
Additively Manufactured Lattice Materials with a Double Level of Gradation: A Comparison of Their Compressive Properties when Fabricated with Material Extrusion and Vat Photopolymerization Processes

 ,
,  , and
, and 
Abstract
:1. Introduction
2. Materials and Methods
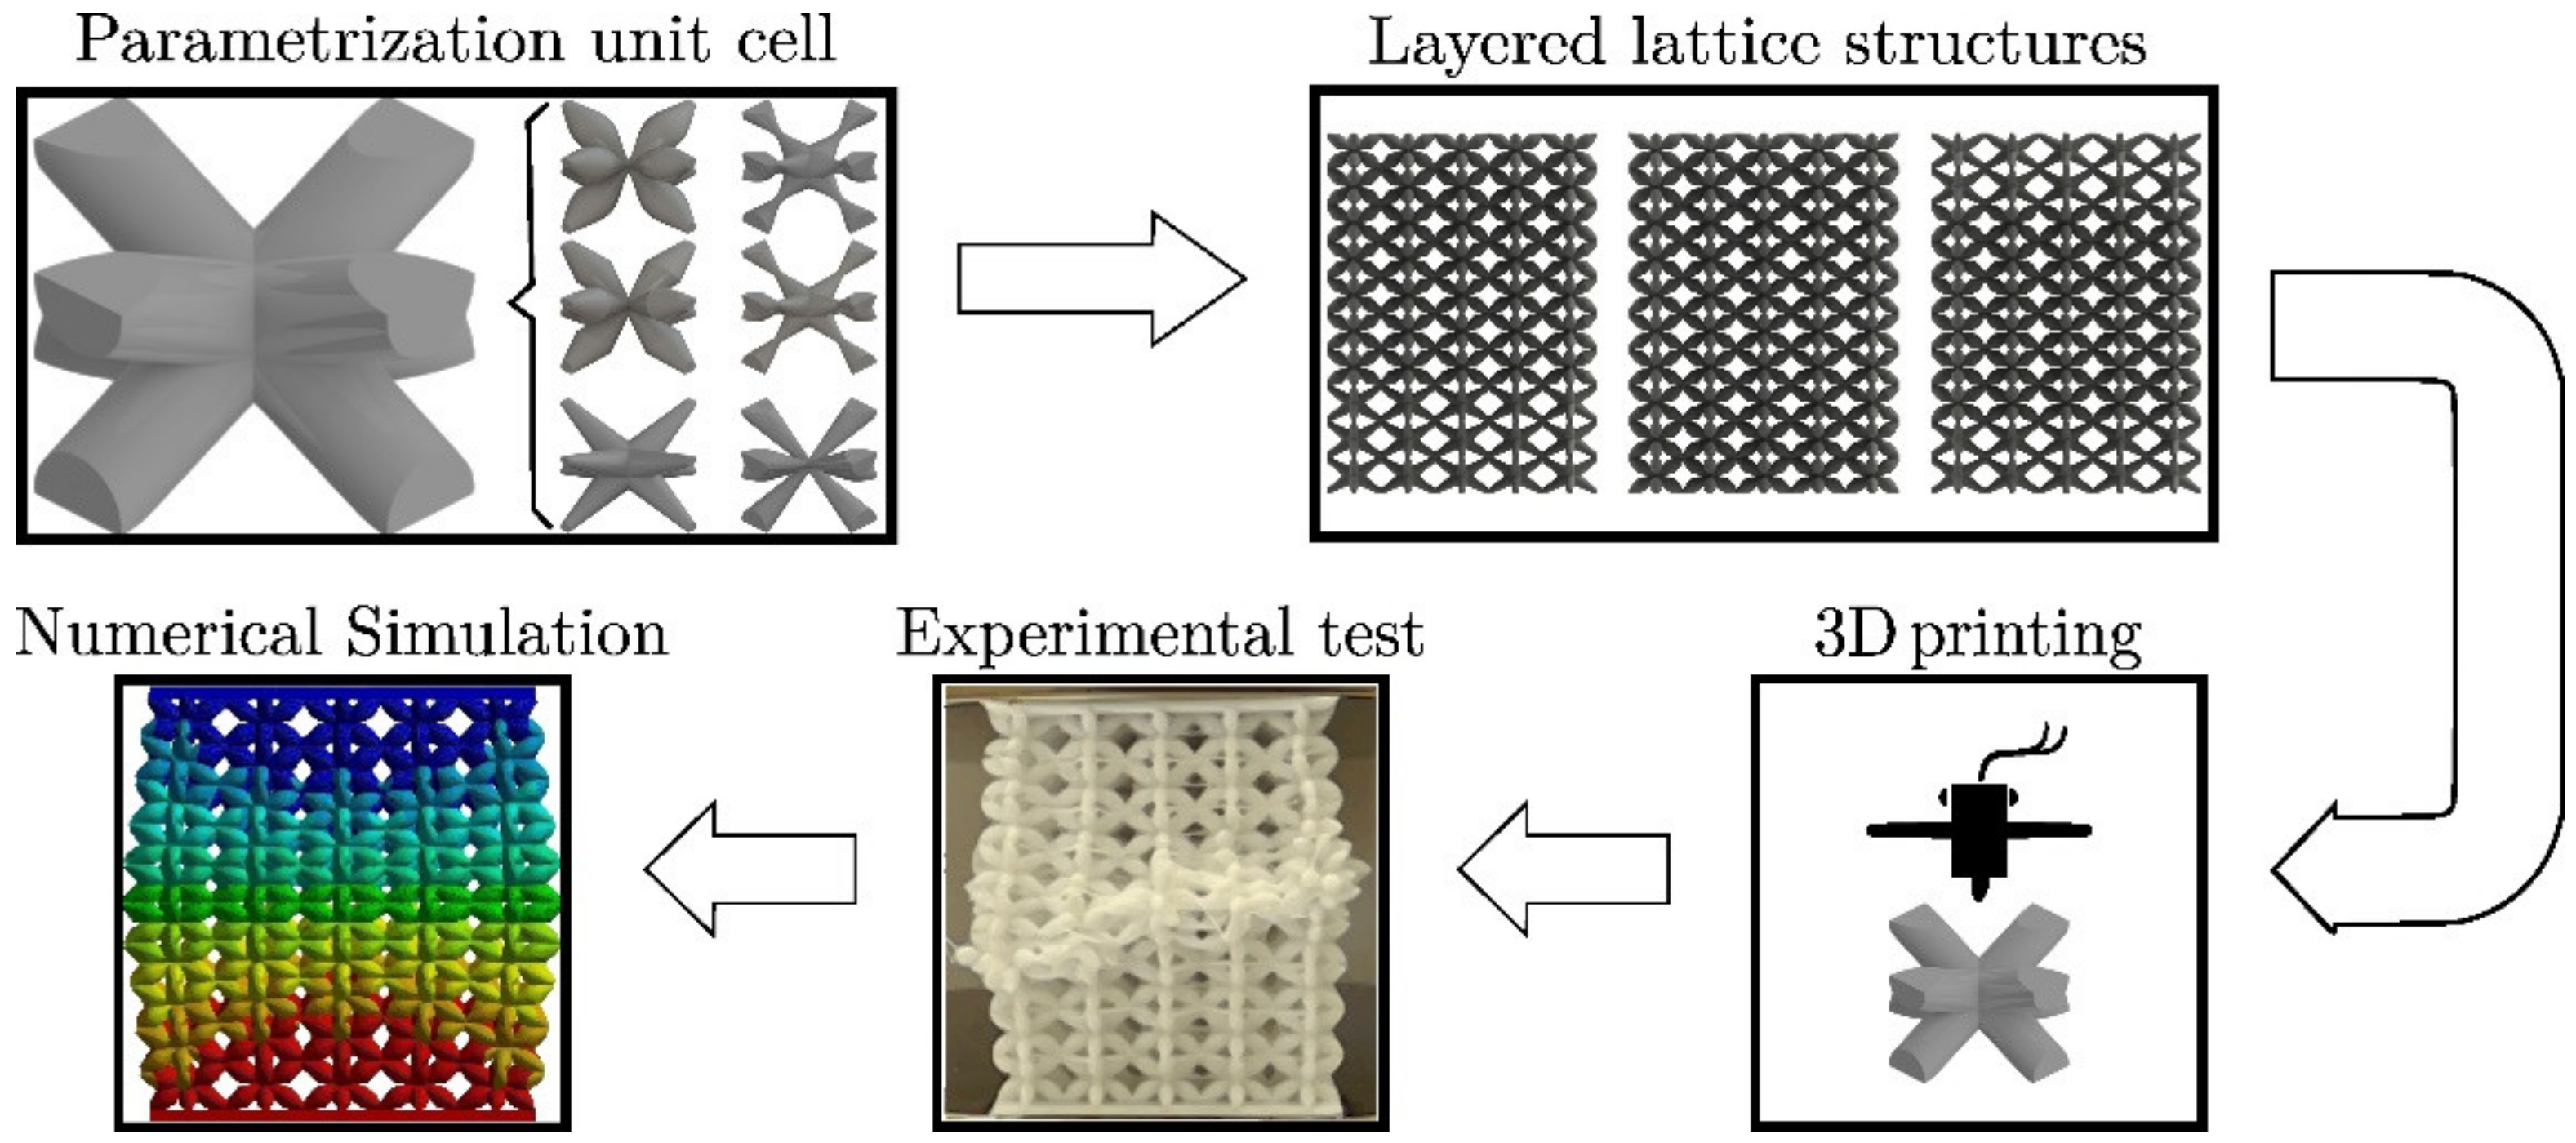
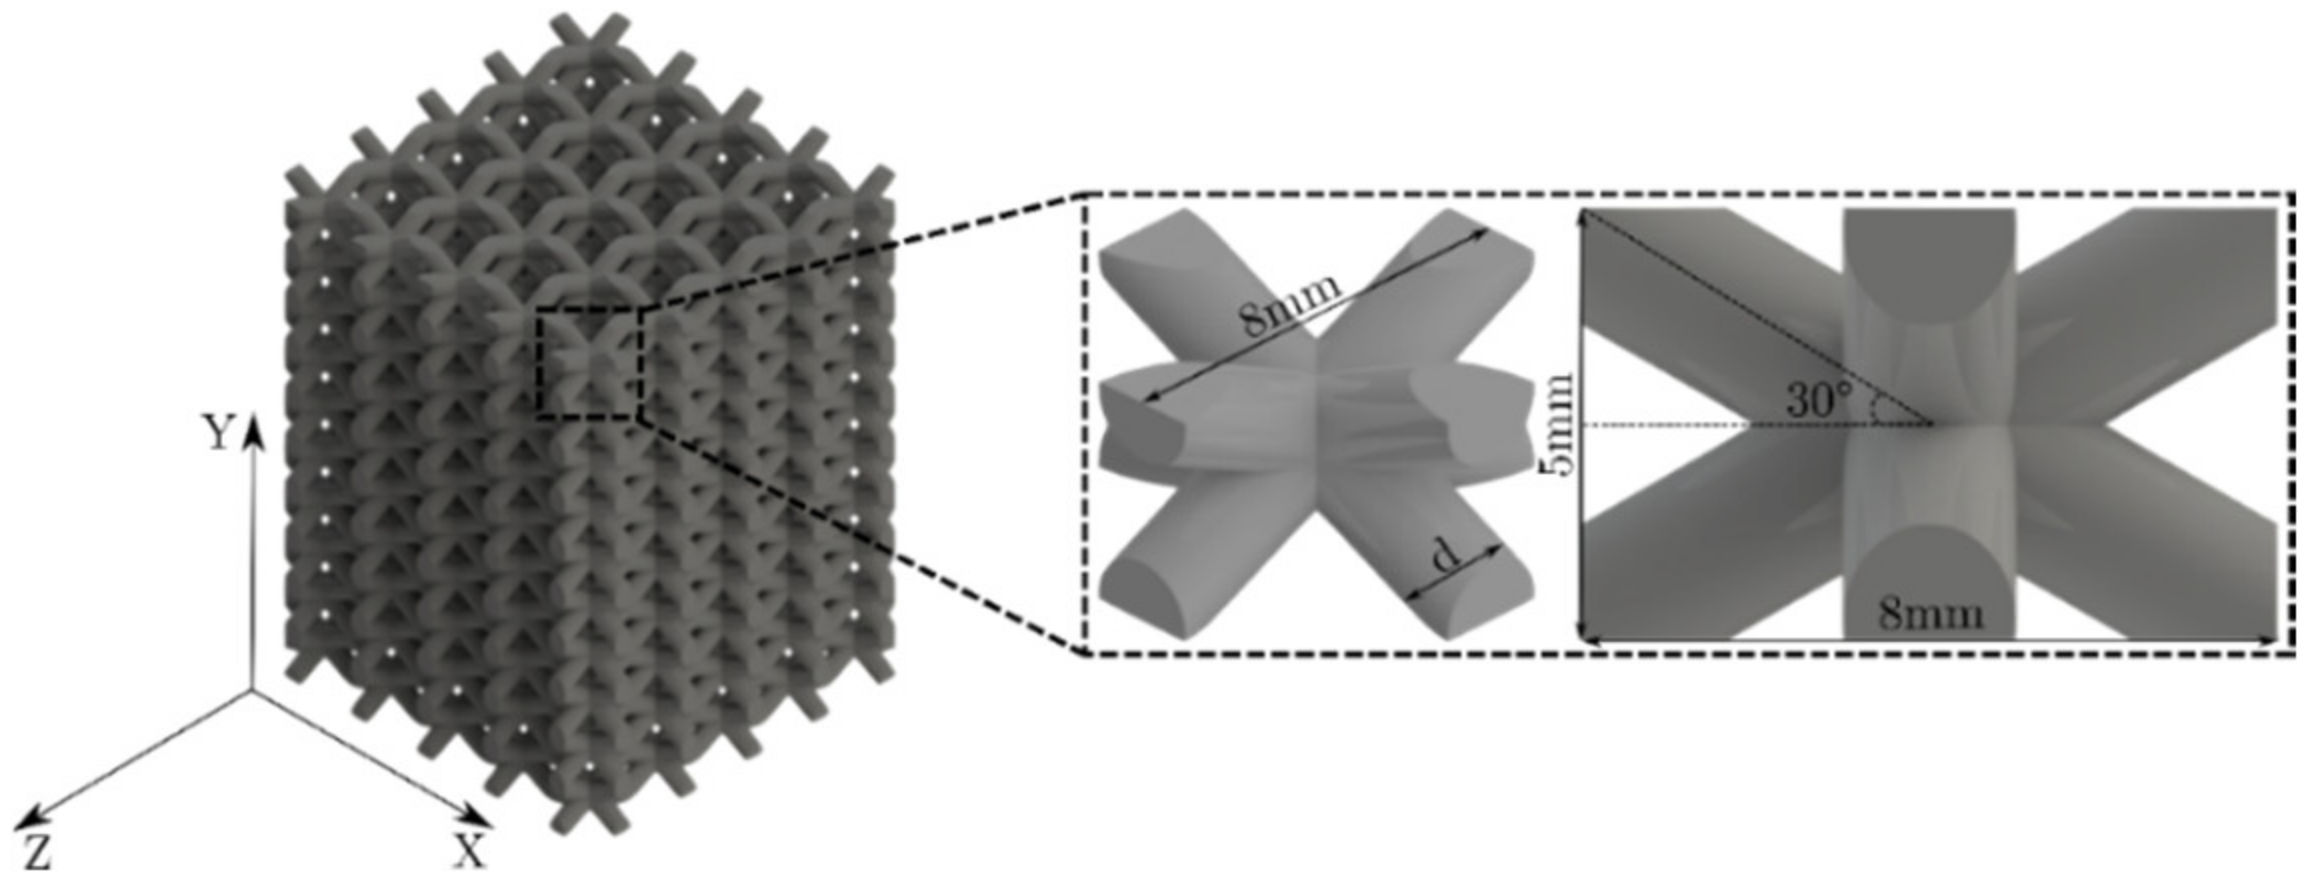
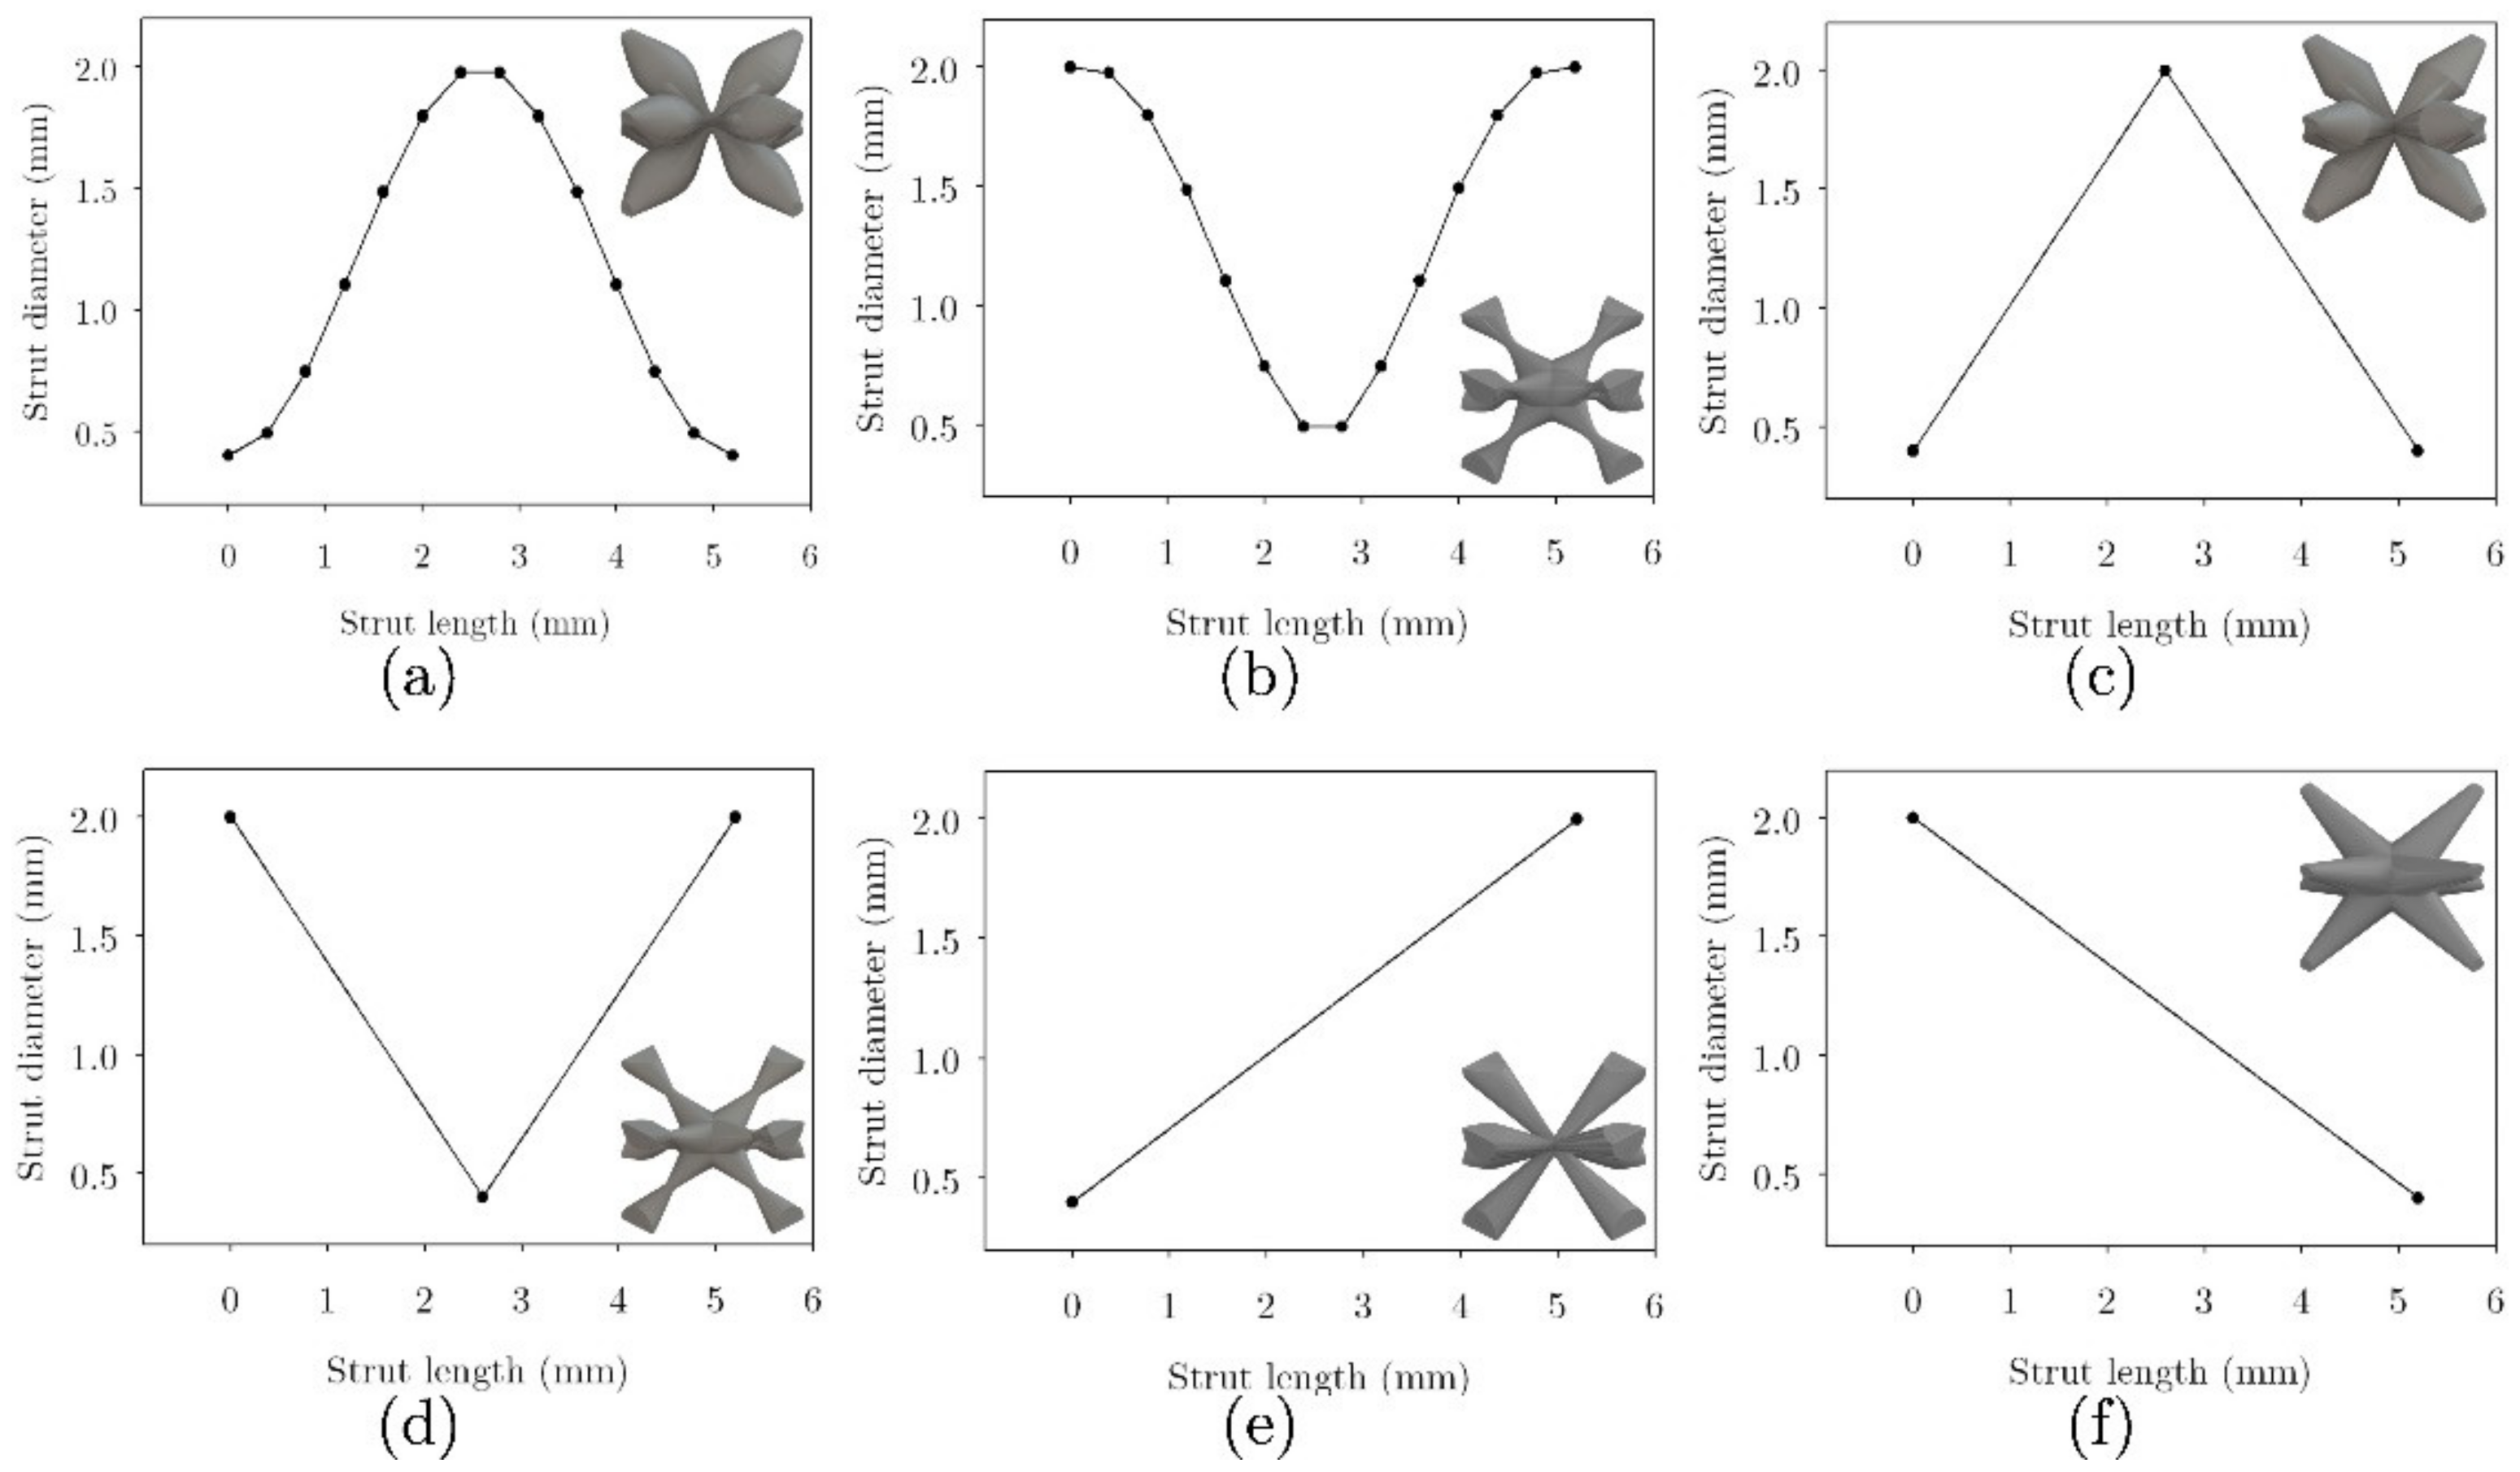
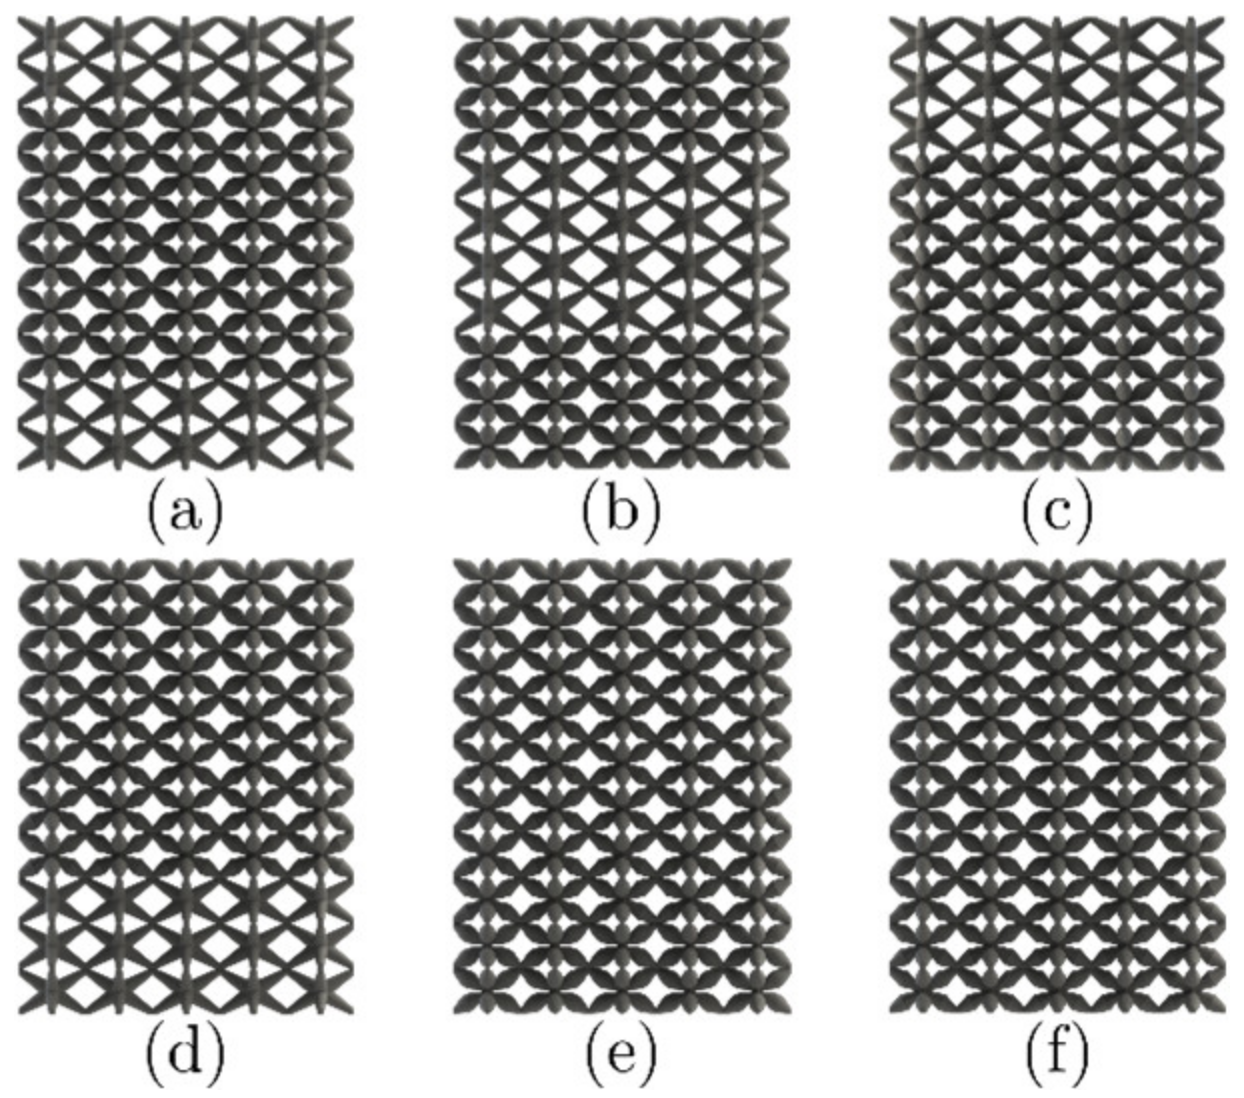
2.1. Parametrization of Lattice Structures and Computational Modeling
2.2. Parametrization of Lattice Structures and Computational Modeling
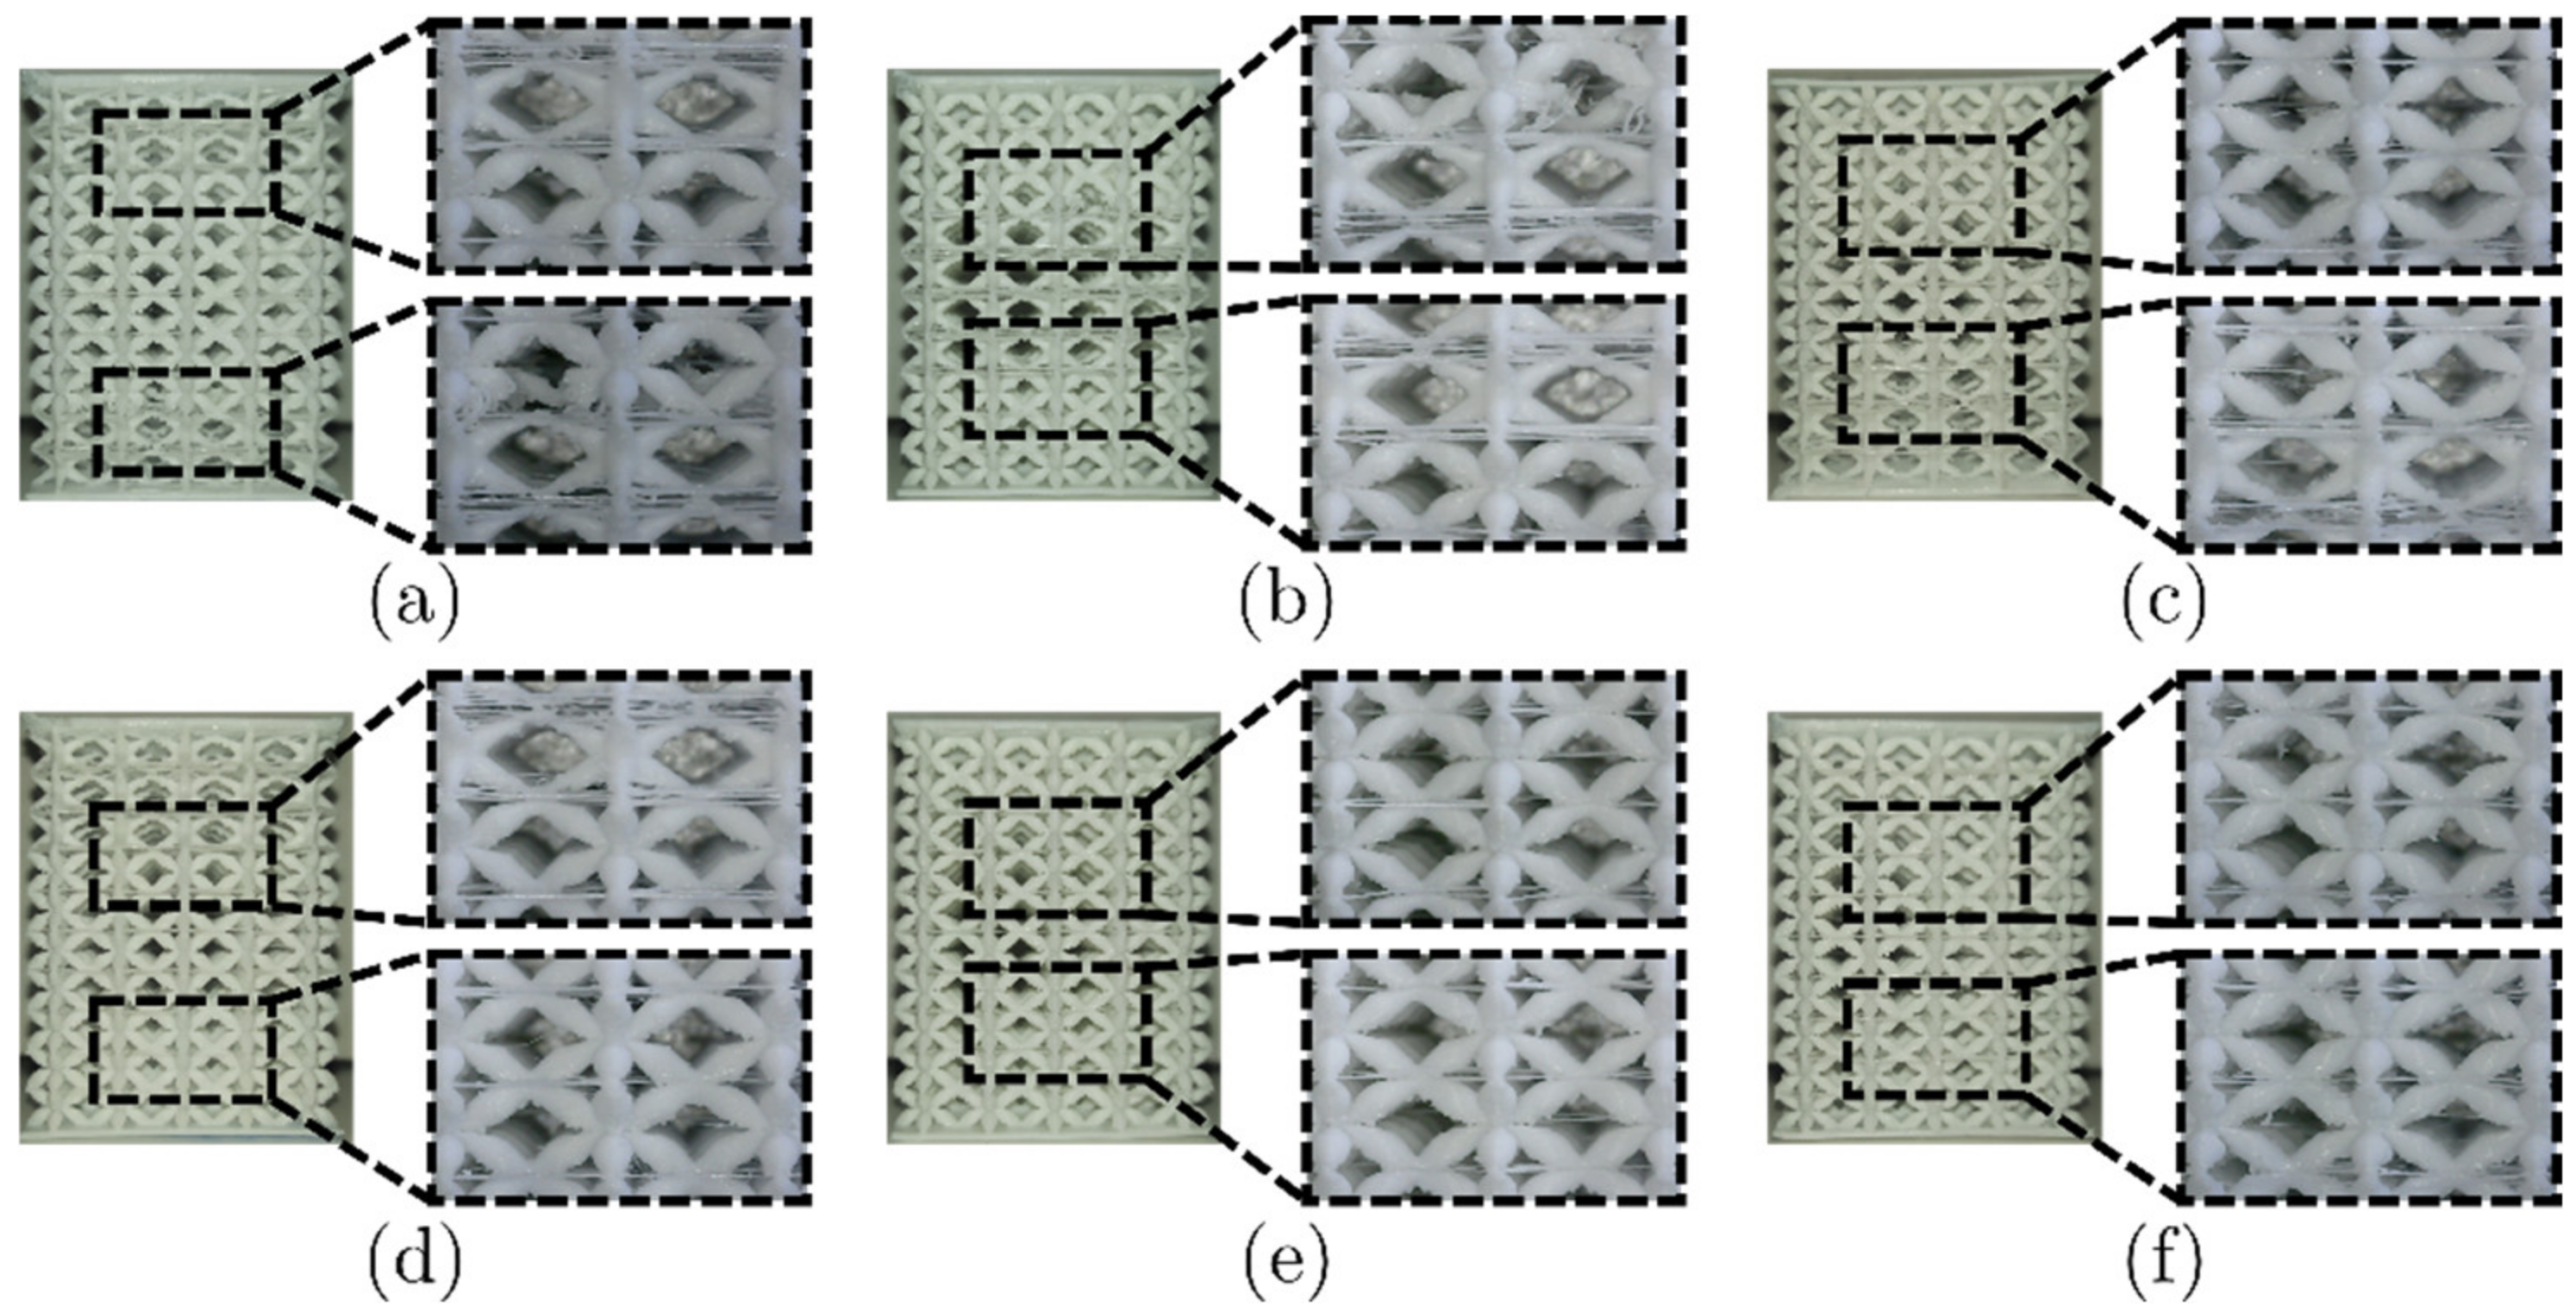
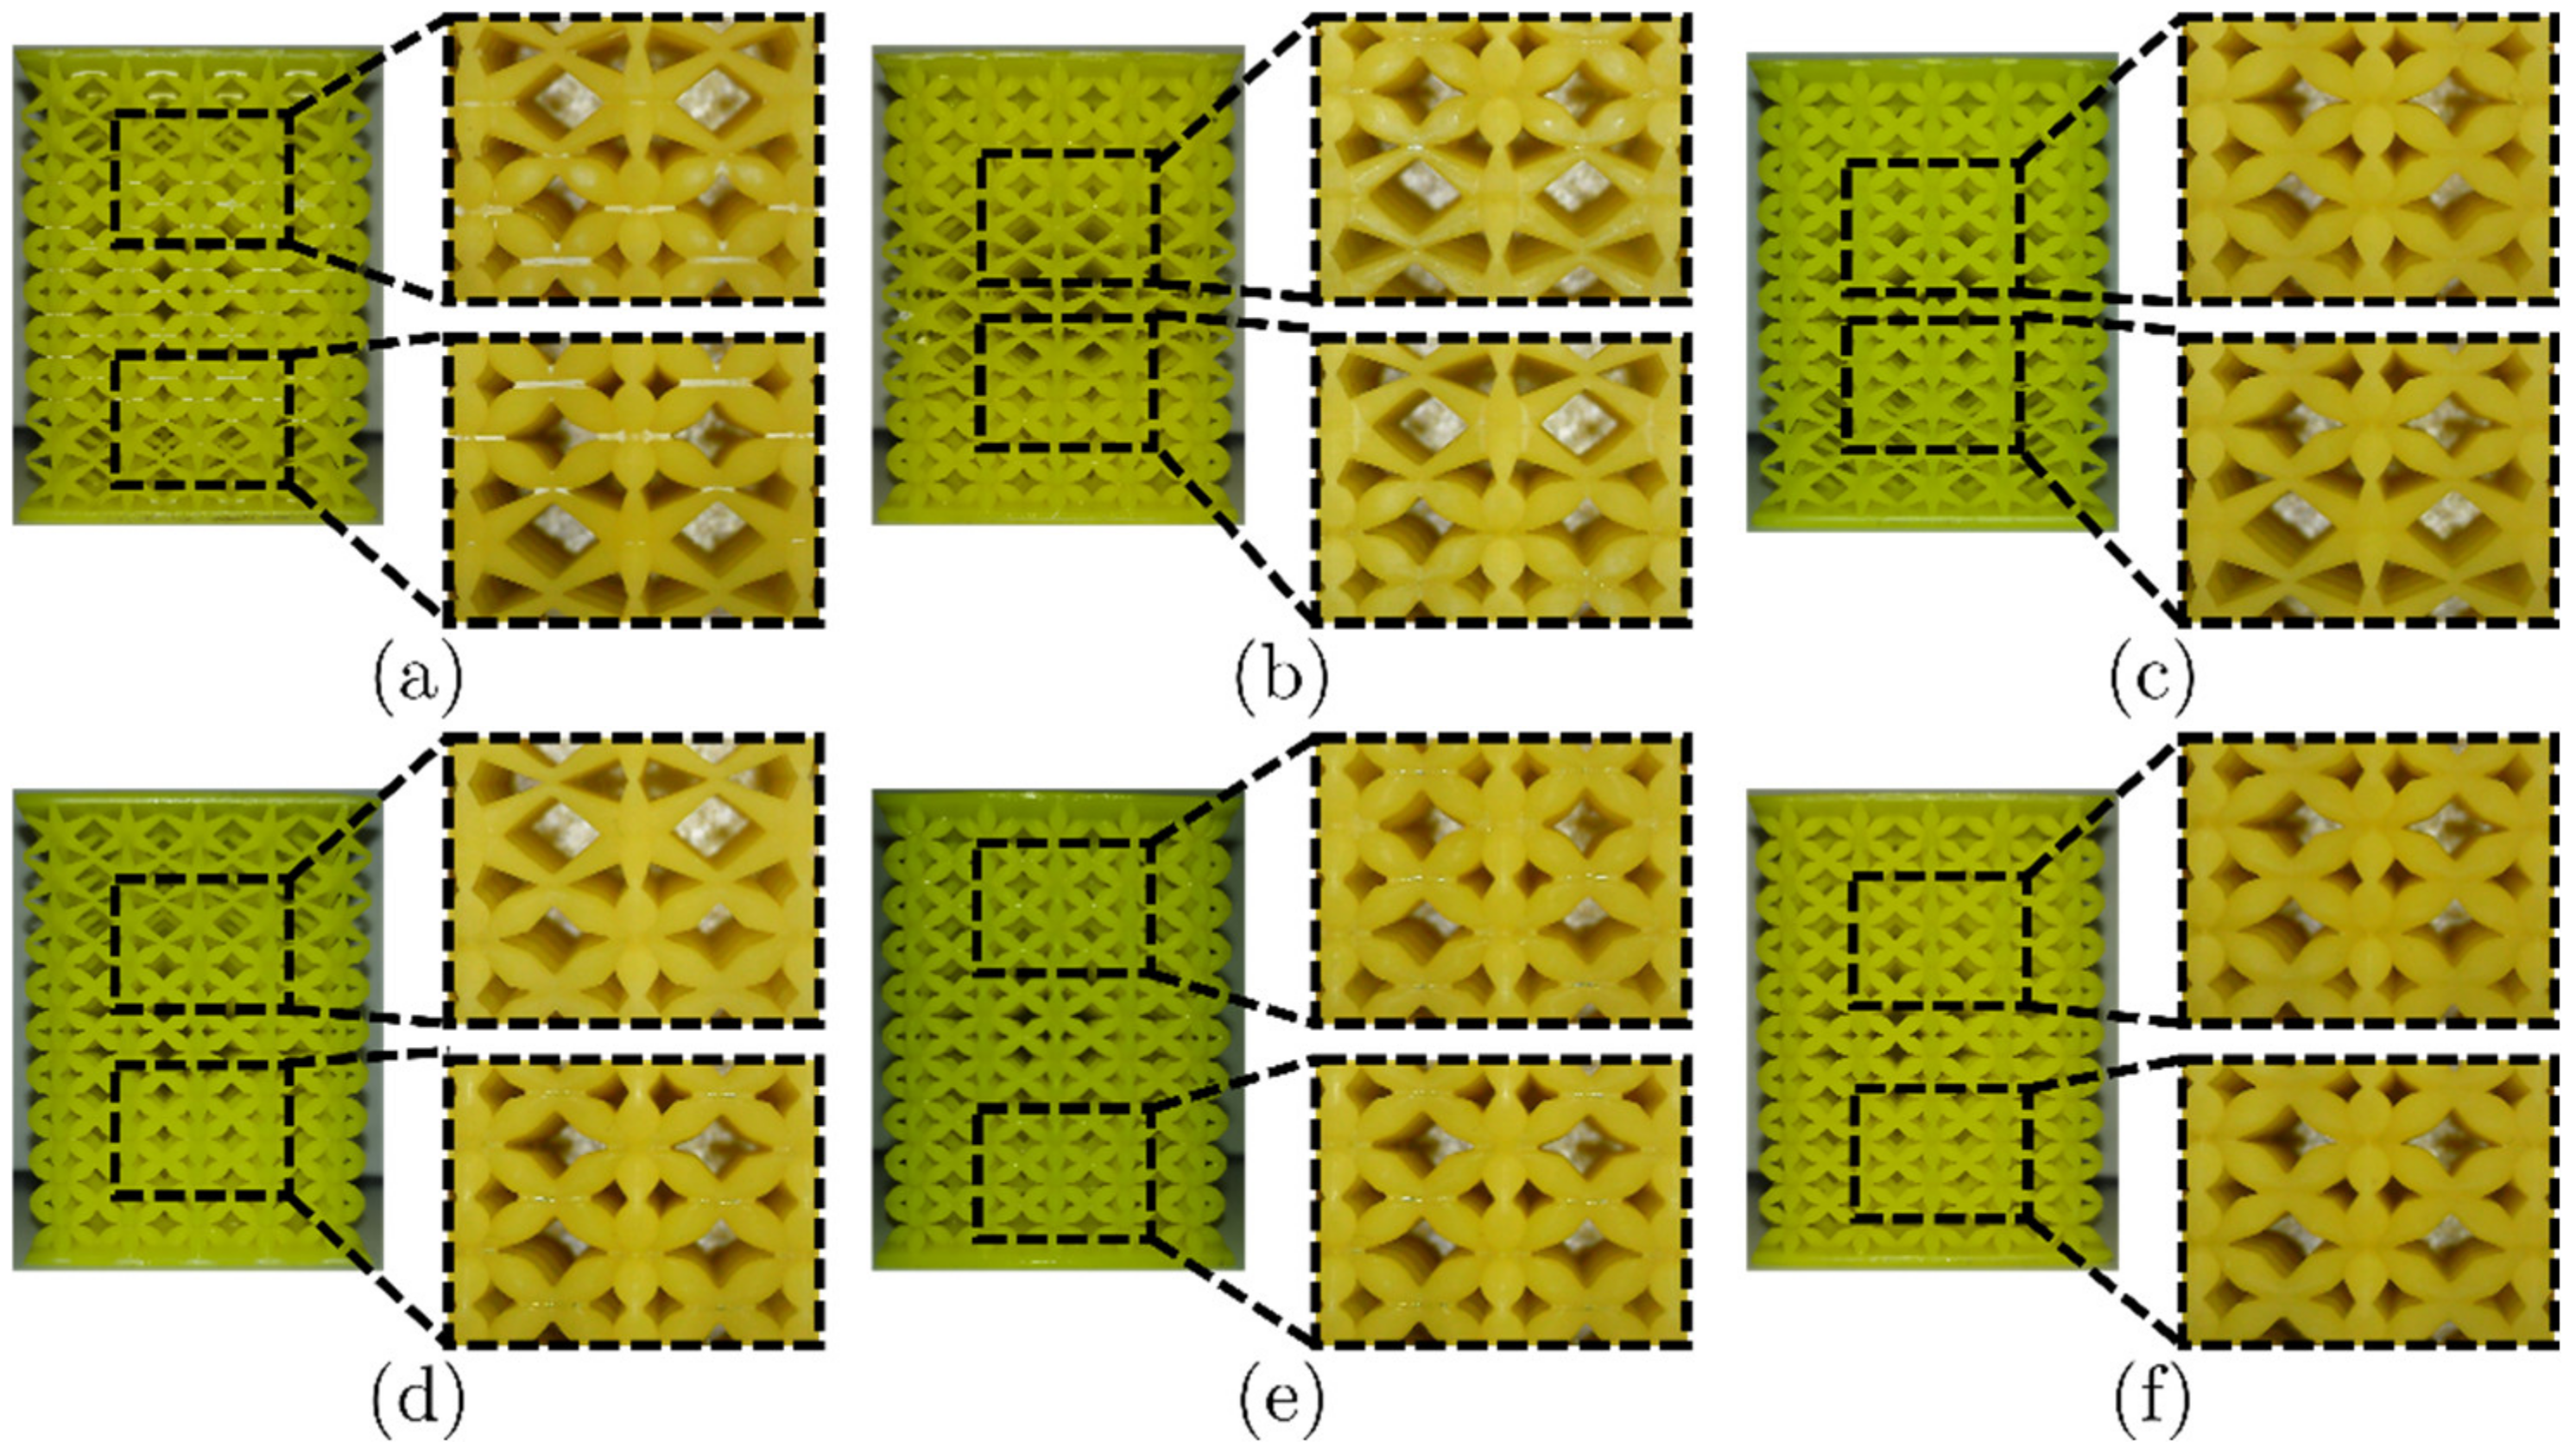
2.3. Additive Manufacturing of Lattice Structures
Micrograph Characterization of Additively Manufactured Lattices
2.4. Mechanical Characterization of the Constituent Additively Manufactured Base Materials
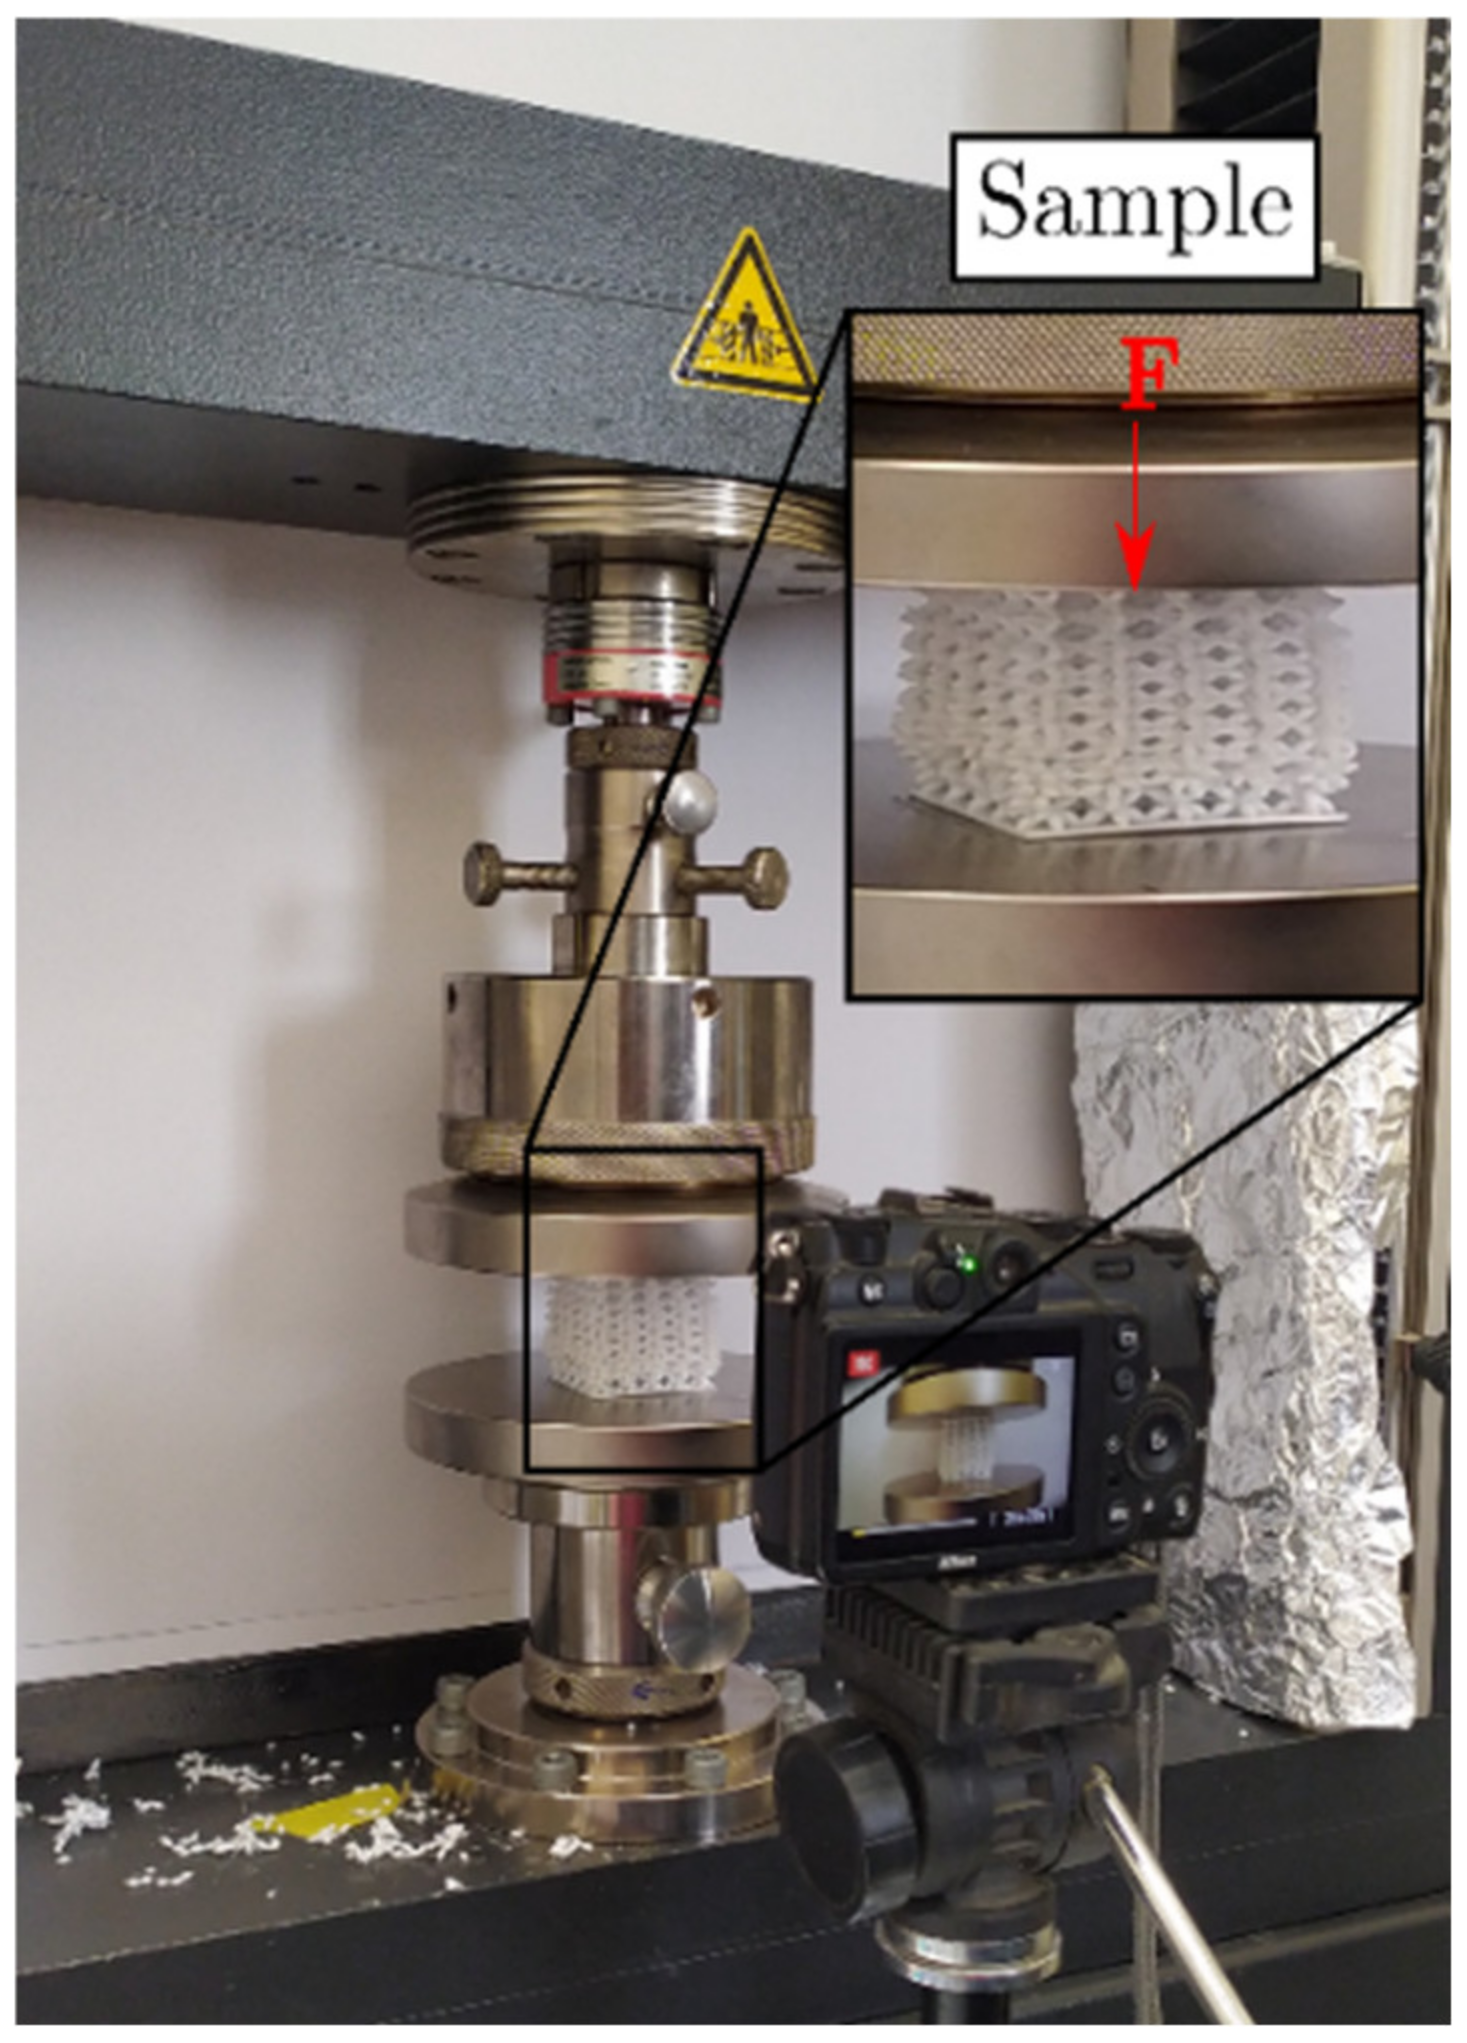
2.5. Experimental Characterization of the Compressive Response of Additively Manufactured Lattice Structures
3. Results and Discussion
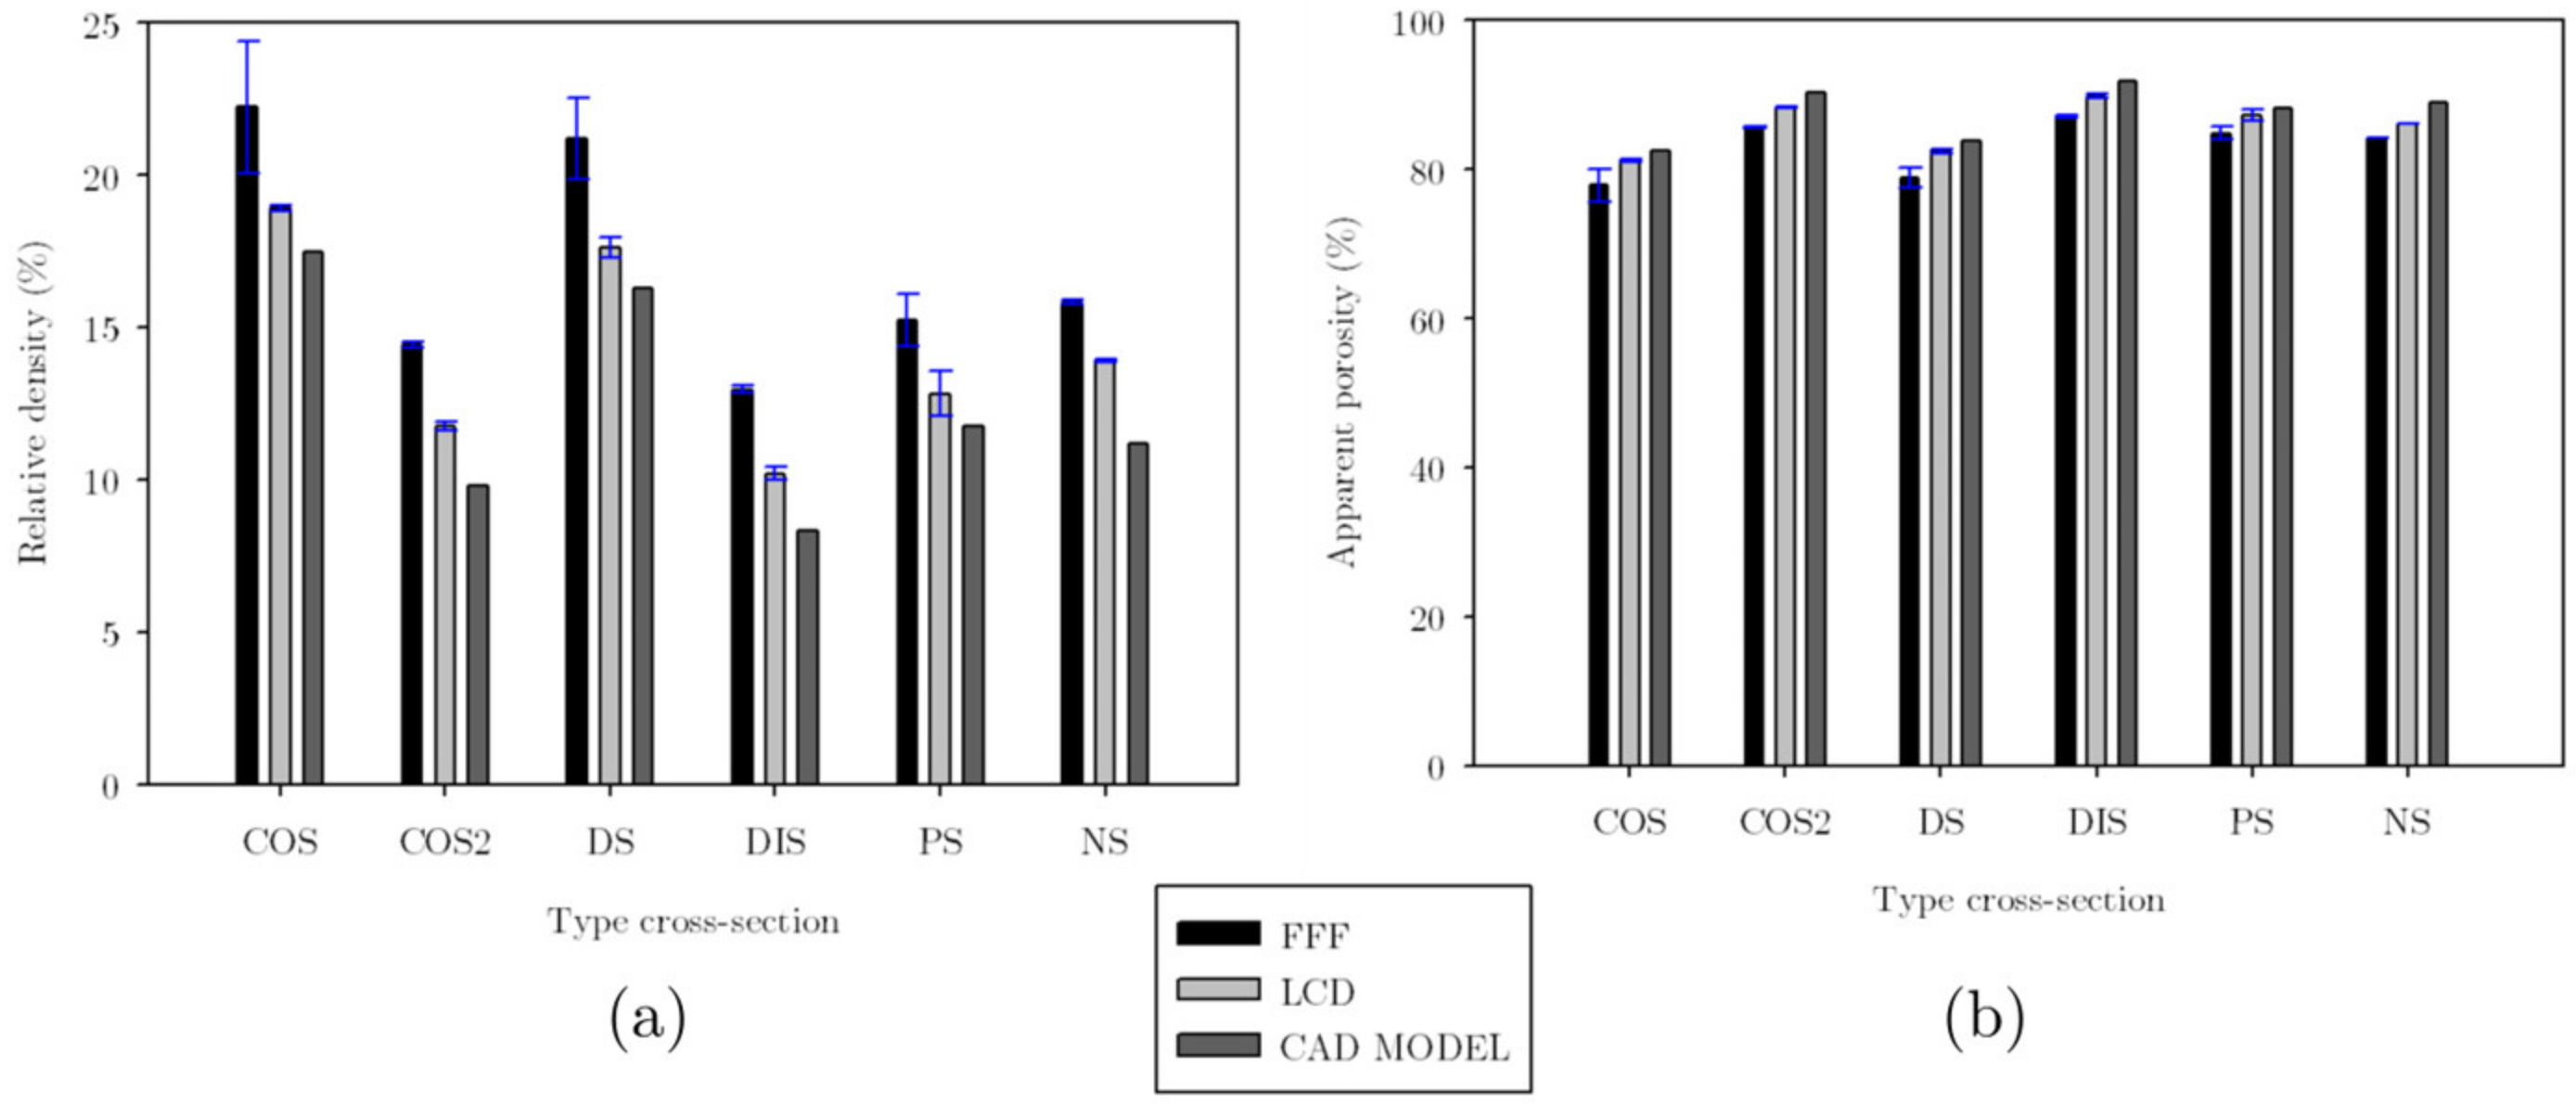
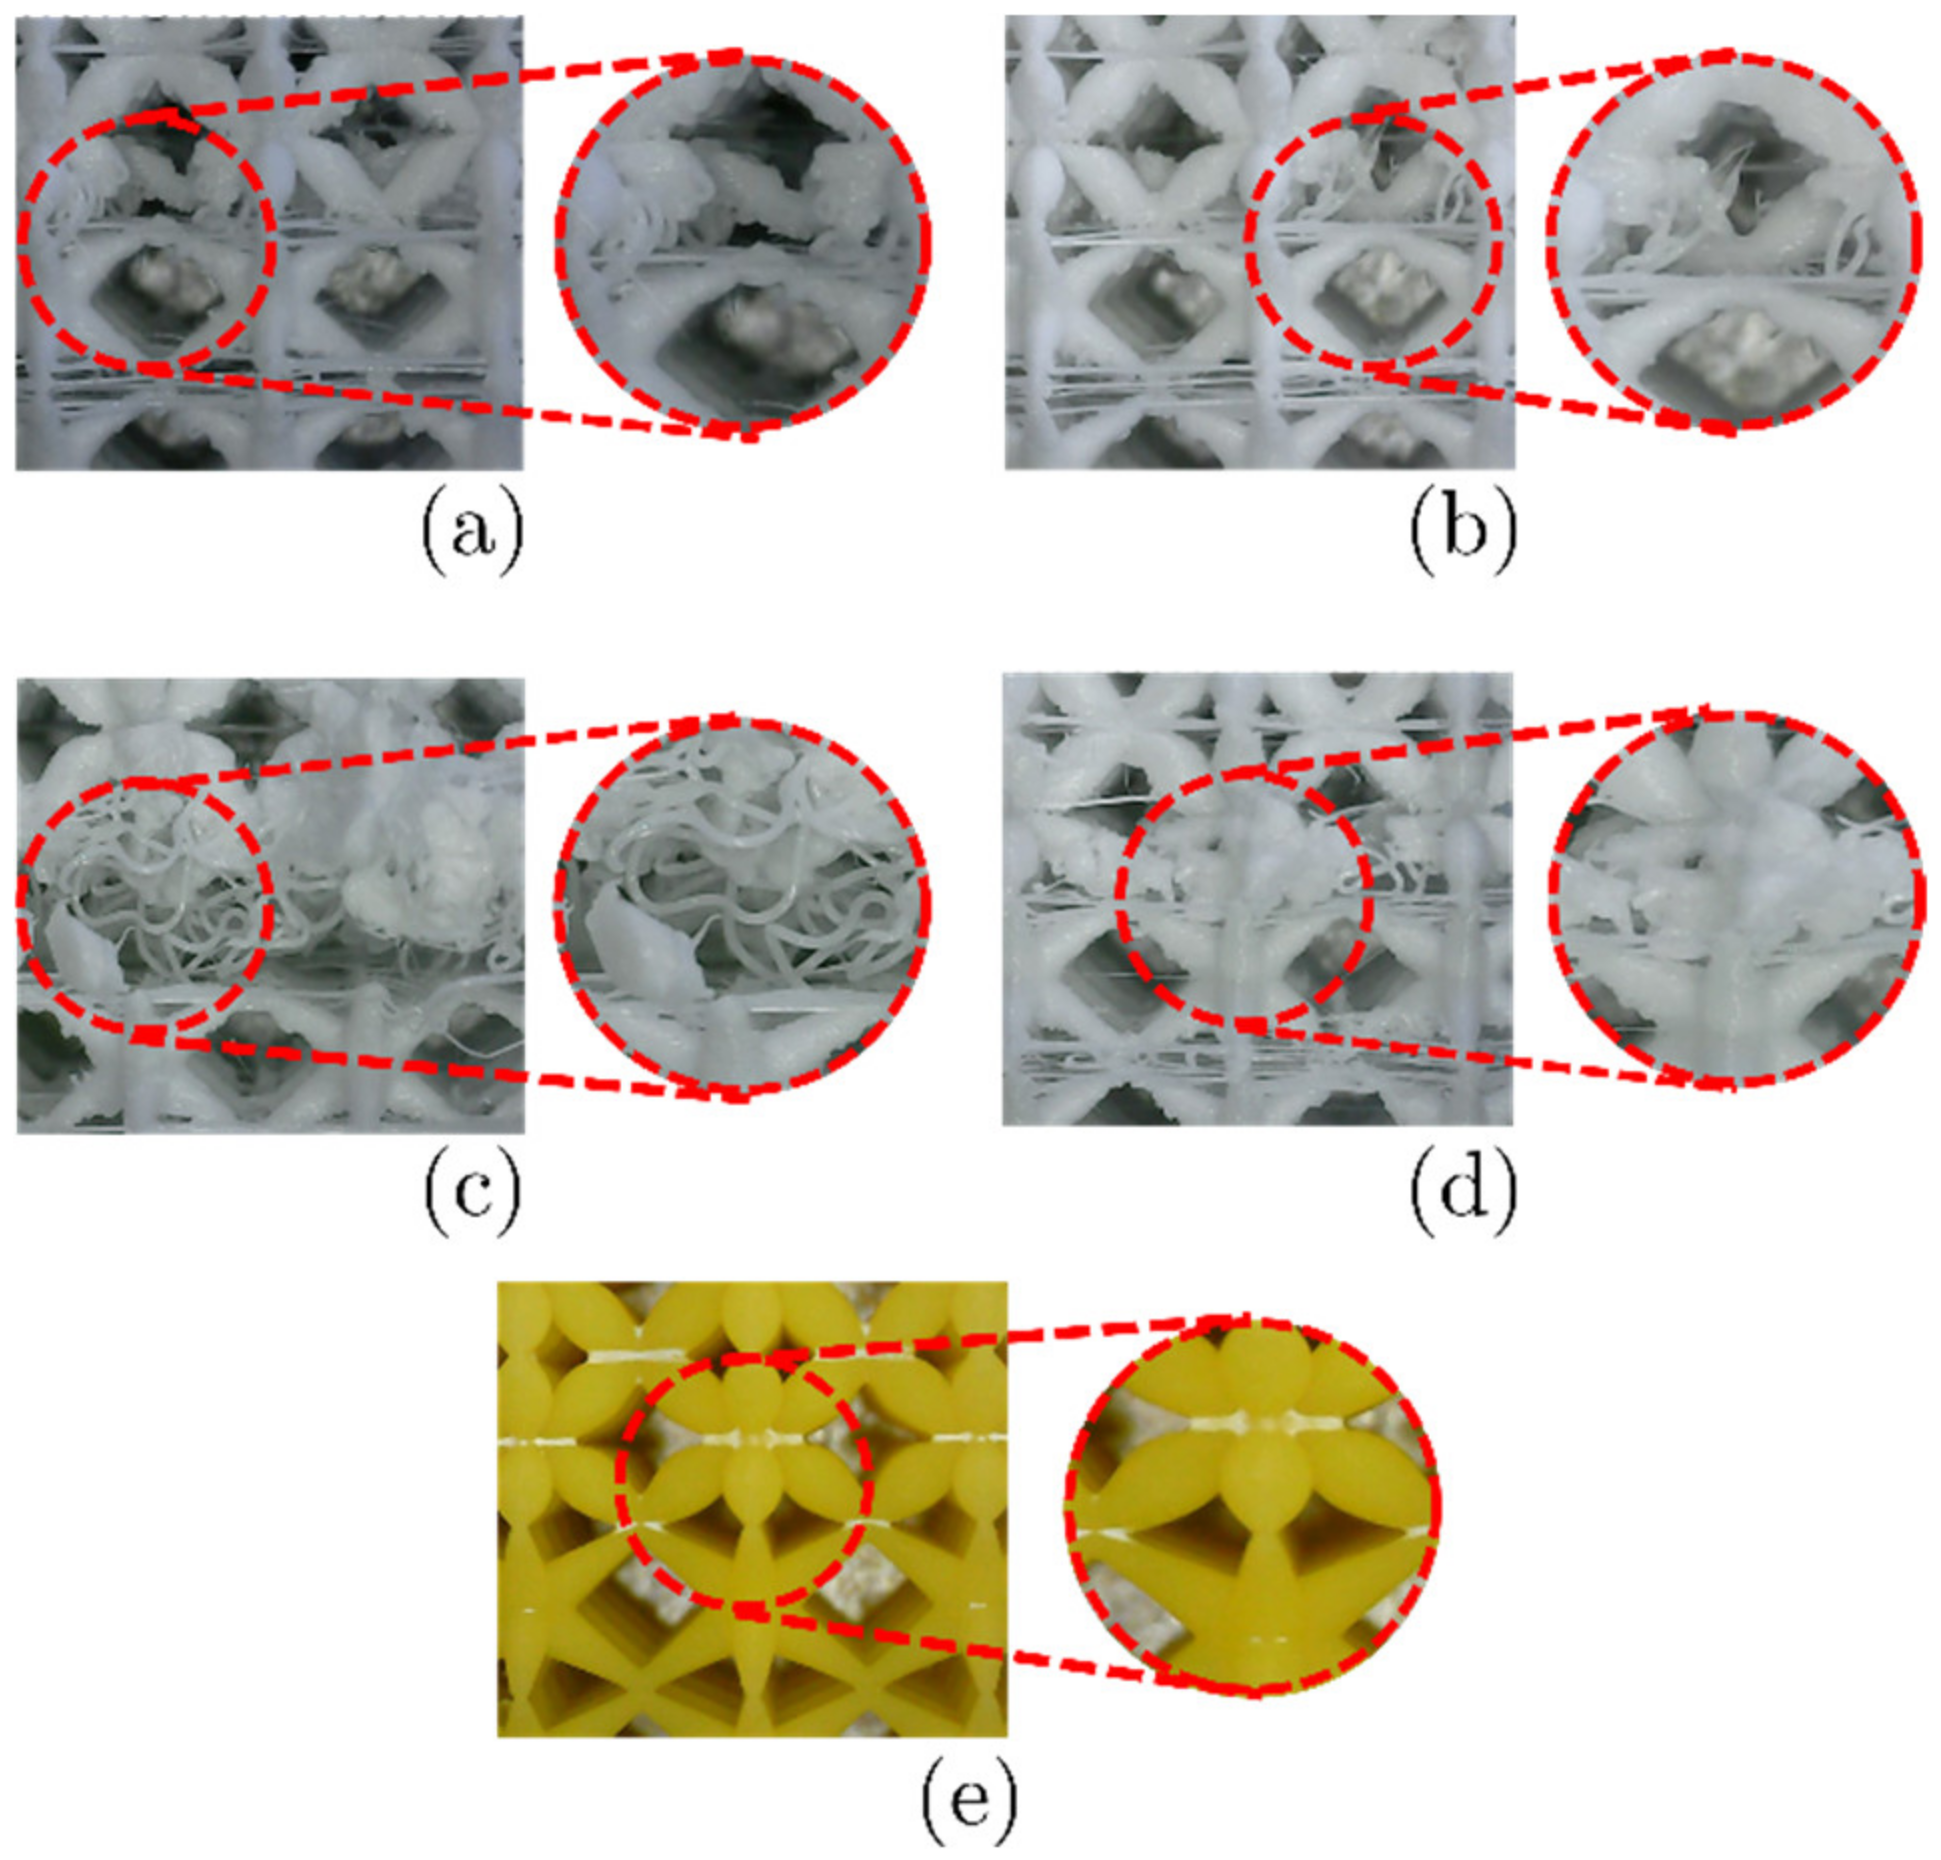
3.1. Additive Manufacturing Defects in Uniformly Periodic Lattice Structures
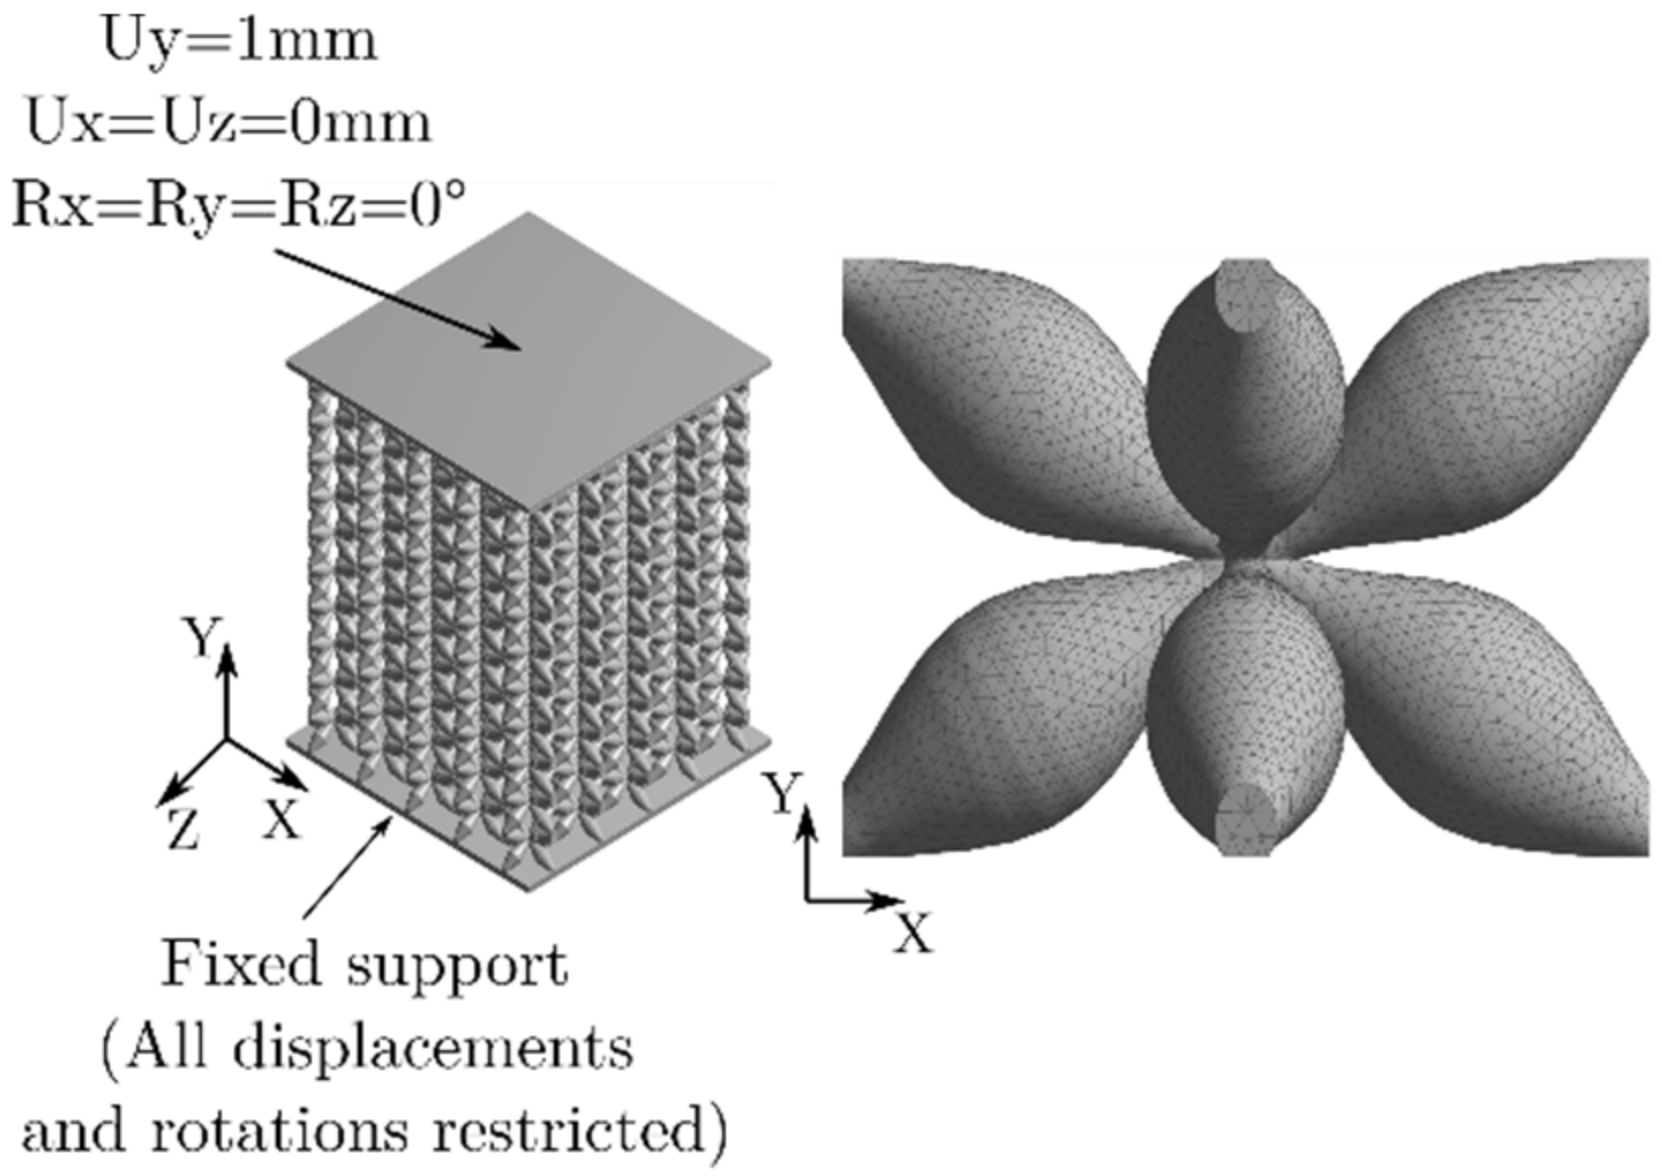
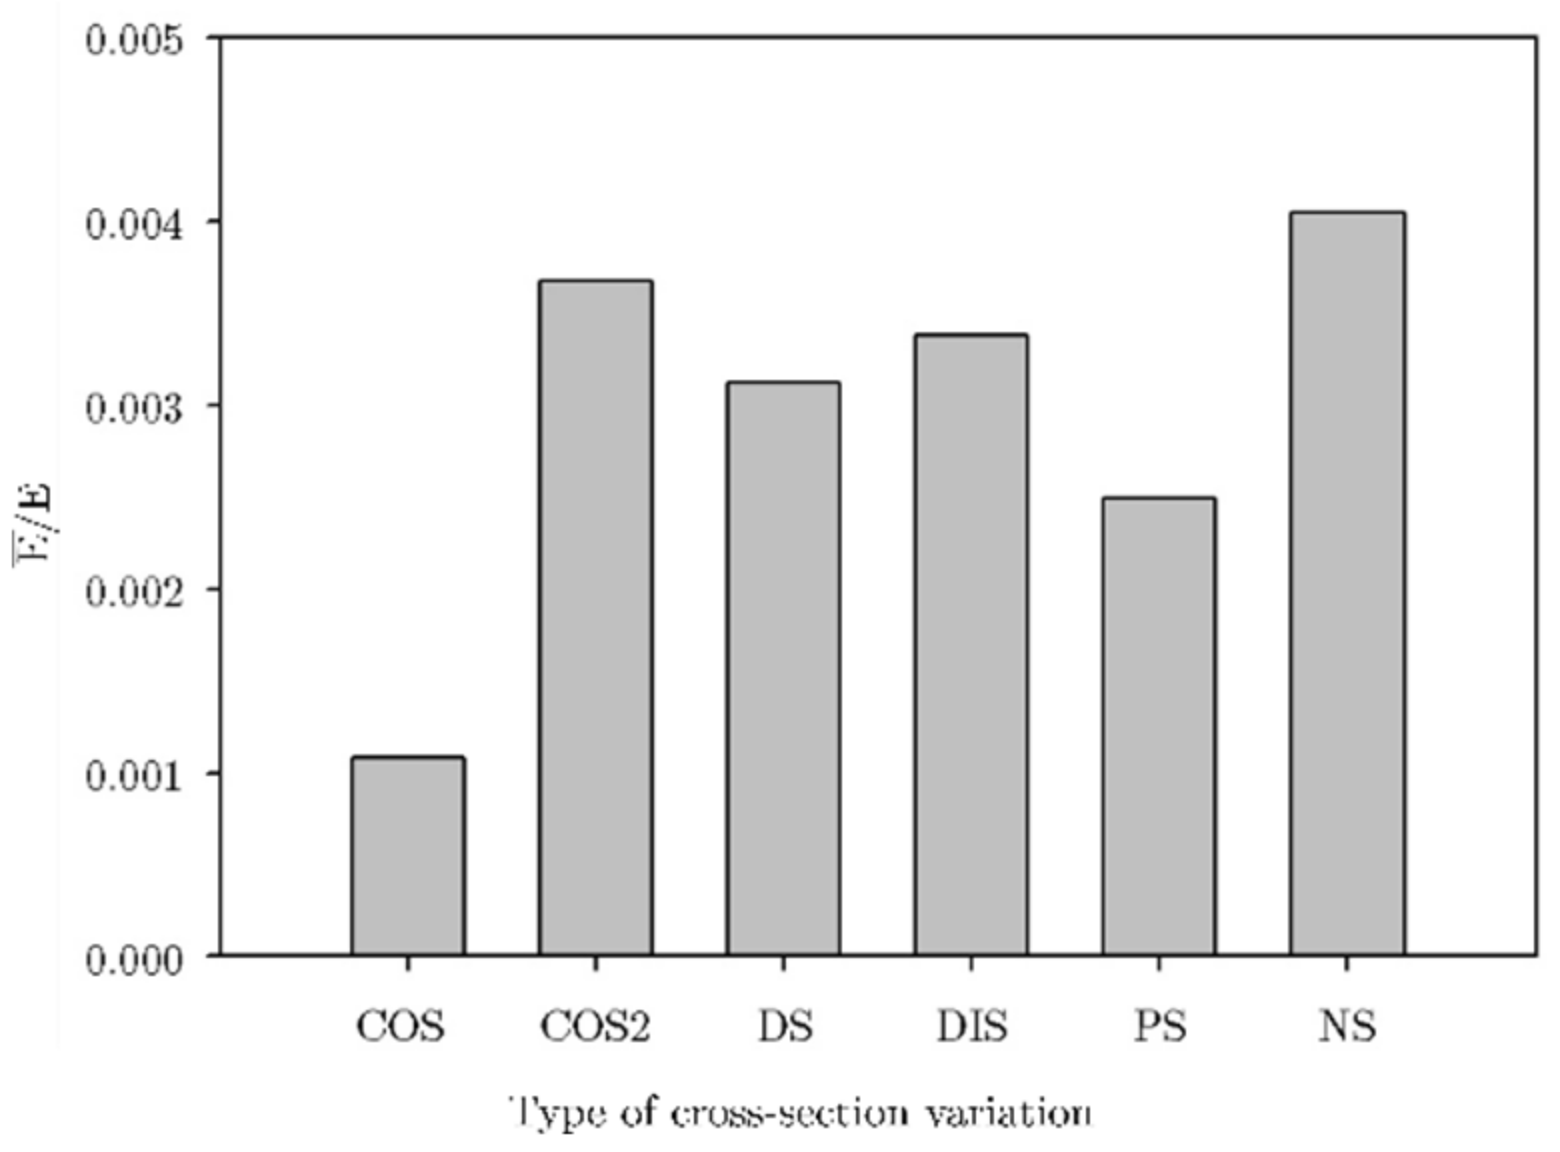
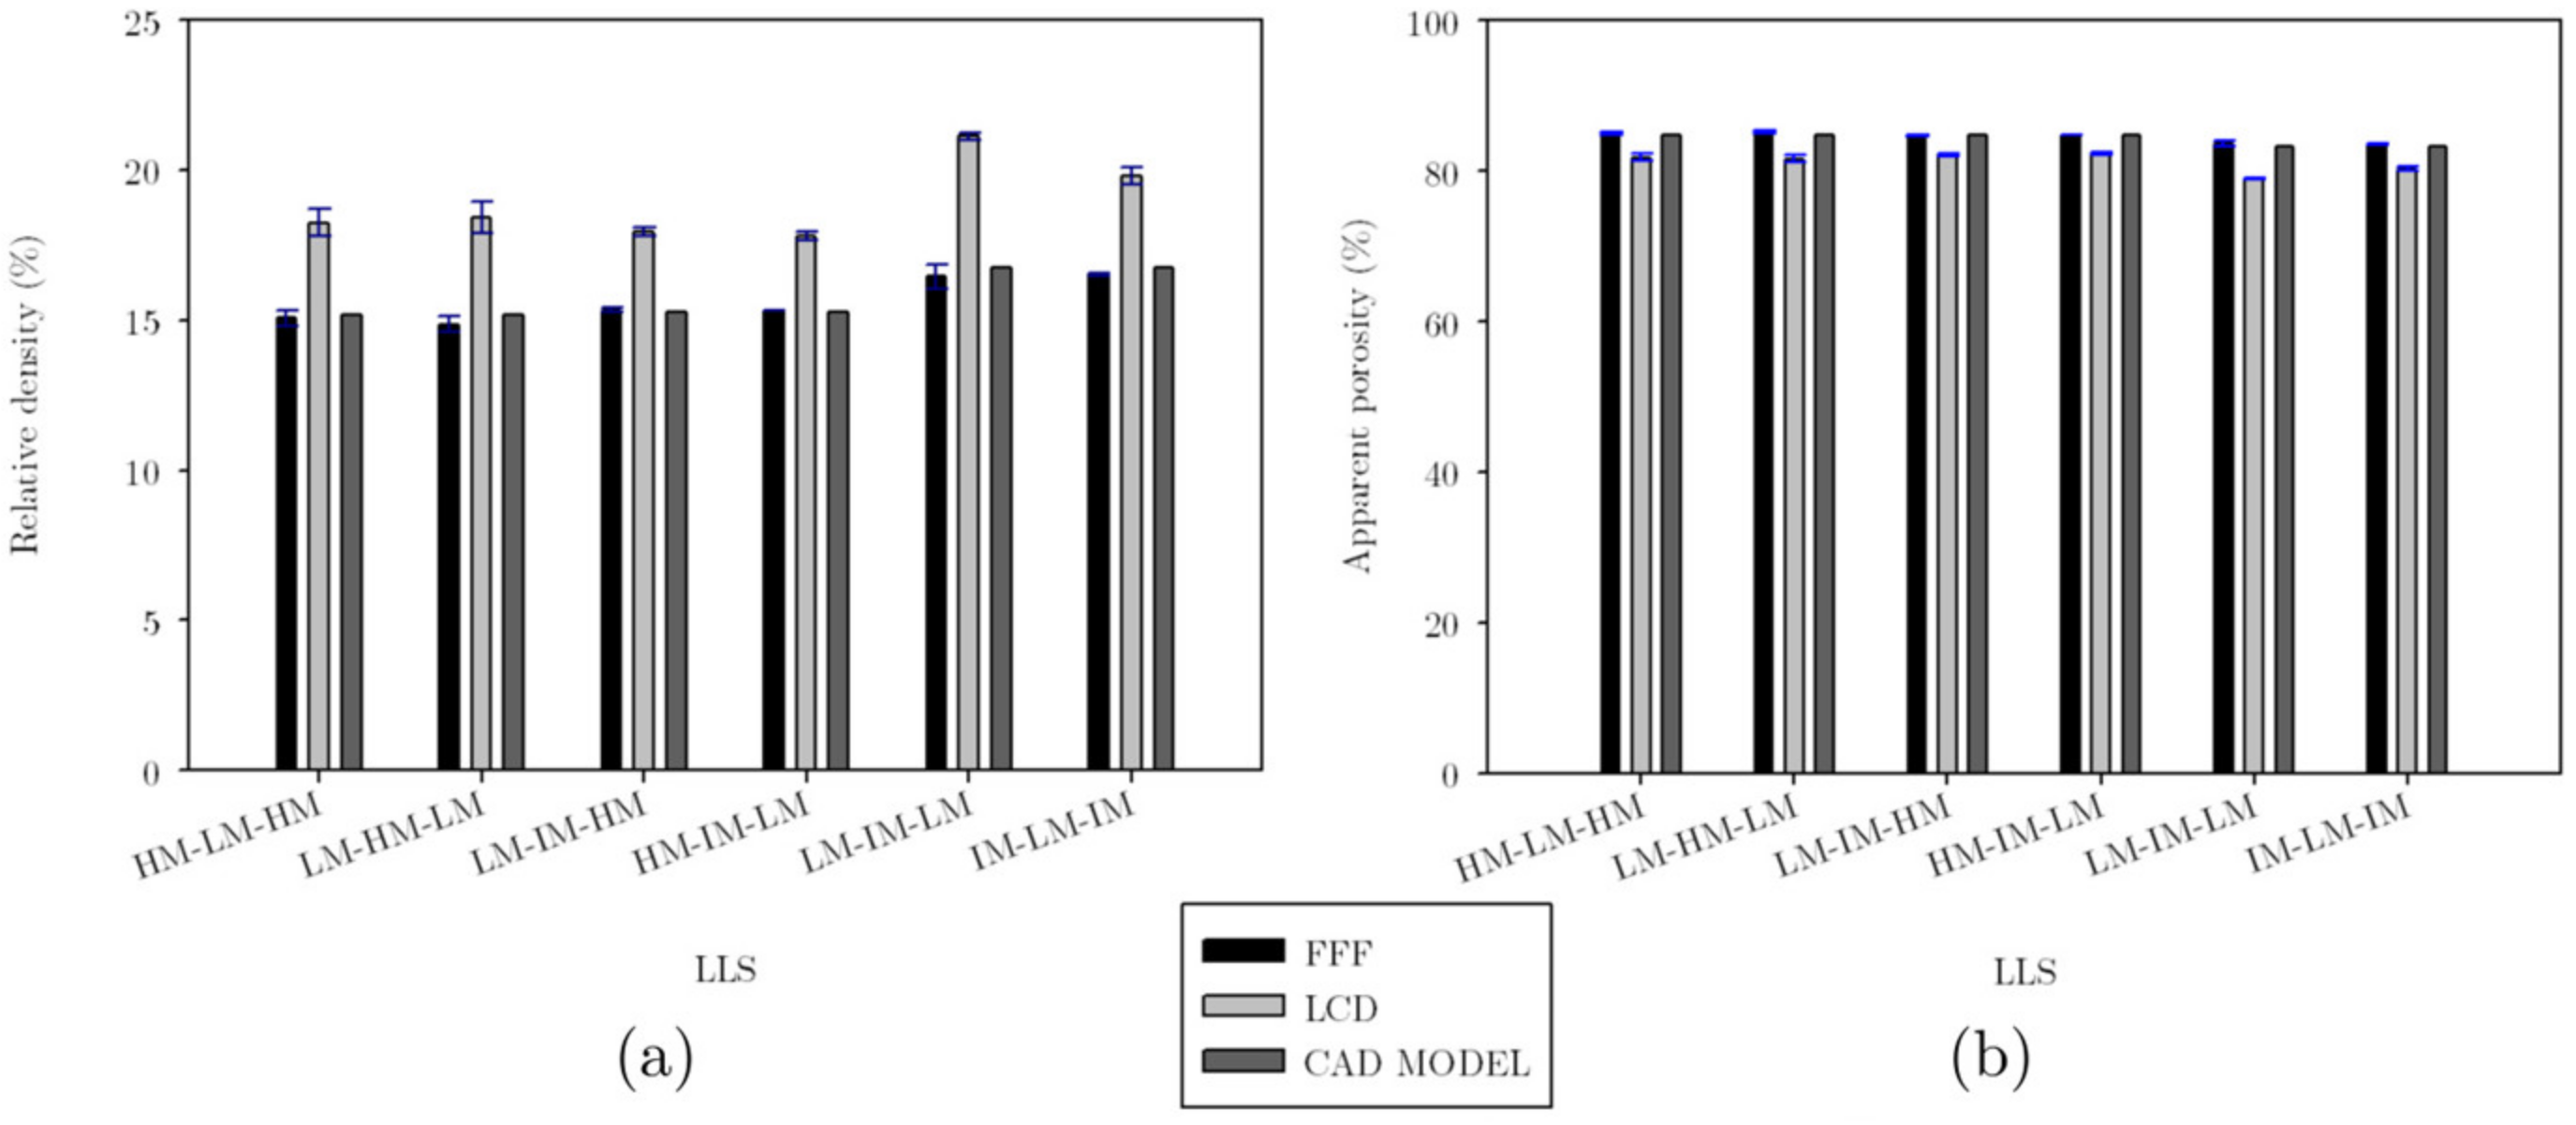
3.2. Apparent Compressive Stiffness via FEA for the Assembly of the Layered Lattice Structures
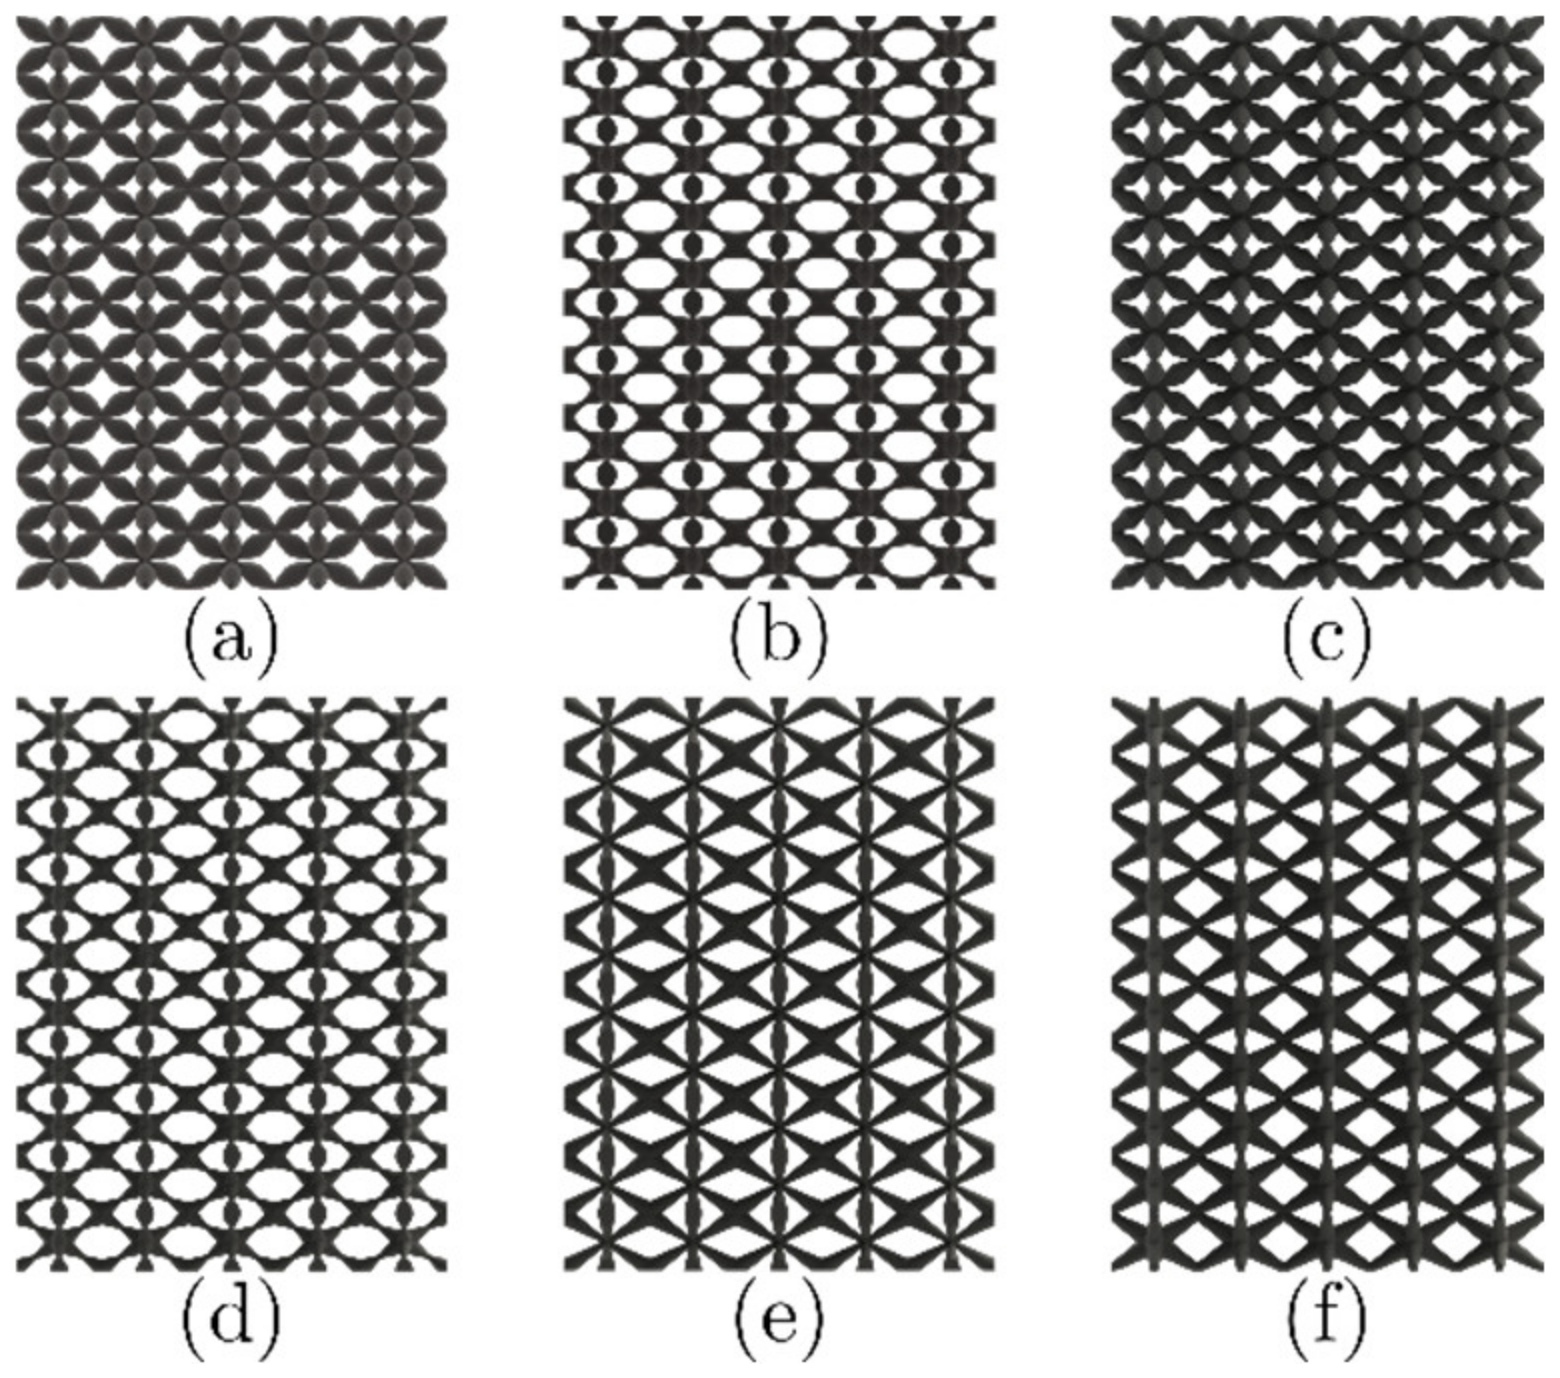
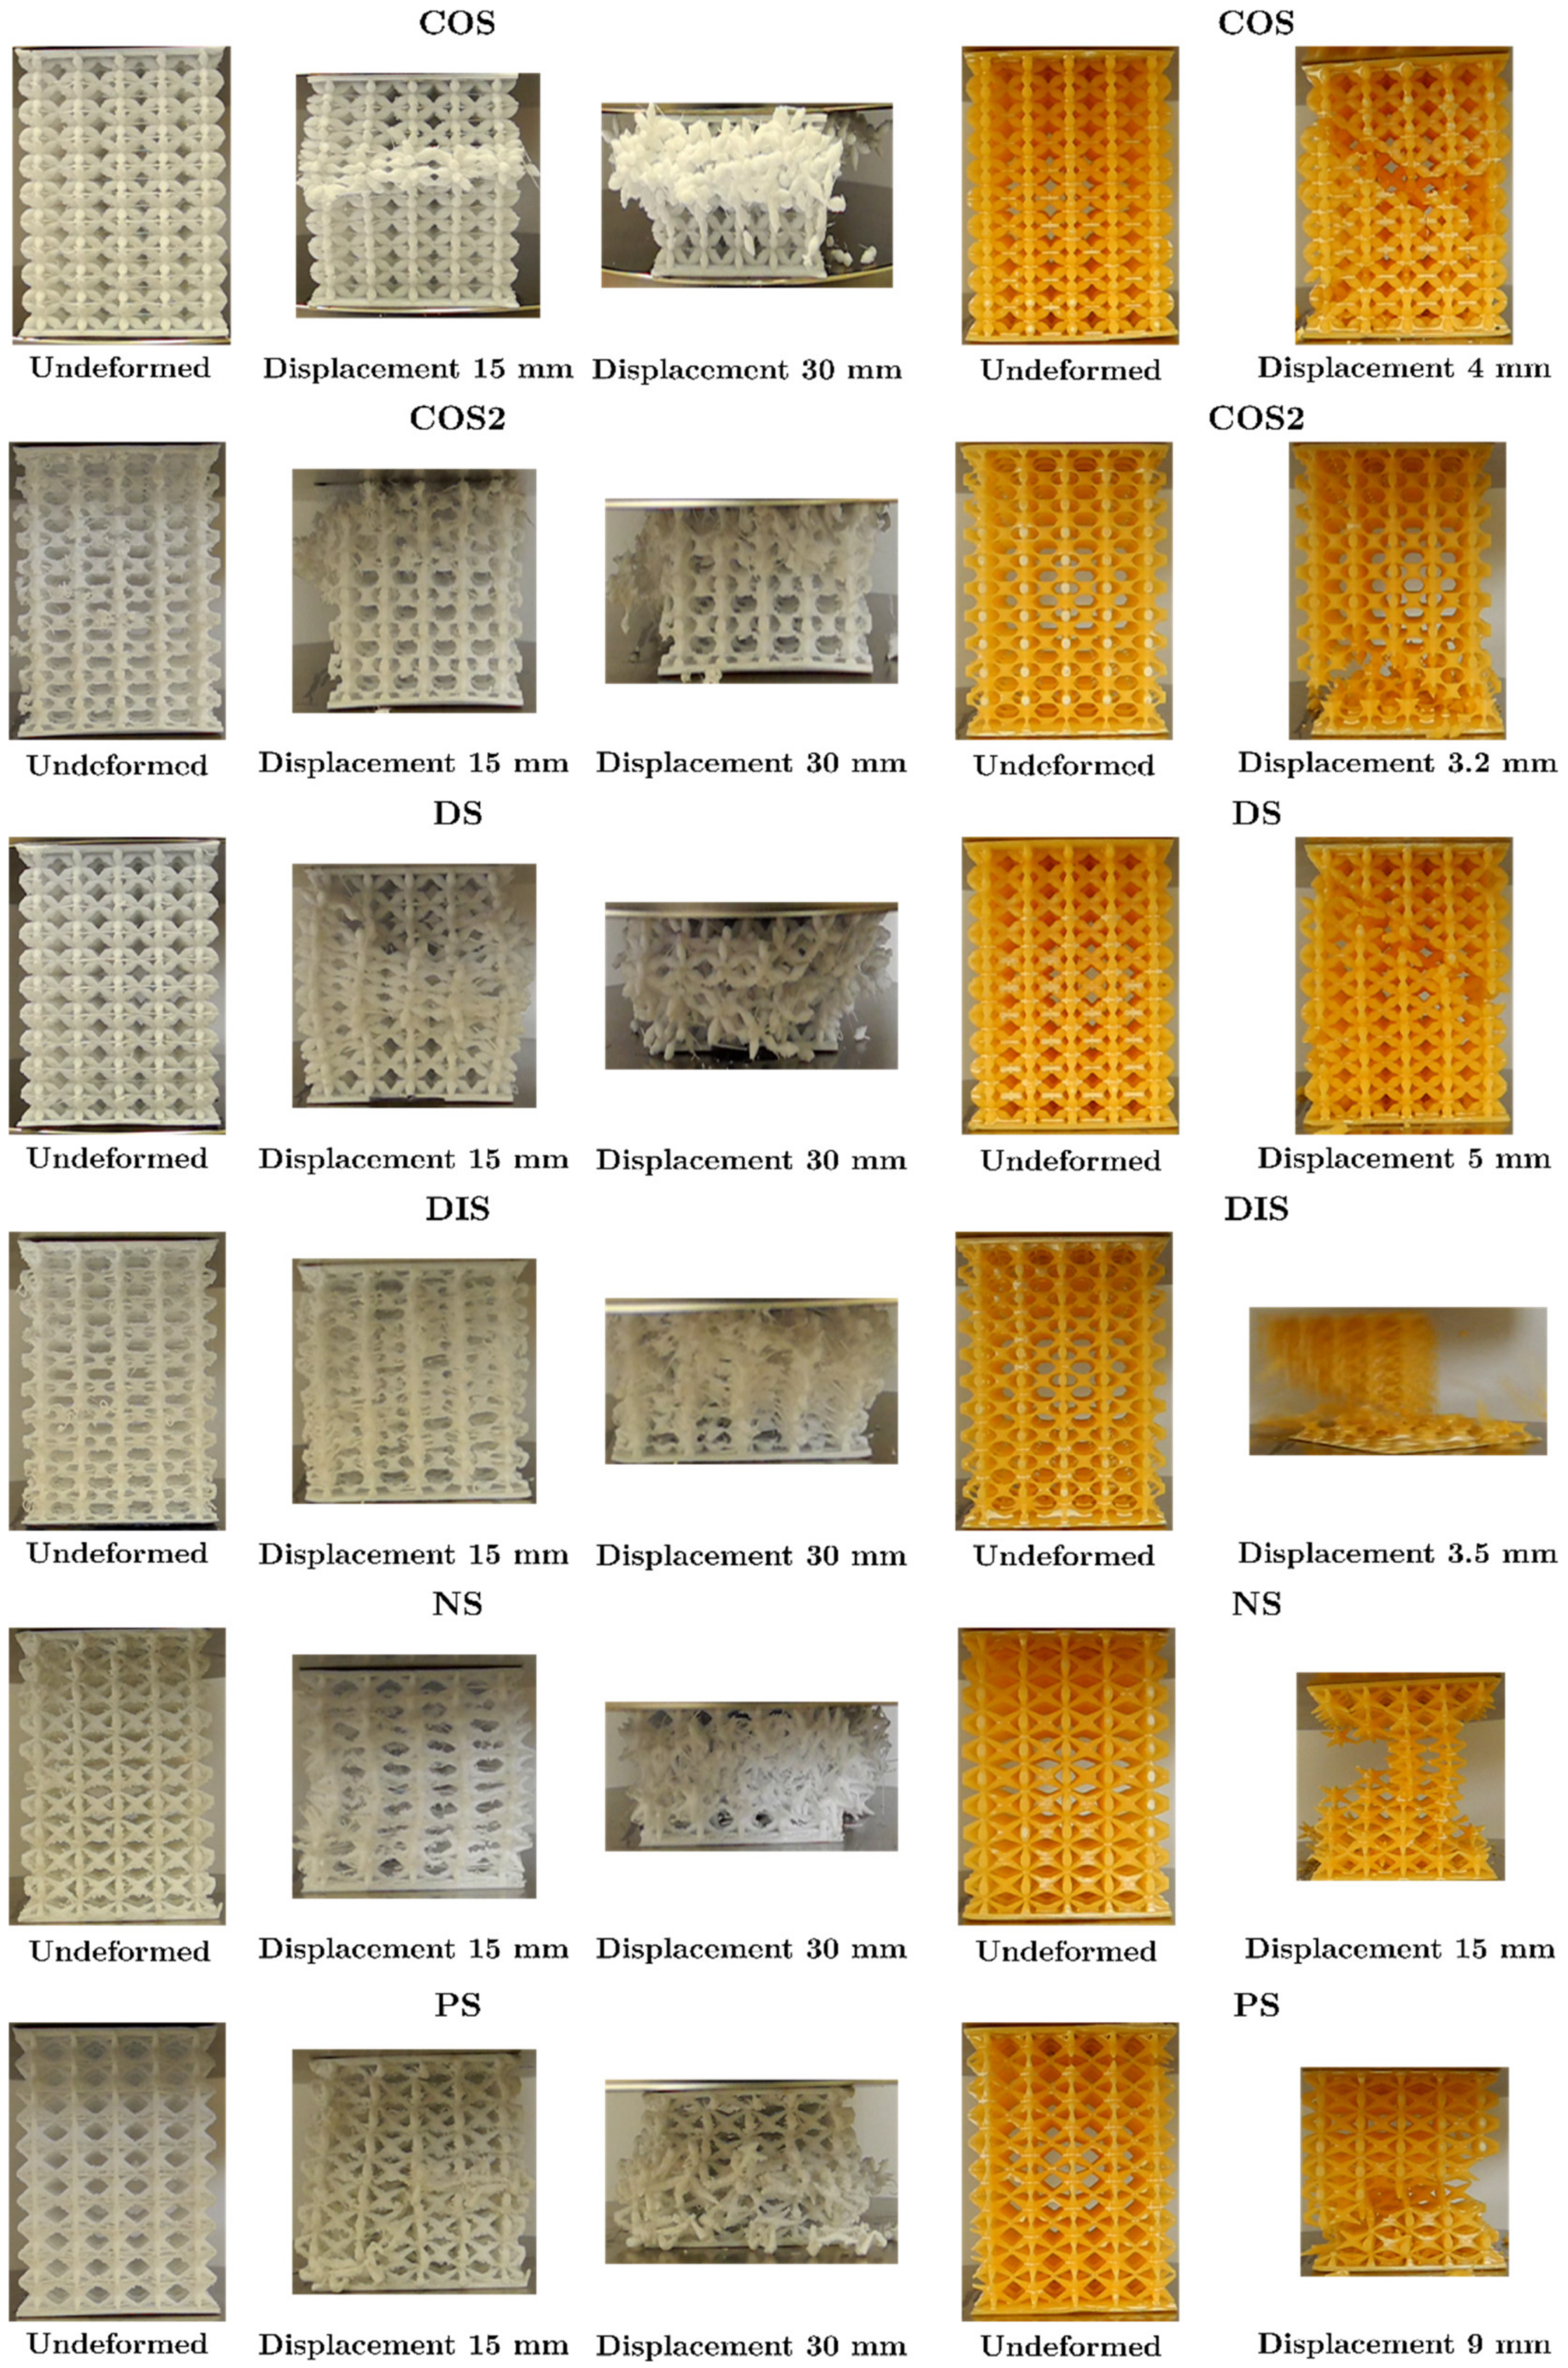
3.3. Additive Manufacturing Layered Lattice Structures
3.4. Mechanical Properties of Lattices Structures under Compression
3.4.1. Characterization of the Mechanical Properties of FFF Structures
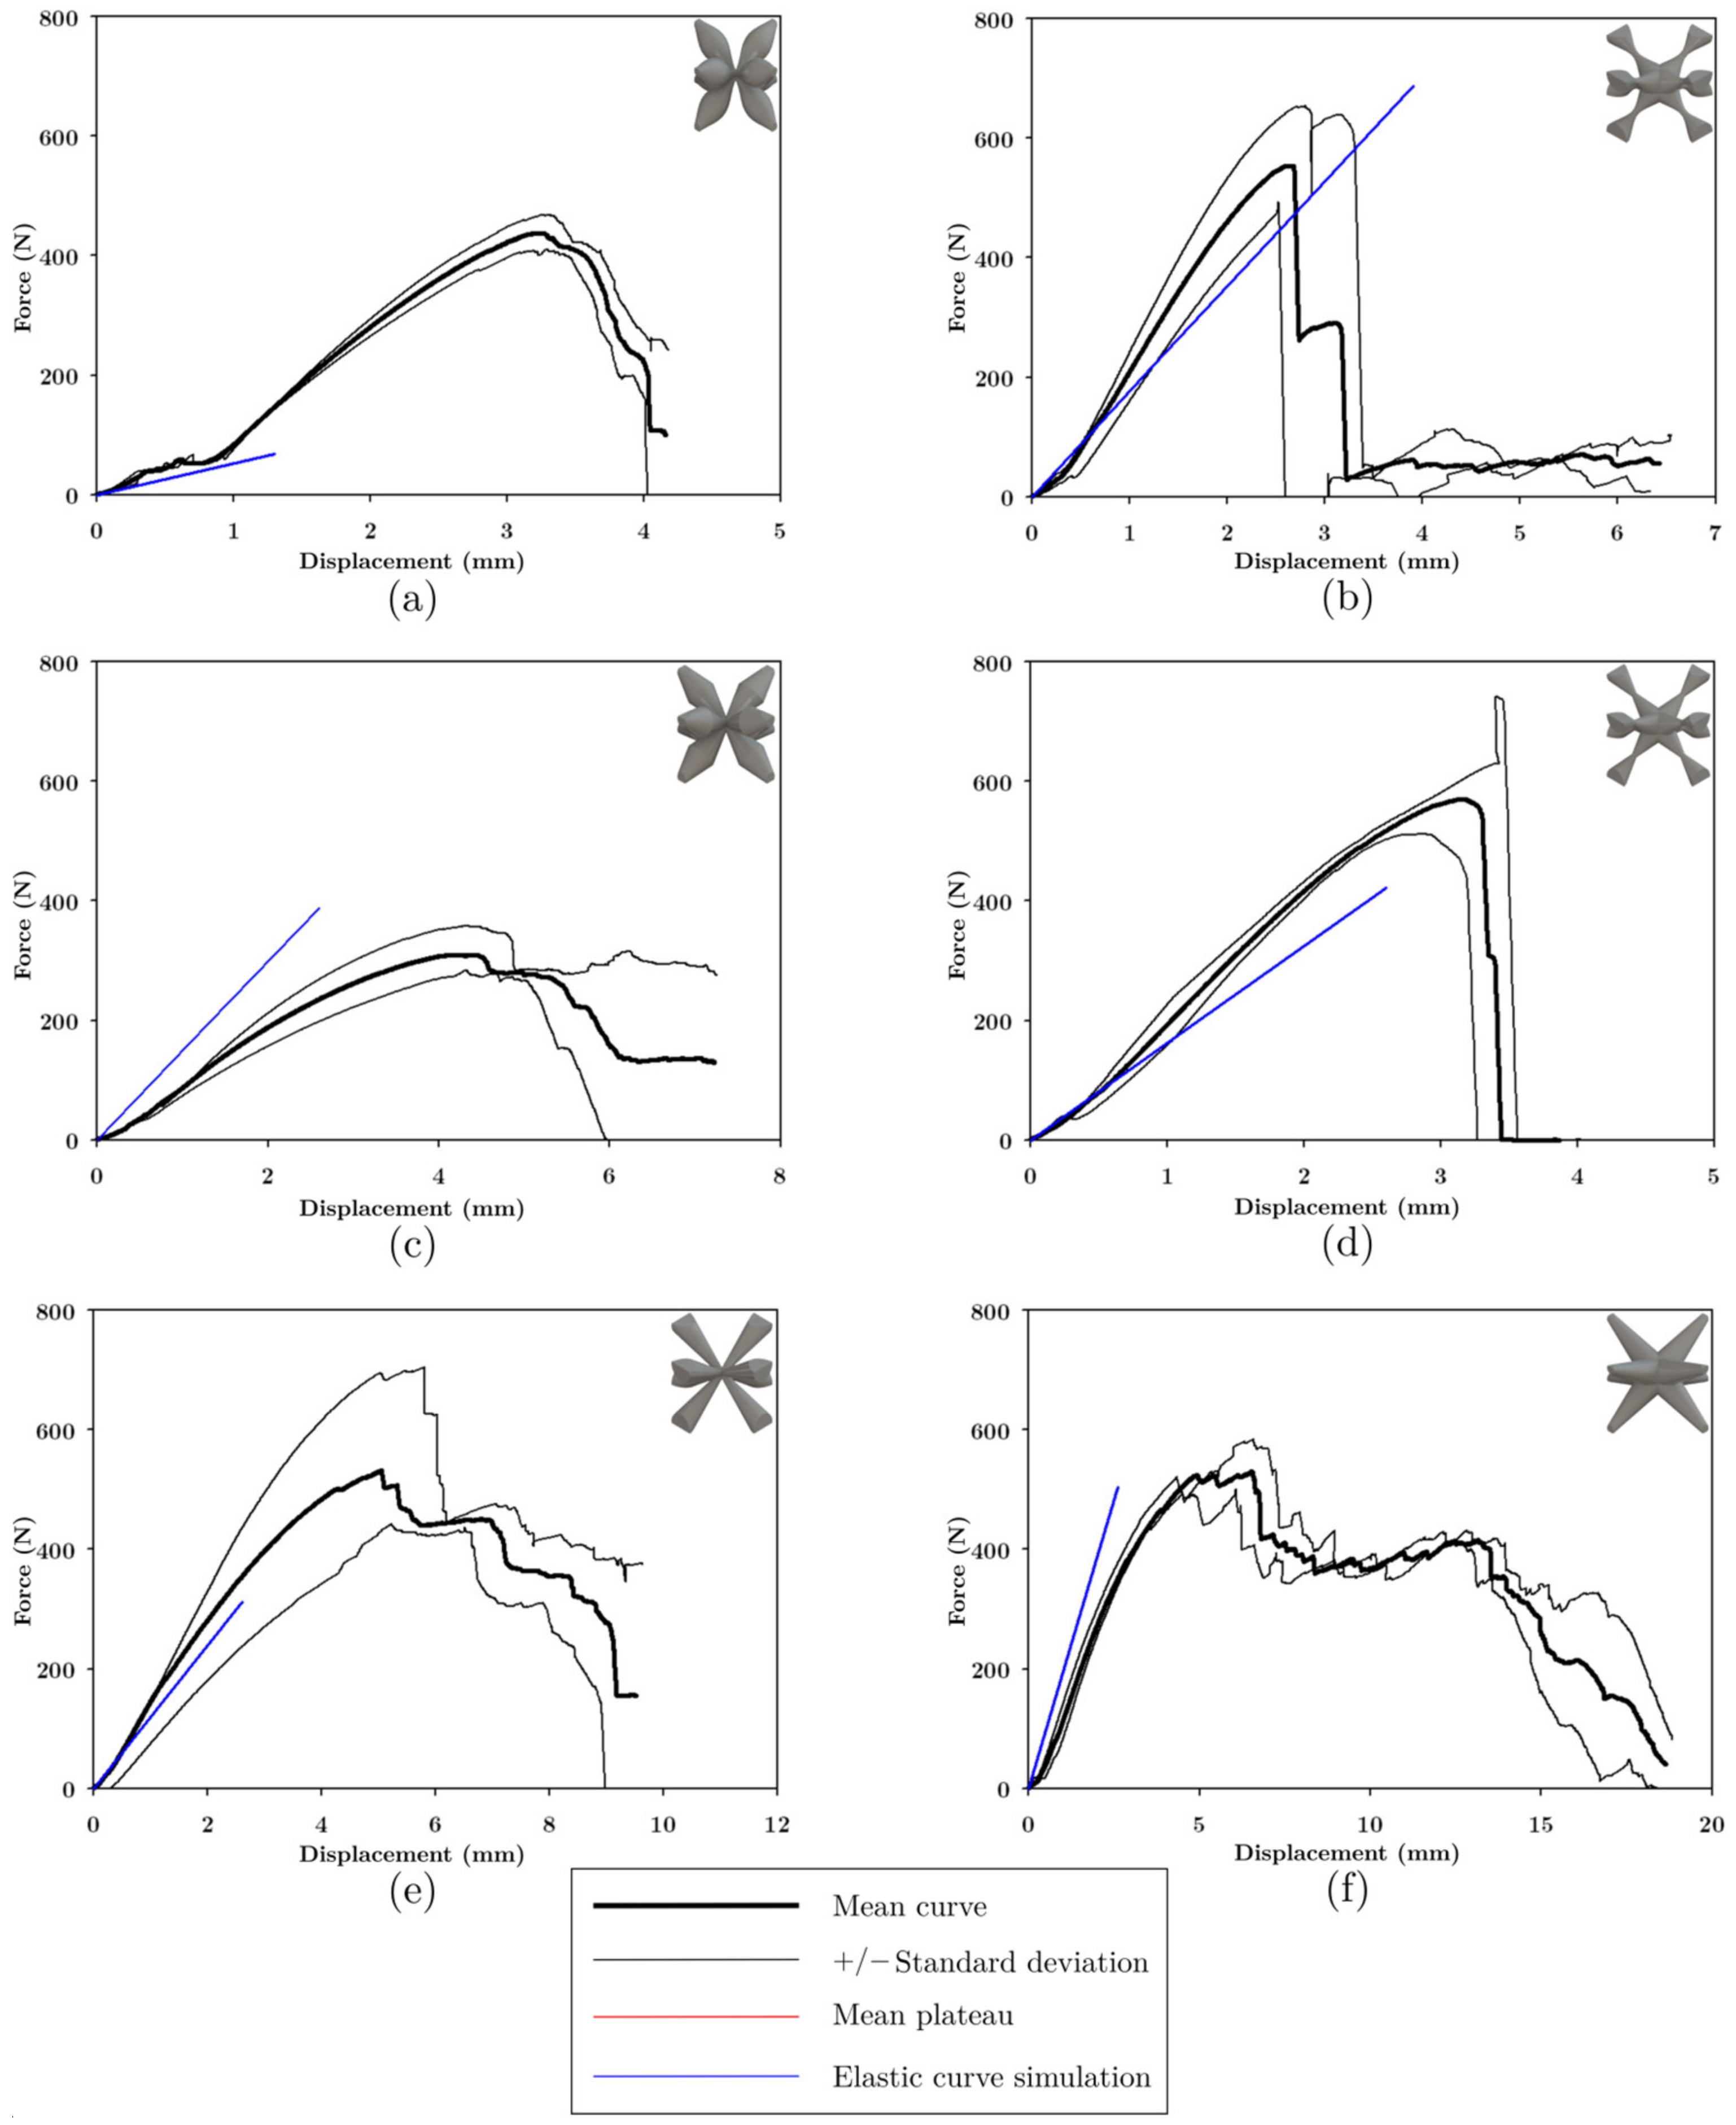
3.4.2. Characterization of the Mechanical Properties of LCD Structures
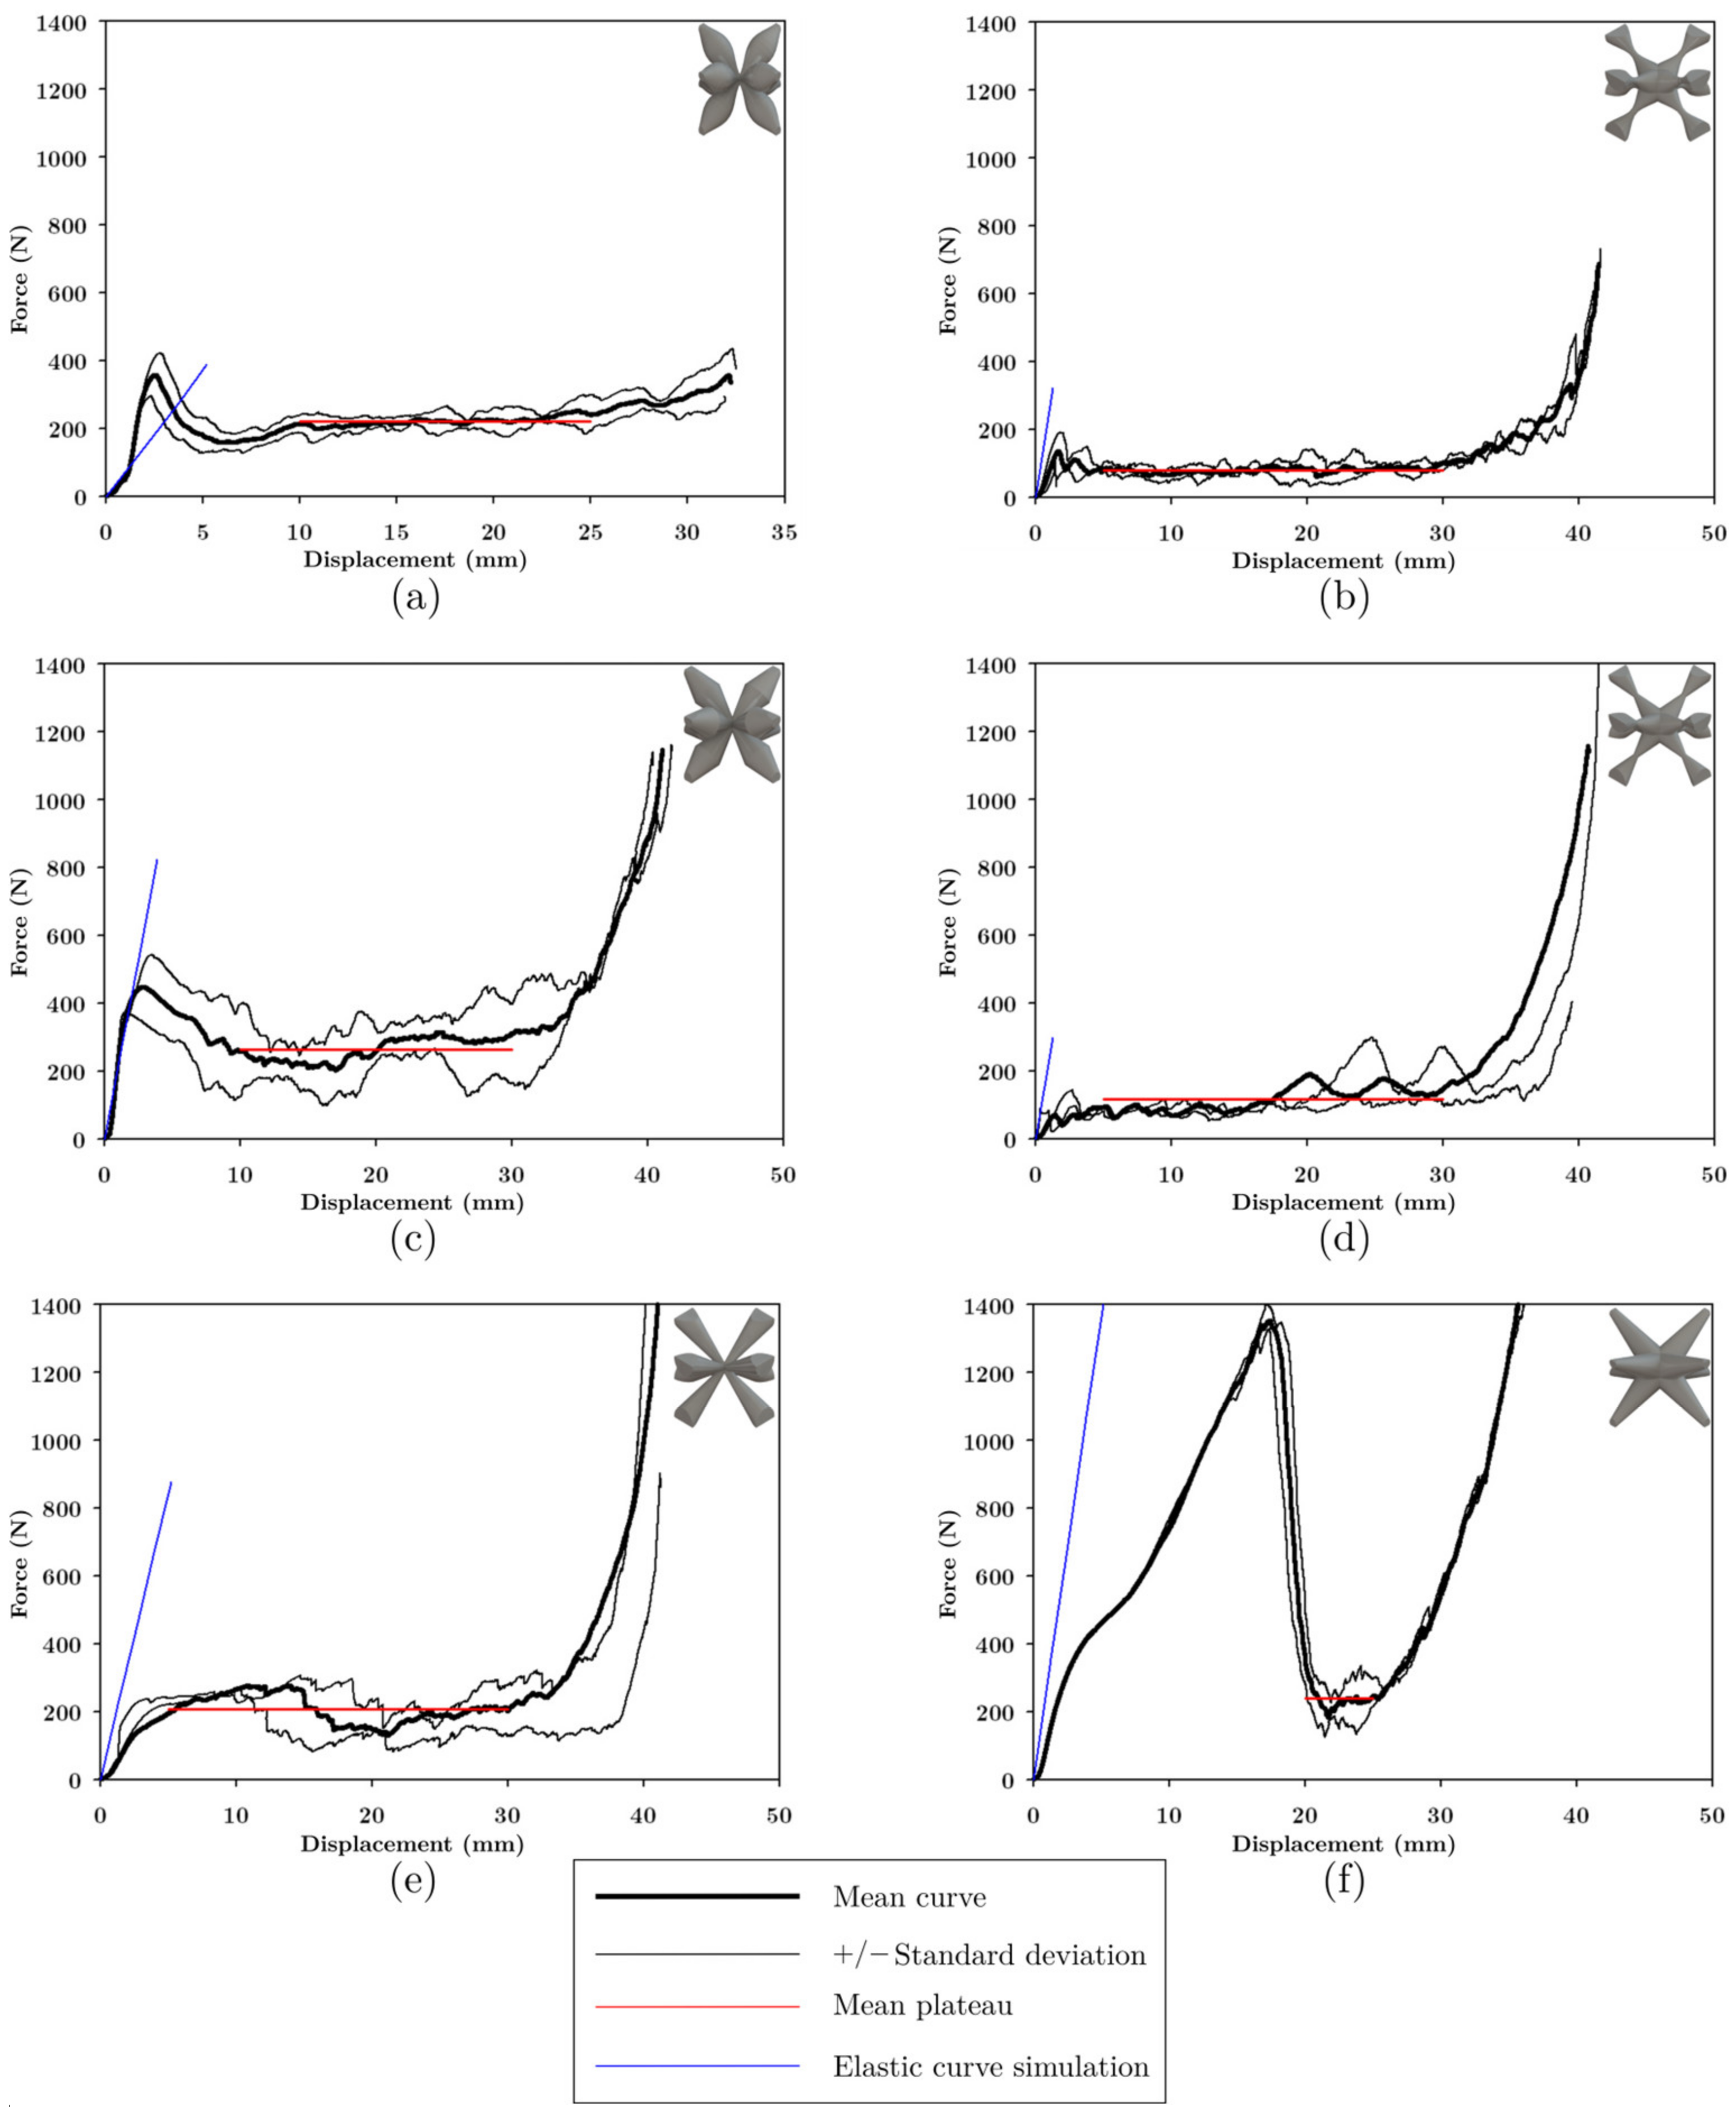
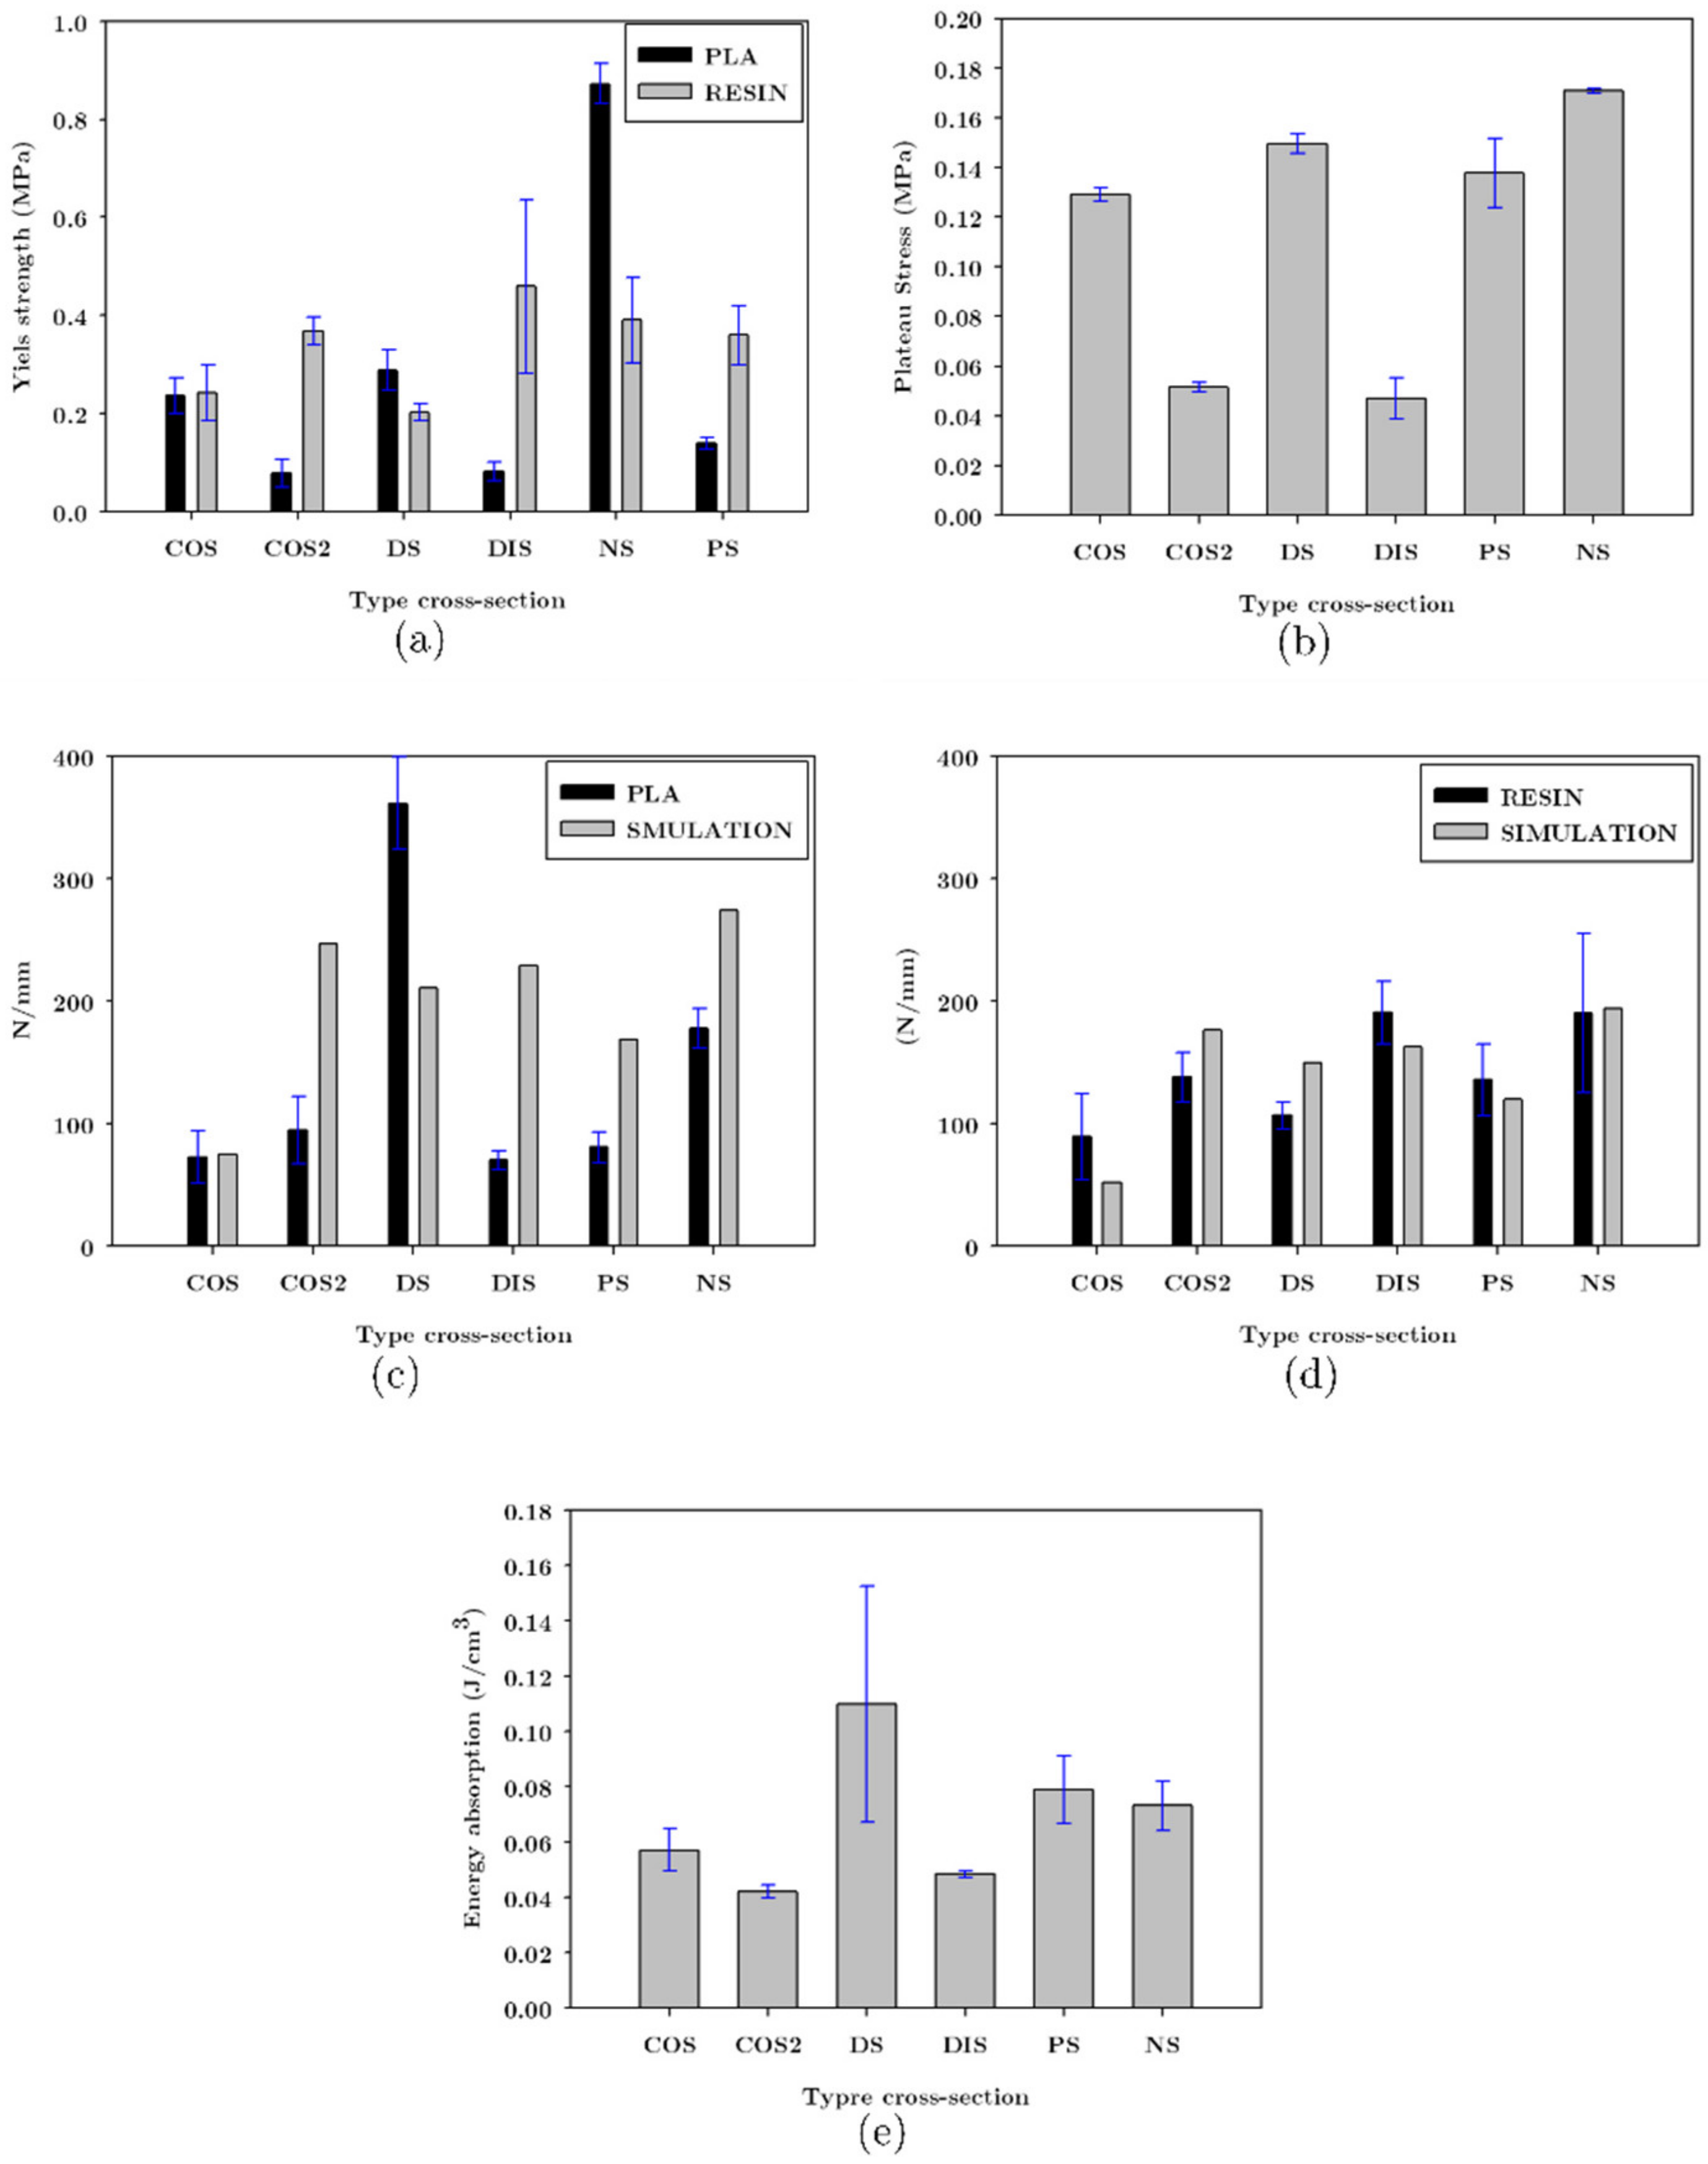
3.4.3. Maximum Stress, Plateau, and Energy Absorption
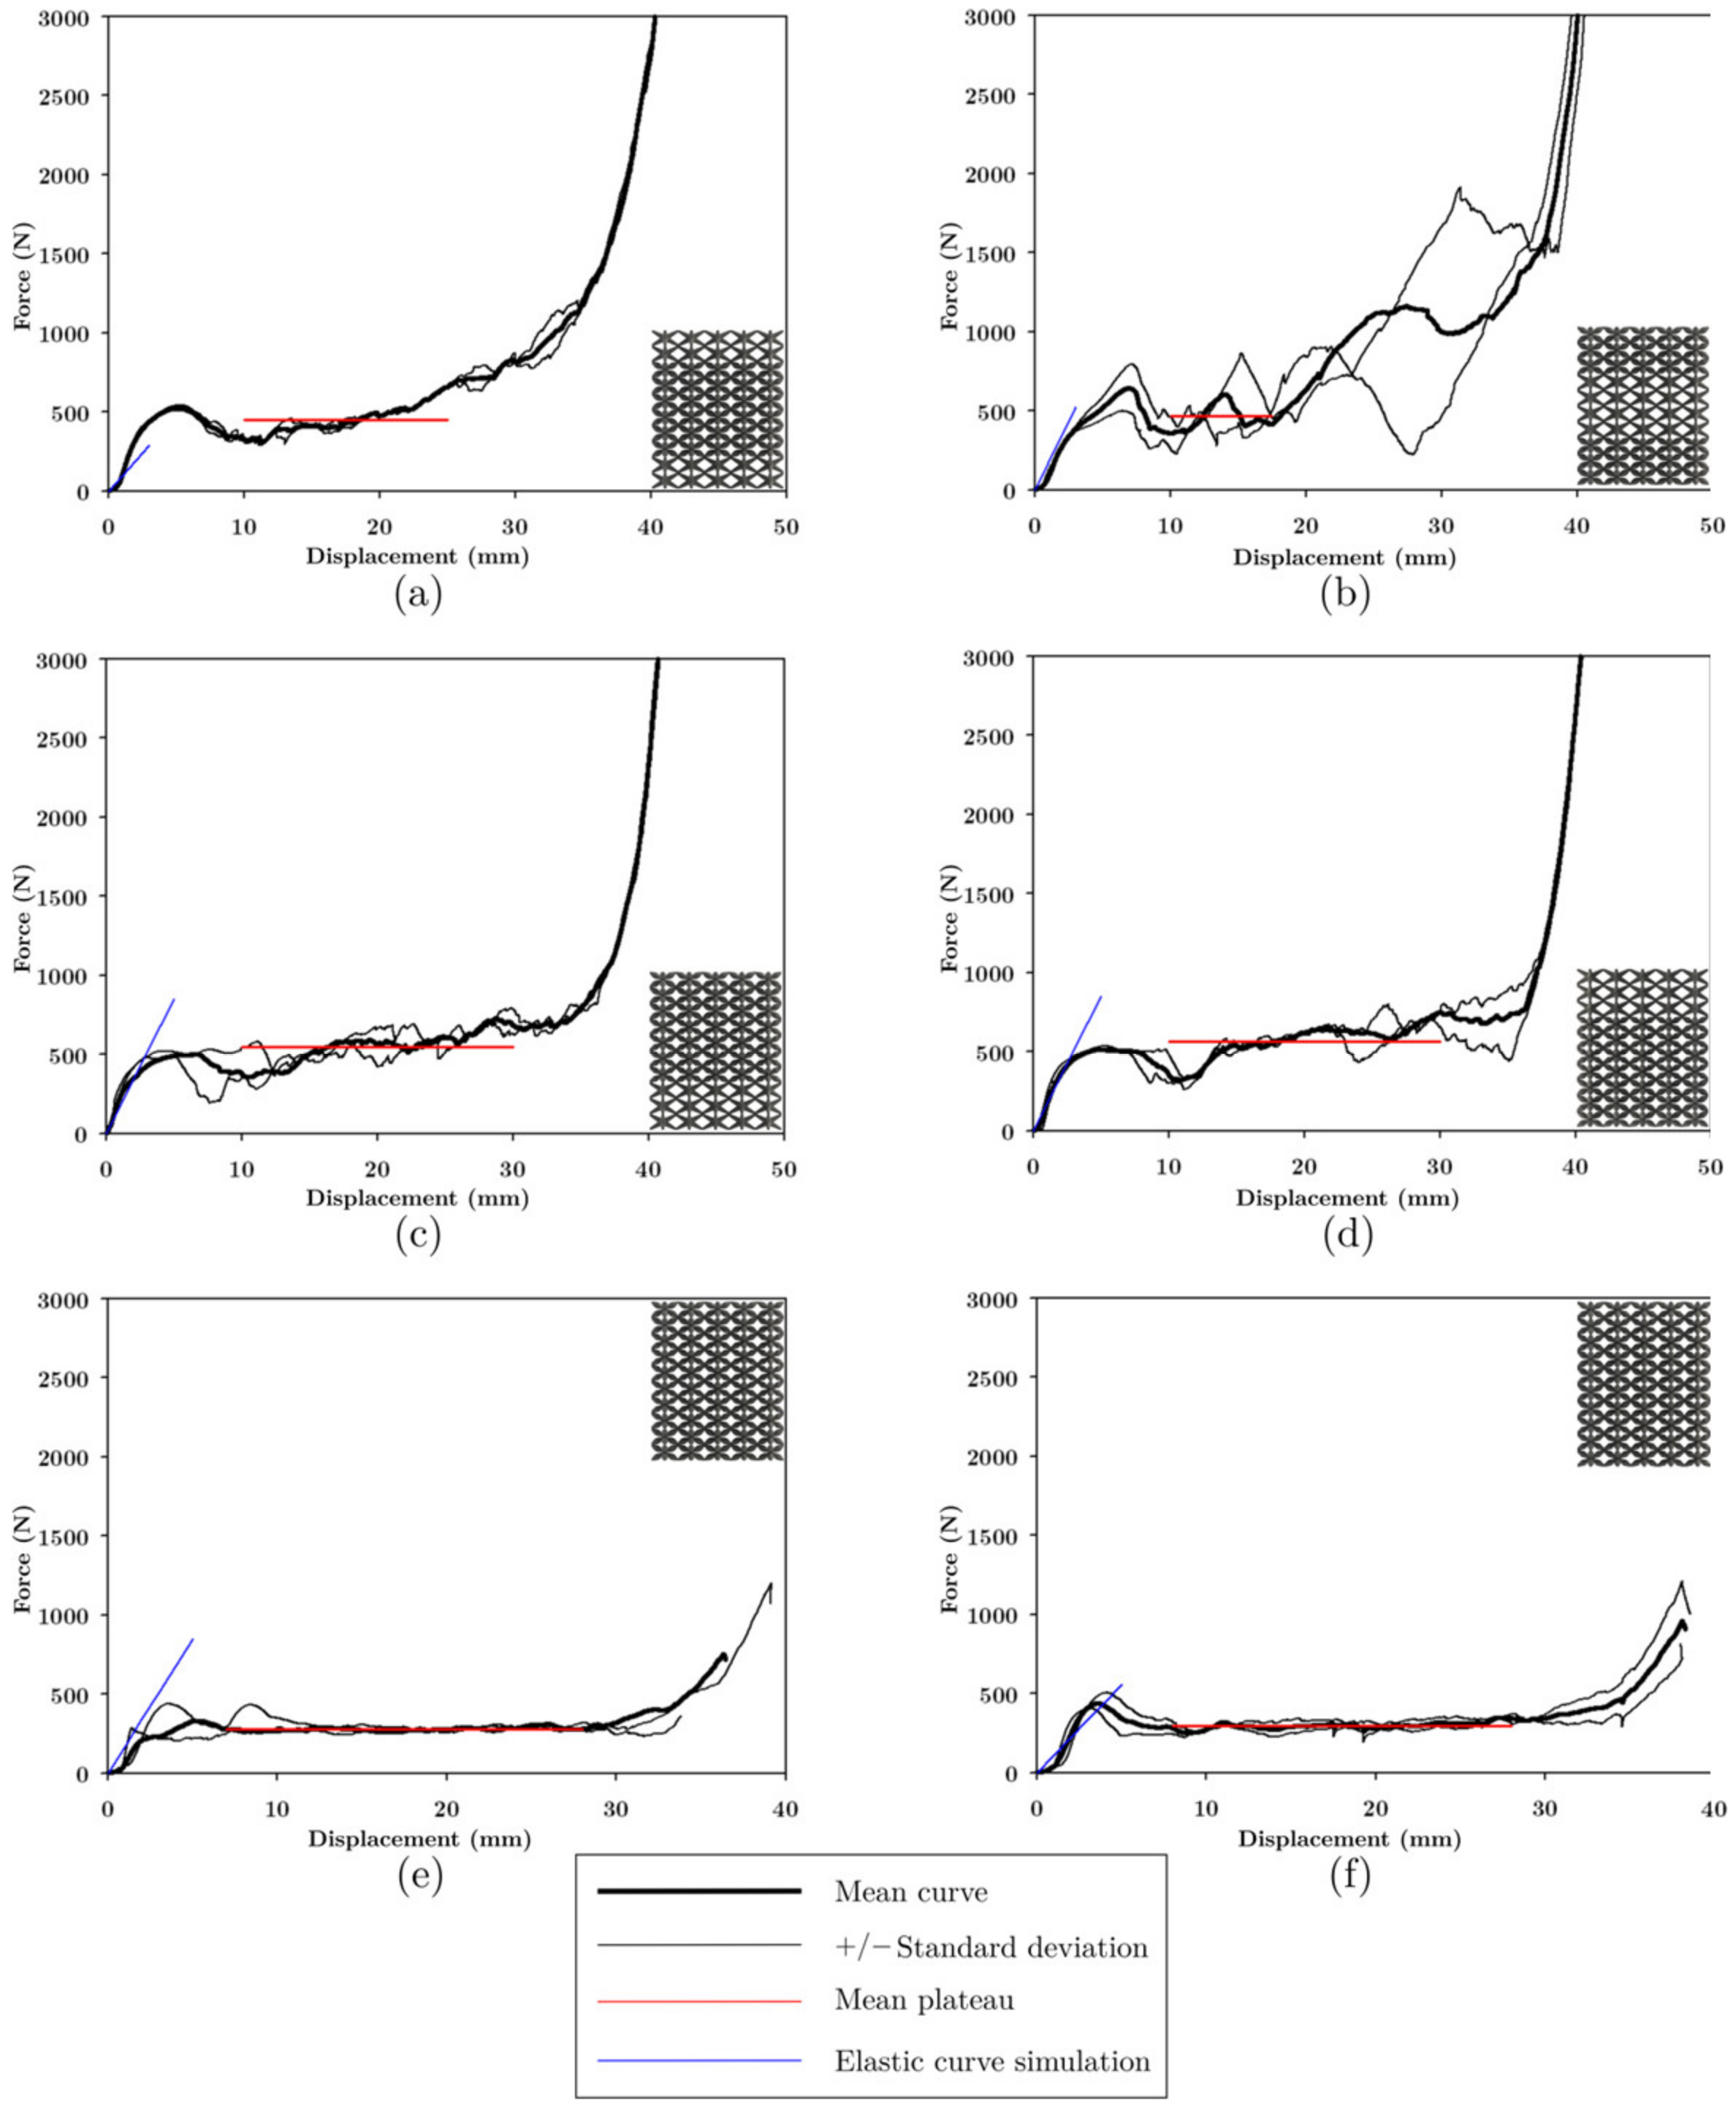
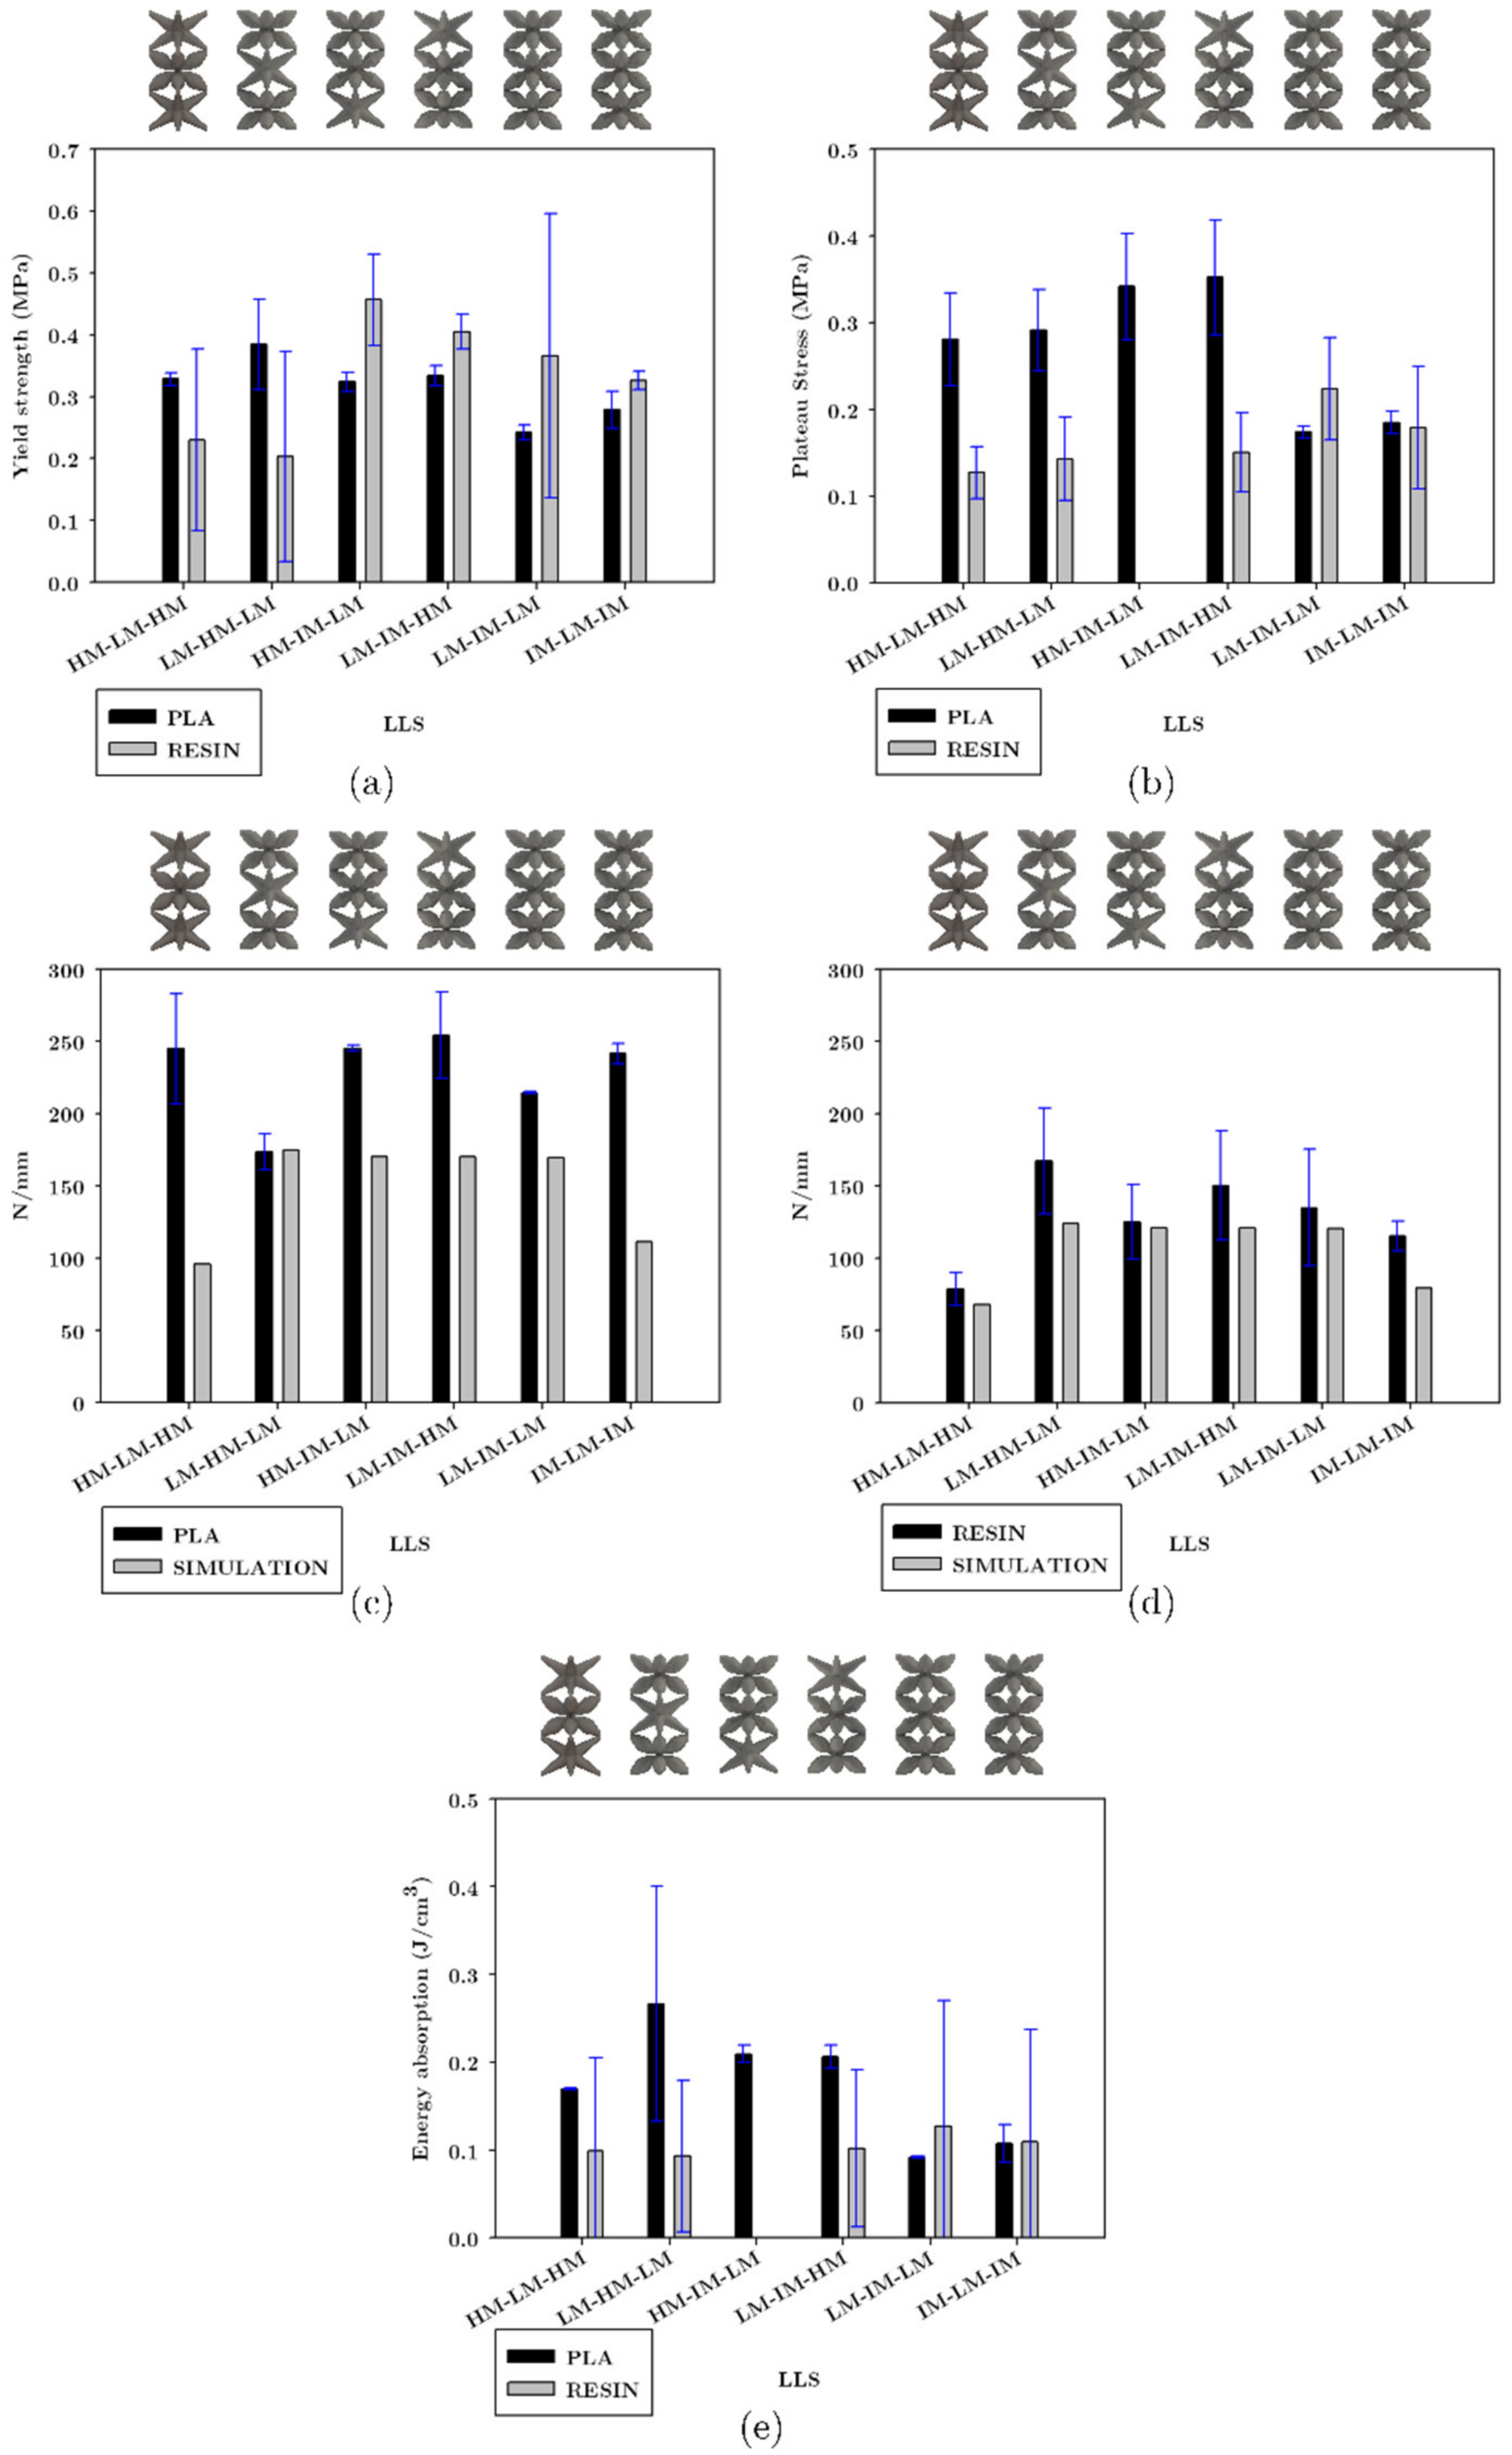
3.4.4. Mechanical Properties of Layered Lattice Structures under Compression
4. Conclusions
Author Contributions
Funding
Institutional Review Board Statement
Informed Consent Statement
Data Availability Statement
Conflicts of Interest
References
- Smith, M.; Guan, Z.; Cantwell, W.J. Finite Element Modelling of the Compressive Response of Lattice Structures Manufactured Using the Selective Laser Melting Technique. Int. J. Mech. Sci. 2013, 67, 28–41. [Google Scholar] [CrossRef]
- Wang, Z.; Zhou, Y.; Wang, X.; Wei, K. Compression Behavior of Strut-Reinforced Hierarchical Lattice—Experiment and Simulation. Int. J. Mech. Sci. 2021, 210, 106749. [Google Scholar] [CrossRef]
- Benedetti, M.; du Plessis, A.; Ritchie, R.O.; Dallago, M.; Razavi, S.M.J.; Berto, F. Architected Cellular Materials: A Review on Their Mechanical Properties towards Fatigue-Tolerant Design and Fabrication. Mater. Sci. Eng. Rep. 2021, 144, 100606. [Google Scholar] [CrossRef]
- Bhate, D.; Penick, C.A.; Ferry, L.A.; Lee, C. Classification and Selection of Cellular Materials in Mechanical Design: Engineering and Biomimetic Approaches. Designs 2019, 3, 19. [Google Scholar] [CrossRef] [Green Version]
- Lakes, R.S. Cellular Solids. J. Biomech. 1989, 22, 397. [Google Scholar] [CrossRef]
- Yan, C.; Hao, L.; Hussein, A.; Young, P.; Raymont, D. Advanced Lightweight 316 L Stainless Steel Cellular Lattice Structures Fabricated via Selective Laser Melting. Mater. Des. 2014, 55, 533–541. [Google Scholar] [CrossRef] [Green Version]
- Maskery, I.; Aremu, A.O.; Parry, L.; Wildman, R.D.; Tuck, C.J.; Ashcroft, I.A. Effective Design and Simulation of Surface-Based Lattice Structures Featuring Volume Fraction and Cell Type Grading. Mater. Des. 2018, 155, 220–232. [Google Scholar] [CrossRef]
- Choy, S.Y.; Sun, C.N.; Leong, K.F.; Wei, J. Compressive Properties of Functionally Graded Lattice Structures Manufactured by Selective Laser Melting. Mater. Des. 2017, 131, 112–120. [Google Scholar] [CrossRef]
- Bai, L.; Gong, C.; Chen, X.; Sun, Y.; Xin, L.; Pu, H.; Peng, Y.; Luo, J. Mechanical Properties and Energy Absorption Capabilities of Functionally Graded Lattice Structures: Experiments and Simulations. Int. J. Mech. Sci. 2020, 182, 105735. [Google Scholar] [CrossRef]
- Zhang, M.; Zhao, C.; Li, G.; Chen, R.; Liang, W. Research on the Cushioning Performance of Layered Lattice Materials with Multi-Configuration. Mater. Today Commun. 2022, 31, 103246. [Google Scholar] [CrossRef]
- Bhate, D. Four Questions in Cellular Material Design. Materials 2019, 12, 1060. [Google Scholar] [CrossRef] [PubMed] [Green Version]
- Abstract of: ISO 13314: 2011 Mechanical Testing of Metals—Ductility Testing—Compression Test for Porous and Cellular Metals Foreword 1 Scope 2 Normative References 3 Terms and Definitions. 1–3. Available online: https://www.iso.org/standard/53669.html (accessed on 2 August 2022).
- Zhao, M.; Liu, F.; Fu, G.; Zhang, D.Z.; Zhang, T.; Zhou, H. Improved Mechanical Properties and Energy Absorption of BCC Lattice Structures with Triply Periodic Minimal Surfaces Fabricated by SLM. Materials 2018, 11, 2411. [Google Scholar] [CrossRef] [PubMed] [Green Version]
- León-Becerra, J.; González-Estrada, O.A.; Quiroga, J. Effect of Relative Density in in-Plane Mechanical Properties of Common 3D-Printed Polylactic Acid Lattice Structures. ACS Omega 2021, 6, 29830–29838. [Google Scholar] [CrossRef] [PubMed]
- Liu, F.; Mao, Z.; Zhang, P.; Zhang, D.Z.; Jiang, J.; Ma, Z. Functionally Graded Porous Scaffolds in Multiple Patterns: New Design Method, Physical and Mechanical Properties. Mater. Des. 2018, 160, 849–860. [Google Scholar] [CrossRef]
- Zhang, P.; Qi, D.; Xue, R.; Liu, K.; Wu, W.; Li, Y. Mechanical Design and Energy Absorption Performances of Rational Gradient Lattice Metamaterials. Compos. Struct. 2021, 277, 114606. [Google Scholar] [CrossRef]
- Dumas, M.; Terriault, P.; Brailovski, V. Modelling and Characterization of a Porosity Graded Lattice Structure for Additively Manufactured Biomaterials. Mater. Des. 2017, 121, 383–392. [Google Scholar] [CrossRef]
- Li, S.; Qin, J.; Wang, B.; Zheng, T.; Hu, Y. Design and Compressive Behavior of a Photosensitive Resin-Based 2-D Lattice Structure with Variable Cross-Section Core. Polymers 2019, 11, 186. [Google Scholar] [CrossRef] [Green Version]
- Goel, A.; Anand, S. Design of Functionally Graded Lattice Structures Using B-Splines for Additive Manufacturing. Procedia Manuf. 2019, 34, 655–665. [Google Scholar] [CrossRef]
- Wojnicz, W.; Augustyniak, M.; Borzyszkowski, P. Mathematical Approach to Design 3D Scaffolds for the 3D Printable Bone Implant. Biocybern. Biomed. Eng. 2021, 41, 667–678. [Google Scholar] [CrossRef]
- Han, C.; Li, Y.; Wang, Q.; Wen, S.; Wei, Q.; Yan, C.; Hao, L.; Liu, J.; Shi, Y. Continuous Functionally Graded Porous Titanium Scaffolds Manufactured by Selective Laser Melting for Bone Implants. J. Mech. Behav. Biomed. Mater. 2018, 80, 119–127. [Google Scholar] [CrossRef]
- Wang, H.V.; Johnston, S.R.; Rosen, D.W. Design of a Graded Cellular Structure for an Acetabular Hip Replacement Component. In 2006 International Solid Freeform Fabrication Symposium; The University of Texas at Austin: Austin, TX, USA, 2006; pp. 111–123. [Google Scholar]
- Alkhatib, S.E.; Tarlochan, F.; Mehboob, H.; Singh, R.; Kadirgama, K.; Harun, W.S.B.W. Finite Element Study of Functionally Graded Porous Femoral Stems Incorporating Body-Centered Cubic Structure. Artif. Organs 2019, 43, E152–E164. [Google Scholar] [CrossRef]
- Nazir, A.; Abate, K.M.; Kumar, A.; Jeng, J.Y. A State-of-the-Art Review on Types, Design, Optimization, and Additive Manufacturing of Cellular Structures. Int. J. Adv. Manuf. Technol. 2019, 104, 3489–3510. [Google Scholar] [CrossRef]
- Uribe-Lam, E.; Treviño-Quintanilla, C.D.; Cuan-Urquizo, E.; Olvera-Silva, O. Use of Additive Manufacturing for the Fabrication of Cellular and Lattice Materials: A Review. Mater. Manuf. Process. 2021, 36, 257–280. [Google Scholar] [CrossRef]
- Askari, M.; Hutchins, D.A.; Thomas, P.J.; Astolfi, L.; Watson, R.L.; Abdi, M.; Ricci, M.; Laureti, S.; Nie, L.; Freear, S.; et al. Additive Manufacturing of Metamaterials: A Review. Addit. Manuf. 2020, 36, 101562. [Google Scholar] [CrossRef]
- Silva, R.G.; Estay, C.S.; Pavez, G.M.; Viñuela, J.Z.; Torres, M.J. Influence of Geometric and Manufacturing Parameters on the Compressive Behavior of 3d Printed Polymer Lattice Structures. Materials 2021, 14, 1462. [Google Scholar] [CrossRef]
- ISO/ASTM 52900:2015; Additive Manufacturing—General Principles and Terminology. International Organization for Standardization: Geneva, Switzerland, 2015; pp. 1–26.
- ASTM D638—02a; Standard Test Method for Tensile Properties of Plastics. American Society for Testing and Materials: West Conshohocken, PA, USA, 2003; pp. 46–58.
- Guerra Silva, R.; Torres, M.J.; Zahr Viñuela, J. A Comparison of Miniature Lattice Structures Produced by Material Extrusion and Vat Photopolymerization Additive Manufacturing. Polymers 2021, 13, 2163. [Google Scholar] [CrossRef]
- Gorguluarslan, R.M.; Gungor, O.U.; Yıldız, S.; Erem, E. Energy Absorption Behavior of Stiffness Optimized Graded Lattice Structures Fabricated by Material Extrusion. Meccanica 2021, 56, 2825–2841. [Google Scholar] [CrossRef]


| Cross-Section | 3D Model | FFF | LCD |
|---|---|---|---|
| COS | 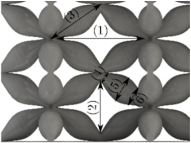 | 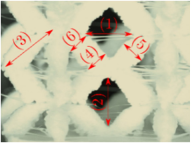 |  |
| COS2 | 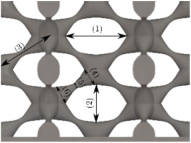 | 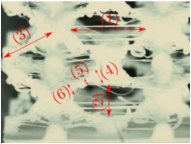 |  |
| DS | 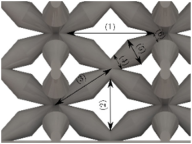 | 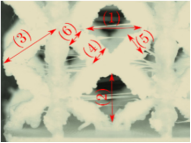 | 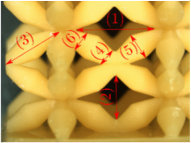 |
| DIS |  | 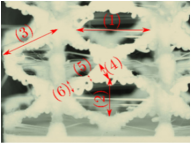 |  |
| PS | 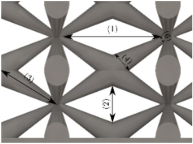 | 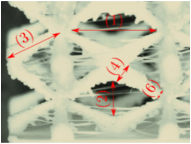 | 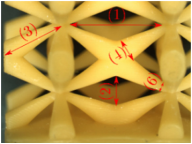 |
| NS | 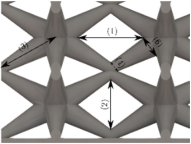 | 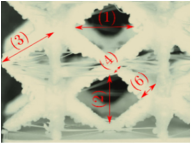 |  |
| FFF | |||||||
|---|---|---|---|---|---|---|---|
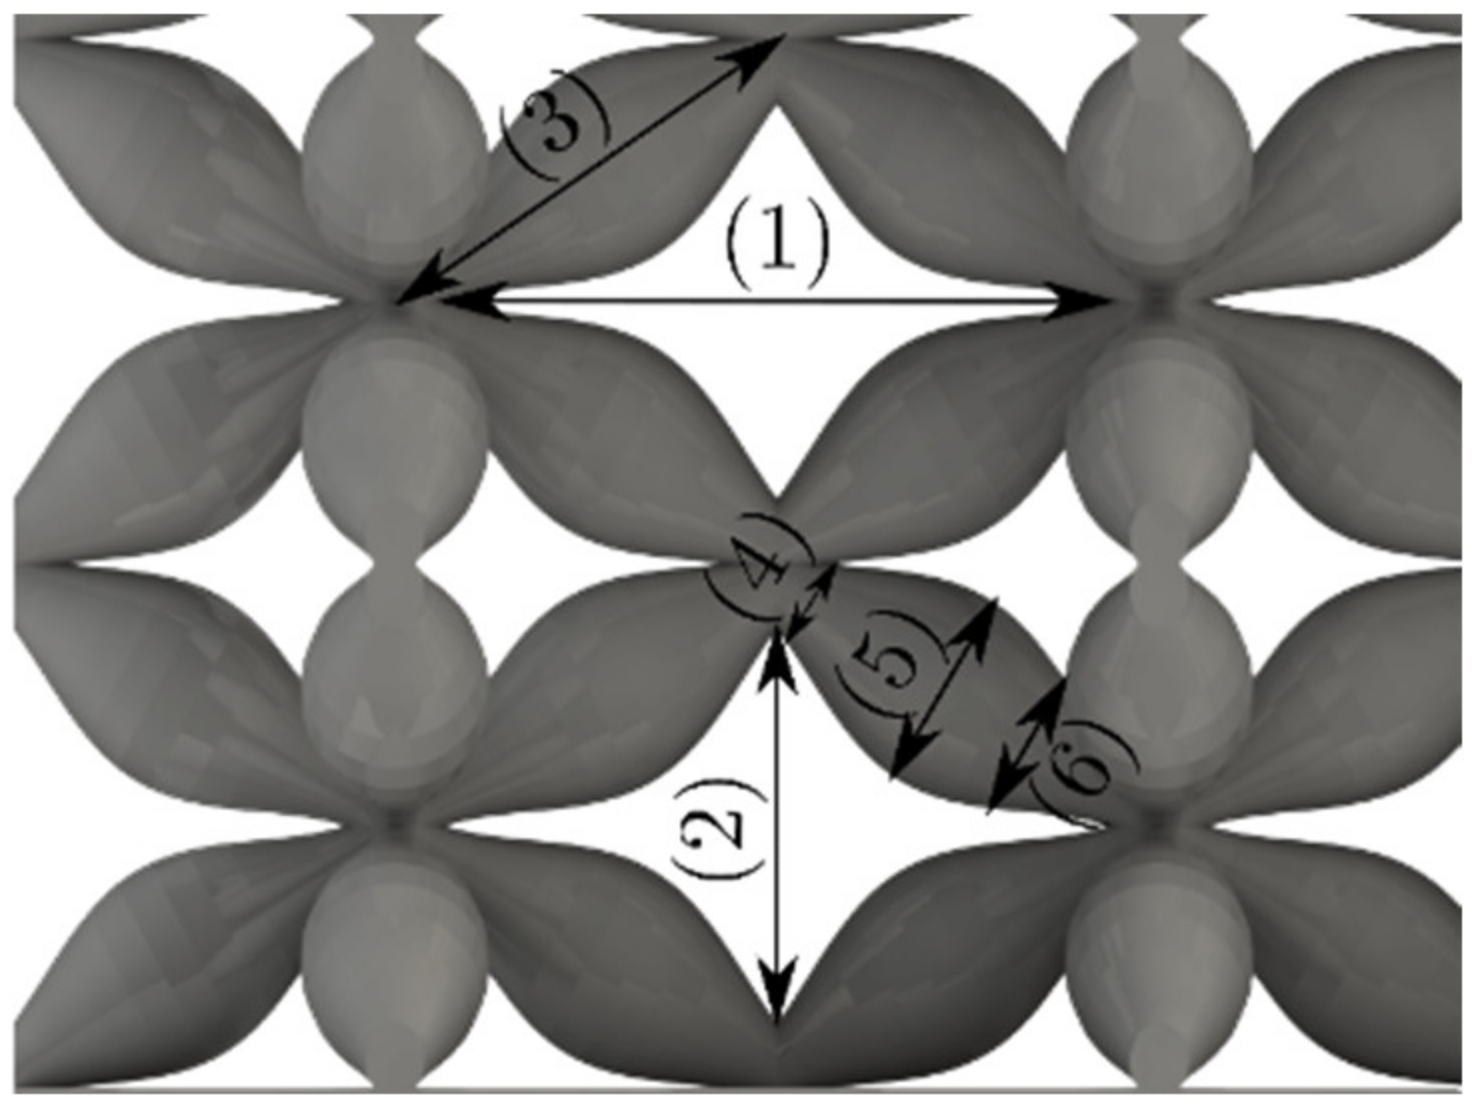
| Cross-Section | CAD Model and Printing Process | Horizontal Space (1) | Vertical Space (2) | Strut Length (3) | Extreme Diameter (4) | Central Diameter (5) | Extreme Diameter (6) |
| COS | CAD | 7.08 | 3.75 | 4.72 | 0.93 | 1.98 | 1.44 |
| Printed Average | 3.18 | 3.5 | 3.475 | 1.345 | 1.68 | 1.515 | |
| COS2 | CAD | 5.12 | 2.76 | 4.72 | 1.44 | 0.49 | 1.44 |
| Printed Average | 5.1 | 2.385 | 3.895 | 1.032 | 0.554 | 0.944 | |
| DS | CAD | 7.2 | 3.75 | 4.72 | 1.35 | 2 | 1.12 |
| Printed Average | 3.89 | 3.345 | 4.455 | 1.41 | 1.715 | 1.19 | |
| DIS | CAD | 5.39 | 3.01 | 7.2 | 1.12 | 0.5 | 1.3 |
| Printed Average | 5.34 | 2.53 | 4.22 | 0.965 | 0.49 | 0.93 | |
| PS | CAD | 4.84 | 3.89 | 4.72 | 0.63 | - | 1.62 |
| Printed Average | 4.69 | 3.405 | 4.225 | 0.6825 | - | 1.21 | |
| NS | CAD | 6.91 | 2.69 | 4.72 | 1.67 | - | 0.59 |
| Printed Average | 6.145 | 2.385 | 4.325 | 1.38 | - | 0.477 | |
| LCD | |||||||
| Cross-section | CAD model and printing process | Horizontal Space (1) | Vertical Space (2) | Strut Length (3) | Extreme Diameter (4) | Central Diameter (5) | Extreme Diameter (6) |
| COS | CAD | 7.08 | 3.75 | 4.72 | 0.93 | 1.98 | 1.44 |
| Printed Average | 4.62 | 3.085 | 4.34 | 1.685 | 1.925 | 1.715 | |
| COS2 | CAD | 5.12 | 2.76 | 4.72 | 1.44 | 0.49 | 1.44 |
| Printed Average | 4.81 | 2.54 | 4.3 | 1.26 | 0.483 | 1.455 | |
| DS | CAD | 7.2 | 3.75 | 4.72 | 1.35 | 2 | 1.12 |
| Printed Average | 5.55 | 3.095 | 4.535 | 1.295 | 1.875 | 0.965 | |
| DIS | CAD | 5.39 | 3.01 | 7.2 | 1.12 | 0.5 | 1.3 |
| Printed Average | 5.035 | 2.755 | 4.485 | 1.255 | 0.4 | 1.316 | |
| PS | CAD | 4.84 | 3.89 | 4.72 | 0.63 | - | 1.62 |
| Printed Average | 4.49 | 3.56 | 4.405 | 0.708 | - | 1.62 | |
| NS | CAD | 6.91 | 2.69 | 4.72 | 1.67 | - | 0.59 |
| Printed Average | 6.505 | 2.225 | 4.57 | 1.58 | - | 0.596 | |
| UPLS Manufactured via the FFF Process | |||
|---|---|---|---|
| Cross-Section | Maximum Load (N) | Displacement where the Maximum Load Occurs (mm) | Densification Load (N) |
| COS | 357.8 | 2.5 | 280 |
| COS2 | 134.8 | 1.37 | 101.9 |
| DS | 447.6 | 2.8 | 309.8 |
| DIS | 70.15 | 1.4 | 145.1 |
| PS | 276.3 | 10.9 | 247.6 |
| NS | 1351.7 | 17.4 | 243.9 |
| UPLS manufactured via the LCD process | |||
| Cross-section | Maximum load (N) | Displacement where the maximum load occurs (mm) | Densification load (N) |
| COS | 437.3 | 3.2 | - |
| COS2 | 553.2 | 2.6 | - |
| DS | 309.6 | 4.1 | - |
| DIS | 567.2 | 3.2 | - |
| PS | 531.4 | 5 | - |
| NS | 523.7 | 4.9 | - |
| LLS Manufactured via the FFF Process | |||
|---|---|---|---|
| Layered Lattice Structure | Maximum Load (N) | Displacement where the Maximum Load Occurs (mm) | Densification Load (N) |
| HM-LM-HM | 524.6 | 5.25 | 815.2 |
| LM-HM-LM | 642.4 | 6.93 | 1095.2 |
| HM-IM-LM | 501.6 | 6.6 | 707 |
| LM-IM-HM | 513.5 | 5.14 | 755.96 |
| LM-IM-LM | 330.2 | 5.07 | 319 |
| IM-LM-IM | 437.2 | 3.56 | 340.7 |
| LLS manufactured via the LCD process | |||
| Layered Lattice Structure | Maximum Load (N) | Displacement where the Maximum Load Occurs (mm) | Densification Load (N) |
| HM-LM-HM | 364.03 | 2.36 | 399.3 |
| LM-HM-LM | 325.4 | 2.9 | 246.4 |
| HM-IM-LM | 731.06 | 3.33 | - |
| LM-IM-HM | 648.1 | 3.59 | 307.4 |
| LM-IM-LM | 589.4 | 2.47 | 297.6 |
| IM-LM-IM | 521.5 | 3.48 | 476.8 |
Disclaimer/Publisher’s Note: The statements, opinions and data contained in all publications are solely those of the individual author(s) and contributor(s) and not of MDPI and/or the editor(s). MDPI and/or the editor(s) disclaim responsibility for any injury to people or property resulting from any ideas, methods, instructions or products referred to in the content. |
© 2023 by the authors. Licensee MDPI, Basel, Switzerland. This article is an open access article distributed under the terms and conditions of the Creative Commons Attribution (CC BY) license (https://creativecommons.org/licenses/by/4.0/).
Share and Cite
Rico-Baeza, G.; Cuan-Urquizo, E.; Pérez-Soto, G.I.; Alcaraz-Caracheo, L.A.; Camarillo-Gómez, K.A. Additively Manufactured Lattice Materials with a Double Level of Gradation: A Comparison of Their Compressive Properties when Fabricated with Material Extrusion and Vat Photopolymerization Processes. Materials 2023, 16, 649. https://doi.org/10.3390/ma16020649
Rico-Baeza G, Cuan-Urquizo E, Pérez-Soto GI, Alcaraz-Caracheo LA, Camarillo-Gómez KA. Additively Manufactured Lattice Materials with a Double Level of Gradation: A Comparison of Their Compressive Properties when Fabricated with Material Extrusion and Vat Photopolymerization Processes. Materials. 2023; 16(2):649. https://doi.org/10.3390/ma16020649
Chicago/Turabian StyleRico-Baeza, Genaro, Enrique Cuan-Urquizo, Gerardo I. Pérez-Soto, Luis A. Alcaraz-Caracheo, and Karla A. Camarillo-Gómez. 2023. "Additively Manufactured Lattice Materials with a Double Level of Gradation: A Comparison of Their Compressive Properties when Fabricated with Material Extrusion and Vat Photopolymerization Processes" Materials 16, no. 2: 649. https://doi.org/10.3390/ma16020649