
Effect of Different Initial CaO/SiO2 Molar Ratios and Curing Times on the Preparation and Formation Mechanism of Calcium Silicate Hydrate

Abstract
:1. Introduction
2. Experimental Section
2.1. Raw Materials
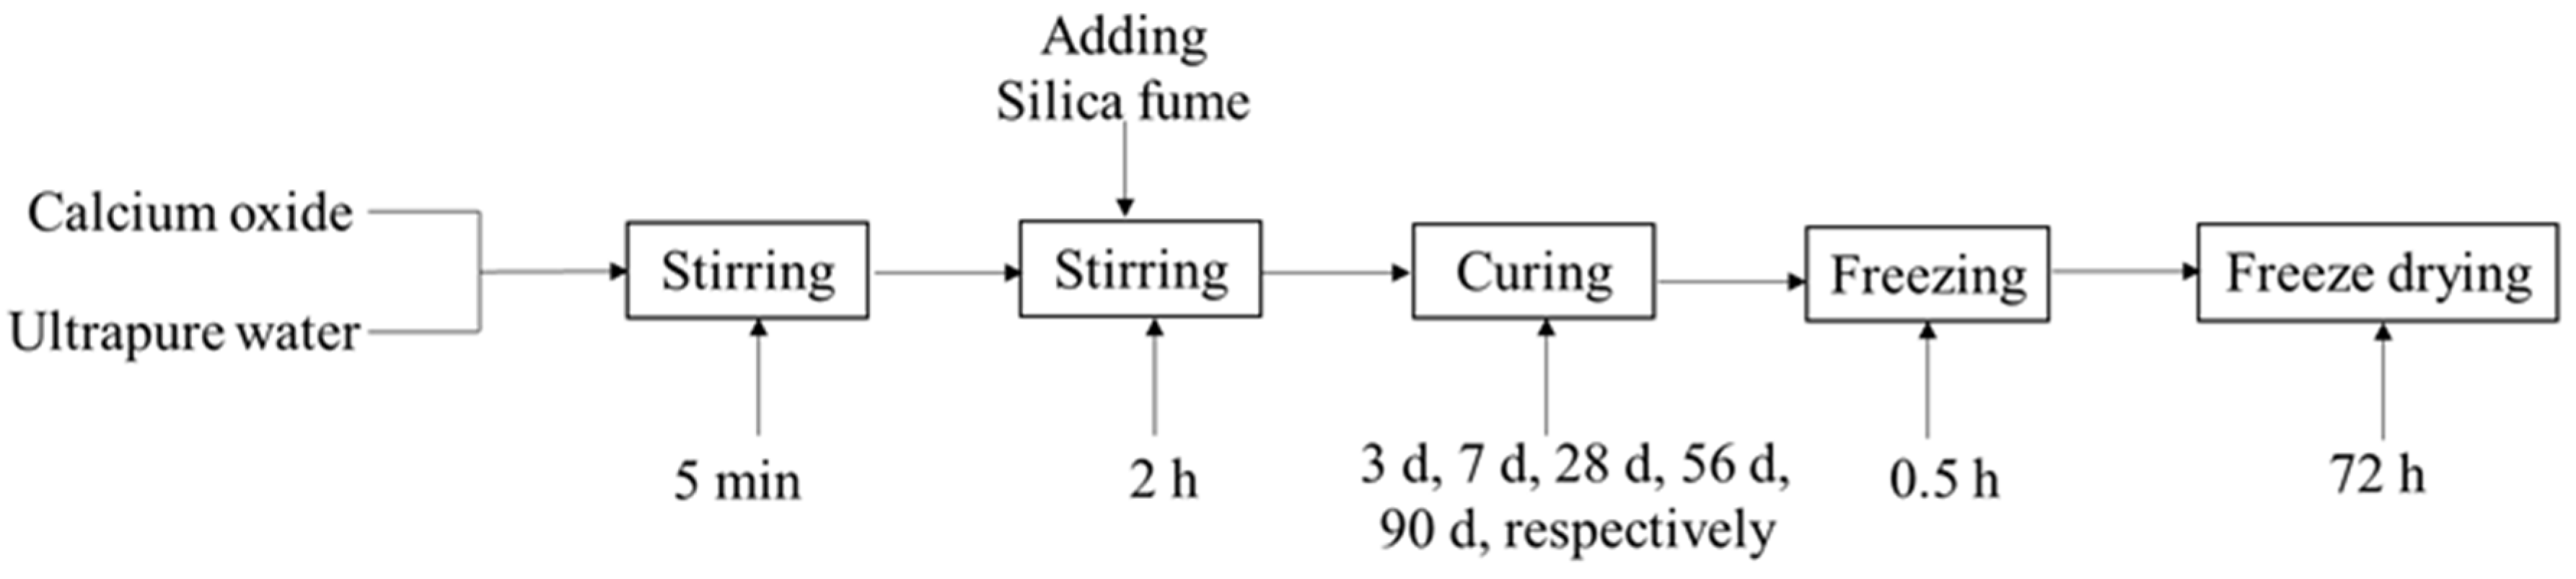
2.2. Synthesis
2.3. Analysis
3. Results and Discussion
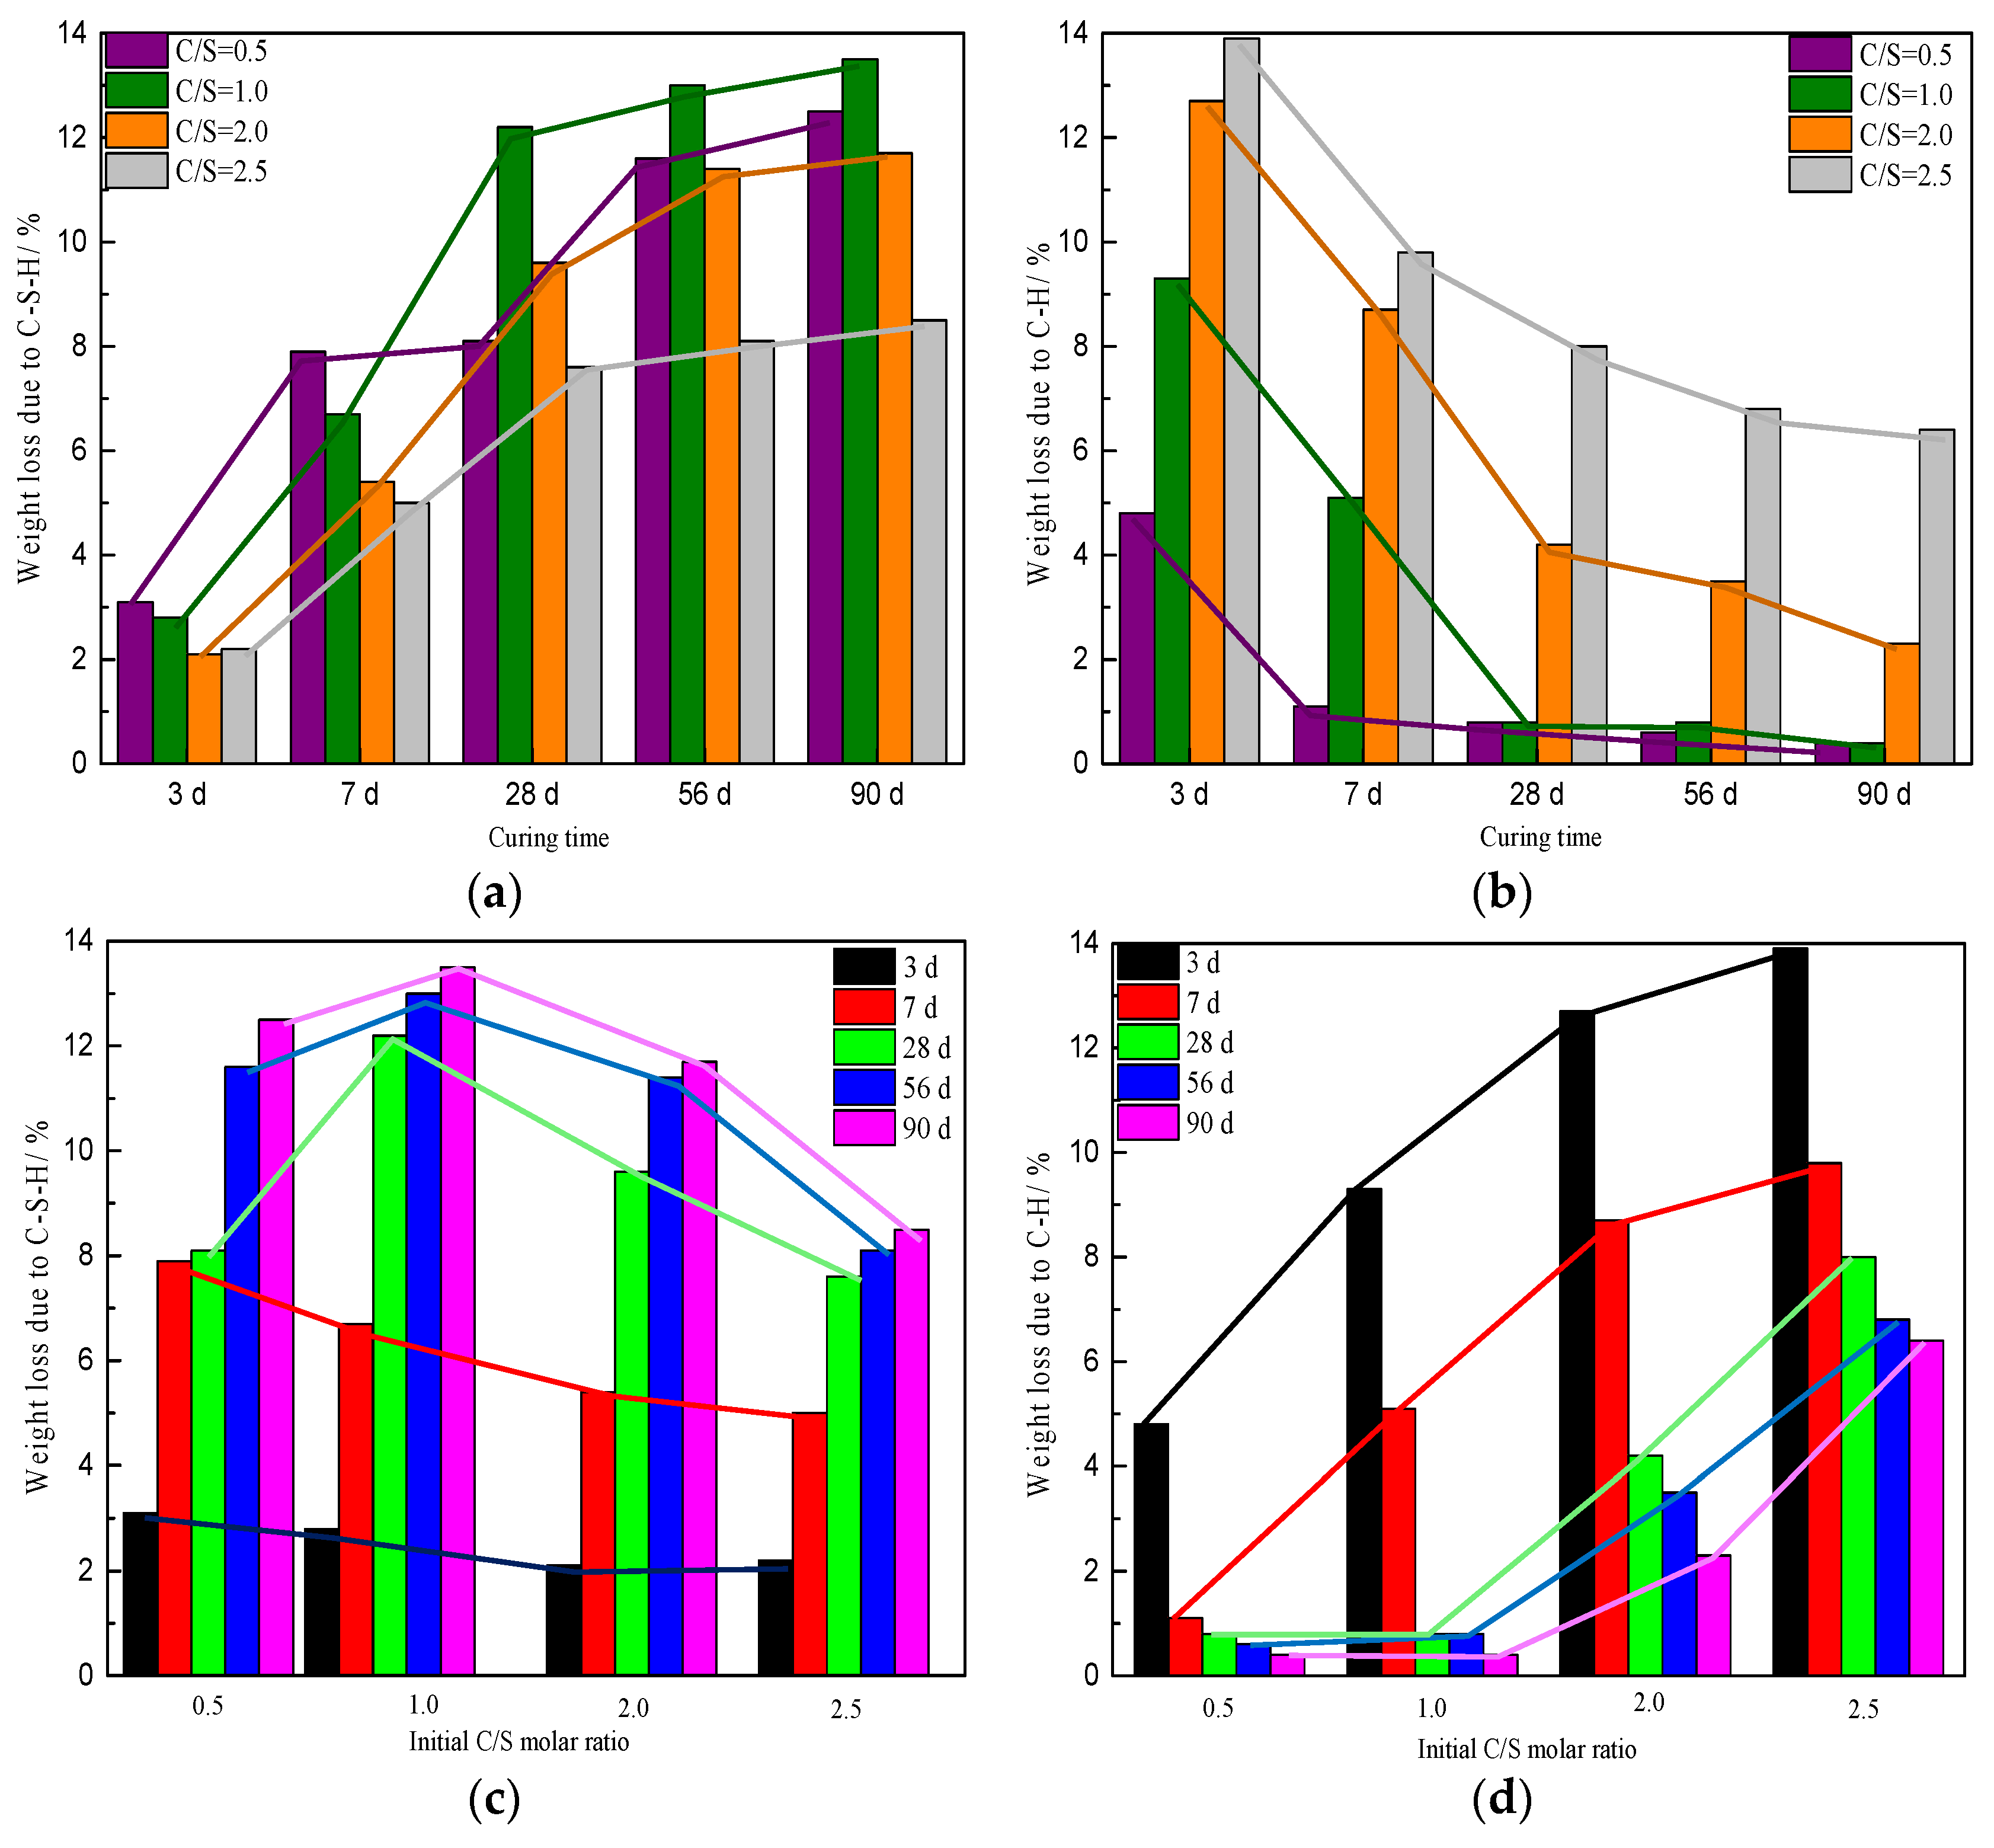
3.1. Thermogravimetric Analysis
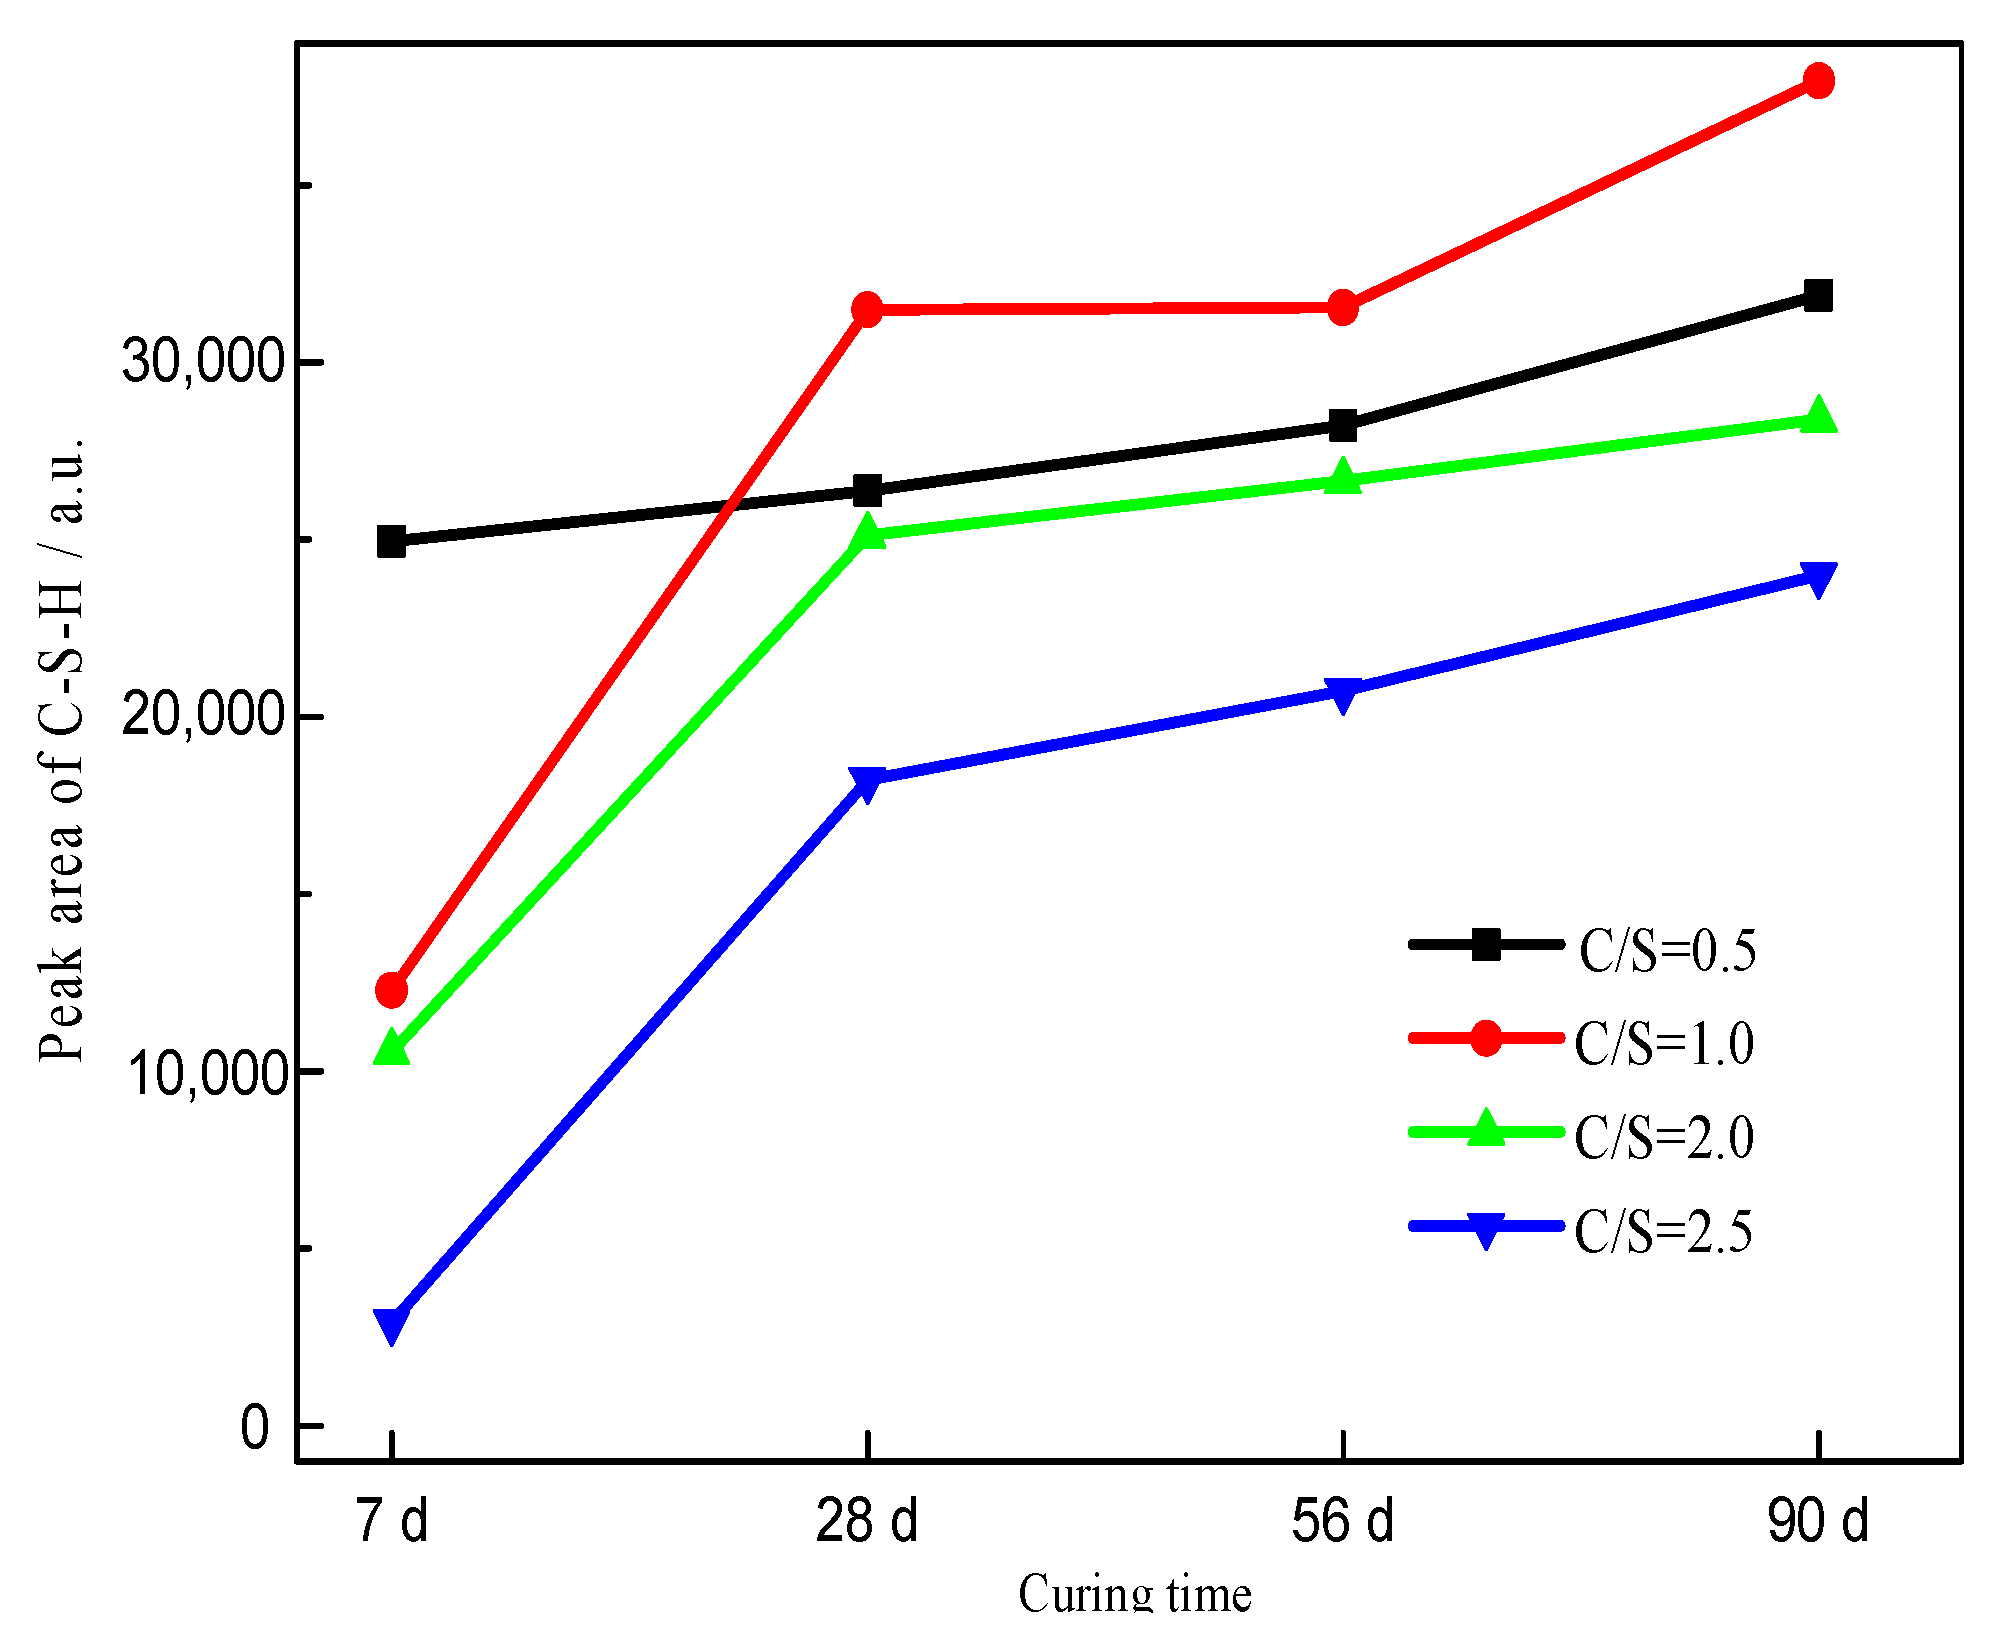
3.2. Formation of C-S-H
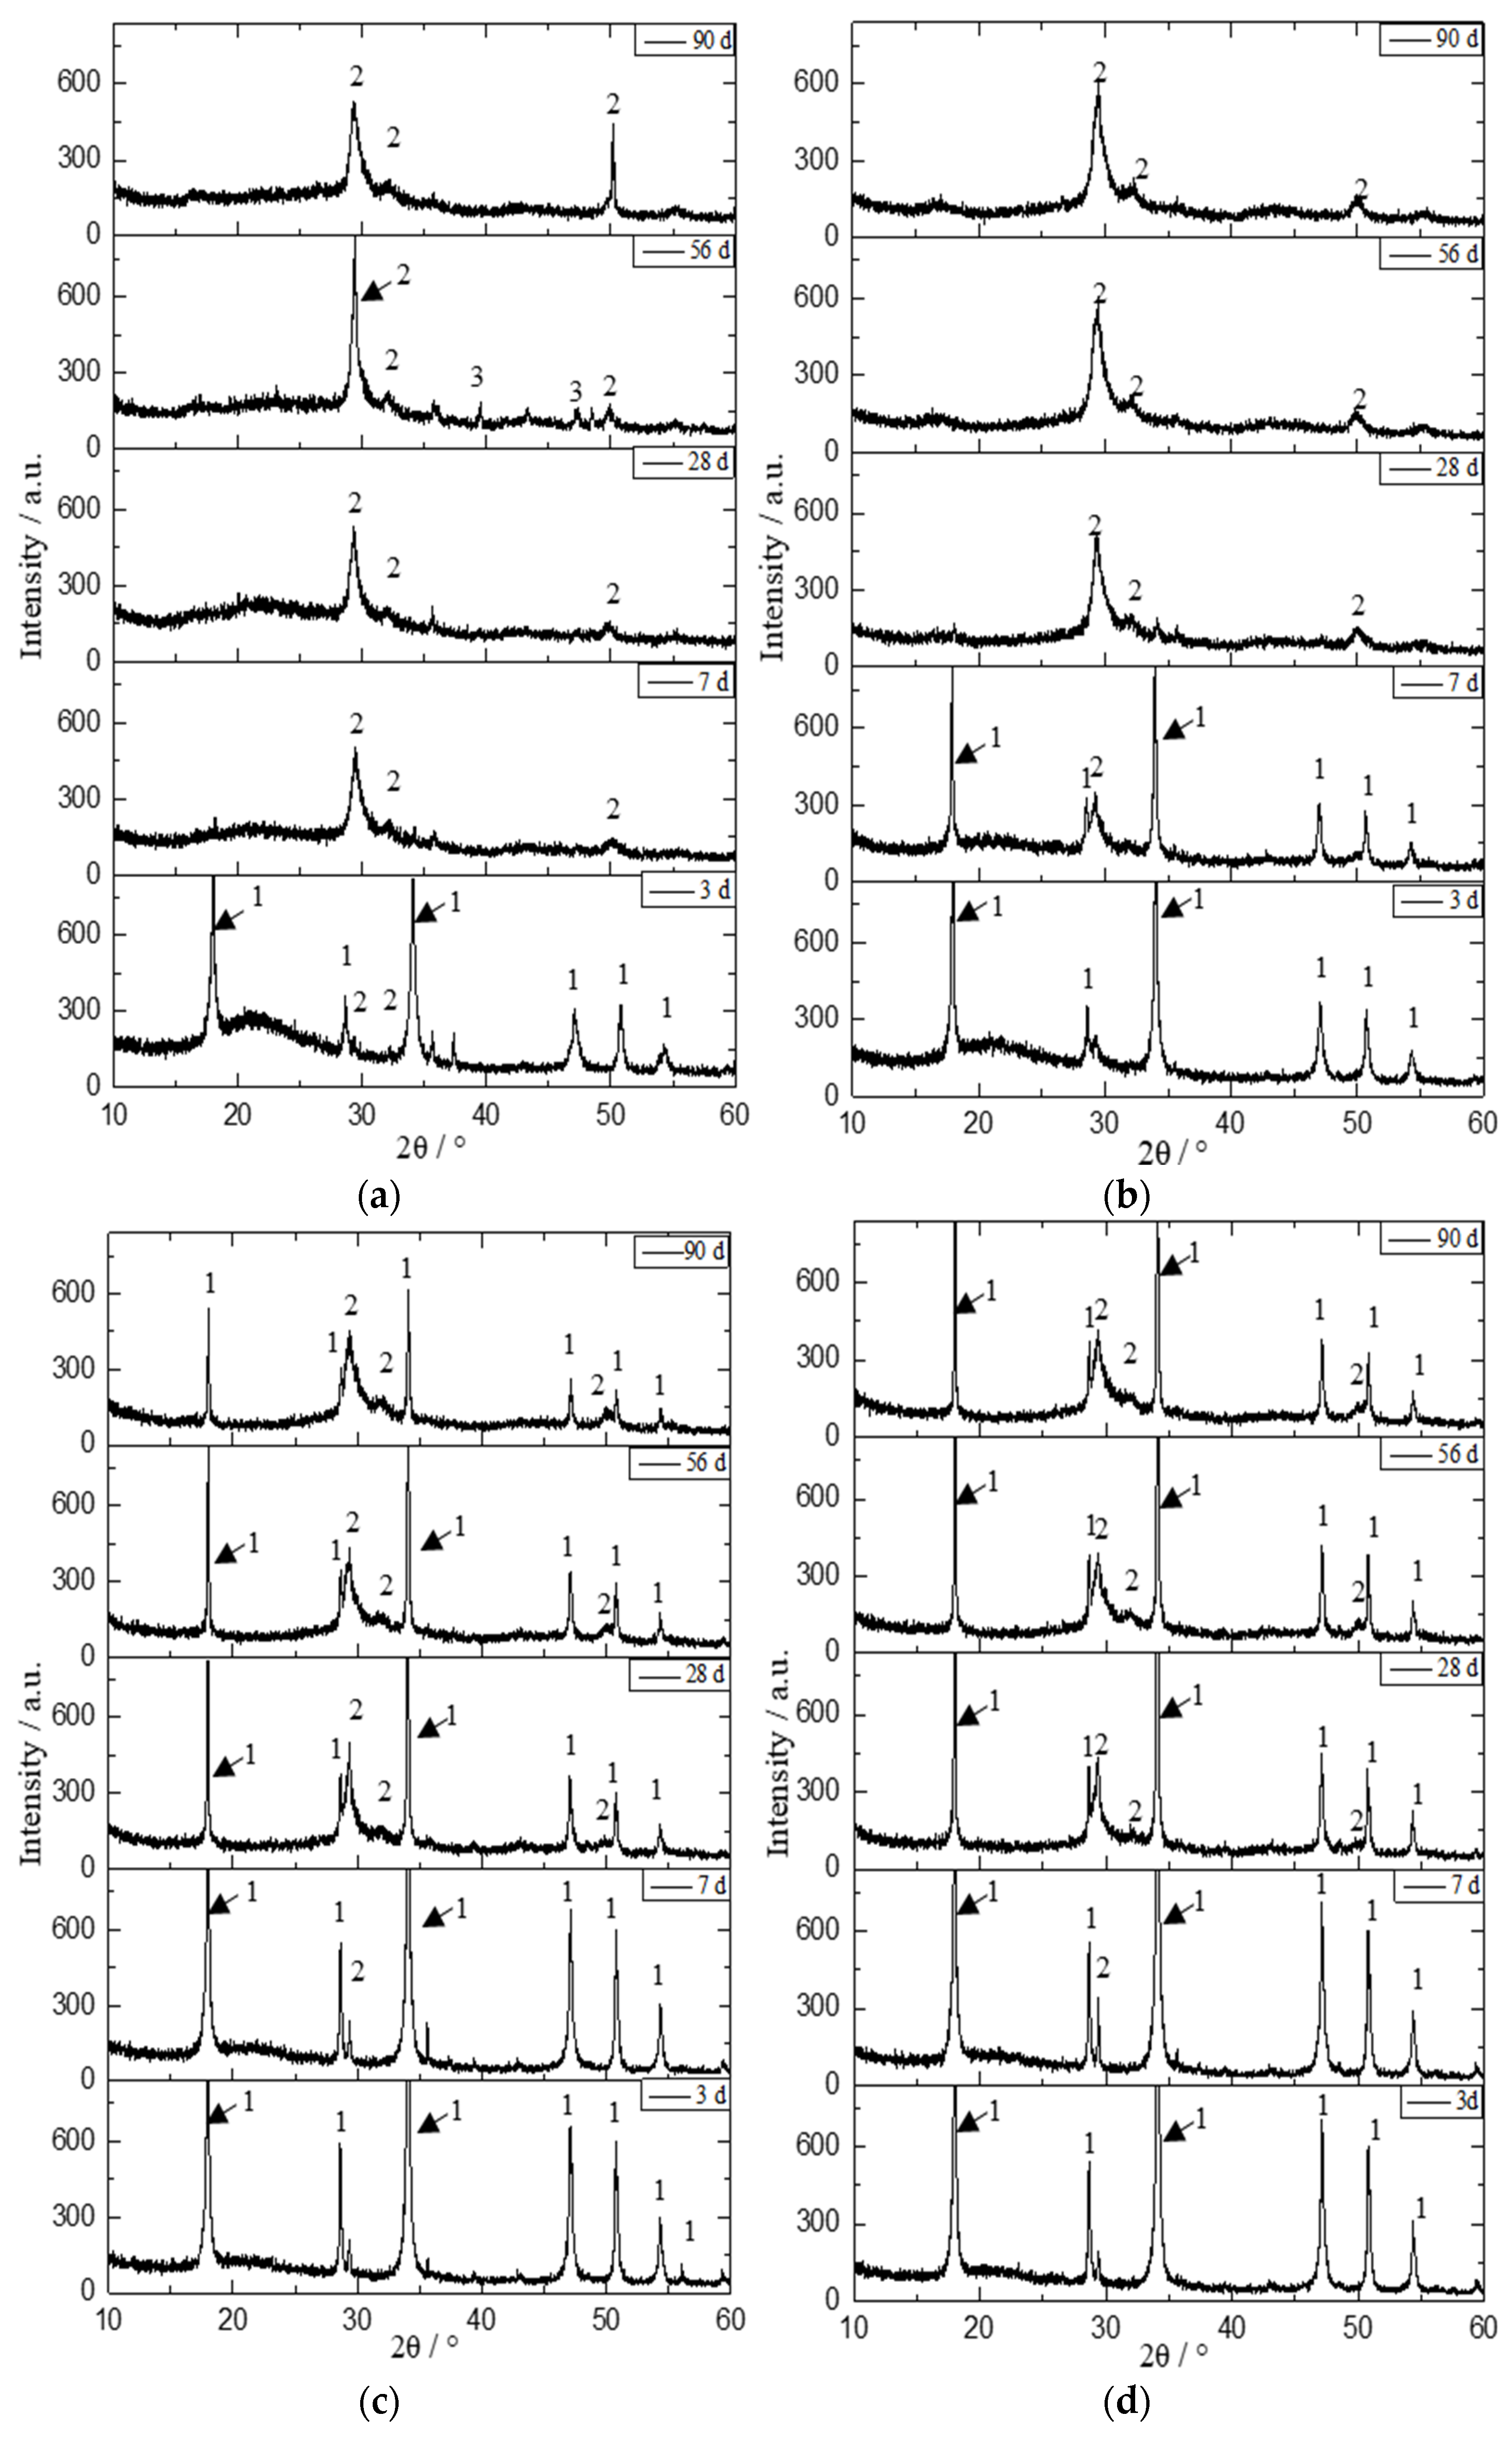
3.3. XRD Analysis
3.4. 29Si MAS-NMR Analysis
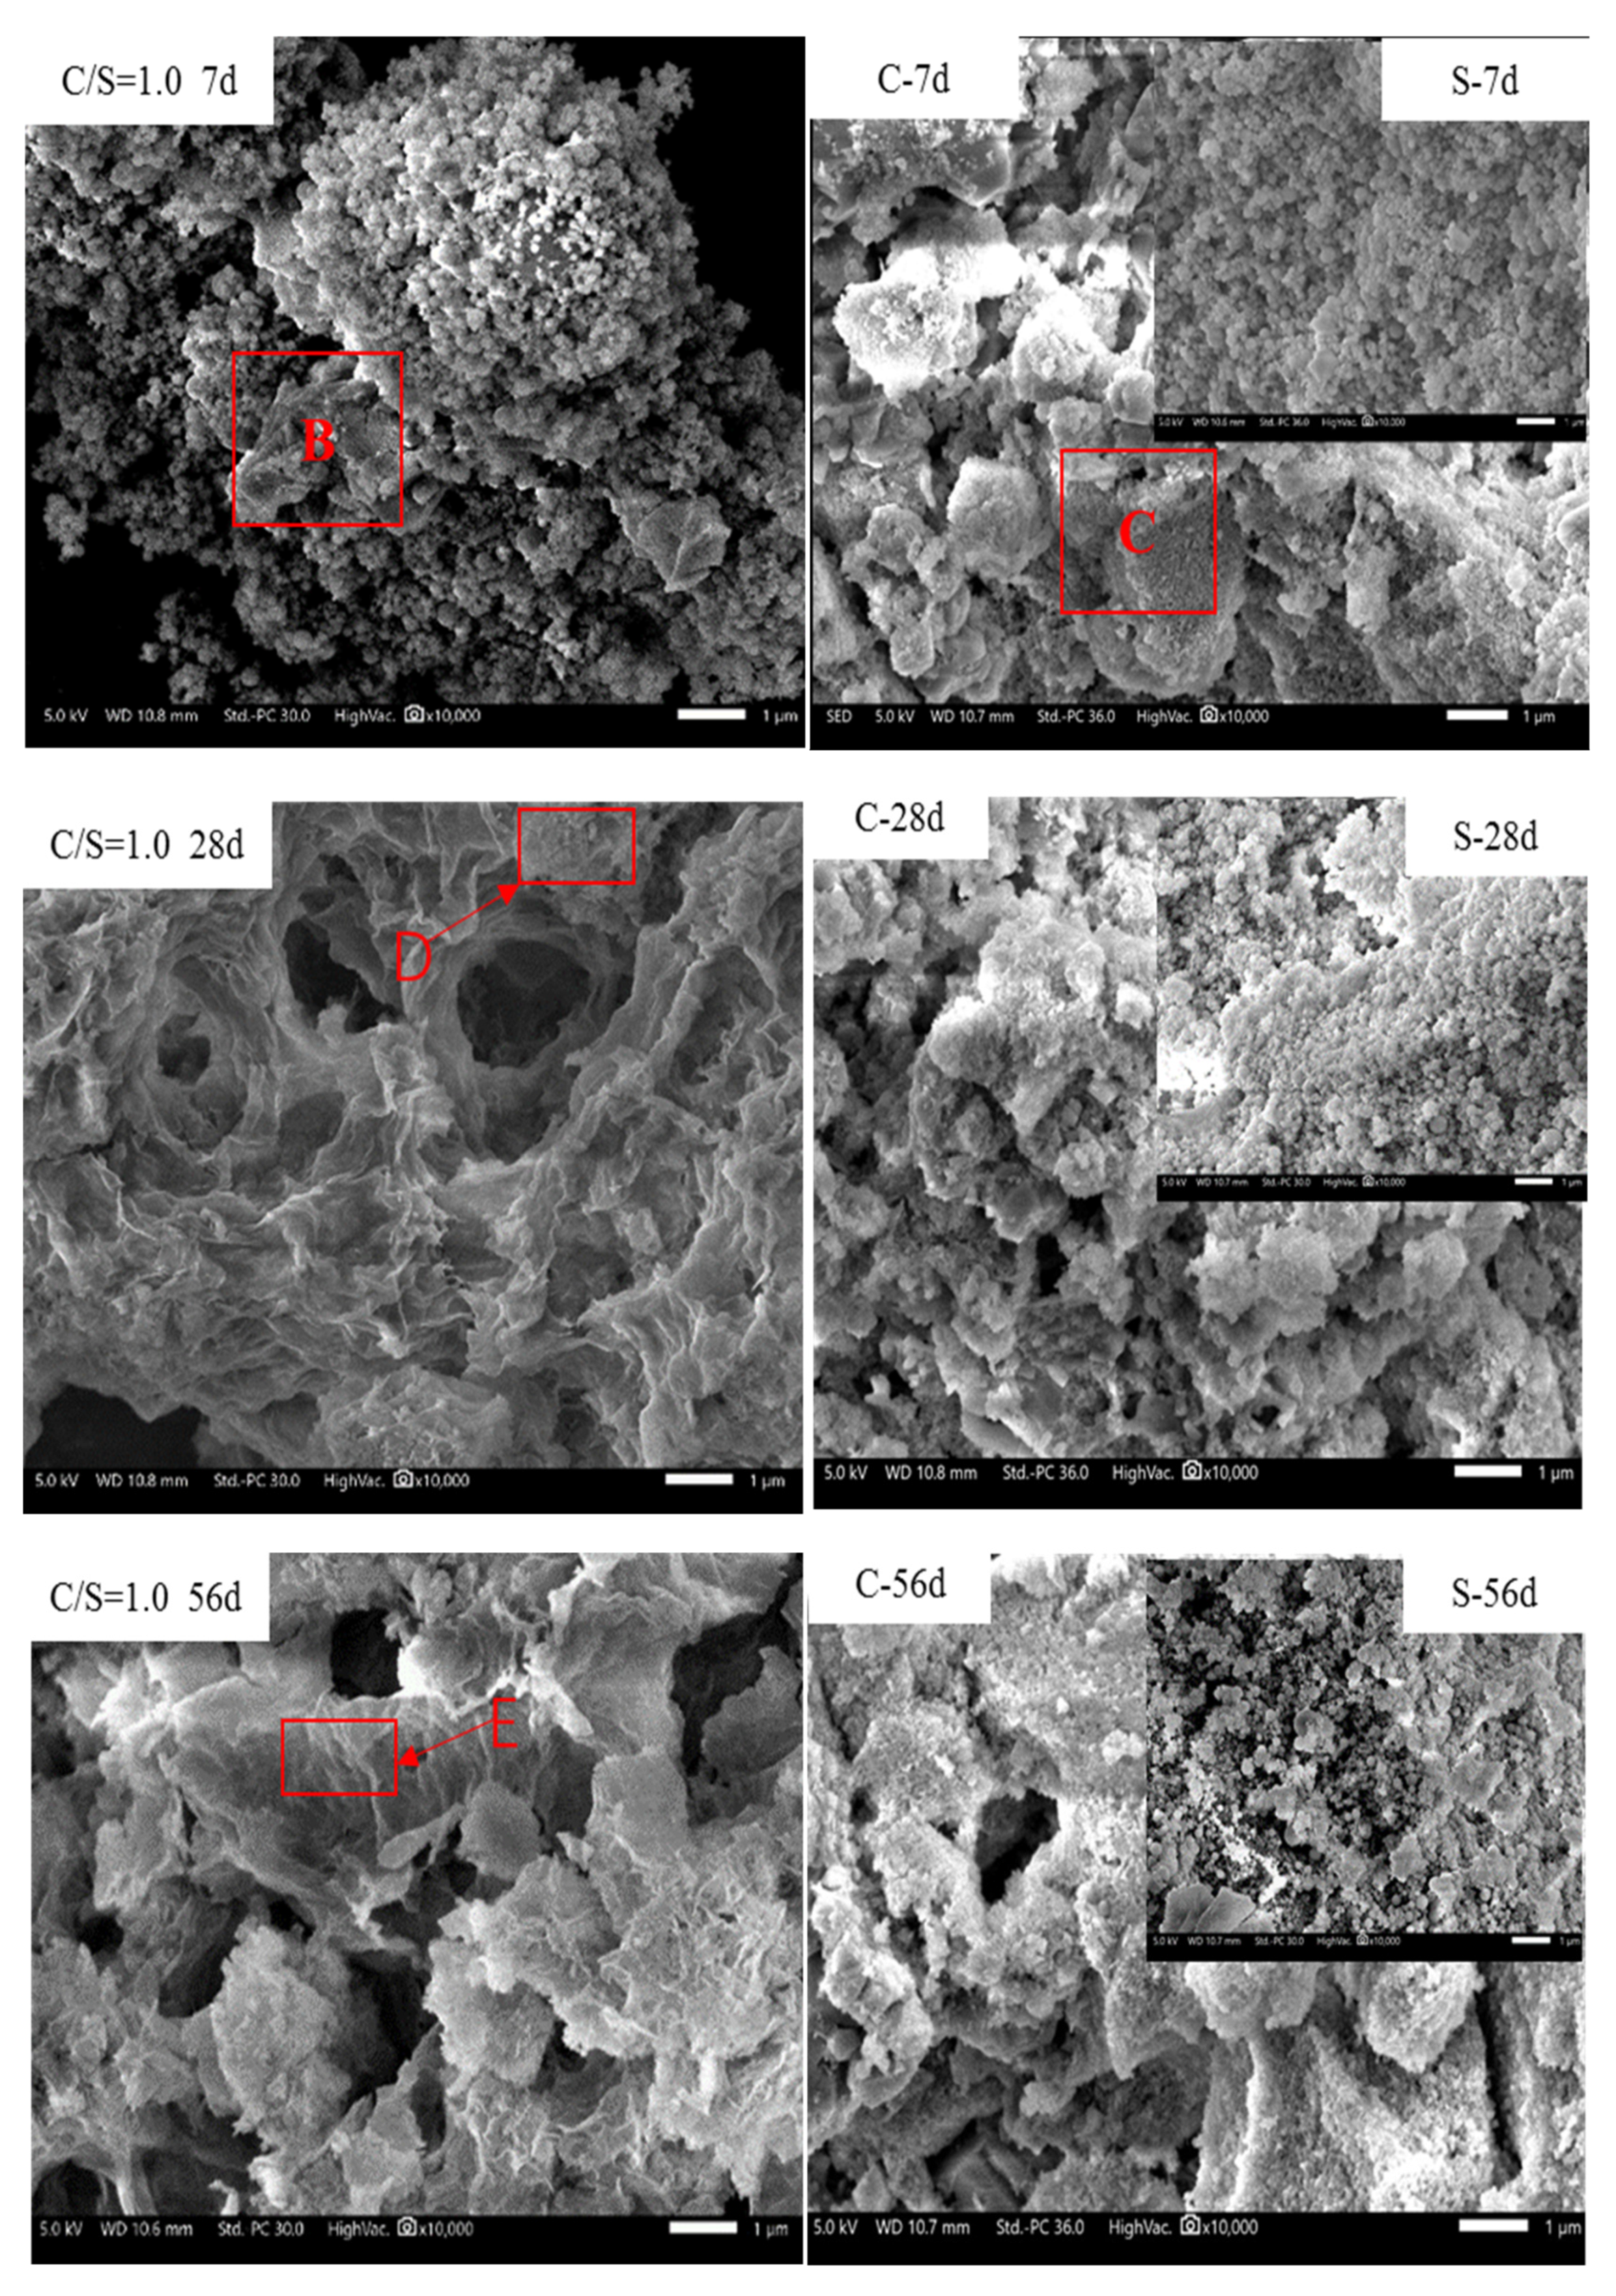
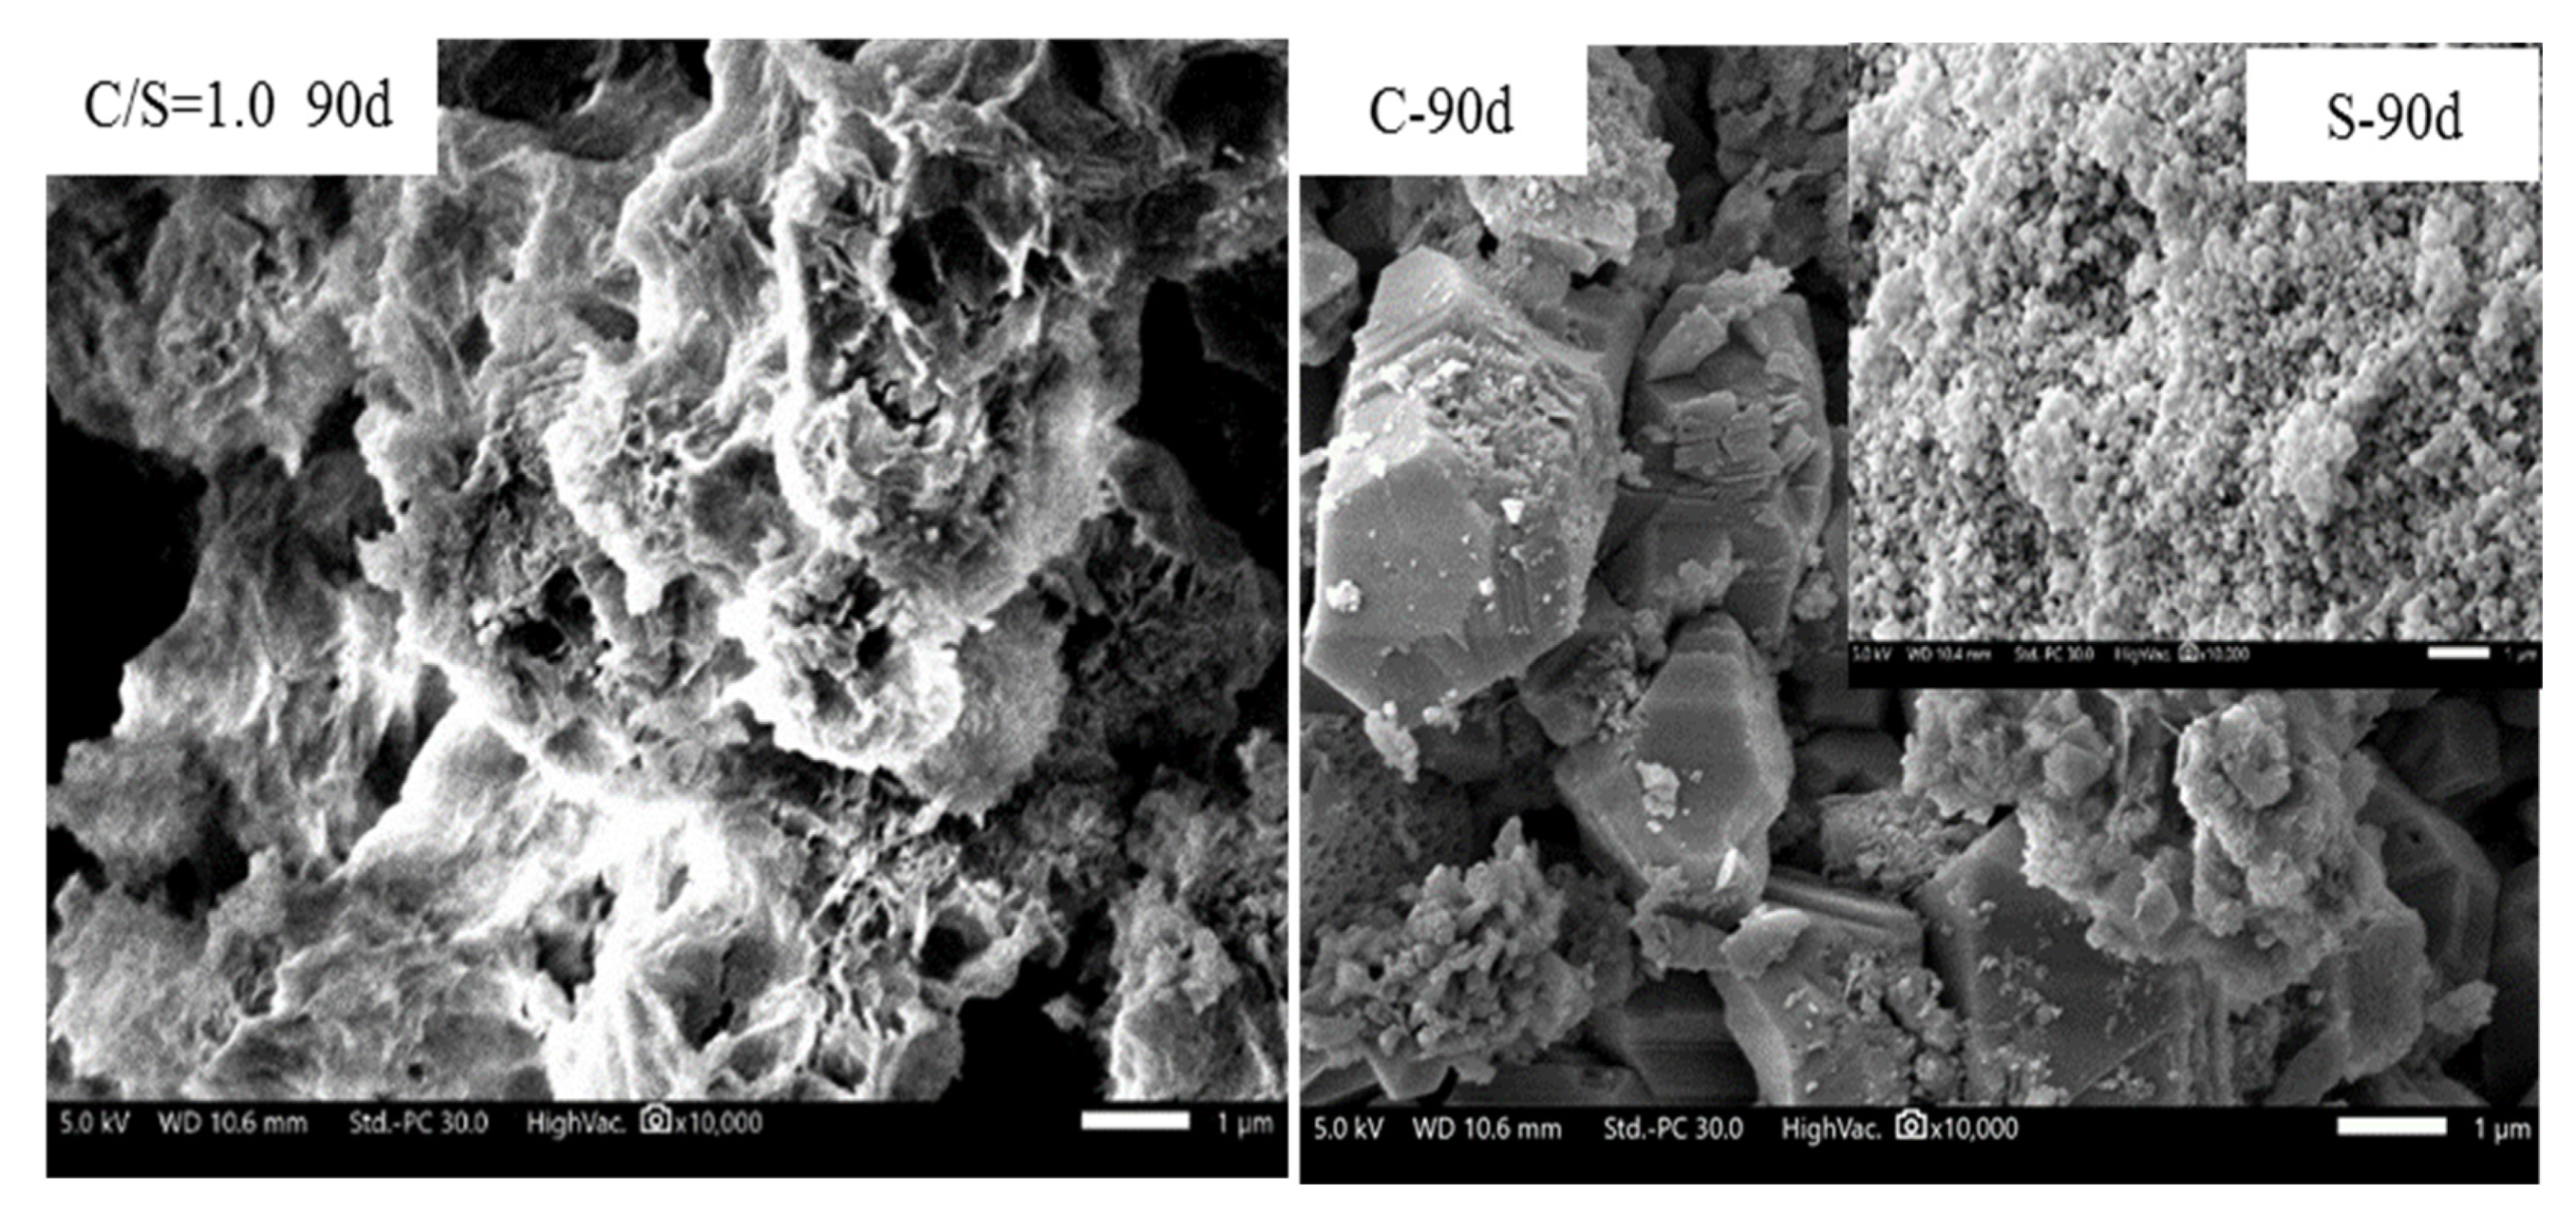
3.5. Analysis of the Formation Mechanism of C-S-H
4. Conclusions
Author Contributions
Funding
Institutional Review Board Statement
Informed Consent Statement
Data Availability Statement
Acknowledgments
Conflicts of Interest
References
- L’Hôpital, E.; Lothenbach, B.; Kulik, D.; Scrivener, K. Influence of calcium to silica ratio on aluminium uptake in calcium silicate hydrate. Cem. Concr. Res. 2016, 85, 111–121. [Google Scholar] [CrossRef]
- He, Y.; Lu, L.; Struble, L.J.; Rapp, J.L.; Mondal, P.; Hu, S. Effect of calcium–silicon ratio on microstructure and nanostructure of calcium silicate hydrate synthesized by reaction of fumed silica and calcium oxide at room temperature. Mater. Struct. 2013, 47, 311–322. [Google Scholar] [CrossRef]
- Maddalena, R.; Hall, C.; Hamilton, A. Effect of silica particle size on the formation of calcium silicate hydrate [C-S-H] using thermal analysis. Thermochim. Acta 2019, 672, 142–149. [Google Scholar] [CrossRef]
- Duan, S.; Liao, H.; Ma, Z.; Cheng, F.; Fang, L.; Gao, H.; Yang, H. The relevance of ultrafine fly ash properties and mechanical properties in its fly ash-cement gelation blocks via static pressure forming. Constr. Build. Mater. 2018, 186, 1064–1071. [Google Scholar] [CrossRef]
- Wang, Z.; Wang, Y.; Cui, L.; Bi, C.; Wu, A. Insight into the isothermal multiphysics processes in cemented paste backfill: Effect of curing time and cement-to-tailings ratio. Constr. Build. Mater. 2022, 325, 126739. [Google Scholar] [CrossRef]
- Zhou, F.; Meng, H.; Pan, G.; Mi, R. Influence of CSH grown in situ on steel slag powder on the performance of fresh and hardened cement pastes. Constr. Build. Mater. 2022, 344, 128269. [Google Scholar] [CrossRef]
- Golewski, G.L.; Szostak, B. Strengthening the very early-age structure of cementitious composites with coal fly ash via incorporating a novel nanoadmixture based on C-S-H phase activators. Constr. Build. Mater. 2021, 312, 125426. [Google Scholar] [CrossRef]
- Lu, B.; Huo, Z.; Xu, Q.; Hou, G.; Wang, X.; Liu, J.; Hu, X. Characteristics of CSH under carbonation and its effects on the hydration and microstructure of cement paste. Constr. Build. Mater. 2023, 364, 129952. [Google Scholar] [CrossRef]
- Rossen, J.E.; Lothenbach, B.; Scrivener, K.L. Composition of C–S–H in pastes with increasing levels of silica fume addition. Cem. Concr. Res. 2015, 75, 14–22. [Google Scholar] [CrossRef] [Green Version]
- Taylor, H. Cement Chemistry; Academic Press: London, UK, 1990; pp. 2–5. [Google Scholar]
- García-Lodeiro, I.; Fernández-Jiménez, A.; Blanco, M.T.; Palomo, A. FTIR study of the sol–gel synthesis of cementitious gels: C–S–H and N–A–S–H. J. Sol Gel Sci. Technol. 2008, 45, 63–72. [Google Scholar] [CrossRef]
- Suzuki, S.; Sinn, E. Observation of calcium silicate hydrate by the precipitation method. J. Mater. Sci. Lett. 1994, 13, 1058–1060. [Google Scholar] [CrossRef]
- Hartmann, A.; Schulenberg, D.; Buhl, J.-C. Synthesis and Structural Characterization of CSH-Phases in the Range of C/S = 0.41–1.66 at Temperatures of the Tobermorite Xonotlite Crossover. J. Mater. Sci. Chem. Eng. 2015, 11, 39–55. [Google Scholar] [CrossRef] [Green Version]
- Richardson, I. Tobermorite/jennite- and tobermorite/calcium hydroxide-based models for the structure of C-S-H: Applicability to hardened pastes of tricalcium silicate, β-dicalcium silicate, Portland cement, and blends of Portland cement with blast-furnace slag, metakaolin, or silica fume. Cem. Concr. Res. 2004, 34, 1733–1777. [Google Scholar] [CrossRef]
- Hou, D.; Zhao, T.; Ma, H.; Li, Z. Reactive Molecular Simulation on Water Confined in the Nanopores of the Calcium Silicate Hydrate Gel: Structure, Reactivity, and Mechanical Properties. J. Phys. Chem. C 2015, 119, 1346–1358. [Google Scholar] [CrossRef]
- Izadifar, M.; Königer, F.; Gerdes, A.; Wöll, C.; Thissen, P. Correlation between Composition and Mechanical Properties of Calcium Silicate Hydrates Identified by Infrared Spectroscopy and Density Functional Theory. J. Phys. Chem. C 2019, 123, 10868–10873. [Google Scholar] [CrossRef]
- Izadifar, M.; Natzeck, C.; Emmerich, K.; Weidler, P.G.; Gohari, S.; Burvill, C.; Thissen, P. Unexpected Chemical Activity of a Mineral Surface: The Role of Crystal Water in Tobermorite. J. Phys. Chem. C 2022, 126, 12405–12412. [Google Scholar] [CrossRef]
- Abdolhosseini Qomi, M.J.; Krakowiak, K.J.; Bauchy, M.; Stewart, K.L.; Shahsavari, R.; Jagannathan, D.; Brommer, D.B.; Baronnet, A.; Buehler, M.J.; Yip, S.; et al. Combinatorial molecular optimization of cement hydrates. Nat. Commun. 2014, 5, 4960. [Google Scholar] [CrossRef] [Green Version]
- Vassilev, S.V.; Vassileva, C.G. Geochemistry of coals, coal ashes and combustion wastes from coal-fired power stations. Fuel Process. Technol. 1997, 51, 19–45. [Google Scholar] [CrossRef]
- Vassilev, S.V.; Vassileva, C.G. Methods for Characterization of Composition of Fly Ashes from Coal-Fired Power Stations: A Critical Overview. Energy Fuels 2005, 19, 1084–1098. [Google Scholar] [CrossRef]
- Ma, W.; Brown, P.W. Hydrothermal reactions of fly ash with Ca(OH)2 and CaSO4·2H2O. Cem. Concr. Res. 1997, 27, 1237–1248. [Google Scholar] [CrossRef]
- John, E.; Matschei, T.; Stephan, D. Nucleation seeding with calcium silicate hydrate—A review. Cem. Concr. Res. 2018, 113, 74–85. [Google Scholar] [CrossRef]
- Shafiq, N.; Nuruddin, M.F.; Kamaruddin, I. Comparison of engineering and durability properties of fly ash blended cement concrete made in UK and Malaysia. Adv. Appl. Ceram. 2007, 106, 314–318. [Google Scholar] [CrossRef]
- Vassilev, S.V.; Menendez, R.; Alvarez, D.; Diaz-Somoano, M.; Martinez-Tarazona, M. Phase-mineral and chemical composition of coal fly ashes as a basis for their multicomponent utilization. 1. Characterization of feed coals and fly ashes☆. Fuel 2003, 82, 1793–1811. [Google Scholar] [CrossRef]
- Lin, R.-B.; Shih, S.-M.; Liu, C.-F. Characteristics and reactivities of Ca(OH)2/silica fume sorbents for low-temperature flue gas desulfurization. Chem. Eng. Sci. 2003, 58, 3659–3668. [Google Scholar] [CrossRef]
- Scrivener, K.; Snellings, R.; Lothenbach, B. A Practical Guide to Microstructural Analysis of Cementitious Materials; CRC Press: Boca Raton, FL, USA, 2016. [Google Scholar]
- Ivan, K.; Benoît, P.; Joseph, V.; André, N. C-S-H Structure Evolution with Calcium Content by Multinuclear NMR. Nuclear Magnetic Resonance Spectroscopy of Cemen-Based Materials; Springer: Berlin, Germany, 1998; pp. 119–141. [Google Scholar]
- Bullard, J.W.; Jennings, H.M.; Livingston, R.A.; Nonat, A.; Scherer, G.W.; Schweitzer, J.S.; Scrivener, K.L.; Thomas, J.J. Mechanisms of cement hydration. Cem. Concr. Res. 2011, 41, 1208–1223. [Google Scholar] [CrossRef]
- Lothenbach, B.; Nied, D.; L’Hôpital, E.; Achiedo, G.; Dauzères, A. Magnesium and calcium silicate hydrates. Cem. Concr. Res. 2015, 77, 60–68. [Google Scholar] [CrossRef]
- Tajuelo Rodriguez, E.; Garbev, K.; Merz, D.; Black, L.; Richardson, I.G. Thermal stability of C-S-H phases and applicability of Richardson and Groves’ and Richardson C-(A)-S-H(I) models to synthetic C-S-H. Cem. Concr. Res. 2017, 93, 45–56. [Google Scholar] [CrossRef]
- Garbev, K.; Bornefeld, M.; Beuchle, G.; Stemmermann, P. Cell Dimensions and Composition of Nanocrystalline Calcium Silicate Hydrate Solid Solutions. Part 2: X-Ray and Thermogravimetry Study. J. Am. Ceram. Soc. 2008, 91, 3015–3023. [Google Scholar] [CrossRef]
- Monteagudo, S.; Moragues, A.; Gálvez, J.; Casati, M.; Reyes, E. The degree of hydration assessment of blended cement pastes by differential thermal and thermogravimetric analysis. Morphological evolution of the solid phases. Thermochim. Acta 2014, 592, 37–51. [Google Scholar] [CrossRef]
- Myers, R.J.; L’Hôpital, E.; Provis, J.L.; Lothenbach, B. Effect of temperature and aluminium on calcium (alumino)silicate hydrate chemistry under equilibrium conditions. Cem. Concr. Res. 2015, 68, 83–93. [Google Scholar] [CrossRef]
- Alexander, G.B.; Heston, W.M.; Iler, R.K. The Solubility of Amorphous Silica in Water. J. Phys. Chem. 1954, 58, 453–455. [Google Scholar] [CrossRef]
- Greenberg, S.A. Reaction between silica and calcium hydroxide solutions. I. kinetics in the temperature range 30 to 85°. J. Phys. Chem. 1961, 65, 12–16. [Google Scholar] [CrossRef]
- Tsunematsu, S.; Inoue, K.; Kimura, K.; Yamada, H. Improvement of acid resistance of calcium silicate hydrate by thermal treatment. Cem. Concr. Res. 2004, 34, 717–720. [Google Scholar] [CrossRef]
- Tsunematsu, S.; Inoue, K.; Yamada, H. Characteristics of carbonated tobermorites and its immobilization property to Cd2+ iron. Inorg. Mater. 1996, 3, 195–202. [Google Scholar]
- Lothenbach, B.; Nonat, A. Calcium silicate hydrates: Solid and liquid phase composition. Cem. Concr. Res. 2015, 78, 57–70. [Google Scholar] [CrossRef]
- Wang, B.; Yao, W.; Stephan, D. Preparation of calcium silicate hydrate seeds by means of mechanochemical method and its effect on the early hydration of cement. Adv. Mech. Eng. 2019, 11, 1–7. [Google Scholar] [CrossRef]
- Ni Tan, Y.; Liu, Y.; Qing, Z.; Birdi, G.; Grover, L.M. Synthesis of Pure Dicalcium Silicate Powder by the Pechini Method and Characterization of Hydrated Cement. Mater. Sci. Forum 2014, 787, 387–394. [Google Scholar] [CrossRef]
- Zhang, Y.; Wang, R.; Liu, Z.; Zhang, Z. A novel carbonate binder from waste hydrated cement paste for utilization of CO2. J. CO2 Util. 2019, 32, 276–280. [Google Scholar] [CrossRef]
- Hou, D.; Zhang, J.; Li, Z.; Zhu, Y. Uniaxial tension study of calcium silicate hydrate (C–S–H): Structure, dynamics and mechanical properties. Mater. Struct. 2014, 48, 3811–3824. [Google Scholar] [CrossRef]
- Trapote-Barreira, A.; Porcar, L.; Cama, J.; Soler, J.M.; Allen, A.J. Structural changes in C–S–H gel during dissolution: Small-angle neutron scattering and Si-NMR characterization. Cem. Concr. Res. 2015, 72, 76–89. [Google Scholar] [CrossRef]
- Trapote-Barreira, A.; Cama, J.; Soler, J.M. Dissolution kinetics of C–S–H gel: Flow-through experiments. Phys. Chem. Earth 2014, 70–71, 17–31. [Google Scholar]
- Sugita, S.; Yu, Q.; Isojima, Y. Hydrothermal and mechanochemical reactions of rice husk ash with calcium hydroxide. Inorg. Mater. 1998, 5, 208–214. [Google Scholar]
- Miller, S.A. Use of Diatomaceous Earth as a Siliceous Material in the Formation of Alkali Activated Fine-Aggregate Limestone Concrete. Master’s Thesis, Drexel University, Philadelphia, PA, USA, 2011. [Google Scholar]
- Stark, J.; Wicht, B. Zement unt Kalk: Der Baustoff als Werkstoff; Birkhäuser Verla: Basel, Switzerland, 2000. [Google Scholar]
- Greenberg, S.A.; Chang, T.N.; Anderson, E. Investigation of colloidal hydrated calcium silicates. I. solubility products. J. Phys. Chem. 1960, 64, 1151–1157. [Google Scholar] [CrossRef]


| Component | SiO2 | Al2O3 | K2O | CaO | Fe2O3 | MgO | Na2O | Loss |
|---|---|---|---|---|---|---|---|---|
| Content | 92.82 | 0.49 | 0. 53 | 0.59 | 0.29 | 0.49 | 0.42 | 4.37 |
| Initial C/S Molar Ratio | Weight Loss Due to C-S-H/% | Weight Loss Due to C−H/% | Weight Loss Due to CaCO3/% | ||||||||||||
|---|---|---|---|---|---|---|---|---|---|---|---|---|---|---|---|
| 3 d | 7 d | 28 d | 56 d | 90 d | 3 d | 7 d | 28 d | 56 d | 90 d | 3 d | 7 d | 28 d | 56 d | 90 d | |
| 0.5 | 3.1 | 7.9 | 8.1 | 11.6 | 12.5 | 4.8 | 1.1 | 0.8 | 0.6 | 0.4 | 1.8 | 1.7 | 1.6 | 1.6 | 1.5 |
| 1.0 | 2.8 | 6.7 | 12.2 | 13.0 | 13.5 | 9.3 | 5.1 | 0.8 | 0.8 | 0.4 | 1.8 | 1.8 | 1.6 | 1.6 | 1.8 |
| 2.0 | 2.1 | 5.4 | 9.6 | 11.4 | 11.7 | 12.7 | 8.7 | 4.2 | 3.5 | 2.3 | 3.1 | 3.3 | 2.8 | 4.1 | 6.0 |
| 2.5 | 2.2 | 5.0 | 7.6 | 8.1 | 8.5 | 13.9 | 9.8 | 8.0 | 6.8 | 6.4 | 3.0 | 3.7 | 3.0 | 3.3 | 3.4 |
| Initial C/S Molar Ratio | Mineral Composition | 2θ/° | Area | Height | ||||||
|---|---|---|---|---|---|---|---|---|---|---|
| 7 d | 28 d | 56 d | 90 d | 7 d | 28 d | 56 d | 90 d | |||
| 0.5 | Ca1.5SiO3.5·xH2O | 29.4 | 20,254 | 19,548 | 25,382 | 20,727 | 278 | 285 | 616 | 276 |
| 32.1 | 1520 | 2963 | 1542 | 3161 | 31 | 48 | 47 | 50 | ||
| 50.1 | 3183 | 3854 | 1297 | 9449 | 35 | 53 | 22 | 338 | ||
| Total | 24,957 | 26,365 | 28,221 | 31,894 | 344 | 386 | 685 | 664 | ||
| 1.0 | Ca1.5SiO3.5·xH2O | 29.4 | 12,283 | 22,292 | 23,702 | 29,711 | 172 | 289 | 212 | 390 |
| 32.1 | — | 3756 | 3009 | 2999 | — | 47 | 154 | 43 | ||
| 50.1 | — | 5435 | 4835 | 5222 | — | 54 | 90 | 58 | ||
| Total | 12,283 | 31,483 | 31,546 | 37,932 | 172 | 390 | 456 | 491 | ||
| 2.0 | Ca1.5SiO3.5·xH2O | 29.4 | 10,559 | 20,048 | 18,915 | 21,723 | 123 | 319 | 233 | 248 |
| 32.1 | — | 2192 | 2847 | 2440 | — | 32 | 40 | 37 | ||
| 50.1 | — | 2880 | 4898 | 4231 | — | 23 | 40 | 46 | ||
| Total | 10,559 | 25,120 | 26,660 | 28,394 | 123 | 374 | 313 | 331 | ||
| 2.5 | Ca1.5SiO3.5·xH2O | 29.4 | 2923 | 15,238 | 17,315 | 17,566 | 219 | 209 | 238 | 228 |
| 32.1 | — | 2964 | 2585 | 2608 | — | 31 | 37 | 36 | ||
| 50.1 | — | 20 | 831 | 3820 | — | 10 | 16 | 83 | ||
| Total | 2923 | 18,222 | 20,731 | 23,994 | 219 | 250 | 291 | 347 | ||
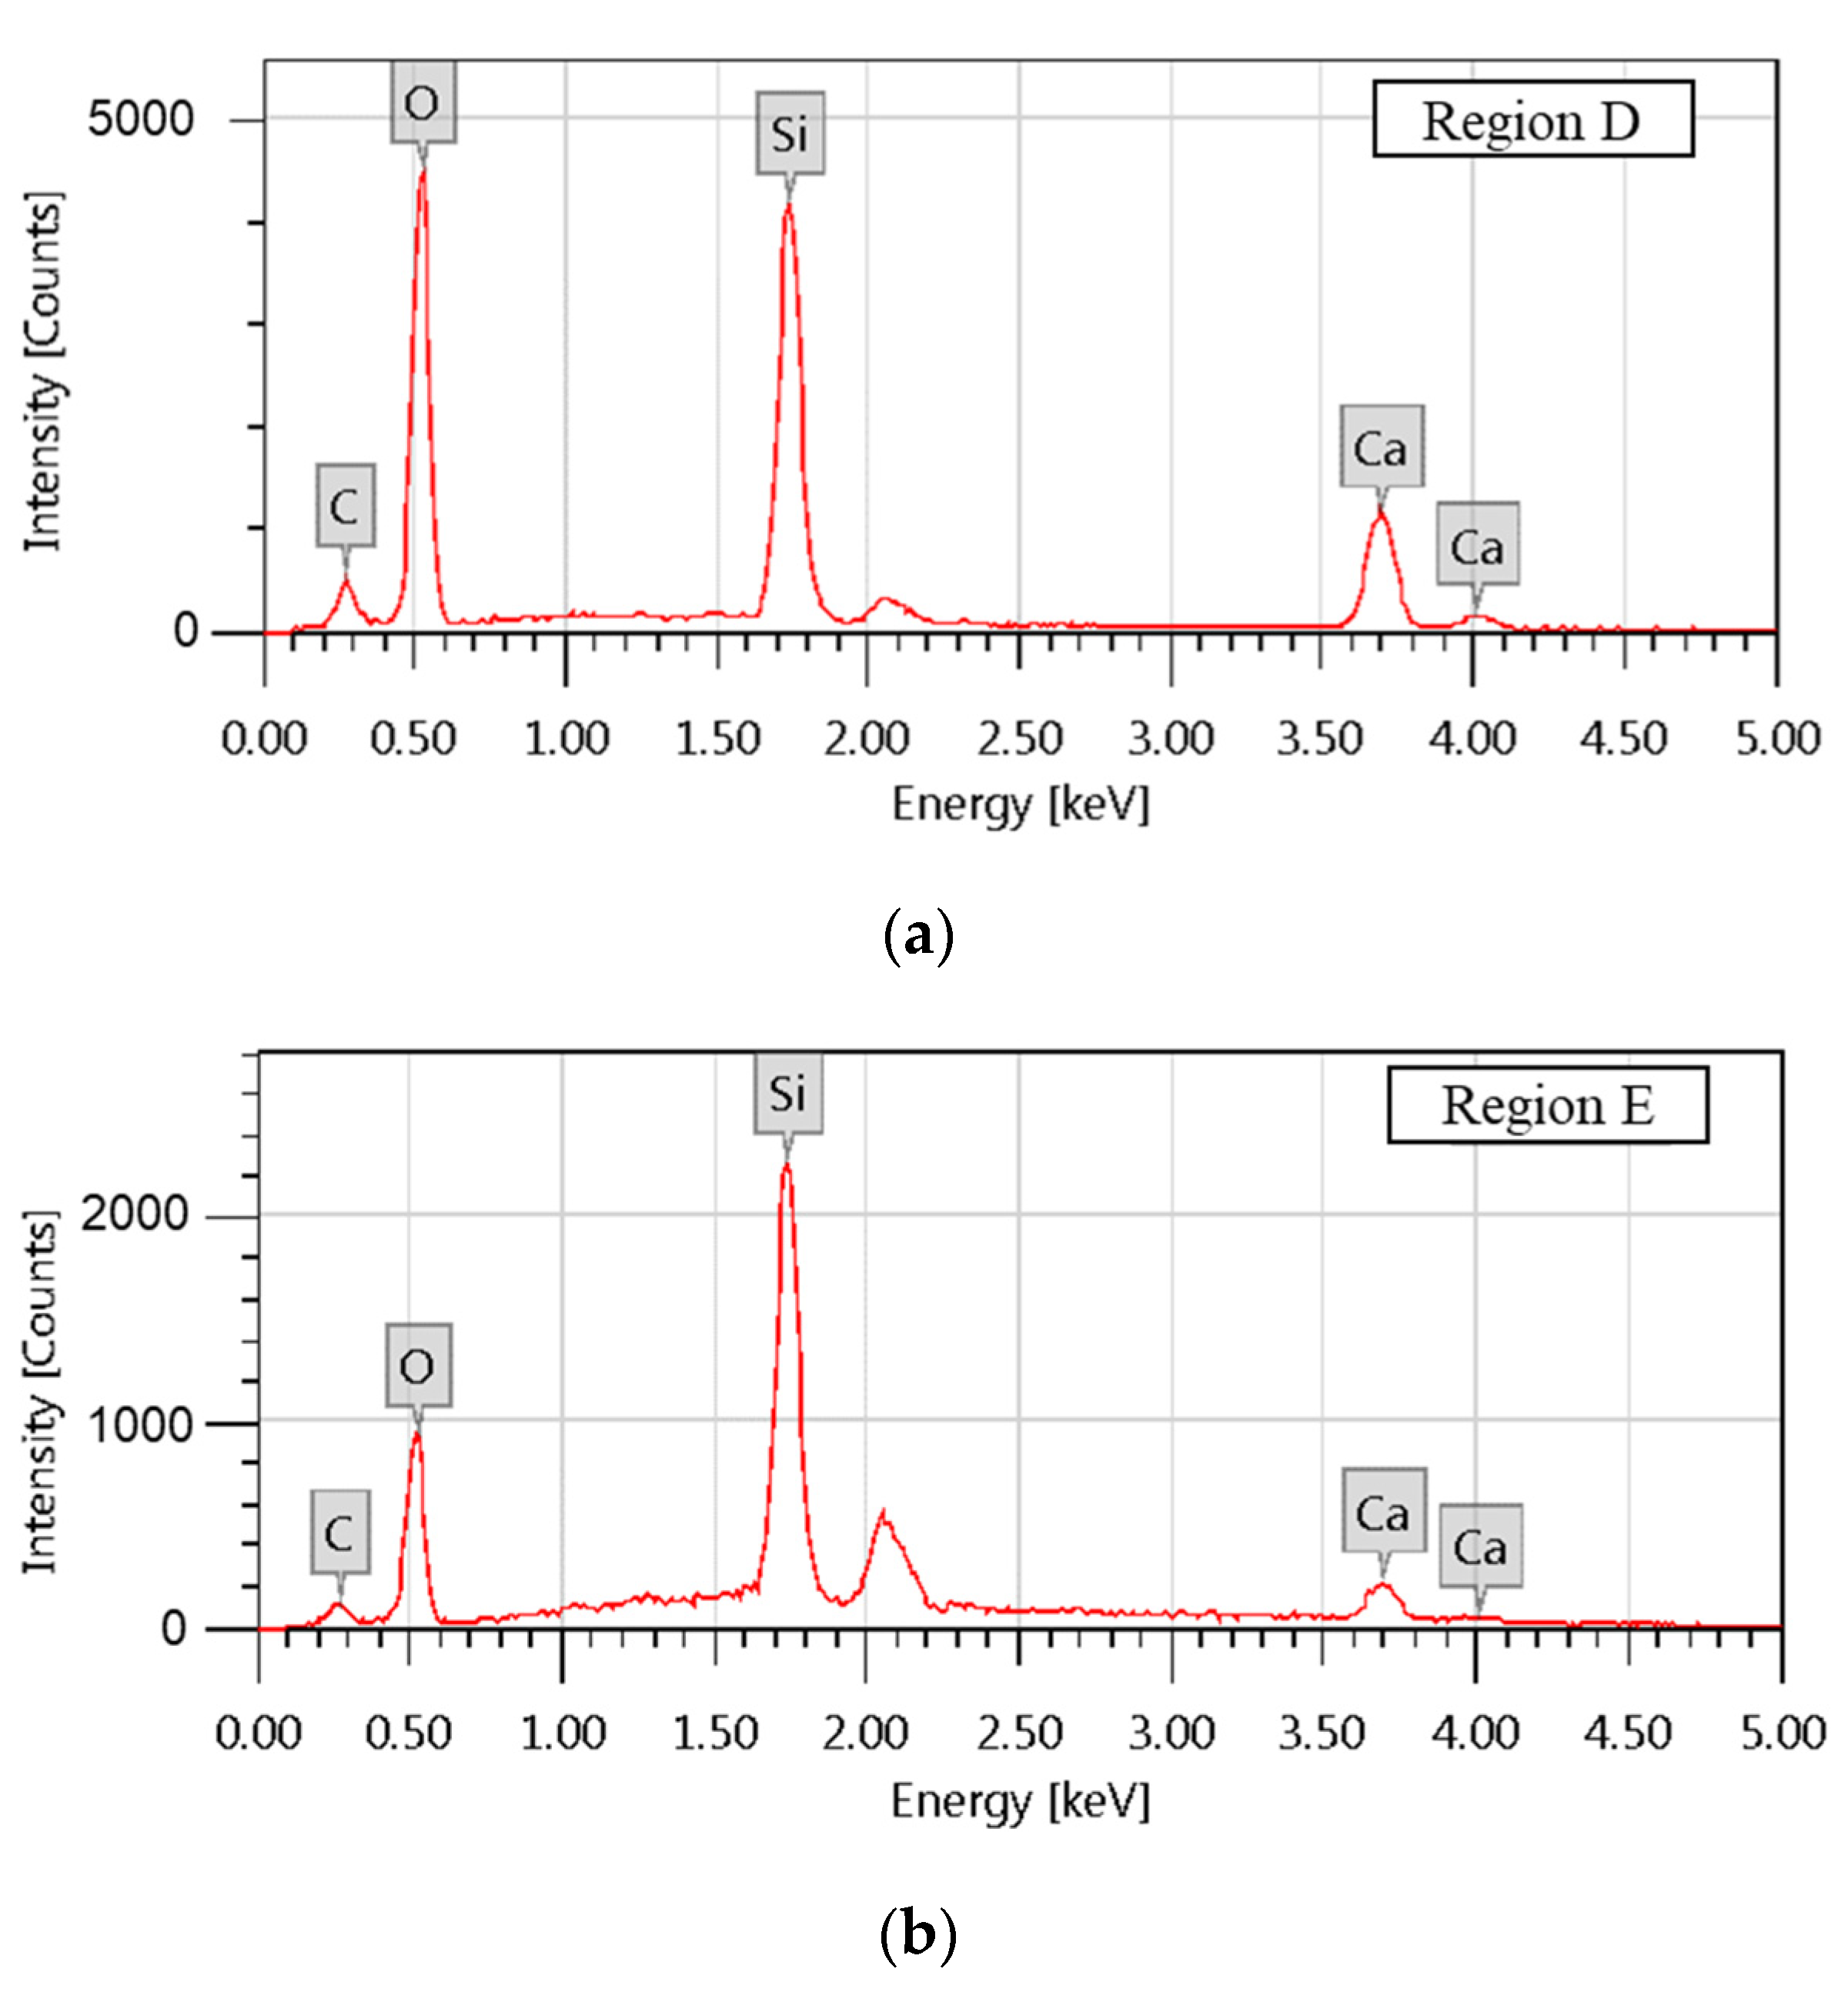
| Region | Atomic Composition /% | |||
|---|---|---|---|---|
| C | O | Si | Ca | |
| D | 8.86 ± 0.08 | 59.80 ± 0.28 | 17.95 ± 0.12 | 13.39 ± 0.13 |
| E | 1.77 ± 0.33 | 18.65 ± 0.20 | 33.45 ± 0.32 | 46.13 ± 1.33 |
Disclaimer/Publisher’s Note: The statements, opinions and data contained in all publications are solely those of the individual author(s) and contributor(s) and not of MDPI and/or the editor(s). MDPI and/or the editor(s) disclaim responsibility for any injury to people or property resulting from any ideas, methods, instructions or products referred to in the content. |
© 2023 by the authors. Licensee MDPI, Basel, Switzerland. This article is an open access article distributed under the terms and conditions of the Creative Commons Attribution (CC BY) license (https://creativecommons.org/licenses/by/4.0/).
Share and Cite
Wu, J.; Liao, H.; Ma, Z.; Song, H.; Cheng, F. Effect of Different Initial CaO/SiO2 Molar Ratios and Curing Times on the Preparation and Formation Mechanism of Calcium Silicate Hydrate. Materials 2023, 16, 717. https://doi.org/10.3390/ma16020717
Wu J, Liao H, Ma Z, Song H, Cheng F. Effect of Different Initial CaO/SiO2 Molar Ratios and Curing Times on the Preparation and Formation Mechanism of Calcium Silicate Hydrate. Materials. 2023; 16(2):717. https://doi.org/10.3390/ma16020717
Chicago/Turabian StyleWu, Jianfang, Hongqiang Liao, Zhuohui Ma, Huiping Song, and Fangqin Cheng. 2023. "Effect of Different Initial CaO/SiO2 Molar Ratios and Curing Times on the Preparation and Formation Mechanism of Calcium Silicate Hydrate" Materials 16, no. 2: 717. https://doi.org/10.3390/ma16020717