
In-Plane Impact Response of Graded Foam Concrete-Filled Auxetic Honeycombs
Abstract
:1. Introduction
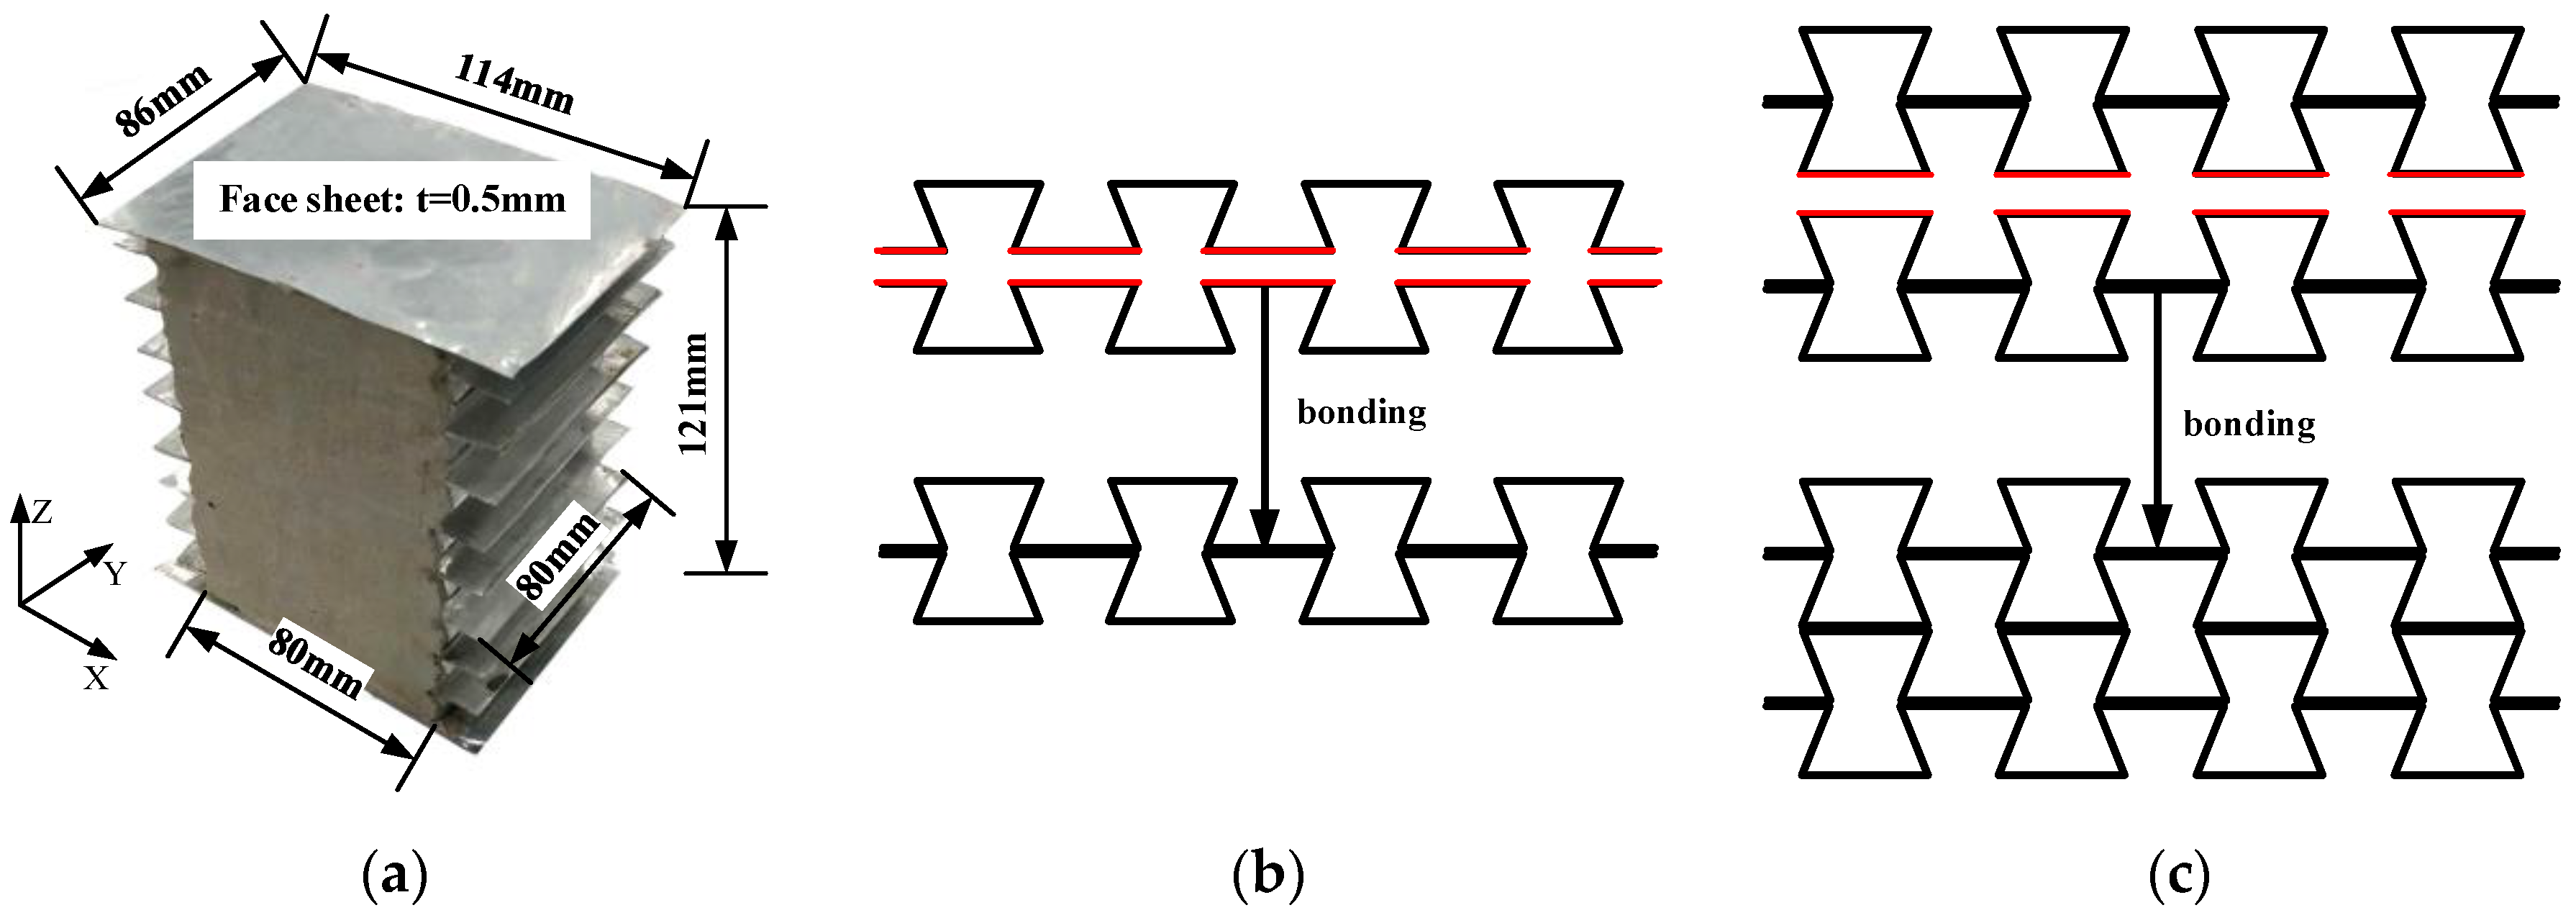
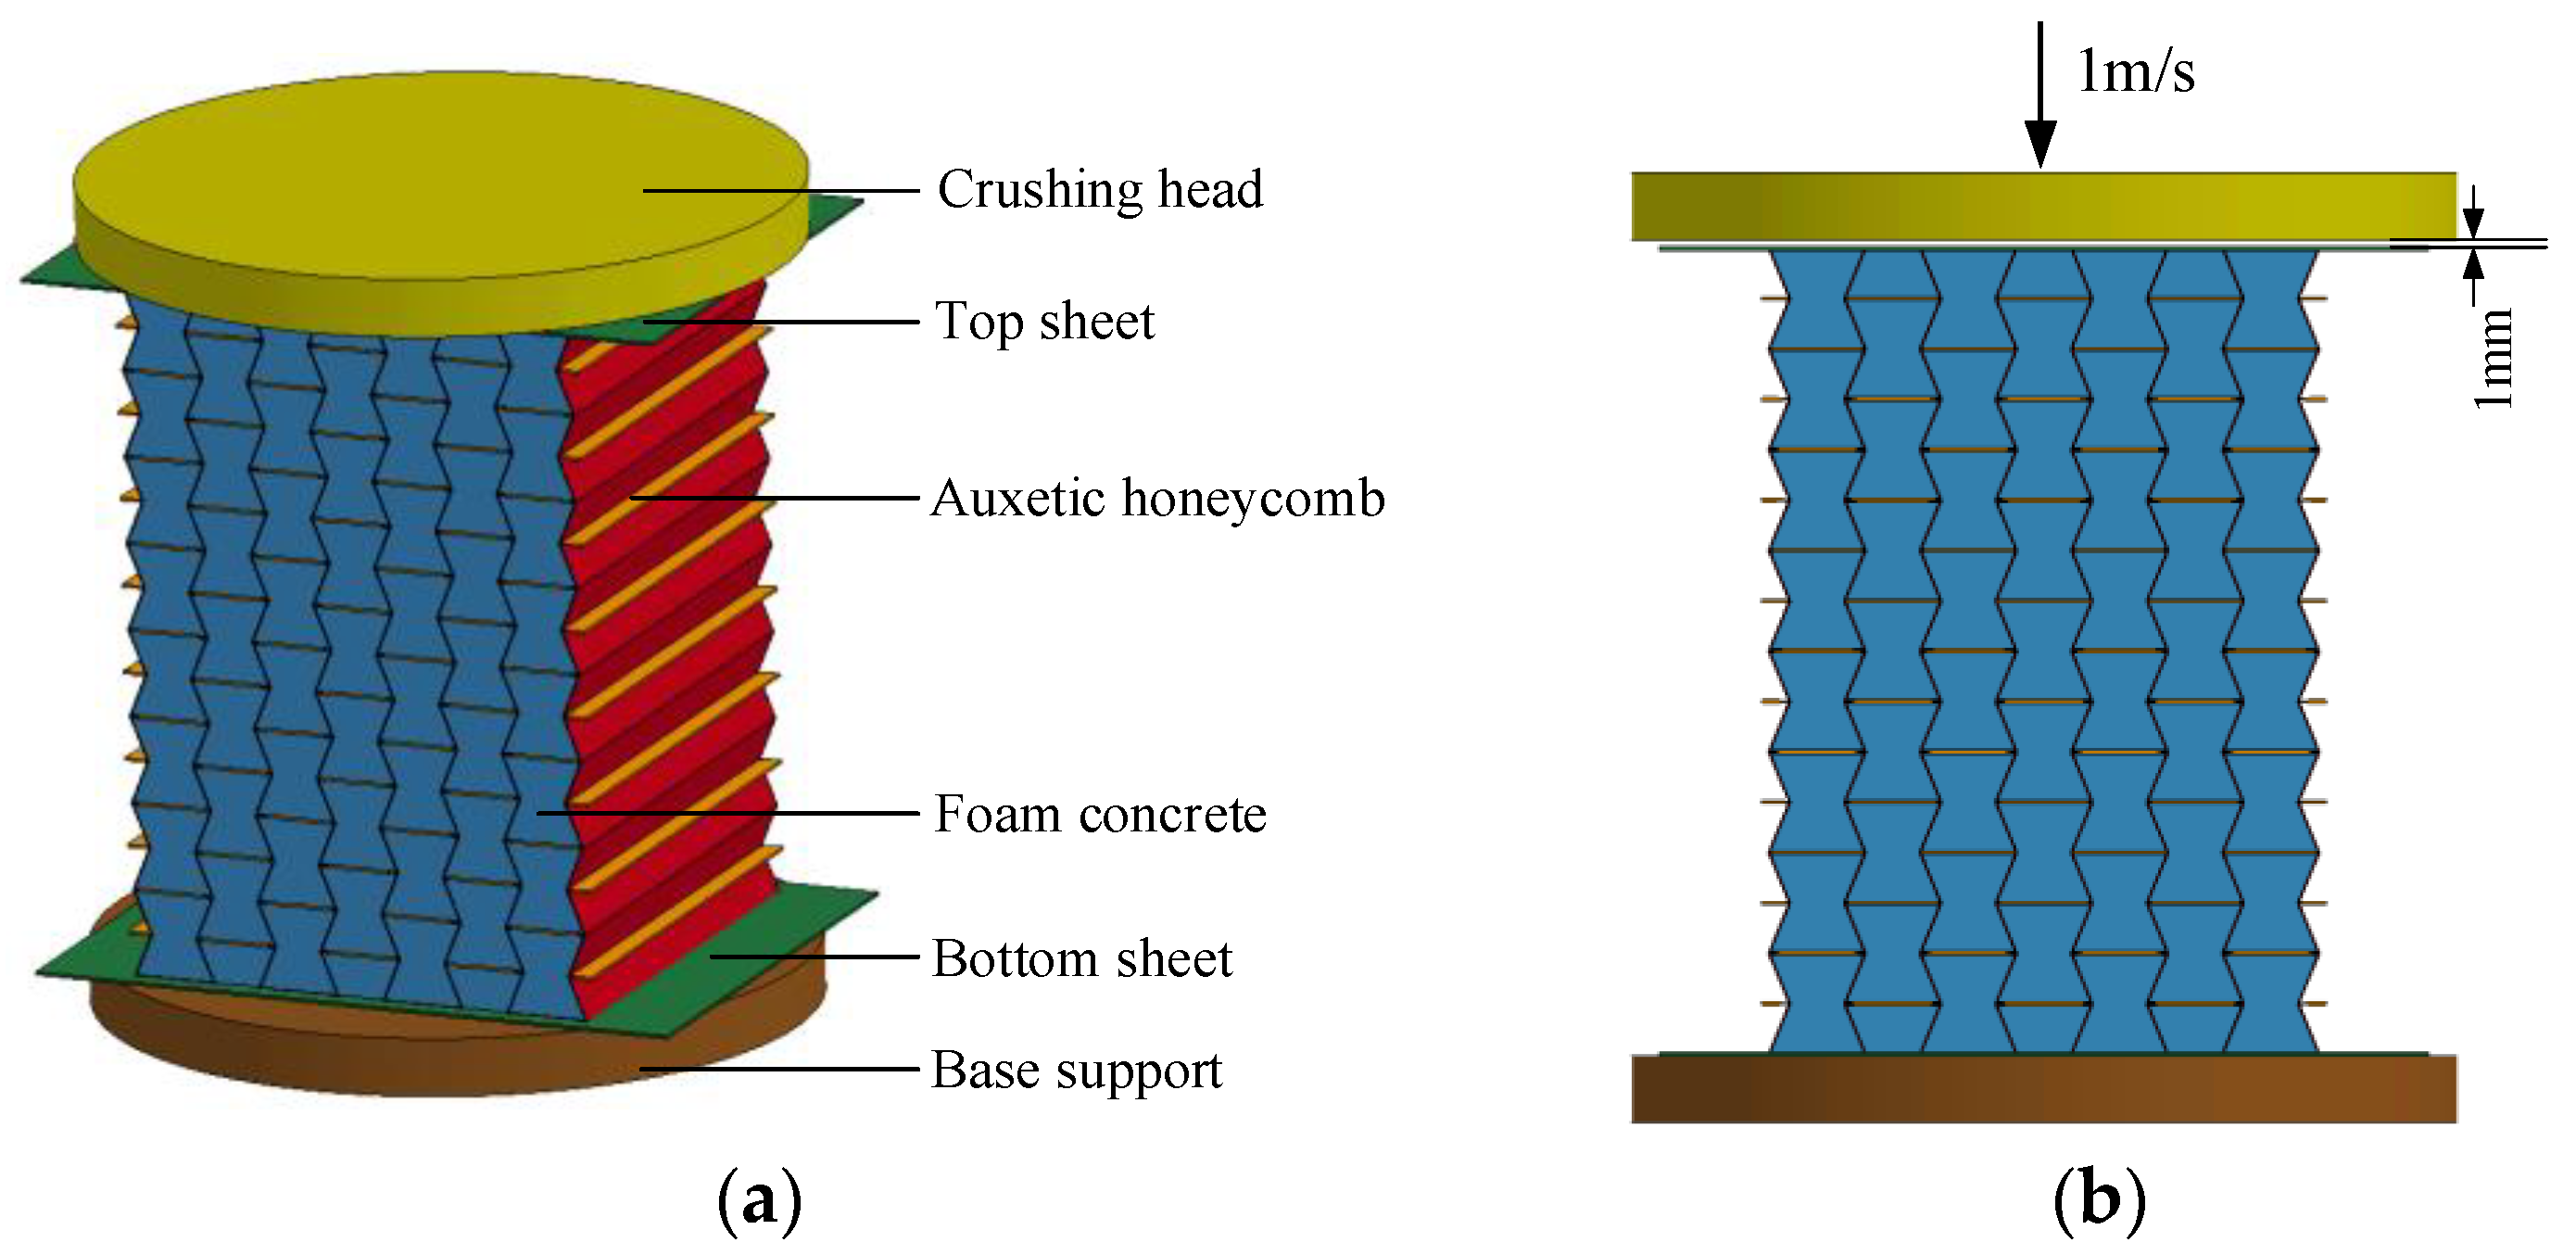
2. Experimental Study
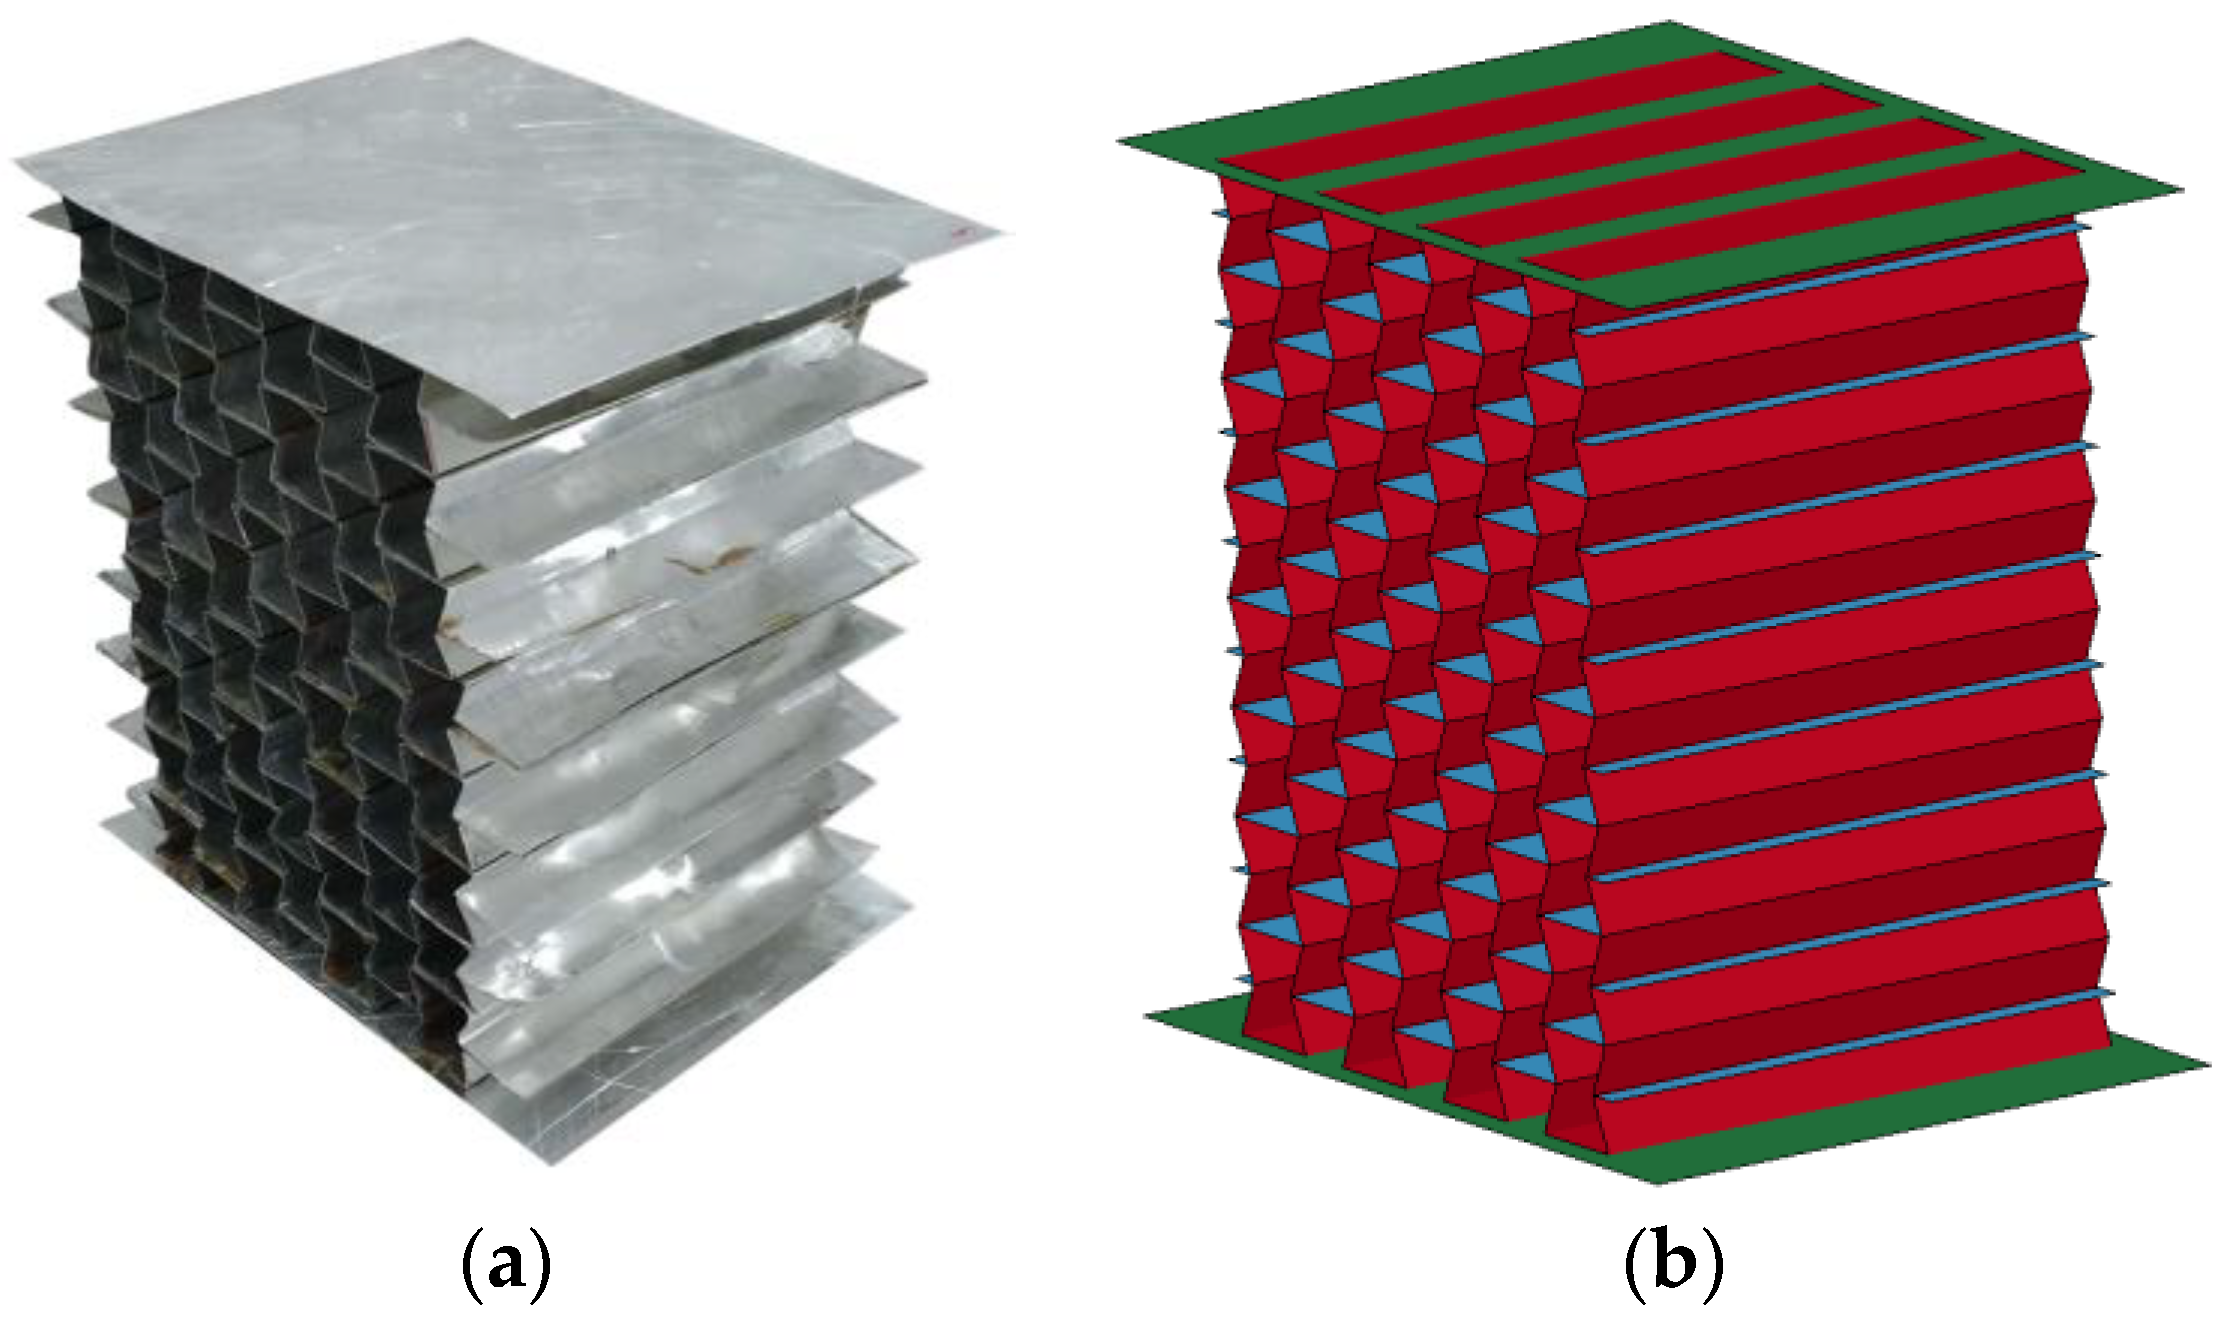
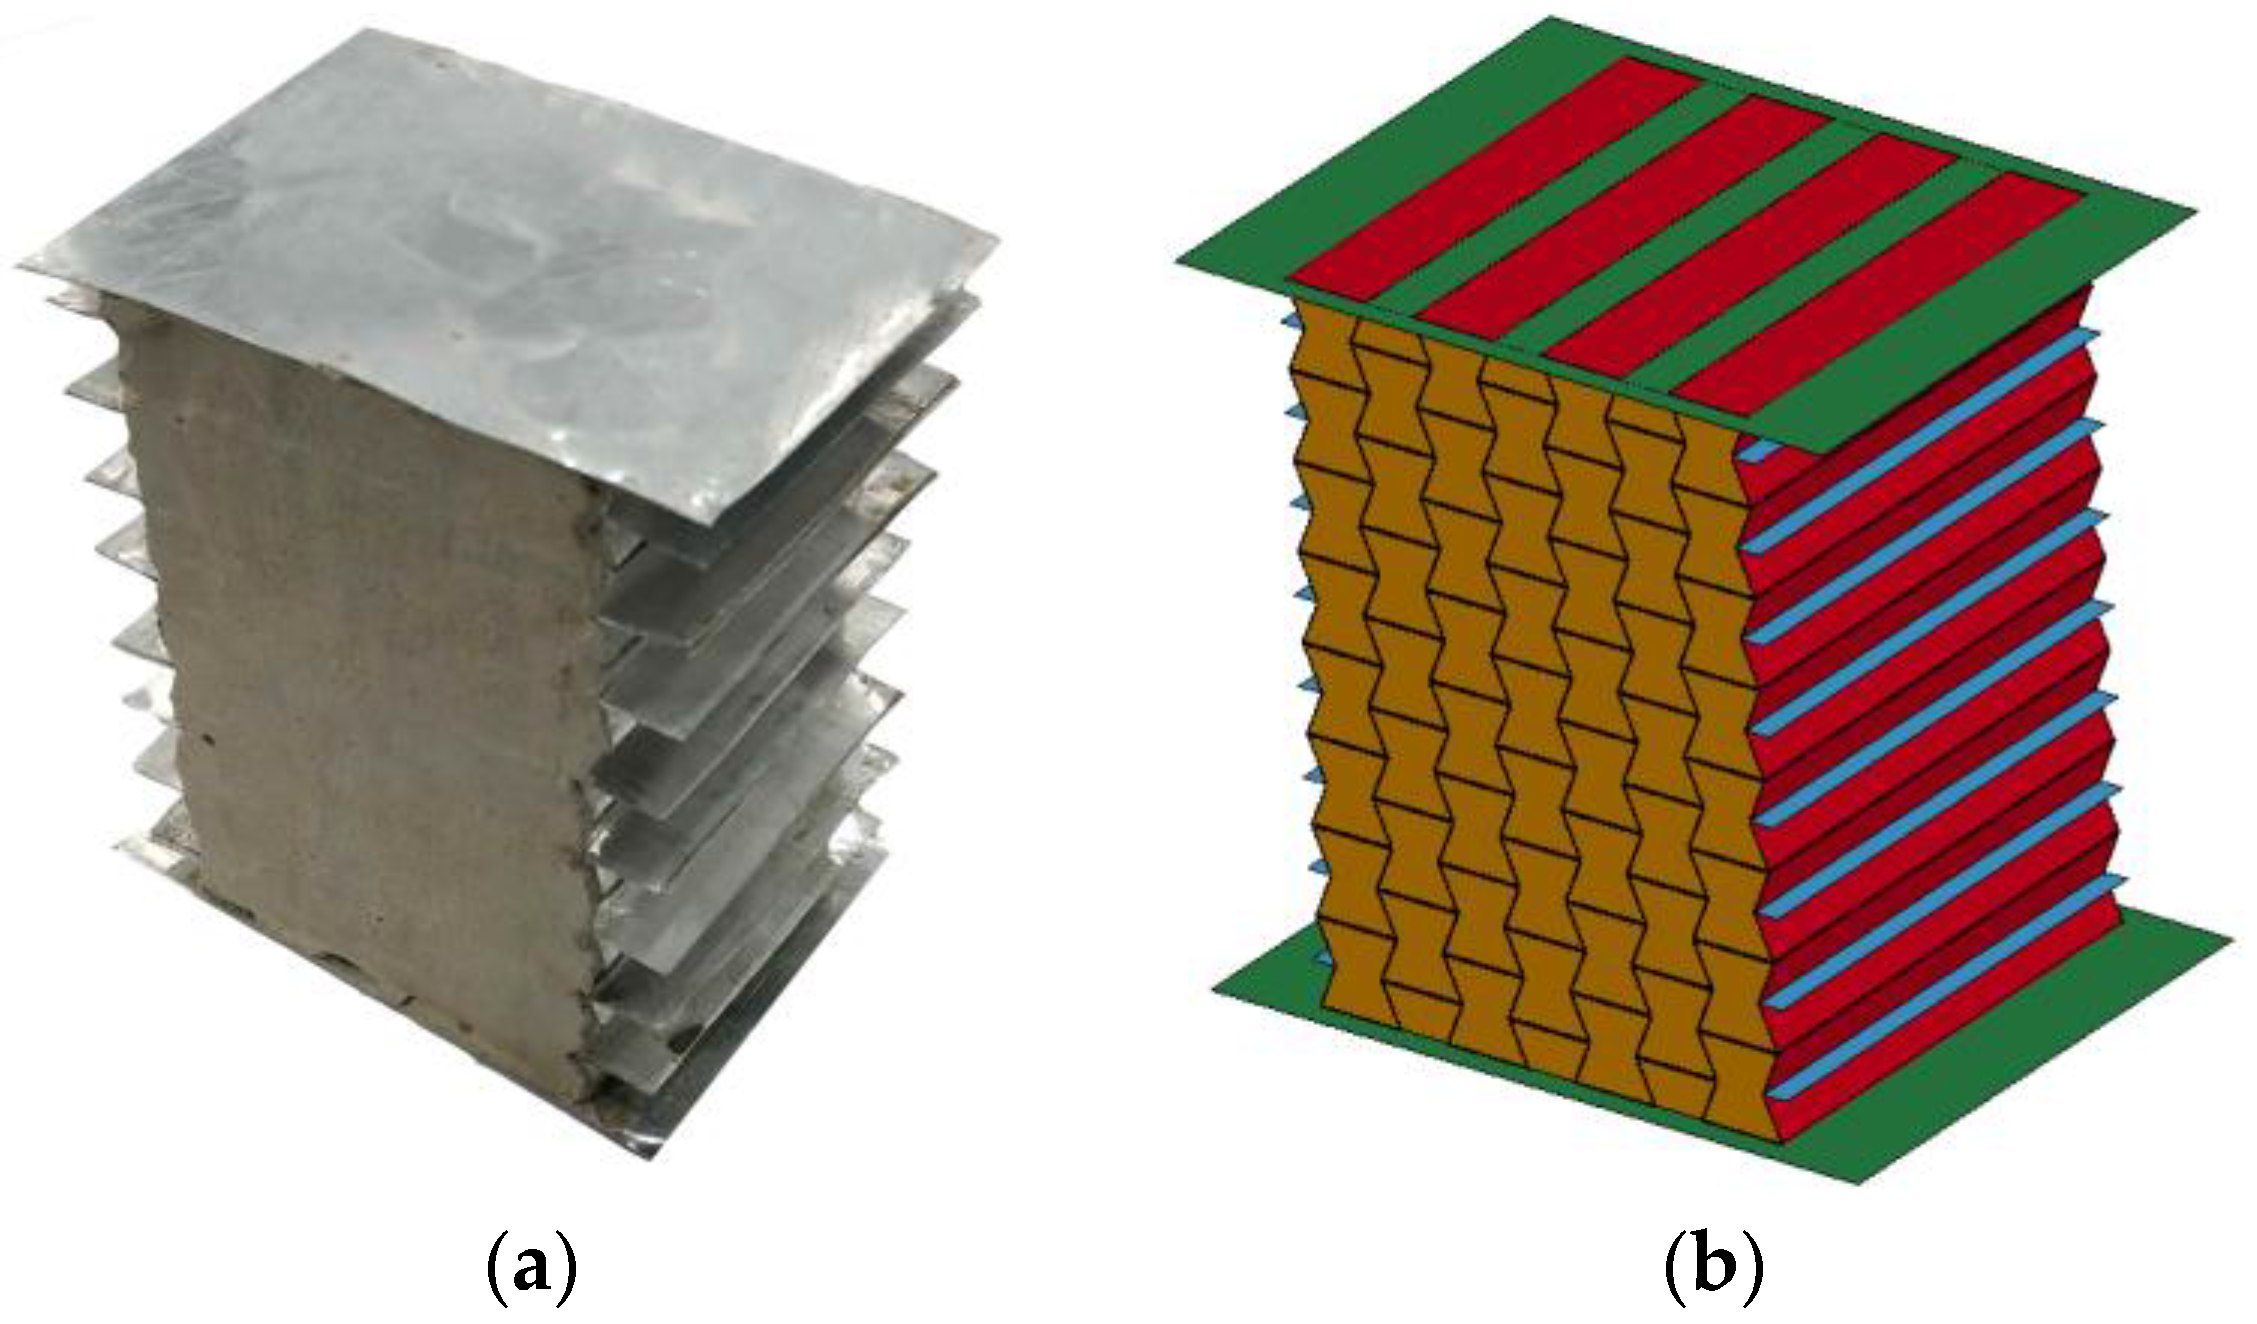
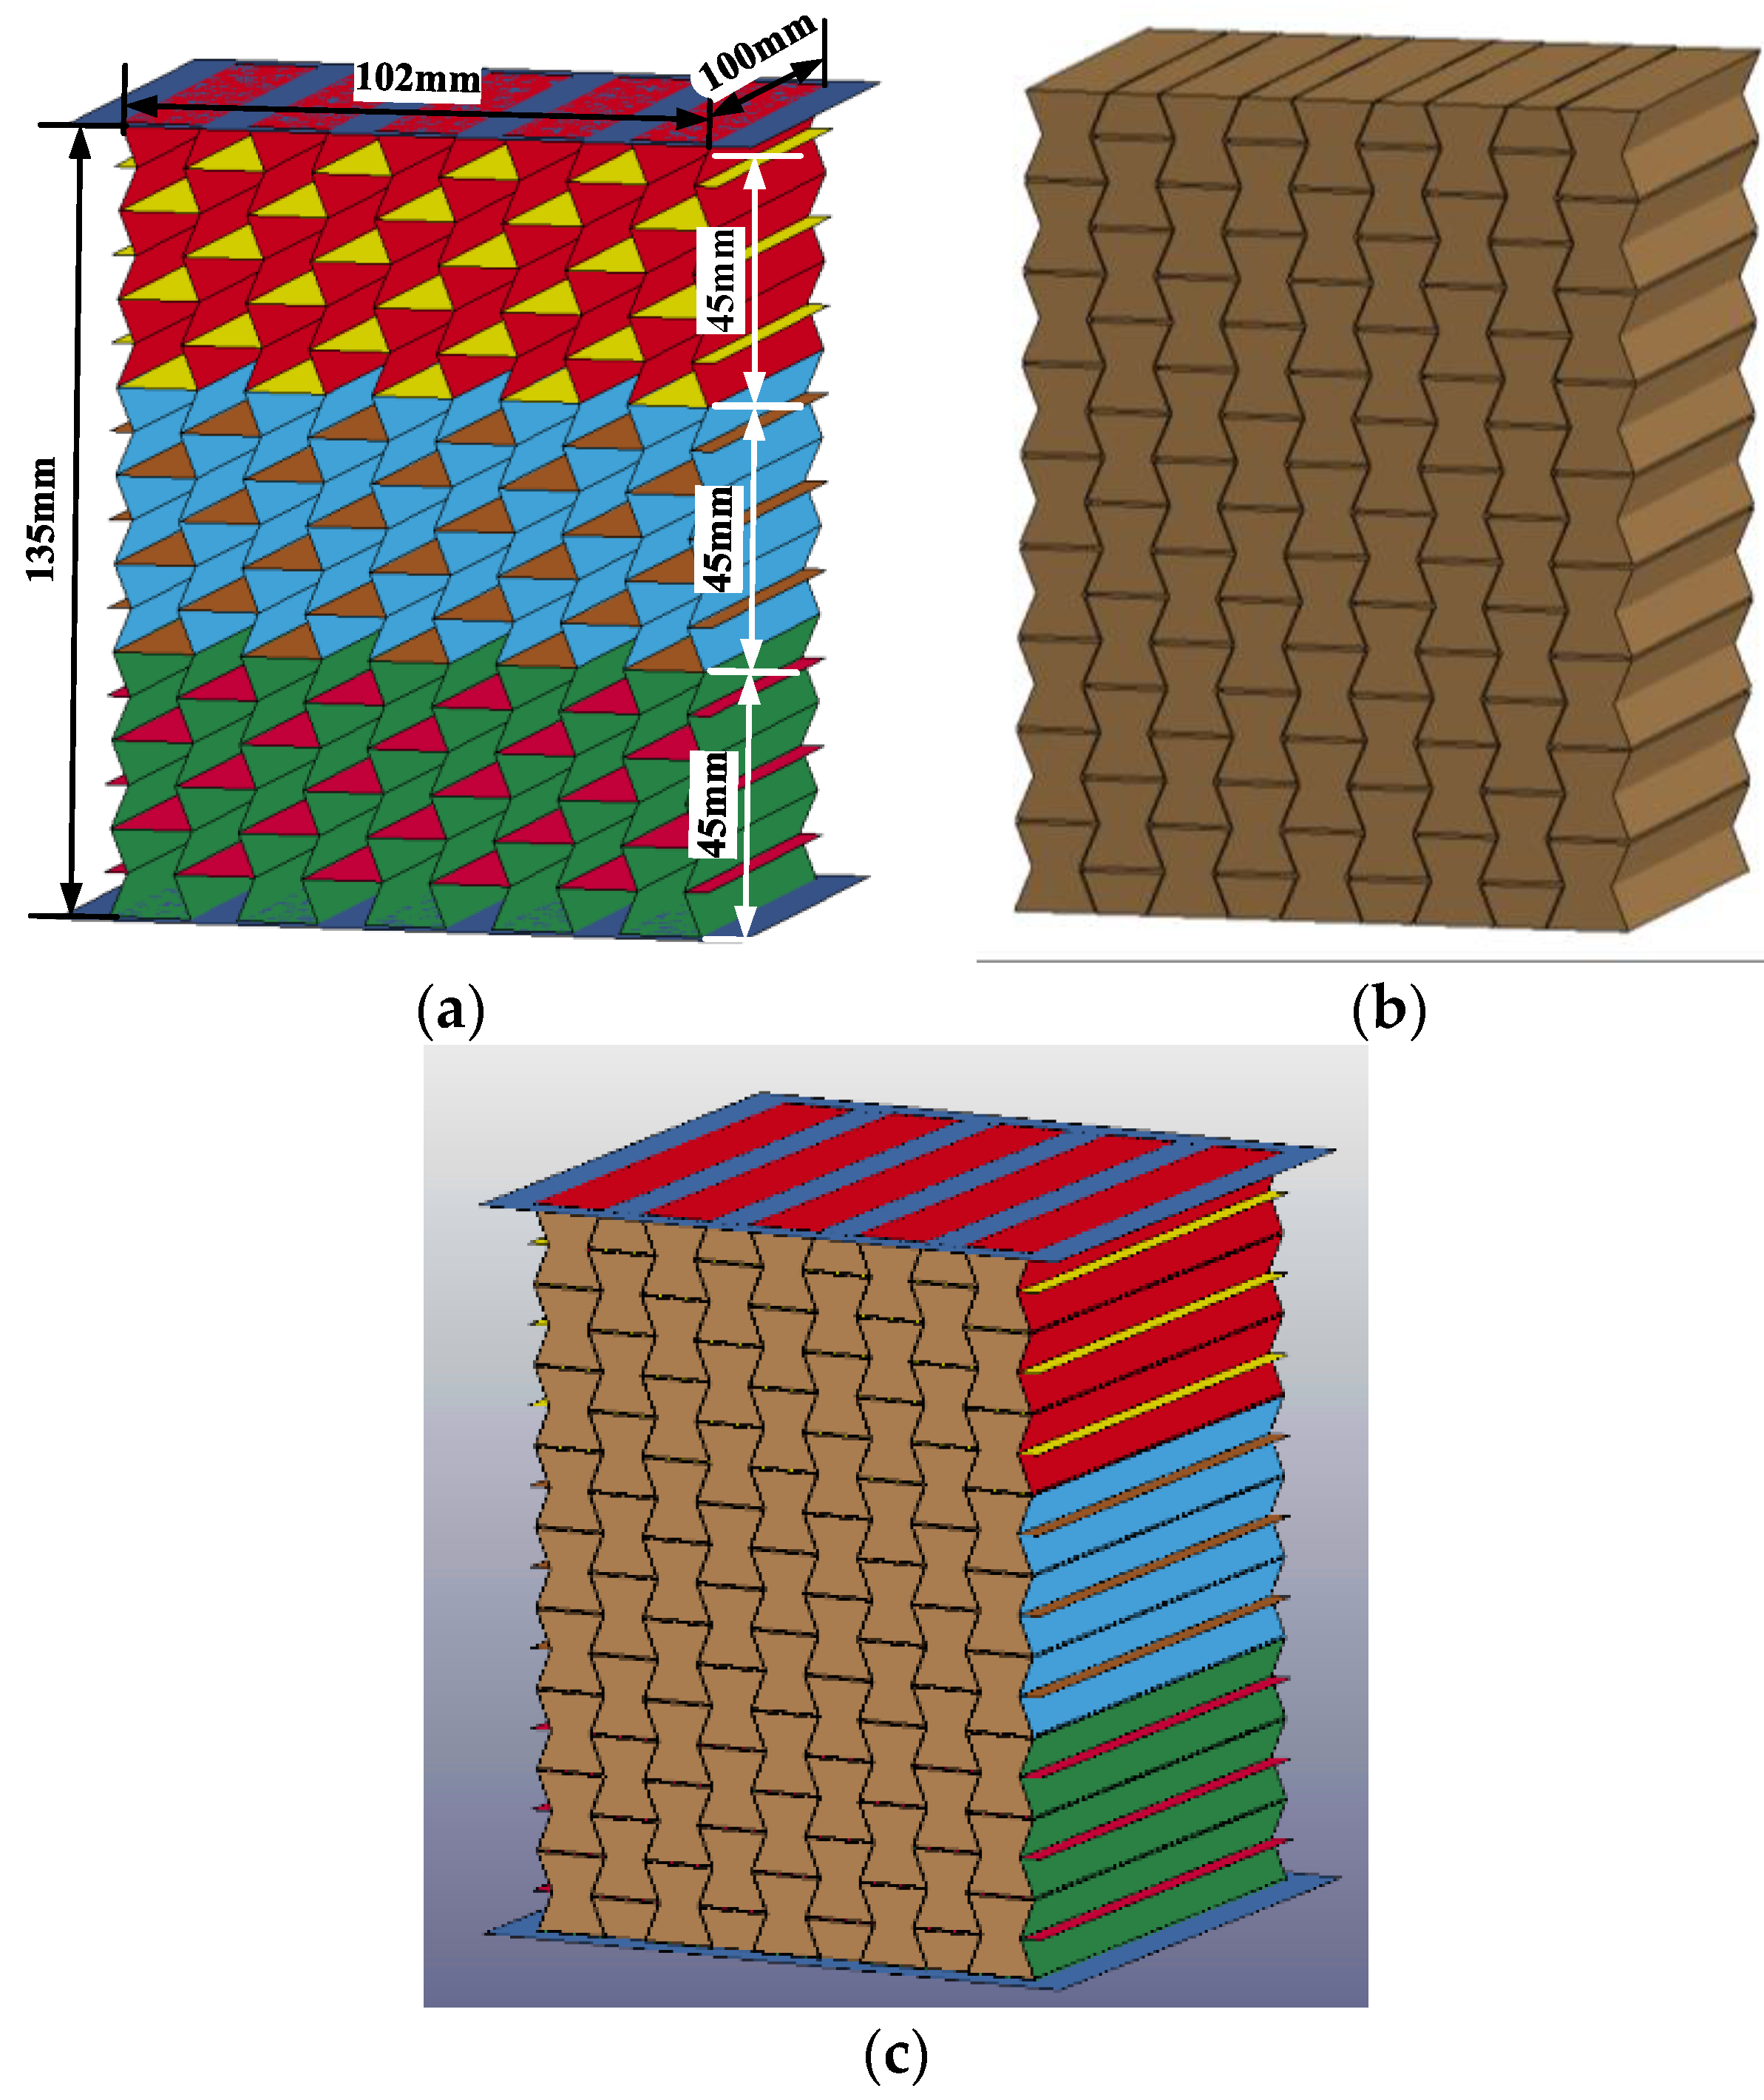
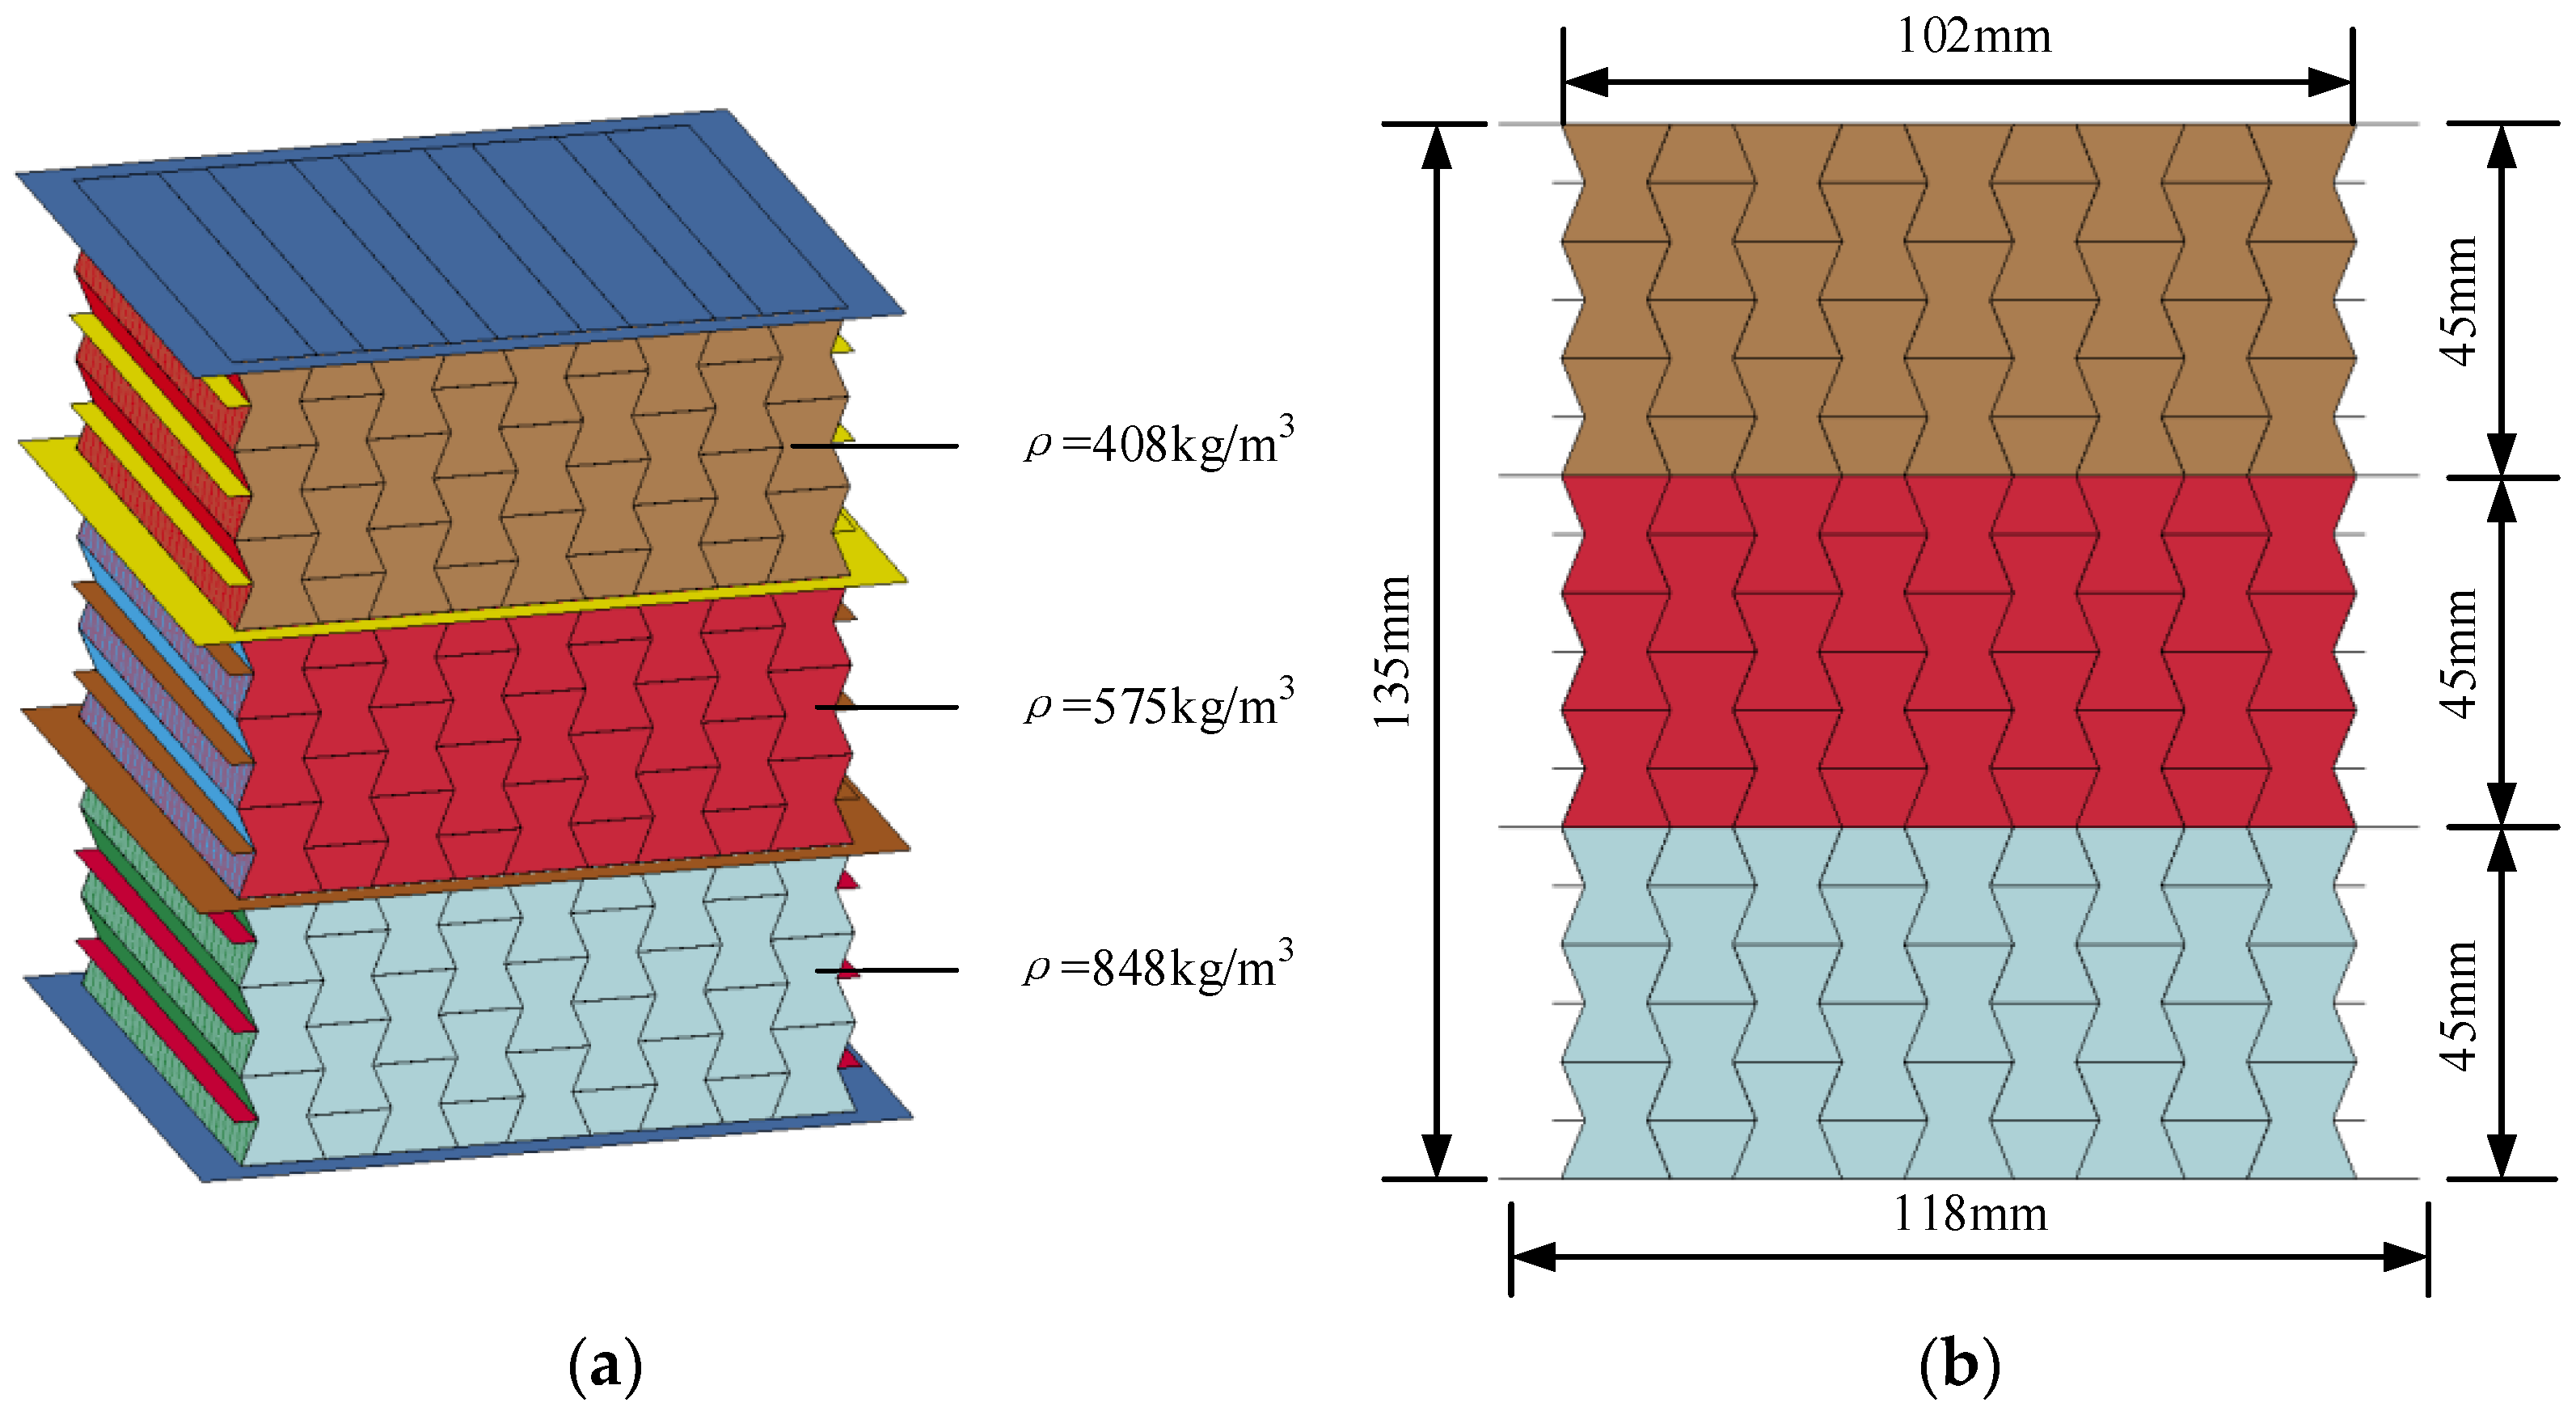
2.1. Specimen Preparation
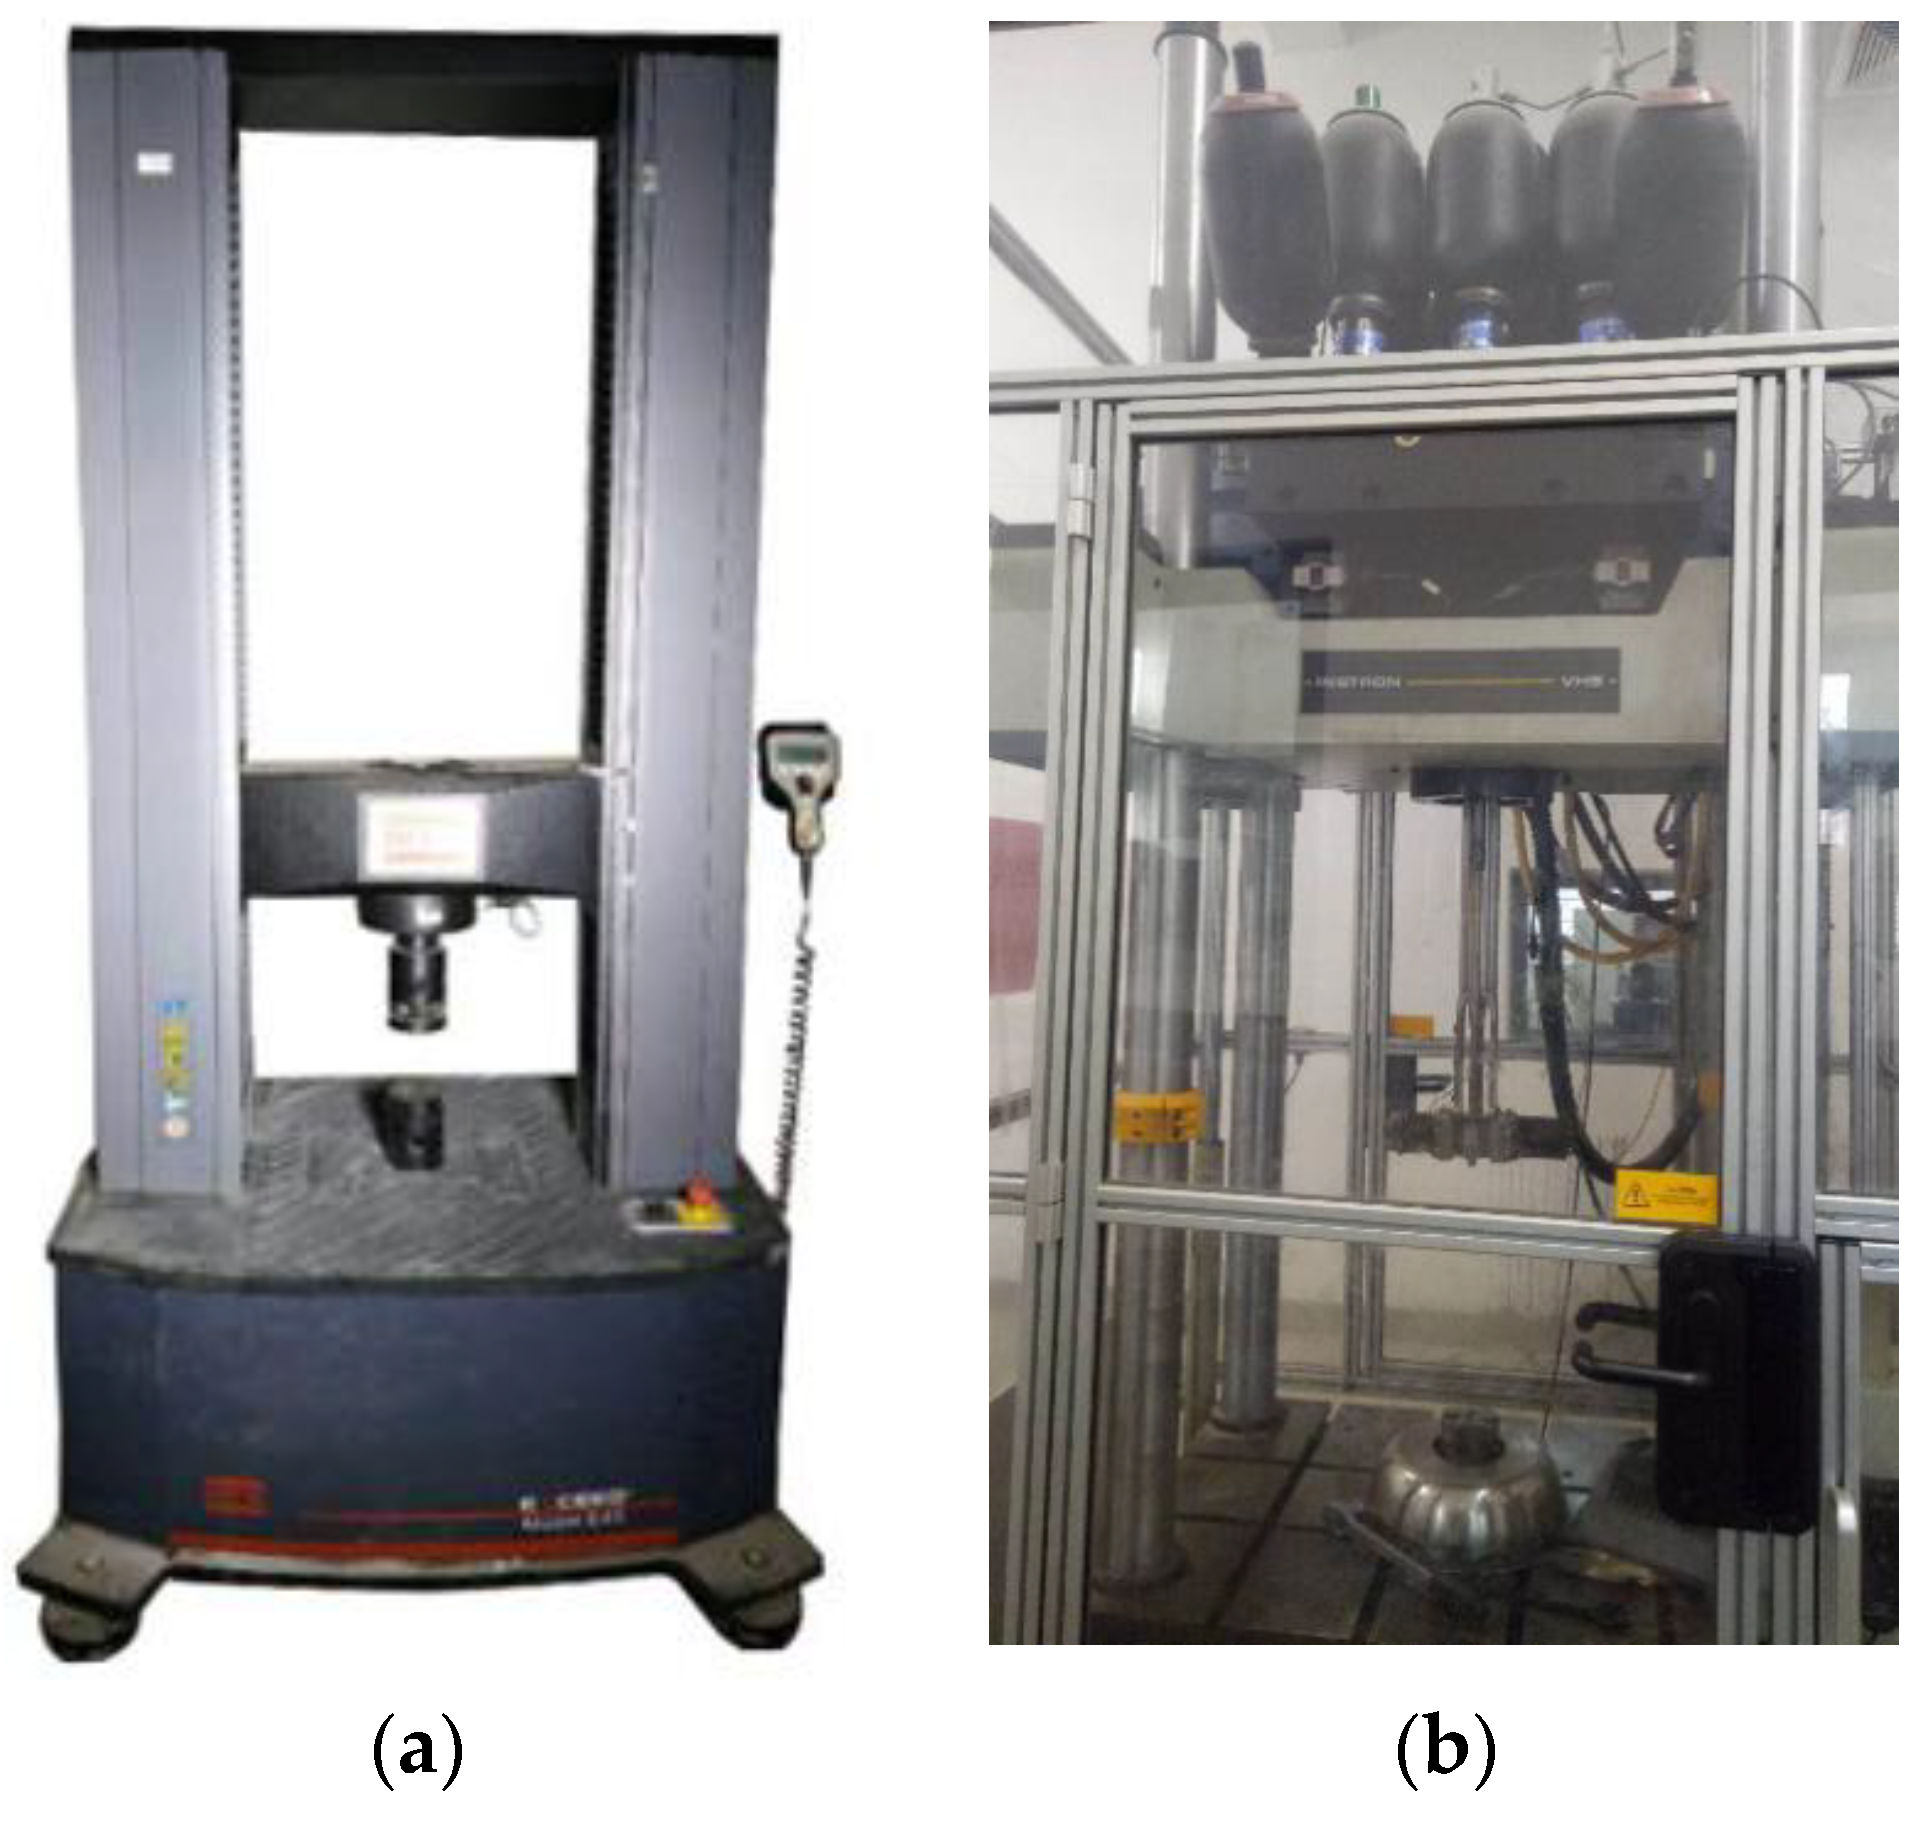
2.2. Quasi-Static and Dynamic Compression Tests
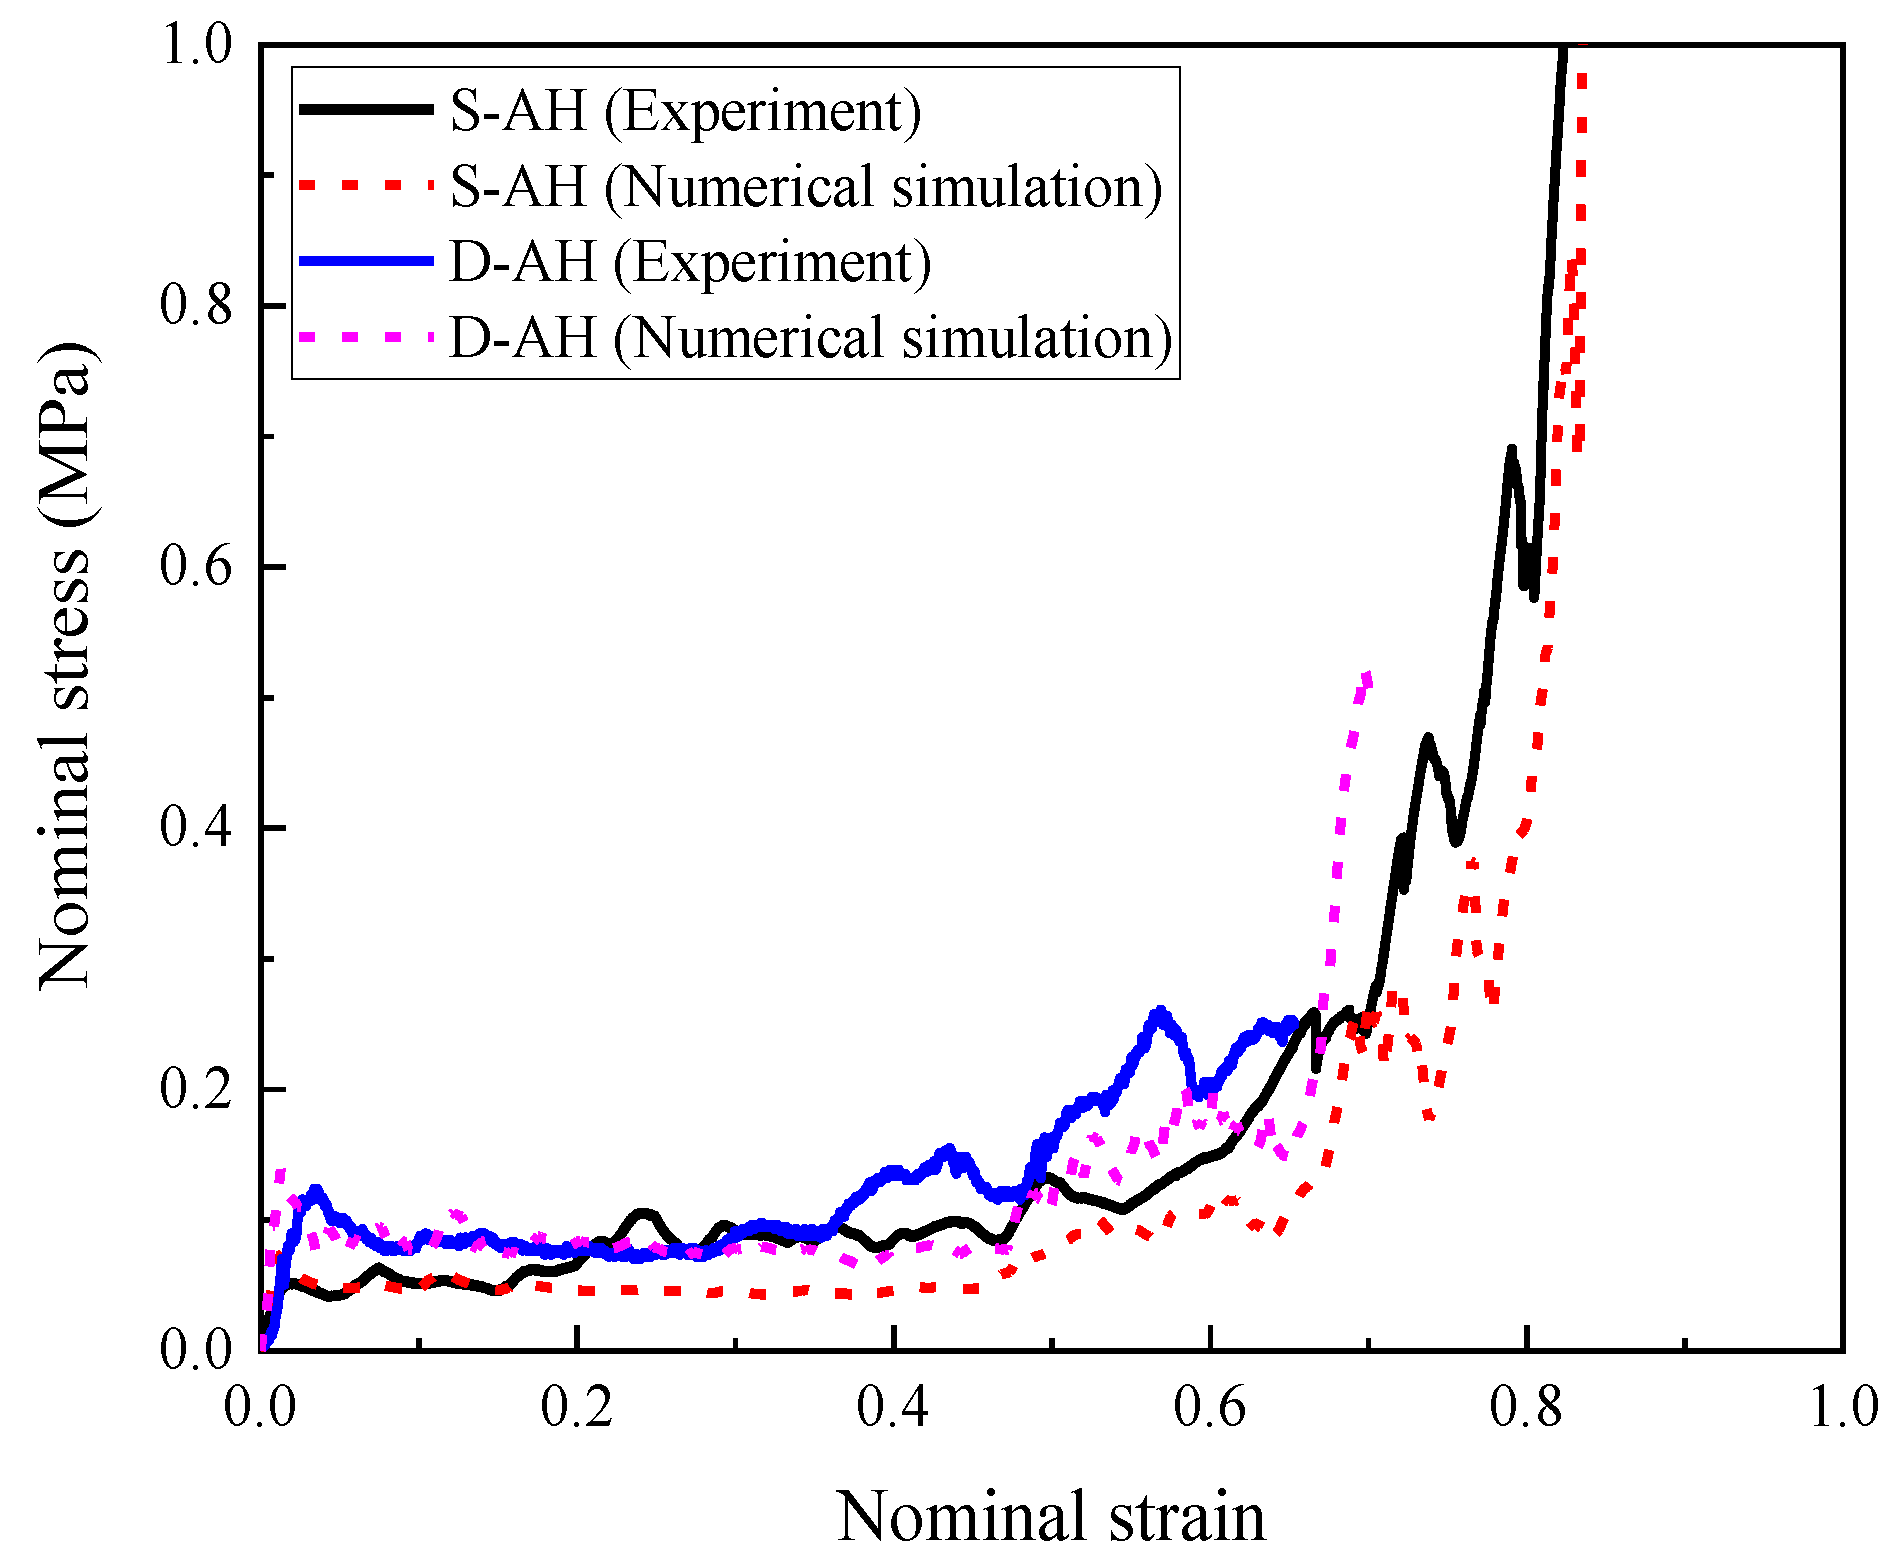
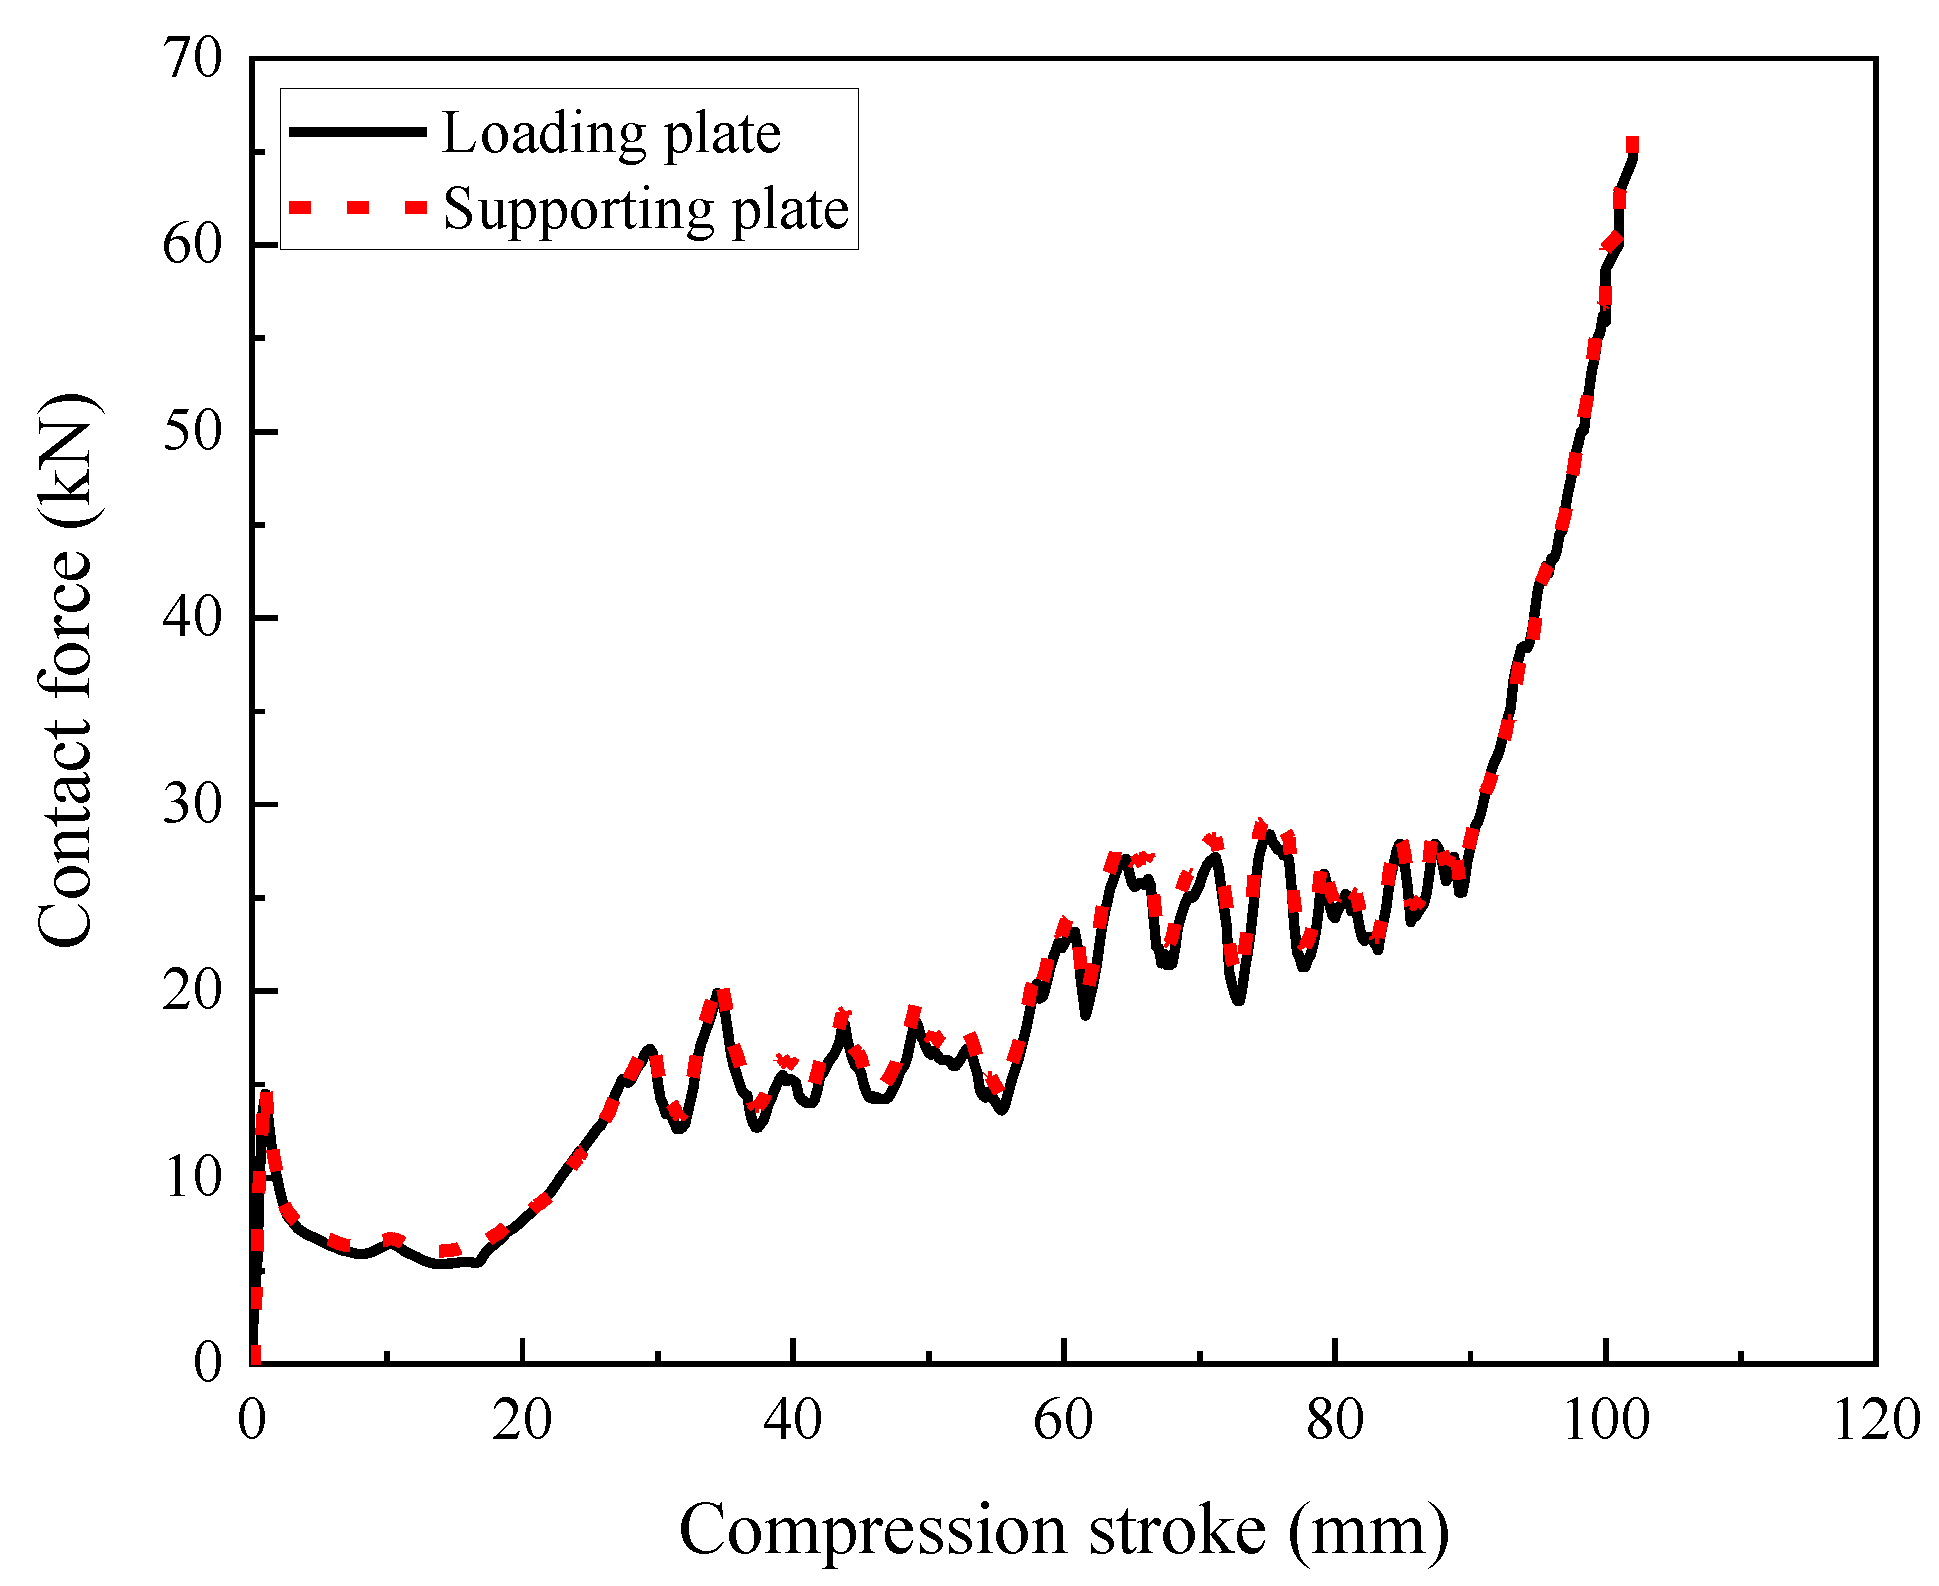
3. Numerical Model with Validation
3.1. Numerical Model of the Homogenous Composite
3.2. Numerical Model Validation
3.2.1. Hollow Honeycomb
3.2.2. Homogenous Composite
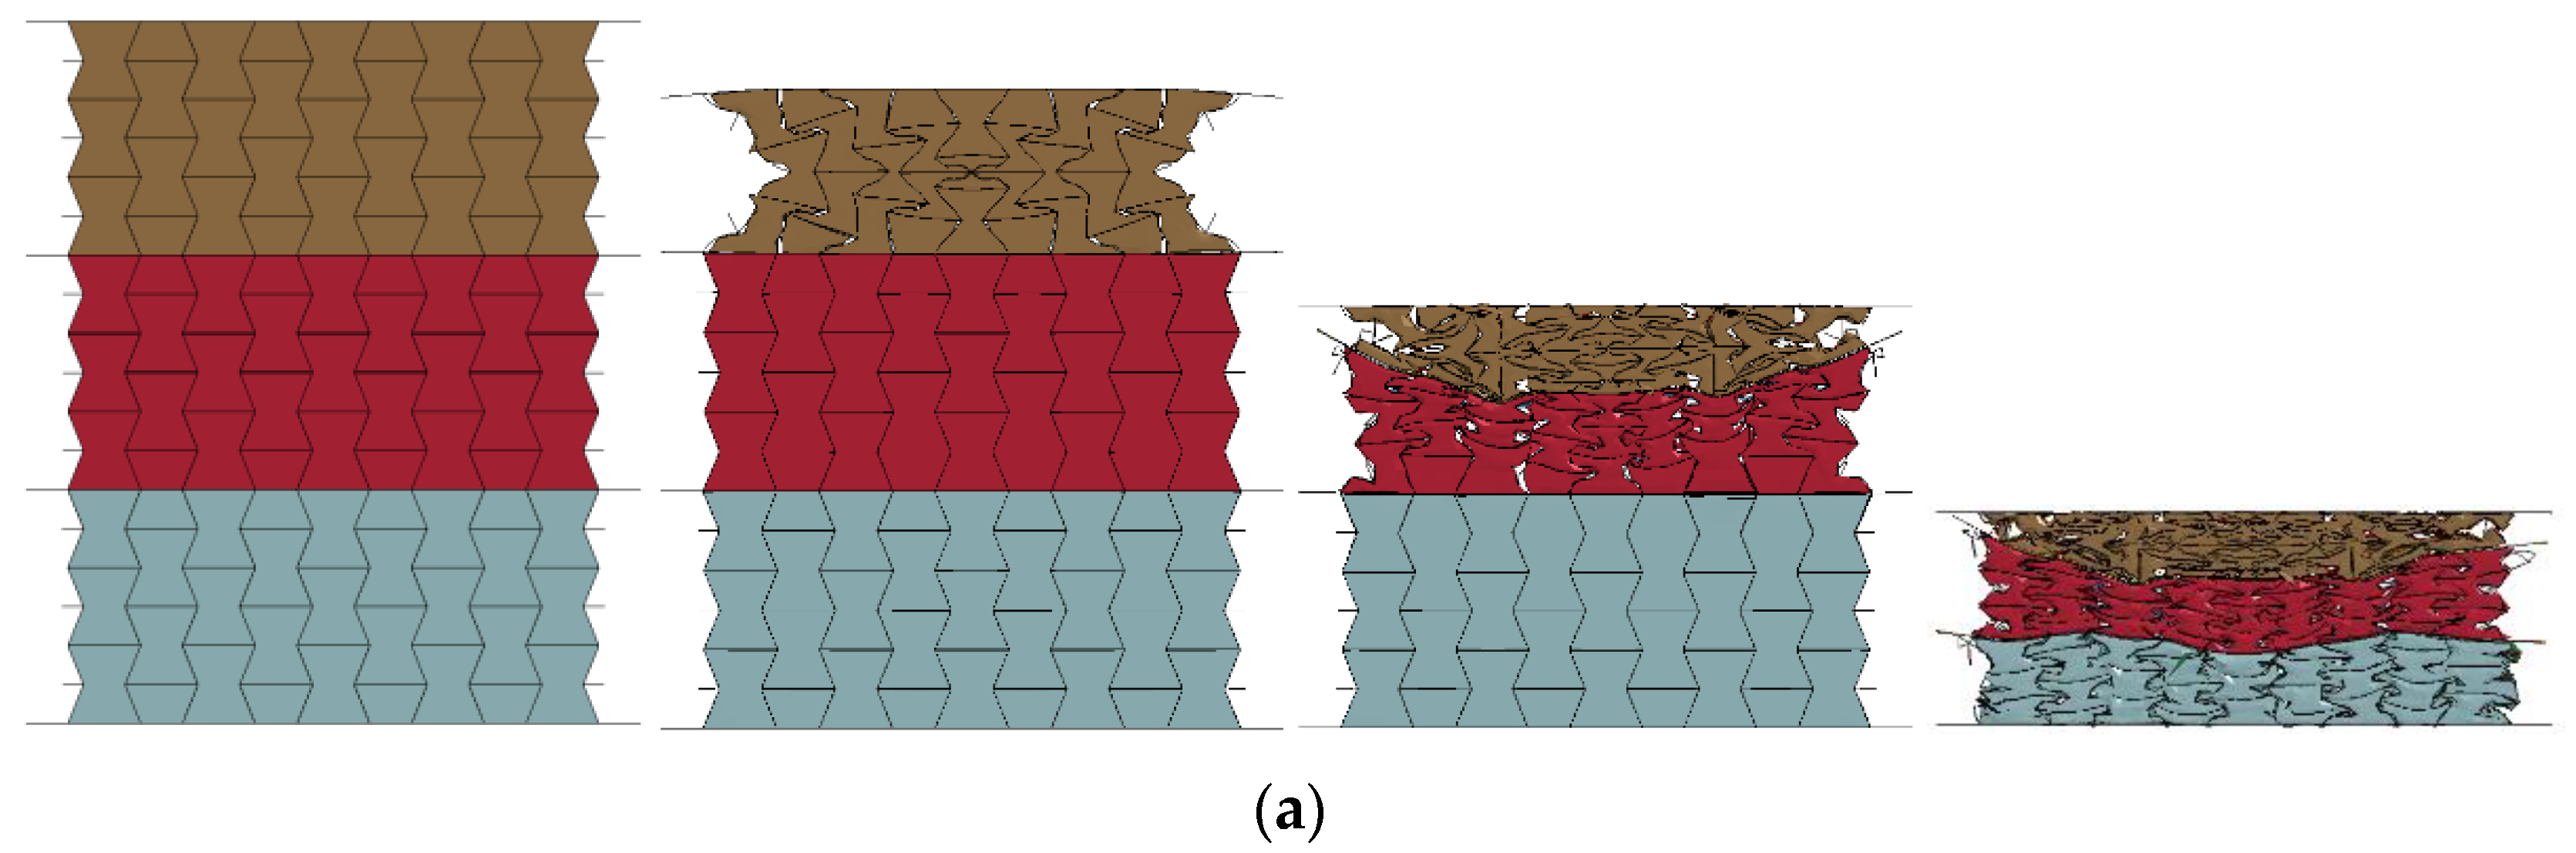
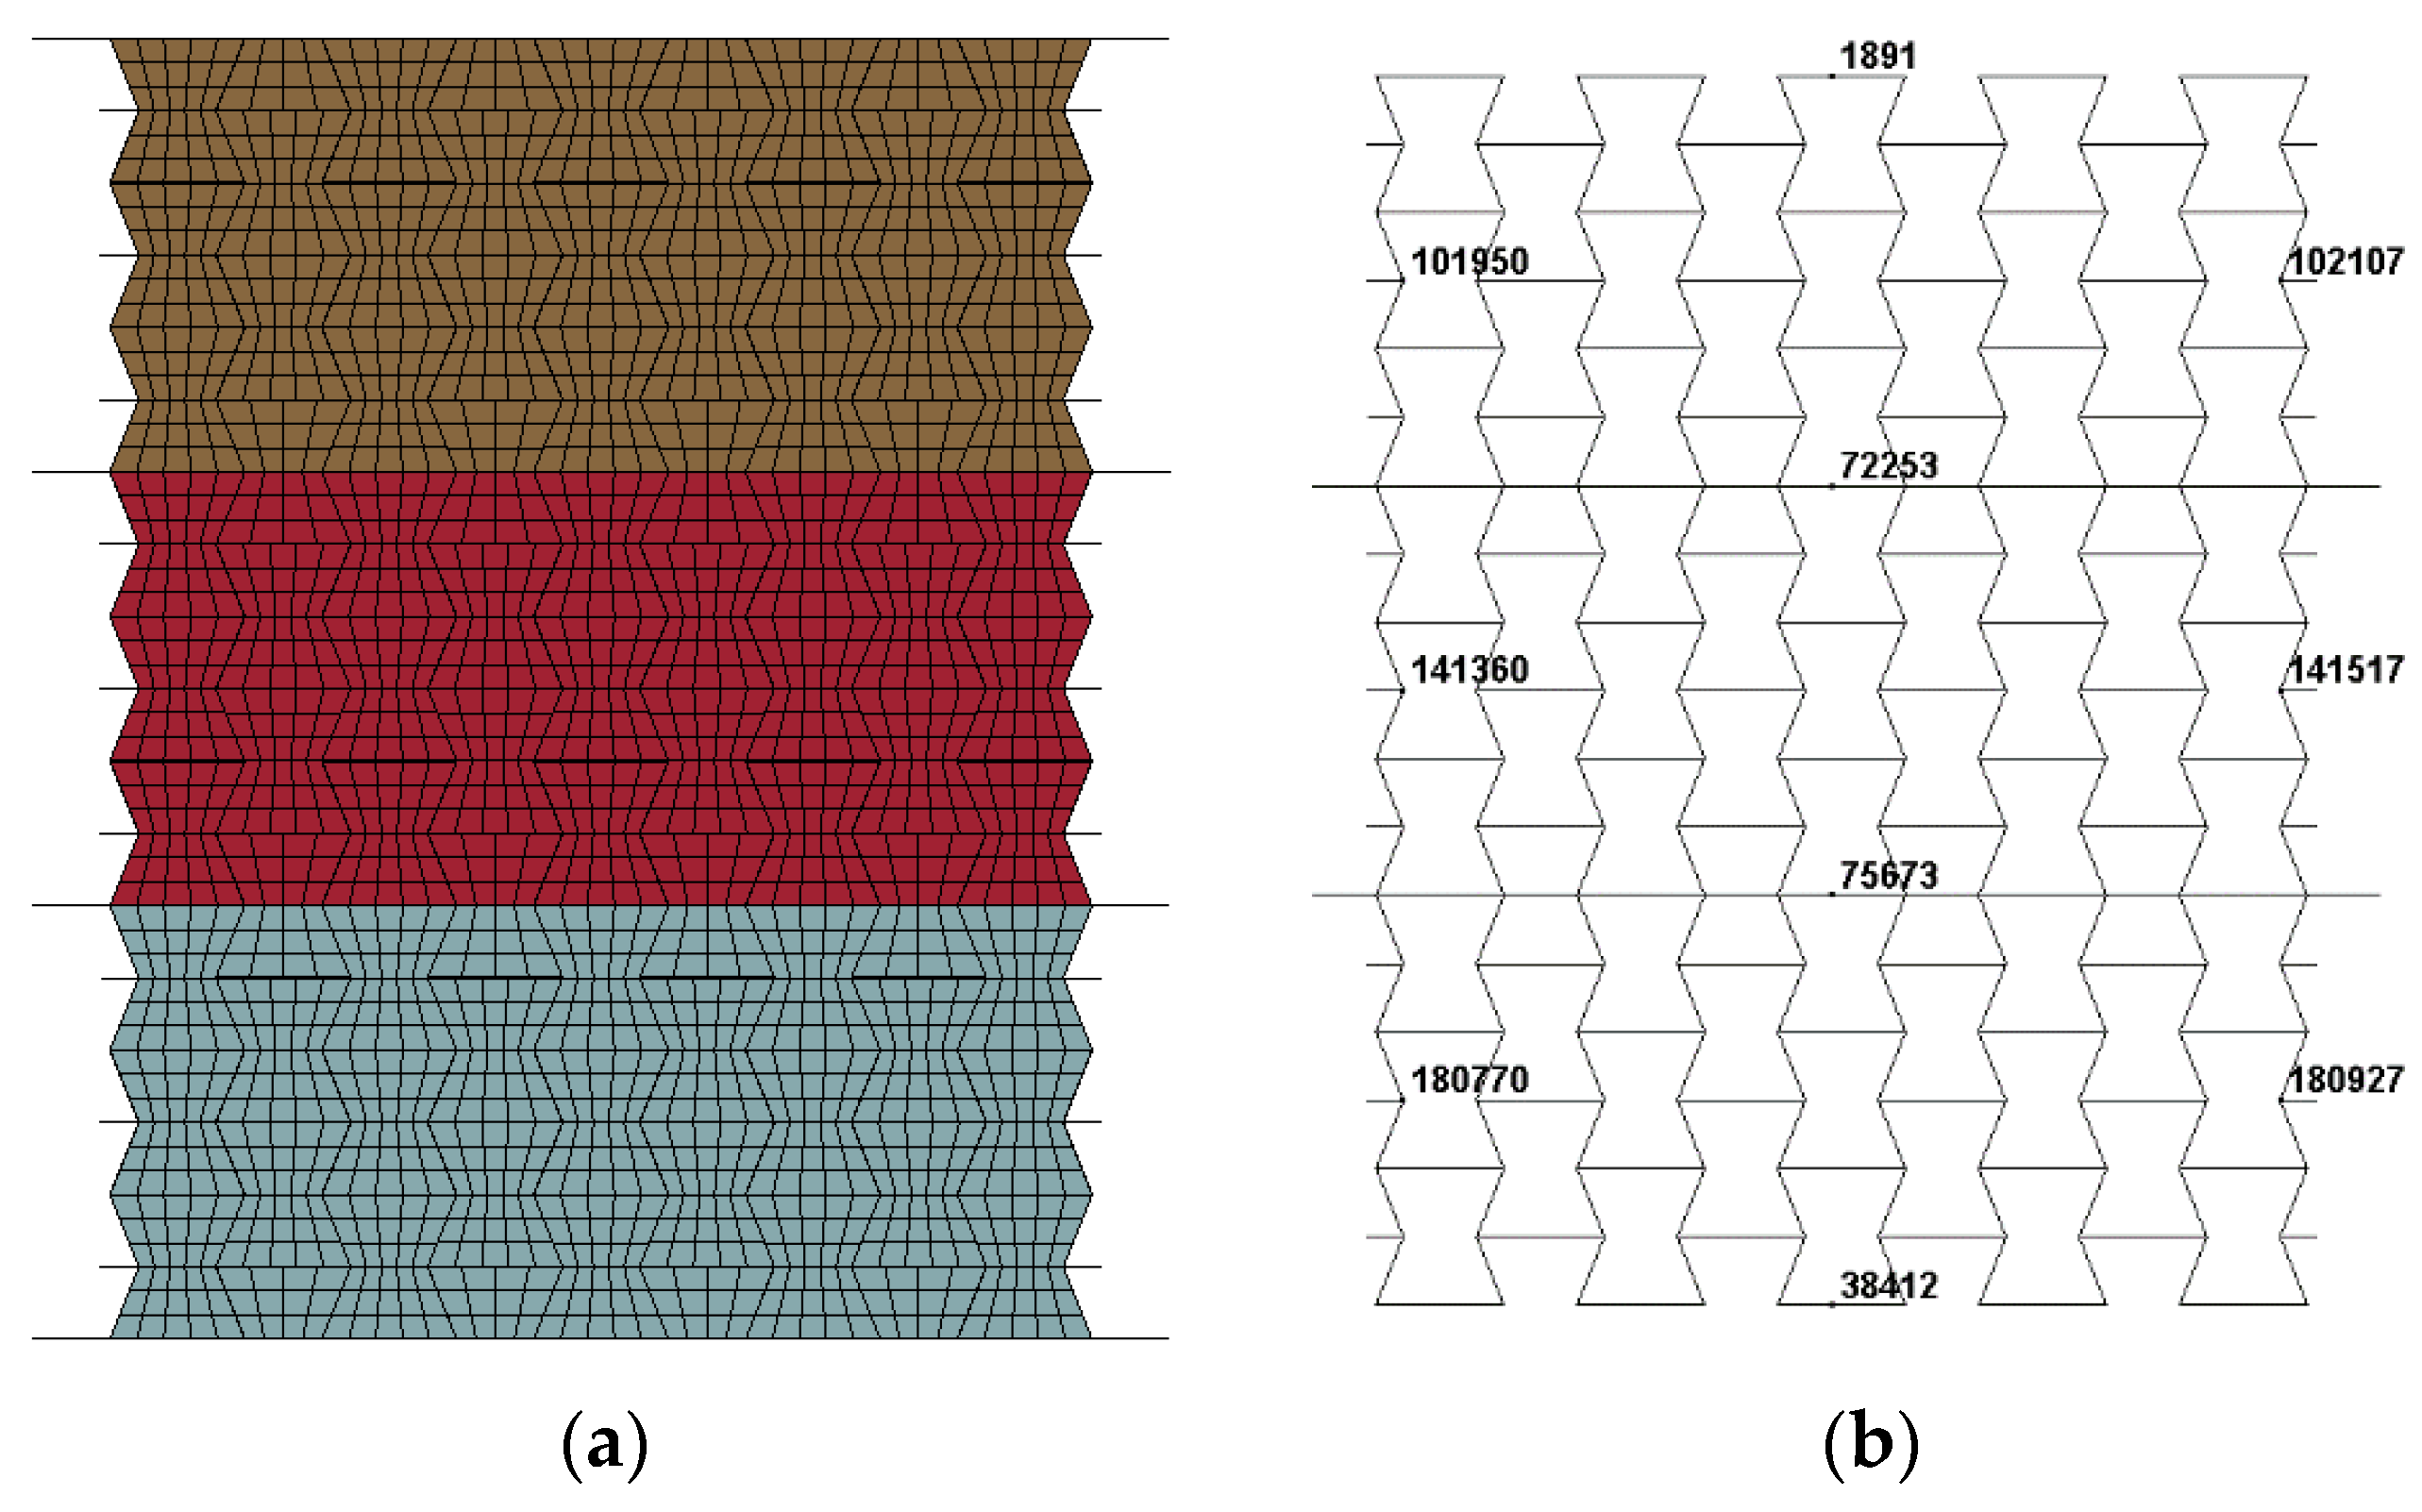
3.3. Numerical Model of Graded Composite
4. Parametric Study and Discussions
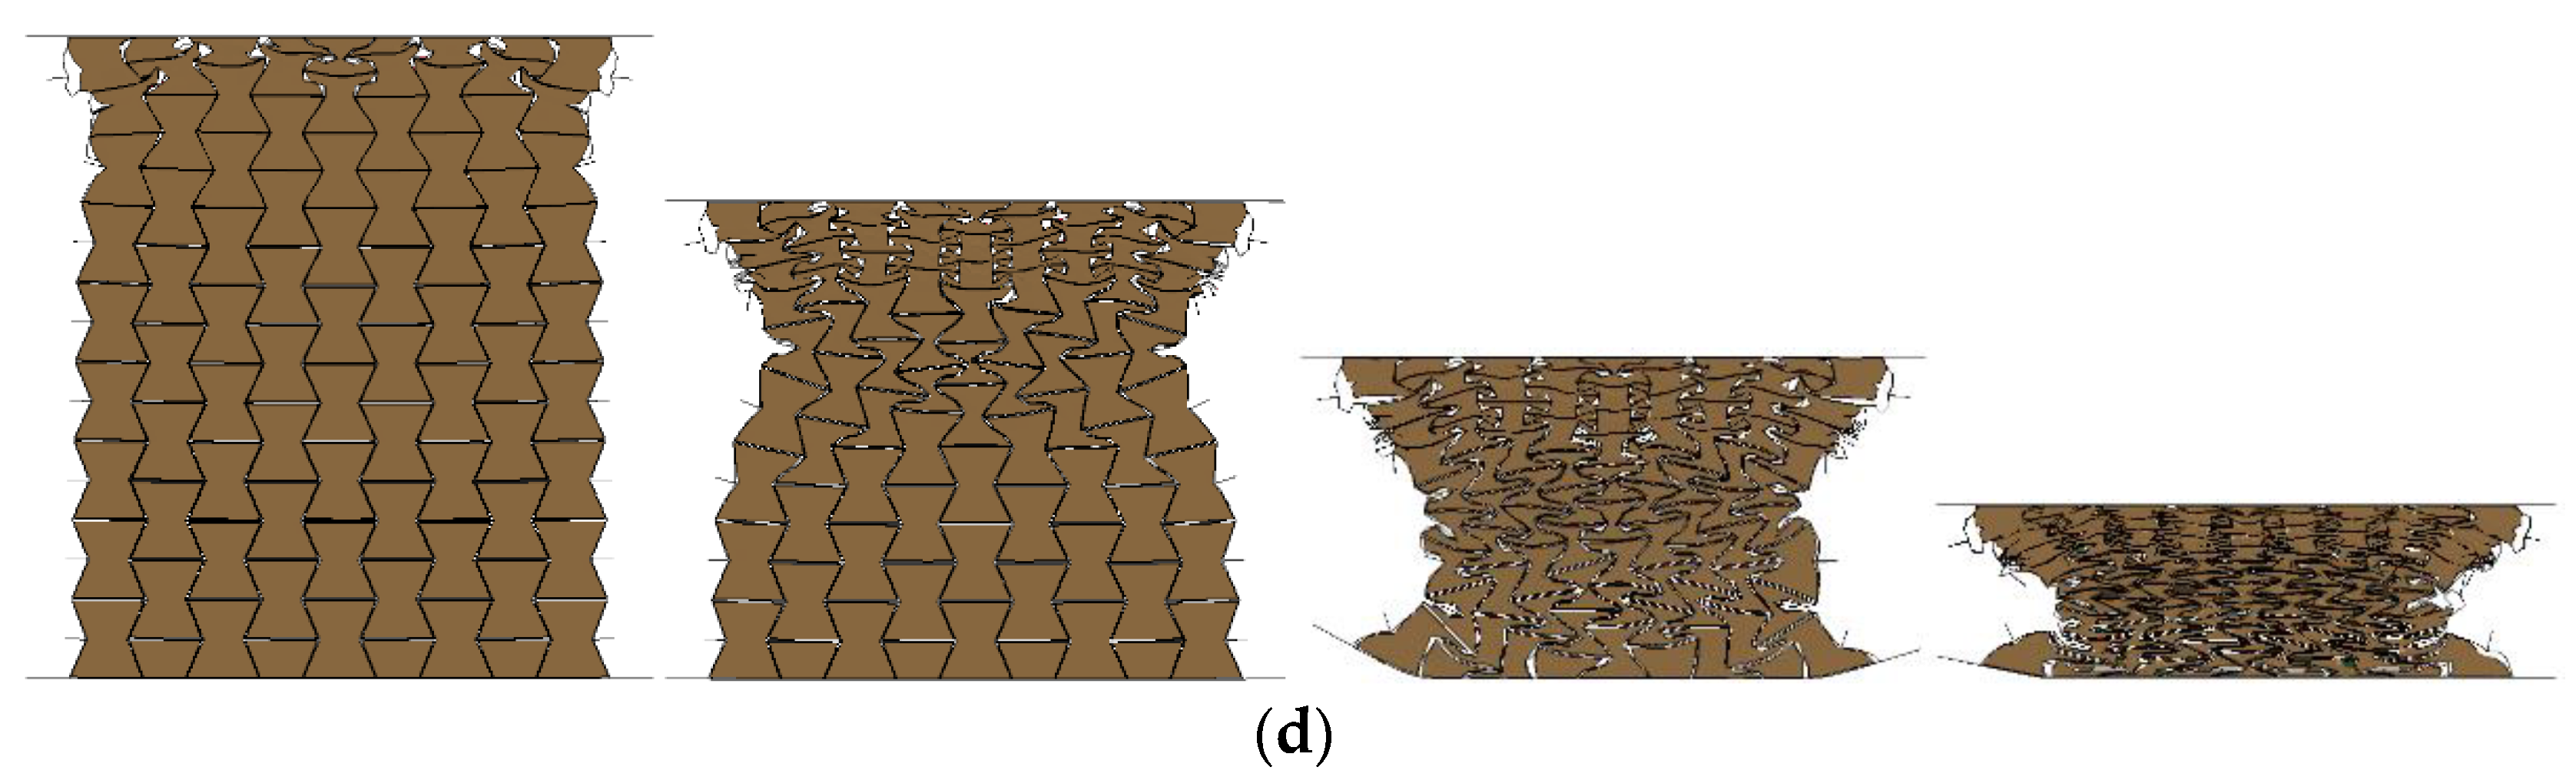
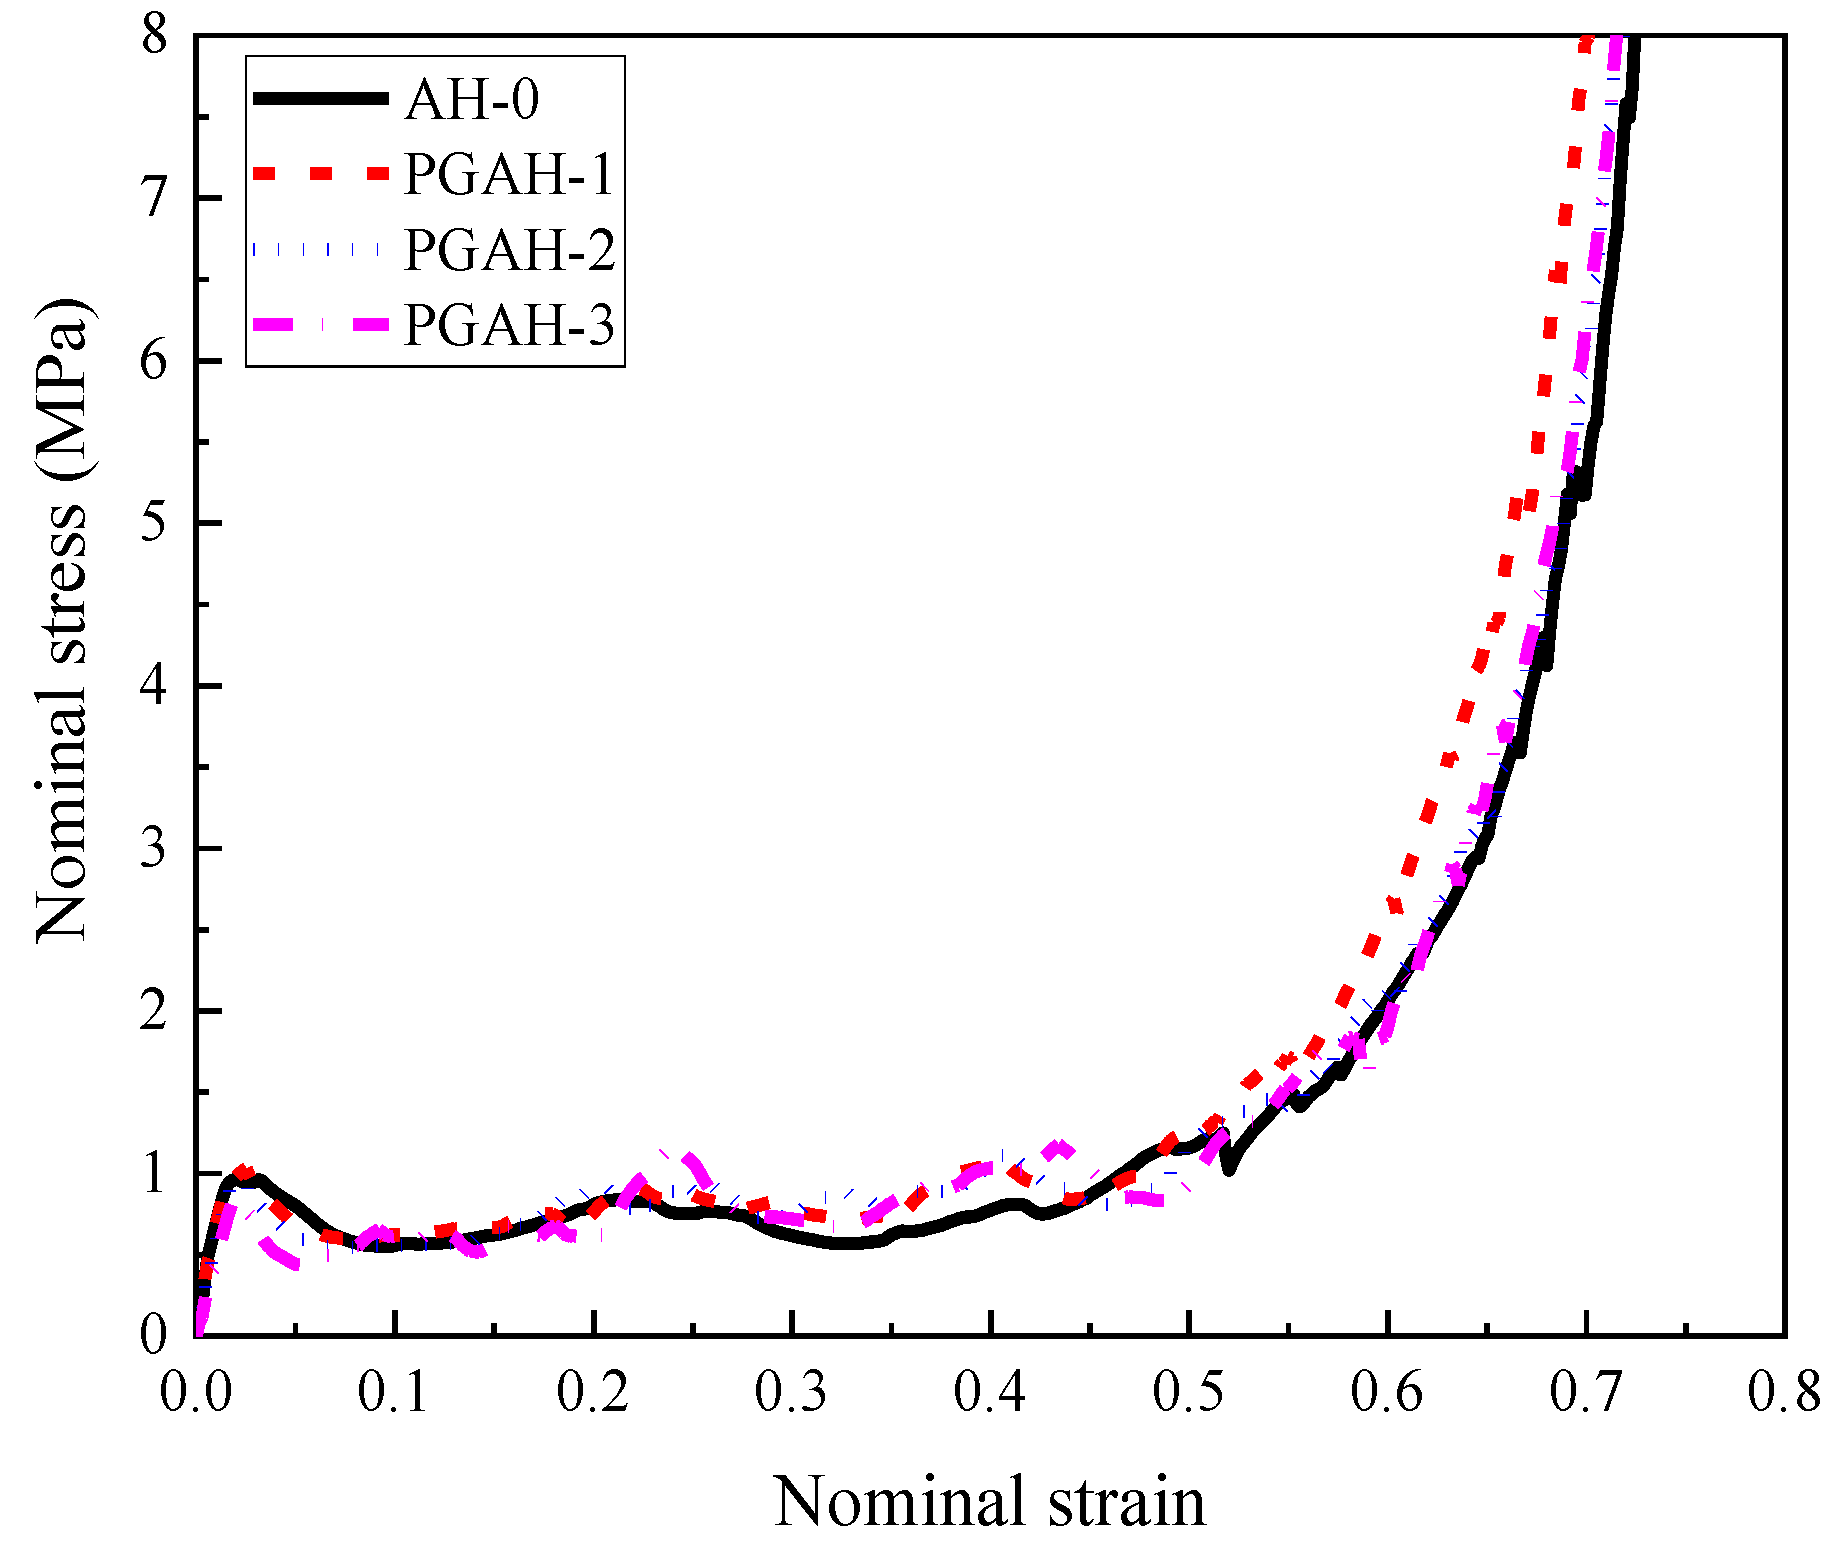
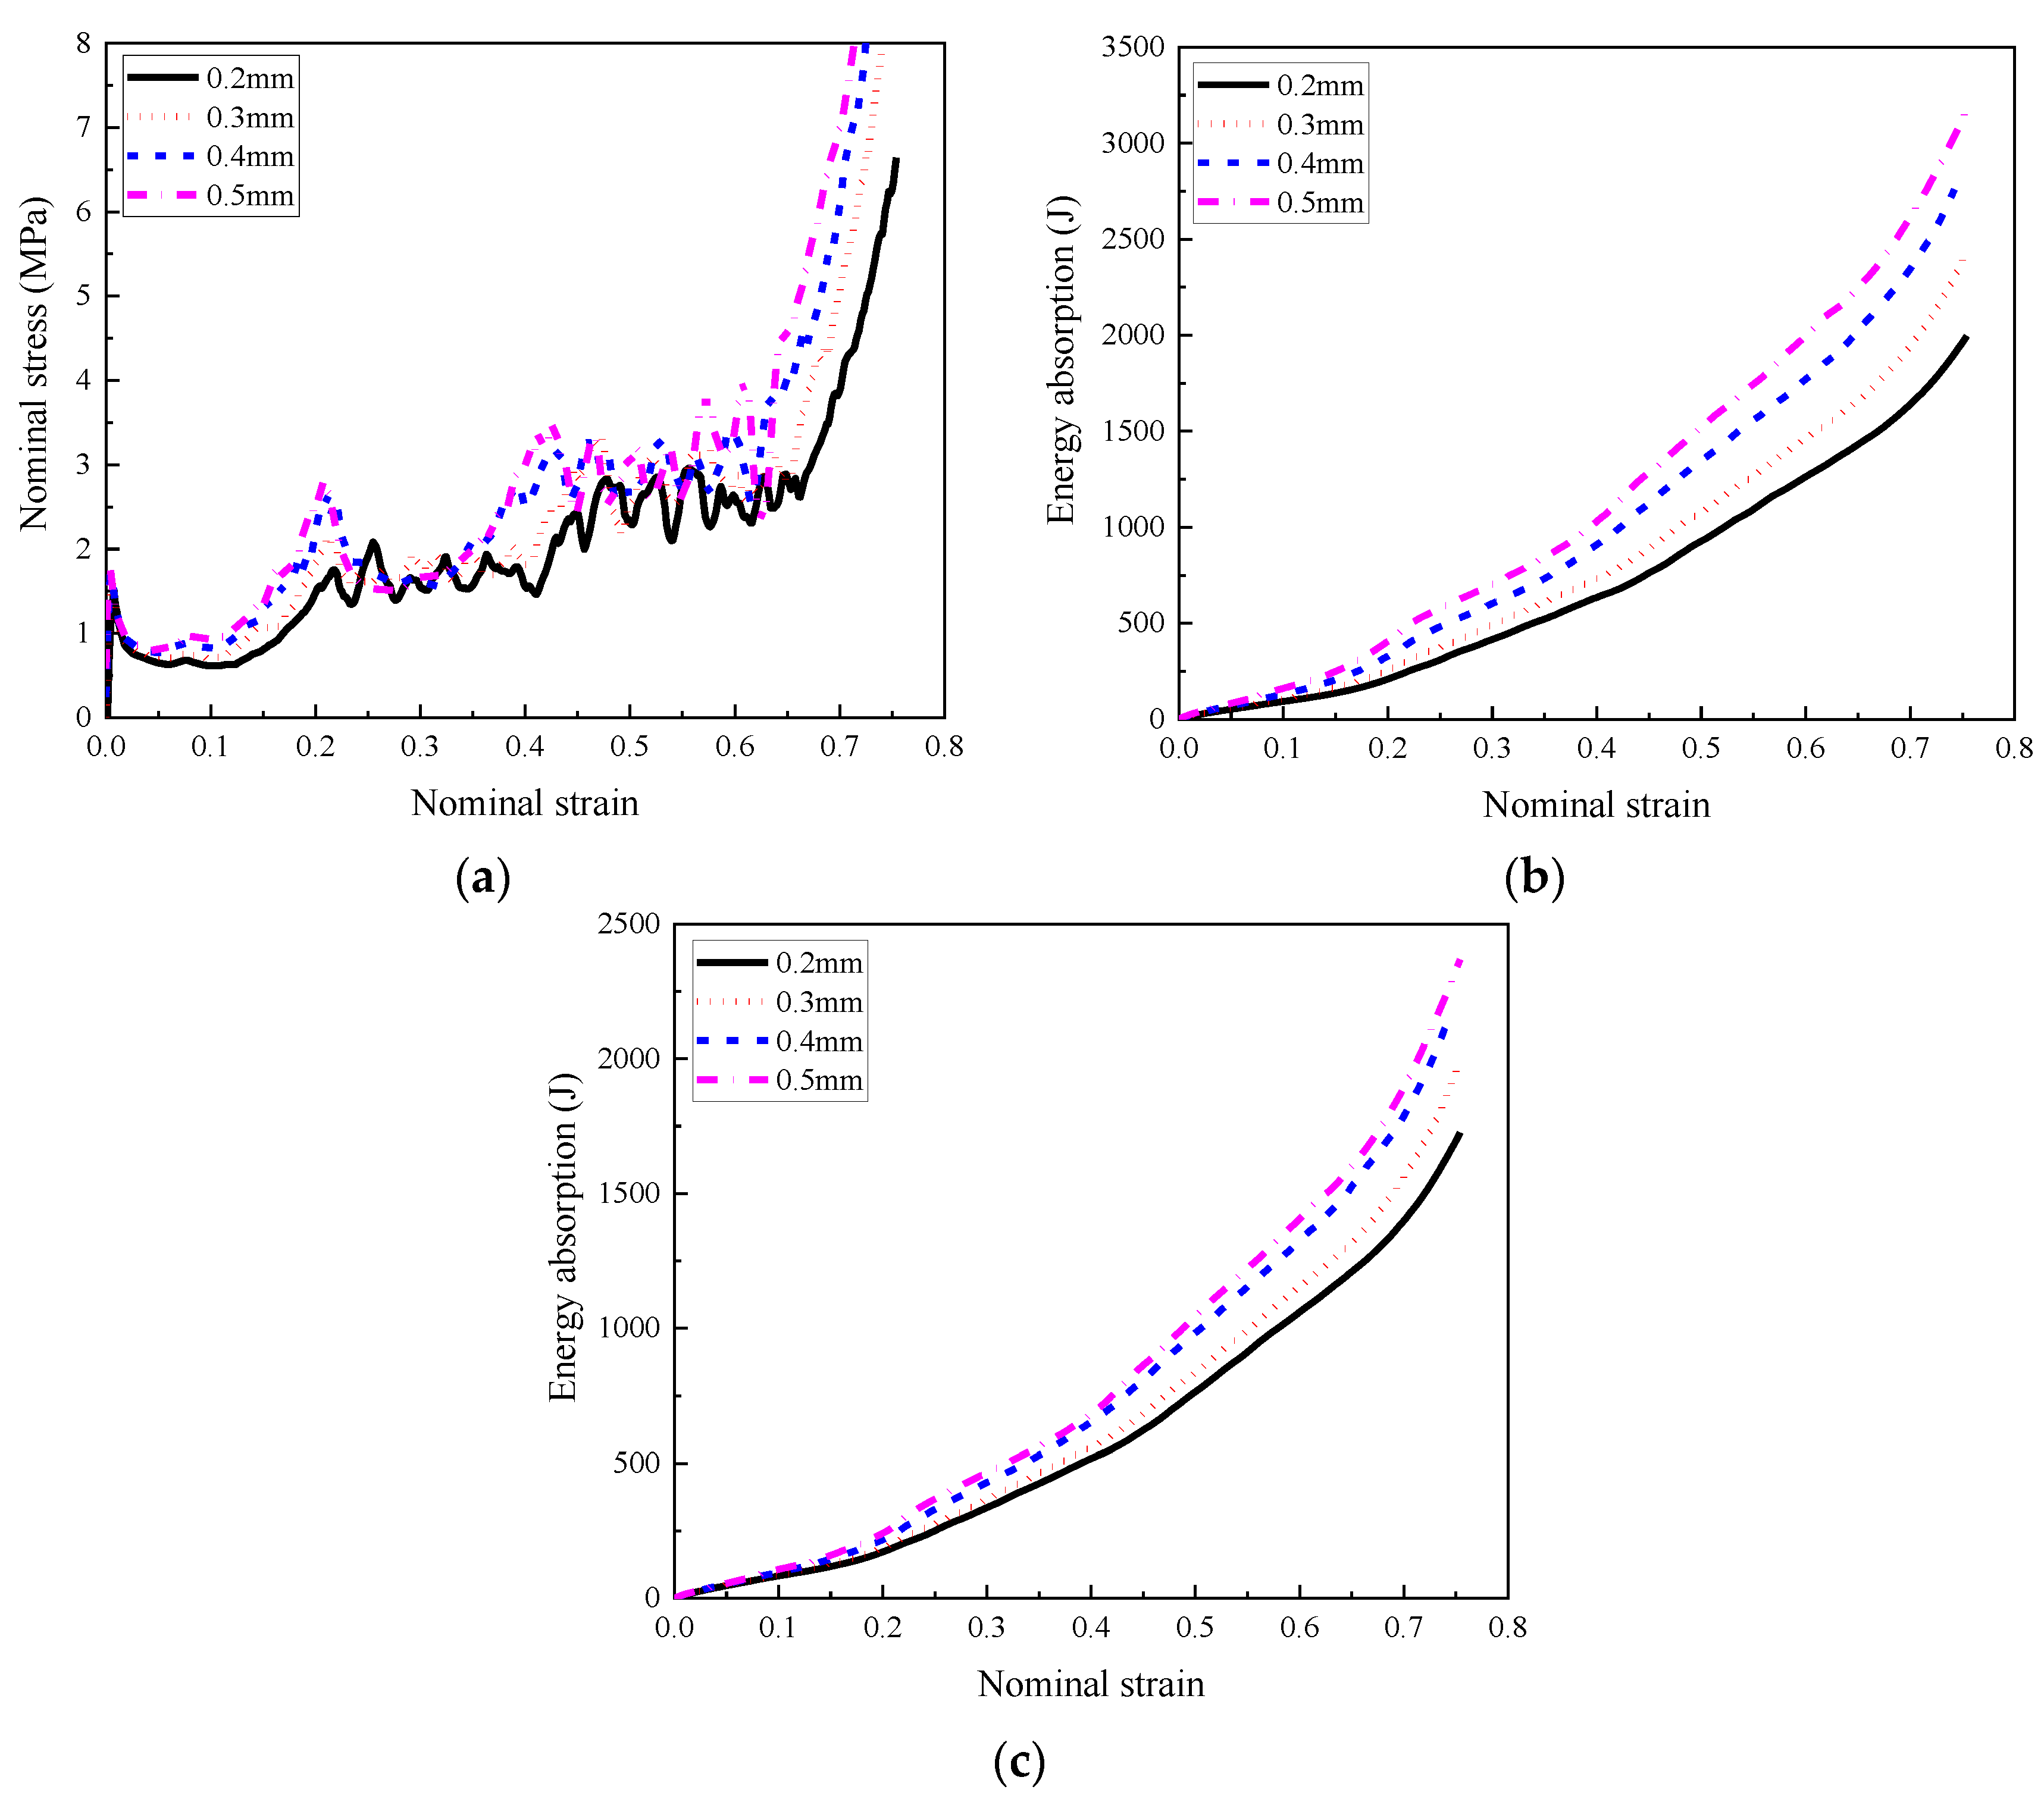
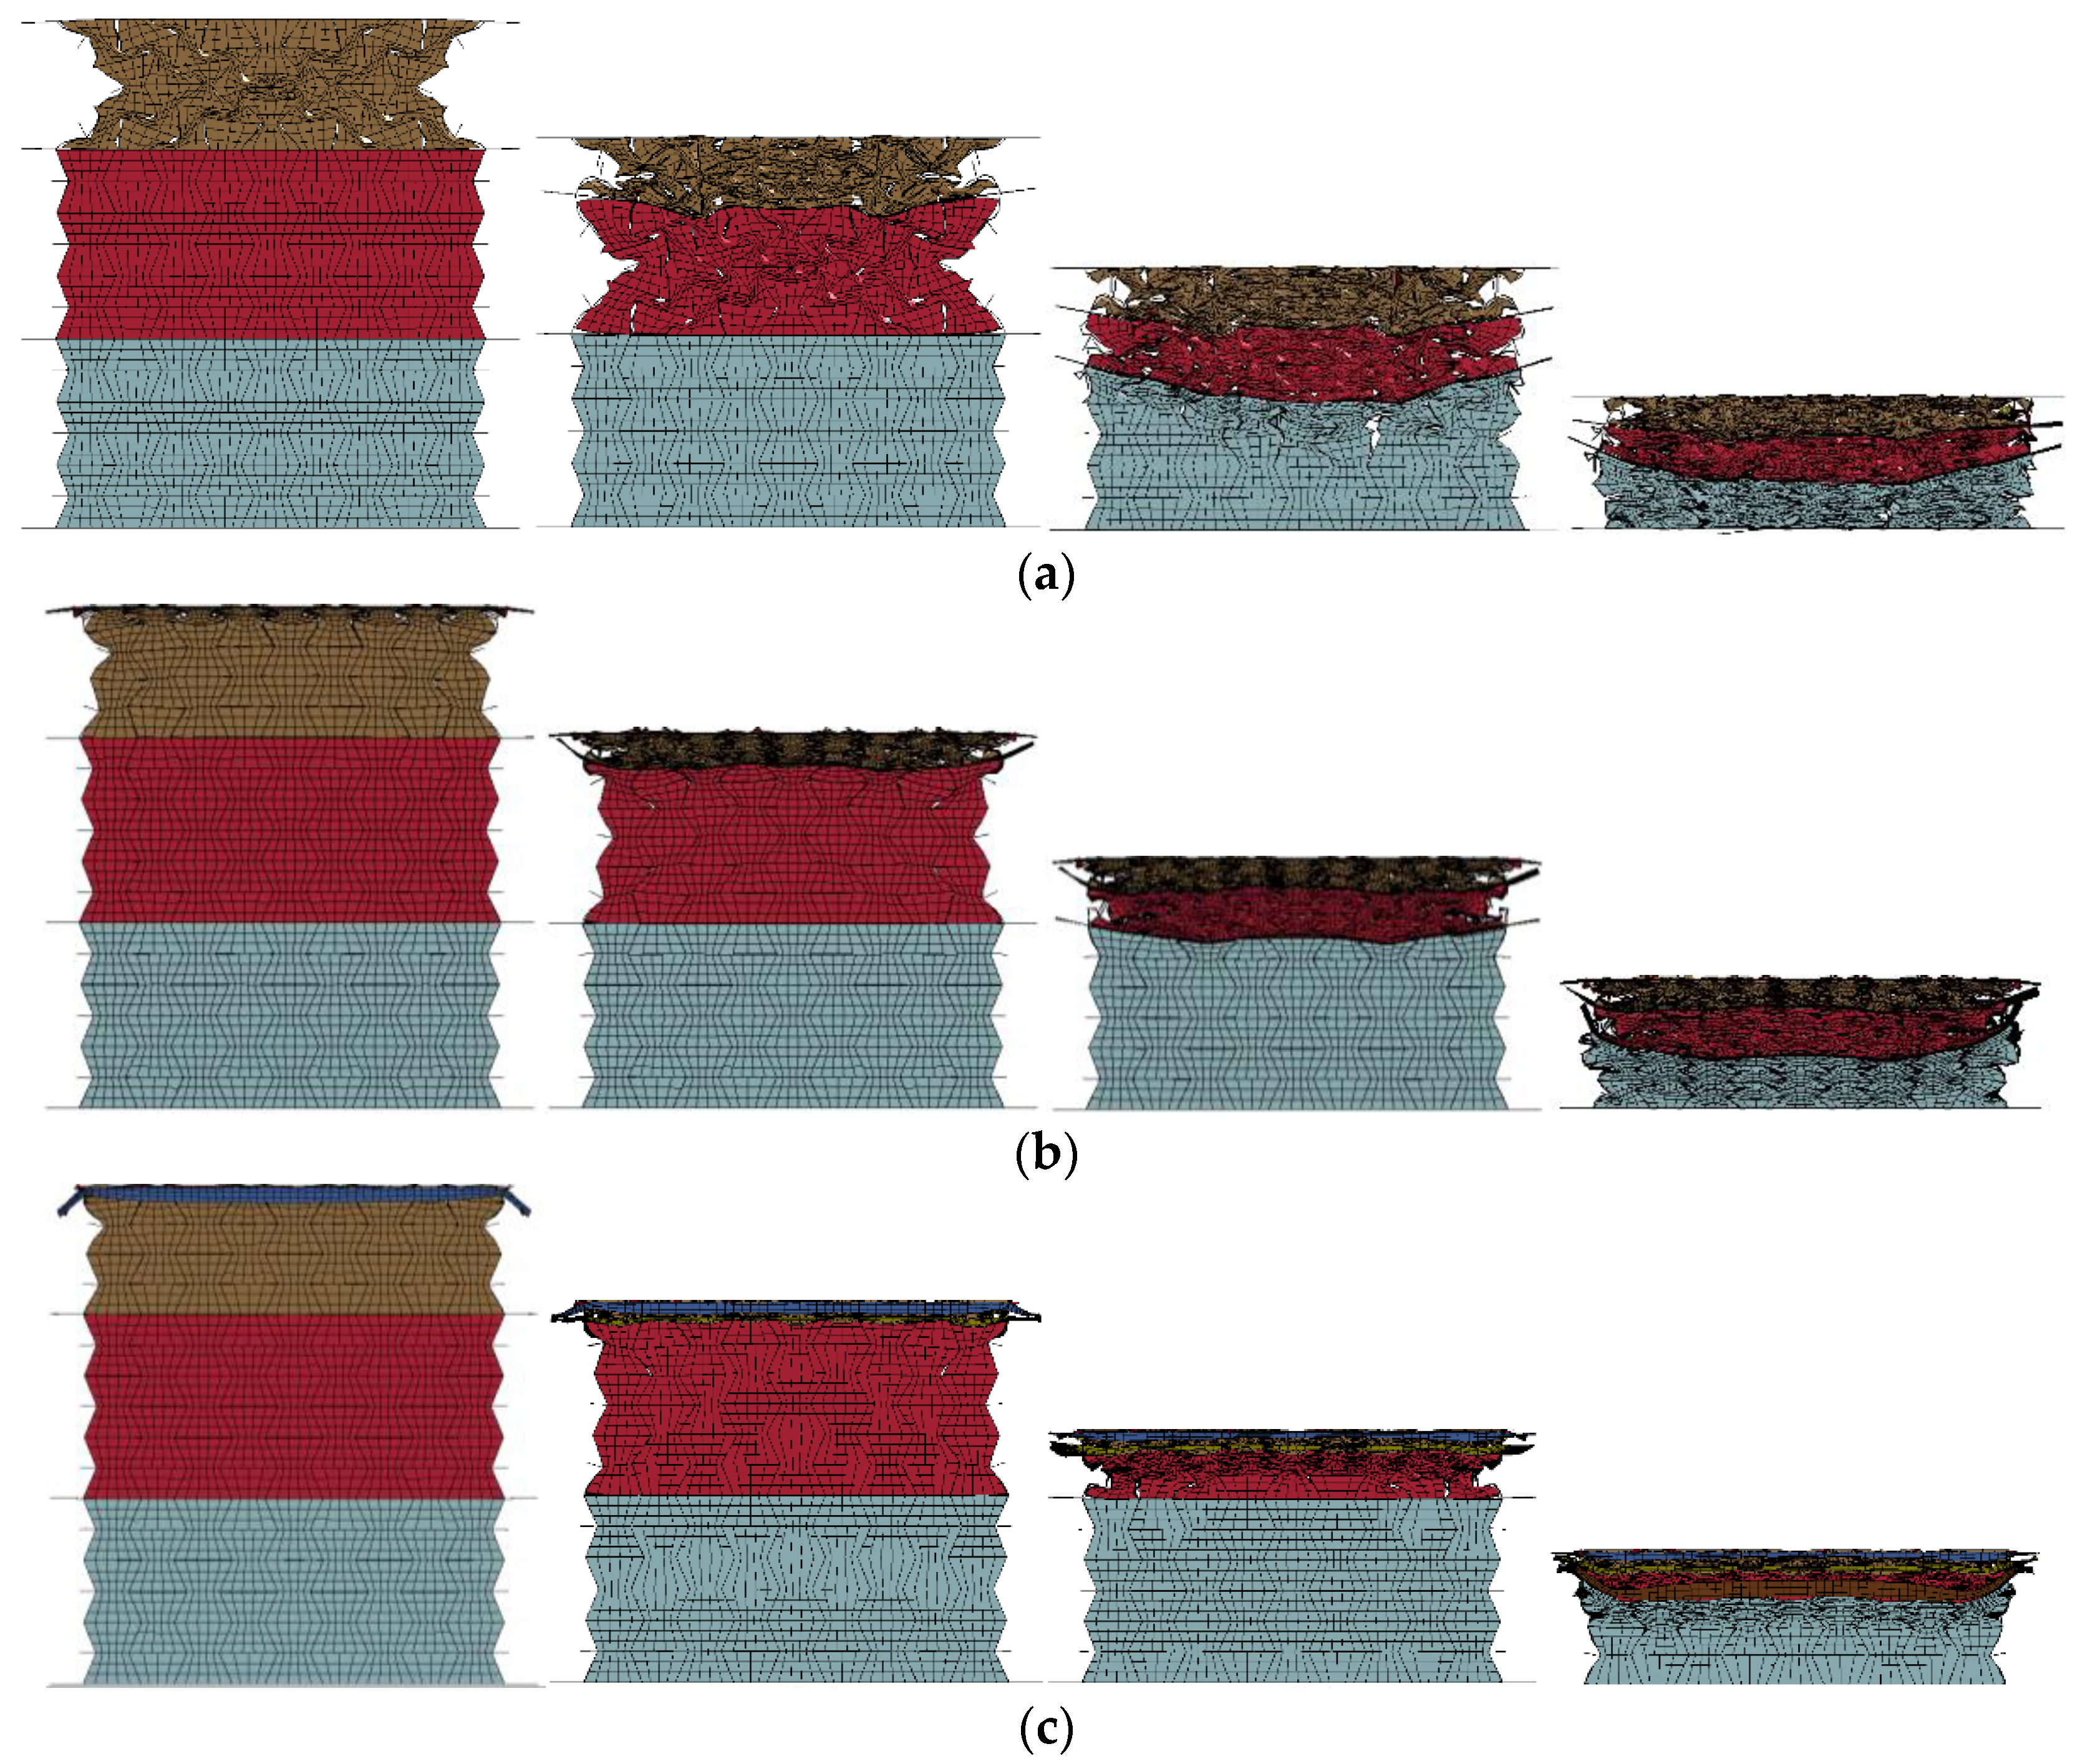
4.1. Influence of Cell-Wall Thickness Gradient
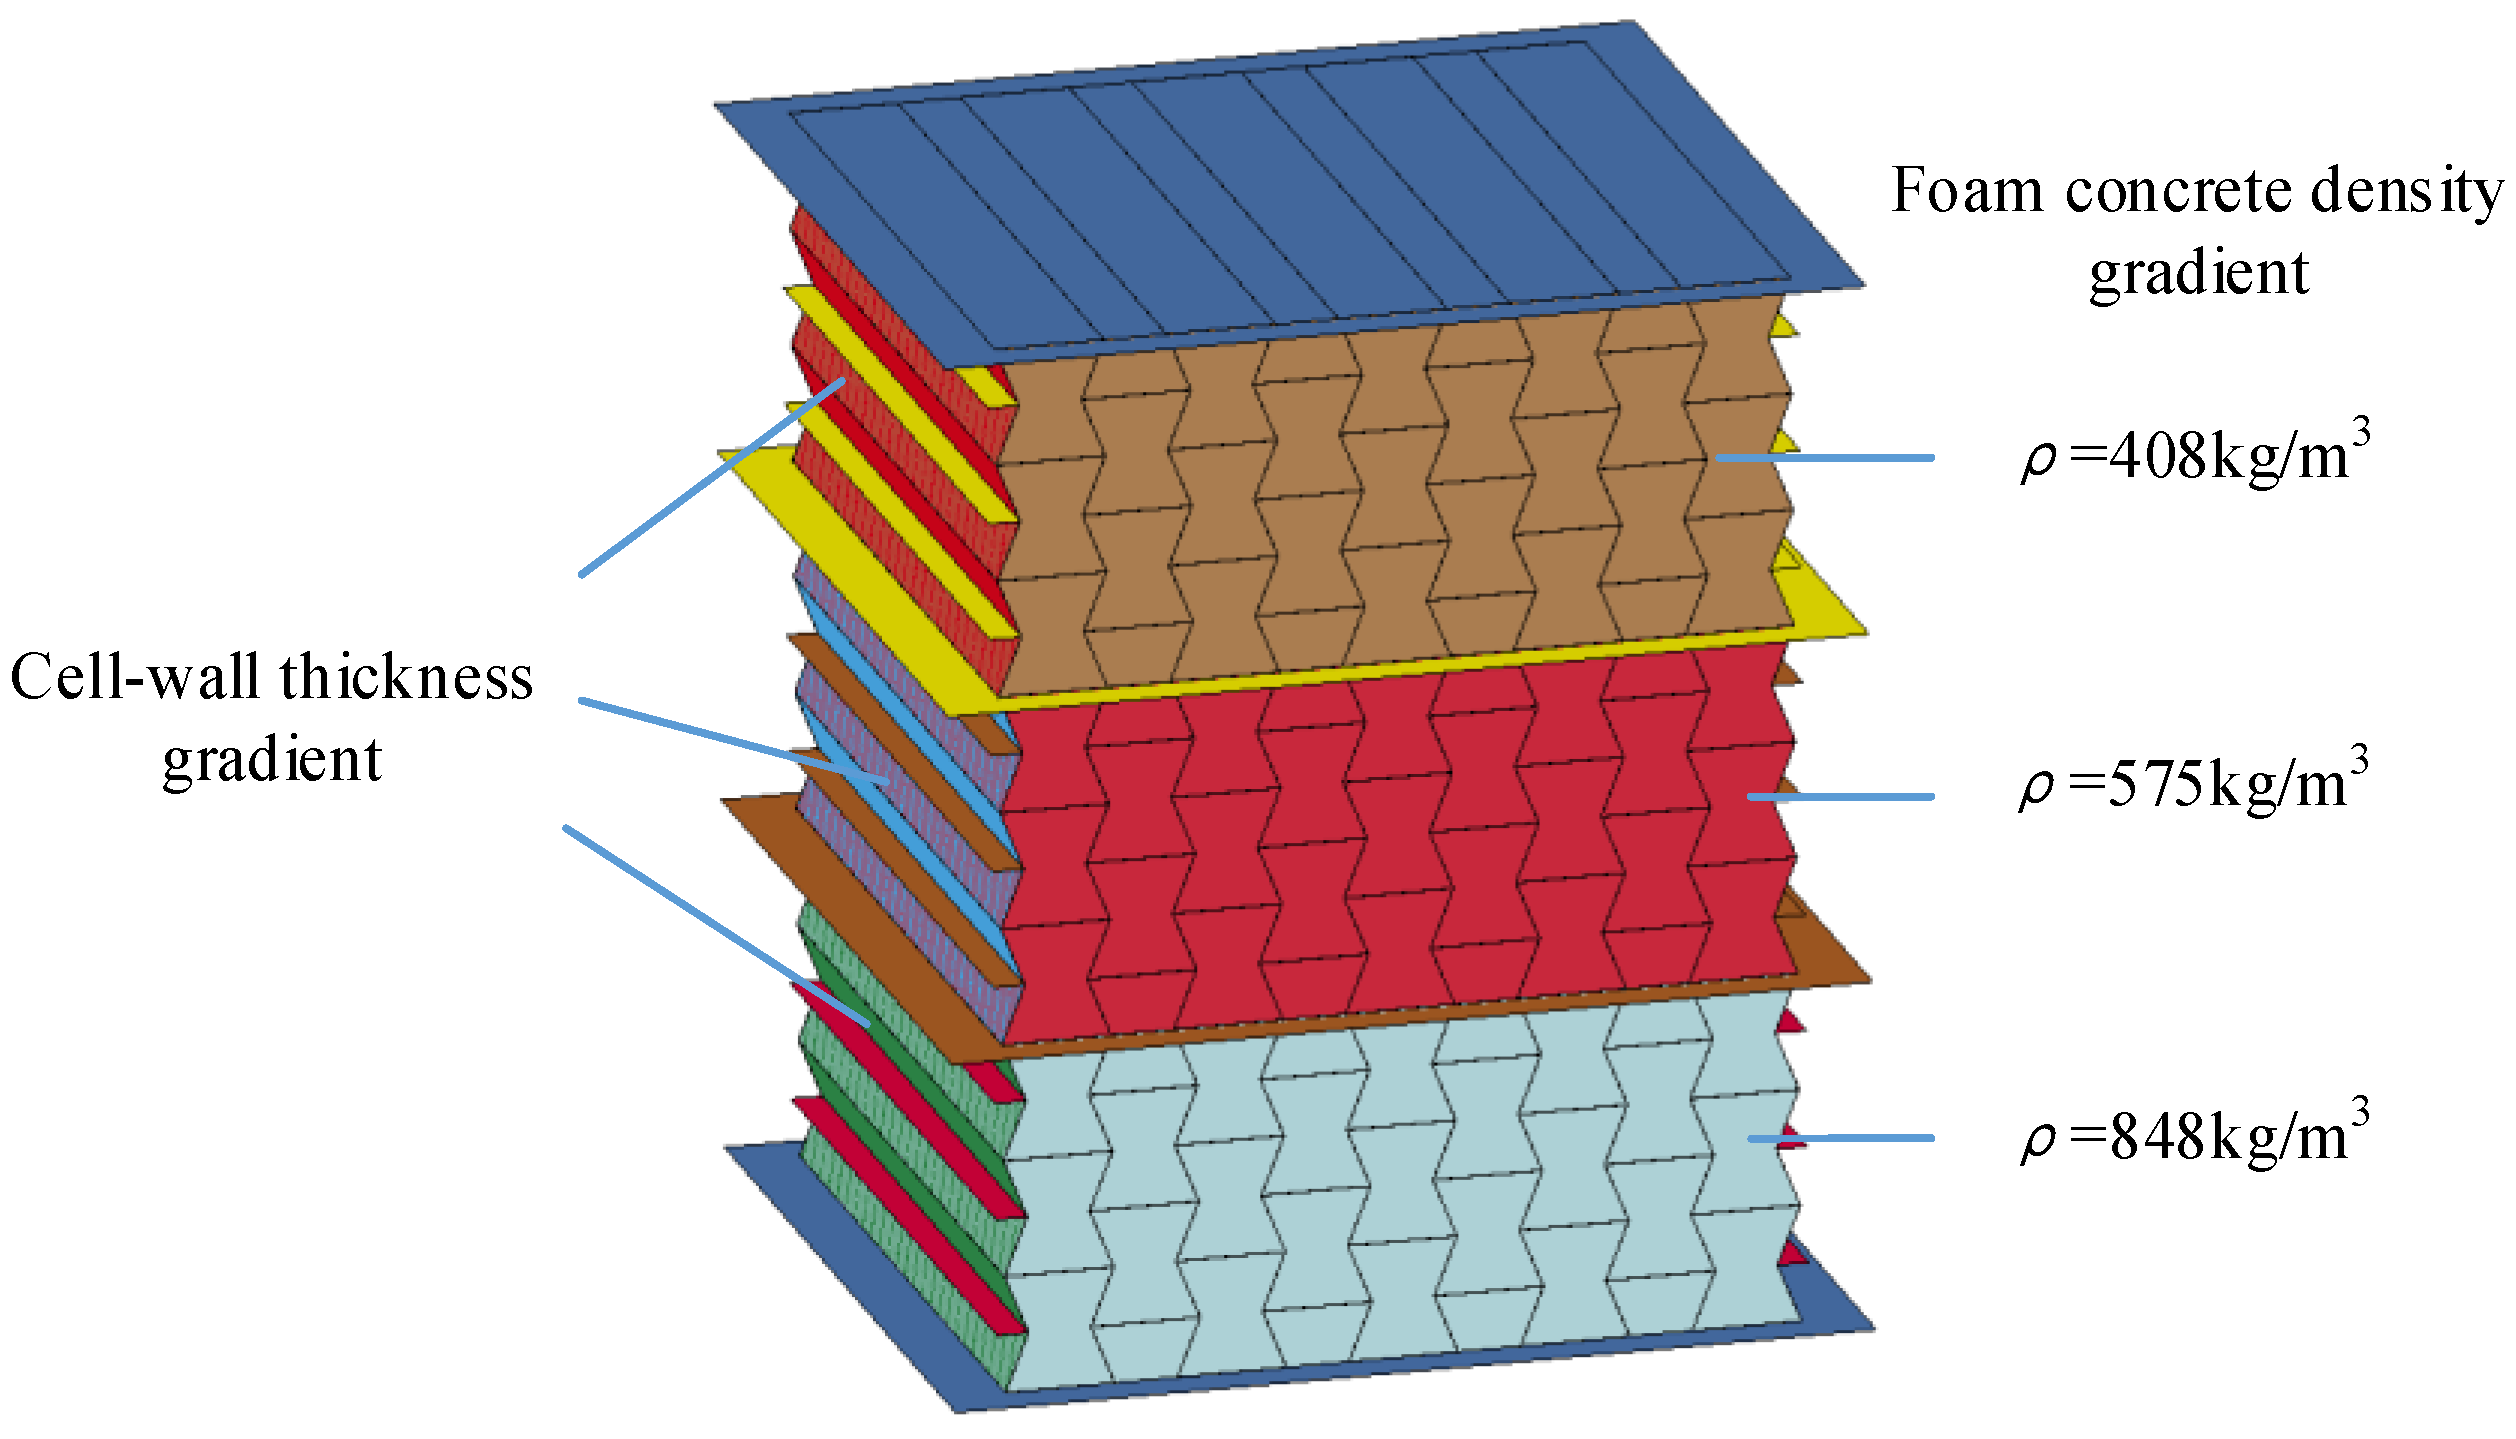
4.2. Influence of Foam Concrete Density Gradient
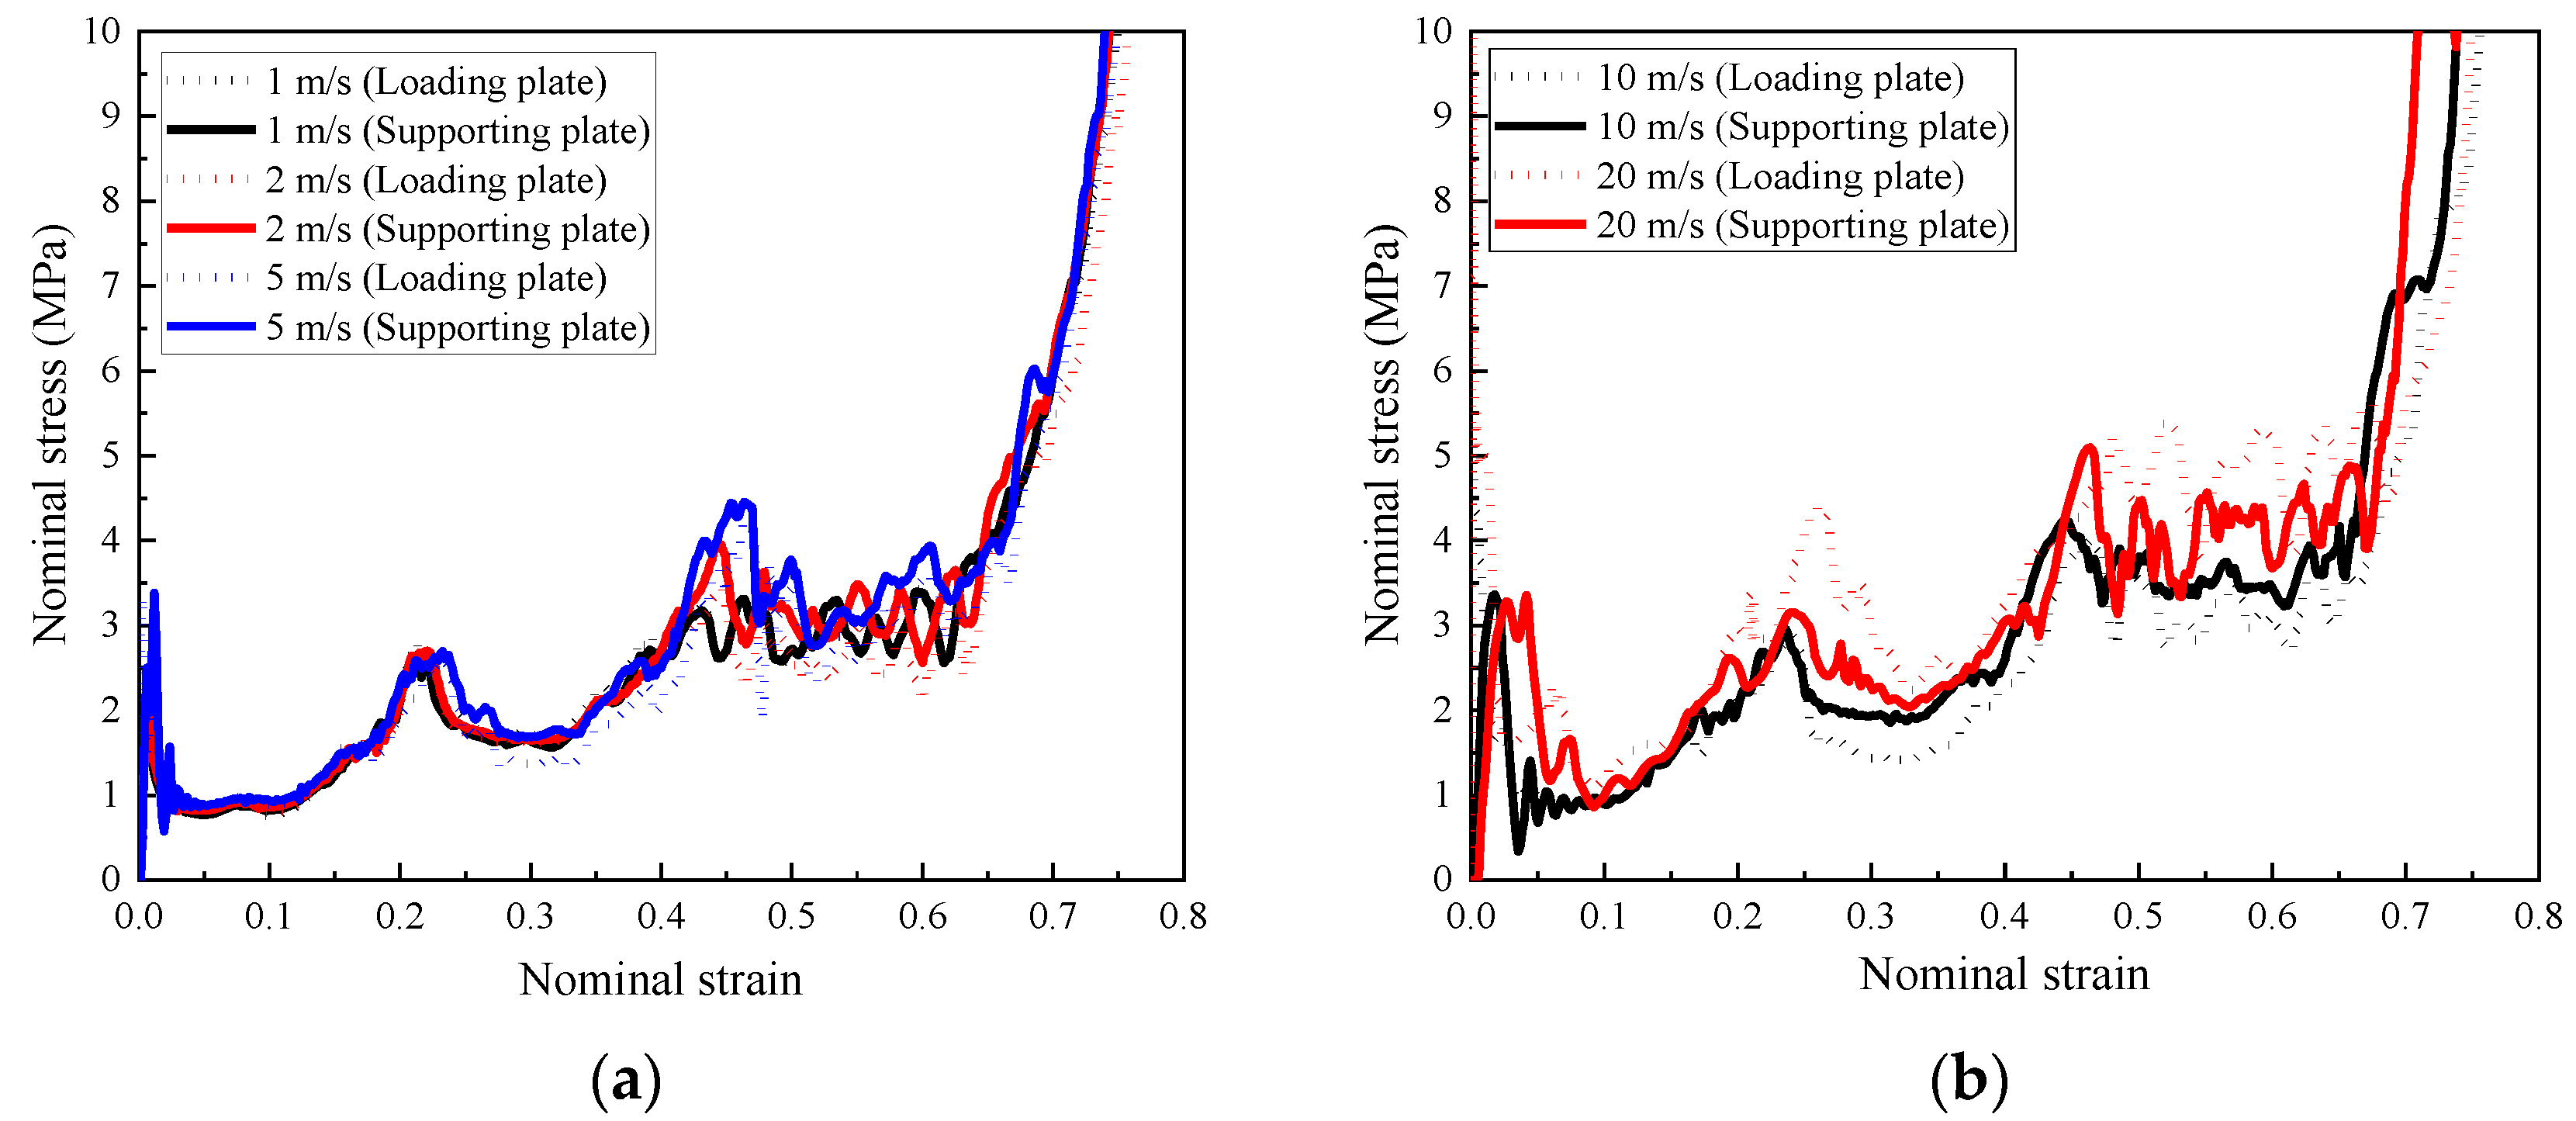
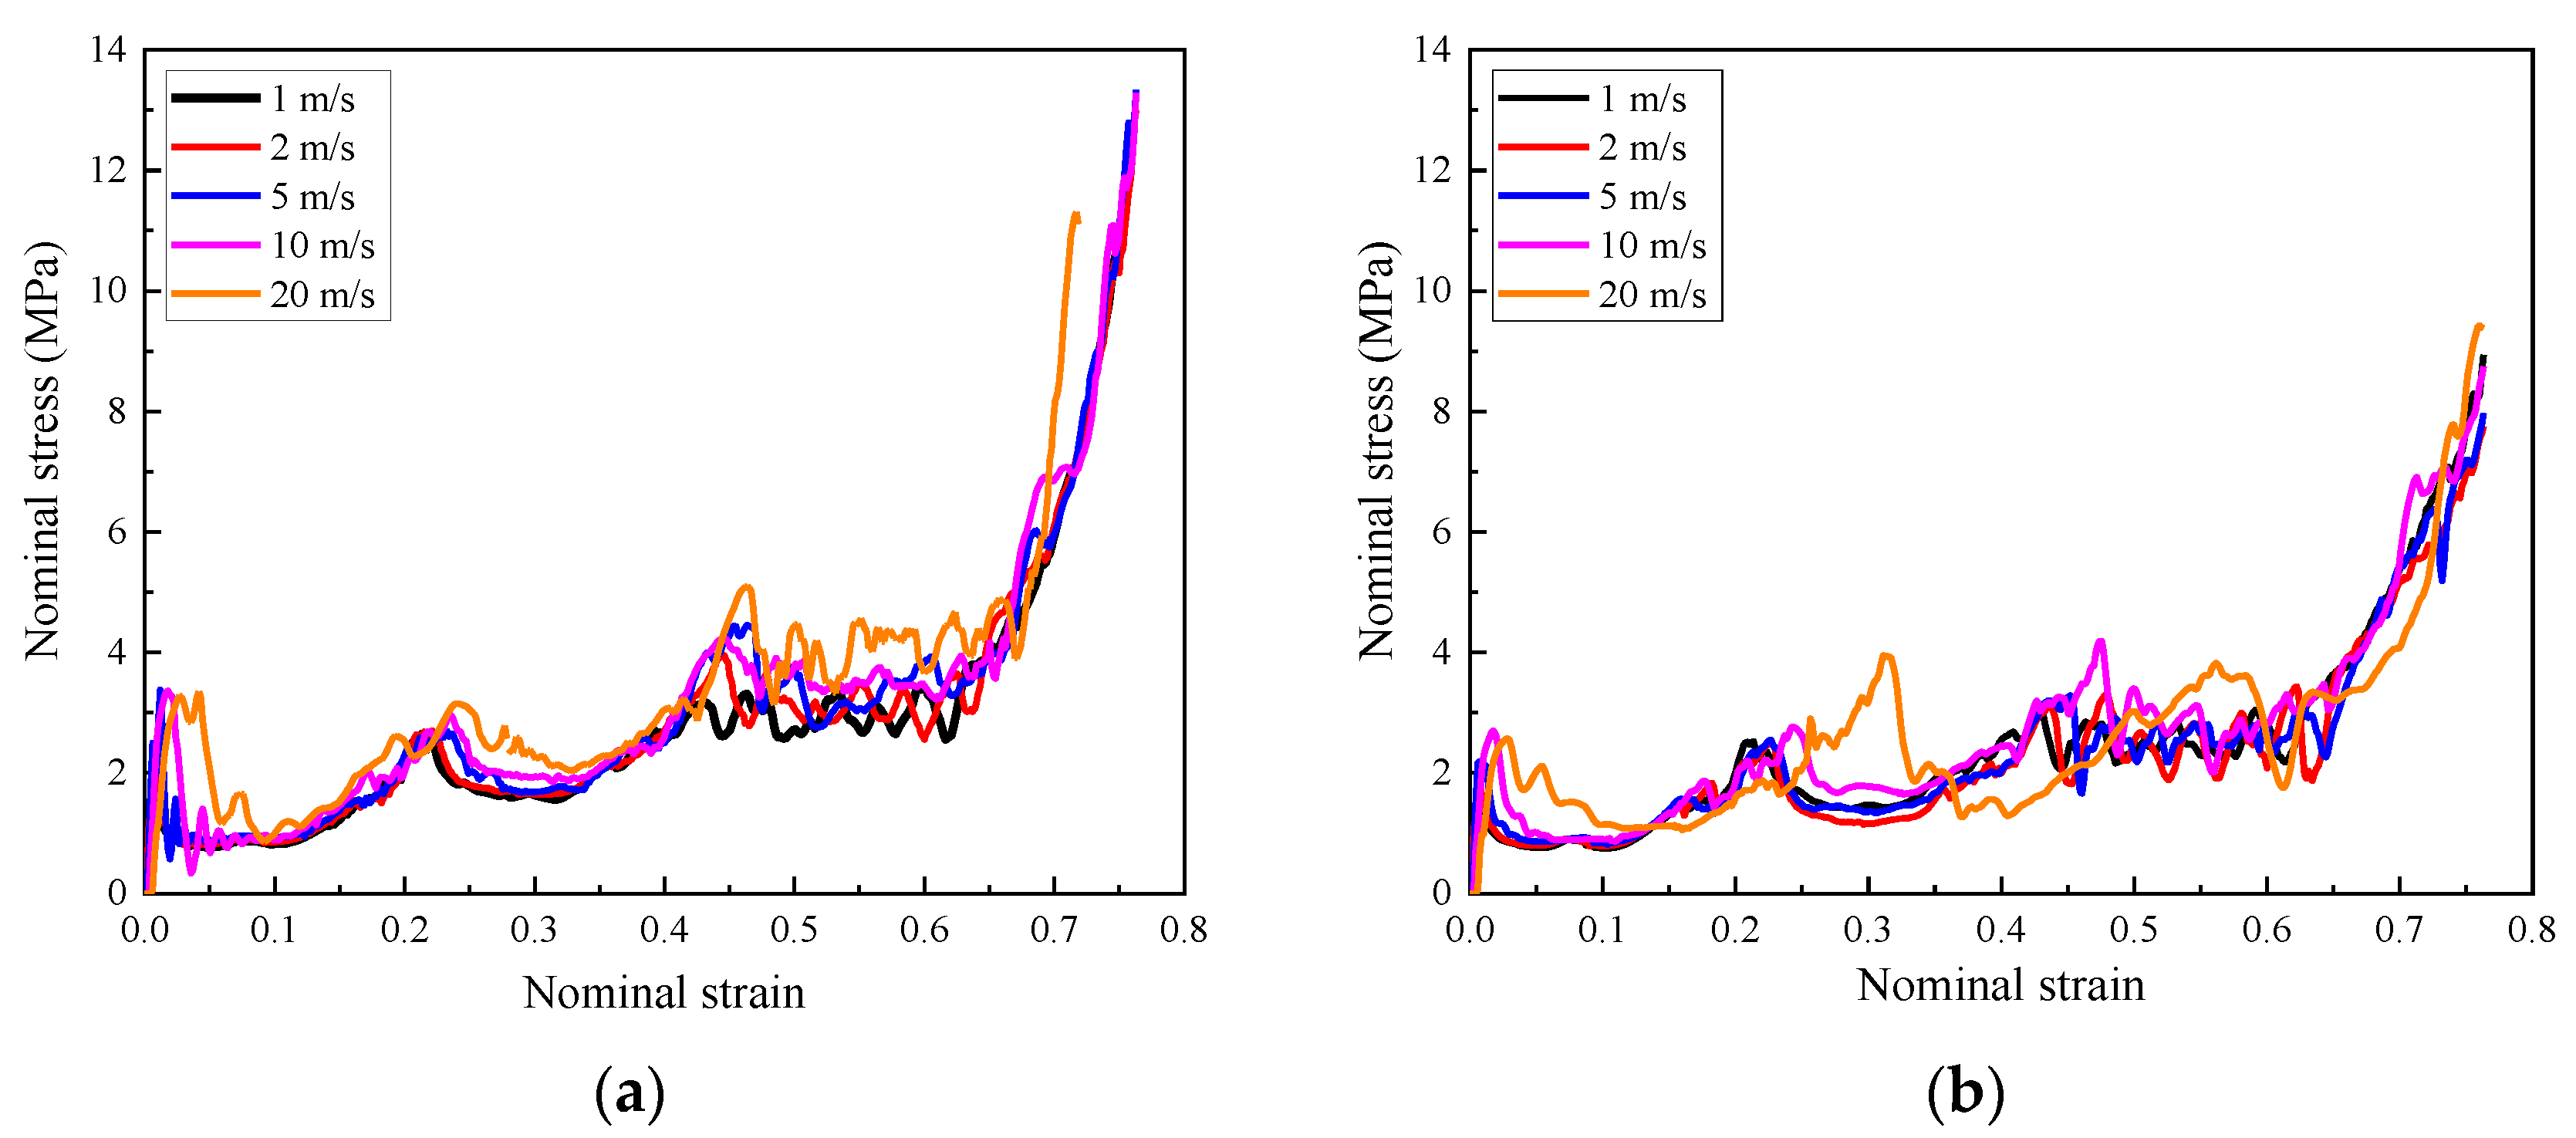
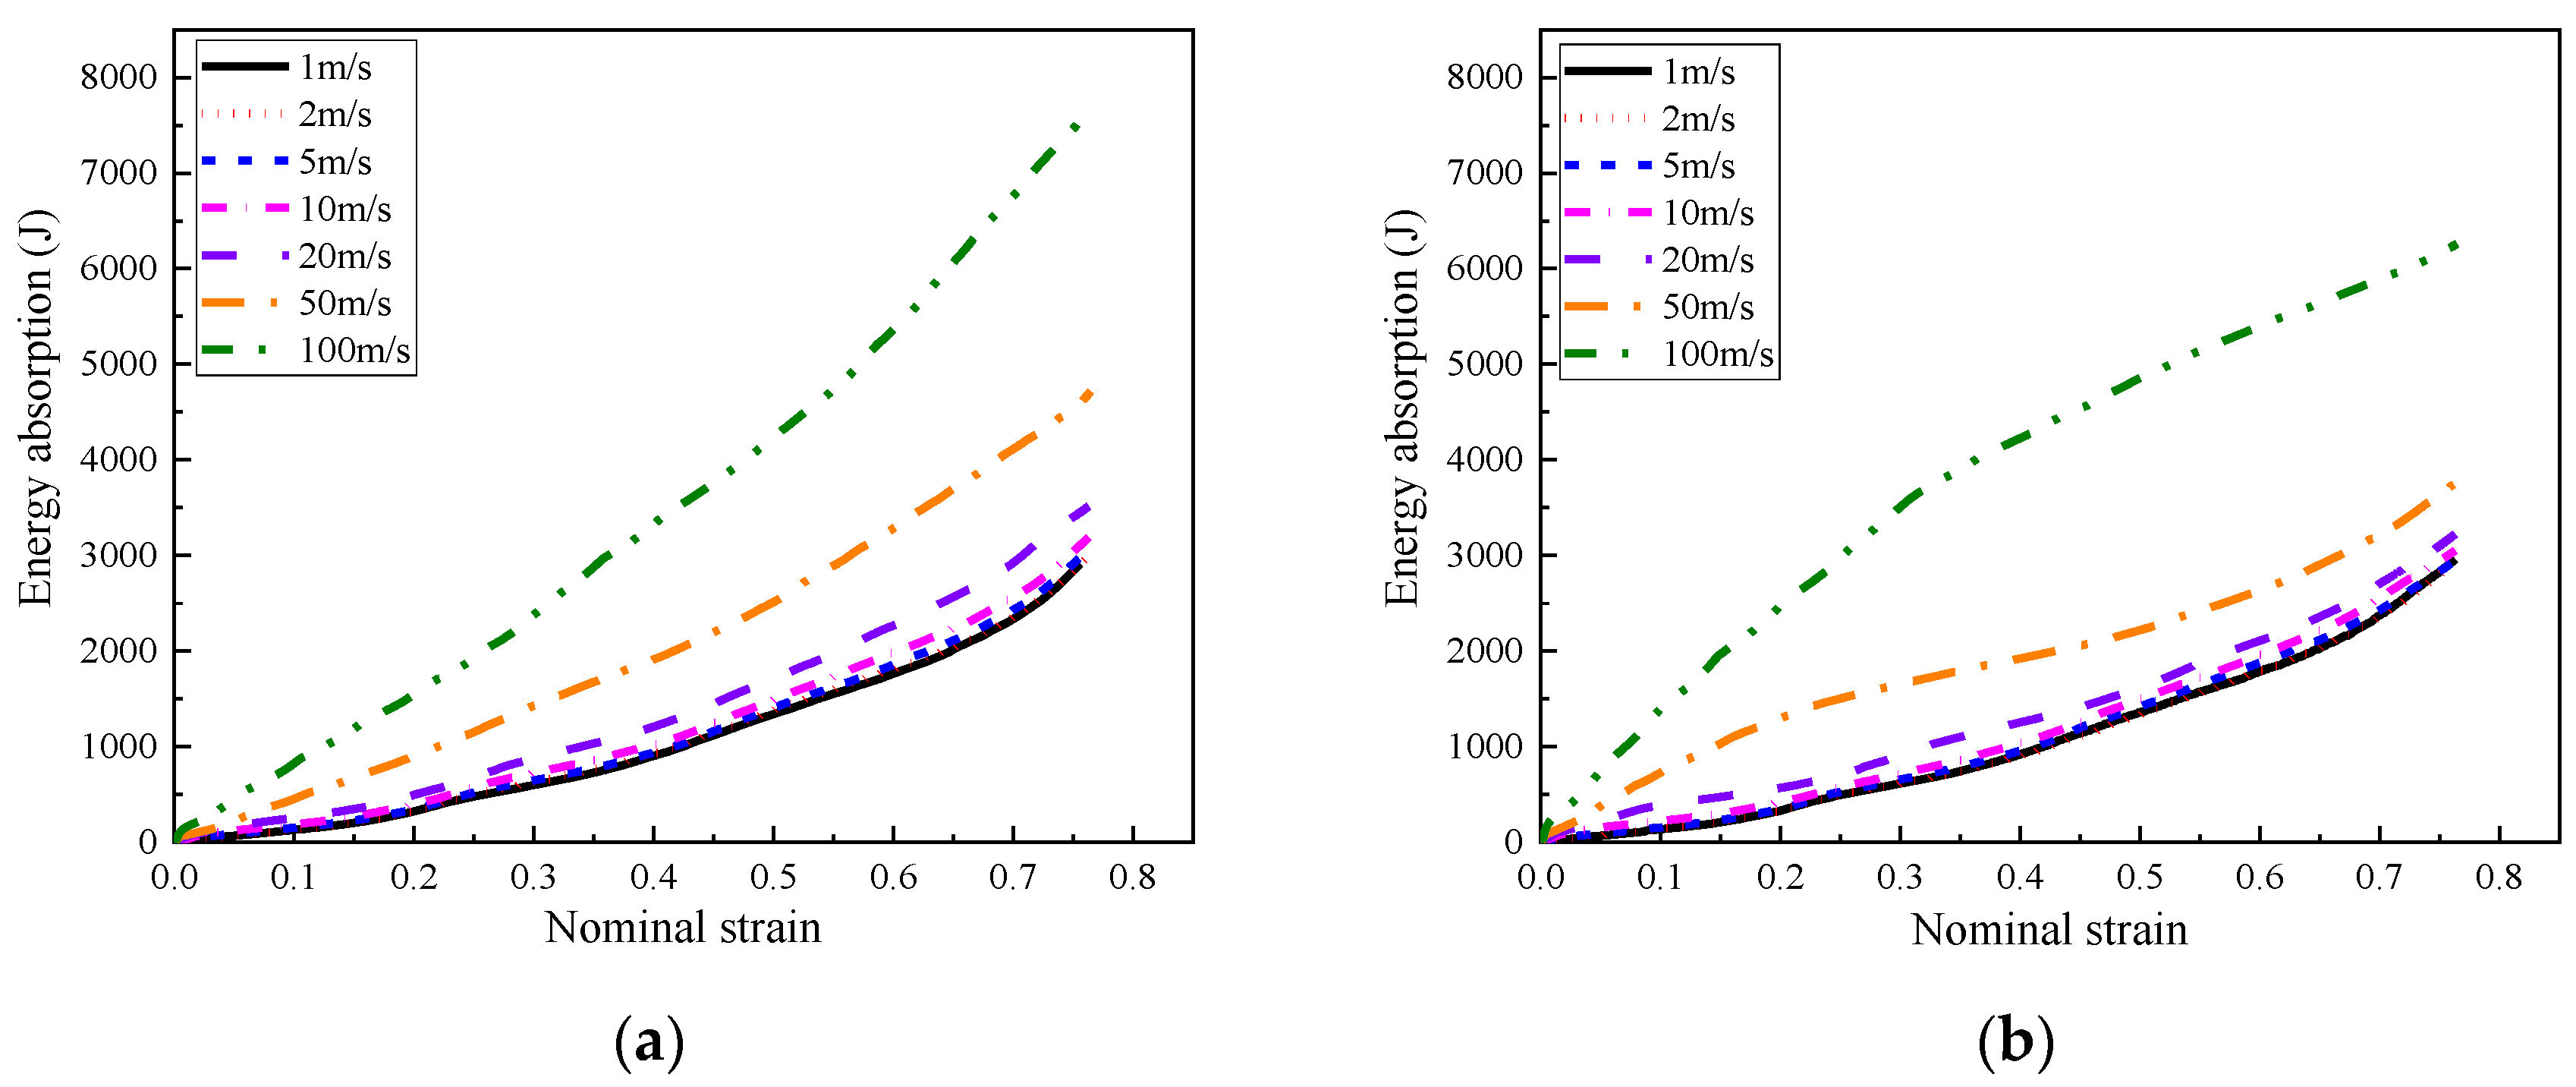
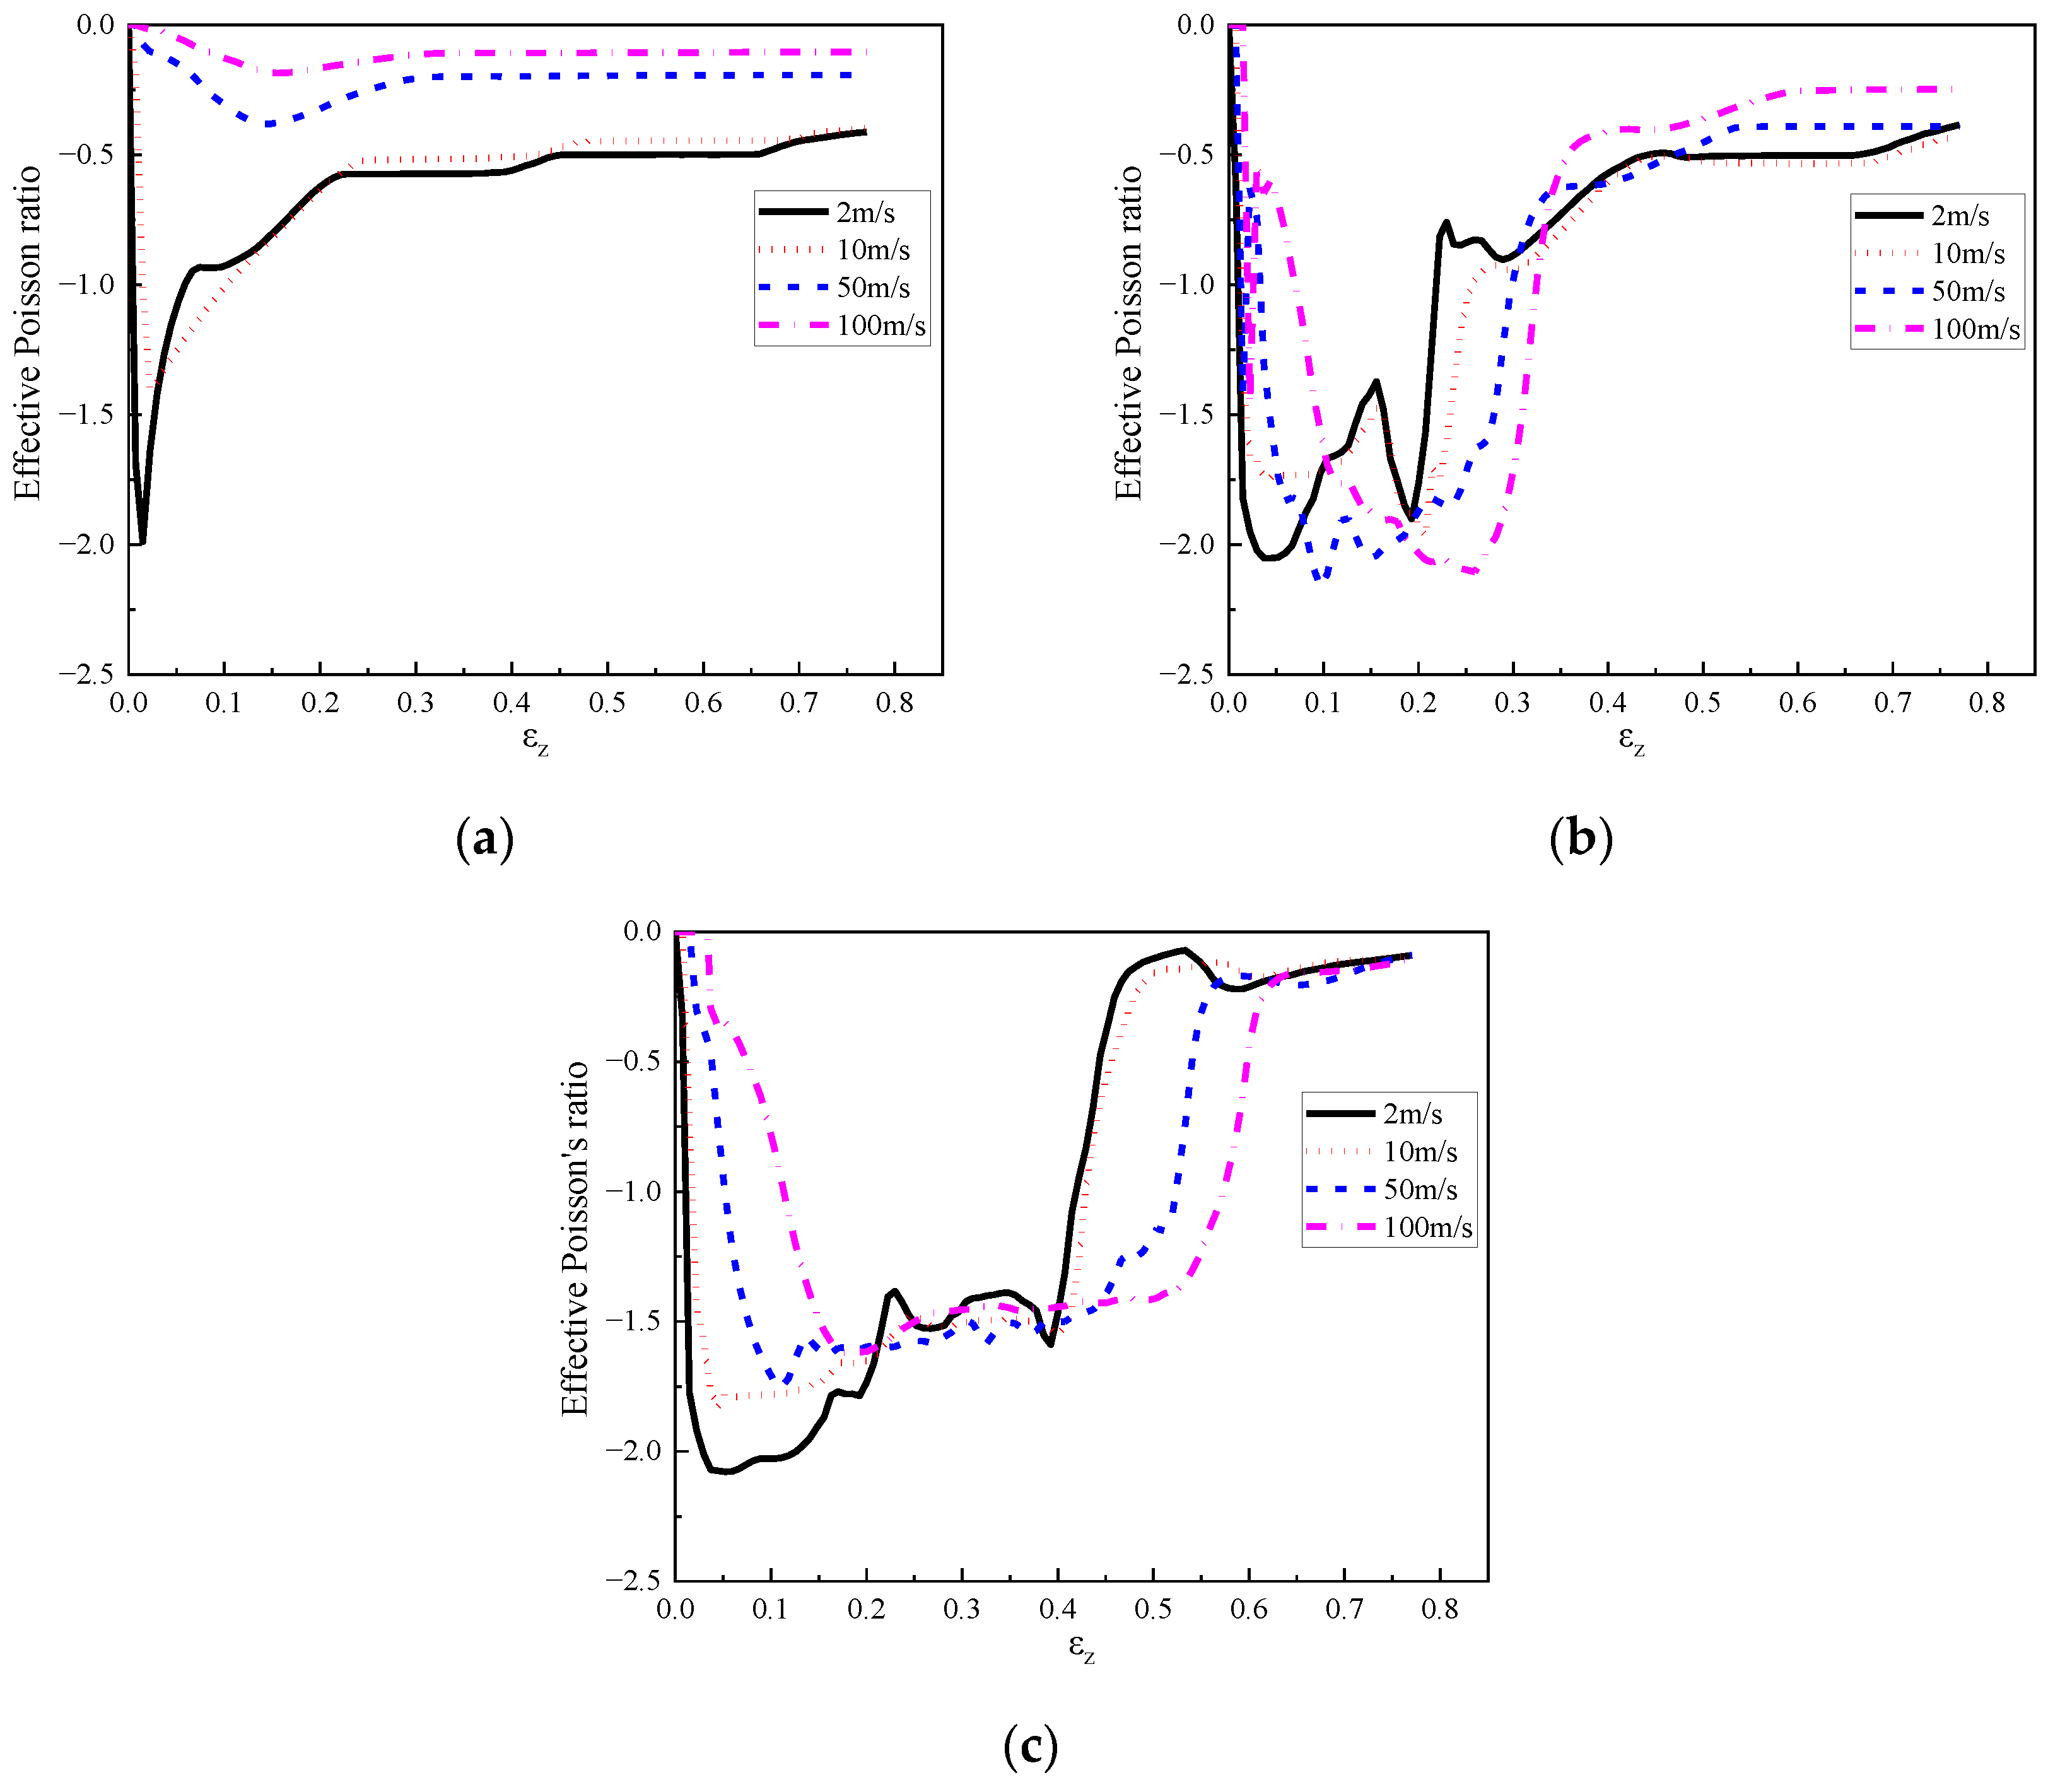
4.3. Influence of Loading Rate
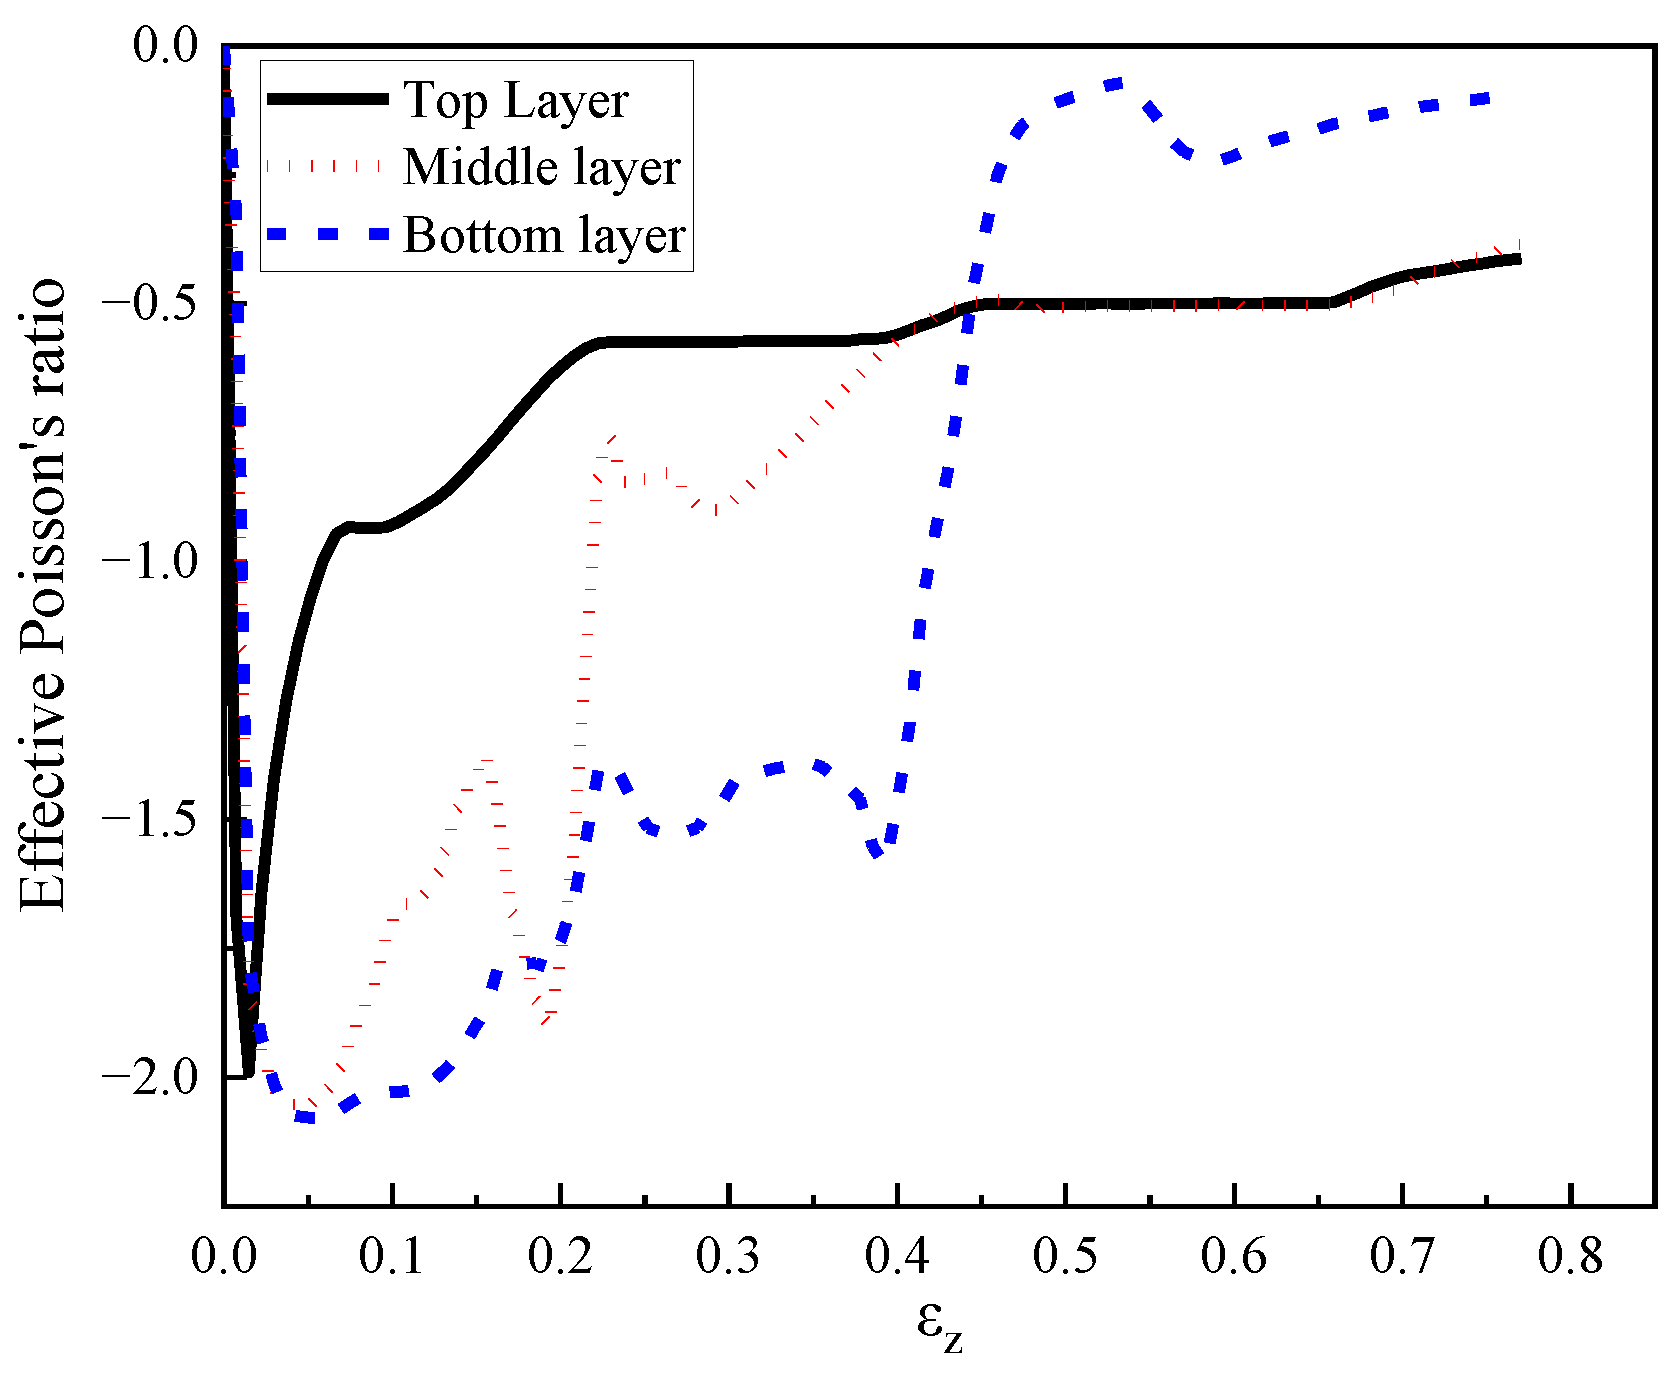
4.4. Effective Poisson’s Ratio
5. Conclusions
- (1)
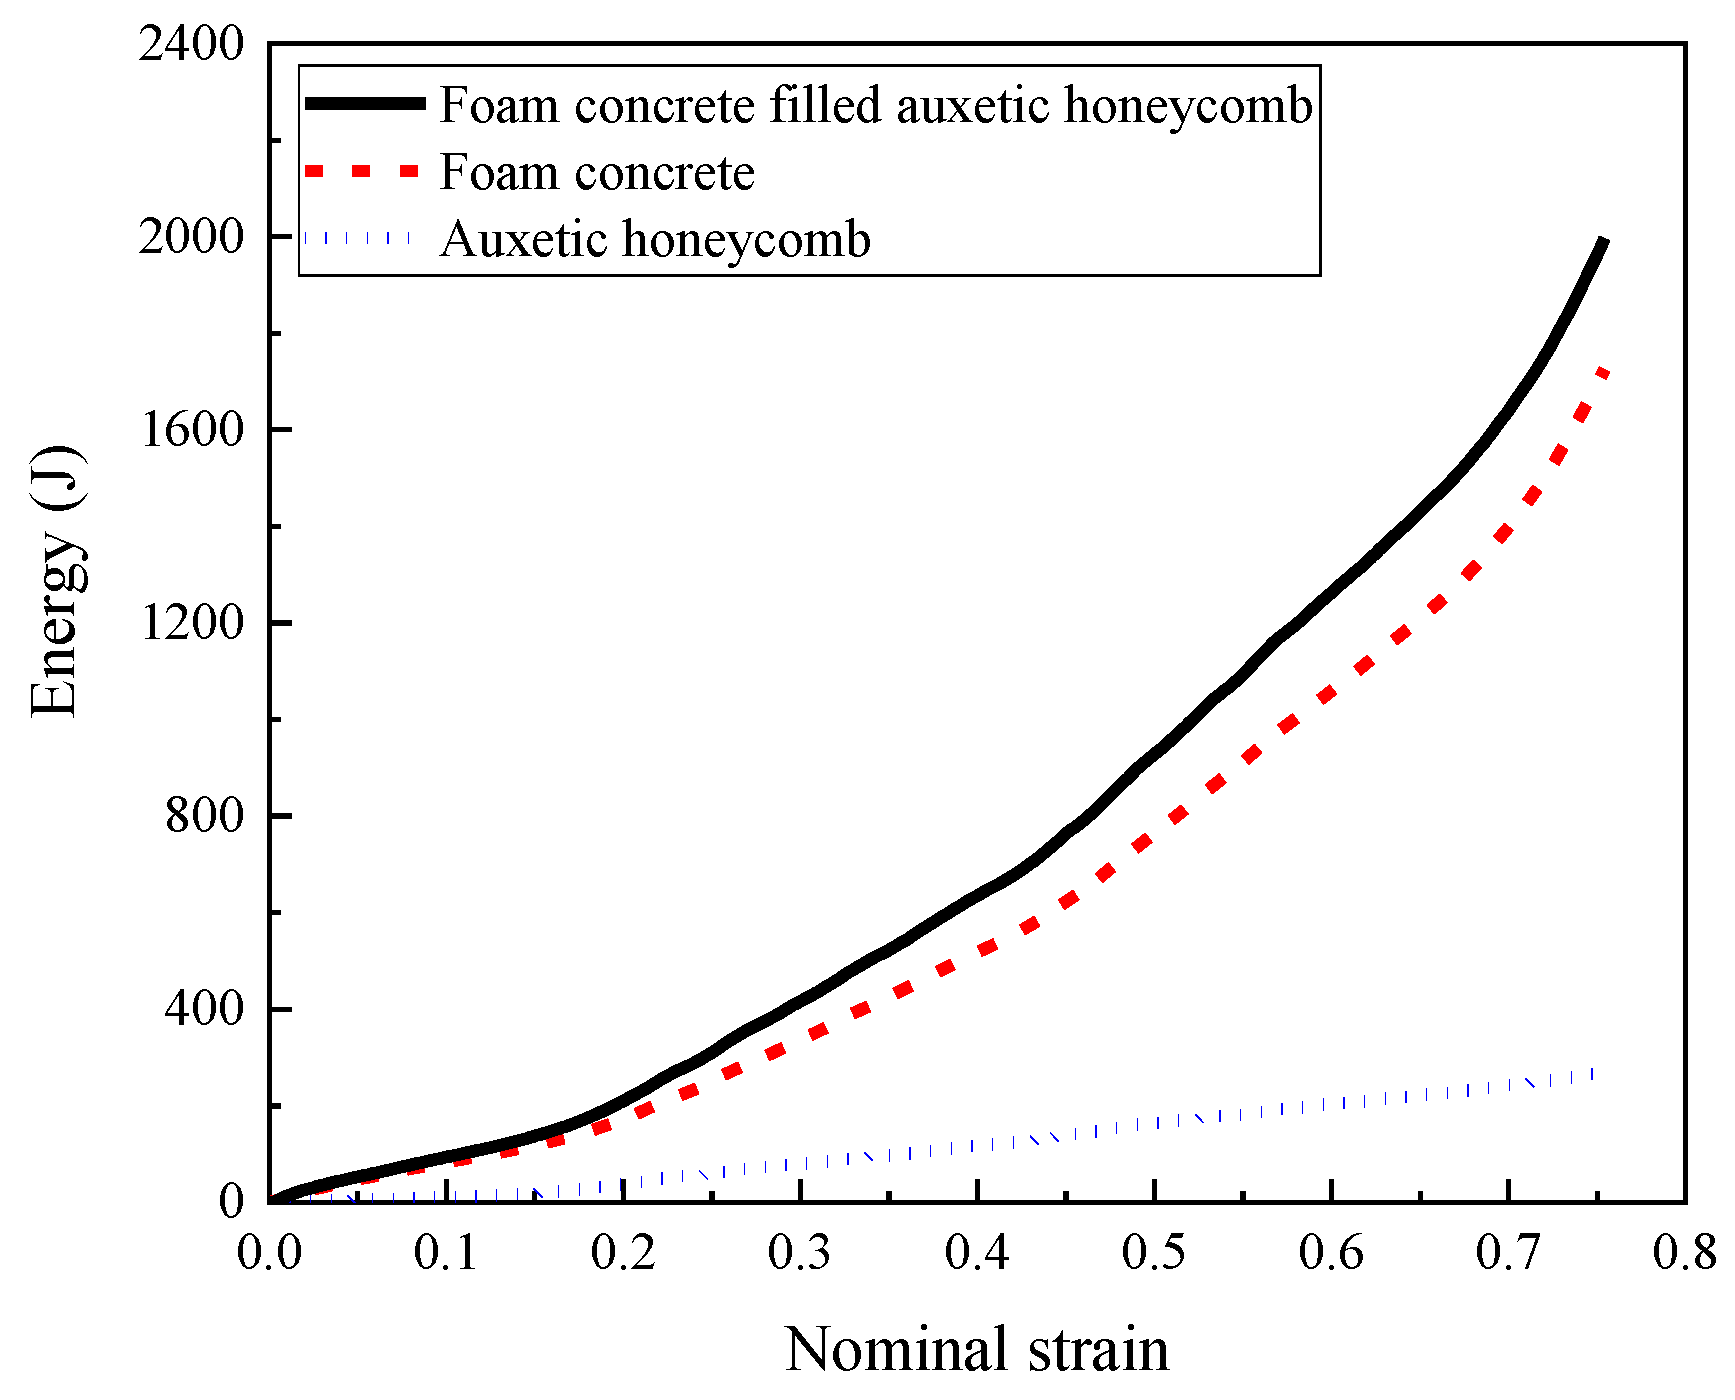
- The composite with cell-wall thickness gradient exhibited layered response mode under low or medium loading rates (1 m/s, and 10 m/s, respectively). Increasing the cell-wall thickness gradient led to a more obvious layer-by-layer compression response, lower initial peak stress, and a more fluctuated stress plateau. Compared with the homogenous cell-wall thickness counterpart, the improvement of the energy absorption of the composite with cell-wall thickness gradient was minor, less than 5%.
- (2)
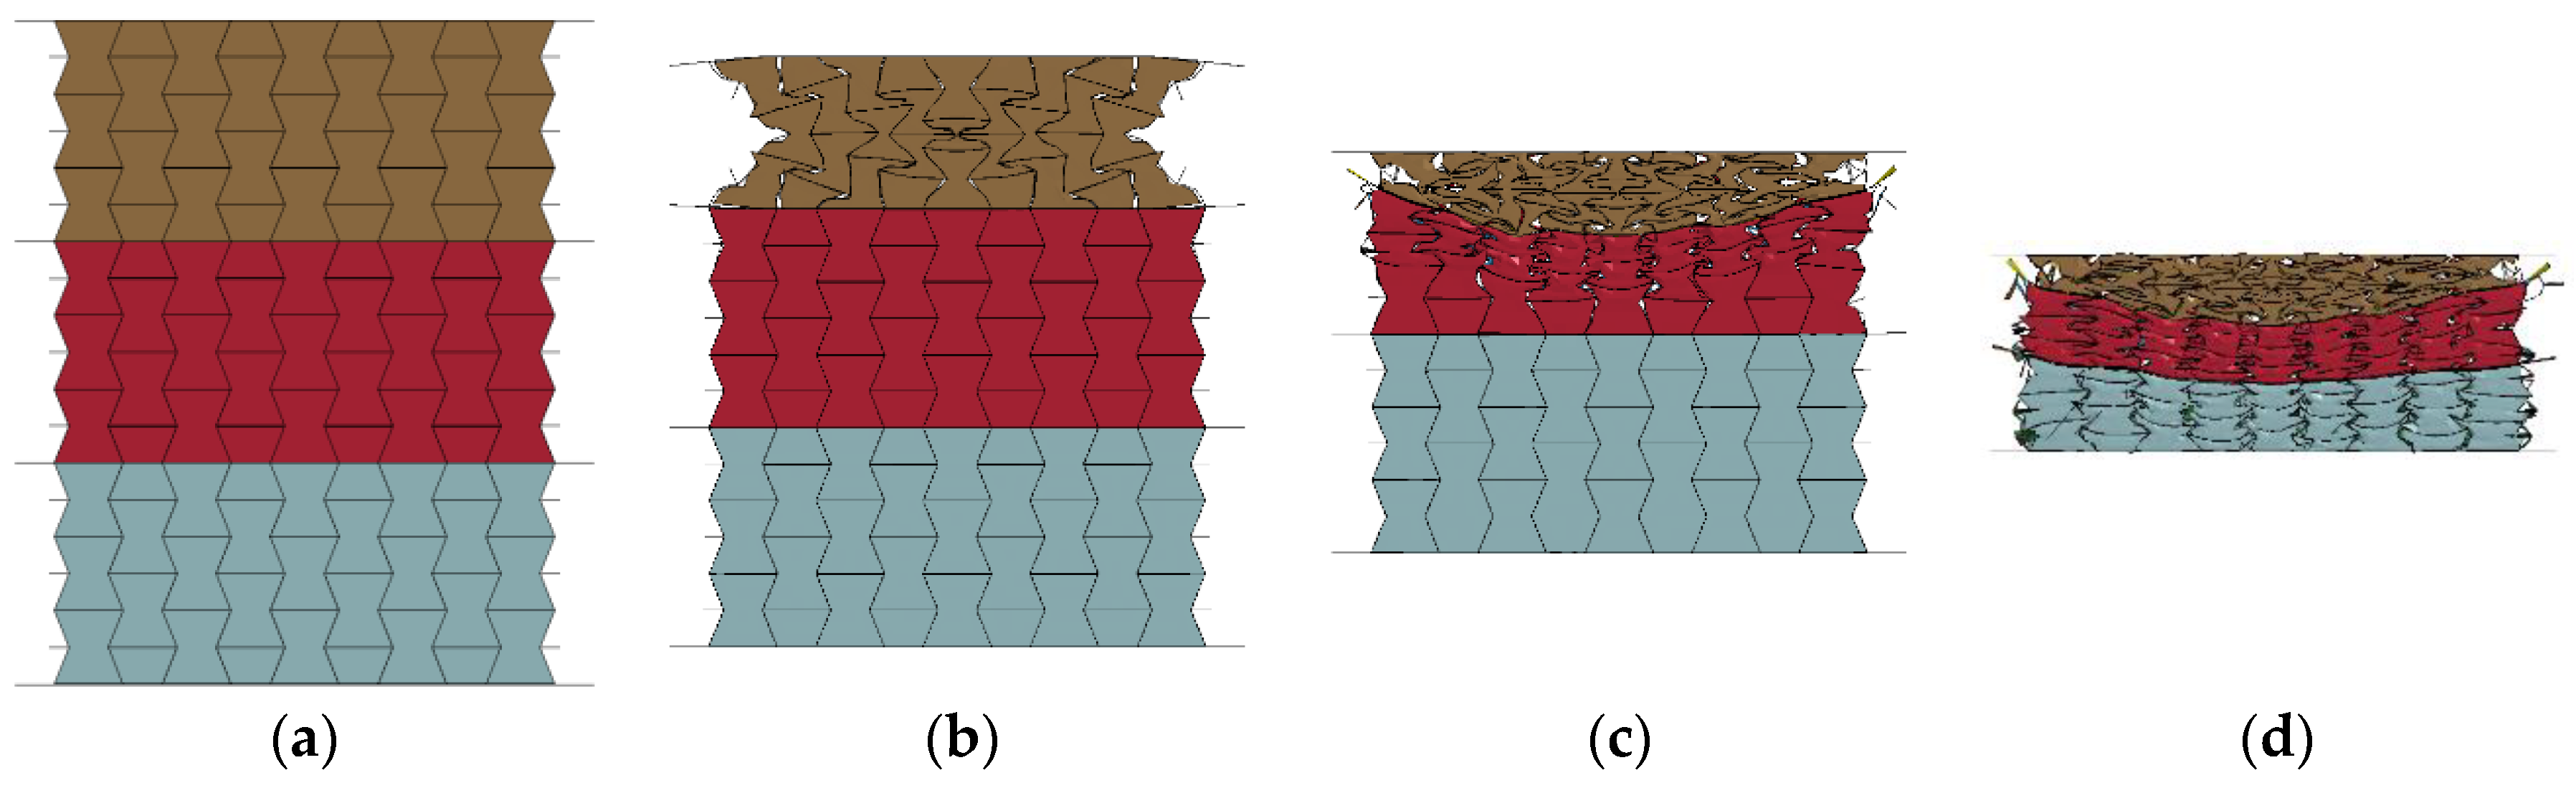
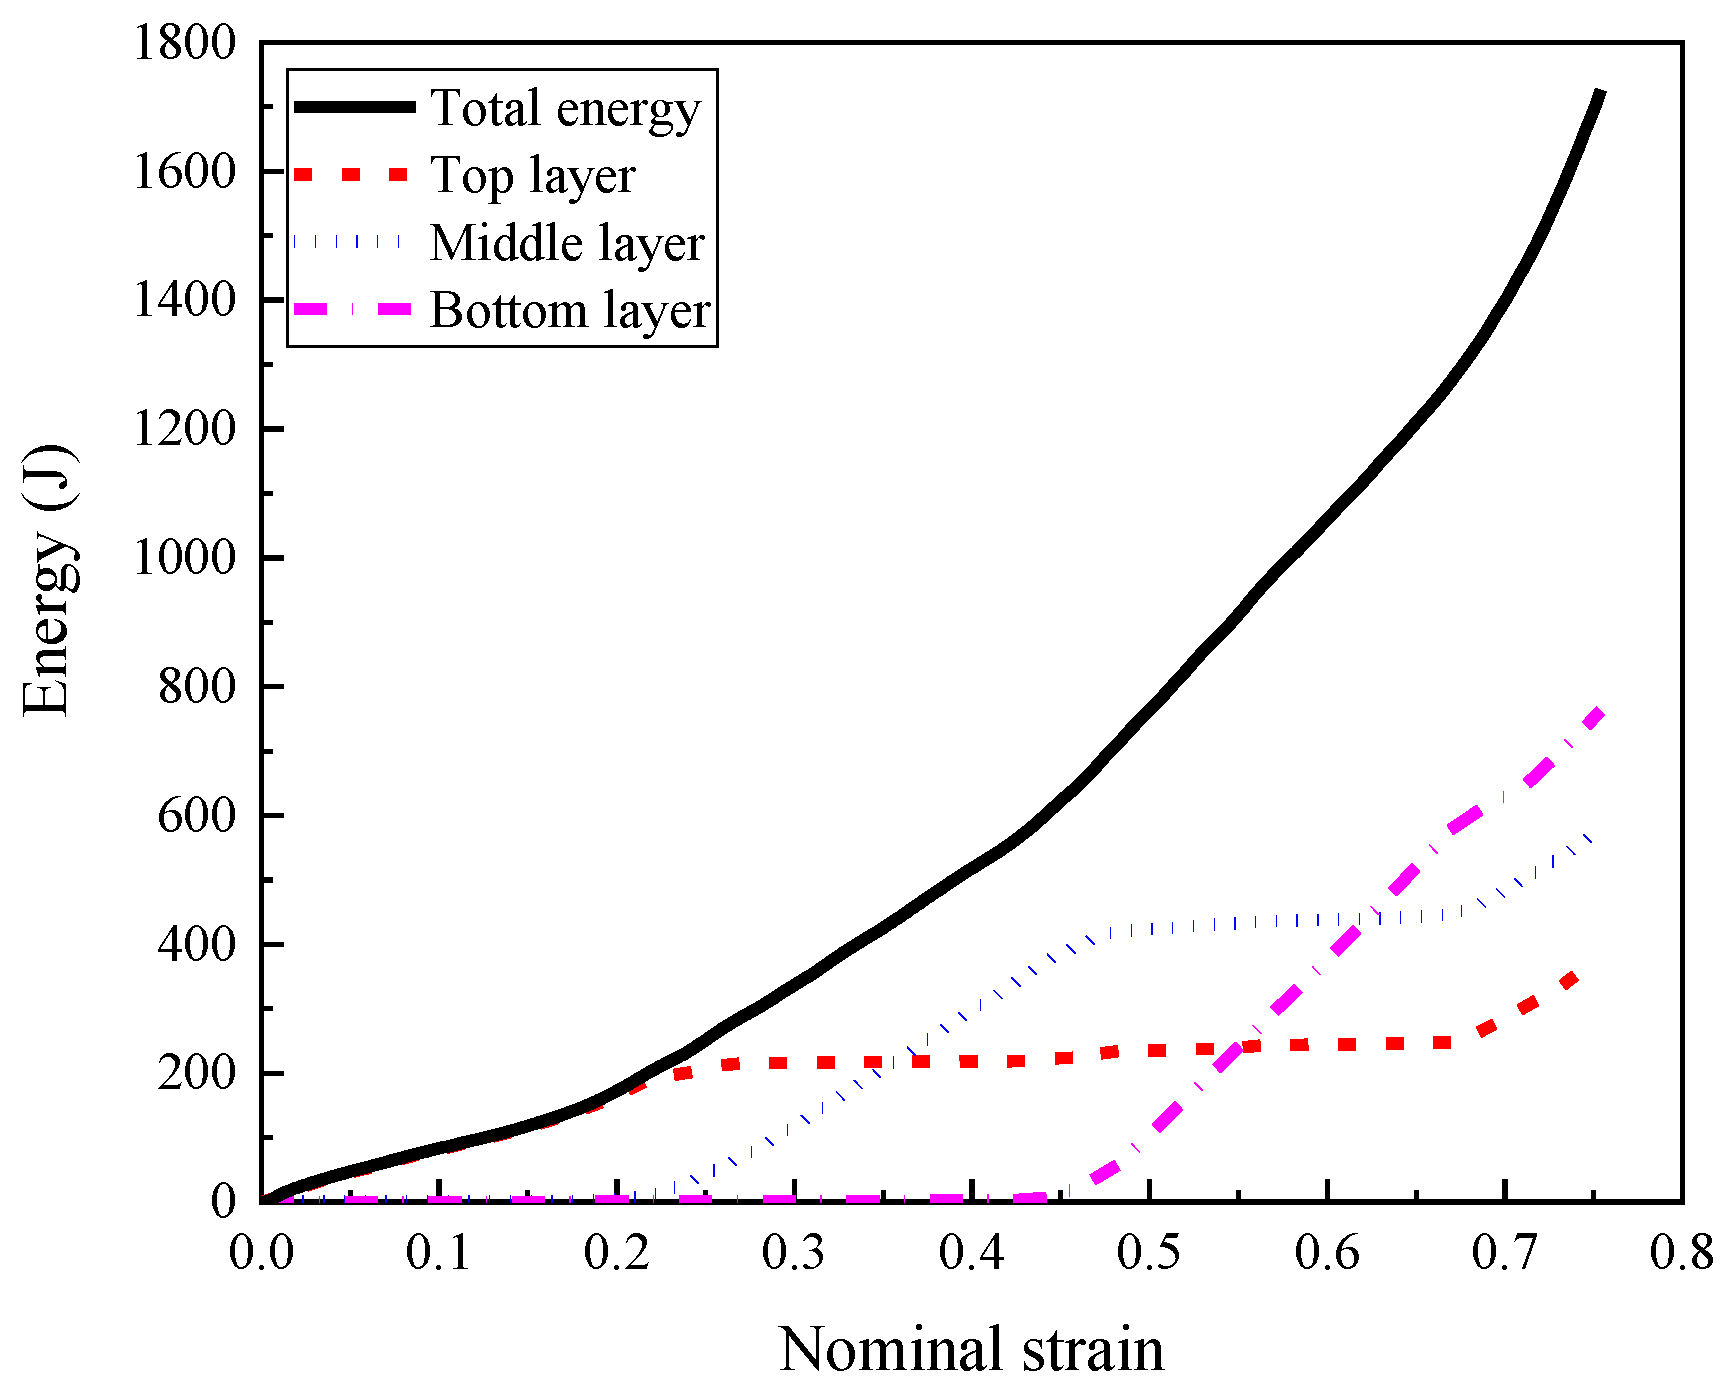
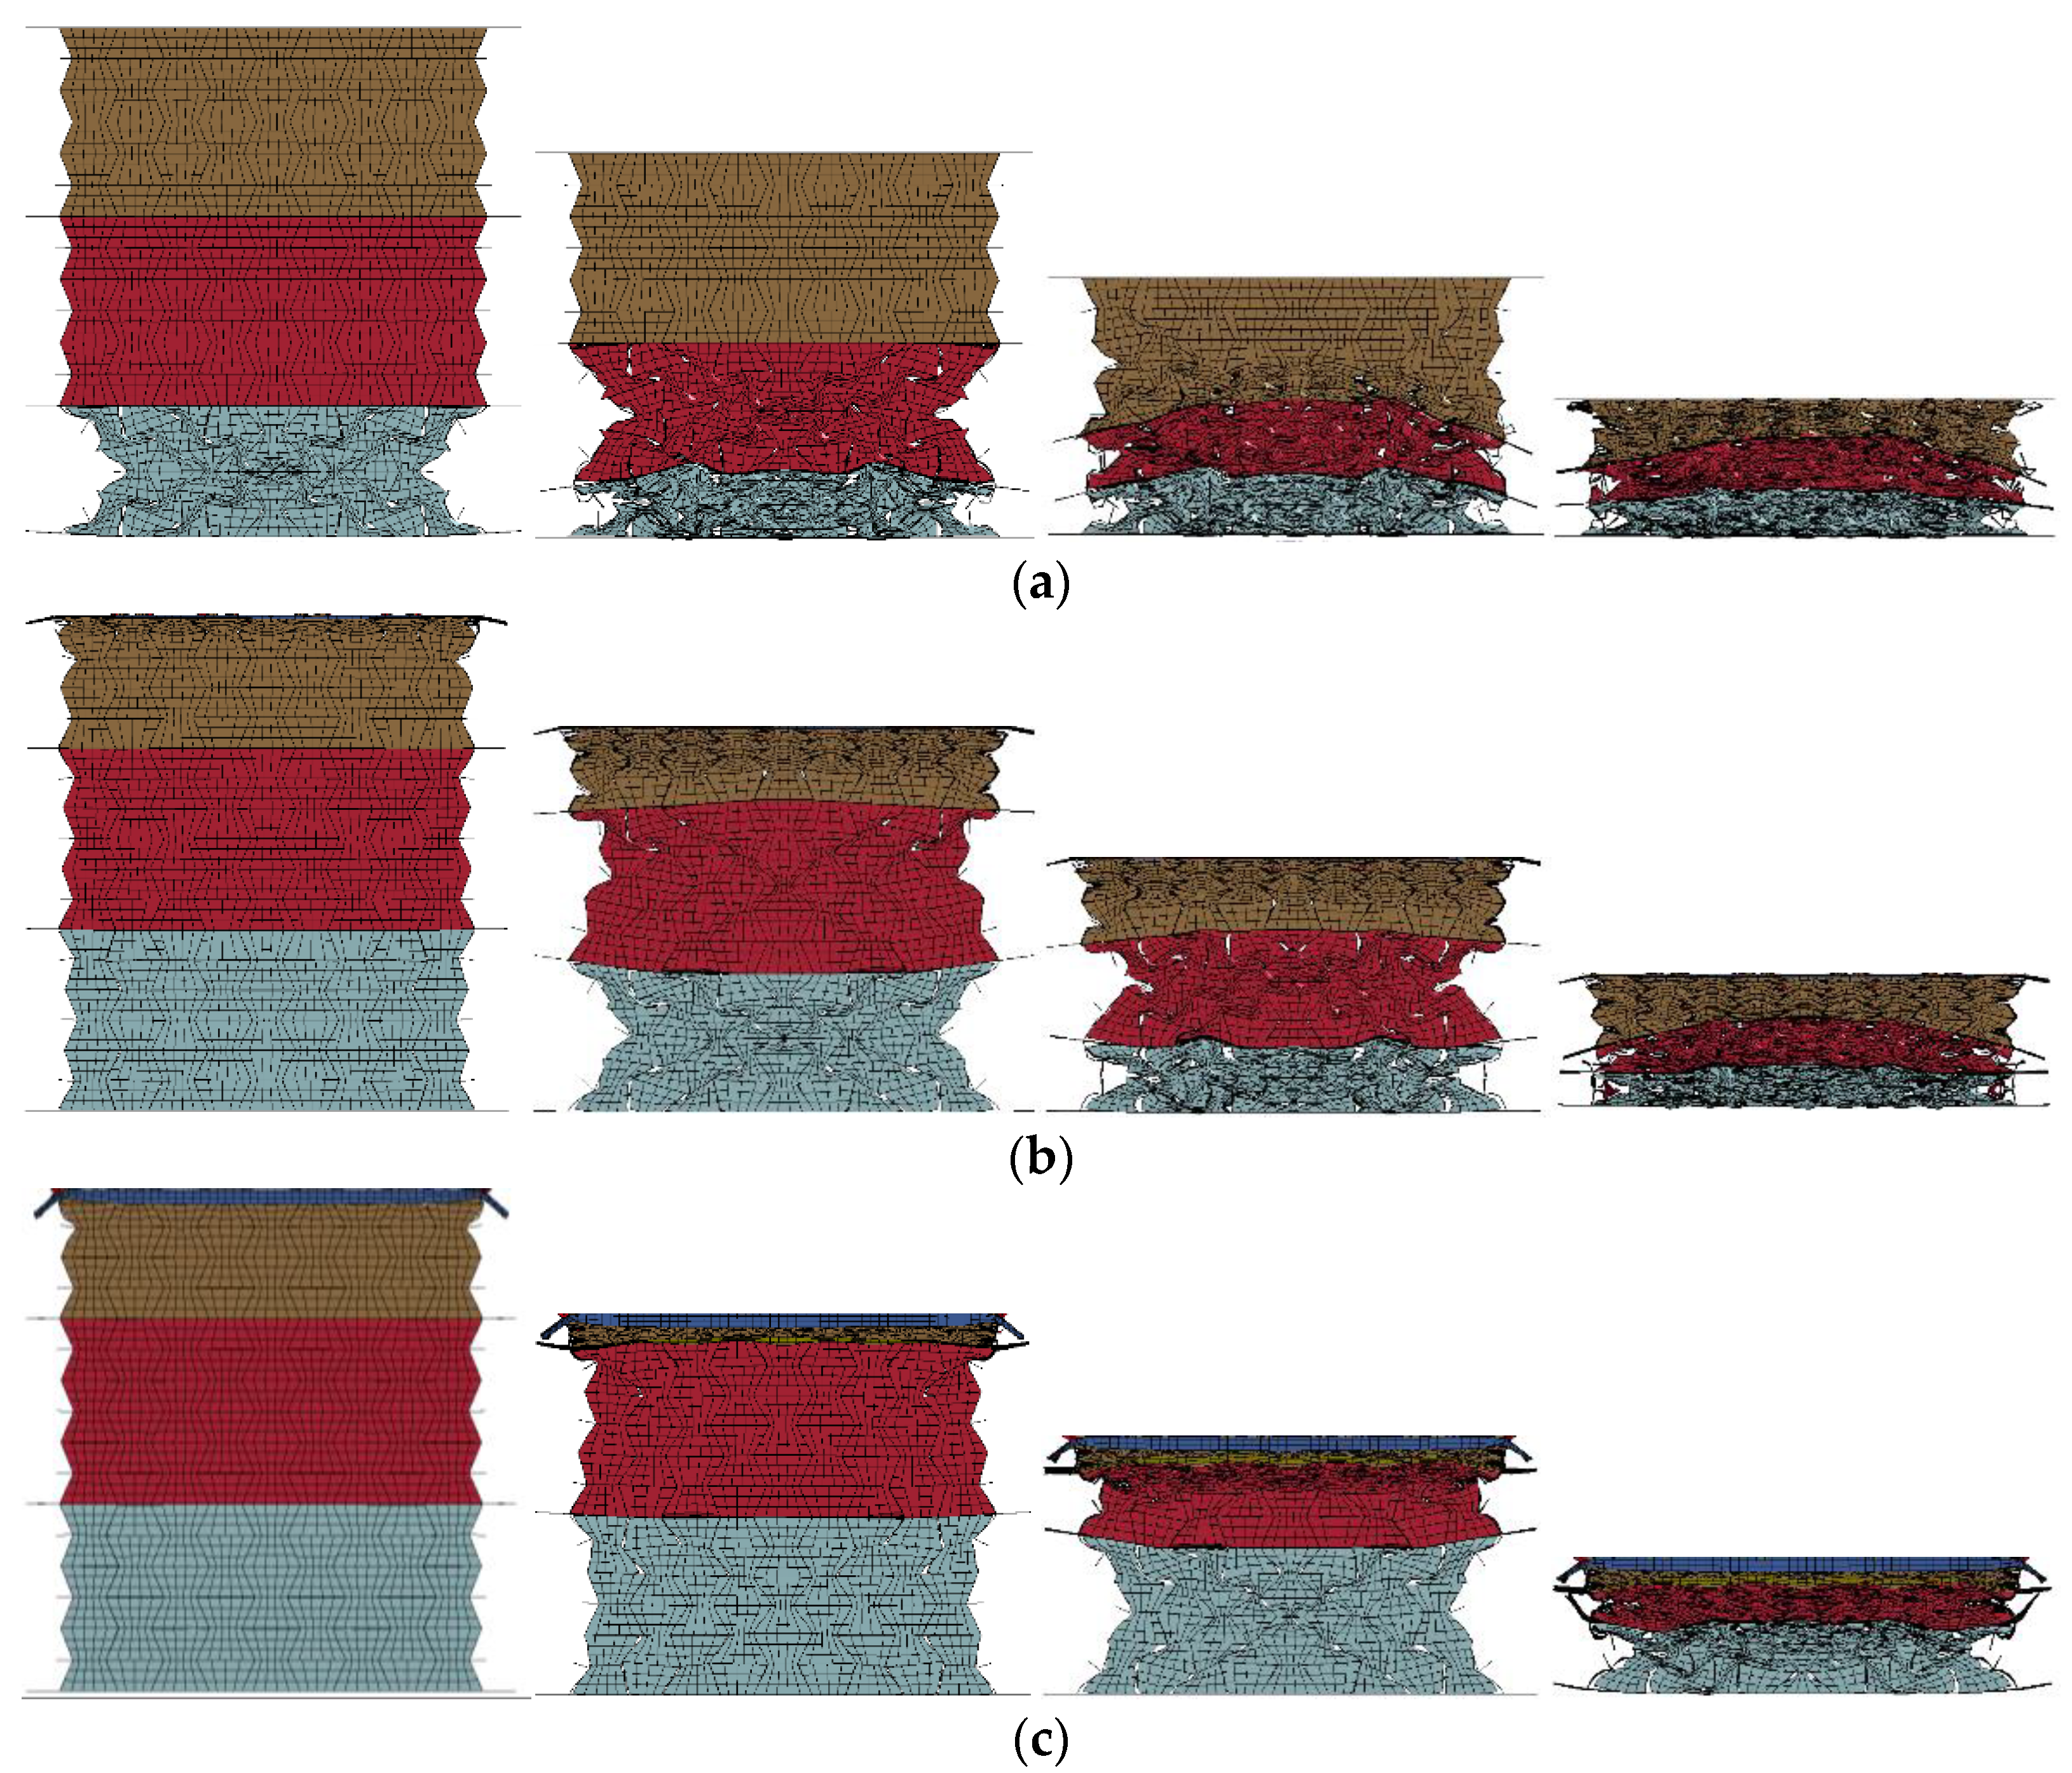
- The foam concrete density gradient and direction had a significant effect on the performance of the composite, reflected by the observed three-stage stress plateau corresponding to the layered compression. In the first, second, and third deformation stages, the top layer, middle layer and bottom layer foam concrete of the composite with positive gradient absorbed 94.62%, 88.72%, and 86.94% of the total foam concrete energy absorption, respectively. The layered architecture filled with foam concrete of different densities was able to realize a controllable sequential compression response, convenient to realize multi-level protection.
- (3)
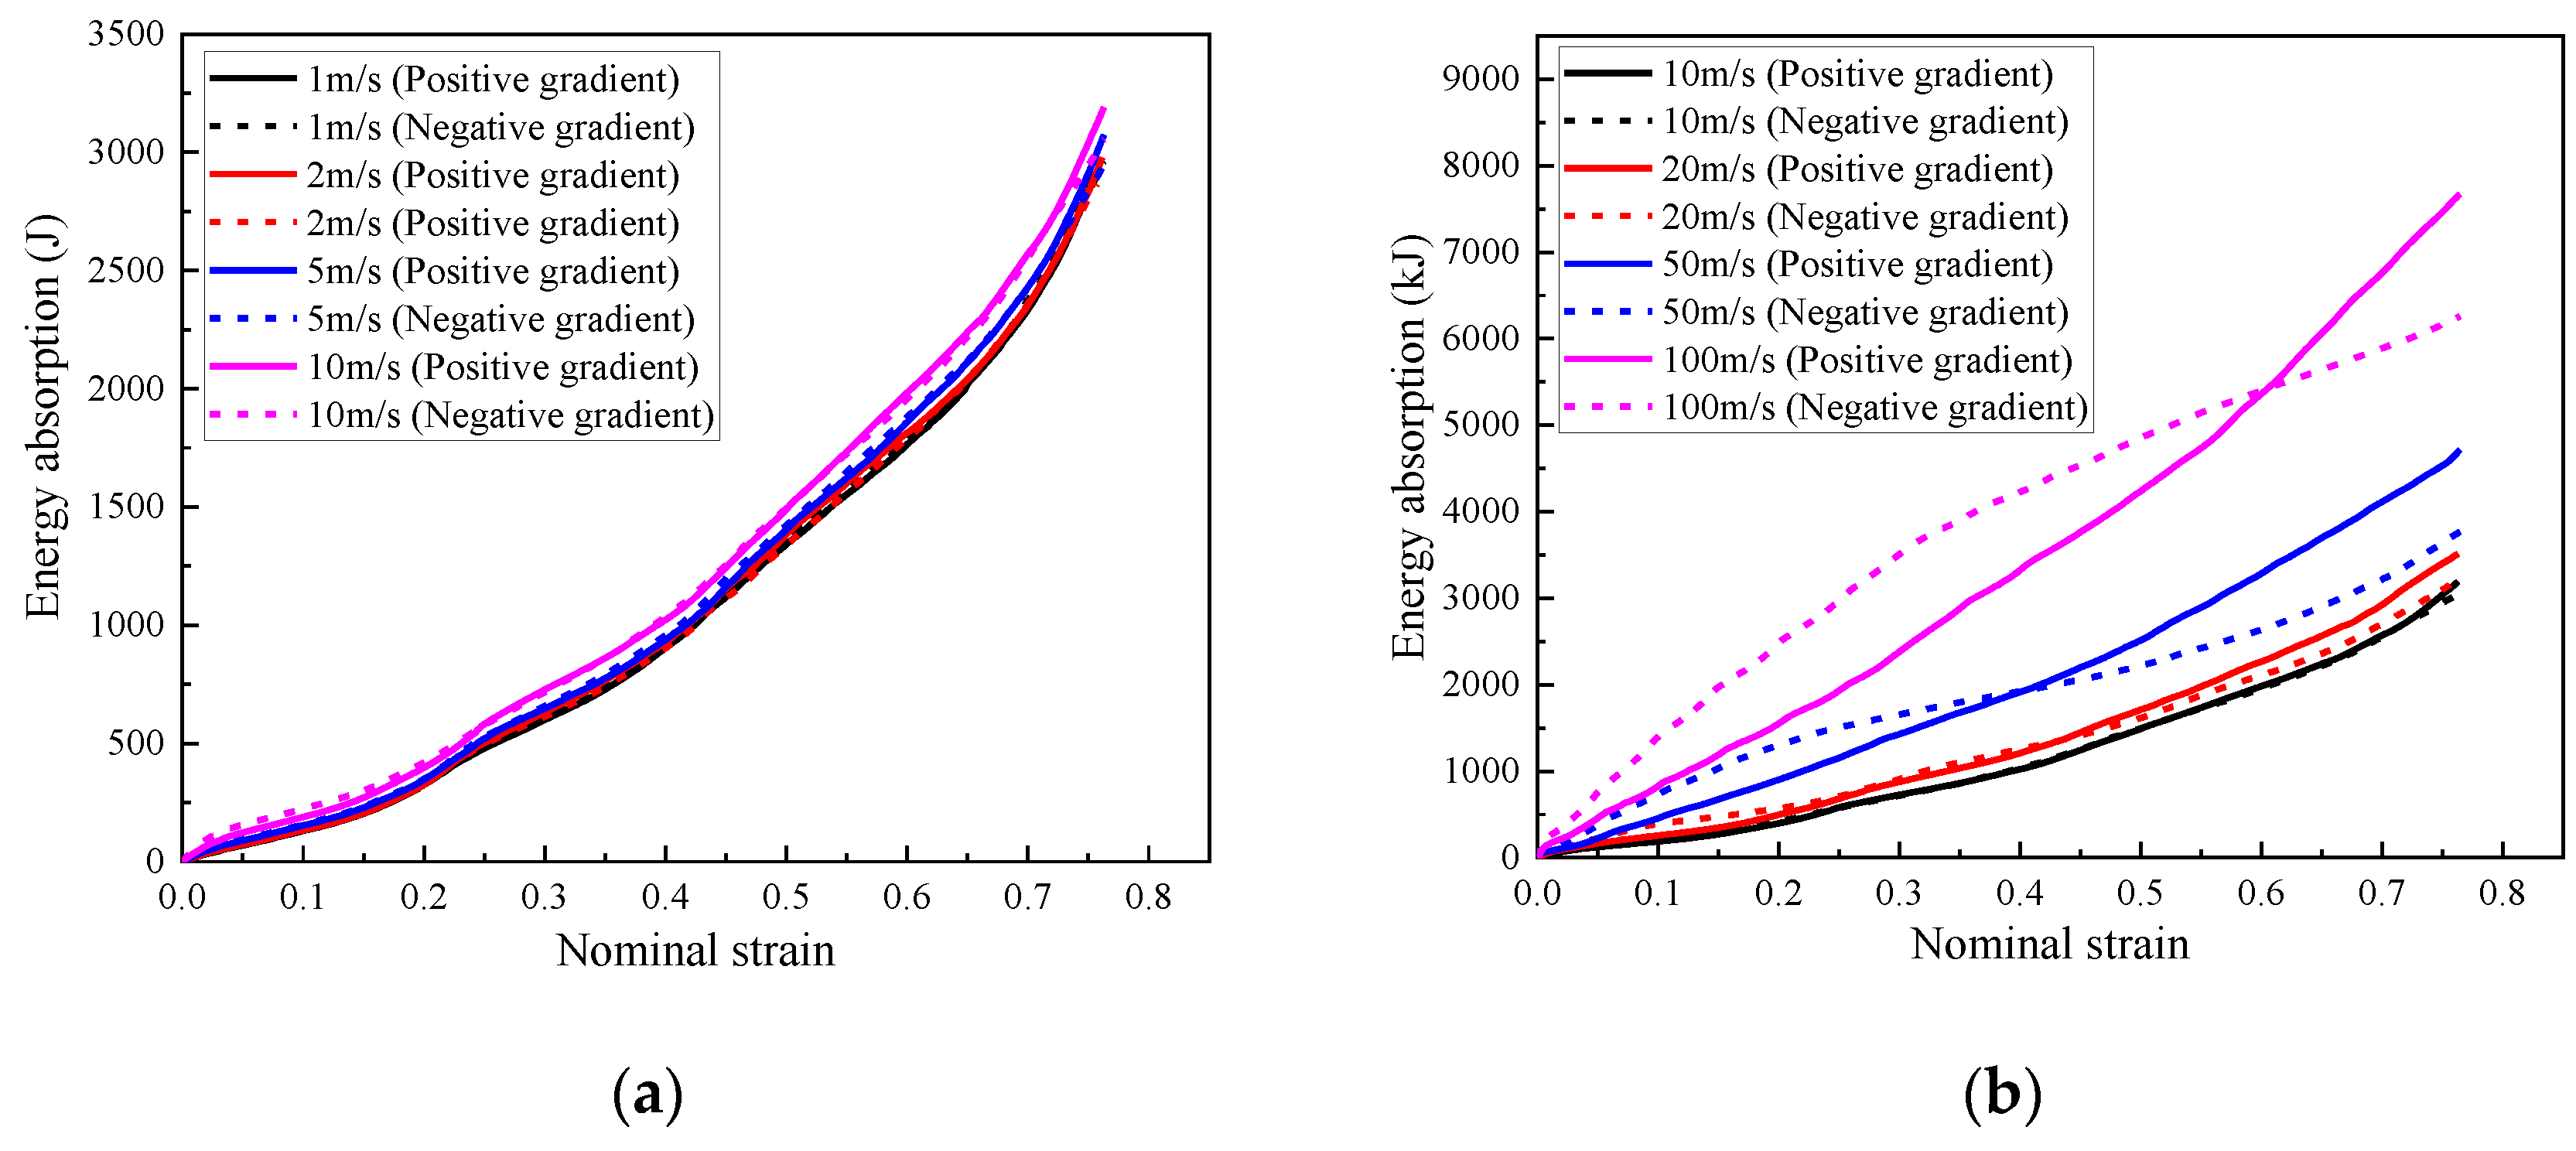
- The layered gradient composite exhibited different response modes under different loading rates. Subjected to a low or medium loading rate (less than 10 m/s), the composite underwent an obvious layered response and negative Poisson’s effect, while it exhibited progressive collapse mode from the loading end subjected to a high loading rate (greater than 10 m/s).
- (4)
- The composite with positive foam concrete density gradient (408:575:848) produced higher initial peak stress compared with that with negative gradient (848:575:408) by 21%, implying that the former was inferior to the latter in the aspect of initial transferred load to the protected structure.
- (5)
- The effective Poisson’s ratio of the proposed composite first increased and then decreased, and finally remained stable with increasing compression stroke. Specifically, the effective Poisson’s ratio of the first layer in the composite with positive gradient (408:575:848) increased to −2 then converged to −0.6 under 2 m/s and 10 m/s crushing, and ranged from −0.4 to −0.1 under 50 m/s and 100 m/s crushing, respectively. The effective Poisson’s ratio of the middle and bottom layers increased to −2 initially and converged to range of −0.4 to −0.1, regardless of the crushing speed.
6. Further Research
- (a)
- The theoretical model for auxetic honeycombs without and with filler may be established, to provide a quick preliminary prediction.
- (b)
- Other configurations of hollow structures with auxeticity under compression may be investigated, especially with foam concrete filler.
- (c)
- The theoretical model incorporating the blast load, the graded protective layer, and the protected structural member such as a beam or slab, may be established.
Author Contributions
Funding
Institutional Review Board Statement
Informed Consent Statement
Data Availability Statement
Acknowledgments
Conflicts of Interest
References
- Hao, H.; Hao, Y.F.; Li, J.; Chen, W.S. Review of the current practices in blast-resistant analysis and design of concrete structures. Adv. Struct. Eng. 2016, 19, 1193–1223. [Google Scholar] [CrossRef]
- Zhang, D.; Yao, S.; Lu, F.; Chen, X.; Lin, G.; Wang, W.; Lin, Y. Experimental study on scaling of RC beams under close-in blast loading. Eng. Fail. Anal. 2013, 33, 497–504. [Google Scholar] [CrossRef]
- Hao, H.; Tran, T.T.; Li, H.W.; Pham, T.M.; Chen, W.S. On the accuracy, reliability and controllability of impact tests of RC beams. Int. J. Impact Eng. 2021, 157, 103979. [Google Scholar] [CrossRef]
- Song, D.Y.; Tan, Q.H.; Zhan, H.W.; Liu, F.; Jiang, Z.G. Experimental investigation on the cellular steel-tube-confined concrete targets against projectile impact. Int. J. Impact Eng. 2019, 131, 94–110. [Google Scholar] [CrossRef]
- Temsah, Y.; Jahami, A.; Khatib, J.; Sonebi, M. Numerical derivation of iso-damaged curve for a reinforced concrete beam subjected to blast loading. MATEC Web Conf. 2018, 149, 02016. [Google Scholar] [CrossRef]
- Li, Z.J.; Chen, W.S.; Hao, H. Blast mitigation performance of cladding using square dome-shape kirigami folded structure as core. Int. J. Mech. Sci. 2018, 145, 83–95. [Google Scholar] [CrossRef]
- Tarlochan, F. Sandwich structures for energy absorption applications: A review. Materials 2021, 14, 4731. [Google Scholar] [CrossRef]
- Cai, S.P.; Liu, J.; Zhang, P.; Li, C.P.; Cheng, Y.S.; Chen, C.H. Experimental study on failure mechanisms of sandwich panels with multi-layered aluminum foam/UHMWPE laminate core under combined blast and fragments loading. Thin-Walled Struct. 2021, 159, 107227. [Google Scholar] [CrossRef]
- Zhang, J.X.; Zhou, R.F.; Wang, M.S.; Qin, Q.H.; Ye, Y.; Wang, T.J. Dynamic response of double-layer rectangular sandwich plates with metal foam cores subjected to blast loading. Int. J. Impact Eng. 2018, 122, 265–275. [Google Scholar] [CrossRef]
- Studziński, R.; Gajewski, T.; Malendowski, M.; Sumelka, W.; Al-Rifaie, H.; Peksa, P.; Sielicki, P.W. Blast test failure mechanisms of soft-core sandwich panels for storage halls applications. Materials 2021, 14, 70. [Google Scholar] [CrossRef]
- Ciepielewski, R.; Gieleta, R.; Miedzińska, D. Experimental study on static dynamic response of aluminum honeycomb sandwich structures. Materials 2022, 15, 1793. [Google Scholar] [CrossRef]
- Zhou, H.Y.; Zhang, X.J.; Wang, X.J.; Du, X.L.; Yu, S.J.; Wang, Y.H.; Jiang, J. Protection effectiveness of sacrificial cladding for near-field blast mitigation. Int. J. Impact Eng. 2022, 170, 104361. [Google Scholar] [CrossRef]
- Elamin, M.; Li, B.; Tan, K.T. Compression after impact performance of carbon-fiber foam-core sandwich composites in low temperature arctic conditions. Compos. Struct. 2021, 261, 113568. [Google Scholar] [CrossRef]
- Li, H.; Wang, Z.; Yu, Z.; Sun, M.; Liu, Y. The low velocity impact response of foam core sandwich panels with a shape memory alloy hybrid face-sheet. Materials 2018, 11, 2076. [Google Scholar] [CrossRef] [Green Version]
- Xu, L.; Duan, Y.; Li, Y. Porosity, gradient and impact velocity effects on compressive response of foamed concrete. Constr. Build. Mater. 2022, 315, 125616. [Google Scholar] [CrossRef]
- Flores Johnson, E.A.; Li, Q.M. Structural behaviour of composite sandwich panels with plain and fibre-reinforced foamed concrete cores and corrugated steel faces. Compos. Struct. 2012, 94, 1555–1563. [Google Scholar] [CrossRef] [Green Version]
- Zhou, H.Y.; Zhang, X.J.; Wang, X.J.; Zhang, H.; Song, T.Y. Improving energy absorption capacity of foam concrete with gradient and layered architecture. Constr. Build. Mater. 2022, 319, 126140. [Google Scholar] [CrossRef]
- Akatay, A.; Bora, M.O.; Coban, O.; Fidan, S.; Tuna, V. The influence of low velocity repeated impacts on residual compressive properties of honeycomb sandwich structures. Compos. Struct. 2015, 125, 425–433. [Google Scholar] [CrossRef]
- Ozen, I.; Cava, K.; Gedikli, H.; Alver, U.; Aslan, M. Low-energy impact response of composite sandwich panels with thermoplastic honeycomb and reentrant cores. Thin-Walled Struct. 2020, 156, 106989. [Google Scholar] [CrossRef]
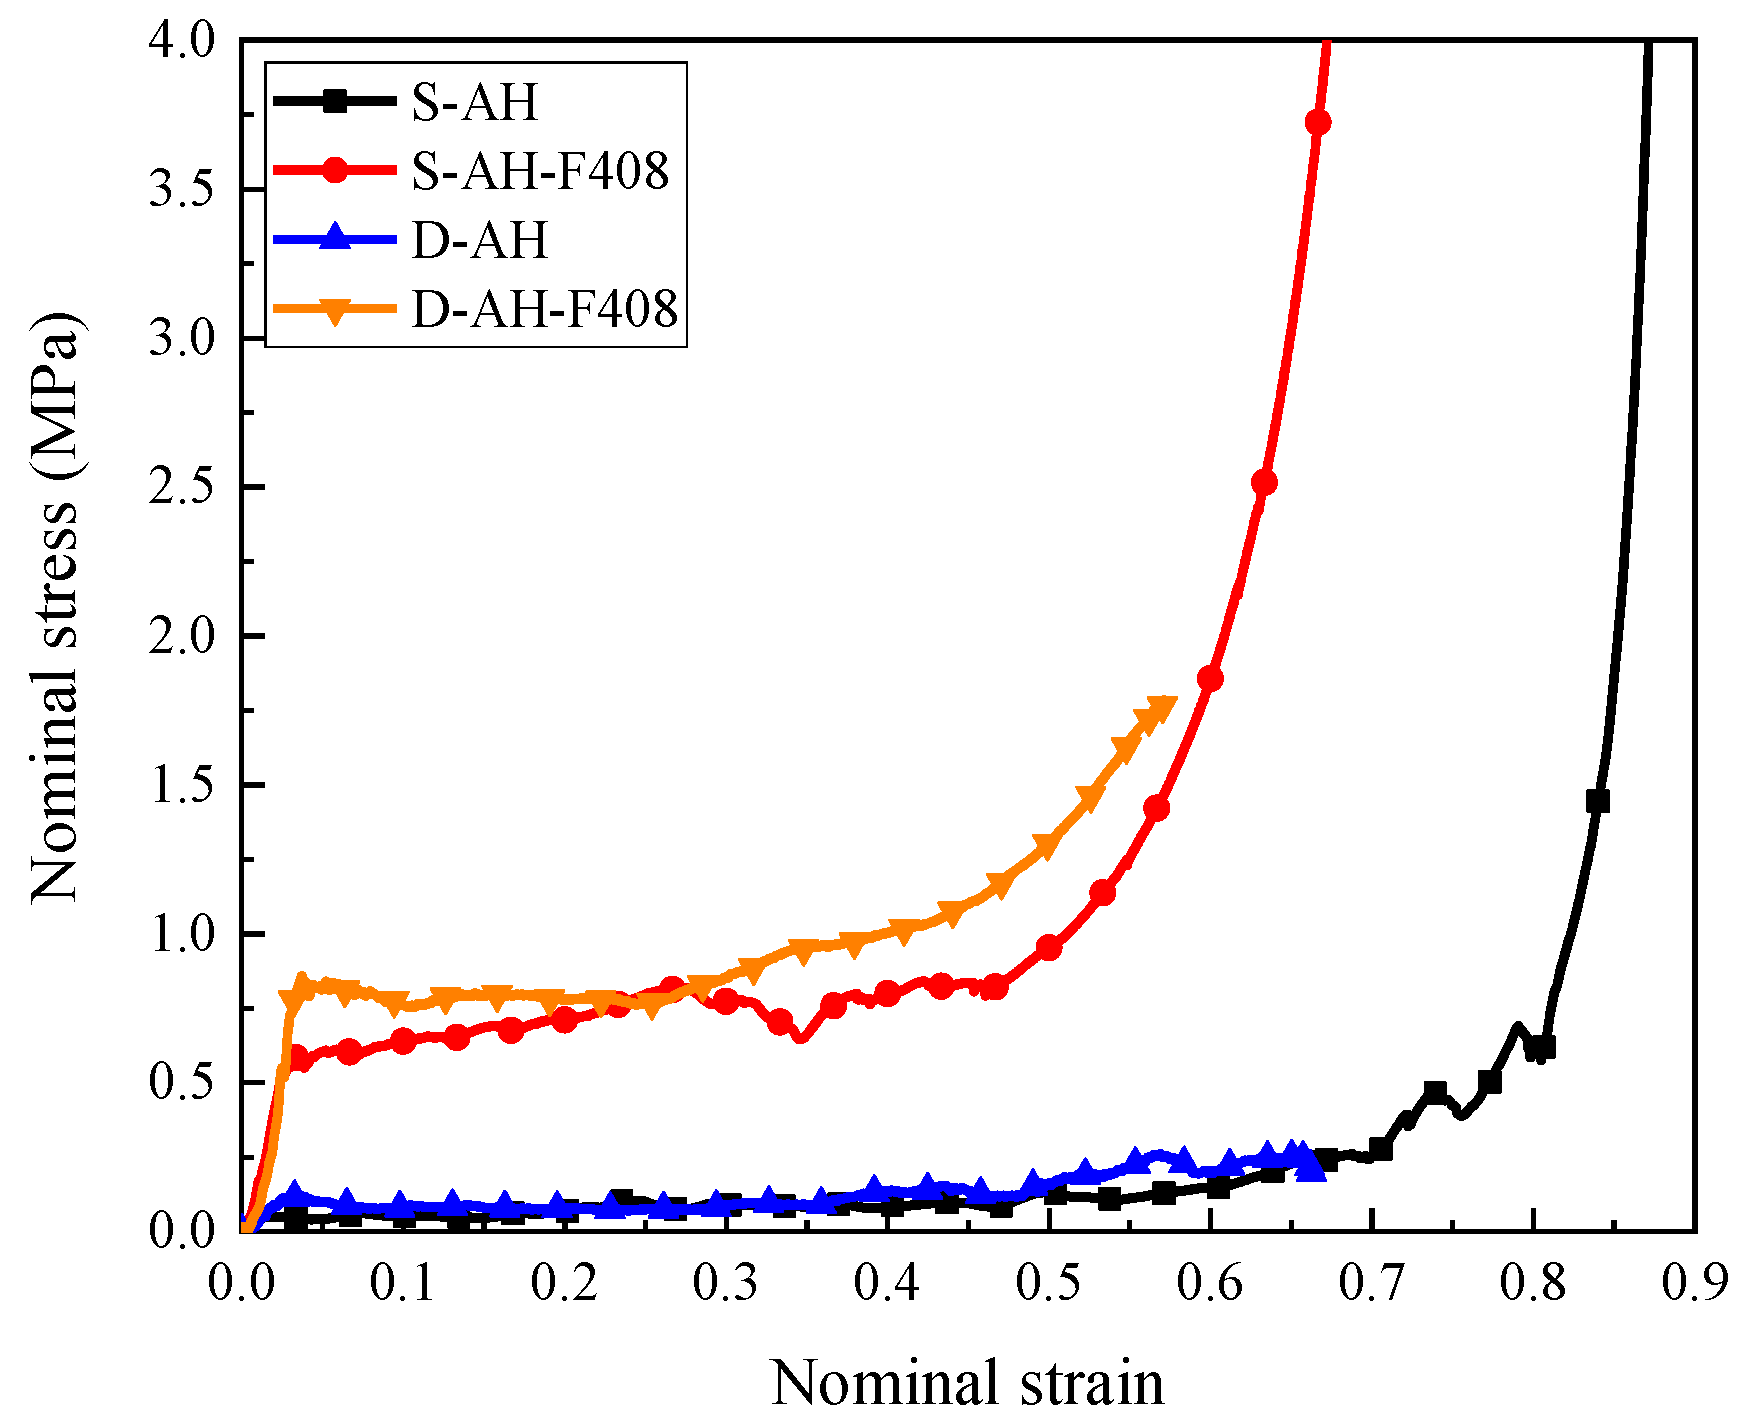
- Zhou, H.Y.; Zhang, X.J.; Wang, X.J.; Wang, Y.H.; Zhao, T.F. Response of foam concrete-filled aluminum honeycombs subject to quasi-static and dynamic compression. Compos. Struct. 2020, 239, 112025. [Google Scholar] [CrossRef]
- Zhou, H.; Jia, K.; Wang, X.; Xiong, M.-X.; Wang, Y. Experimental and numerical investigation of low velocity impact response of foam concrete filled auxetic honeycombs. Thin-Walled Struct. 2020, 154, 106898. [Google Scholar] [CrossRef]
- Zhang, Y.; Lin, Y.; Li, X. Plastic crushing failure of bio-inspired cellular hierarchical topological sandwich core. Materials 2021, 14, 5040. [Google Scholar] [CrossRef] [PubMed]
- Park, S.W.; Beak, J.W.; Kim, K.J.; Park, Y.J. Study on reduction effect of vibration propagation due to internal explosion using composite materials. Int. J. Concr. Struct. Mater. 2021, 15, 30. [Google Scholar] [CrossRef]
- Golewski, G.L. On the special construction and materials conditions reducing the negative impact of vibrations on concrete structures. Mater. Today Proc. 2021, 45, 4344–4348. [Google Scholar] [CrossRef]
- Lyratzakis, A.; Tsompanakis, Y.; Psarropoulos, P.N. Efficient mitigation of high-speed train vibrations on adjacent reinforced concrete buildings. Constr. Build. Mater. 2022, 314, 125653. [Google Scholar] [CrossRef]
- Fleck, N.A.; Deshpande, V.S. The resistance of clamped sandwich beams to shock loading. J. Appl. Mech.-Trans. ASME 2004, 71, 386–401. [Google Scholar] [CrossRef] [Green Version]
- Zhang, J.X.; Qin, Q.H.; Xiang, C.P.; Wang, Z.J.; Wang, T.J. A theoretical study of low-velocity impact of geometrically asymmetric sandwich beams. Int. J. Impact Eng. 2016, 96, 35–49. [Google Scholar] [CrossRef]
- Zhang, J.; Liu, K.; Ye, Y.; Qin, Q. Low-velocity impact of rectangular multilayer sandwich plates. Thin-Walled Struct. 2019, 141, 308–318. [Google Scholar] [CrossRef]
- Burlayenko, V.N.; Sadowski, T. Effective elastic properties of foam-filled honeycomb cores of sandwich panels. Compos. Struct. 2010, 92, 2890–2900. [Google Scholar] [CrossRef]
- Hussein, R.D.; Ruan, D.; Lu, G.X.; Guillow, S.; Yoon, J.W. Crushing response of square aluminium tubes filled with polyurethane foam and aluminium honeycomb. Thin-Walled Struct. 2017, 110, 140–154. [Google Scholar] [CrossRef]
- Yan, L.L.; Zhu, K.Y.; Zhang, Y.W.; Zhang, C.; Zheng, X.T. Effect of absorbent foam filling on mechanical behaviors of 3D-printed honeycombs. Polymers 2020, 12, 2059. [Google Scholar] [CrossRef]
- Wang, Z.G.; Liu, J.F. Mechanical performance of honeycomb filled with circular CFRP tubes. Compos. Part B-Eng. 2018, 135, 232–241. [Google Scholar] [CrossRef]
- Jin, X.C.; Jin, T.; Su, B.Y.; Wang, Z.H.; Ning, J.G.; Shu, X.F. Ballistic resistance and energy absorption of honeycomb structures filled with reactive powder concrete prisms. J. Sandw. Struct. Mater. 2017, 19, 544–571. [Google Scholar] [CrossRef]
- Mozafari, H.; Molatefi, H.; Crupi, V.; Epasto, G.; Guglielmino, E. In plane compressive response and crushing of foam filled aluminum honeycombs. J. Compos. Mater. 2015, 49, 3215–3228. [Google Scholar] [CrossRef]
- Liu, Q.; Fu, J.; Wang, J.S.; Ma, J.B.; Chen, H.; Li, Q.; Hui, D. Axial and lateral crushing responses of aluminum honeycombs filled with EPP foam. Compos. Part B-Eng. 2017, 130, 236–247. [Google Scholar] [CrossRef]
- Li, Z.J.; Chen, W.S.; Hao, H. Dynamic crushing and energy absorption of foam filled multi-layer folded structures: Experimental and numerical study. Int. J. Impact Eng. 2019, 133, 103341. [Google Scholar] [CrossRef]
- Lakes, R.S.; Elms, K. Indentability of conventional and negative poissons ratio foams. J. Compos. Mater. 1993, 27, 1193–1202. [Google Scholar] [CrossRef] [Green Version]
- Zhong, R.; Ren, X.; Zhang, X.; Luo, C.; Zhang, Y.; Xie, Y. Mechanical properties of concrete composites with auxetic single and layered honeycomb structures. Constr. Build. Mater. 2022, 322, 126453. [Google Scholar] [CrossRef]
- Ju, J.; Summers, J.D. Compliant hexagonal periodic lattice structures having both high shear strength and high shear strain. Mater. Des. 2011, 32, 512–524. [Google Scholar] [CrossRef]
- Assidi, M.; Ganghoffer, J.F. Composites with auxetic inclusions showing both an auxetic behavior and enhancement of their mechanical properties. Compos. Struct. 2012, 94, 2373–2382. [Google Scholar] [CrossRef]
- Ren, X.; Shen, J.H.; Ghaedizadeh, A.; Tian, H.Q.; Xie, Y.M. A simple auxetic tubular structure with tuneable mechanical properties. Smart Mater. Struct. 2016, 25, 065012. [Google Scholar] [CrossRef] [Green Version]
- Zhang, J.J.; Lu, G.X.; Ruan, D.; Wang, Z.H. Tensile behavior of an auxetic structure: Analytical modeling and finite element analysis. Int. J. Mech. Sci. 2018, 136, 143–154. [Google Scholar] [CrossRef]
- Amran, Y.H.M.; Farzadnia, N.; Ali, A.A.A. Properties and applications of foamed concrete: A review. Constr. Build. Mater. 2015, 101, 990–1005. [Google Scholar] [CrossRef]
- Chica, L.; Alzate, A. Cellular concrete review: New trends for application in construction. Constr. Build. Mater. 2019, 200, 637–647. [Google Scholar] [CrossRef]
- Ma, K.; Ren, F.; Huang, H.; Yang, X.; Zhang, F. Experimental investigation on the dynamic mechanical properties and energy absorption mechanism of foam concrete. Constr. Build. Mater. 2022, 342, 127927. [Google Scholar] [CrossRef]
- Wu, K.; Shao, Z.; Qin, S. A solution for squeezing deformation control in tunnels using foamed concrete: A review. Constr. Build. Mater. 2020, 257, 119539. [Google Scholar] [CrossRef]
- Su, B.Y.; Zhou, Z.W.; Li, Z.Q.; Wang, Z.H.; Shu, X.F. Experimental investigation on the mechanical behavior of foamed concrete under uniaxial and triaxial loading. Constr. Build. Mater. 2019, 209, 41–51. [Google Scholar] [CrossRef]
- Feng, L.; Chen, X.; Ning, Y.; Wang, J.; Zhang, W. High temperature effect of foamed concrete under equal displacement increment triaxial cyclic compression. Constr. Build. Mater. 2022, 327, 126989. [Google Scholar] [CrossRef]
- Guo, Y.; Chen, X.; Chen, B.; Wen, R.; Wu, P. Analysis of foamed concrete pore structure of railway roadbed based on X-ray computed tomography. Constr. Build. Mater. 2021, 273, 121773. [Google Scholar] [CrossRef]
- Wang, S.L.; Wang, Y.; Yu, F.; Yang, Y.F.; Huang, Z.L.; Ding, Y.N. Evaluation of in-plane crushing performance of printed randomly polymeric honeycombs filled with foamed concrete. Constr. Build. Mater. 2021, 310, 125291. [Google Scholar] [CrossRef]
- Krishna, B.V.; Bose, S.; Bandyopadhyay, A. Strength of open-cell 6101 aluminum foams under free and constrained compression. Mater. Sci. Eng. A-Struct. Mater. Prop. Microstruct. Process. 2007, 452, 178–188. [Google Scholar] [CrossRef]
- Ashab, A.S.M.; Ruan, D.; Lu, G.X.; Xu, S.Q.; Wen, C.E. Experimental investigation of the mechanical behavior of aluminum honeycombs under quasi-static and dynamic indentation. Mater. Des. 2015, 74, 138–149. [Google Scholar] [CrossRef]
- Jin, T.; Zhou, Z.W.; Wang, Z.H.; Wu, G.Y.; Shu, X.F. Experimental study on the effects of specimen in-plane size on the mechanical behavior of aluminum hexagonal honeycombs. Mater. Sci. Eng. A-Struct. Mater. Prop. Microstruct. Process. 2015, 635, 23–35. [Google Scholar] [CrossRef]
- Gupta, N. A functionally graded syntactic foam material for high energy absorption under compression. Mater. Lett. 2007, 61, 979–982. [Google Scholar] [CrossRef]
- Zhou, C.C.; Wang, P.; Li, W. Fabrication of functionally graded porous polymer via supercritical CO2 foaming. Compos. Part B-Eng. 2011, 42, 318–325. [Google Scholar] [CrossRef]
- Xu, F.X.; Zhang, X.; Zhang, H. A review on functionally graded structures and materials for energy absorption. Eng. Struct. 2018, 171, 309–325. [Google Scholar] [CrossRef]
- Cui, L.; Kiernan, S.; Gilchrist, M.D. Designing the energy absorption capacity of functionally graded foam materials. Mater. Sci. Eng. A-Struct. Mater. Prop. Microstruct. Process. 2009, 507, 215–225. [Google Scholar] [CrossRef]
- Liang, M.Z.; Li, Z.B.; Lu, F.Y.; Li, X.Y. Theoretical and numerical investigation of blast responses of continuous-density graded cellular materials. Compos. Struct. 2017, 164, 170–179. [Google Scholar] [CrossRef]
- Avila, A.F. Failure mode investigation of sandwich beams with functionally graded core. Compos. Struct. 2007, 81, 323–330. [Google Scholar] [CrossRef]
- Apetre, N.A.; Sankar, B.V.; Ambur, D.R. Low-velocity impact response of sandwich beams with functionally graded core. Int. J. Solids Struct. 2006, 43, 2479–2496. [Google Scholar] [CrossRef]
- Wang, B.; Chen, Y.S.; Fan, H.L.; Jin, F.N. Investigation of low-velocity impact behaviors of foamed concrete material. Compos. Part B-Eng. 2019, 162, 491–499. [Google Scholar] [CrossRef]
- Li, H.N.; Liu, P.F.; Li, C.; Li, G.; Zhang, H. Experimental research on dynamic mechanical properties of metal tailings porous concrete. Constr. Build. Mater. 2019, 213, 20–31. [Google Scholar] [CrossRef]
- Qi, C.; Remennikov, A.; Pei, L.Z.; Yang, S.; Yu, Z.H.; Ngo, T.D. Impact and close-in blast response of auxetic honeycomb-cored sandwich panels: Experimental tests and numerical simulations. Compos. Struct. 2017, 180, 161–178. [Google Scholar] [CrossRef]


| Material | Density/(kg/m3) | E/GPa | Poisson’s Ratio | Tangent Modulus/MPa |
|---|---|---|---|---|
| Aluminum | 2700 | 68 | 0.36 | 31.25 |
| Material | Density/(kg/m3) | E/MPa | Poisson’s Ratio | TSC/MPa | DAMP |
|---|---|---|---|---|---|
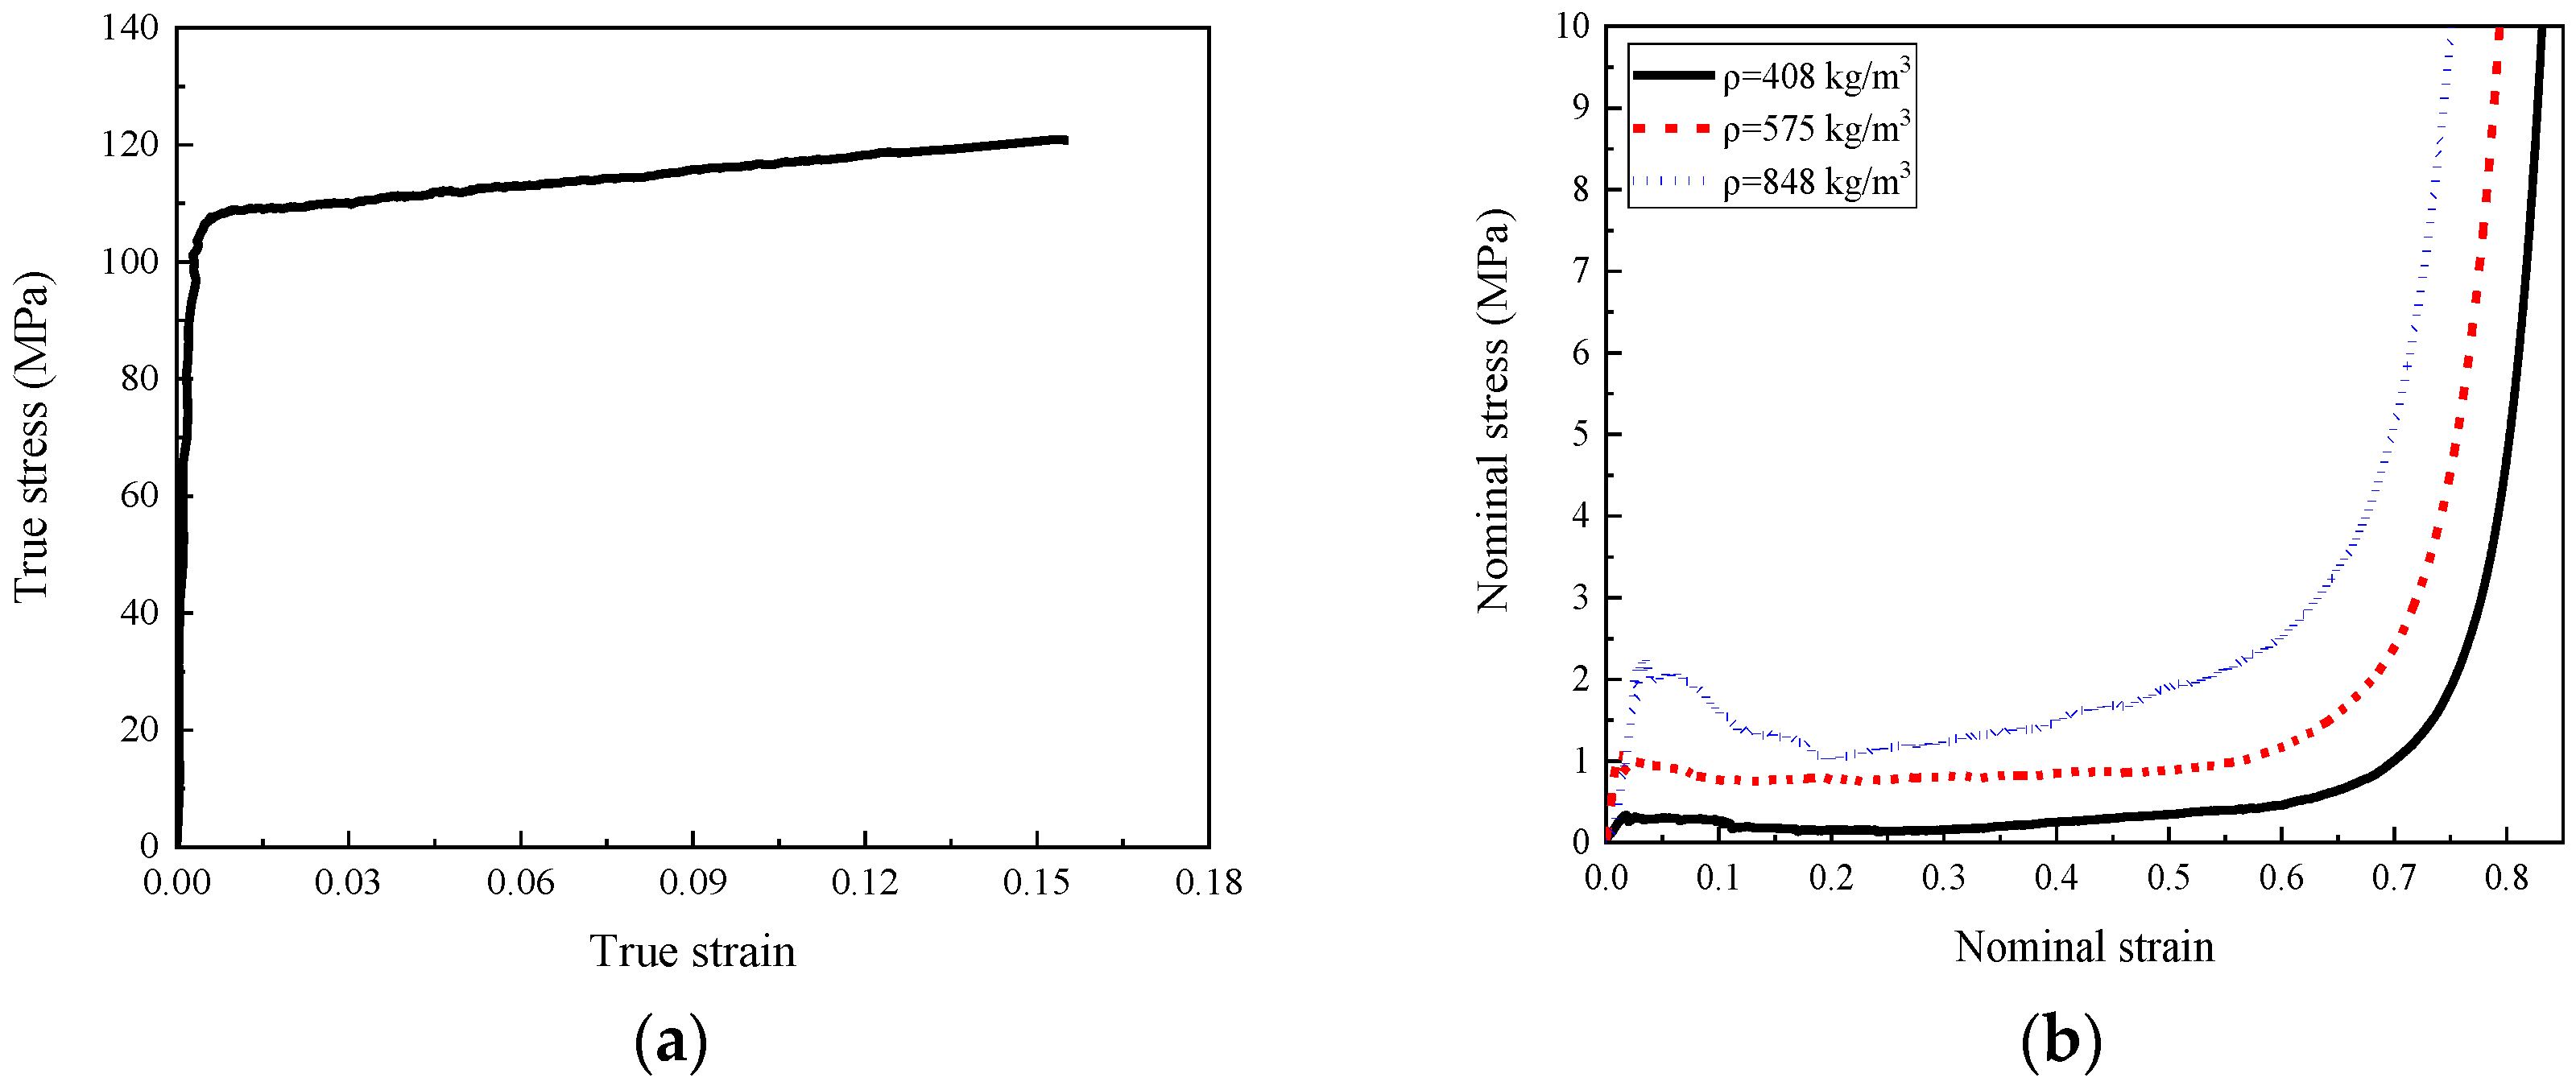
| Foam concrete-1 | 408 | 25 | 0.01 | 0.02 | 0.1 |
| Foam concrete-2 | 575 | 52 | 0.01 | 0.1 | 0.1 |
| Foam concrete-3 | 848 | 80 | 0.01 | 0.22 | 0.1 |
| Specimen Index | Specimen Type | Cell-Wall Thickness Gradient | Average Cell-Wall Thickness/mm | Average Density/(kg/m3) |
|---|---|---|---|---|
| AH-0 | Homogeneous | 0.25:0.25:0.25 | 0.25 | 580 |
| PGAH-1 | Positive gradient | 0:20:0:25:0.30 | 0.25 | 580 |
| PGAH-2 | Positive gradient | 0:15:0:25:0.35 | 0.25 | 580 |
| PGAH-3 | Positive gradient | 0:10:0:25:0.40 | 0.25 | 580 |
| NGAH-1 | Negative gradient | 0.30:0.25:0.20 | 0.25 | 580 |
| NGAH-2 | Negative gradient | 0.35:0.25:0.15 | 0.25 | 580 |
| NGAH-3 | Negative gradient | 0.40:0.25:0.10 | 0.25 | 580 |
| Compression Stage | Nominal Strain | Displacement/mm | Energy/J | Proportion of Energy/% | Plateau Stress/MPa |
|---|---|---|---|---|---|
| Stage 1 | 0–0.216 | 0–29.16 | 243.41 | 16.51 | 1.16 |
| Stage 2 | 0.216–0.45 | 29.16–60.74 | 520.94 | 35.33 | 1.42 |
| Stage 3 | 0.45–0.662 | 60.74–89.37 | 710.04 | 48.16 | 2.58 |
| Total | 0–0.662 | 0–89.37 | 1474.39 | 100 | - |
| Layer | Nominal Strain | Stage 1 Energy/J | Stage 1 Proportion/% | Stage 2 Energy/J | Stage 2 Proportion/% | Stage 3 Energy/J | Stage 3 Proportion/% |
|---|---|---|---|---|---|---|---|
| Top layer | 0–0.216 | 187.72 | 94.62 | 36.18 | 8.51 | 23.44 | 3.75 |
| Middle layer | 0.216–0.45 | 9.32 | 4.70 | 377.41 | 88.72 | 58.16 | 9.31 |
| Bottom layer | 0.45–0.662 | 1.35 | 0.68 | 11.78 | 2.77 | 542.99 | 86.94 |
| Total | 0–0.662 | 198.39 | 100 | 425.37 | 100 | 624.59 | 100 |
Disclaimer/Publisher’s Note: The statements, opinions and data contained in all publications are solely those of the individual author(s) and contributor(s) and not of MDPI and/or the editor(s). MDPI and/or the editor(s) disclaim responsibility for any injury to people or property resulting from any ideas, methods, instructions or products referred to in the content. |
© 2023 by the authors. Licensee MDPI, Basel, Switzerland. This article is an open access article distributed under the terms and conditions of the Creative Commons Attribution (CC BY) license (https://creativecommons.org/licenses/by/4.0/).
Share and Cite
Wang, X.; Jia, K.; Liu, Y.; Zhou, H. In-Plane Impact Response of Graded Foam Concrete-Filled Auxetic Honeycombs. Materials 2023, 16, 745. https://doi.org/10.3390/ma16020745
Wang X, Jia K, Liu Y, Zhou H. In-Plane Impact Response of Graded Foam Concrete-Filled Auxetic Honeycombs. Materials. 2023; 16(2):745. https://doi.org/10.3390/ma16020745
Chicago/Turabian StyleWang, Xiaojuan, Kuncheng Jia, Yan Liu, and Hongyuan Zhou. 2023. "In-Plane Impact Response of Graded Foam Concrete-Filled Auxetic Honeycombs" Materials 16, no. 2: 745. https://doi.org/10.3390/ma16020745