Piezoresistivity and AC Impedance Spectroscopy of Cement-Based Sensors: Basic Concepts, Interpretation, and Perspective
Abstract
:1. Introduction
2. Resistance-Based Self-Sensing Concrete
2.1. Piezoresistivity Theory
2.2. Factors Affecting Piezoresistivity Measurement in Self-Sensing Concrete
2.3. Resistance Measurement Methodology
2.4. Strain and Damage Sensing
2.5. Conduction Theories
3. Equivalent Circuit Model
3.1. ACIS Theory
3.2. Equivalent Circuit Model and the Corresponding Physical Meaning
3.3. Equivalent Circuit Models of Cement-Based Sensors
4. Challenges and Future Aspects
5. Conclusions
- Piezoresistivity is a phenomenon that achieves self-sensing in cement-based sensors by distinguishing between reversible and irreversible behaviours. Moreover, the sensitivity of the piezoresistivity can be measured using the gauge factor (GF).
- Piezoresistivity depends on many factors that affect its reliability.
- The resistance measurement methodology depends on the properties of AC and DC power sources in addition to the configuration of the electrode. Additionally, using an AC power source with a high frequency is preferable to using a DC power source.
- In general, the cause of piezoresistivity in cement-based sensors depends on the orientation and displacement of conductive fillers included in the cement-based matrix under loading.
- The percolation threshold depends on the type of conductive filler, the dosage, and the aspect ratio. It can be attained through contacting conduction and the quantum tunnelling phenomenon.
- The ACIS theory and the equivalent circuit model can effectively characterise the microstructure of cement-based sensors as a non-destructive technique.
Author Contributions
Funding
Institutional Review Board Statement
Data Availability Statement
Acknowledgments
Conflicts of Interest
References
- Soh, C.-K.; Yang, Y.; Bhalla, S. Smart Materials in Structural Health Monitoring, Control and Biomechanics; Springer: Berlin/Heidelberg, Germany, 2012. [Google Scholar] [CrossRef]
- Khotiaintsev, S.; Beltrán-Hernández, A.; González-Tinoco, J.; Guzmán-Olguín, H.; Aguilar-Ramos, G. Structural Health Monitoring of Concrete Elements with Embedded Arrays of Optical Fibers. In Proceedings of the SPIE Smart Structures and Materials + Nondestructive Evaluation and Health Monitoring, San Diego, CA, USA, 10–14 March 2013. [Google Scholar]
- Klar, A.; Goldfeld, Y.; Charas, Z. Measures for Identifying Cracks within Reinforced Concrete Beams Using BOTDR; SPIE: Bellingham, WA, USA, 2010. [Google Scholar]
- Goldfeld, Y.; Klar, A. Damage Identification in Reinforced Concrete Beams Using Spatially Distributed Strain Measurements. J. Struct. Eng. 2013, 139, 4013013. [Google Scholar] [CrossRef]
- Antunes, P.; Lima, H.; Alberto, N.; Bilro, L.; Pinto, P.; Costa, A.; Rodrigues, H.; Pinto, J.L.; Nogueira, R.; Varum, H.; et al. Optical Sensors Based on Fiber Bragg Gratings for Structural Health Monitoring; Springer: Berlin/Heidelberg, Germany, 2011; Volume 96, pp. 253–295. [Google Scholar]
- Majumder, M.; Gangopadhyay, T.K.; Chakraborty, A.K.; Dasgupta, K.; Bhattacharya, D.K. Fibre Bragg gratings in structural health monitoring—Present status and applications. Sens. Actuators A Phys. 2008, 147, 150–164. [Google Scholar] [CrossRef]
- Li, H.-N.; Li, D.-S.; Song, G.-B. Recent applications of fiber optic sensors to health monitoring in civil engineering. Eng. Struct. 2004, 26, 1647–1657. [Google Scholar] [CrossRef]
- Lee, B. Review of the present status of optical fiber sensors. Opt. Fiber Technol. 2003, 9, 57–79. [Google Scholar] [CrossRef]
- Krebber, K.; Lenke, P.; Liehr, S.; Nöther, N.; Wendt, M.; Wosniok, A.; Daum, W. Structural Health Monitoring by Distributed Fiber Optic Sensors Embedded into Technical Textiles. Tm-Tech. Mess. 2012, 79, 337–347. [Google Scholar] [CrossRef]
- Montanini, R.; De Domenico, F.; Freni, F.; Maugeri, N.; Recupero, A. Structural Health Monitoring of Reinforced Concrete Beams by Means of Embedded Fiber Bragg Grating Sensors. In Proceedings of the 22th International Conference on Optical Fiber Sensors (OFS-22), Beijing, China, 15–19 October 2012. [Google Scholar]
- Taheri, S. A review on five key sensors for monitoring of concrete structures. Constr. Build. Mater. 2019, 204, 492–509. [Google Scholar] [CrossRef]
- Tian, Z.; Li, Y.; Zheng, J.; Wang, S. A state-of-the-art on self-sensing concrete: Materials, fabrication and properties. Compos. Part B Eng. 2019, 177, 107437. [Google Scholar] [CrossRef]
- Meoni, A.; D’Alessandro, A.; Mancinelli, M.; Ubertini, F. A Multichannel Strain Measurement Technique for Nanomodified Smart Cement-Based Sensors in Reinforced Concrete Structures. Sensors 2021, 21, 5633. [Google Scholar] [CrossRef]
- Han, B.; Ding, S.; Yu, X. Intrinsic self-sensing concrete and structures: A review. Meas. J. Int. Meas. Confed. 2015, 59, 110–128. [Google Scholar] [CrossRef]
- Alexander, C.; Sadiku, M. Fundamentals of Electric Circuits; McGraw-Hill Education: New York, NY, USA, 2016. [Google Scholar]
- Dong, W.; Li, W.; Tao, Z.; Wang, K. Piezoresistive properties of cement-based sensors: Review and perspective. Constr. Build. Mater. 2019, 203, 146–163. [Google Scholar] [CrossRef]
- Rana, S.; Subramani, P.; Fangueiro, R.; Correia, A.G. A review on smart self-sensing composite materials for civil engineering applications. AIMS Mater. Sci. 2016, 3, 357–379. [Google Scholar] [CrossRef]
- Chung, D.D.L. Carbon materials for structural self-sensing, electromagnetic shielding and thermal interfacing. Carbon 2012, 50, 3342–3353. [Google Scholar] [CrossRef]
- Chung, D.D.L. Self-sensing concrete: From resistance-based sensing to capacitance-based sensing. Int. J. Smart Nano Mater. 2021, 12, 1–19. [Google Scholar] [CrossRef]
- Han, B.; Zhang, K.; Burnham, T.; Kwon, E.; Yu, X. Integration and road tests of a self-sensing CNT concrete pavement system for traffic detection. Smart Mater. Struct. 2012, 22, 15020. [Google Scholar] [CrossRef]
- Lu, Y.; Zhang, J.; Li, Z.; Dong, B. Corrosion monitoring of reinforced concrete beam using embedded cement-based piezoelectric sensor. Mag. Concr. Res. 2013, 65, 1265–1276. [Google Scholar] [CrossRef]
- Wen, S.; Chung, D.D.L. Carbon fiber-reinforced cement as a strain-sensing coating. Cem. Concr. Res. 2001, 31, 665–667. [Google Scholar] [CrossRef]
- Downey, A.; D’Alessandro, A.; Laflamme, S.; Ubertini, F. Smart bricks for strain sensing and crack detection in masonry structures. Smart Mater. Struct. 2017, 27, 15009. [Google Scholar] [CrossRef]
- Sassani, A.; Arabzadeh, A.; Ceylan, H.; Kim, S.; Sadati, S.M.S.; Gopalakrishnan, K.; Taylor, P.C.; Abdualla, H. Carbon fiber-based electrically conductive concrete for salt-free deicing of pavements. J. Clean. Prod. 2018, 203, 799–809. [Google Scholar] [CrossRef]
- Galao, O.; Baeza, F.J.; Zornoza, E.; Garcés, P. Strain and damage sensing properties on multifunctional cement composites with CNF admixture. Cem. Concr. Compos. 2014, 46, 90–98. [Google Scholar] [CrossRef]
- Han, B.; Yu, X.; Kwon, E. A self-sensing carbon nanotube/cement composite for traffic monitoring. Nanotechnology 2009, 20, 445501. [Google Scholar] [CrossRef]
- Spinelli, G.; Lamberti, P.; Tucci, V.; Guadagno, L.; Vertuccio, L. Damage monitoring of structural resins loaded with carbon fillers: Experimental and theoretical study. Nanomaterials 2020, 10, 434. [Google Scholar] [CrossRef] [PubMed]
- Murray, C.M.; Doshi, S.M.; Sung, D.H.; Thostenson, E.T. Hierarchical composites with electrophoretically deposited carbon nanotubes for in situ sensing of deformation and damage. Nanomaterials 2020, 10, 1262. [Google Scholar] [CrossRef] [PubMed]
- Meoni, A.; D’Alessandro, A.; Downey, A.; Laflamme, S.; Ubertini, F. Strain Monitoring in Masonry Structures Using Smart Bricks. In Proceedings of the Sensors and Smart Structures Technologies for Civil, Mechanical, and Aerospace Systems 2018; Sohn, H., Ed.; SPIE: Bellingham, WA, USA, 2018. [Google Scholar]
- Sun, M.-q.; Liew, R.J.Y.; Zhang, M.-H.; Li, W. Development of cement-based strain sensor for health monitoring of ultra high strength concrete. Constr. Build. Mater. 2014, 65, 630–637. [Google Scholar] [CrossRef]
- Chen, P.-W.; Chung, D.D.L. Carbon fiber reinforced concrete for smart structures capable of non-destructive flaw detection. Smart Mater. Struct. 1993, 2, 22–30. [Google Scholar] [CrossRef]
- Wen, S.; Chung, D.D.L. Uniaxial tension in carbon fiber reinforced cement, sensed by electrical resistivity measurement in longitudinal and transverse directions. Cem. Concr. Res. 2000, 30, 1289–1294. [Google Scholar] [CrossRef]
- Wen, S.; Chung, D.D.L. Uniaxial compression in carbon fiber-reinforced cement, sensed by electrical resistivity measurement in longitudinal and transverse directions. Cem. Concr. Res. 2001, 31, 297–301. [Google Scholar] [CrossRef]
- Wen, S.; Chung, D.D.L. Strain-sensing characteristics of carbon fiber-reinforced cement. ACI Mater. J. 2005, 102, 244–248. [Google Scholar] [CrossRef]
- Wen, S.; Chung, D.D.L. Self-sensing of flexural damage and strain in carbon fiber reinforced cement and effect of embedded steel reinforcing bars. Carbon 2006, 44, 1496–1502. [Google Scholar] [CrossRef]
- Wen, S.; Chung, D.D.L. Piezoresistivity-based strain sensing in carbon fiber-reinforced cement. ACI Mater. J. 2007, 104, 171–179. [Google Scholar] [CrossRef]
- Wen, S.; Chung, D.D.L. Electrical-resistance-based damage self-sensing in carbon fiber reinforced cement. Carbon 2007, 45, 710–716. [Google Scholar] [CrossRef]
- Cao, J.; Chung, D.D.L. Electric polarization and depolarization in cement-based materials, studied by apparent electrical resistance measurement. Cem. Concr. Res. 2004, 34, 481–485. [Google Scholar] [CrossRef]
- Chen, B.; Liu, J.; Wu, K. Electrical responses of carbon fiber reinforced cementitious composites to monotonic and cyclic loading. Cem. Concr. Res. 2005, 35, 2183–2191. [Google Scholar] [CrossRef]
- Han, B.; Guan, X.; Ou, J. Electrode design, measuring method and data acquisition system of carbon fiber cement paste piezoresistive sensors. Sens. Actuators A Phys. 2007, 135, 360–369. [Google Scholar] [CrossRef]
- Vilaplana, J.L.; Baeza, F.J.; Galao, O.; Zornoza, E.; Garcés, P. Self-sensing properties of alkali activated blast furnace slag (BFS) composites reinforced with carbon fibers. Materials 2013, 6, 4776–4786. [Google Scholar] [CrossRef]
- Reza, F.; Batson, G.B.; Yamamuro, J.A.; Lee, J.S. Resistance Changes during Compression of Carbon Fiber Cement Composites. J. Mater. Civ. Eng. 2003, 15, 476–483. [Google Scholar] [CrossRef]
- Chung, D.D.L. A critical review of piezoresistivity and its application in electrical-resistance-based strain sensing. J. Mater. Sci. 2020, 55, 15367–15396. [Google Scholar] [CrossRef]
- Barlian, A.A.; Park, W.T.; Mallon, J.R.; Rastegar, A.J.; Pruitt, B.L. Review: Semiconductor Piezoresistance for Microsystems. Proc. IEEE 2009, 97, 513–552. [Google Scholar] [CrossRef]
- Monteiro, A.O.; Cachim, P.B.; Costa, P.M.F.J. Self-sensing piezoresistive cement composite loaded with carbon black particles. Cem. Concr. Compos. 2017, 81, 59–65. [Google Scholar] [CrossRef]
- Huang, Y.; Li, H.; Qian, S. Self-sensing properties of Engineered Cementitious Composites. Constr. Build. Mater. 2018, 174, 253–262. [Google Scholar] [CrossRef]
- Pârvan, M.-G.; Voicu, G.; Bădănoiu, A.-I. Study of hydration and hardening processes of self-sensing cement-based materials with carbon black content. J. Therm. Anal. Calorim. 2019, 139, 807–815. [Google Scholar] [CrossRef]
- Dong, W.; Li, W.; Wang, K.; Vessalas, K.; Zhang, S. Mechanical strength and self-sensing capacity of smart cementitious composite containing conductive rubber crumbs. J. Intell. Mater. Syst. Struct. 2020, 31, 1325–1340. [Google Scholar] [CrossRef]
- Han, B.; Wang, Y.; Ding, S.; Yu, X.; Zhang, L.; Li, Z.; Ou, J. Self-sensing cementitious composites incorporated with botryoid hybrid nano-carbon materials for smart infrastructures. J. Intell. Mater. Syst. Struct. 2017, 28, 699–727. [Google Scholar] [CrossRef]
- Fu, X.; Chung, D.D.L. Submicron carbon filament cement-matrix composites for electromagnetic interference shielding. Cem. Concr. Res. 1996, 26, 1467–1472. [Google Scholar] [CrossRef]
- Wen, S.; Chung, D.D.L. A comparative study of steel- and carbon-fibre cement as piezoresistive strain sensors. Adv. Cem. Res. 2003, 15, 119–128. [Google Scholar] [CrossRef]
- Wen, S.; Chung, D.D.L. Electric polarization in carbon fiber-reinforced cement. Cem. Concr. Res. 2001, 31, 141–147. [Google Scholar] [CrossRef]
- Abedi, M.; Fangueiro, R.; Gomes Correia, A. A review of intrinsic self-sensing cementitious composites and prospects for their application in transport infrastructures. Constr. Build. Mater. 2021, 310, 125139. [Google Scholar] [CrossRef]
- Han, J.; Pan, J.; Cai, J.; Li, X. A review on carbon-based self-sensing cementitious composites. Constr. Build. Mater. 2020, 265, 120764. [Google Scholar] [CrossRef]
- Zhang, T.; Zhang, K.; Liu, W. Exact impact response of multi-layered cement-based piezoelectric composite considering electrode effect. J. Intell. Mater. Syst. Struct. 2019, 30, 400–415. [Google Scholar] [CrossRef]
- Chen, P.-W.; Chung, D.D.L. Carbon-Fiber-Reinforced Concrete as an Intrinsically Smart Concrete for Damage Assessment during Dynamic Loading. J. Am. Ceram. Soc. 1995, 78, 816–818. [Google Scholar] [CrossRef]
- Han, B.; Yu, X.; Ou, J. Chapter 6-Sensing Mechanisms of Self-Sensing Concrete. In Self-Sensing Concrete in Smart Structures; Han, B., Yu, X., Ou, J., Eds.; Butterworth-Heinemann: Oxford, UK, 2014; pp. 163–187. [Google Scholar] [CrossRef]
- Wen, S.; Chung, D.D.L. Effect of moisture on piezoresistivity of carbon fiber-reinforced cement paste. ACI Mater. J. 2008, 105, 274–280. [Google Scholar] [CrossRef]
- Jiang, C.; Li, Z.; Song, X.; Lu, Y. Mechanism of Functional Responses to Loading of Carbon Fiber Reinforced Cement-based Composites. J. Wuhan Univ. Technol. Mater. Sci. Ed. 2008, 23, 571–573. [Google Scholar] [CrossRef]
- Chung, D.D.L. Piezoresistive Cement-Based Materials for Strain Sensing. J. Intell. Mater. Syst. Struct. 2002, 13, 599–609. [Google Scholar] [CrossRef]
- Fu, X.; Chung, D.D.L. Contact electrical resistivity between cement and carbon fiber: Its decrease with increasing bond strength and its increase during fiber pull-out. Cem. Concr. Res. 1995, 25, 1391–1396. [Google Scholar] [CrossRef]
- Fu, X.; Chung, D.D.L. Sensitivity of the bond strength to the structure of the interface between reinforcement and cement, and the variability of this structure. Cem. Concr. Res. 1998, 28, 787–793. [Google Scholar] [CrossRef]
- Li, G.Y.; Wang, P.M.; Zhao, X. Pressure-sensitive properties and microstructure of carbon nanotube reinforced cement composites. Cem. Concr. Compos. 2007, 29, 377–382. [Google Scholar] [CrossRef]
- Dai, H.; Tombler, T.W.; Zhou, C.; Alexseyev, L.; Kong, J.; Liu, L.; Jayanthi, C.S.; Tang, M.; Wu, S.-Y. Reversible electromechanical characteristics of carbon nanotubes under local-probe manipulation. Nature 2000, 405, 769–772. [Google Scholar] [CrossRef]
- Hou, T.-C.; Lynch, J.P. Conductivity-Based Strain Monitoring and Damage Characterization of Fiber Reinforced Cementitious Structural Components. Proc. SPIE 2005, 5765, 419–429. [Google Scholar]
- Han, B.; Zhang, K.; Yu, X.; Kwon, E.; Ou, J. Electrical characteristics and pressure-sensitive response measurements of carboxyl MWNT/cement composites. Cem. Concr. Compos. 2012, 34, 794–800. [Google Scholar] [CrossRef]
- Wen, S.; Chung, D.D.L. The role of electronic and ionic conduction in the electrical conductivity of carbon fiber reinforced cement. Carbon 2006, 44, 2130–2138. [Google Scholar] [CrossRef]
- Chung, D.D.L. Cement reinforced with short carbon fibers: A multifunctional material. Compos. Part B Eng. 2000, 31, 511–526. [Google Scholar] [CrossRef]
- Baeza, F.J.; Galao, O.; Zornoza, E.; Garcés, P. Effect of aspect ratio on strain sensing capacity of carbon fiber reinforced cement composites. Mater. Des. 2013, 51, 1085–1094. [Google Scholar] [CrossRef]
- Cao, J.; Chung, D.D.L. Carbon fiber reinforced cement mortar improved by using acrylic dispersion as an admixture. Cem. Concr. Res. 2001, 31, 1633–1637. [Google Scholar] [CrossRef]
- Coppola, L.; Buoso, A.; Corazza, F. Electrical properties of carbon nanotubes cement composites for monitoring stress conditions in concrete structures. Appl. Mech. Mater. 2011, 82, 118–123. [Google Scholar] [CrossRef]
- Kim, H.K.; Park, I.S.; Lee, H.K. Improved piezoresistive sensitivity and stability of CNT/cement mortar composites with low water–binder ratio. Compos. Struct. 2014, 116, 713–719. [Google Scholar] [CrossRef]
- Sun, S.; Han, B.; Jiang, S.; Yu, X.; Wang, Y.; Li, H.; Ou, J. Nano graphite platelets-enabled piezoresistive cementitious composites for structural health monitoring. Constr. Build. Mater. 2017, 136, 314–328. [Google Scholar] [CrossRef]
- Song, G. Equivalent circuit model for AC electrochemical impedance spectroscopy of concrete. Cem. Concr. Res. 2000, 30, 1723–1730. [Google Scholar] [CrossRef]
- Wang, R.; He, F.; Shi, C.; Zhang, D.; Chen, C.; Dai, L. AC impedance spectroscopy of cement-based materials: Measurement and interpretation. Cem. Concr. Compos. 2022, 131, 104591. [Google Scholar] [CrossRef]
- Hu, X.; Shi, C.; Liu, X.; Zhang, J.; de Schutter, G. A review on microstructural characterization of cement-based materials by AC impedance spectroscopy. Cem. Concr. Compos. 2019, 100, 1–14. [Google Scholar] [CrossRef]
- Chen, P.-W.; Chung, D.D.L. Concrete as a new strain/stress sensor. Compos. Part B Eng. 1996, 27, 11–23. [Google Scholar] [CrossRef]
- Le, J.-L.; Du, H.; Pang, S.D. Use of 2D Graphene Nanoplatelets (GNP) in cement composites for structural health evaluation. Compos. Part B Eng. 2014, 67, 555–563. [Google Scholar] [CrossRef]
- Yoo, D.-Y.; Kim, S.; Lee, S.H. Self-sensing capability of ultra-high-performance concrete containing steel fibers and carbon nanotubes under tension. Sens. Actuators A Phys. 2018, 276, 125–136. [Google Scholar] [CrossRef]
- Park, J.-M.; Jang, J.-H.; Wang, Z.-J.; Kwon, D.-J.; DeVries, K.L. Self-sensing of carbon fiber/carbon nanofiber–epoxy composites with two different nanofiber aspect ratios investigated by electrical resistance and wettability measurements. Compos. Part A Appl. Sci. Manuf. 2010, 41, 1702–1711. [Google Scholar] [CrossRef]
- Chen, B.; Wu, K.; Yao, W. Conductivity of carbon fiber reinforced cement-based composites. Cem. Concr. Compos. 2004, 26, 291–297. [Google Scholar] [CrossRef]
- Luheng, W.; Tianhuai, D.; Peng, W. Influence of carbon black concentration on piezoresistivity for carbon-black-filled silicone rubber composite. Carbon 2009, 47, 3151–3157. [Google Scholar] [CrossRef]
- Li, H.; Xiao, H.-G.; Ou, J.-P. Effect of compressive strain on electrical resistivity of carbon black-filled cement-based composites. Cem. Concr. Compos. 2006, 28, 824–828. [Google Scholar] [CrossRef]
- Wen, S.; Chung, D.D.L. Partial replacement of carbon fiber by carbon black in multifunctional cement–matrix composites. Carbon 2007, 45, 505–513. [Google Scholar] [CrossRef]
- García, Á.; Schlangen, E.; van de Ven, M.; Liu, Q. Electrical conductivity of asphalt mortar containing conductive fibers and fillers. Constr. Build. Mater. 2009, 23, 3175–3181. [Google Scholar] [CrossRef]
- Konsta-Gdoutos, M.S.; Aza, C.A. Self sensing carbon nanotube (CNT) and nanofiber (CNF) cementitious composites for real time damage assessment in smart structures. Cem. Concr. Compos. 2014, 53, 162–169. [Google Scholar] [CrossRef]
- Dai, Y.; Sun, M.; Liu, C.; Li, Z. Electromagnetic wave absorbing characteristics of carbon black cement-based composites. Cem. Concr. Compos. 2010, 32, 508–513. [Google Scholar] [CrossRef]
- Siad, H.; Lachemi, M.; Sahmaran, M.; Mesbah, H.A.; Hossain, K.A. Advanced engineered cementitious composites with combined self-sensing and self-healing functionalities. Constr. Build. Mater. 2018, 176, 313–322. [Google Scholar] [CrossRef]
- Nam, I.W.; Kim, H.K.; Lee, H.K. Influence of silica fume additions on electromagnetic interference shielding effectiveness of multi-walled carbon nanotube/cement composites. Constr. Build. Mater. 2012, 30, 480–487. [Google Scholar] [CrossRef]
- Yu, X.; Kwon, E. A carbon nanotube/cement composite with piezoresistive properties. Smart Mater. Struct. 2009, 18, 055010. [Google Scholar] [CrossRef]
- Kyi, A.A.; Batchelor, B. An electrical conductivity method for measuring the effects of additives on effective diffusivities in portland cement pastes. Cem. Concr. Res. 1994, 24, 752–764. [Google Scholar] [CrossRef]
- Chung, D.D.L. Dispersion of short fibers in cement. J. Mater. Civ. Eng. 2005, 17, 379–383. [Google Scholar] [CrossRef]
- Kim, G.M.; Yang, B.J.; Cho, K.J.; Kim, E.M.; Lee, H.K. Influences of CNT dispersion and pore characteristics on the electrical performance of cementitious composites. Compos. Struct. 2017, 164, 32–42. [Google Scholar] [CrossRef]
- Ferraris, C.F.; Obla, K.H.; Hill, R. The influence of mineral admixtures on the rheology of cement paste and concrete. Cem. Concr. Res. 2001, 31, 245–255. [Google Scholar] [CrossRef]
- Wang, M.; Chung, D.D.L. Understanding the increase of the electric permittivity of cement caused by latex addition. Compos. Part B Eng. 2018, 134, 177–185. [Google Scholar] [CrossRef]
- Papo, A.; Piani, L. Effect of various superplasticizers on the rheological properties of Portland cement pastes. Cem. Concr. Res. 2004, 34, 2097–2101. [Google Scholar] [CrossRef]
- Wen, S.; Chung, D.D.L. Carbon fiber-reinforced cement as a thermistor. Cem. Concr. Res. 1999, 29, 961–965. [Google Scholar] [CrossRef]
- Vipulanandan, C.; Mohammed, A. Smart cement rheological and piezoresistive behavior for oil well applications. J. Pet. Sci. Eng. 2015, 135, 50–58. [Google Scholar] [CrossRef]
- Reza, F.; Batson, G.B.; Yamamuro, J.A.; Lee, J.S. Volume electrical resistivity of carbon fiber cement composites. ACI Mater. J. 2001, 98, 25–35. [Google Scholar]
- Fu, X.; Chung, D.D.L. Effect of curing age on the self-monitoring behavior of carbon fiber reinforced mortar. Cem. Concr. Res. 1997, 27, 1313–1318. [Google Scholar] [CrossRef]
- Xiao, H.; Li, H.; Ou, J. Modeling of piezoresistivity of carbon black filled cement-based composites under multi-axial strain. Sens. Actuators A Phys. 2010, 160, 87–93. [Google Scholar] [CrossRef]
- Fu, X.; Chung, D.D.L. Self-monitoring of fatigue damage in carbon fiber reinforced cement. Cem. Concr. Res. 1996, 26, 15–20. [Google Scholar] [CrossRef]
- Wu, B.; Huang, X.-J.; Lu, J.-Z. Biaxial compression in carbon-fiber-reinforced mortar, sensed by electrical resistance measurement. Cem. Concr. Res. 2005, 35, 1430–1434. [Google Scholar] [CrossRef]
- Wang, W.; Dai, H.; Wu, S. Mechanical behavior and electrical property of CFRC-strengthened RC beams under fatigue and monotonic loading. Mater. Sci. Eng. A 2008, 479, 191–196. [Google Scholar] [CrossRef]
- Banthia, N.; Djeridane, S.; Pigeon, M. Electrical resistivity of carbon and steel micro-fiber reinforced cements. Cem. Concr. Res. 1992, 22, 804–814. [Google Scholar] [CrossRef]
- Azhari, F. Cement-Based Sensors for Structural Health Monitoring. Master’s Thesis, University of British Columbia, Vancouver, BC, Canada, 2008. [Google Scholar]
- Cai, H.; Liu, X. Freeze-thaw durability of concrete: Ice formation process in pores. Cem. Concr. Res. 1998, 28, 1281–1287. [Google Scholar] [CrossRef]
- Cao, J.; Chung, D.D.L. Damage evolution during freeze–thaw cycling of cement mortar, studied by electrical resistivity measurement. Cem. Concr. Res. 2002, 32, 1657–1661. [Google Scholar] [CrossRef]
- Ding, Y.; Huang, Y.; Zhang, Y.; Jalali, S.; Aguiar, J.B. Self-monitoring of freeze–thaw damage using triphasic electric conductive concrete. Constr. Build. Mater. 2015, 101, 440–446. [Google Scholar] [CrossRef]
- Shen, J.T.; Buschhorn, S.T.; De Hosson, J.T.M.; Schulte, K.; Fiedler, B. Pressure and temperature induced electrical resistance change in nano-carbon/epoxy composites. Compos. Sci. Technol. 2015, 115, 1–8. [Google Scholar] [CrossRef]
- Li, H.; Xiao, H.; Ou, J. Electrical property of cement-based composites filled with carbon black under long-term wet and loading condition. Compos. Sci. Technol. 2008, 68, 2114–2119. [Google Scholar] [CrossRef]
- Wen, S.; Chung, D.D.L. Spatially resolved self-sensing of strain and damage in carbon fiber cement. J. Mater. Sci. 2006, 41, 4823–4831. [Google Scholar] [CrossRef]
- Hou, T.-C.; Lynch, J.P. Electrical Impedance Tomographic Methods for Sensing Strain Fields and Crack Damage in Cementitious Structures. J. Intell. Mater. Syst. Struct. 2009, 20, 1363–1379. [Google Scholar] [CrossRef]
- Chung, D.D.L. Strain sensors based on the electrical resistance change accompanying the reversible pull-out of conducting short fibers in a less conducting matrix. Smart Mater. Struct. 1995, 4, 59–61. [Google Scholar] [CrossRef]
- Cao, J.; Chung, D.D.L. Minor damage of cement mortar during cyclic compression, monitored by electrical resistivity measurement. Cem. Concr. Res. 2001, 31, 1519–1521. [Google Scholar] [CrossRef]
- Chung, D.D.L. Carbon Composites: Composites with Carbon Fibers, Nanofibers, and Nanotubes, 2nd ed.; Butterworth-Heinemann: Oxford, UK, 2017. [Google Scholar]
- Konkanov, M.; Salem, T.; Jiao, P.; Niyazbekova, R.; Lajnef, N. Environment-friendly, self-sensing concrete blended with byproduct wastes. Sensors 2020, 20, 1925. [Google Scholar] [CrossRef]
- Wen, S.; Chung, D.D.L. Model of piezoresistivity in carbon fiber cement. Cem. Concr. Res. 2006, 36, 1879–1885. [Google Scholar] [CrossRef]
- Zhu, S.; Chung, D.D.L. Theory of piezoresistivity for strain sensing in carbon fiber reinforced cement under flexure. J. Mater. Sci. 2007, 42, 6222–6233. [Google Scholar] [CrossRef]
- Han, B.; Yu, X.; Ou, J. Multifunctional and Smart Carbon Nanotube Reinforced Cement-Based Materials; Springer: Berlin/Heidelberg, Germany, 2011; pp. 1–47. [Google Scholar] [CrossRef]
- Han, B.; Wang, Y.; Sun, S.; Yu, X.; Ou, J. Nanotip-induced ultrahigh pressure-sensitive composites: Principles, properties and applications. Compos. Part A Appl. Sci. Manuf. 2014, 59, 105–114. [Google Scholar] [CrossRef]
- Kaiser, A.B.; Park, Y.W. Current-voltage characteristics of conducting polymers and carbon nanotubes. Synth. Met. 2005, 152, 181–184. [Google Scholar] [CrossRef]
- Han, B.; Yu, X.; Ou, J. Effect of water content on the piezoresistivity of MWNT/cement composites. J. Mater. Sci. 2010, 45, 3714–3719. [Google Scholar] [CrossRef]
- Zhao, Y.; Cai, J.; Luo, H.; Kang, S.; Qian, W.; Dong, C. Low pressure hydrogen sensing based on carbon nanotube field emission: Mechanism of atomic adsorption induced work function effects. Carbon 2017, 124, 669–674. [Google Scholar] [CrossRef]
- Celzard, A.; McRae, E.; Furdin, G.; Marêché, J.F. Conduction mechanisms in some graphite-polymer composites: The effect of a direct-current electric field. J. Phys. Condens. Matter 1997, 9, 2225–2237. [Google Scholar] [CrossRef]
- Chen, K.; Xiong, C.; Li, L.; Zhou, L.; Lei, Y.; Dong, L. Conductive mechanism of antistatic poly(ethylene terephthalate)/ZnOw composites. Polym. Compos. 2009, 30, 226–231. [Google Scholar] [CrossRef]
- Gong, S.; Zhu, Z.H.; Li, Z. Electron tunnelling and hopping effects on the temperature coefficient of resistance of carbon nanotube/polymer nanocomposites. Phys. Chem. Chem. Phys. 2017, 19, 5113–5120. [Google Scholar] [CrossRef]
- van Beek, L.K.H.; van Pul, B.I.C.F. Internal field emission in carbon black-loaded natural rubber vulcanizates. J. Appl. Polym. Sci. 1962, 6, 651–655. [Google Scholar] [CrossRef]
- Zhang, Z.M.; Zhang, Z.M.; Luby. Nano/Microscale Heat Transfer; Springer: Cham, Switzerland, 2007; Volume 410. [Google Scholar]
- Xu, J.; Zhong, W.; Yao, W. Modeling of conductivity in carbon fiber-reinforced cement-based composite. J. Mater. Sci. 2010, 45, 3538–3546. [Google Scholar] [CrossRef]
- Bueche, F. Electrical resistivity of conducting particles in an insulating matrix. J. Appl. Phys. 1972, 43, 4837–4838. [Google Scholar] [CrossRef]
- Aharoni, S.M. Electrical resistivity of a composite of conducting particles in an insulating matrix. J. Appl. Phys. 1972, 43, 2463–2465. [Google Scholar] [CrossRef]
- McLachlan, D.S.; Blaszkiewicz, M.; Newnham, R.E. Electrical Resistivity of Composites. J. Am. Ceram. Soc. 1990, 73, 2187–2203. [Google Scholar] [CrossRef]
- Nan, C.W.; Shen, Y.; Ma, J. Physical properties of composites near percolation. Annu. Rev. Mater. Res. 2010, 40, 131–151. [Google Scholar] [CrossRef]
- Motaghi, A.; Hrymak, A.; Motlagh, G.H. Electrical conductivity and percolation threshold of hybrid carbon/polymer composites. J. Appl. Polym. Sci. 2015, 132, 41744. [Google Scholar] [CrossRef]
- Brigandi, P.J.; Cogen, J.M.; Pearson, R.A. Electrically conductive multiphase polymer blend carbon-based composites. Polym. Eng. Sci. 2014, 54, 1–16. [Google Scholar] [CrossRef]
- Han, J.; Pan, J.; Cai, J. Self-sensing properties and piezoresistive effect of high ductility cementitious composite. Constr. Build. Mater. 2022, 323, 126390. [Google Scholar] [CrossRef]
- Chen, P.-W.; Chung, D.D.L. Improving the electrical conductivity of composites comprised of short conducting fibers in a nonconducting matrix: The addition of a nonconducting particulate filler. J. Electron. Mater. 1995, 24, 47–51. [Google Scholar] [CrossRef]
- Wen, S.; Chung, D.D.L. Double percolation in the electrical conduction in carbon fiber reinforced cement-based materials. Carbon 2007, 45, 263–267. [Google Scholar] [CrossRef]
- Javier Baeza, F.; Chung, D.D.L.; Zornoza, E.; Andión, L.G.; Garcés, P. Triple percolation in concrete reinforced with carbon fiber. ACI Mater. J. 2010, 107, 396–402. [Google Scholar] [CrossRef]
- Zhang, X.W.; Pan, Y.; Zheng, Q.; Yi, X.S. Time dependence of piezoresistance for the conductor-filled polymer composites. J. Polym. Sci. Part B Polym. Phys. 2000, 38, 2739–2749. [Google Scholar] [CrossRef]
- Srinivasan, R.; Fasmin, F. An Introduction to Electrochemical Impedance Spectroscopy; Taylor & Francis Group: Milton, ON, Canada, 2021. [Google Scholar]
- Sato, T. An AC Impedance Spectroscopy Study of the Freezing-Thawing Durability of Wollastonite Micro-Fibre Reinforced Cement Paste; University of Ottawa: Ottawa, ON, Canada, 2002. [Google Scholar]
- Woo, L.Y. Characterizing Fiber-Reinforced Composite Structures Using AC-Impedance Spectroscopy (AC-IS). Ph.D. Thesis, Northwestern University, Ann Arbor, MI, USA, 2005. [Google Scholar]
- Cooper., S.J. Introduction to Electrochemical Impedance Spectroscopy (EIS: Maths and Theory). Available online: https://www.imperial.ac.uk/people/samuel.cooper (accessed on 4 December 2022).
- Iqbal, K.I.M. Electrical Characterization of Conductive Concrete Containing Graphite Powder. Master’s Thesis, The University of Texas Rio Grande Valley, Edinburg, TX, USA, 2021. [Google Scholar]
- Vladikova, D. The technique of the differential impedance analysis: Part I. Basics of the impedance spectroscopy. In Proceedings of the Advanced Techniques for Energy Sources Investigation and Testing, Sofia, Bulgaria, 4–9 September 2004. [Google Scholar]
- Kanoun, O. Impedance Spectroscopy: Advanced Applications: Battery Research, Bioimpedance, System Design; Walter de Gruyter: Berlin, Germany; Boston, MA, USA, 2018. [Google Scholar]
- Macdonald, J.R.; Barsoukov, E. Impedance Spectroscopy: Theory, Experiment, and Applications; John Wiley & Sons: Hoboken, NJ, USA, 2018. [Google Scholar]
- McCarter, W.J.; Brousseau, R. The A.C. response of hardened cement paste. Cem. Concr. Res. 1990, 20, 891–900. [Google Scholar] [CrossRef]
- Vladikova, D. The technique of the differential impedance analysis: Part II. Differential impedance analysis. In Proceedings of the Advanced Techniques for Energy Sources Investigation and Testing, Sofia, Bulgaria, 4–9 September 2004. [Google Scholar]
- Ortega, J.M.; Sánchez, I.; Climent, M.A. Impedance spectroscopy study of the effect of environmental conditions in the microstructure development of OPC and slag cement mortars. Arch. Civ. Mech. Eng. 2014, 15, 569–583. [Google Scholar] [CrossRef]
- Cabeza, M.; Merino, P.; Miranda, A.; Nóvoa, X.R.; Sanchez, I. Impedance spectroscopy study of hardened Portland cement paste. Cem. Concr. Res. 2002, 32, 881–891. [Google Scholar] [CrossRef]
- He, F.; Wang, R.; Shi, C.; Chen, C.; Lin, L.; An, X. Error evaluation and correction of stray impedance during measurement and interpretation of AC impedance of cement-based materials. Cem. Concr. Compos. 2016, 72, 190–200. [Google Scholar] [CrossRef]
- Huang, Q.-A.; Hui, R.; Wang, B.; Zhang, J. A review of AC impedance modeling and validation in SOFC diagnosis. Electrochim. Acta 2007, 52, 8144–8164. [Google Scholar] [CrossRef]
- Gu, P.; Xie, P.; Beaudoin, J.J.; Brousseau, R.A.C. impedance spectroscopy (I): A new equivalent circuit model for hydrated portland cement paste. Cem. Concr. Res. 1992, 22, 833–840. [Google Scholar] [CrossRef]
- Xie, P.; Gu, P.; Xu, Z.; Beaudoin, J.J. A rationalized a.c. impedence model for microstructural characterization of hydrating cement systems. Cem. Concr. Res. 1993, 23, 359–367. [Google Scholar] [CrossRef]
- Coverdale, R.T.; Christensen, B.J.; Mason, T.O.; Jennings, H.M.; Garboczi, E.J. Interpretation of the impedance spectroscopy of cement paste via computer modelling-Part II Dielectric response. J. Mater. Sci. 1994, 29, 4984–4992. [Google Scholar] [CrossRef]
- Ford, S.J.; Hwang, J.H.; Shane, J.D.; Olson, R.A.; Moss, G.M.; Jennings, H.M.; Mason, T.O. Dielectric amplification in cement pastes. Adv. Cem. Based Mater. 1997, 5, 41–48. [Google Scholar] [CrossRef]
- Macphee, D.E.; Sinclair, D.C.; Cormack, S.L. Development of an Equivalent Circuit Model for Cement Pastes from Microstructural Considerations. J. Am. Ceram. Soc. 1997, 80, 2876–2884. [Google Scholar] [CrossRef]
- Macphee, D.E.; Sinclair, D.C.; Stubbs, S.L. Electrical characterization of pore reduced cement by impedance spectroscopy. J. Mater. Sci. Lett. 1996, 15, 1566–1568. [Google Scholar] [CrossRef]
- McCarter, W.J. A parametric study of the impedance characteristics of cement-aggregate systems during early hydration. Cem. Concr. Res. 1994, 24, 1097–1110. [Google Scholar] [CrossRef]
- McCarter, W.; Garvin, S. Dependence of electrical impedance of cement-based materials on their moisture condition. J. Phys. D Appl. Phys. 1989, 22, 1773. [Google Scholar] [CrossRef]
- Gu, P.; Xie, P.; Fu, Y.; Beaudoin, J.J. AC impedance phenomena in hydrating cement systems: Frequency dispersion angle and pore size distribution. Cem. Concr. Res. 1994, 24, 86–88. [Google Scholar] [CrossRef]
- Gu, P.; Xie, P.; Fu, Y.; Beaudoin, J.J. AC impedance phenomena in hydrating cement systems, The drying-rewetting process. Cem. Concr. Res. 1994, 24, 89–91. [Google Scholar] [CrossRef]
- Shi, M.; Chen, Z.; Sun, J. Determination of chloride diffusivity in concrete by AC impedance spectroscopy. Cem. Concr. Res. 1999, 29, 1111–1115. [Google Scholar] [CrossRef]
- Le, H.V.; Kim, M.K.; Kim, D.J.; Park, J. Electrical properties of smart ultra-high performance concrete under various temperatures, humidities, and age of concrete. Cem. Concr. Compos. 2021, 118, 103979. [Google Scholar] [CrossRef]
- Fita, I.C.; Cruz, J.M.; Bouzón, N.; Borrachero, M.V.; Payá, J. Monitoring the pozzolanic effect of fly ash in blended OPC mortars by electrical impedance spectroscopy. Constr. Build. Mater. 2022, 314, 125632. [Google Scholar] [CrossRef]
- Ma, C.; Liu, Y.; Song, D.; Cao, L.; He, F.; Liu, X.; Zhou, H. Characterizing the influencing factors in a novel repairing material for concrete structures by AC impedance spectroscopy. J. Build. Eng. 2022, 47, 103858. [Google Scholar] [CrossRef]
- Shrivastava, M.; Tsegaye, H.; Kumar, S.; Venkatanarayanan Harish, K. Assessment of hydration behaviour of Portland Cement-Based materials containing brick powders as partial replacement for fine aggregates. Mater. Today Proc. 2022, 65, 1095–1104. [Google Scholar] [CrossRef]
- da Silva, G.F.; Martini, S.; Moraes, J.C.B.; Teles, L.K. AC impedance spectroscopy (AC-IS) analysis to characterize the effect of nanomaterials in cement-based mortars. Constr. Build. Mater. 2021, 269, 121260. [Google Scholar] [CrossRef]
- Hassi, S.; Ebn Touhami, M.; Boujad, A.; Benqlilou, H. Assessing the effect of mineral admixtures on the durability of Prestressed Concrete Cylinder Pipe (PCCP) by means of electrochemical impedance spectroscopy. Constr. Build. Mater. 2020, 262, 120925. [Google Scholar] [CrossRef]
- Gu, P.; Xie, P.; Beaudoin, J.J. Impedance characterization of microcracking behaviour in fibre-reinforced cement composites. Cem. Concr. Compos. 1993, 15, 173–180. [Google Scholar] [CrossRef]
- Hixson, A.D.; Woo, L.Y.; Campo, M.A.; Mason, T.O. The origin of nonlinear current–voltage behavior in fiber-reinforced cement composites. Cem. Concr. Res. 2003, 33, 835–840. [Google Scholar] [CrossRef]
- Li, W.-W.; Ji, W.-M.; Fang, G.-H.; Liu, Y.-Q.; Xing, F.; Liu, Y.-K.; Dong, B.-Q. Electrochemical impedance interpretation for the fracture toughness of carbon nanotube/cement composites. Constr. Build. Mater. 2016, 114, 499–505. [Google Scholar] [CrossRef]
- Li, X.; Li, M. Multifunctional self-sensing and ductile cementitious materials. Cem. Concr. Res. 2019, 123, 105714. [Google Scholar] [CrossRef]
- Díaz, B.; Guitián, B.; Nóvoa, X.R.; Pérez, C. Analysis of the microstructure of carbon fibre reinforced cement pastes by impedance spectroscopy. Constr. Build. Mater. 2020, 243, 118207. [Google Scholar] [CrossRef]
- Han, J.; Cai, J.; Pan, J.; Sun, Y. Study on the conductivity of carbon fiber self-sensing high ductility cementitious composite. J. Build. Eng. 2021, 43, 103125. [Google Scholar] [CrossRef]
- Song, F.; Chen, Q.; Jiang, Z.; Zhu, X.; Li, B.; He, B.; Zhu, H. Piezoresistive properties of ultra-high-performance fiber-reinforced concrete incorporating few-layer graphene. Constr. Build. Mater. 2021, 305, 124362. [Google Scholar] [CrossRef]
- Pichór, W.; Frąc, M.; Radecka, M. Determination of percolation threshold in cement composites with expanded graphite by impedance spectroscopy. Cem. Concr. Compos. 2022, 125, 104328. [Google Scholar] [CrossRef]
- Hou, Y.-Y.; Sun, M.-Q.; Chen, J.-Z. Electrical resistance and capacitance responses of smart ultra-high performance concrete with compressive strain by DC and AC measurements. Constr. Build. Mater. 2022, 327, 127007. [Google Scholar] [CrossRef]
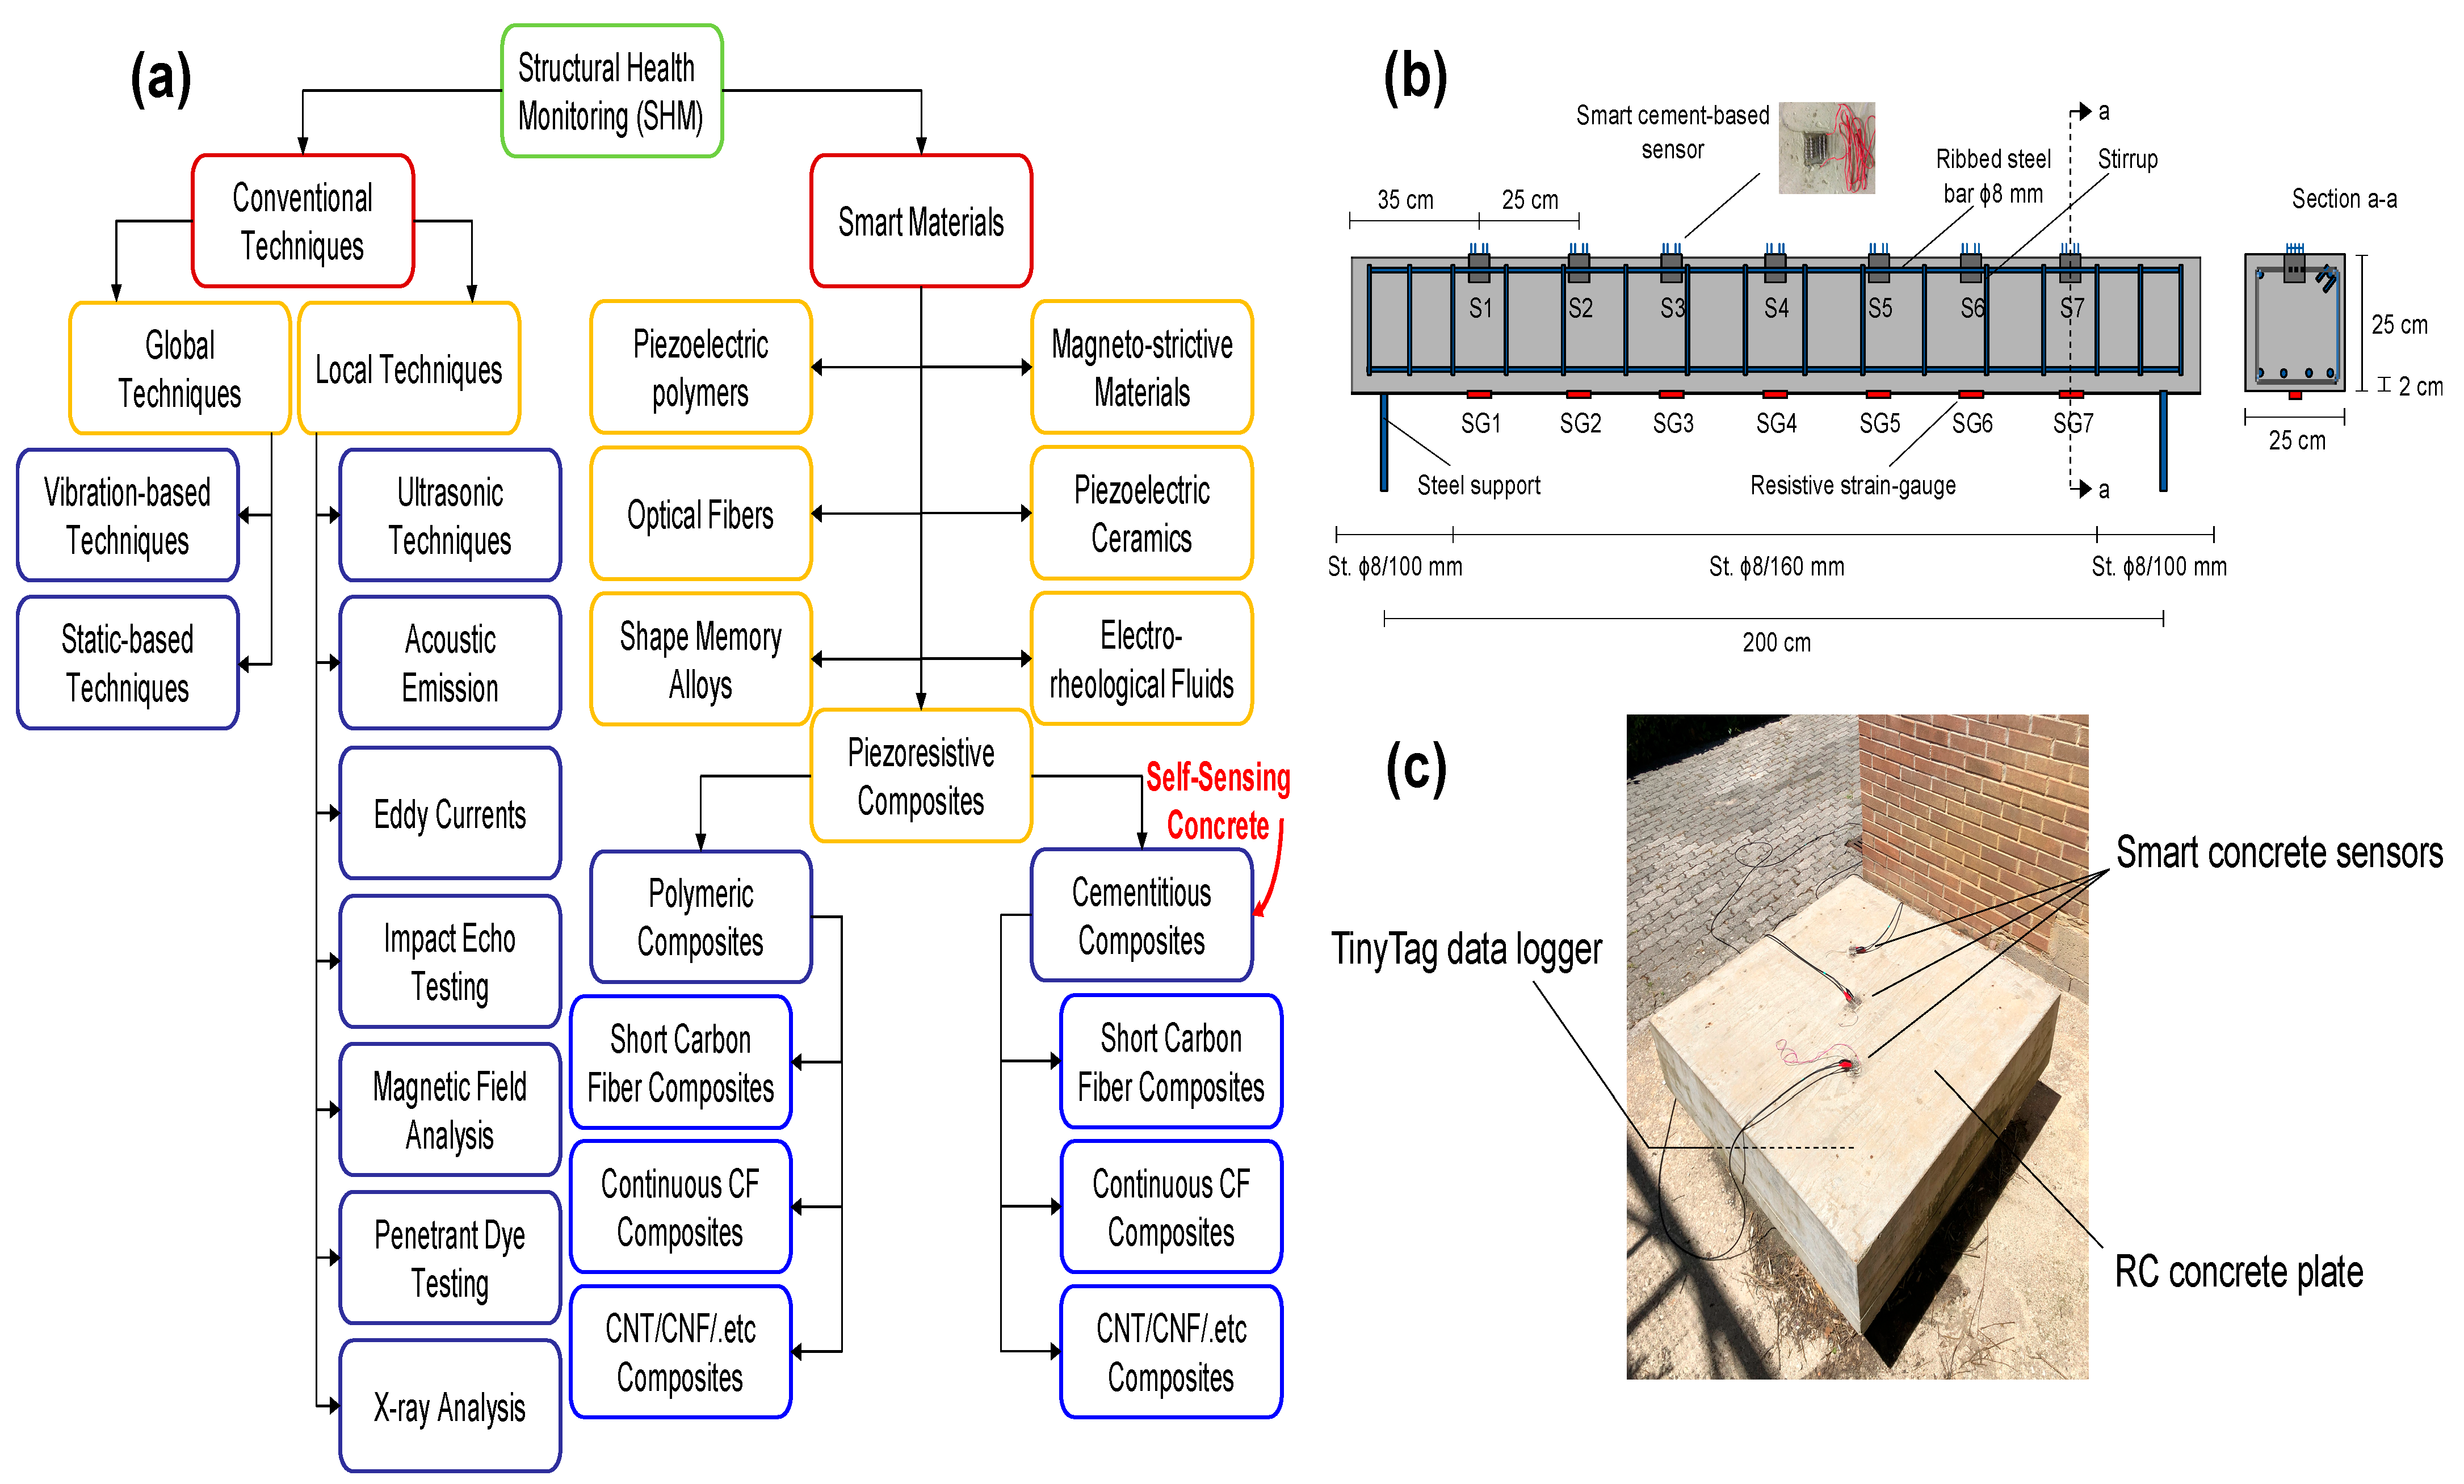


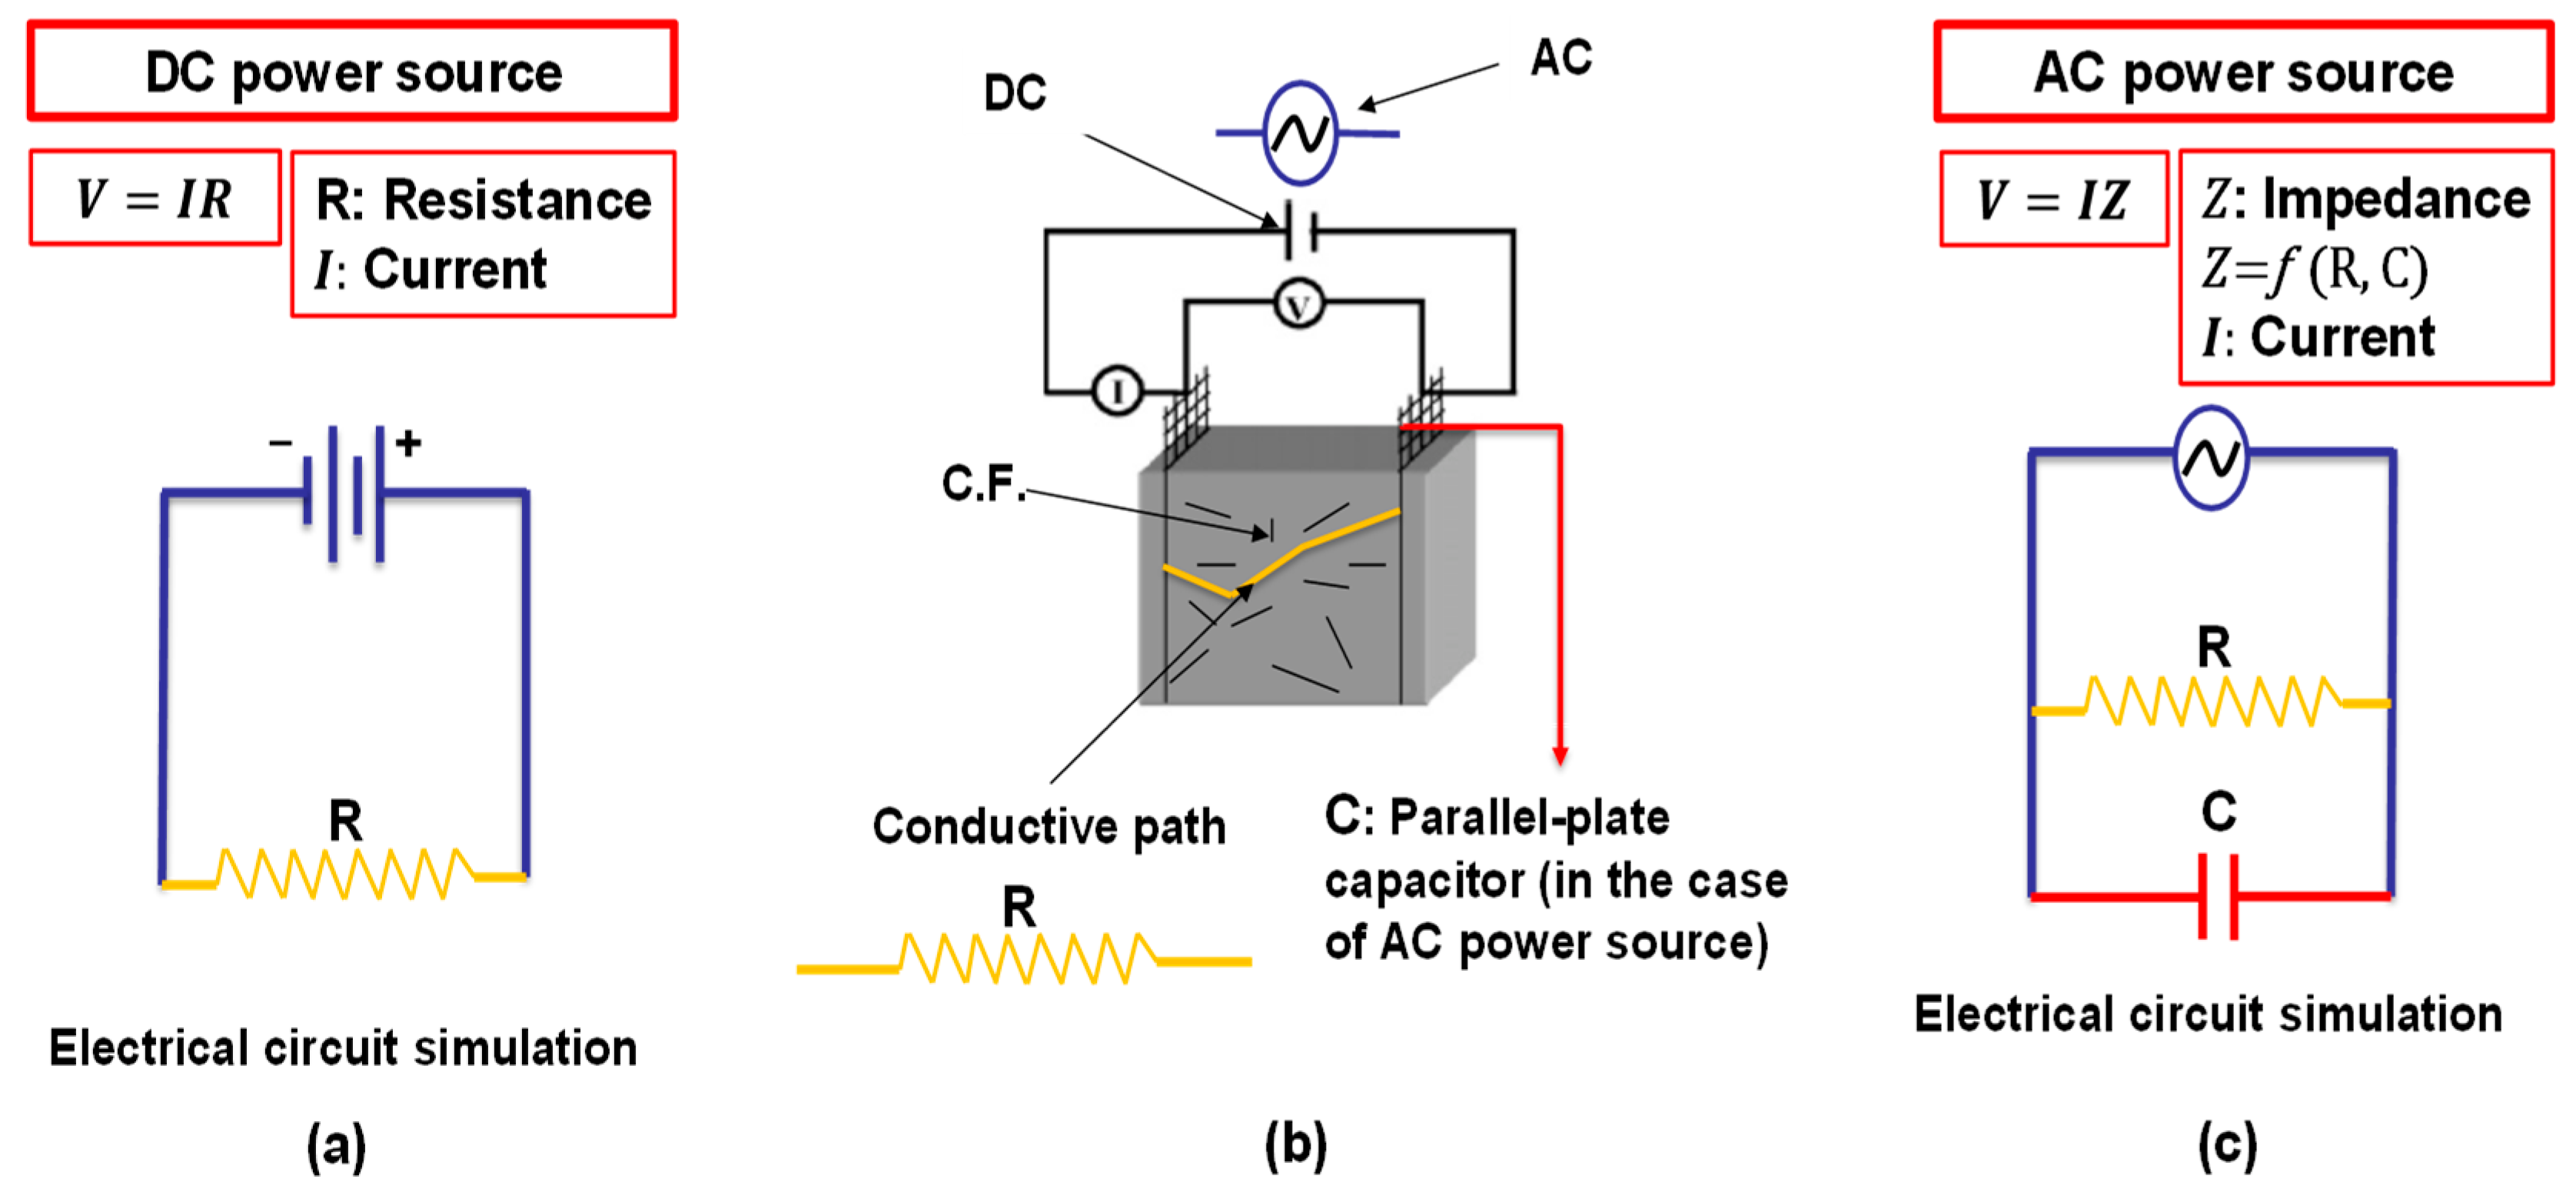


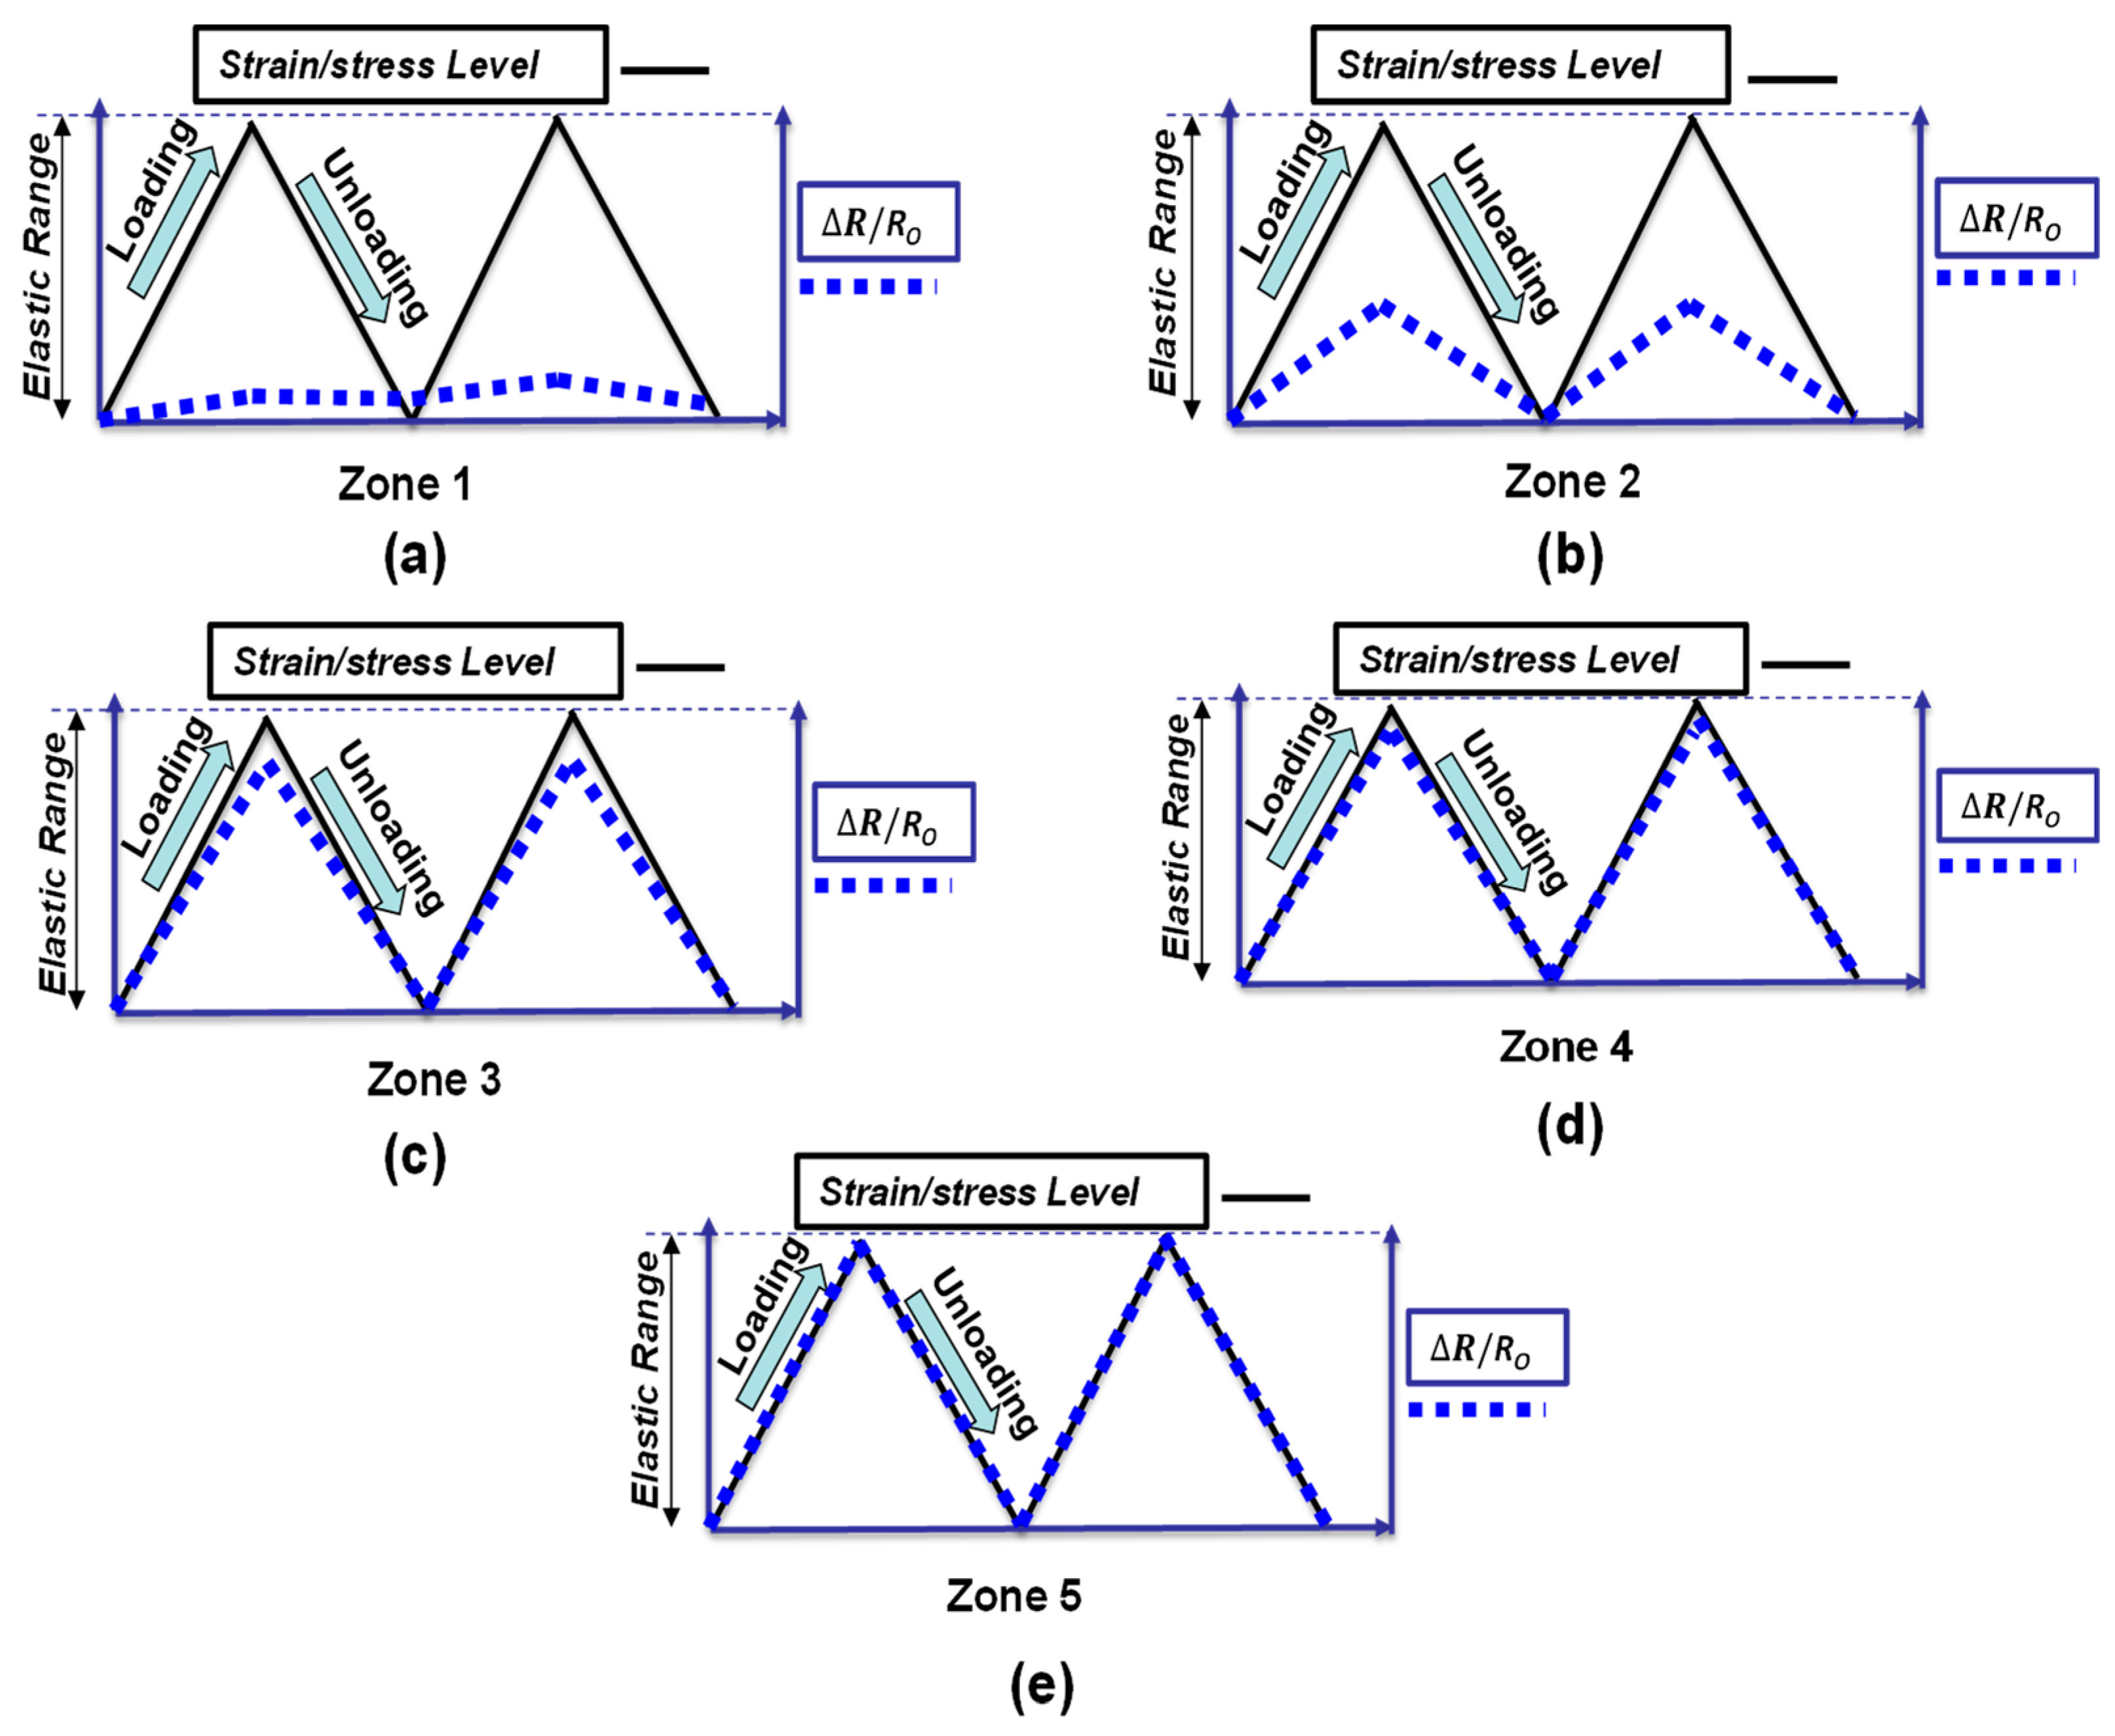
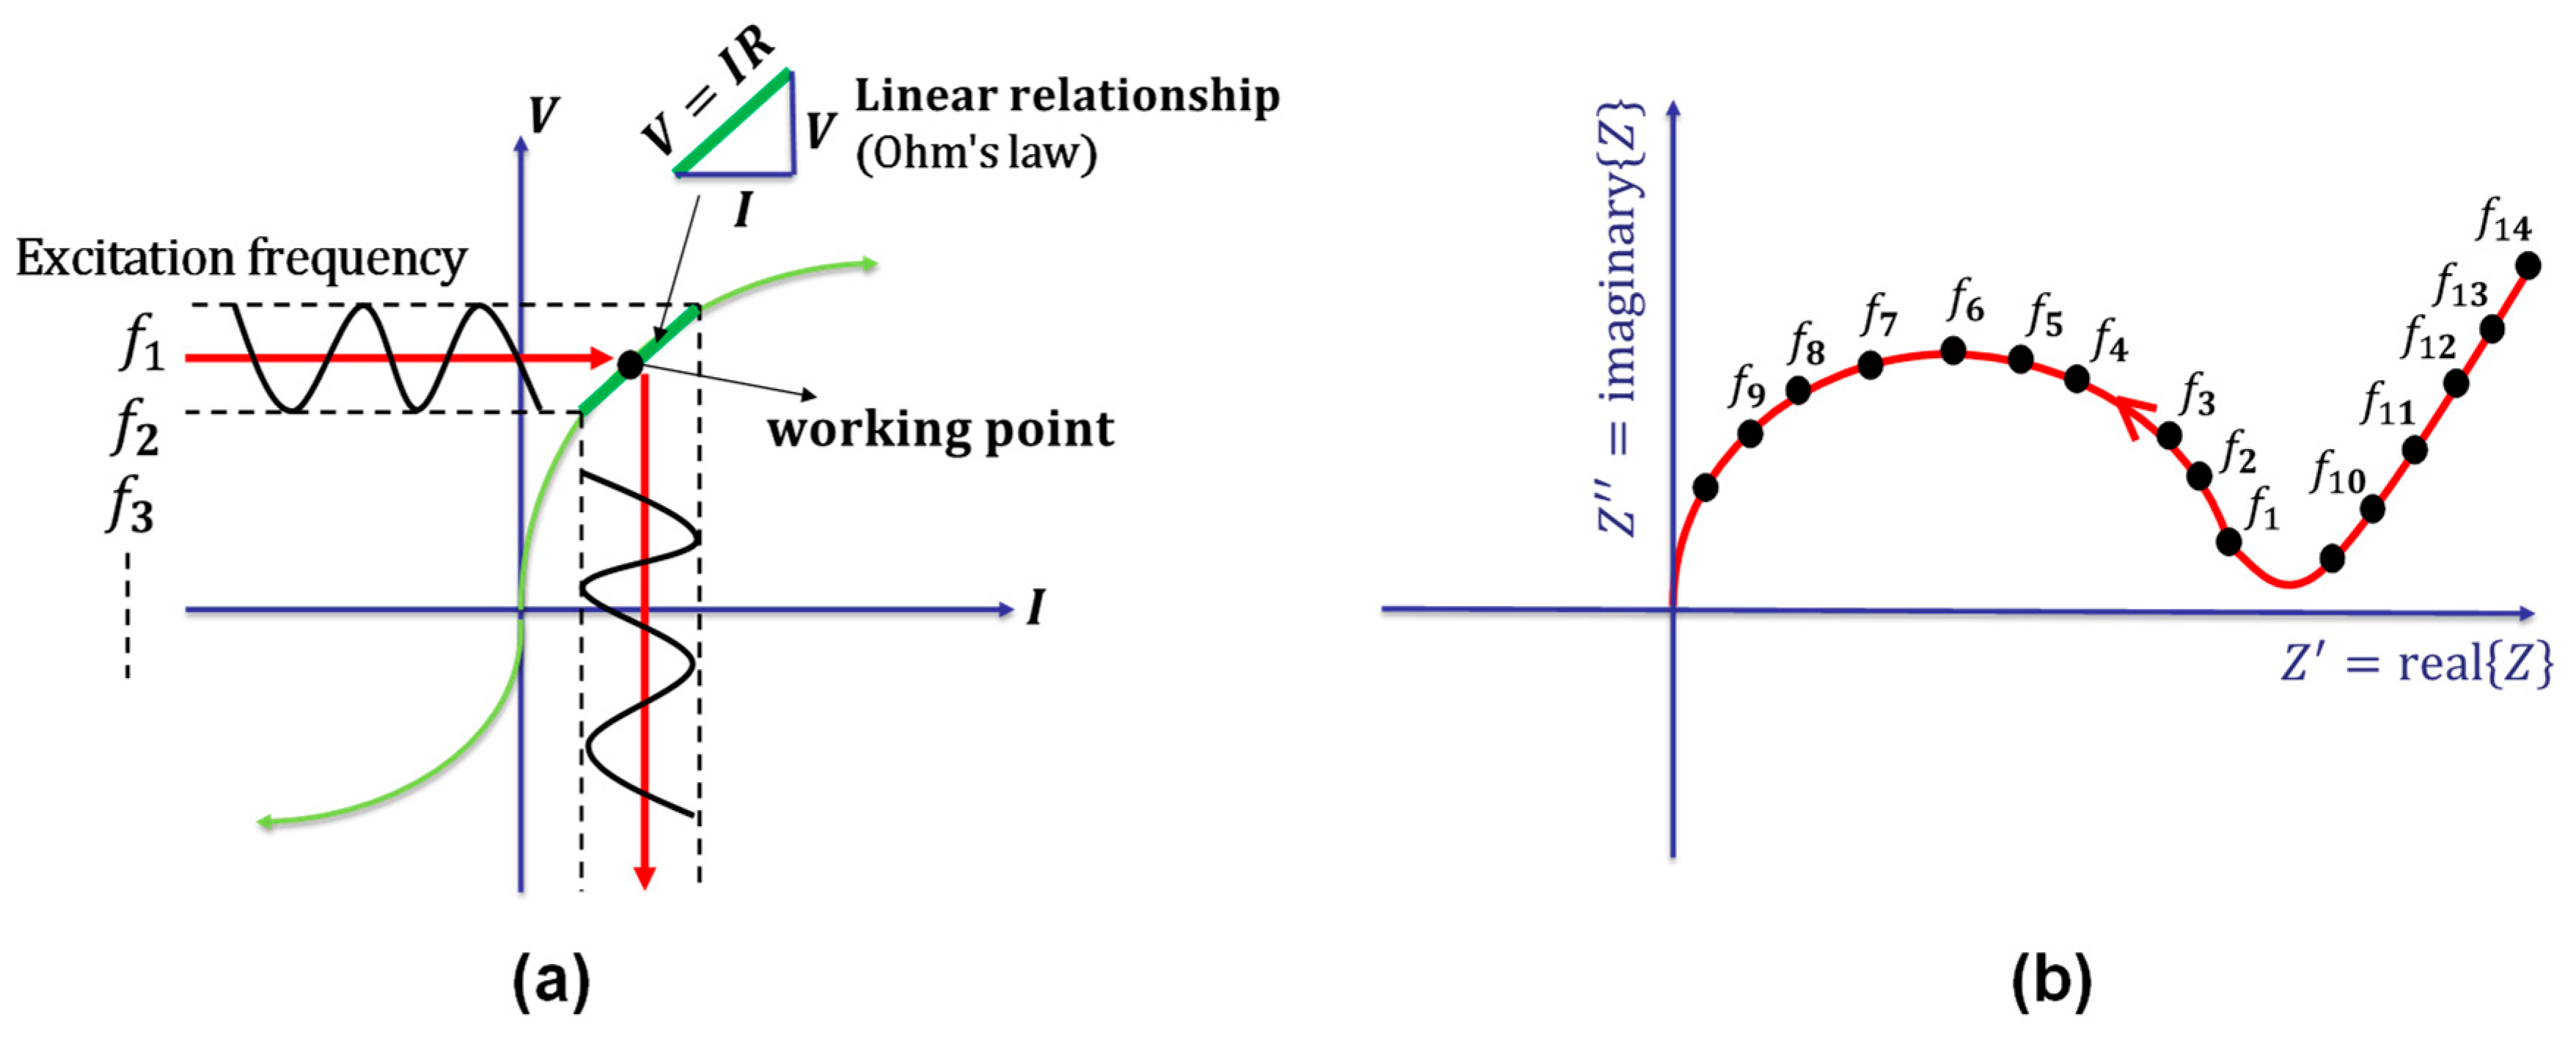
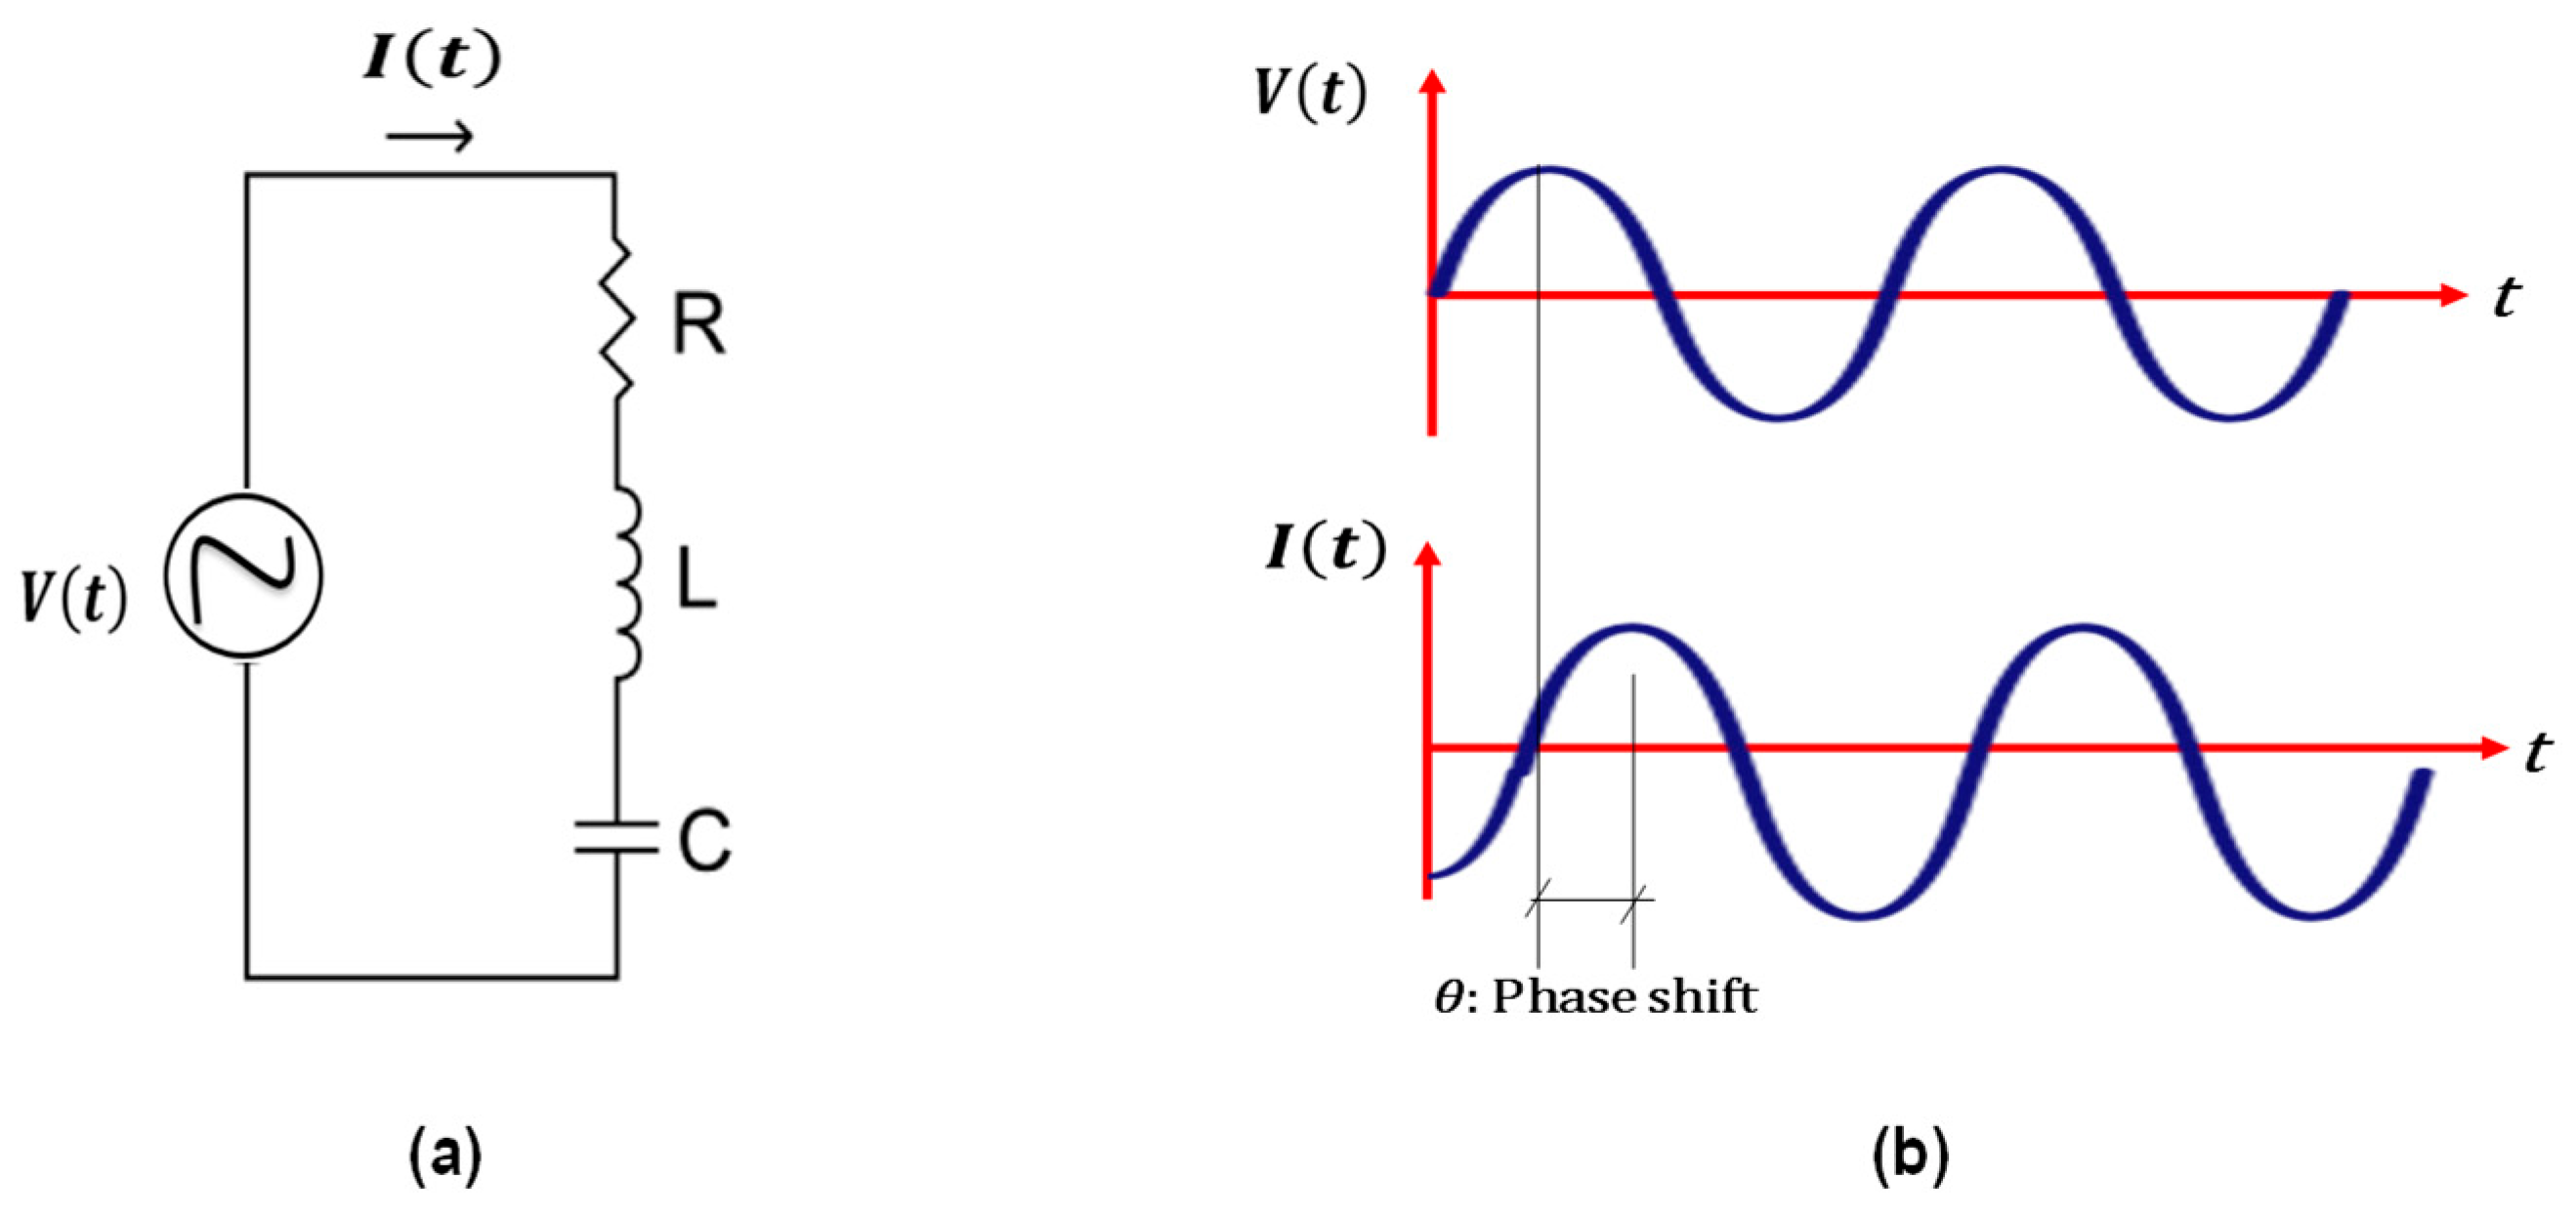
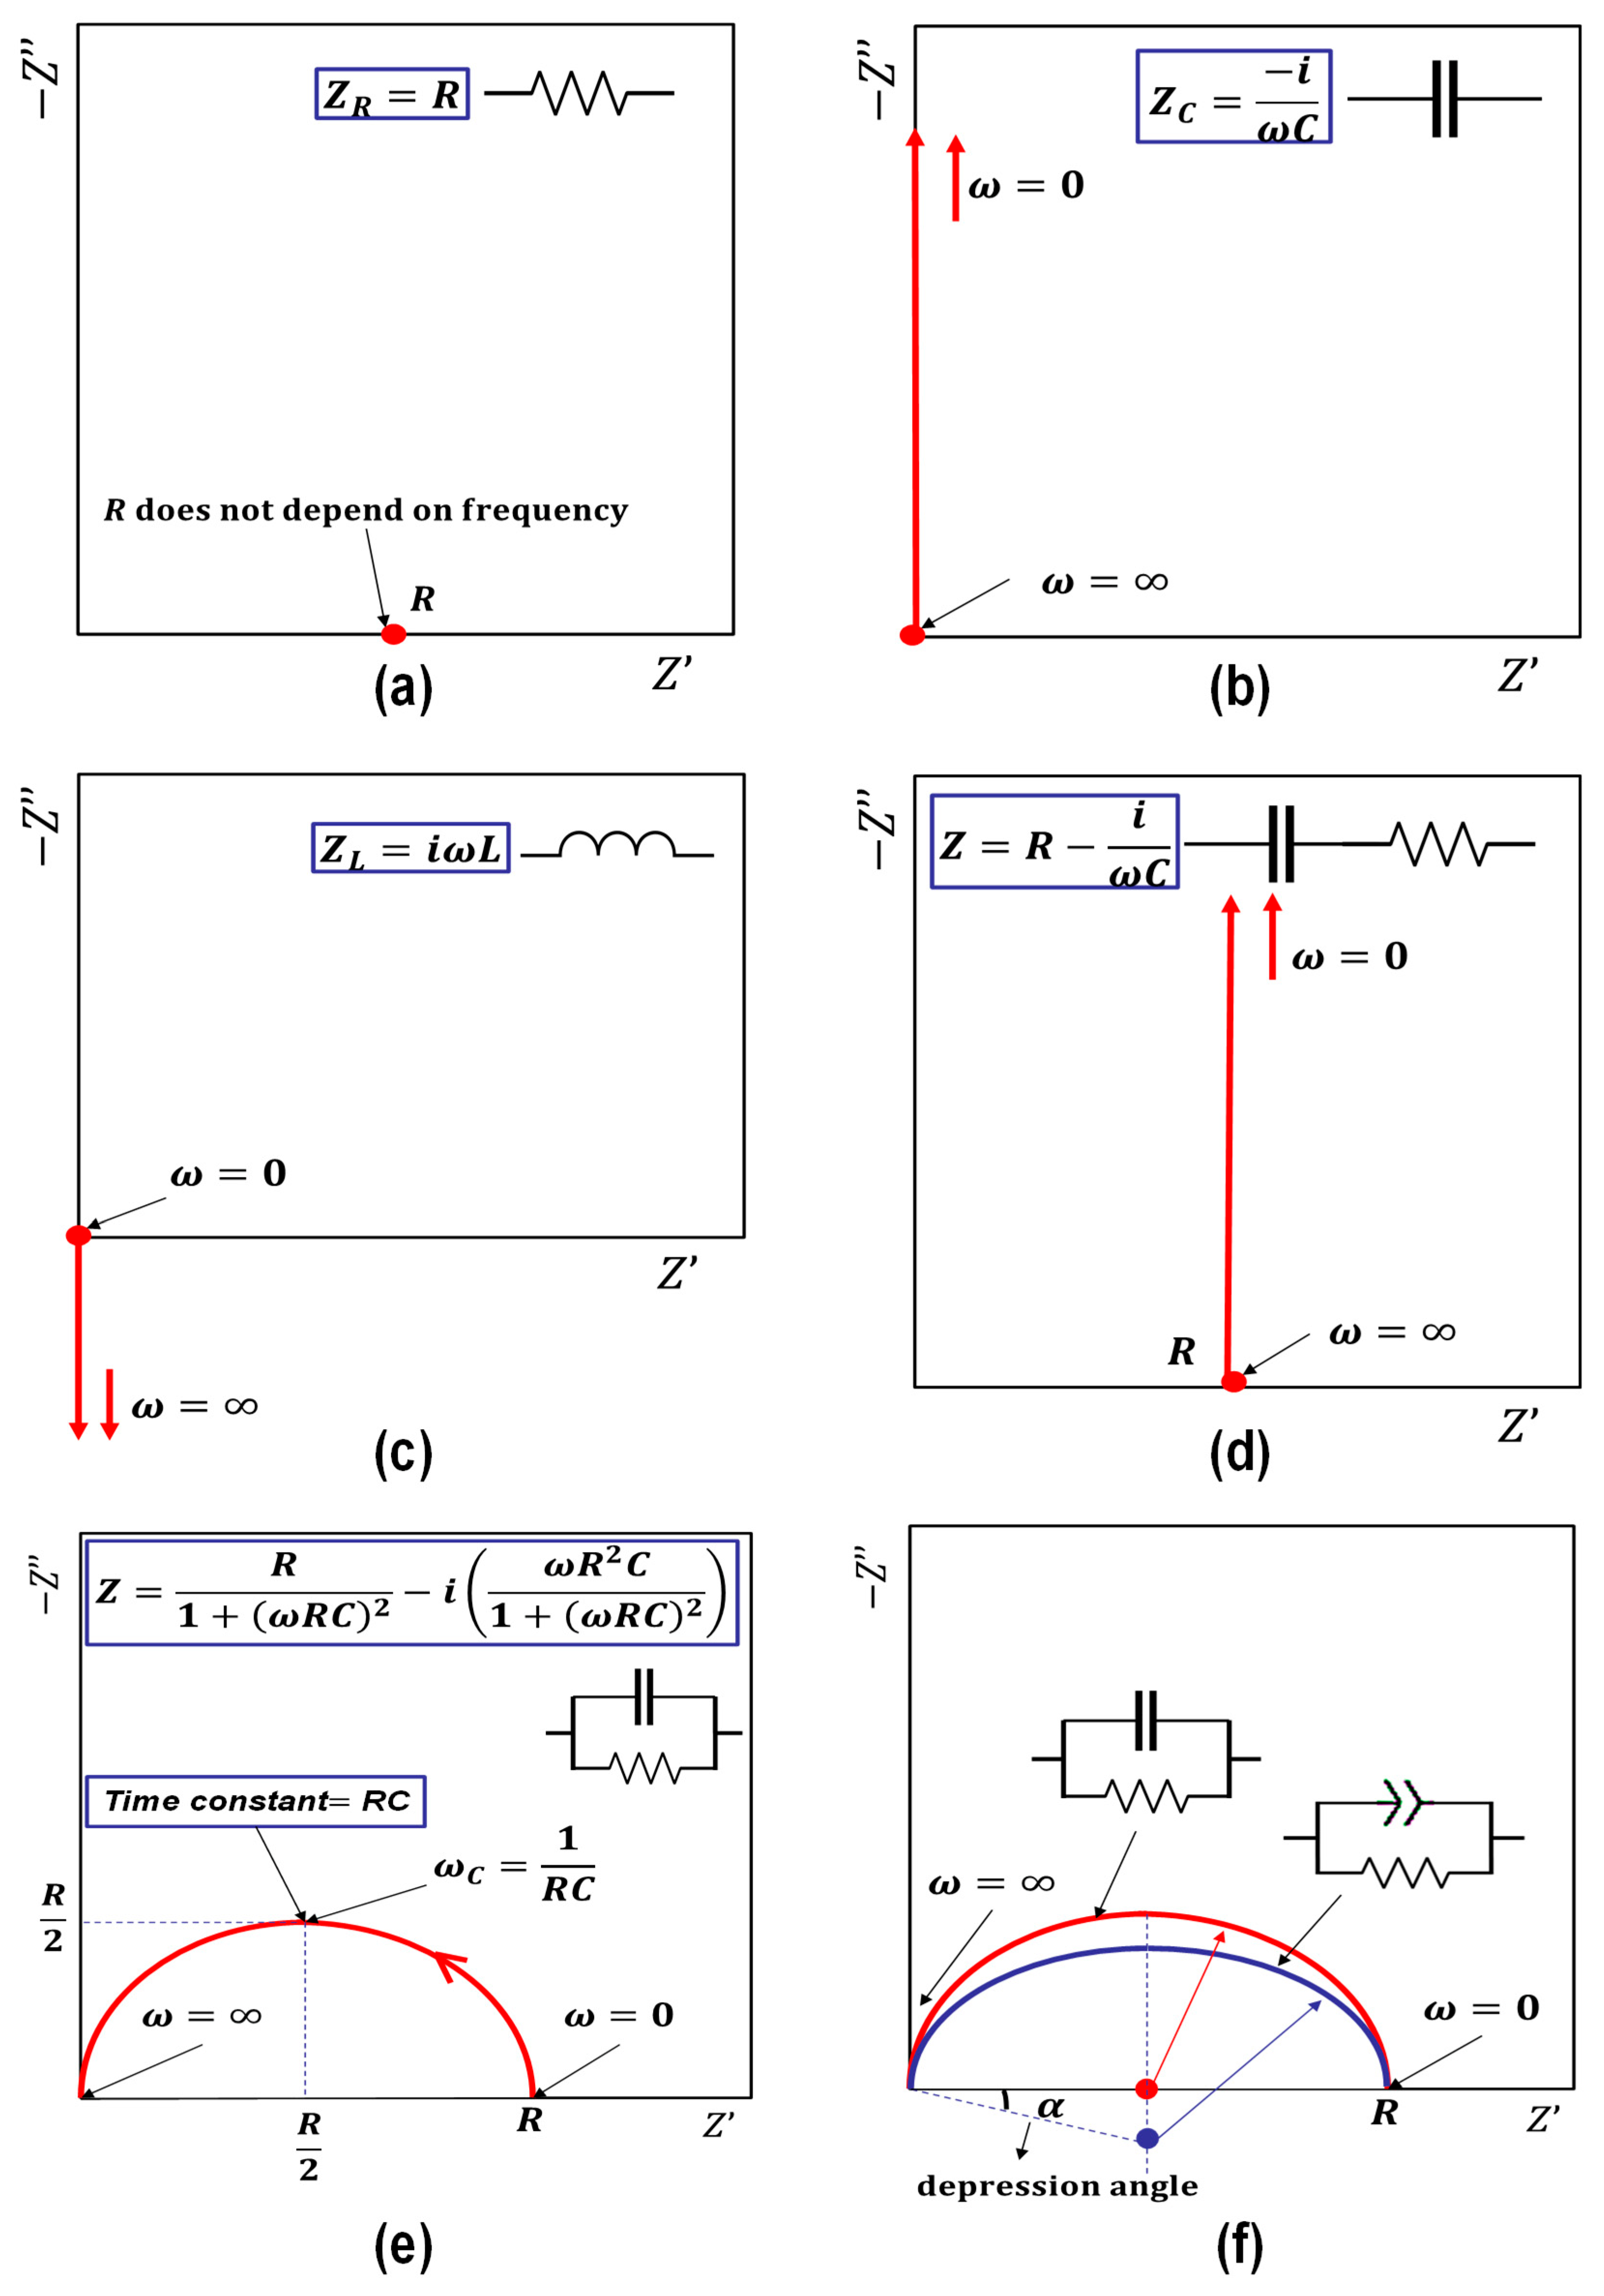
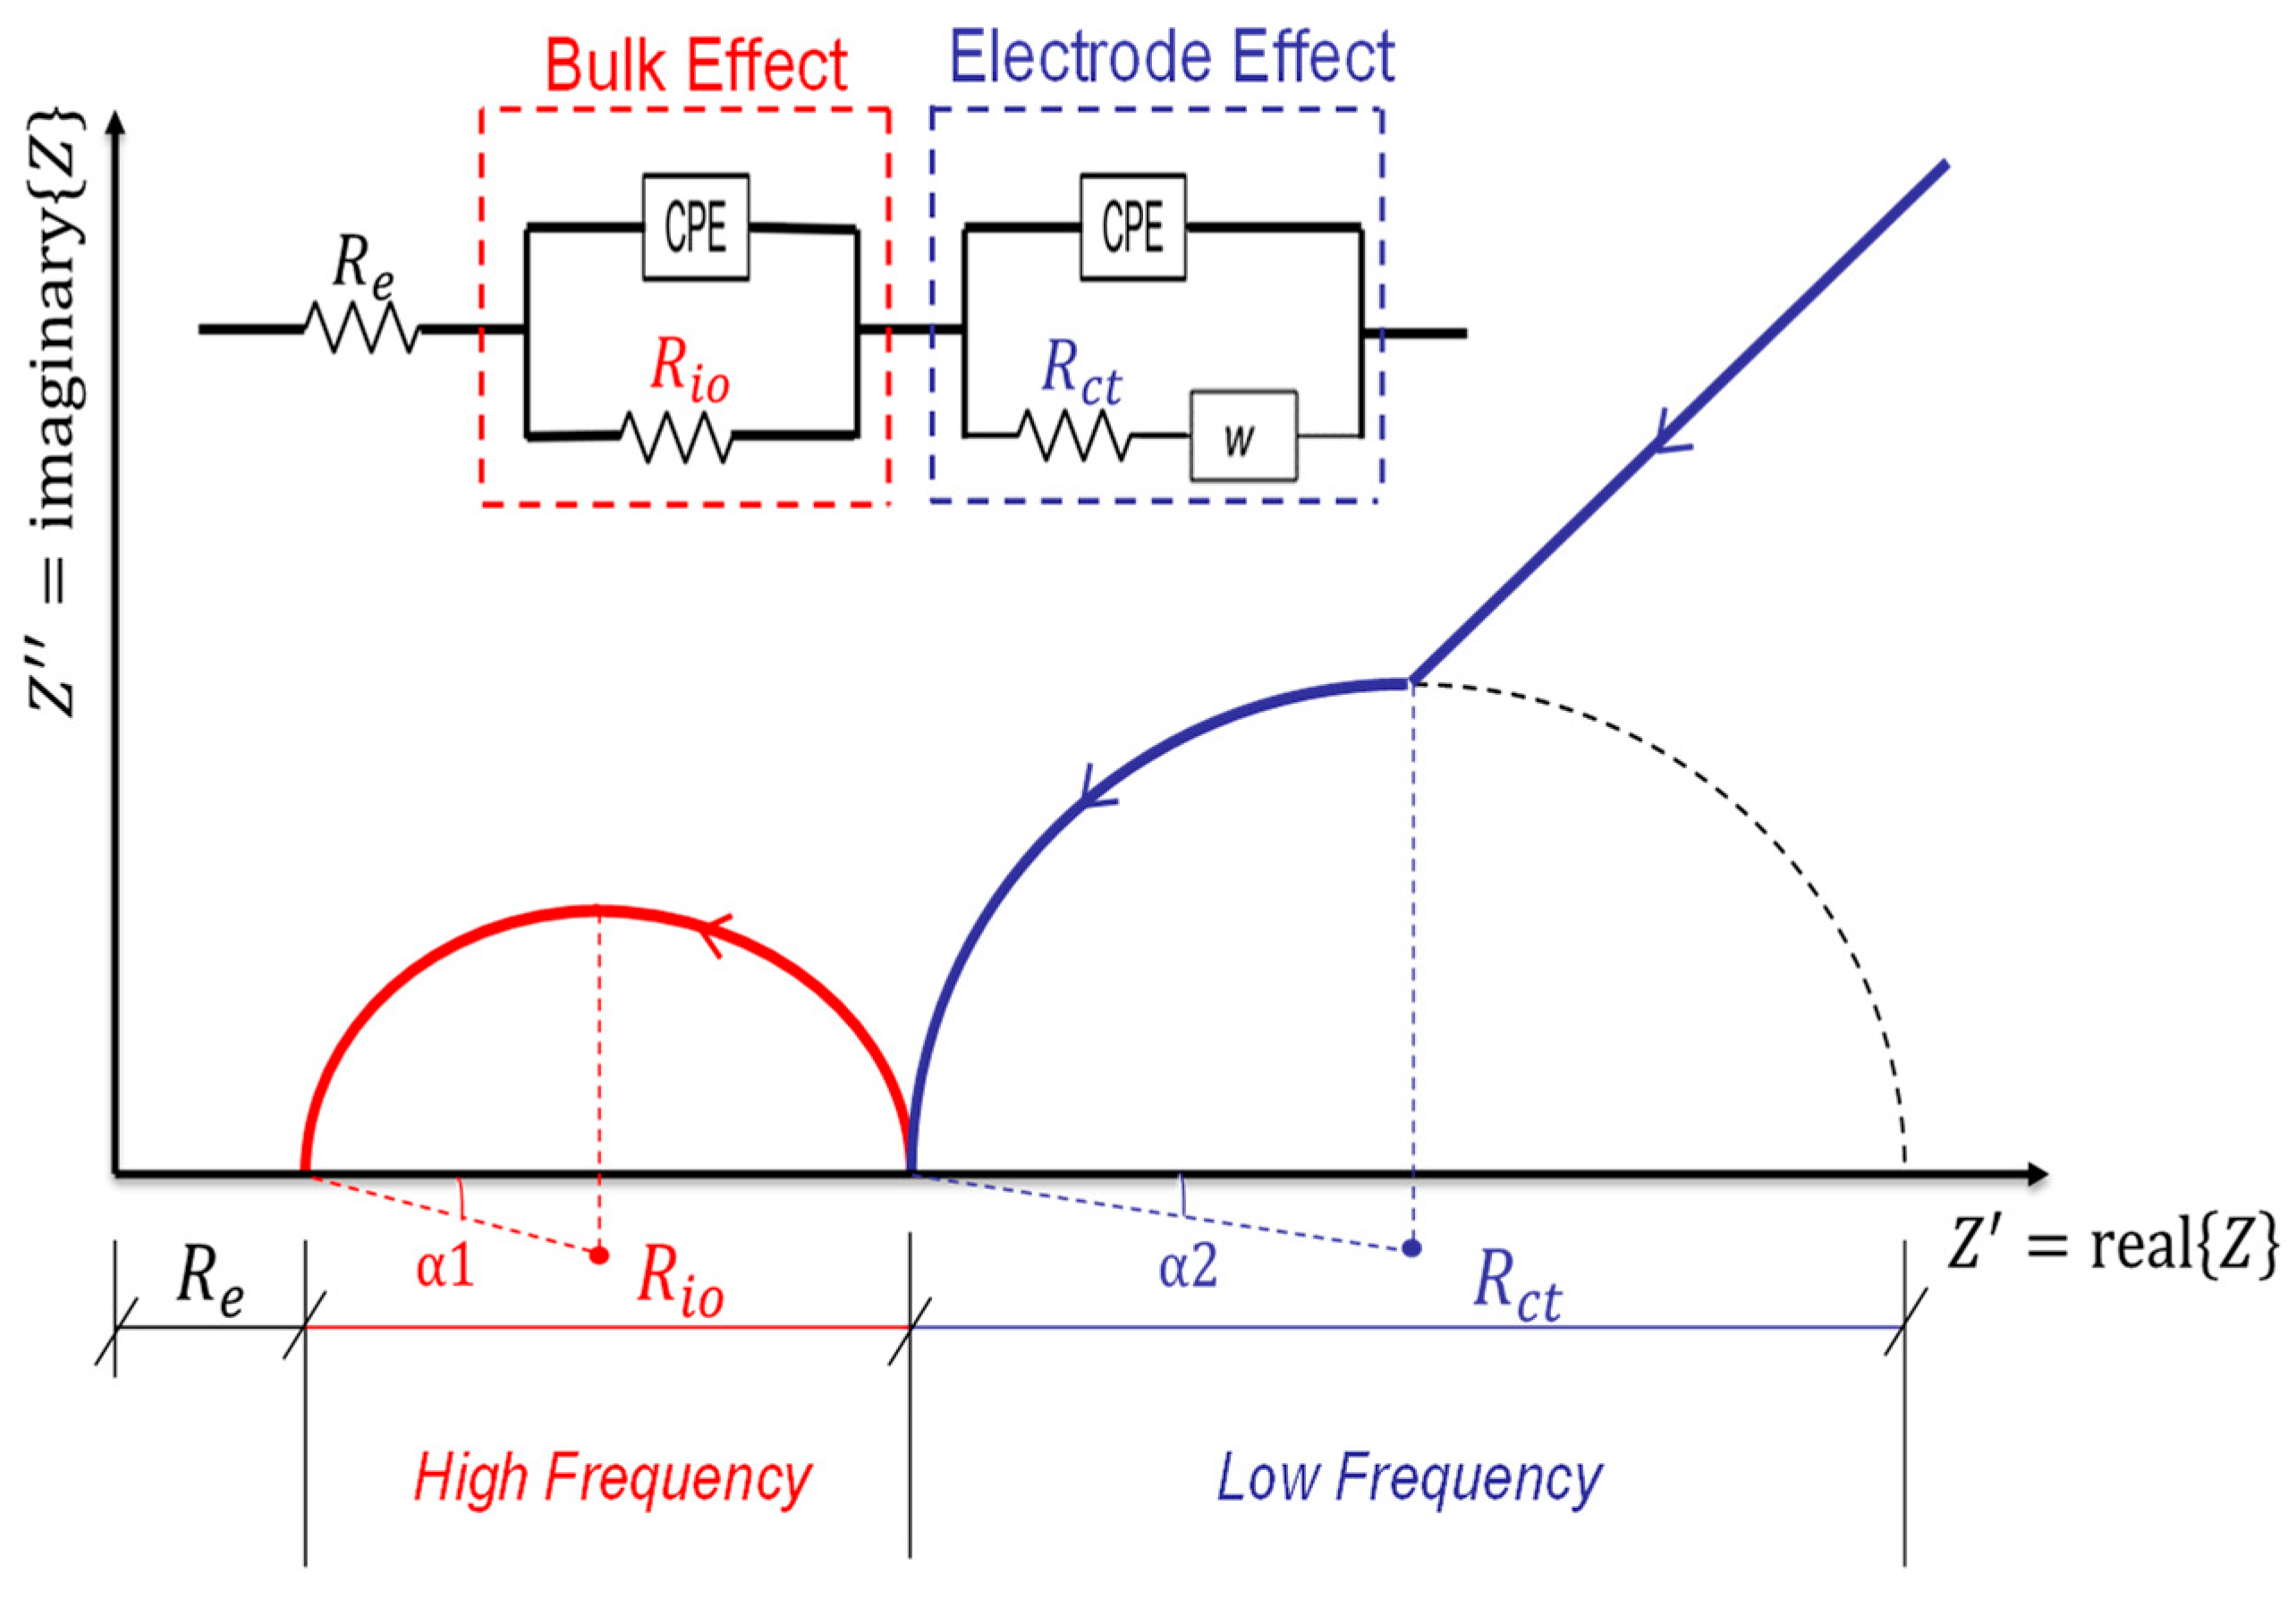
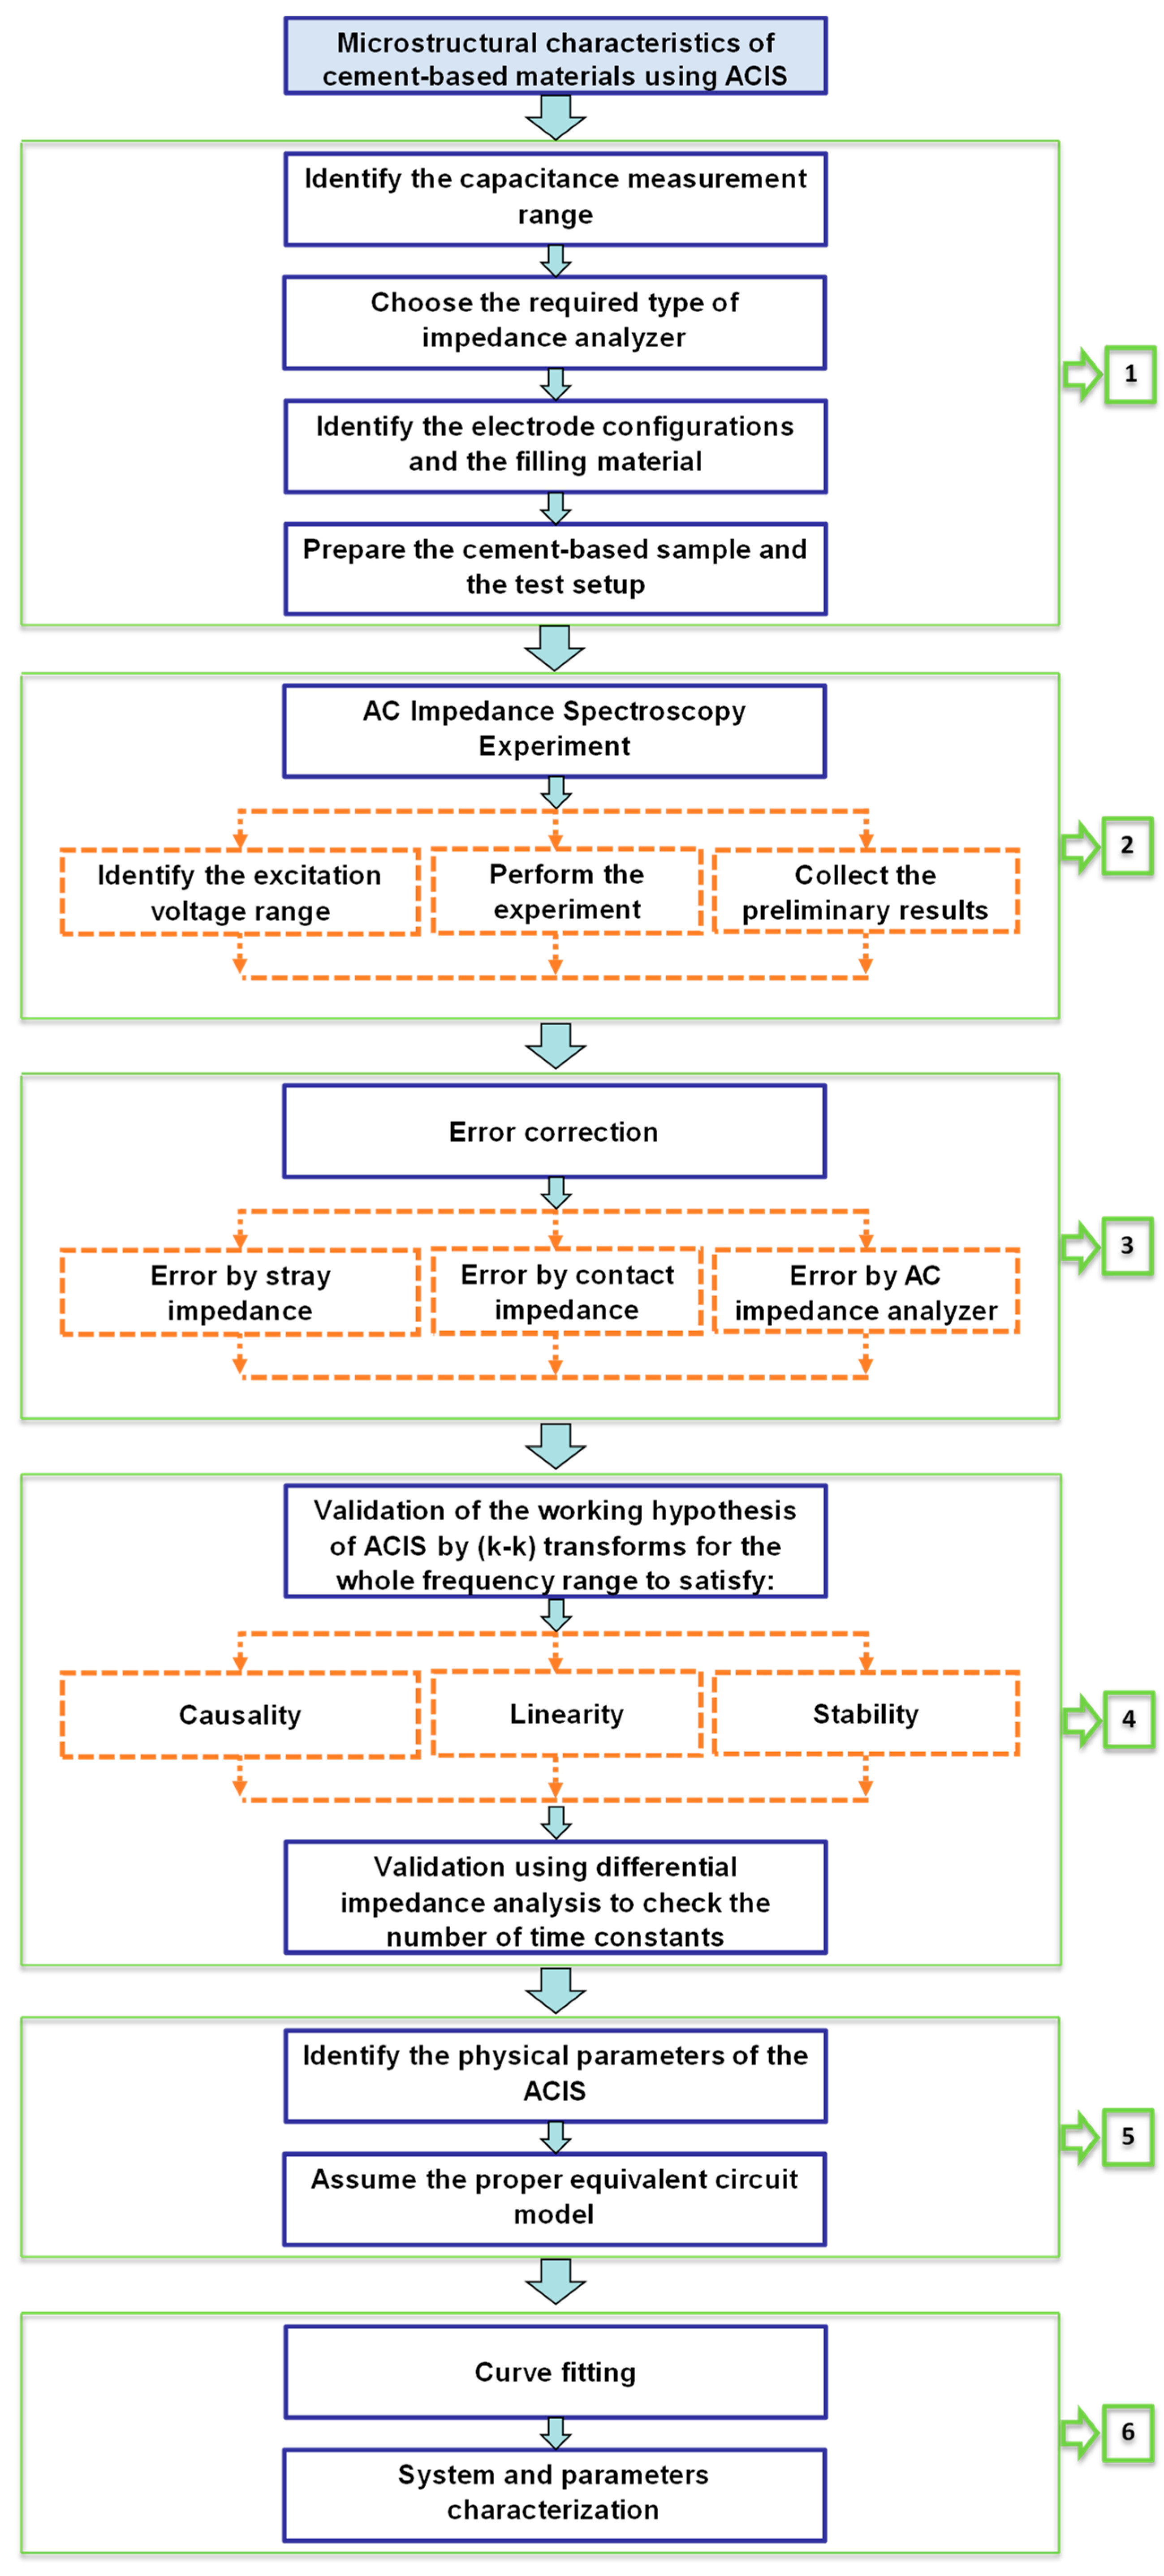
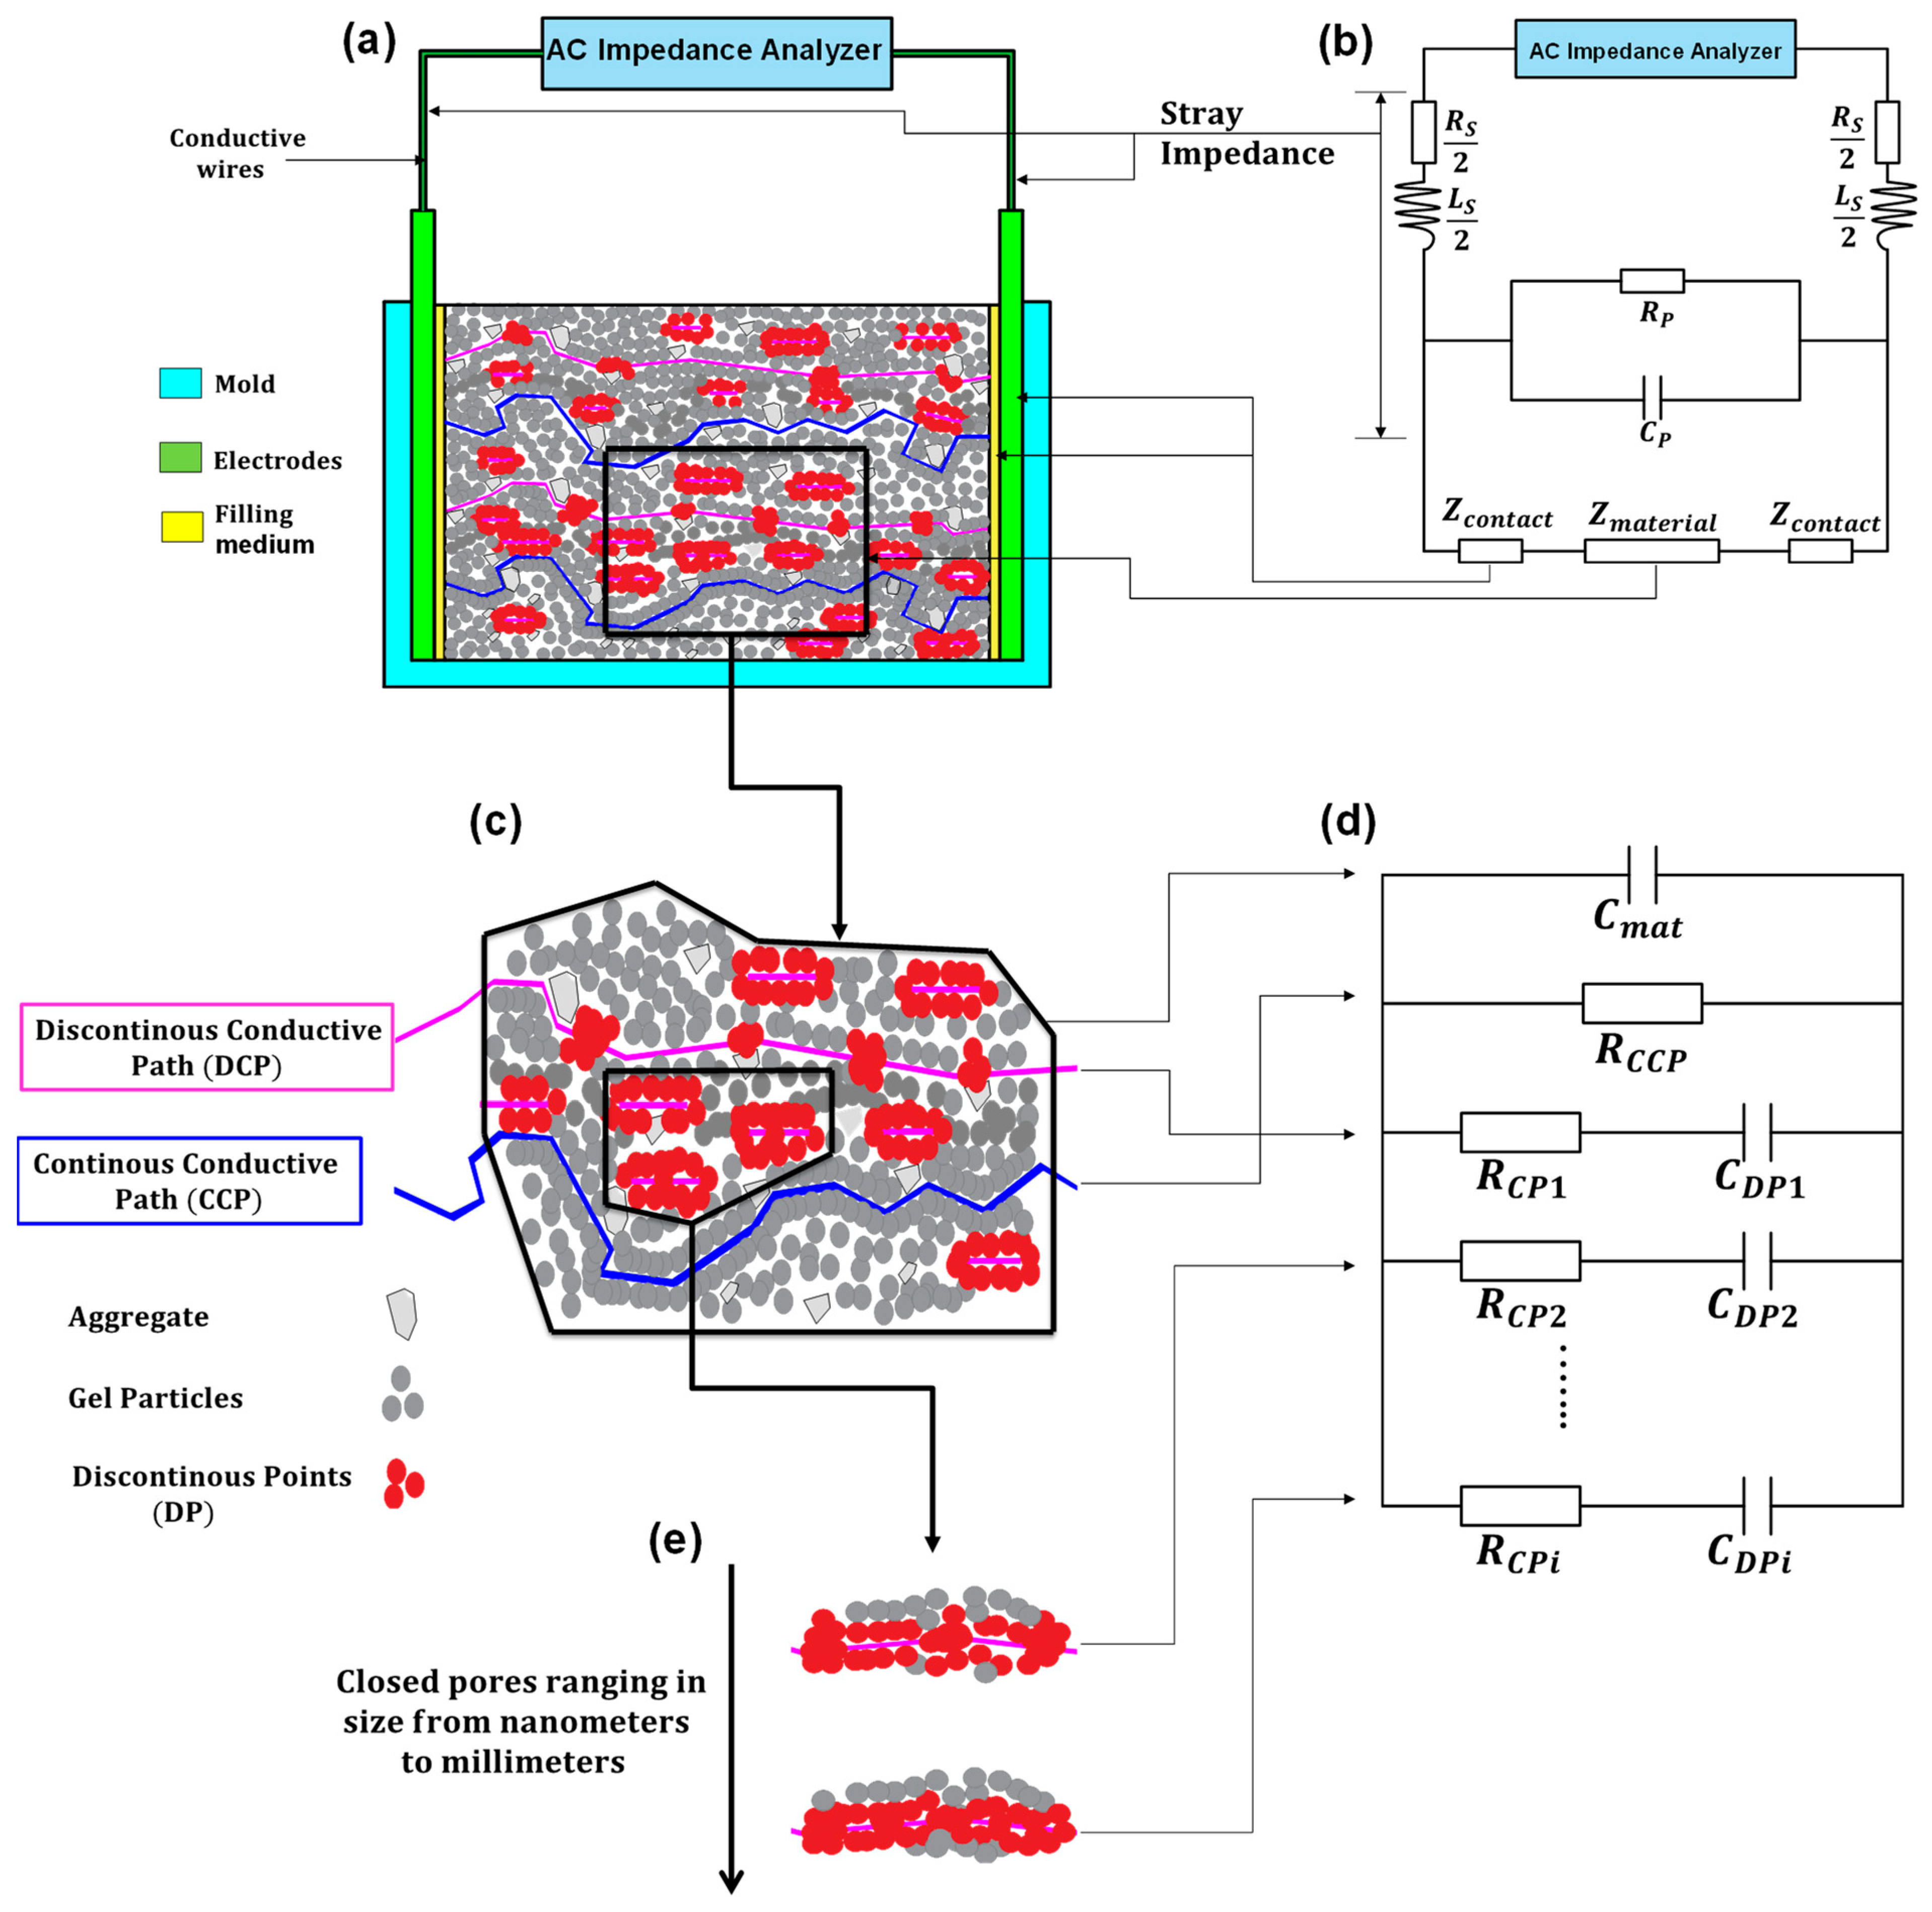
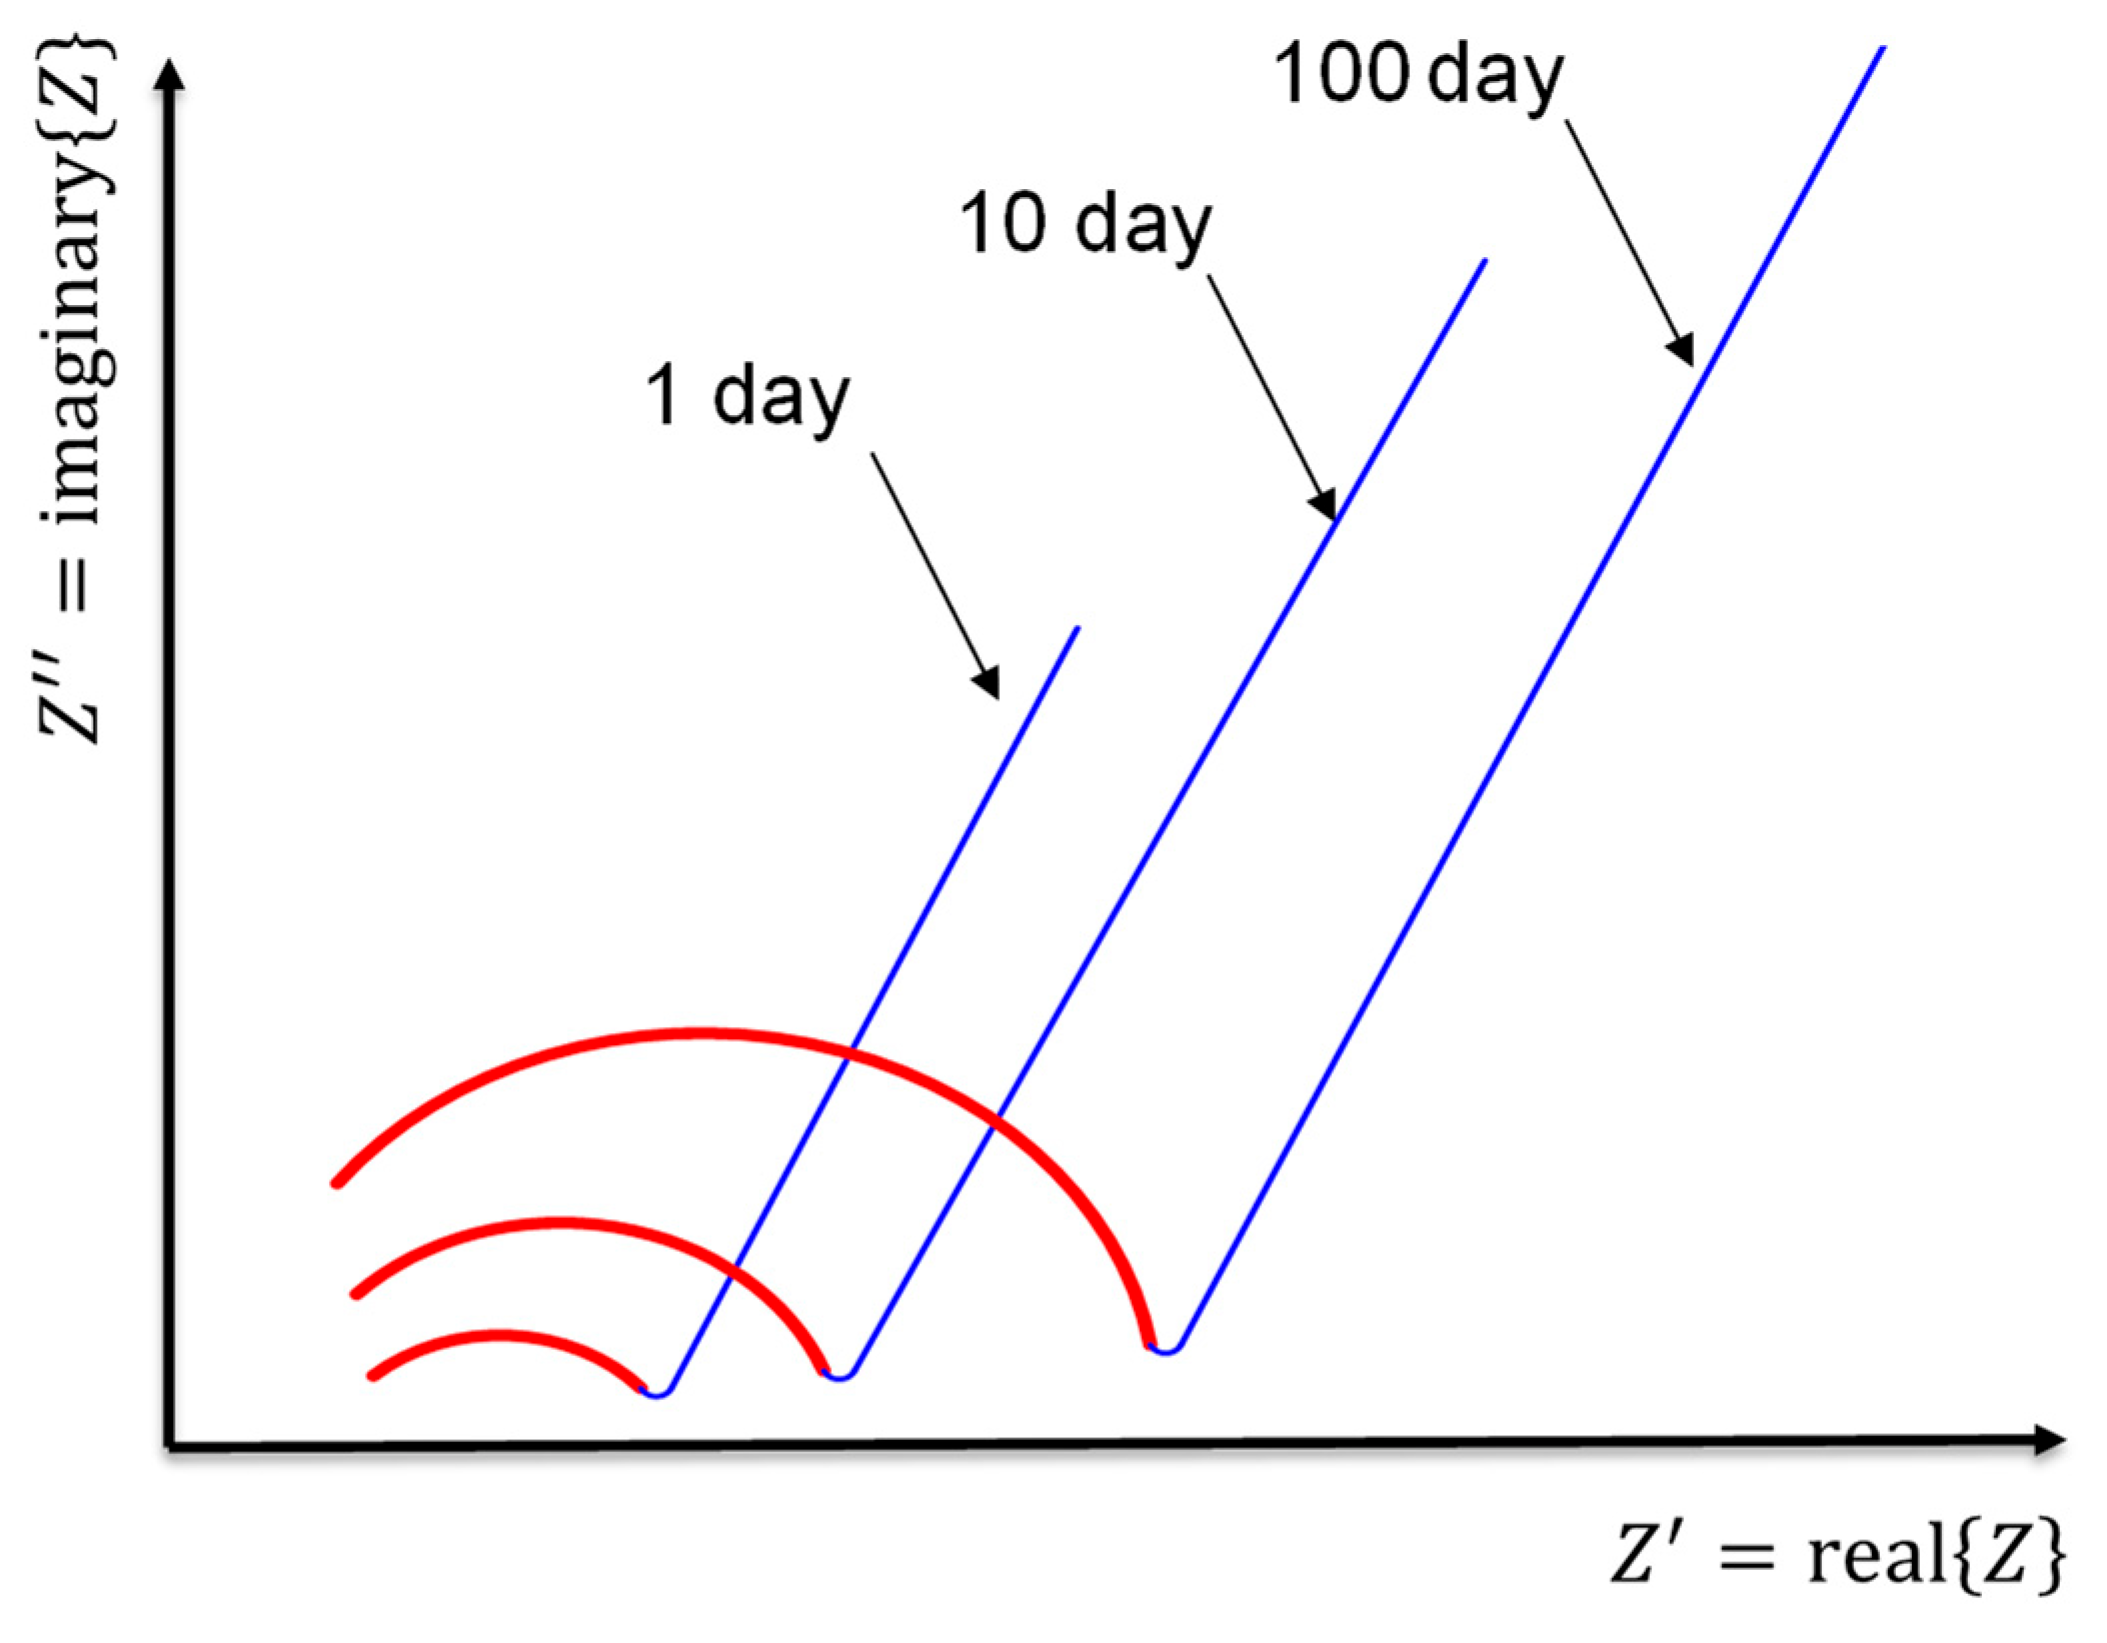
| Factor | Description | Key Findings | Refs. |
|---|---|---|---|
| The filler type, the aspect ratio, and the dosage | The type of conductive filler (CF, CNT, CB, etc.), as well as the geometry and dosage, affect the resistivity of cement-based composites. | The change in conductive fillers’ geometry and dosage affects the formation of the conductive passages, leading to an alteration in the percolation threshold. | [69,77,78,79,80,81,82,83,84,85,86,87,88] |
| The dispersion of conductive fillers | The dispersion of conductive fillers is advisable to form the conductive passages and improve the workability of concrete. | Using supplementary cementitious materials (silica fume, fly ash, and slag) and chemical admixtures (latex, methylcellulose, and superplasticisers) enhances the dispersion of conductive fillers. However, the impact on resistivity and piezoresistivity is different. | [38,67,70,71,77,89,90,91,92,93,94,95,96,97] |
| The matrix type | The type of cementitious matrix (cement paste, mortar, and concrete) affects resistivity. | In the presence of conductive fillers, cement paste is more conductive than mortar and concrete; fine and coarse aggregates hinder the formation of conductive paths. | [16] |
| The water-to-cement ratio | The water-to-binder ratio affects the resistivity and piezoresistivity. | The piezoresistivity stability improves when the water-to-cement ratio is reduced. However, this may affect the rheological properties of the cement-based material. | [72,98,99] |
| The curing type and its duration | The method of curing (moist or air) and its duration affect cement-based materials’ resistivity and piezoresistivity. | Samples tested at 28 days showed better reversibility compared to 7 and 14 days. | [25,100] |
| The loading type and its amplitude | The loading type’s amplitude and frequency affect the piezoresistivity. | The piezoresistivity is affected differently by monotonic and cyclic, uniaxial, biaxial, and multiaxial forces. | [73,101,102,103,104] |
| The electrode configuration | The electrode configuration, such as embedded, attached, two contacts, four contacts, electrode material, and electrode position, affect the resistivity and piezoresistivity. | The four-probe technique is more reliable than the two-probe technique; embedded electrodes are better than attached electrodes, and the distance between electrodes does not significantly impact the measurement. Additionally, the resistivity measurement does not depend on the area of the voltage probes. | [36,40,99] |
| The power supply type (DC or AC) | Current type (AC or DC), intensity, and lasting time affect piezoresistivity. | An AC power source is generally better than a DC power source, and a high frequency is preferable to a low frequency. | [25,99,105] |
| The freeze-thaw cycles | The damage to cement-based materials due to the freeze-thaw cycles is primarily caused by the freezing of water inside pores. This damage can be quantified using the change in resistivity. | The impact on resistivity due to the freeze-thaw cycles is minimal compared to the temperature impact on resistivity. | [106,107,108,109] |
| The temperature | The change in external temperature affects the resistivity and piezoresistivity. | Increasing the temperature leads to a decrease in the resistivity of cement-based materials. | [97,99,110] |
| The relative humidity and the moisture content | The change in relative humidity and moisture content affects the resistivity and piezoresistivity. | At low dosage of conductive fillers, the relative humidity and water content affect the resistivity. Conversely, increasing the dosage of conductive fillers leads to a reduction in this impact. Moreover, the presence of water leads to a longer measurement time as the polarisation is enhanced. | [58,81,111] |
| Cause | Description and Key Findings | Refs. |
|---|---|---|
| The slippage of the fibre–matrix interface | The pull-out of crack-bridging fibres during crack opening leads to an increase in the contact electrical resistivity. | [57,58,59,60,61,62] |
| The change in intrinsic resistance of the conductive admixtures | Under the externally applied loads on the concrete matrix, deformations occur in the conductive fillers, leading to changes in their intrinsic resistance. | [57,59,63,64] |
| The change in contact resistance between the functional additives | Under the externally applied loads on the concrete matrix, the position of the conductive fillers alters, leading to direct contact or separation between them. As a result, an increase or decrease in the contact resistance between conductive fillers occurs. | [57,65] |
| The change in tunnelling distance between the conductive admixtures | Under the externally applied loads on the concrete matrix, the tunnelling distance, or the insulating distance, of the cementitious layer between the functional fillers alters, leading to an alteration in the electrical resistance of the composite. | [57] |
| The change in capacitance distance of the conductive fillers | At the microstructural level, carbon fibres may be considered micro-capacitance plates because of the ionic conduction between them in the concrete matrix. Therefore, under the externally applied loads on the concrete matrix, the distance between these micro-capacitance plates alters, leading to a change in the resistance of the composite. | [57,66] |
| Symbol | Description | Impedance | Variables |
|---|---|---|---|
 | A resistor with resistance, [Ω, “ohms”] | is the impedance due to a pure resistor [145]. | |
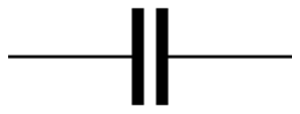 | A capacitor with capacitance, [F, “farads”] | is the impedance due to an ideal capacitor, is the square root of (−1), and is the angular frequency and equals 2πƒ, where ƒ represents the frequency of the AC source [145]. | |
 | An inductor with inductance, [H, “henrys”] | is the impedance due to an ideal inductor [145]. | |
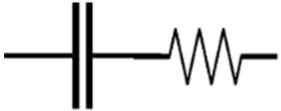 | A resistor and a capacitor in series | is the impedance due to a pure resistor and an ideal capacitor in series [145]. | |
 | A resistor and a capacitor in parallel | is the impedance due to a pure resistor and an ideal capacitor in parallel [145]. | |
 or  | The constant phase element (CPE) can be used to represent the non-ideal behaviour of a capacitor, as there are losses in capacitance due to relaxation time spread and dielectric dispersion. | is the impedance due to a complex circuit component, is a pseudo-capacitive coefficient, and is an arbitrary constant with no physical meaning and its value between 0 and 1 (0 ≤ ≤ 1). If = 1 then [145,146]. | |
 | The Warburg element (W) can be used to simulate the semi-infinite diffusion at the electrode/sample interface. | = | is the impedance of the Warburg element, and 𝜎 is the Warburg parameter [147]. |
| Equivalent Circuit Model | Parameters | Specification | Limitations | Ref. |
|---|---|---|---|---|
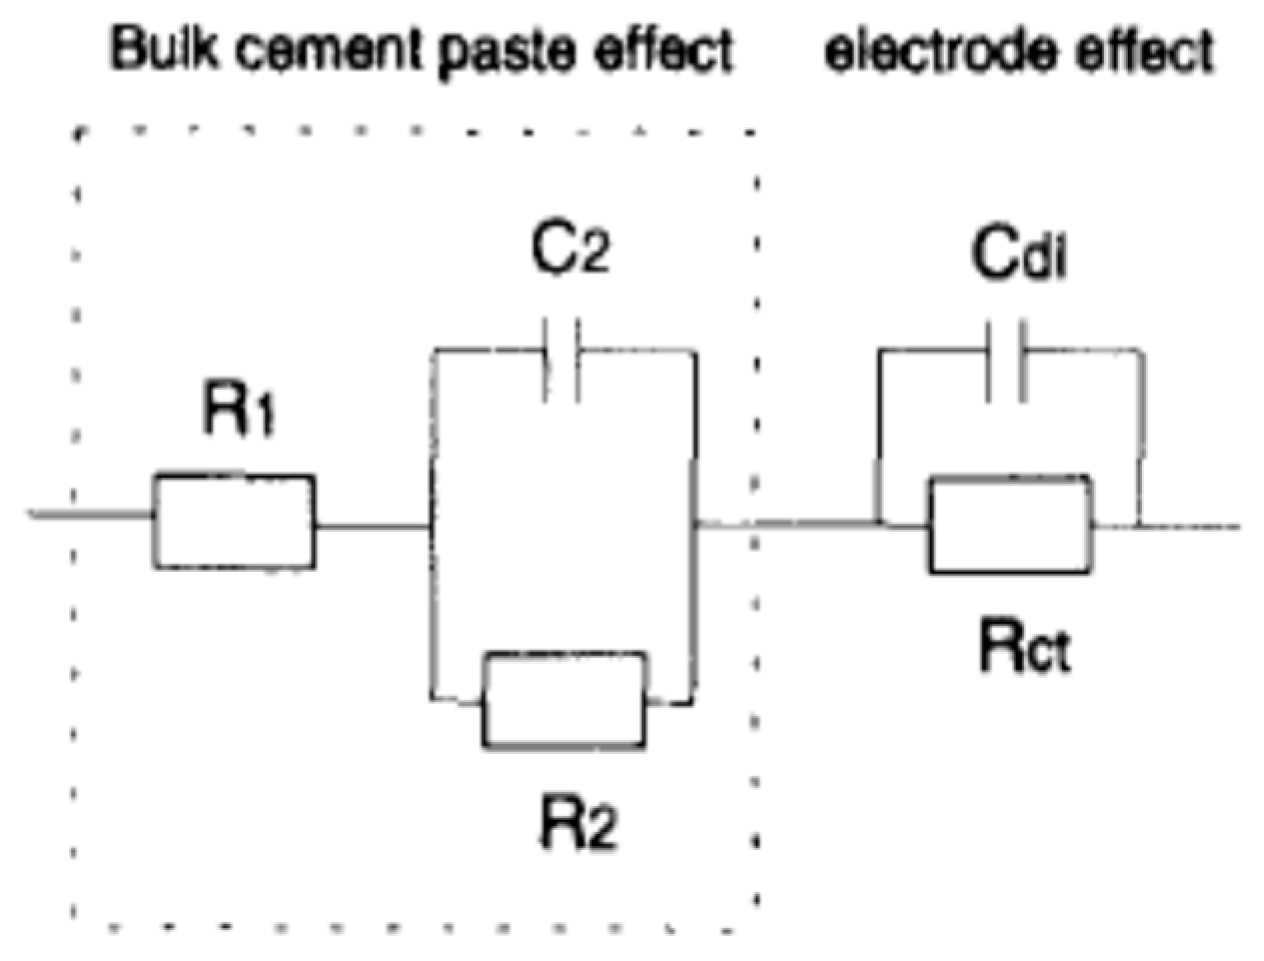 | R1 is the high-frequency resistance, R2 is the resistance of solid/liquid interface, and C2 is the bulk capacitance. Rct is the charge transfer resistance of the cement/electrode interface, and Cdl is the double-layer capacitance. | The model was used to study the crack growth of cement-based composites reinforced with polypropylene, carbon fibre, and mica flakes under a compressive load. | The model can characterise and detect crack growth in cement-based composites containing polypropylene fibres and mica flakes. However, it did not reflect the microstructure of cement-based materials incorporating carbon fibres. | [173] |
 | Rox is the resistance due to the oxide film formation on the copper-mesh electrodes, and Cox is the capacitance due to the electrode films or double layers. Rc and Cc are the resistance and capacitance due to the fibre oxide coating, respectively. Rsp and Csp are the spreading resistance and capacitance at fibre tips, respectively. Rb/ and Cb/ are the bulk resistance and the bulk capacitance between adjacent fibres, respectively. Rb and Cb are the bulk resistance and capacitance of the matrix, respectively. | The model was used to study the non-linear relationship between current and voltage in cement-based composites containing steel fibres. | The threshold of the four-point DC resistance measurement was ±50 mA, with a range of frequencies of 11–100 MHz. Additionally, measuring the resistance for a long period of time leads to the corrosion of fibre tips. | [174] |
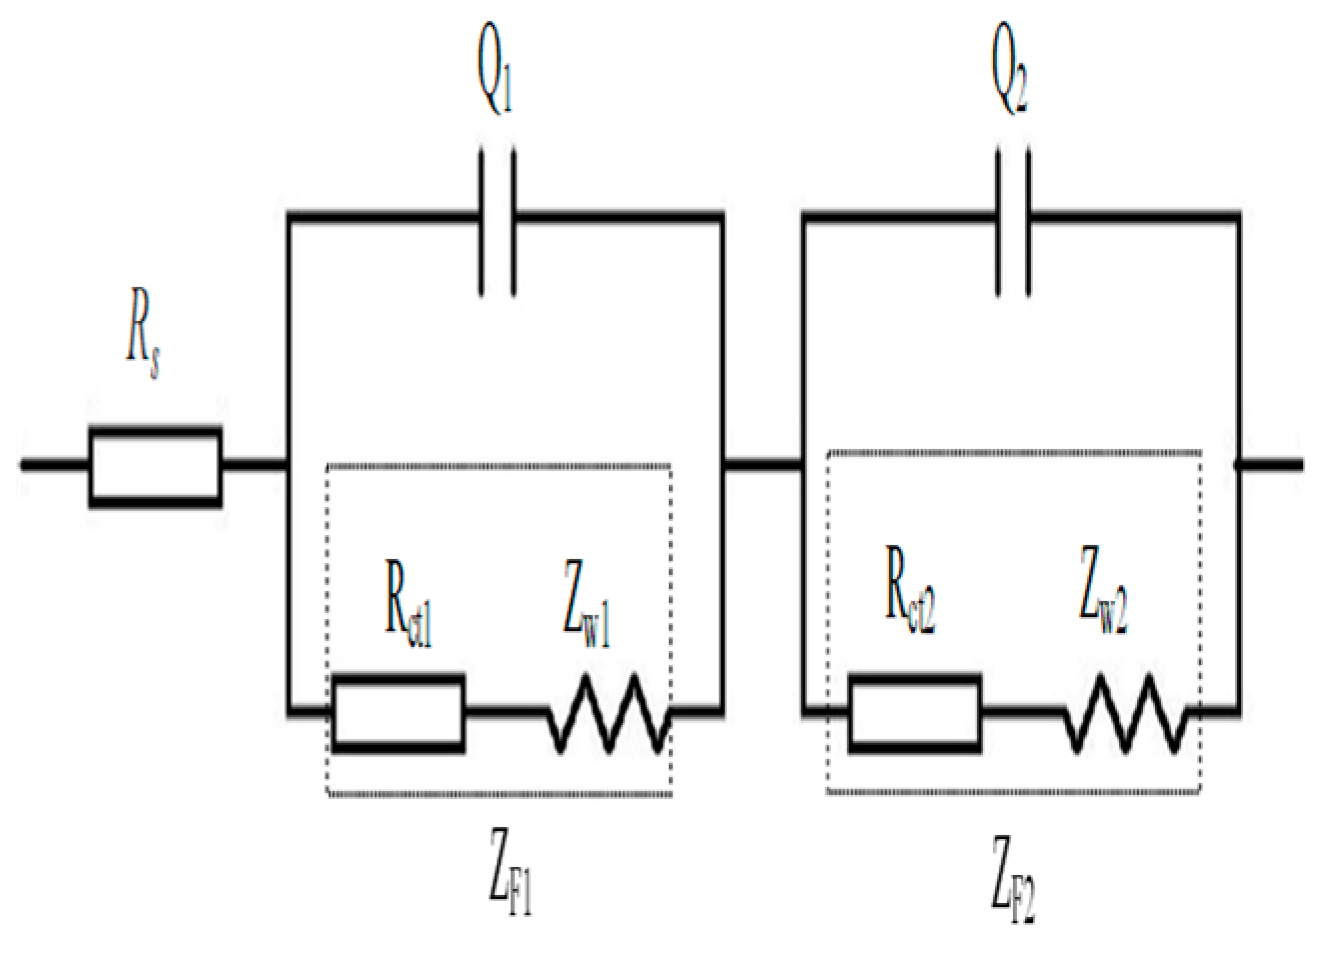 | Rs simulates the resistance of electrolyte solutions. Q1 represents the double-layer capacitance on the surface of multi-walled CNTs, Rct1 simulates the resistance caused by charge transfer on the surface of multi-walled CNTs, and Zw1 simulates the Warburg resistance due to charge diffusion on the surface of multi-walled CNTs. Q2 represents the double-layer capacitance between cement material and electrodes, Rct2 simulates the resistance due to charge transfer on the surface of electrodes, and Zw2 represents the Warburg resistance due to charge diffusion on the surface of electrodes. | The model was used to study the fracture toughness of multi-walled carbon nanotube/cement composites. | The model was limited to carbon nanotubes with lengths and diameters of 10–30 µm and 10–20 nm, respectively. The CNT was up to 0.1 wt%. | [175] |
 | R1 simulates the bulk resistance of conductive paths, and R2 represents the resistance of partially conductive paths. C1 simulates the capacitance of non-conductive paths, and C2 represents the capacitance of partially conductive paths. | The model was used to study the electrical properties of cement-based composites containing carbon black nanoparticles and PVA fibres. | The model was used to simulate the high-frequency region, excluding the electrode/sample interface. It was restricted to uncracked bulk samples containing PVA fibres at 2% by volume and CB up to 10%. | [176] |
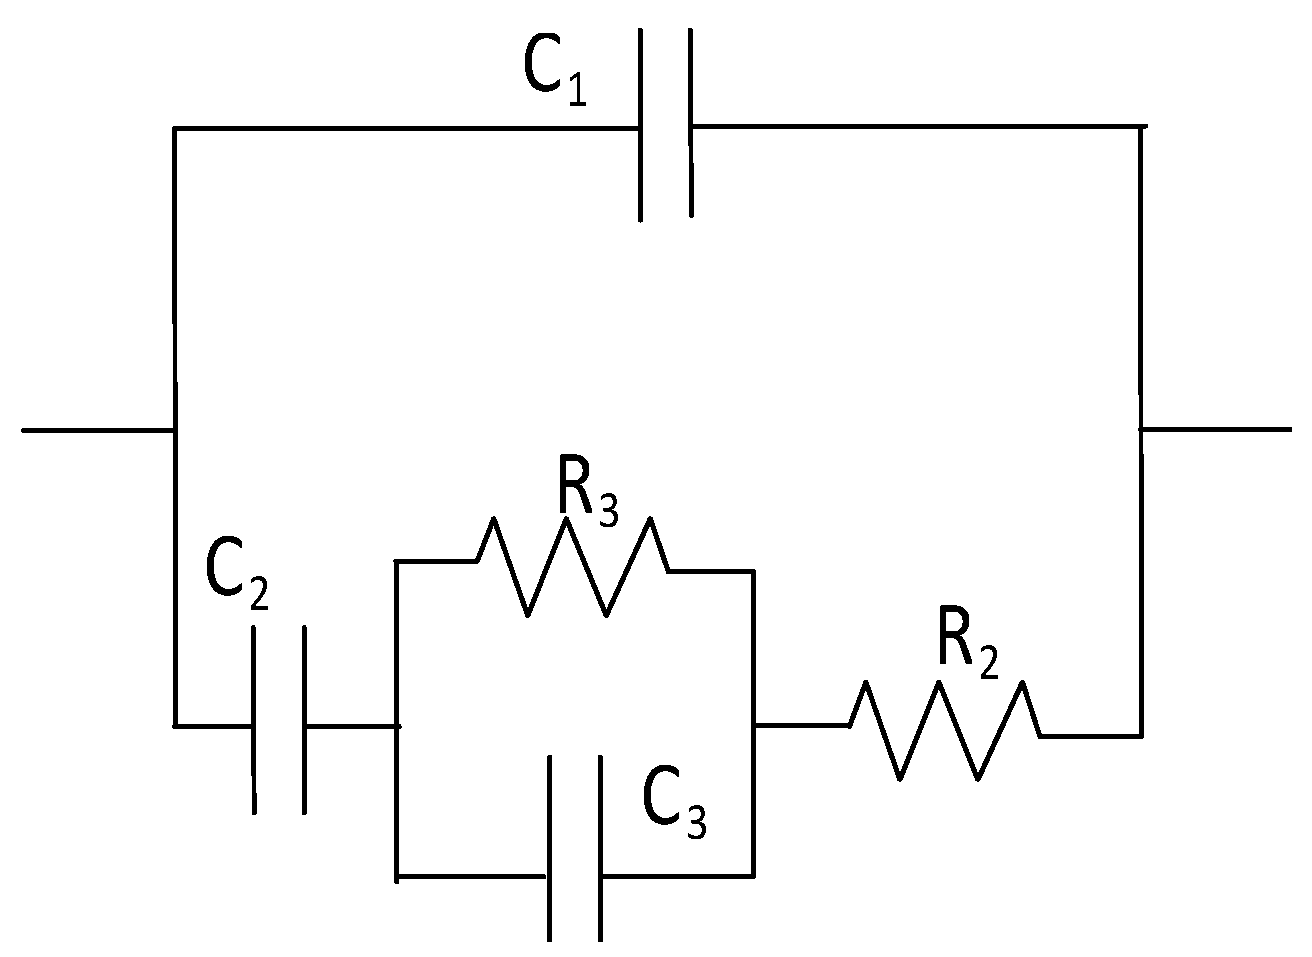 | R2 is a resistor representing the electrolyte filling the non-percolating pores, and R3 is a resistor simulating the charge transfer across the fibre/electrolyte interface. C1 is a capacitor representing the solid phase, C2 is a capacitor simulating the electrolyte filling the non-percolating pores, and C3 is a double-layer capacitor simulating the fibre/electrolyte interface. | The model was used to study the microstructure of cementitious materials incorporating short carbon fibres. | The model was used to simulate the high-frequency region, excluding the electrode/sample interface. It was restricted to cement-based samples containing carbon fibres with a length of 5.5 mm and up to 1% by weight of cement. | [177] |
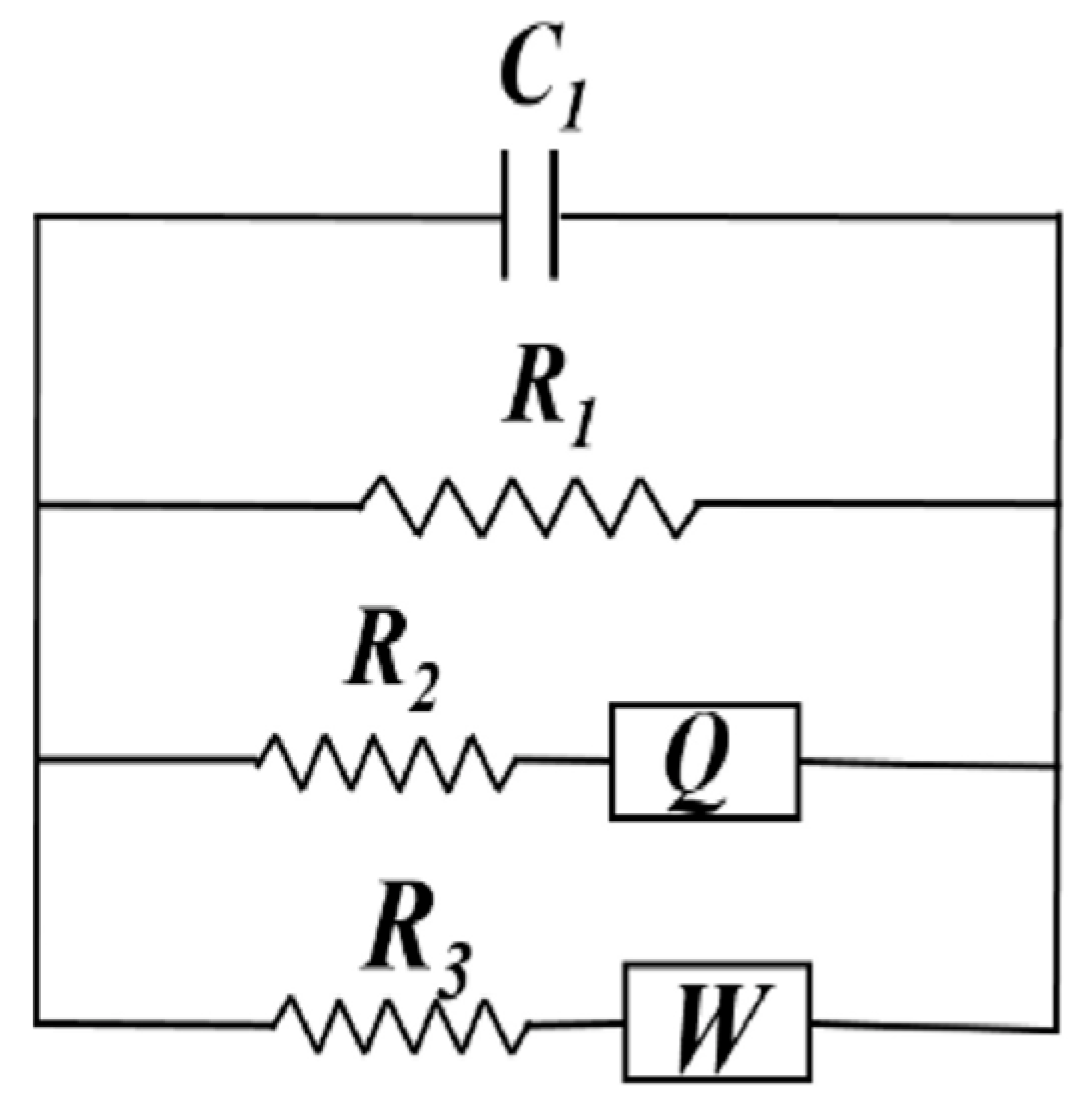 | C1 is a capacitor representing the insulating matrix, and R1 is a resistor simulating carbon fibre networks or connected solutions. R2/ZQ is a resistor in addition to a constant phase element to simulate the complex unconnected pore structure, and R3/Zw is a resistor in addition to the Warburg element to simulate the diffusion. | The model was used to study the conductive mechanisms of cementitious materials incorporating short carbon and PVA fibres. | The model was restricted to cement-based samples containing carbon fibres with a length of 9 mm and up to 3% by weight of cement. | [178] |
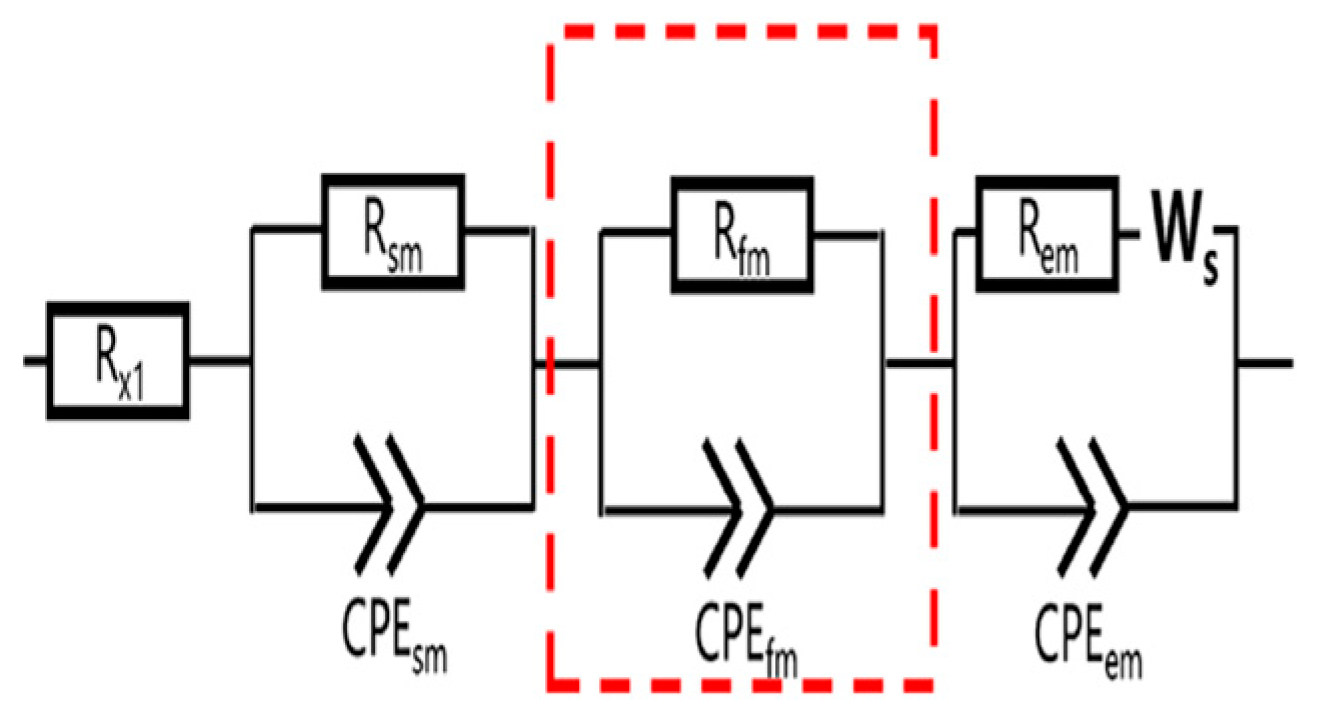 | Rx1 is a resistor representing the left intercept of the arc and the real axis. Rsm/CPEsm and Rfm/CPEfm simulate the responses from the steel fibre/matrix interface and the few-layer graphene/matrix interface, respectively. The Rem/CPEem/Ws circuit simulates the response from the electrode/matrix interface. | The model was used to study the piezoresistive behaviour of smart ultra-high-performance fibre-reinforced concrete incorporating few-layer graphene nanomaterials as a conductive filler. | The cementitious matrix was composed of cement, quartz powder, and quartz sand with proportions of 743, 250, and 1070 kg/m3, respectively. | [179] |
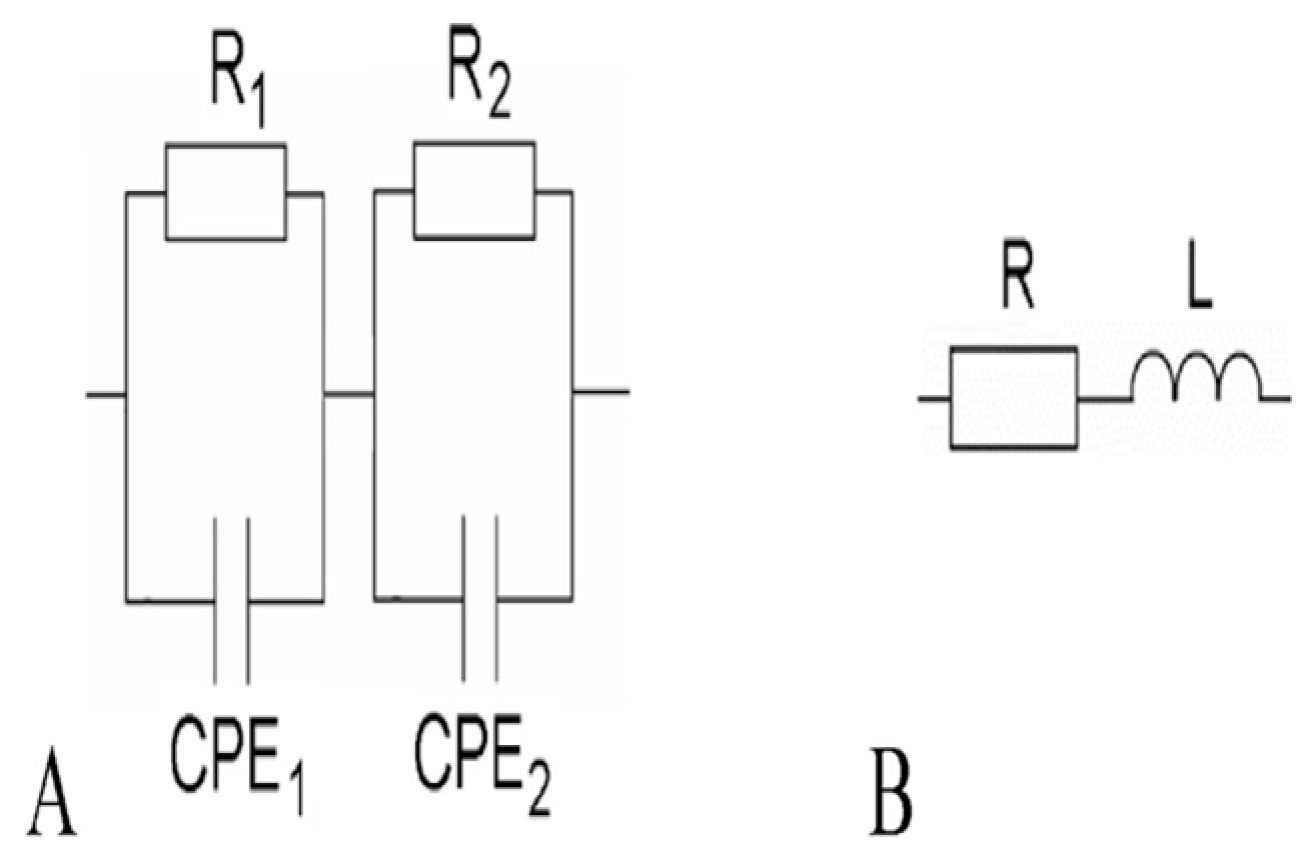 | Model A represents cement-based composites containing a low percentage of expanded graphite. This model contains two loops: loop one includes a resistor (R1) and a constant phase element (CPE1) to simulate the cement/graphite interface in the high-frequency region; loop two incorporates a resistor (R2) and a constant phase element (CPE2) to simulate the electrode/matrix interface in the low-frequency region. On the other hand, model B represents cement-based composites containing a high percentage of expanded graphite. It comprises a resistor (R) and an inductor (L) in a series circuit. | The model was used to study the percolation threshold of cement-based composites containing expanded graphite. | The model was restricted to intercalated graphite type EG 290 as the conductive medium, with bulk densities of 0.016 and 0.04 gm/cm3 at 500 and 1000 degrees Celsius, respectively. The percolation threshold obtained from IS was lower than DC measurements. | [180] |
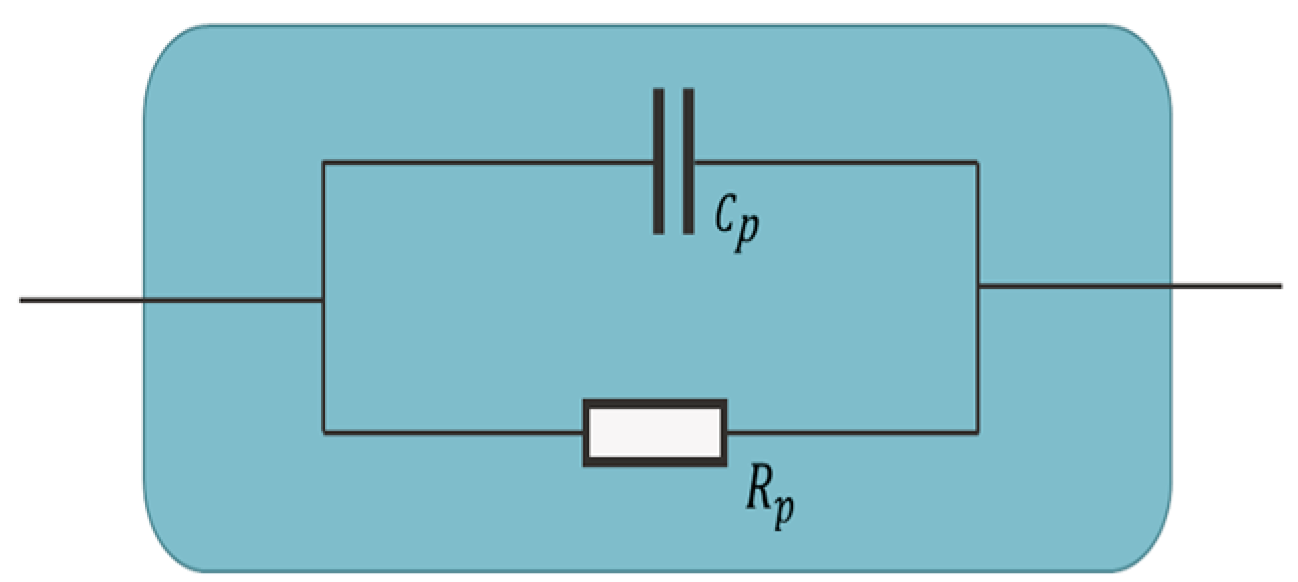 | The model includes a resistor (Rp) to simulate the bulk resistance of the cement-based sensor between electrodes and a capacitor (Cp) to simulate the polarisation processes in the same sample. | The model was used to study the electrical properties of smart ultra-high-performance concrete containing steel fibres as conductive fillers. | The model was for the high-frequency region, excluding the electrode/sample interface. It was restricted to a cementitious matrix containing copper-coated steel fibres with a length of 13 mm, a diameter of 0.22 mm and up to 2% by volume. | [181] |
Disclaimer/Publisher’s Note: The statements, opinions and data contained in all publications are solely those of the individual author(s) and contributor(s) and not of MDPI and/or the editor(s). MDPI and/or the editor(s) disclaim responsibility for any injury to people or property resulting from any ideas, methods, instructions or products referred to in the content. |
© 2023 by the authors. Licensee MDPI, Basel, Switzerland. This article is an open access article distributed under the terms and conditions of the Creative Commons Attribution (CC BY) license (https://creativecommons.org/licenses/by/4.0/).
Share and Cite
Elseady, A.A.E.; Lee, I.; Zhuge, Y.; Ma, X.; Chow, C.W.K.; Gorjian, N. Piezoresistivity and AC Impedance Spectroscopy of Cement-Based Sensors: Basic Concepts, Interpretation, and Perspective. Materials 2023, 16, 768. https://doi.org/10.3390/ma16020768
Elseady AAE, Lee I, Zhuge Y, Ma X, Chow CWK, Gorjian N. Piezoresistivity and AC Impedance Spectroscopy of Cement-Based Sensors: Basic Concepts, Interpretation, and Perspective. Materials. 2023; 16(2):768. https://doi.org/10.3390/ma16020768
Chicago/Turabian StyleElseady, Amir A. E., Ivan Lee, Yan Zhuge, Xing Ma, Christopher W. K. Chow, and Nima Gorjian. 2023. "Piezoresistivity and AC Impedance Spectroscopy of Cement-Based Sensors: Basic Concepts, Interpretation, and Perspective" Materials 16, no. 2: 768. https://doi.org/10.3390/ma16020768
APA StyleElseady, A. A. E., Lee, I., Zhuge, Y., Ma, X., Chow, C. W. K., & Gorjian, N. (2023). Piezoresistivity and AC Impedance Spectroscopy of Cement-Based Sensors: Basic Concepts, Interpretation, and Perspective. Materials, 16(2), 768. https://doi.org/10.3390/ma16020768


