Thermoanalytical and X-ray Diffraction Studies on the Phase Transition of the Calcium-Substituted La2Mo2O9 System
Abstract
1. Introduction
2. Materials and Methods
3. Results and Discussion
3.1. Thermal Analysis
3.2. X-ray Diffraction
4. Conclusions
Author Contributions
Funding
Institutional Review Board Statement
Informed Consent Statement
Data Availability Statement
Conflicts of Interest
Appendix A



Appendix B


References
- Lacorre, P.; Goutenoire, F.; Bohnke, O.; Retoux, R.; Laligant, Y. Designing fast oxide-ion conductors based on La2Mo2O9. Nature 2000, 404, 856–858. [Google Scholar] [CrossRef] [PubMed]
- Skinner, S.J.; Kilner, J.A. Oxygen ion conductors. Mater. Today 2003, 6, 30–37. [Google Scholar] [CrossRef]
- Yang, J.; Wang, Y.; Yang, B.; Tian, C.; Liu, Y.; Yang, L. Research progress of La2Mo2O9-based oxide-ion conductor electrolyte materials. Nanomater. Nanotechnol. 2022, 11, 1–7. [Google Scholar] [CrossRef]
- Jacquens, J.; Farrusseng, D.; Georges, S.; Viricelle, J.P.; Gaudillere, C.; Corbel, G.; Lacorre, P. Tests for the Use of La2Mo2O9-based Oxides as Multipurpose SOFC Core Materials. Fuel Cells 2010, 10, 433–439. [Google Scholar] [CrossRef]
- Lo, J.C.; Tsai, D.S.; Chen, Y.C.; Le, M.V.; Chung, W.H.; Liu, F.J. La2Mo2O9-Based Electrolyte: Ion Conductivity and Anode-Supported Cell under Single Chamber Conditions. J. Am. Ceram. Soc. 2011, 94, 806–811. [Google Scholar] [CrossRef]
- Kilner, J.; Druce, J.; Ishihara, T. Electrolytes. In High-Temperature Solid Oxide Fuel Cells for the 21st Century: Fundamentals, Design and Applications: Second Edition, 2nd ed.; Kendall, K., Kendall, M., Eds.; Elsevier Inc.: Amsterdam, The Netherlands, 2016; pp. 85–132. [Google Scholar] [CrossRef]
- Siddharth Sil, A.; Bysakh, S. Effect of K doping on Mo6+ stability and ionic conductivity study in La2Mo2O9 as oxide-ion conductor. Mater. Res. Express 2019, 6, 056203. [Google Scholar] [CrossRef]
- Ali, M.; Wani, B.N.; Bharadwaj, S.R. Phase transition in LAMOX type compounds. J. Therm. Anal. Calorim. 2009, 96, 463–468. [Google Scholar] [CrossRef]
- Zhang, H.; Wang, Y.; Wang, H.O.; Huo, D.X.; Tan, W.S. Room-temperature magnetoresistive and magnetocaloric effect in La1-xBaxMnO3 compounds: Role of Griffiths phase with ferromagnetic metal cluster above Curie temperature. J. Appl. Phys. 2022, 131, 043901. [Google Scholar] [CrossRef]
- Evans, I.R.; Howard, J.A.K.; Evans, J.S.O. The crystal structure of alpha-La2Mo2O9 and the structural origin of the oxide ion migration pathway. Chem. Mater. 2005, 17, 4074–4077. [Google Scholar] [CrossRef]
- Goutenoire, F.; Isnard, O.; Retoux, R.; Lacorre, P. Crystal structure of La2Mo2O9, a new fast oxide-ion conductor. Chem. Mater. 2000, 12, 2575–2580. [Google Scholar] [CrossRef]
- Selmi, A.; Galven, C.; Corbel, G.; Lacorre, P. Thermal stability of alkali and alkaline-earth substituted LAMOX oxide-ion conductors. Dalton Trans. 2010, 39, 93–102. [Google Scholar] [CrossRef] [PubMed]
- Tealdi, C.; Chiodelli, G.; Flor, G.; Leonardi, S. Electrode stability and electrochemical performance of Lamox electrolytes under fuel cell conditions. Solid State Ionics 2010, 181, 1456–1461. [Google Scholar] [CrossRef]
- El Khal, H.; Cordier, A.; Batis, N.; Siebert, E.; Georges, S.; Steil, M.C. Effect of porosity on the electrical conductivity of LAMOX materials. Solid State Ionics 2017, 304, 75–84. [Google Scholar] [CrossRef]
- Malavasi, L.; Fisher, C.A.J.; Islam, M.S. Oxide-ion and proton conducting electrolyte materials for clean energy applications: Structural and mechanistic features. Chem. Soc. Rev. 2010, 39, 4370–4387. [Google Scholar] [CrossRef] [PubMed]
- Zhang, D.M.; Zhuang, Z.; Gao, Y.X.; Wang, X.P.; Fang, Q.F. Electrical properties and microstructure of nanocrystalline La2-xAxMo2O9-delta (A = Ca, Sr, Ba, K) films. Solid State Ionics 2010, 181, 1510–1515. [Google Scholar] [CrossRef]
- Corbel, G.; Durand, P.; Lacorre, P. Comprehensive survey of Nd3+ substitution In La2Mo2O9 oxide-ion conductor. J. Solid State Chem. 2009, 182, 1009–1016. [Google Scholar] [CrossRef]
- Khaled, A.; Pireaux, J.J.; Khelili, S. Synthesis and Characterization of Ca and Ba Doped LAMOX Materials and Surface Study by X-ray Photoelectron Spectroscopy. Acta Chim. Slov. 2012, 59, 766–778. [Google Scholar]
- Das, A.; Lakhanlal, L.; Shajahan, I.; Dasari, H.P.; Saidutta, M.B.; Dasari, H. Dilatometer studies on LAMOX based electrolyte materials for solid oxide fuel cells. Mater. Chem. Phys. 2021, 258, 123958. [Google Scholar] [CrossRef]
- Corbel, G.; Laligant, Y.; Goutenoire, F.; Suard, E.; Lacorre, P. Effects of partial substitution of Mo6+ by Cr6+ and W6+ on the crystal structure of the fast oxide-ion conductor structural effects of W6+. Chem. Mater. 2005, 17, 4678–4684. [Google Scholar] [CrossRef]
- Georges, S.; Bohnke, O.; Goutenoire, F.; Laligant, Y.; Fouletier, J.; Lacorre, P. Effects of tungsten substitution on the transport properties and mechanism of fast oxide-ion conduction in La2Mo2O9. Solid State Ionics 2006, 177, 1715–1720. [Google Scholar] [CrossRef]
- Pinet, P.; Fouletier, J.; Georges, S. Conductivity of reduced La2Mo2O9 based oxides: The effect of tungsten substitution. Mater. Res. Bull. 2007, 42, 935–942. [Google Scholar] [CrossRef]
- Kazakevicius, E.; Kezionis, A.; Kazlauskas, S.; Zalga, A.; Barre, M.; Juskenas, R. Phase transformations in La2-xYxMo2O9 (x=0.05, x=0.075): Temperature cycling and DRT analysis. Solid State Ionics 2019, 339, 114989. [Google Scholar] [CrossRef]
- Liao, Y.W.; Kawabata, S.; Yabutsuka, T.; Chen, W.J.; Okumura, H.; Takai, S. Low temperature phase transition phenomena in Ba- and Pb-substituted La2Mo2O9 oxide ion conductors. Solid State Ionics 2020, 354, 115405. [Google Scholar] [CrossRef]
- Acharya, S.; Naz, R. Nd-Nb co-dopant effect on suppression of phase transition, ionic conductivity and dielectrics relaxation phenomenon of La2Mo2O9 system. Ferroelectrics 2022, 589, 243–251. [Google Scholar] [CrossRef]
- Borah, L.N.; Sanjay; Pandey, A. Effect of Sn-doping at Mo-site on the conductivity of La2Mo2O9 series of compounds. Indian J. Phys. 2010, 84, 699–704. [Google Scholar] [CrossRef]
- Pahari, B.; Mhadhbi, N.; Corbel, G.; Lacorre, P.; Dittmer, J. Analysis of the local structure of phosphorus-substituted LAMOX oxide ion conductors. Dalton Trans. 2012, 41, 5696–5703. [Google Scholar] [CrossRef]
- Dammak, K.; Mhadhbi, N.; Tozri, A.; Naili, H. Influence of Isovalent Partial Sulfur Substitution on the Structural, Thermal, Electrical and Spectroscopic Properties of La2Mo2O9 Oxide Ion Conductors. Eur. J. Inorg. Chem. 2022, e202200165. [Google Scholar] [CrossRef]
- Paul, T.; Tsur, Y. Influence of Isovalent ‘W’ Substitutions on the Structure and Electrical Properties of La2Mo2O9 Electrolyte for Intermediate-Temperature Solid Oxide Fuel Cells. Ceramics 2021, 4, 502–515. [Google Scholar] [CrossRef]
- Selmi, A.; Corbel, G.; Kojikian, S.; Voronkova, V.; Kharitonova, E.; Lacorre, P. Complex effect of partial substitution of La3+ by Ca2+ on the stability of fast oxide-ion conductor La2Mo2O9. Eur. J. Inorg. Chem. 2008, 1813–1821. [Google Scholar] [CrossRef]
- Porotnikova, N.; Khrustov, A.; Farlenkov, A.; Khodimchuk, A.; Partin, G.; Animitsa, I.; Kochetova, N.; Pavlov, D.; Ananyev, M. Promising La2Mo2O9-La2Mo3O12 Composite Oxygen-Ionic Electrolytes: Interphase Phenomena. ACS Appl. Mater. Interfaces 2022, 14, 6180–6193. [Google Scholar] [CrossRef]
- Borah, L.N.; Pandey, A. Impedance Studies of La2Mo2-xSnxO9-delta Oxide Ion Conductors. Acta Metall. Sin. (Engl. Lett.) 2013, 26, 425–434. [Google Scholar] [CrossRef]
- Le, M.V.; Tsai, D.S.; Yao, C.C.; Lo, J.C.; Vo, T.P.G. Properties of 10% Dy-doped La2Mo2O9 and its electrolyte performance in single chamber solid oxide fuel cell. J. Alloys. Compd. 2014, 582, 780–785. [Google Scholar] [CrossRef]
- Stankevičiūtė, R.; Žalga, A. Sol-gel synthesis, crystal structure, surface morphology, and optical properties of Eu2O3-doped La2Mo3O12 ceramic. J. Therm. Anal. Calorim. 2014, 118, 925–935. [Google Scholar] [CrossRef]
- Žalga, A.; Gaidamavičienė, G.; Gricius, Ž.; Užpurvytė, E.; Gadeikis, J.; Diktanaitė, A.; Barré, M.; Šalkus, T.; Kežionis, A.; Kazakevičius, E. Aqueous sol–gel synthesis, thermoanalytical study and electrical properties of La2Mo2O9. J. Therm. Anal. Calorim. 2018, 132, 1499–1511. [Google Scholar] [CrossRef]

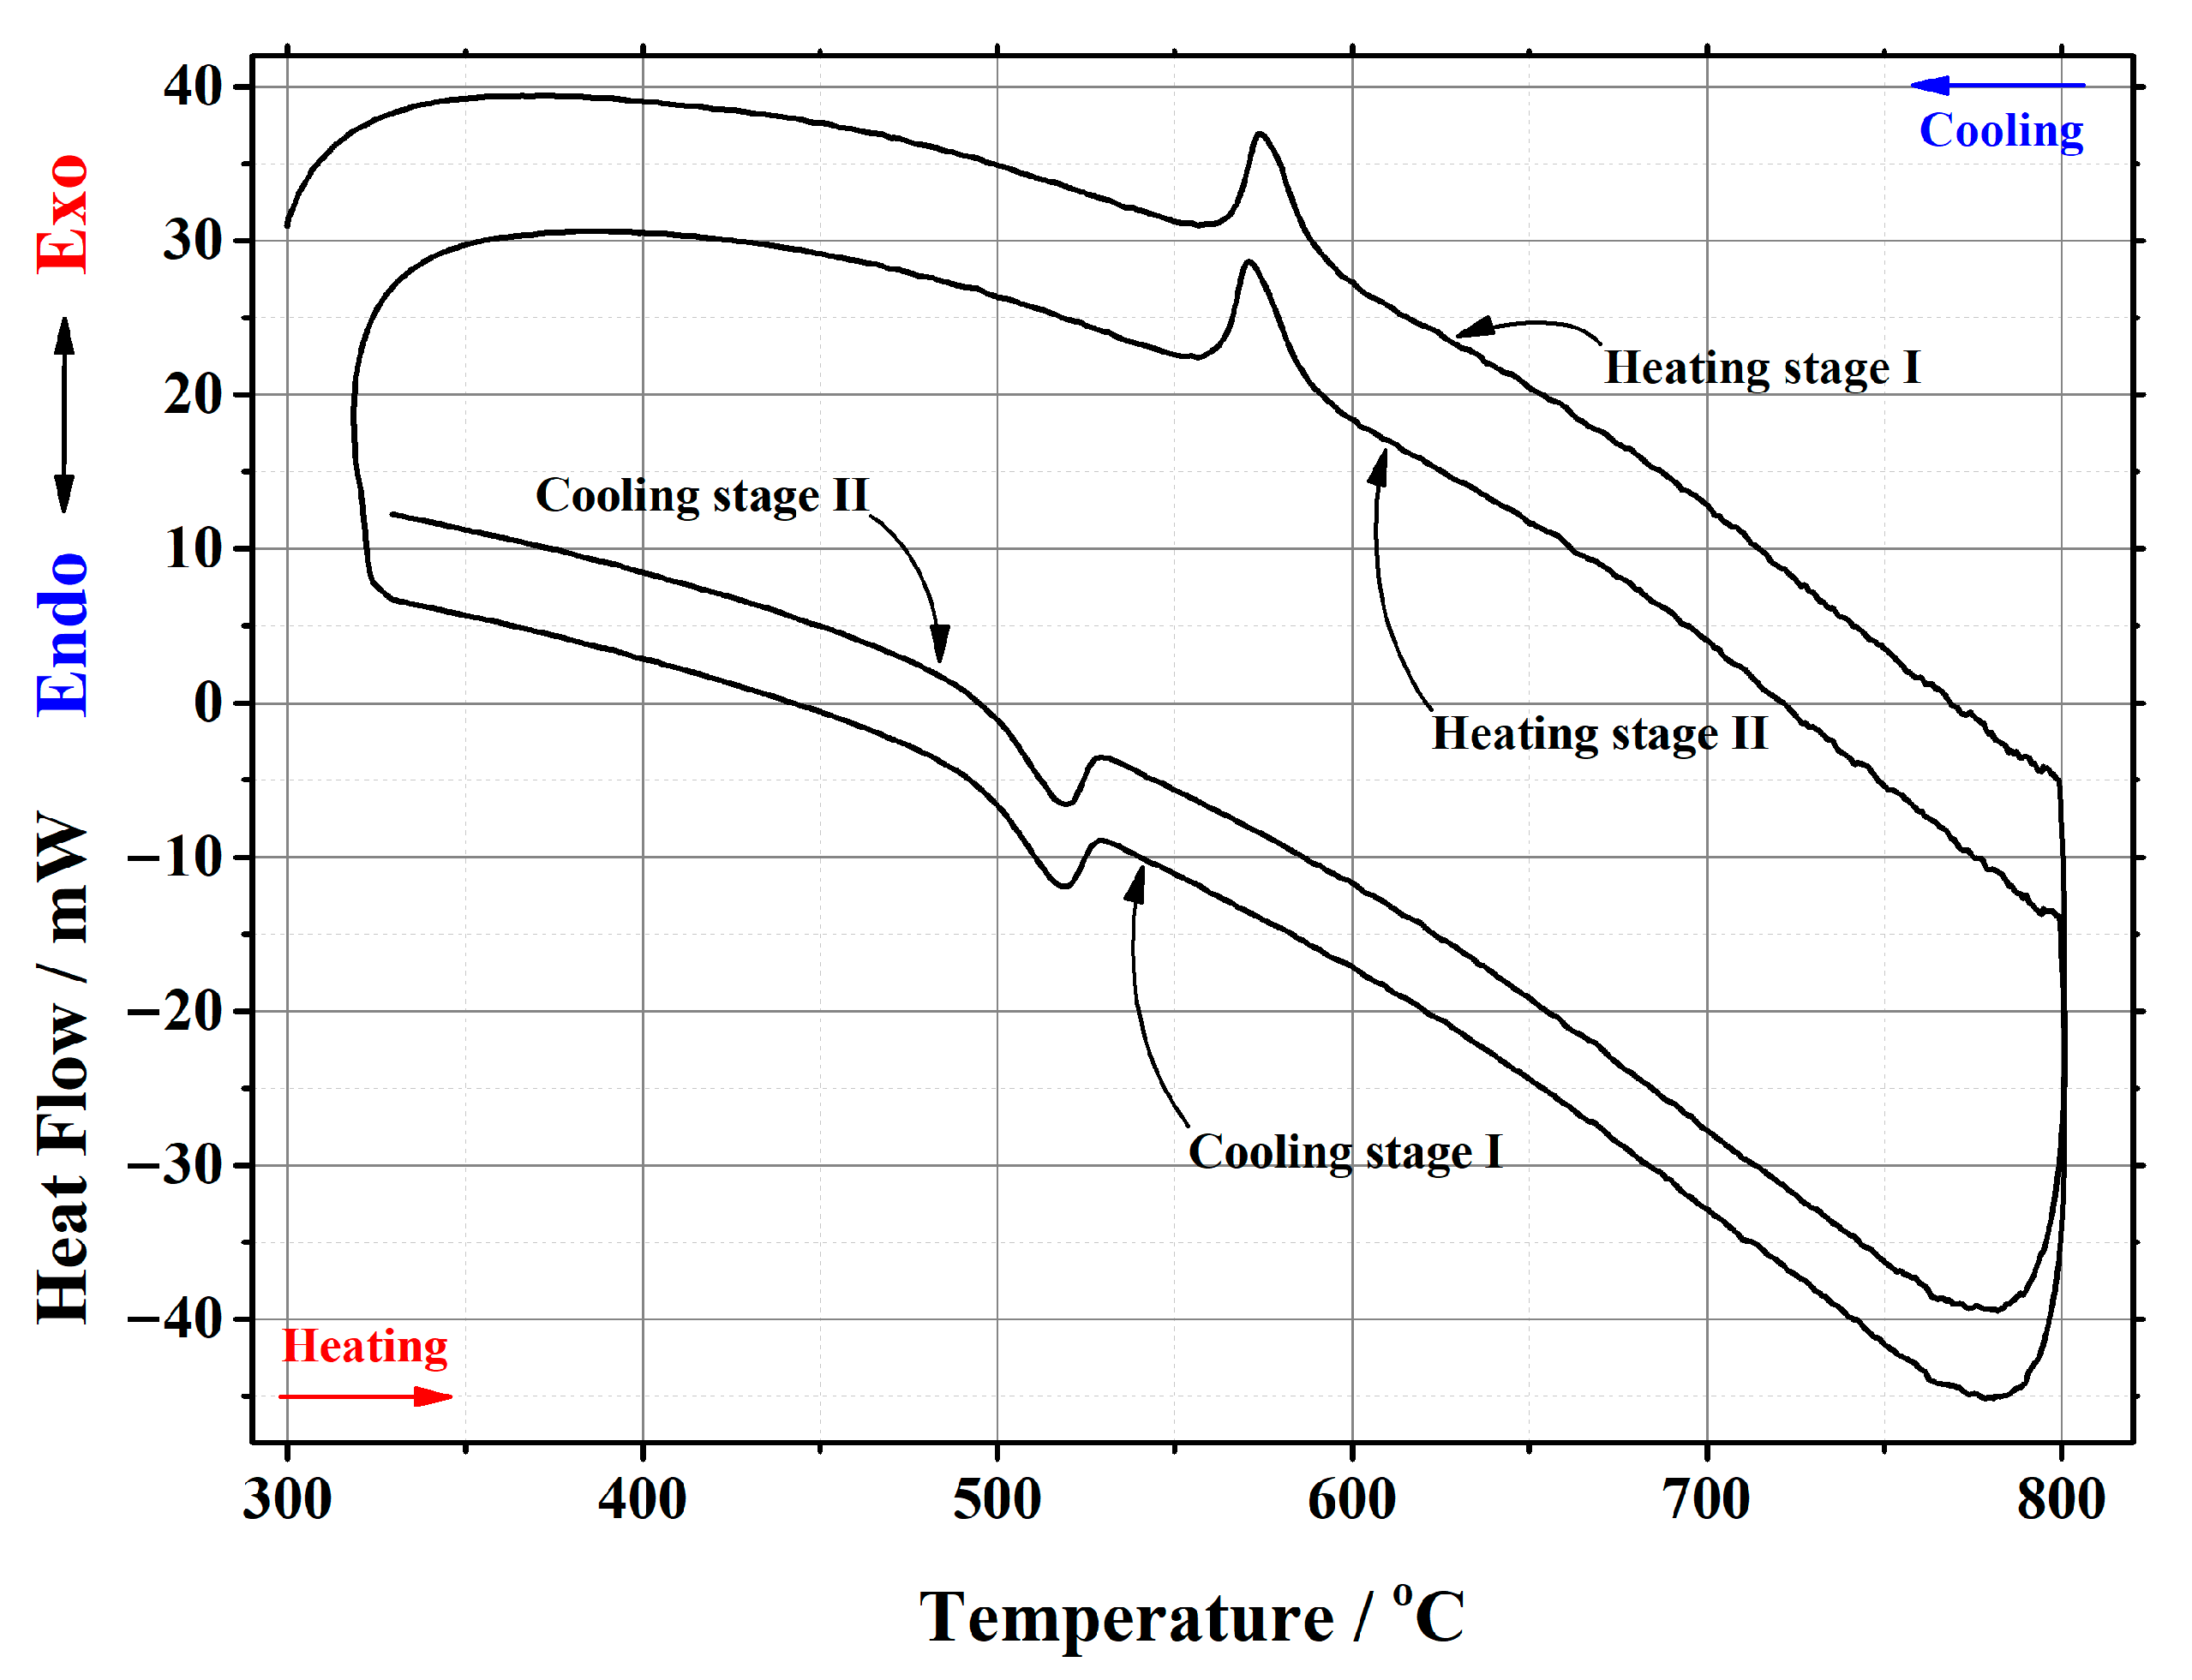
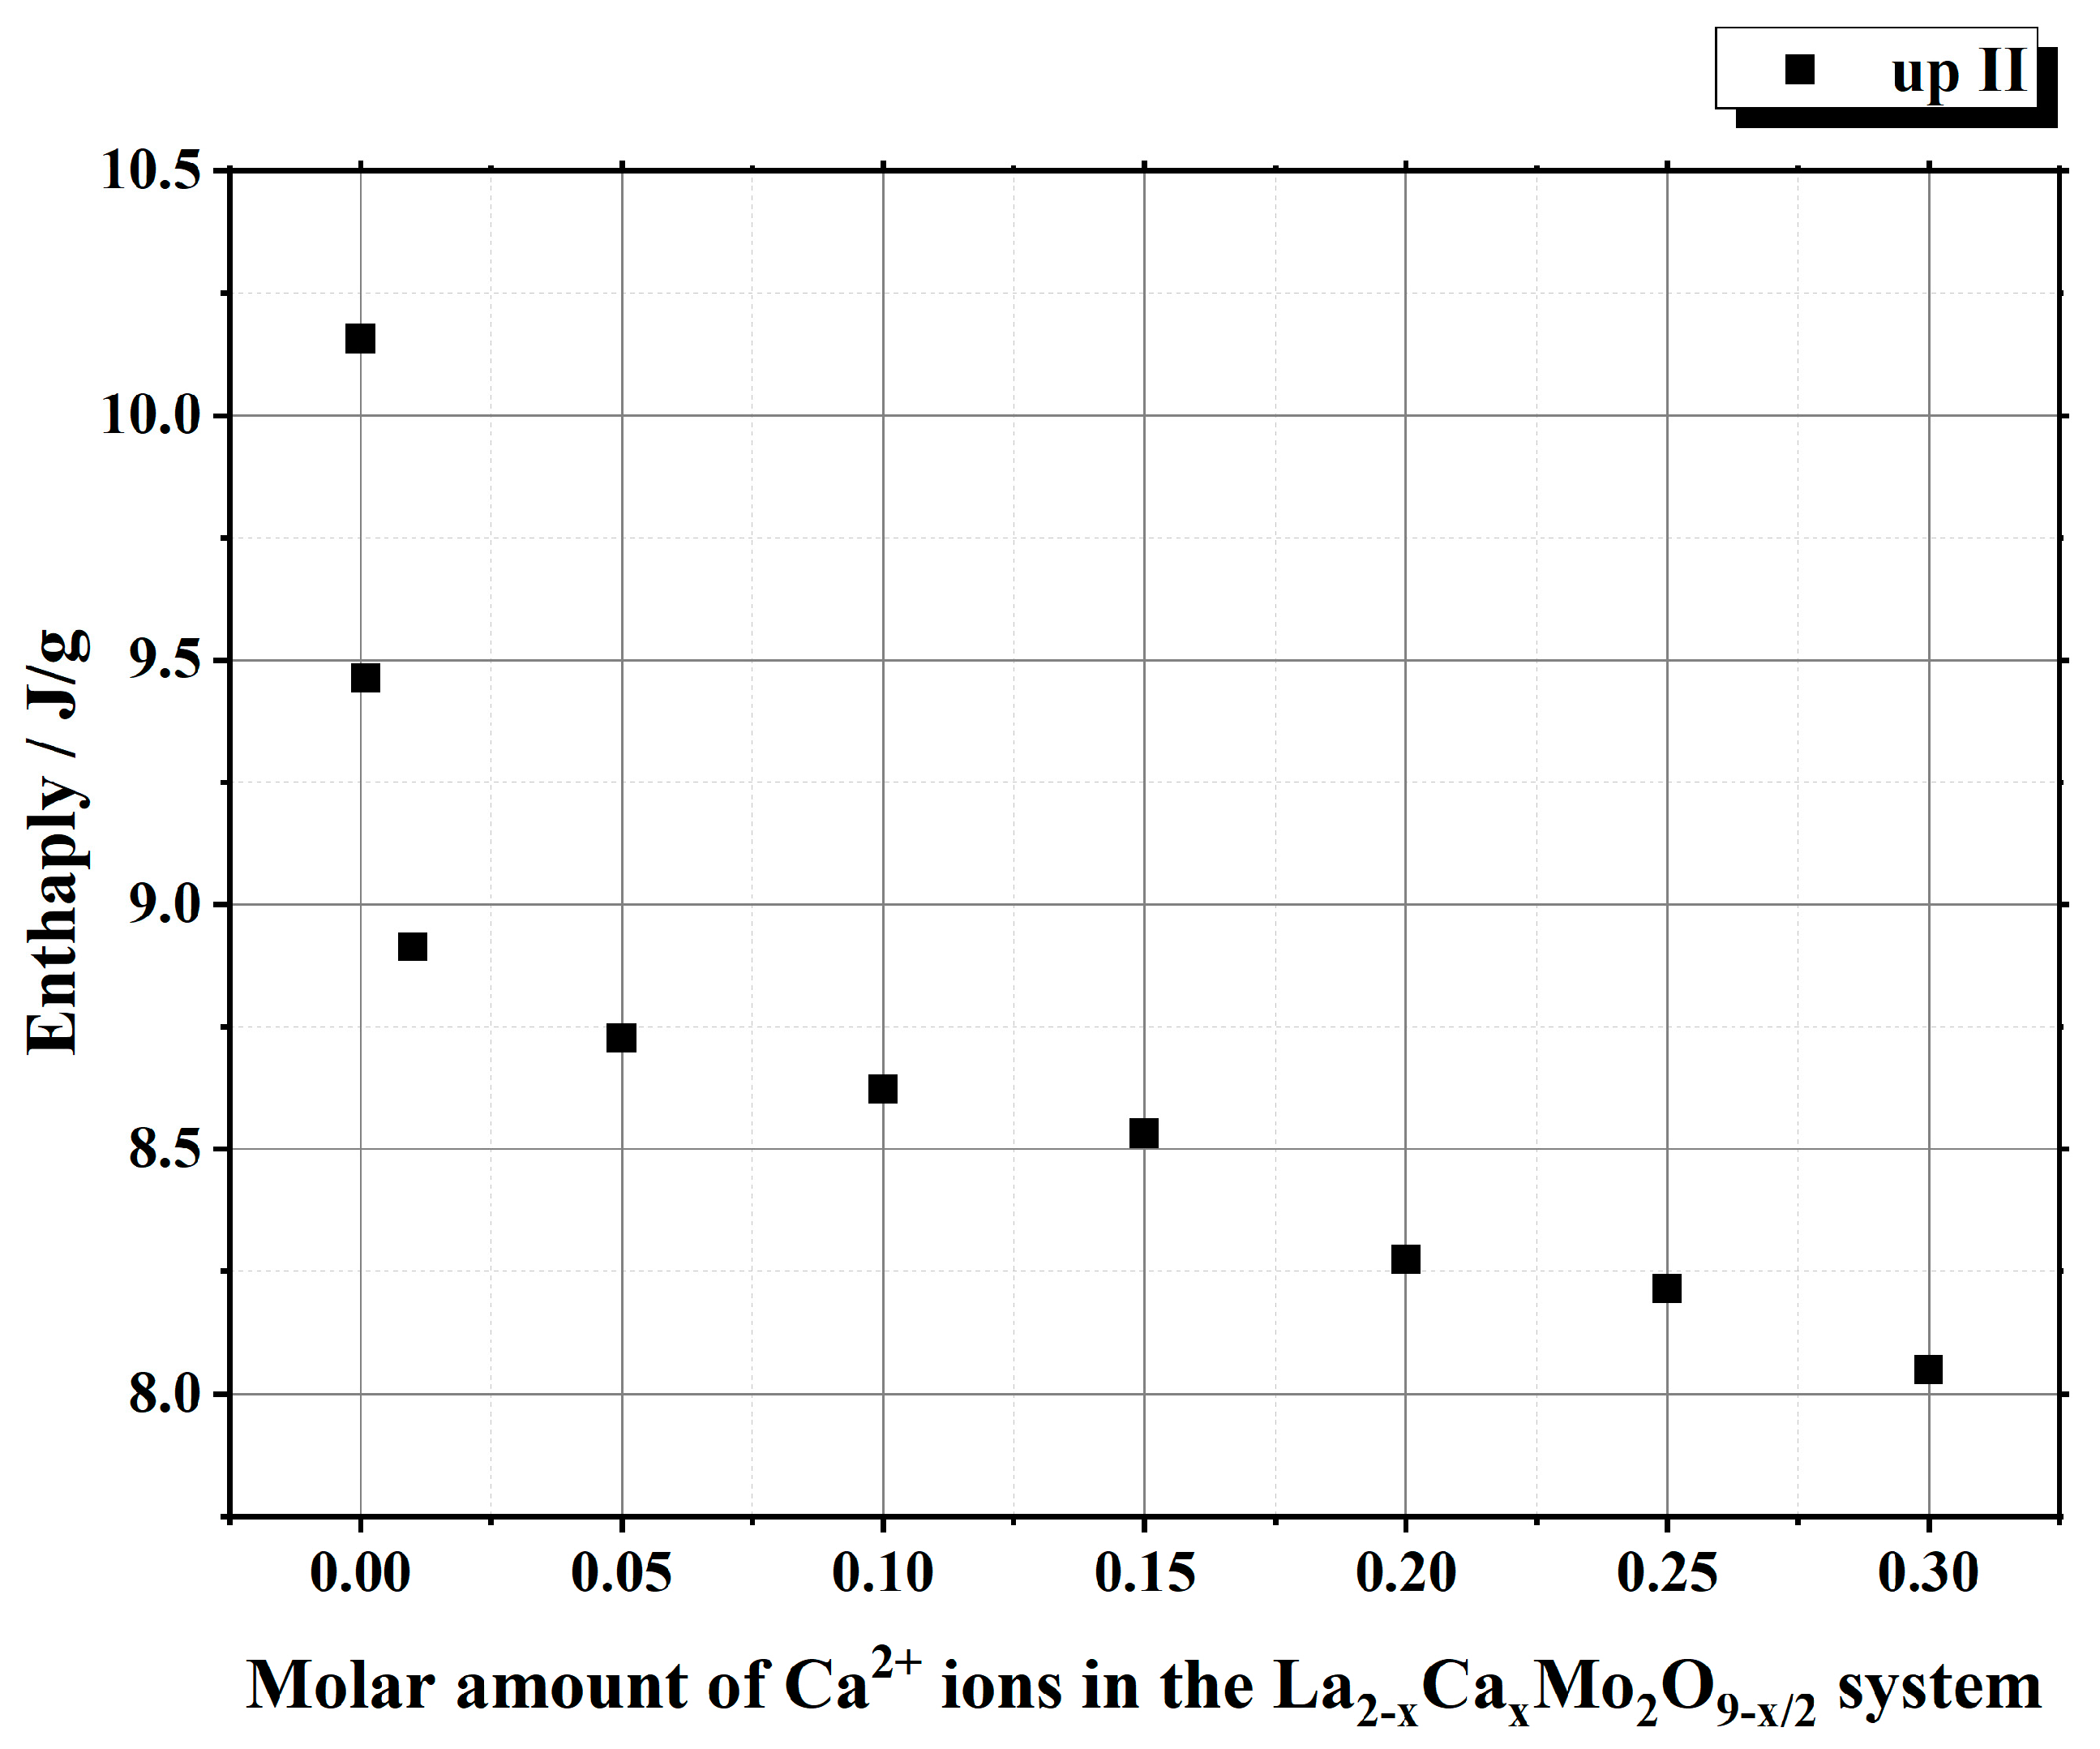
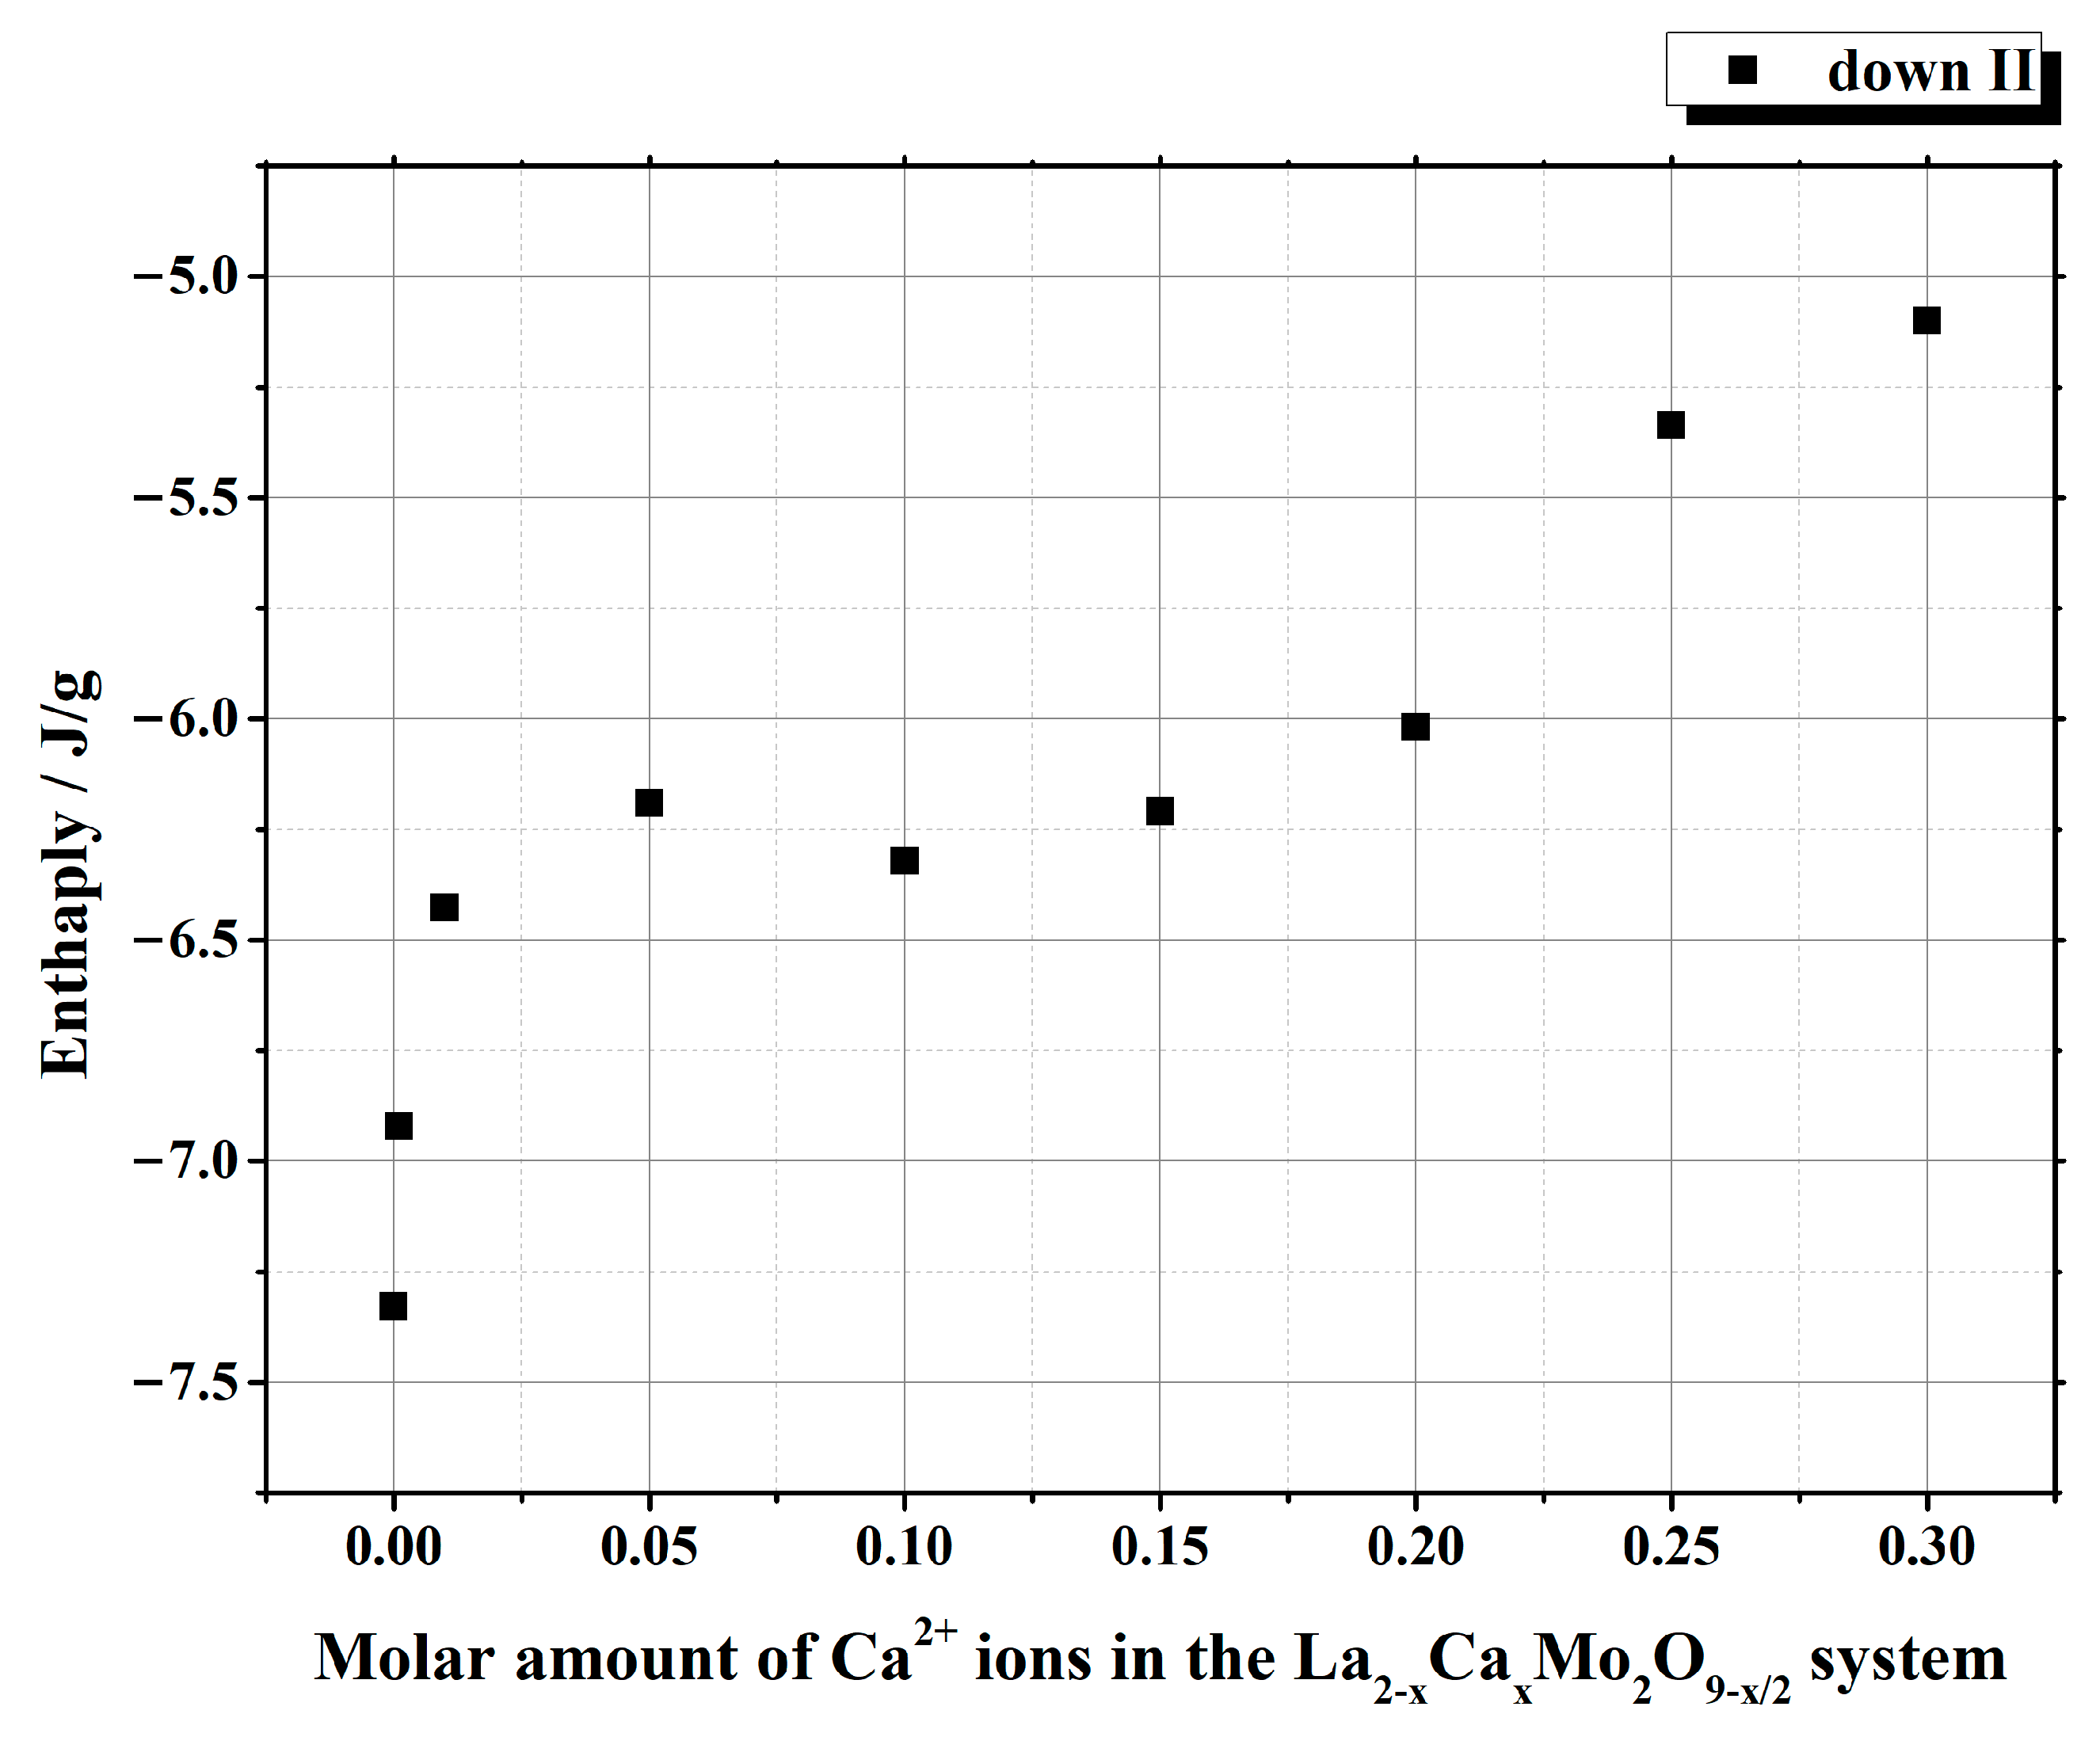

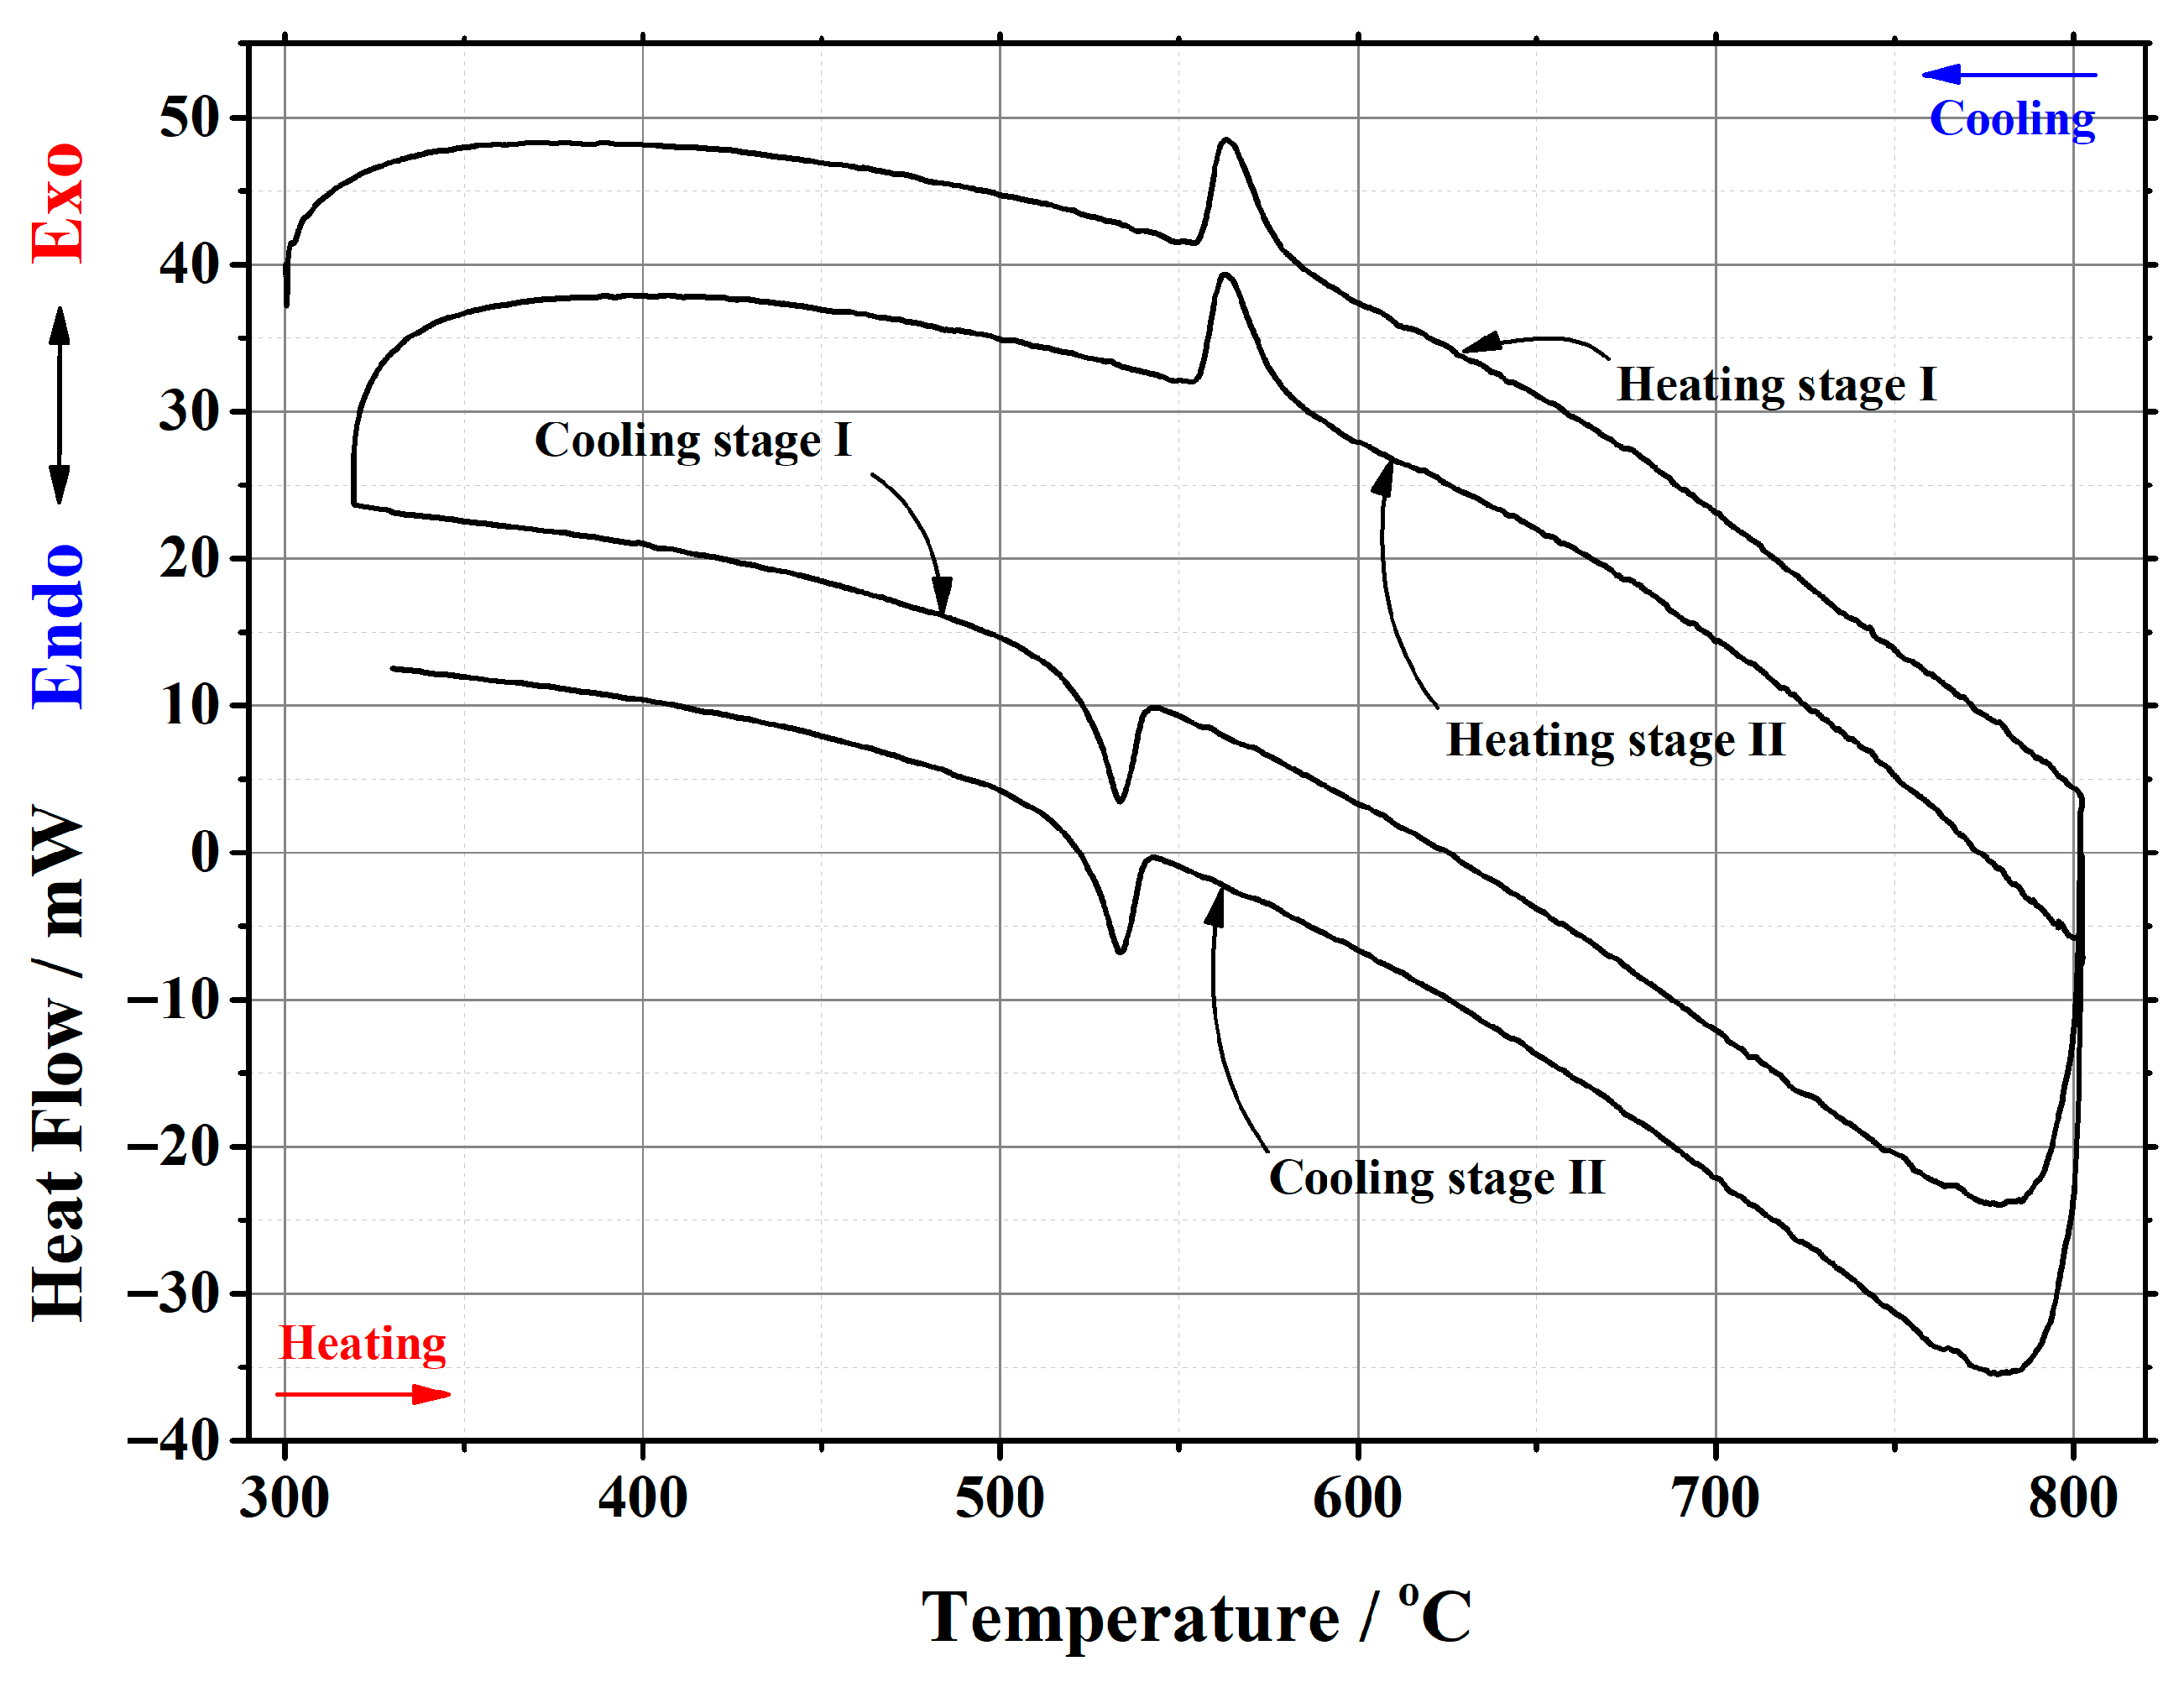
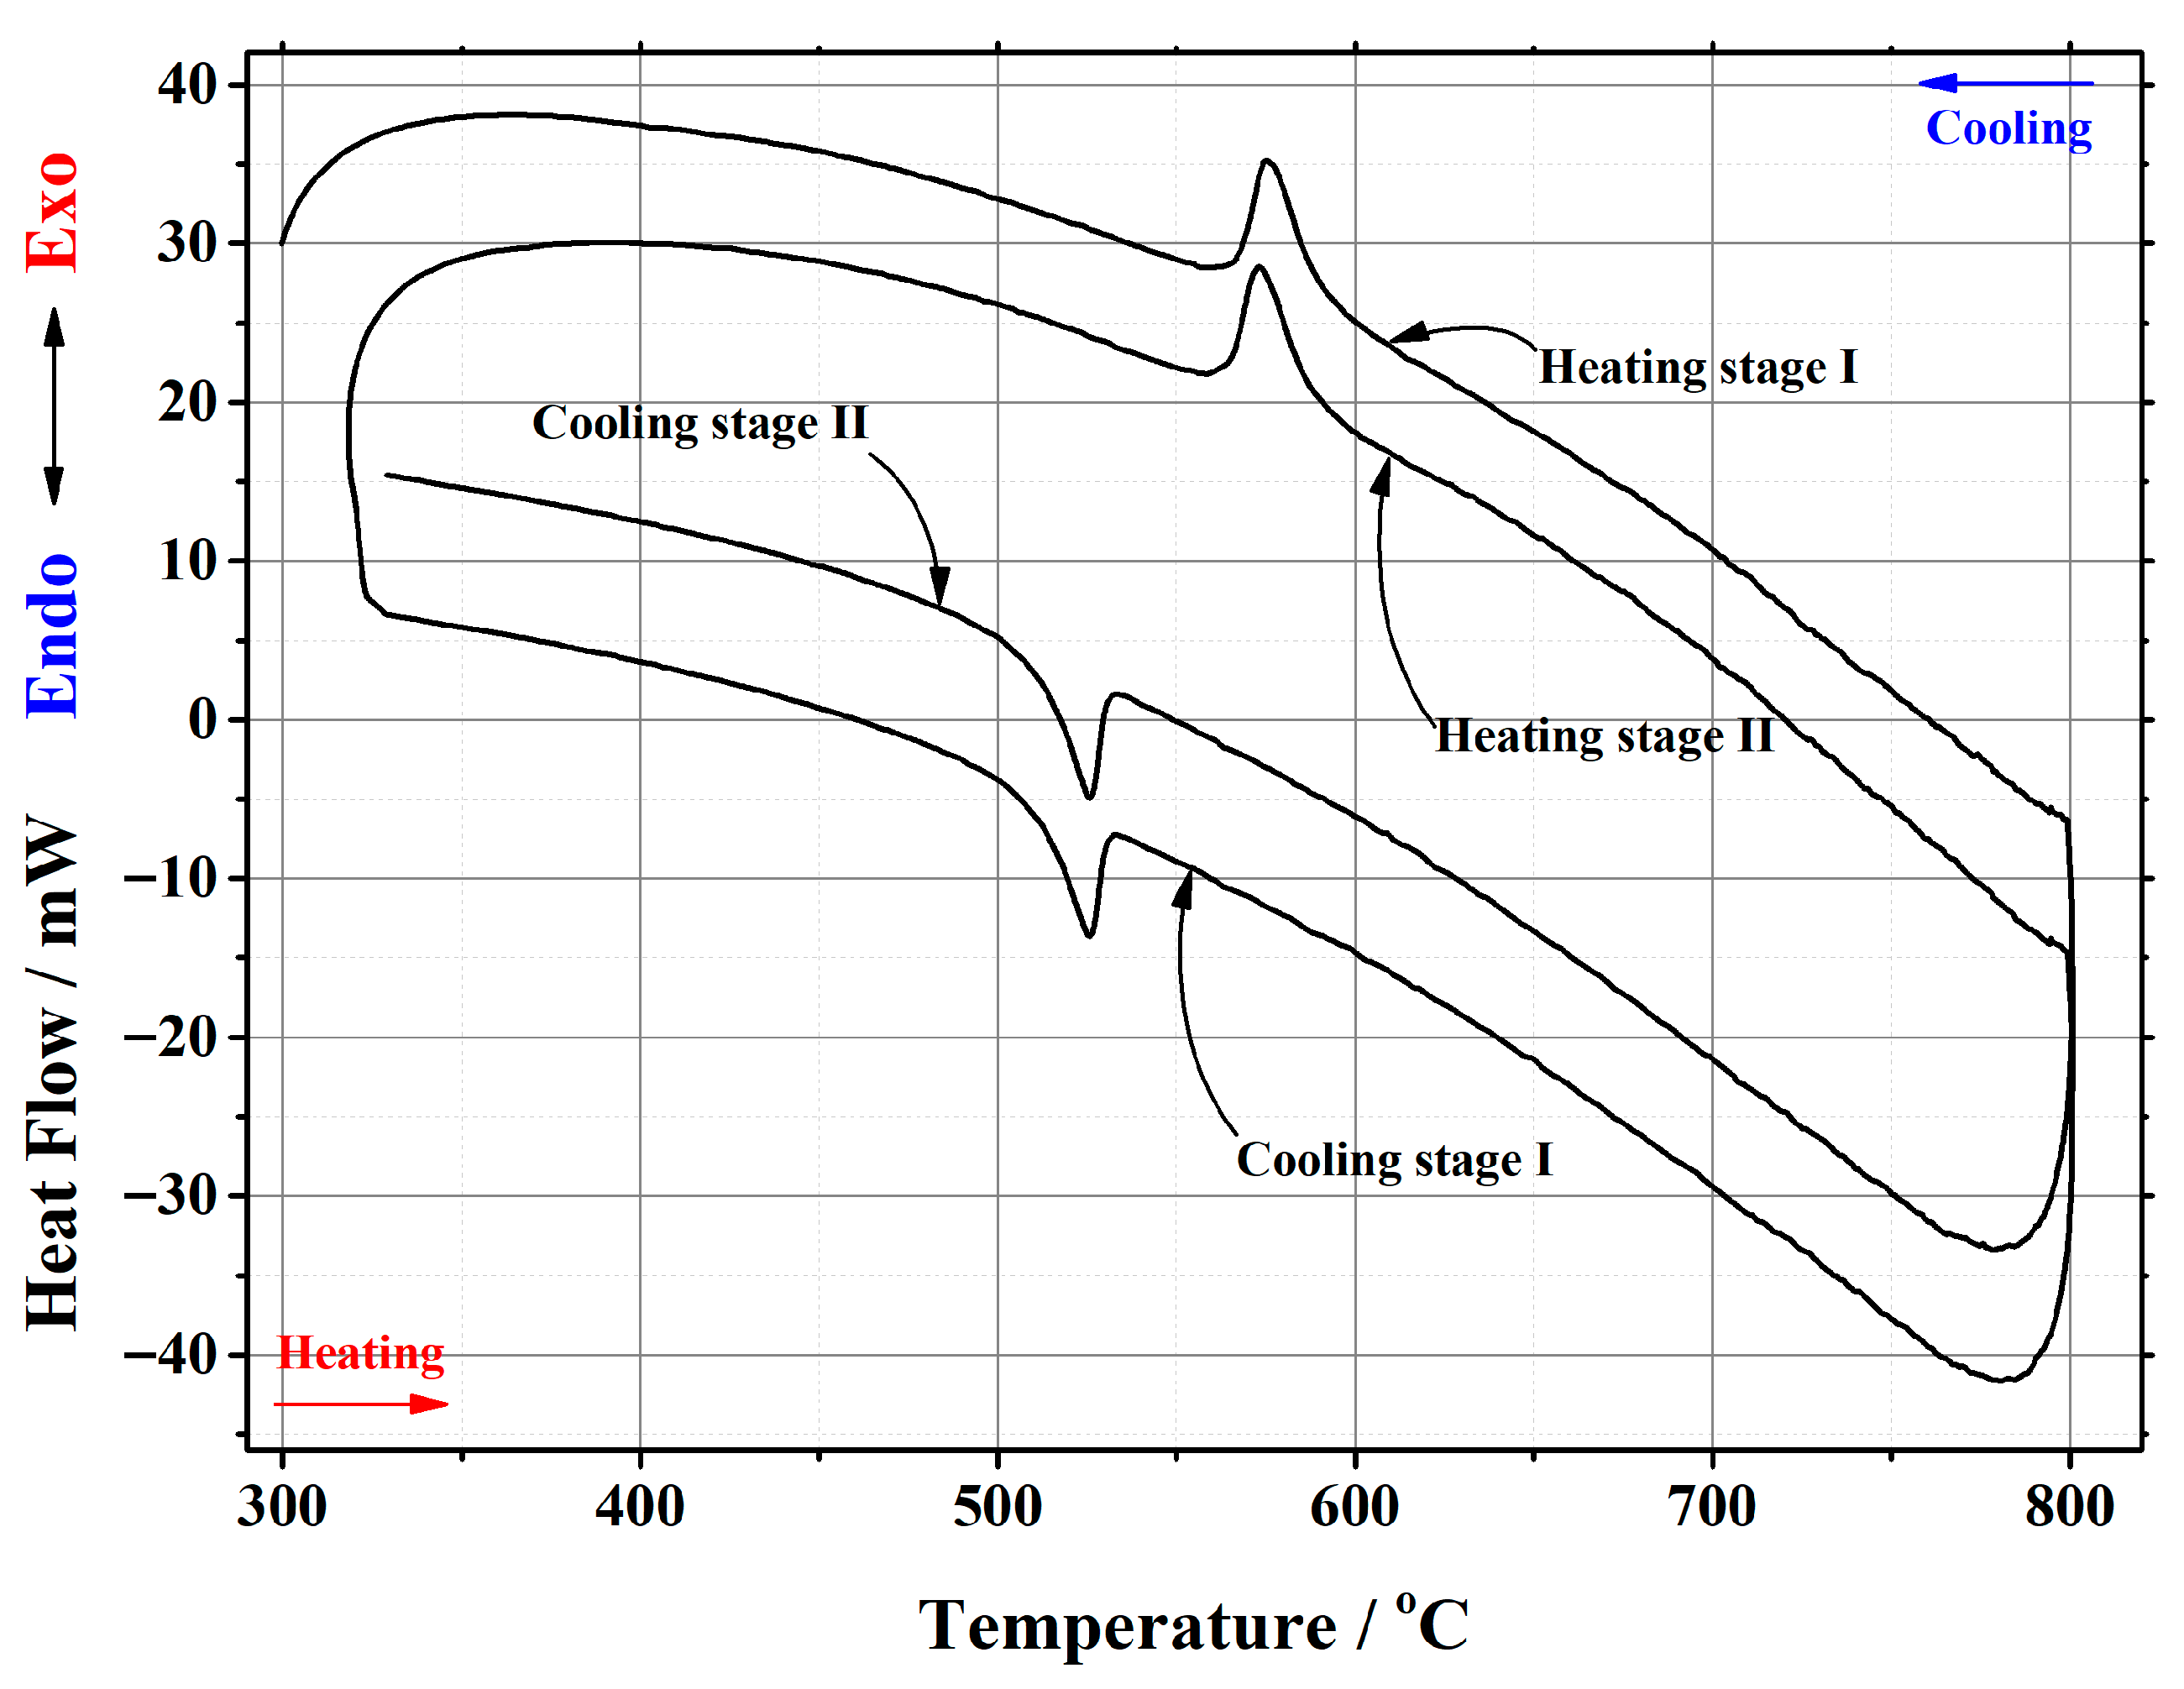
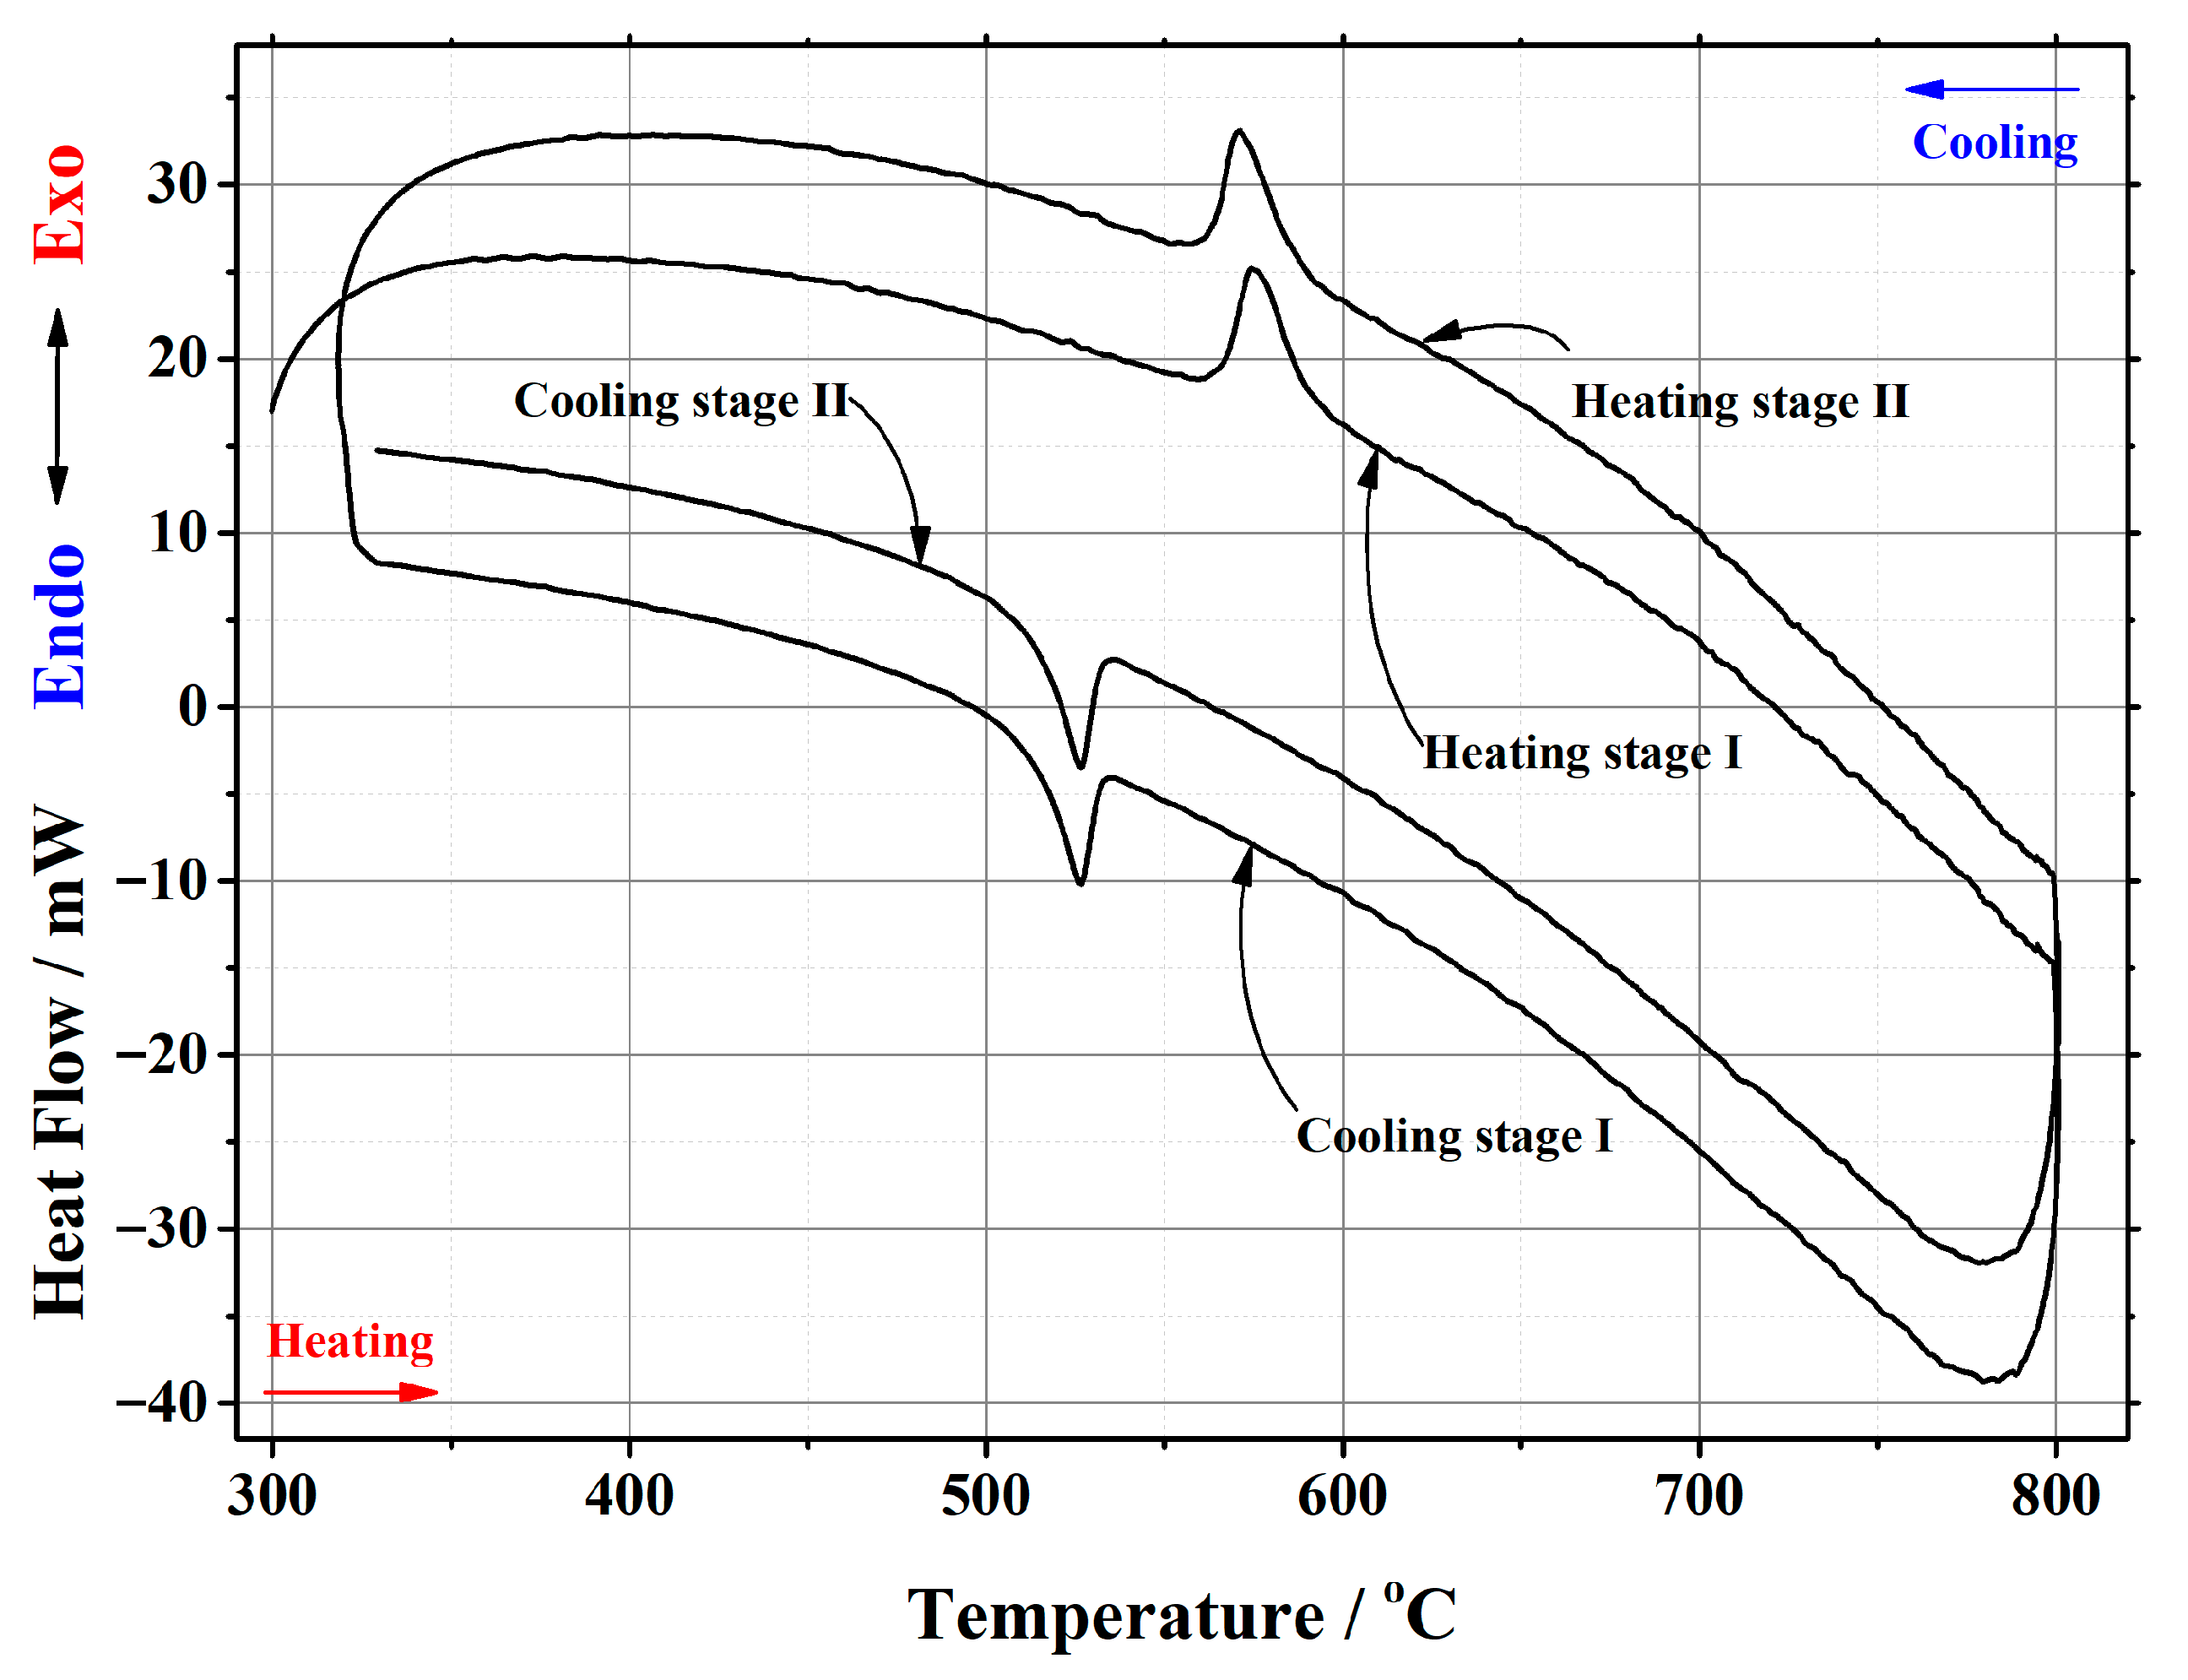
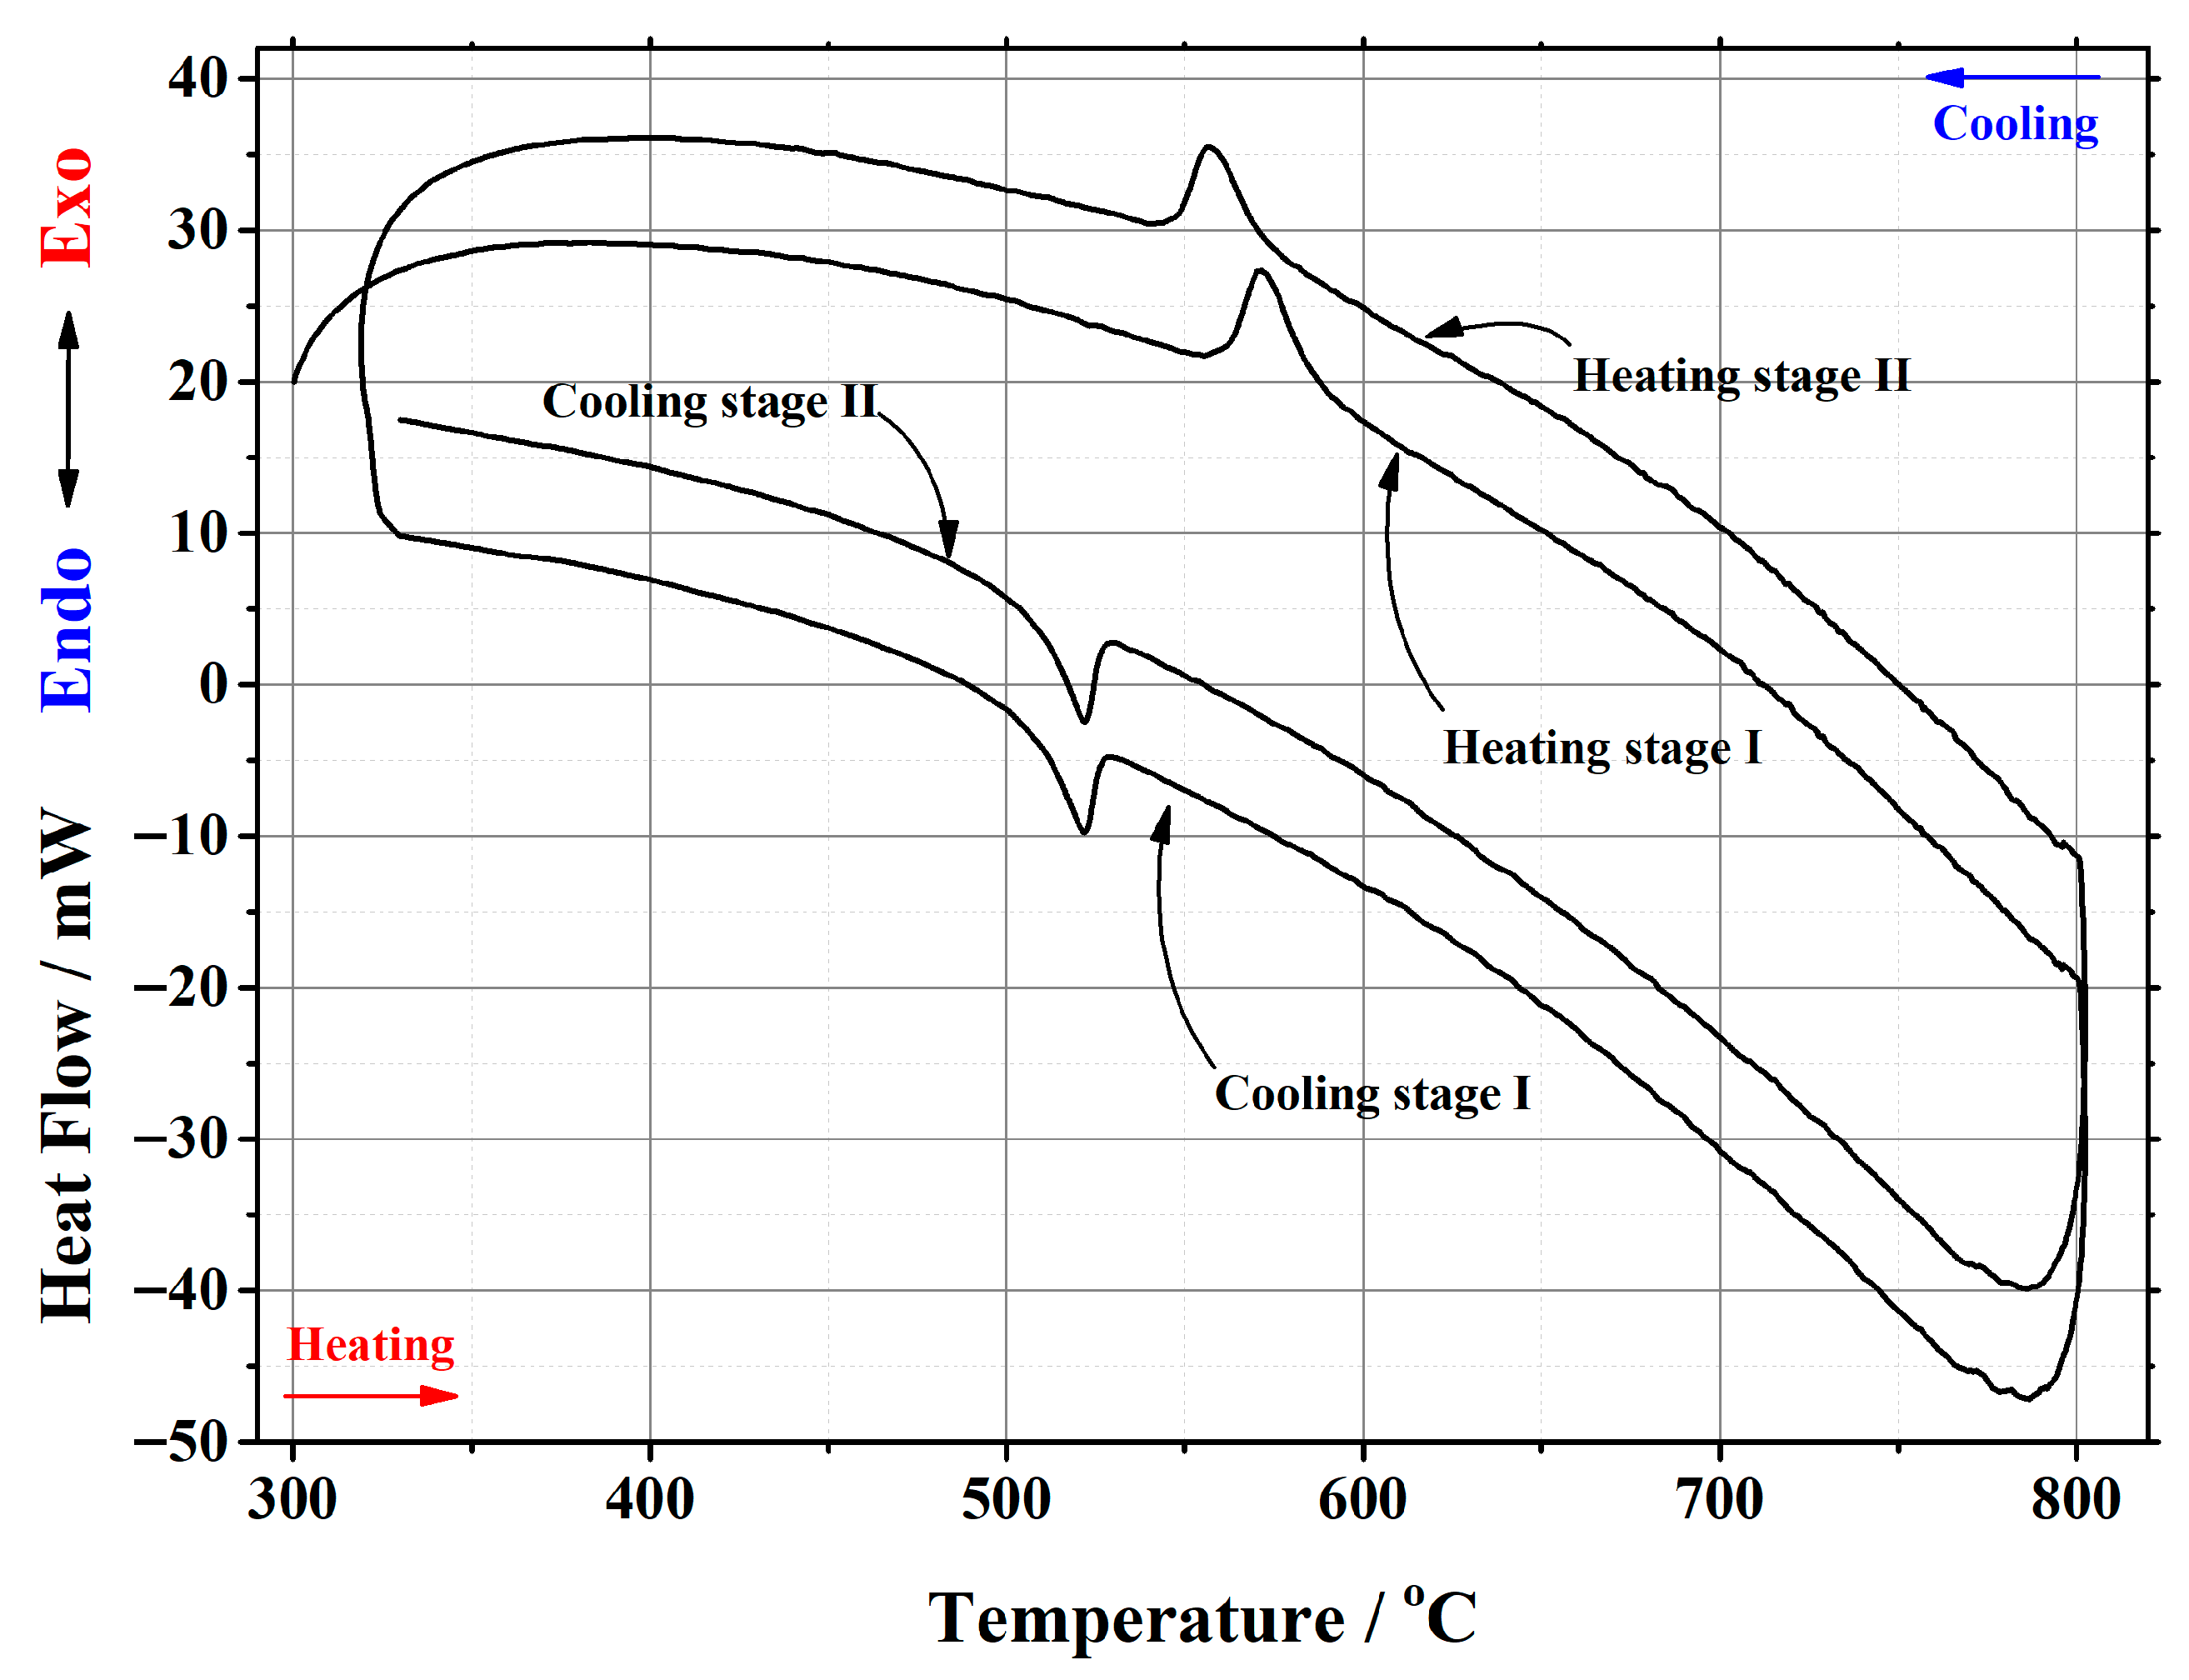
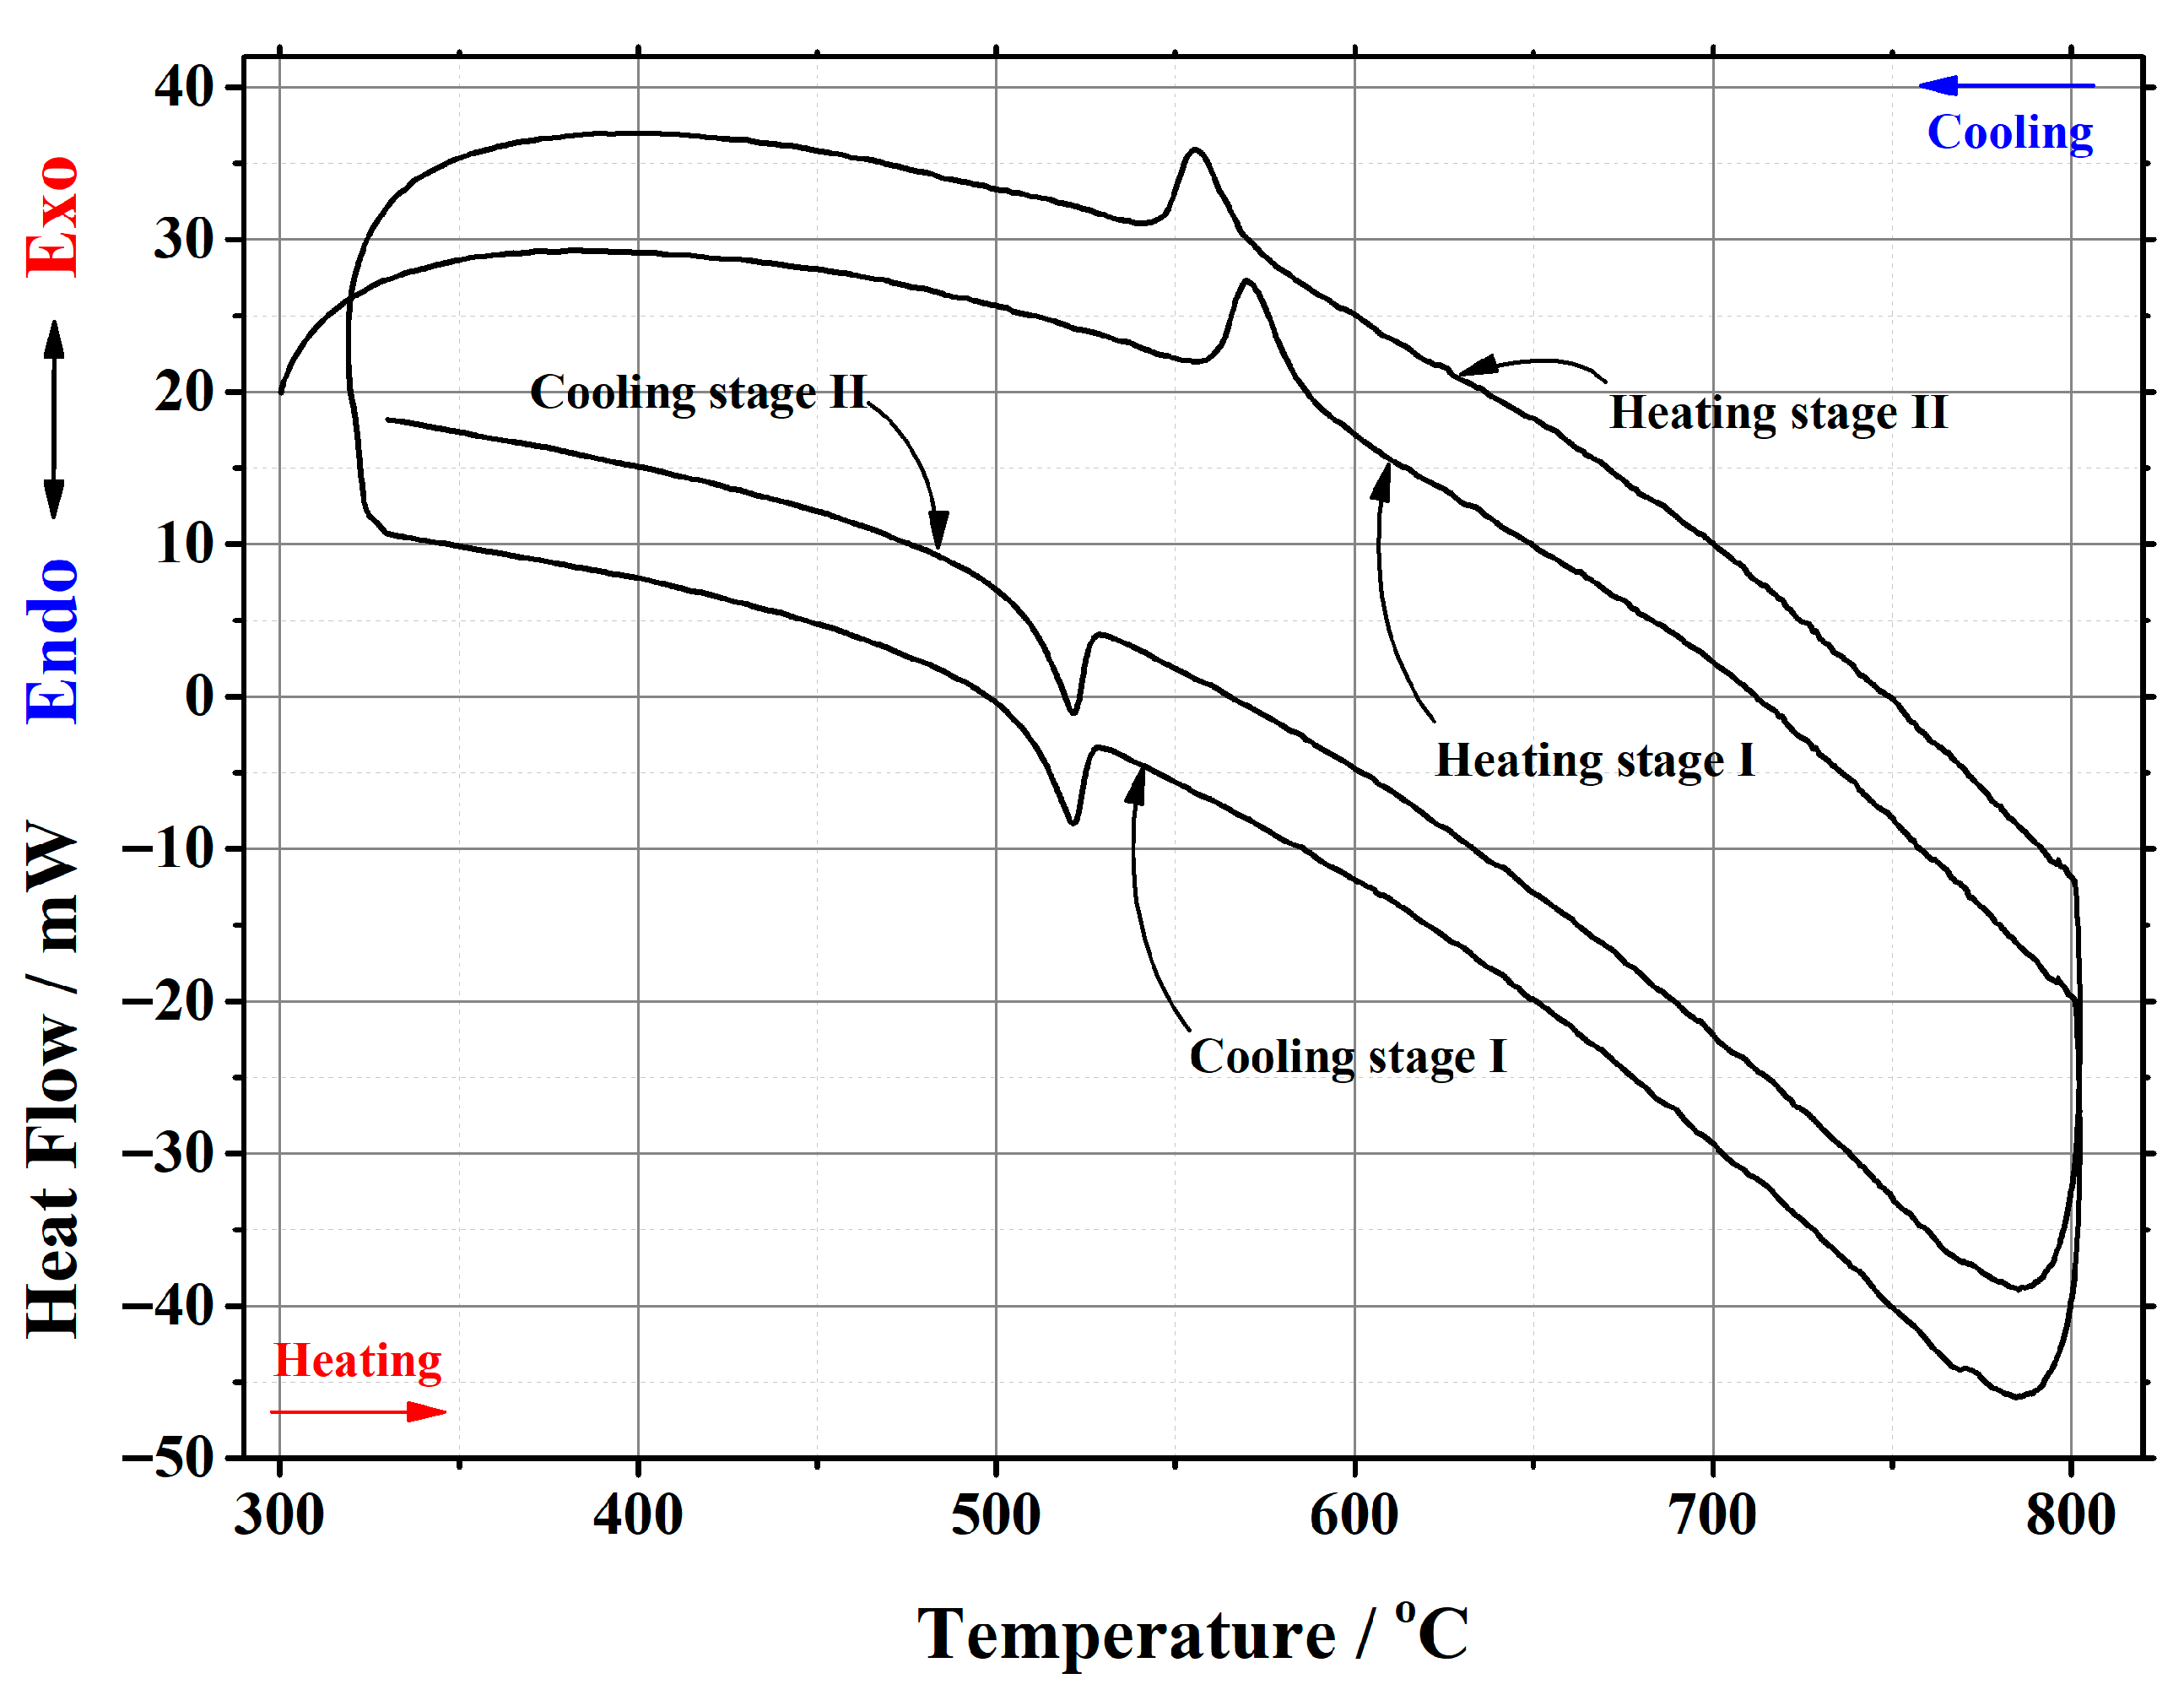
| Initial Composition | Sample Mass/mg | Heating/Cooling Stages | Temperature/°C | Heat | ||||
|---|---|---|---|---|---|---|---|---|
| Onset | End | Peak Position | Flow/mJ | Enthalpy/J·g–1 | ||||
| La2Mo2O9 | 20.181 | heating | stage I | 556.07 | 579.33 | 563.25 | 195.047 | 9.665 |
| stage II | 555.69 | 578.84 | 563.03 | 204.953 | 10.1559 | |||
| cooling | stage I | 540.31 | 523.80 | 533.34 | –146.255 | –7.2473 | ||
| stage II | 540.26 | 523.17 | 533.29 | –147.886 | –7.3281 | |||
| La1.999Ca0.001Mo2O8.9995 | 22.158 | heating | stage I | 558.63 | 580.56 | 567.11 | 191.073 | 8.6231 |
| stage II | 556.36 | 578.06 | 564.68 | 209.688 | 9.4632 | |||
| cooling | stage I | 537.43 | 511.92 | 525.65 | –156.176 | –7.0482 | ||
| stage II | 537.45 | 511.92 | 526.09 | –153.356 | –6.9209 | |||
| La1.99Ca0.01Mo2O8.995 | 22.153 | heating | stage I | 562.12 | 585.08 | 569.41 | 194.41 | 8.7757 |
| stage II | 559.49 | 582.62 | 566.63 | 197.462 | 8.9134 | |||
| cooling | stage I | 533.02 | 512.79 | 523.19 | –145.764 | –6.5798 | ||
| stage II | 532.63 | 511.21 | 522.73 | –142.37 | –6.4266 | |||
| La1.95Ca0.05Mo2O8.975 | 22.146 | heating | stage I | 565.55 | 587.31 | 573.98 | 183.43 | 8.2826 |
| stage II | 563.28 | 587.47 | 571.59 | 193.262 | 8.7266 | |||
| cooling | stage I | 527.46 | 497.28 | 517.3 | –134.667 | –6.0808 | ||
| stage II | 527.68 | 498.61 | 518.05 | –137.095 | –6.1904 | |||
| La1.9Ca0.1Mo2O8.95 | 22.183 | heating | stage I | 567.18 | 589.94 | 575.53 | 182.851 | 8.2429 |
| stage II | 564.64 | 587.71 | 573.60 | 191.273 | 8.6225 | |||
| cooling | stage I | 530.34 | 512.47 | 525.64 | –139.347 | –6.2817 | ||
| stage II | 530.42 | 513.60 | 525.82 | –140.215 | –6.3208 | |||
| La1.85Ca0.15Mo2O8.925 | 22.189 | heating | stage I | 566.04 | 589.64 | 574.53 | 181.146 | 8.146 |
| stage II | 563.04 | 588.21 | 572.27 | 189.325 | 8.5323 | |||
| cooling | stage I | 530.33 | 515.25 | 525.78 | –137.468 | –6.1953 | ||
| stage II | 530.38 | 515.97 | 526.06 | –137.764 | –6.2086 | |||
| La1.8Ca0.2Mo2O8.9 | 22.200 | heating | stage I | 566.1 | 589.06 | 574.45 | 175.753 | 7.9168 |
| stage II | 563.01 | 585.8 | 571.18 | 183.708 | 8.2751 | |||
| cooling | stage I | 532.05 | 515.17 | 526.57 | –137.915 | –6.2124 | ||
| stage II | 532.12 | 516.21 | 526.66 | –133.617 | –6.0188 | |||
| La1.75Ca0.25Mo2O8.875 | 22.182 | heating | stage I | 561.67 | 586.44 | 571.56 | 181.96 | 8.203 |
| stage II | 547.82 | 573.6 | 556.83 | 182.224 | 8.2148 | |||
| cooling | stage I | 526.46 | 508.12 | 521.81 | –115.632 | –5.2128 | ||
| stage II | 526.48 | 510.01 | 521.98 | –118.351 | –5.3354 | |||
| La1.7Ca0.3Mo2O8.85 | 22.192 | heating | stage I | 560.67 | 585.41 | 569.80 | 176.441 | 7.9507 |
| stage II | 546.08 | 571.05 | 555.68 | 178.614 | 8.0486 | |||
| cooling | stage I | 526.23 | 508.93 | 521.35 | –111.515 | –5.0250 | ||
| stage II | 526.17 | 510.26 | 521.13 | –113.167 | –5.0995 | |||
| Initial Composition | Crystal Phase | Crystal System | Mass Fraction/% | Crystallite size/nm | Unit Cell | Weighted R Profile | Goodness of Fit | ||
|---|---|---|---|---|---|---|---|---|---|
| a/pm | b/pm | c/pm | |||||||
| alpha/o | beta/o | gamma/o | |||||||
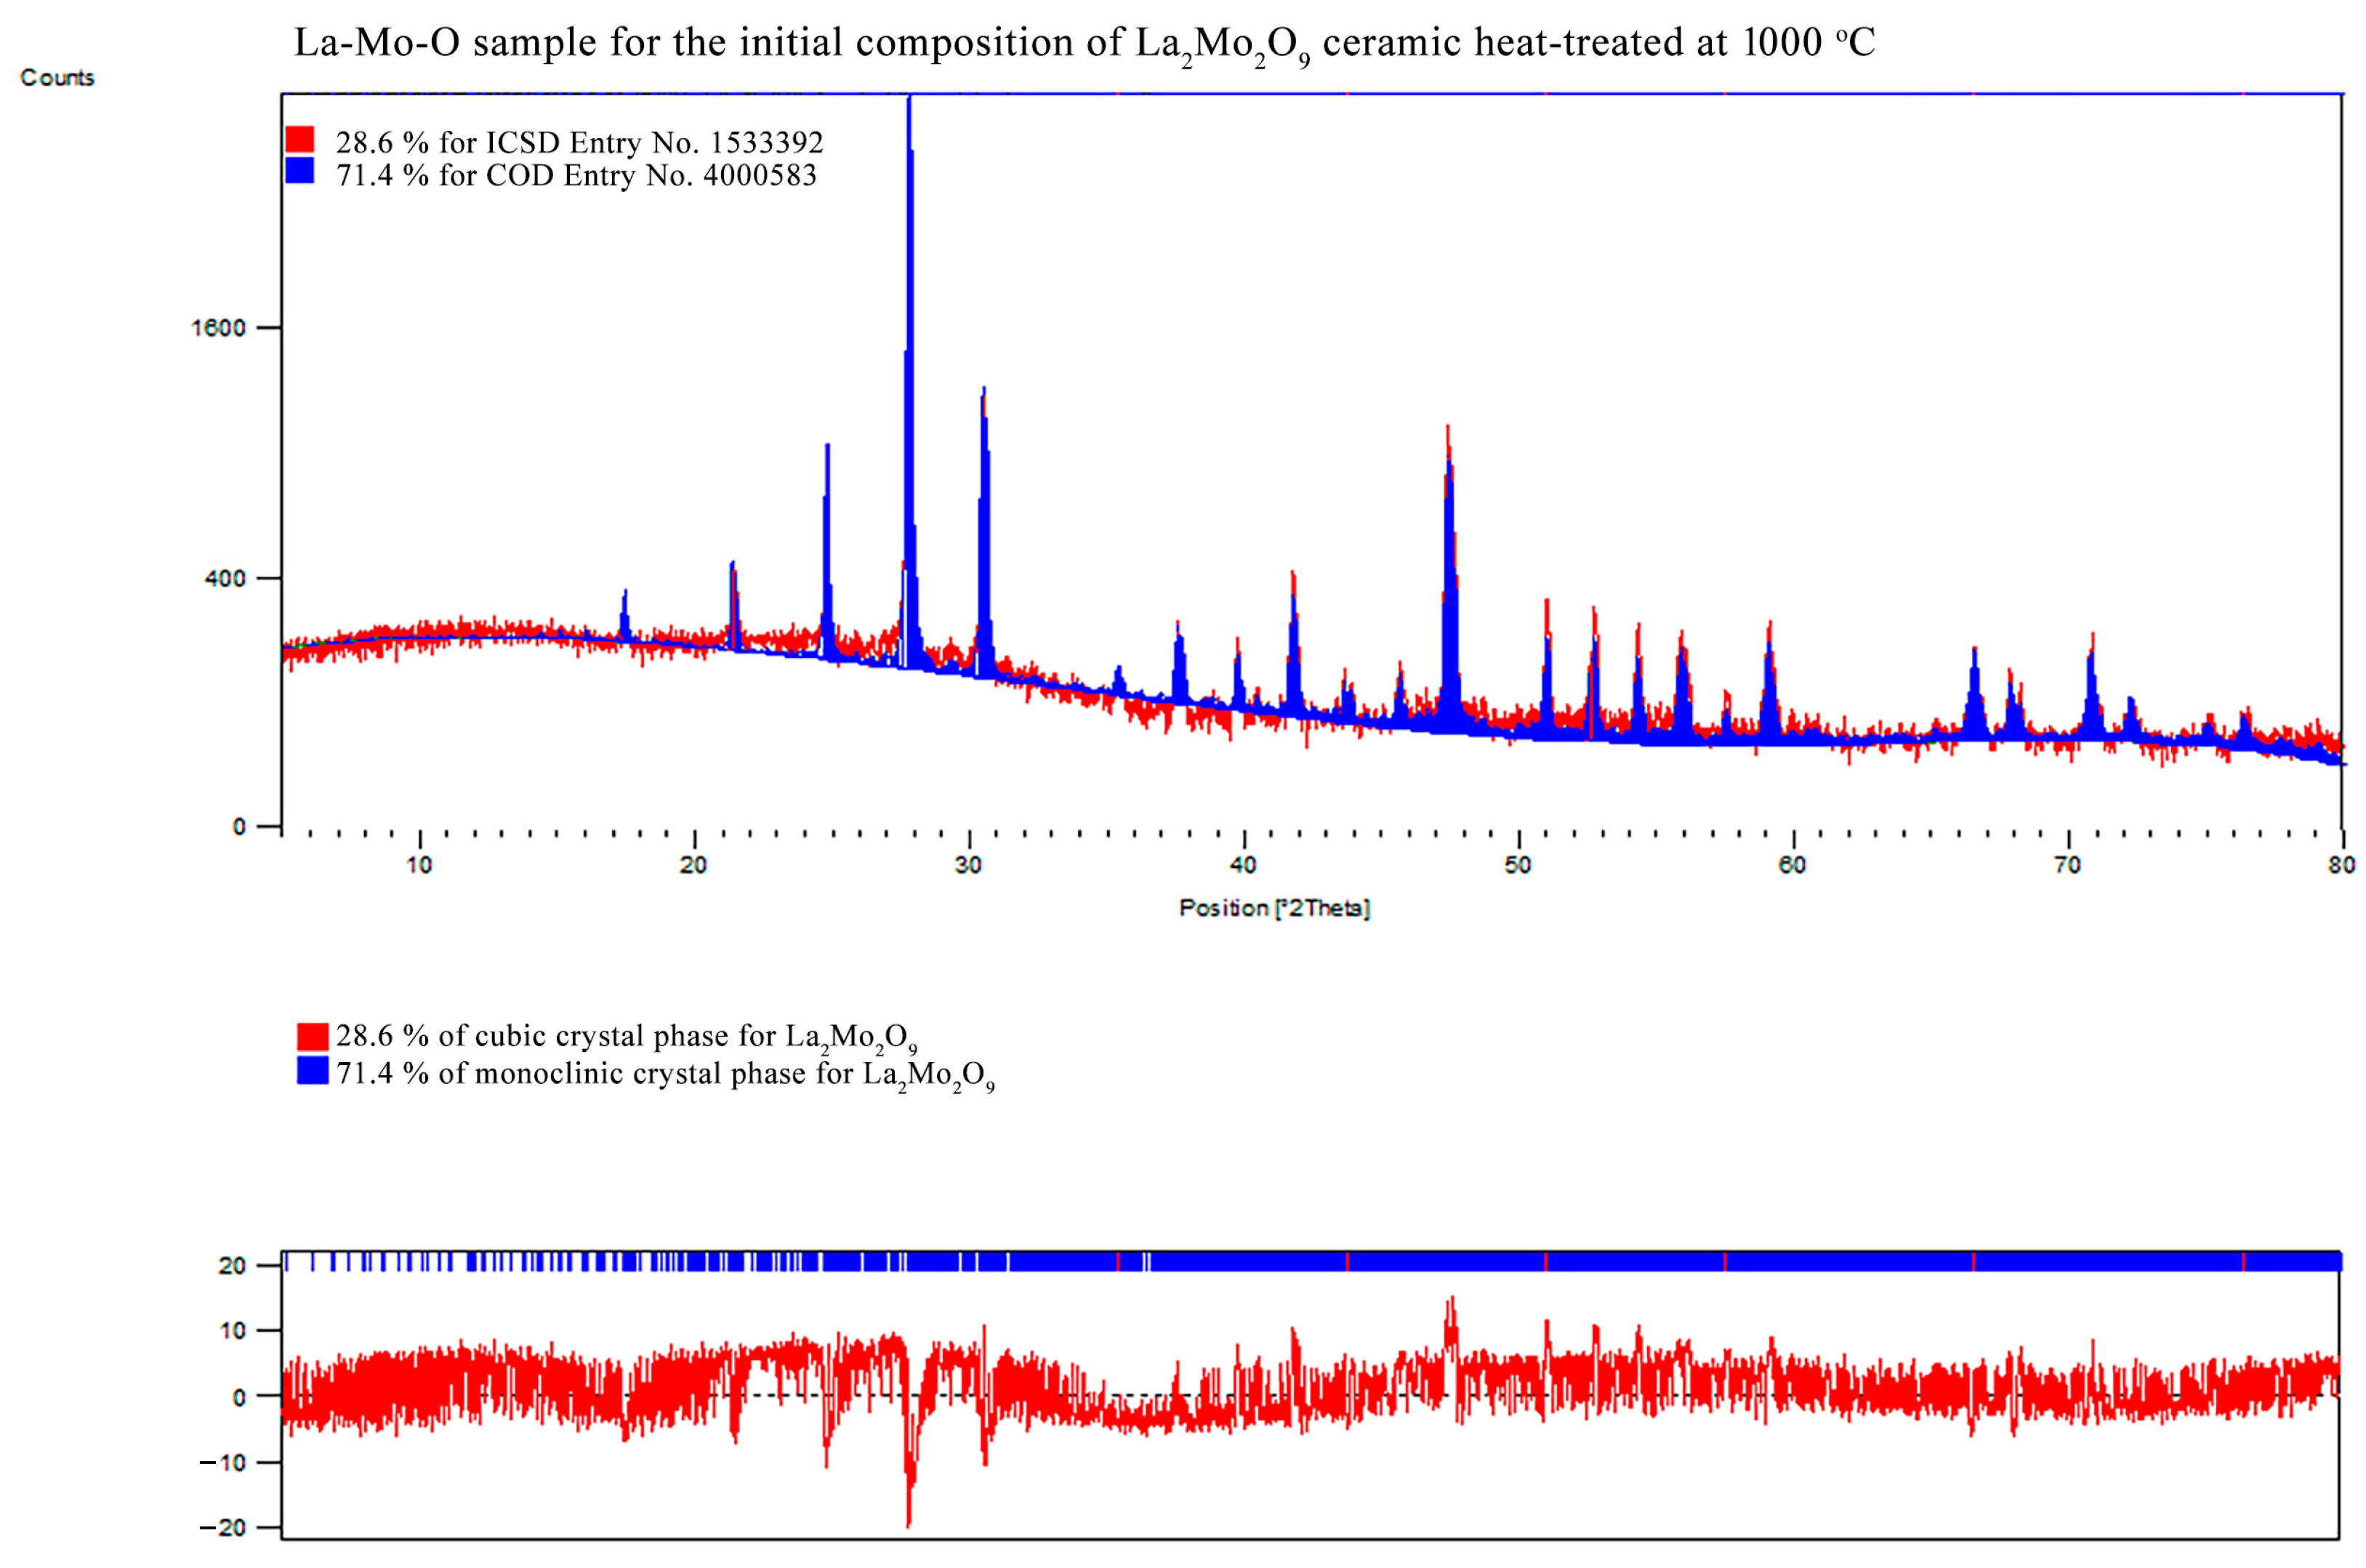
| La2Mo2O9 | La2Mo2O9 | monoclinic | 71.4 | 104.75 | 1431.438 | 2145.289 | 2855.431 | 12.99106 | 1.29603 |
| 90.00000 | 90.42323 | 90.00000 | |||||||
| La2Mo2O9 | cubic | 28.6 | 47.03 | 715.106 | 715.106 | 715.106 | |||
| 90.00000 | 90.00000 | 90.00000 | |||||||
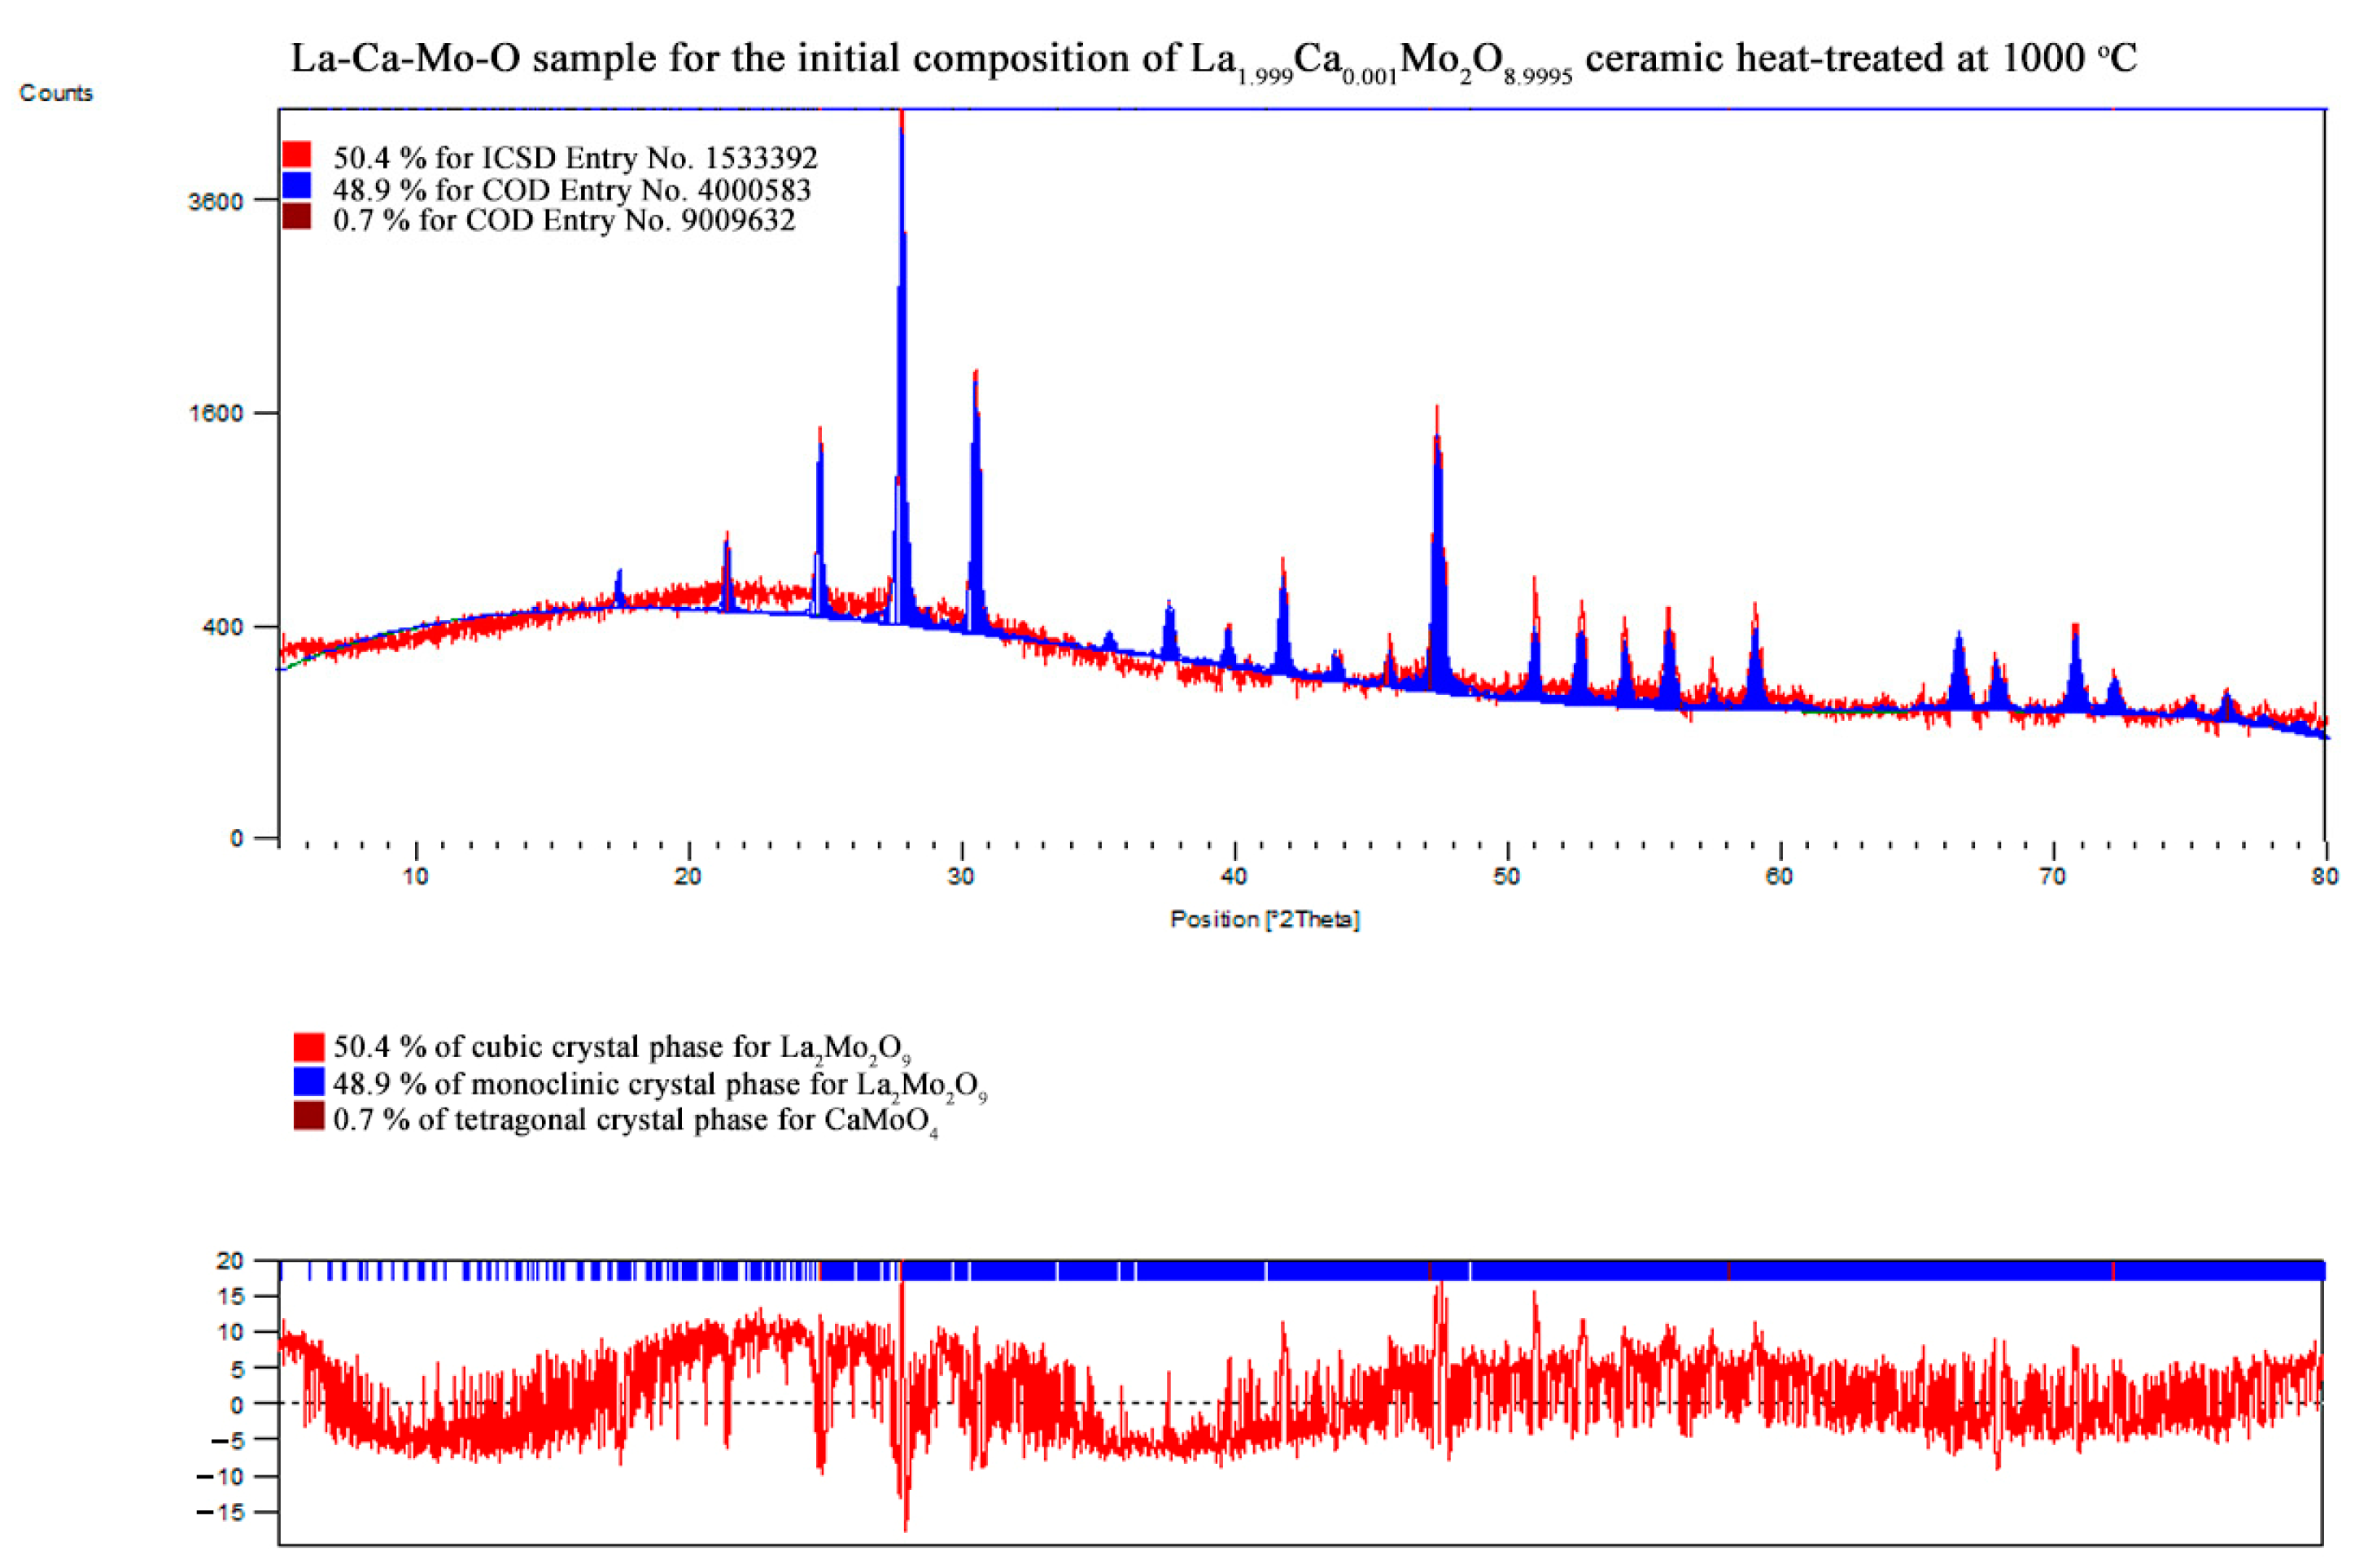
| La1.999Ca0.001Mo2O8.9995 | La2Mo2O9 | monoclinic | 48.9 | 66.33 | 1432.093 | 2145.928 | 2857.133 | 10.70047 | 1.87511 |
| 90.00000 | 90.35913 | 90.00000 | |||||||
| La2Mo2O9 | cubic | 50.4 | 45.56 | 715.357 | 715.357 | 715.357 | |||
| 90.00000 | 90.00000 | 90.00000 | |||||||
| CaMoO4 | tetragonal | 0.7 | – | – | – | – | |||
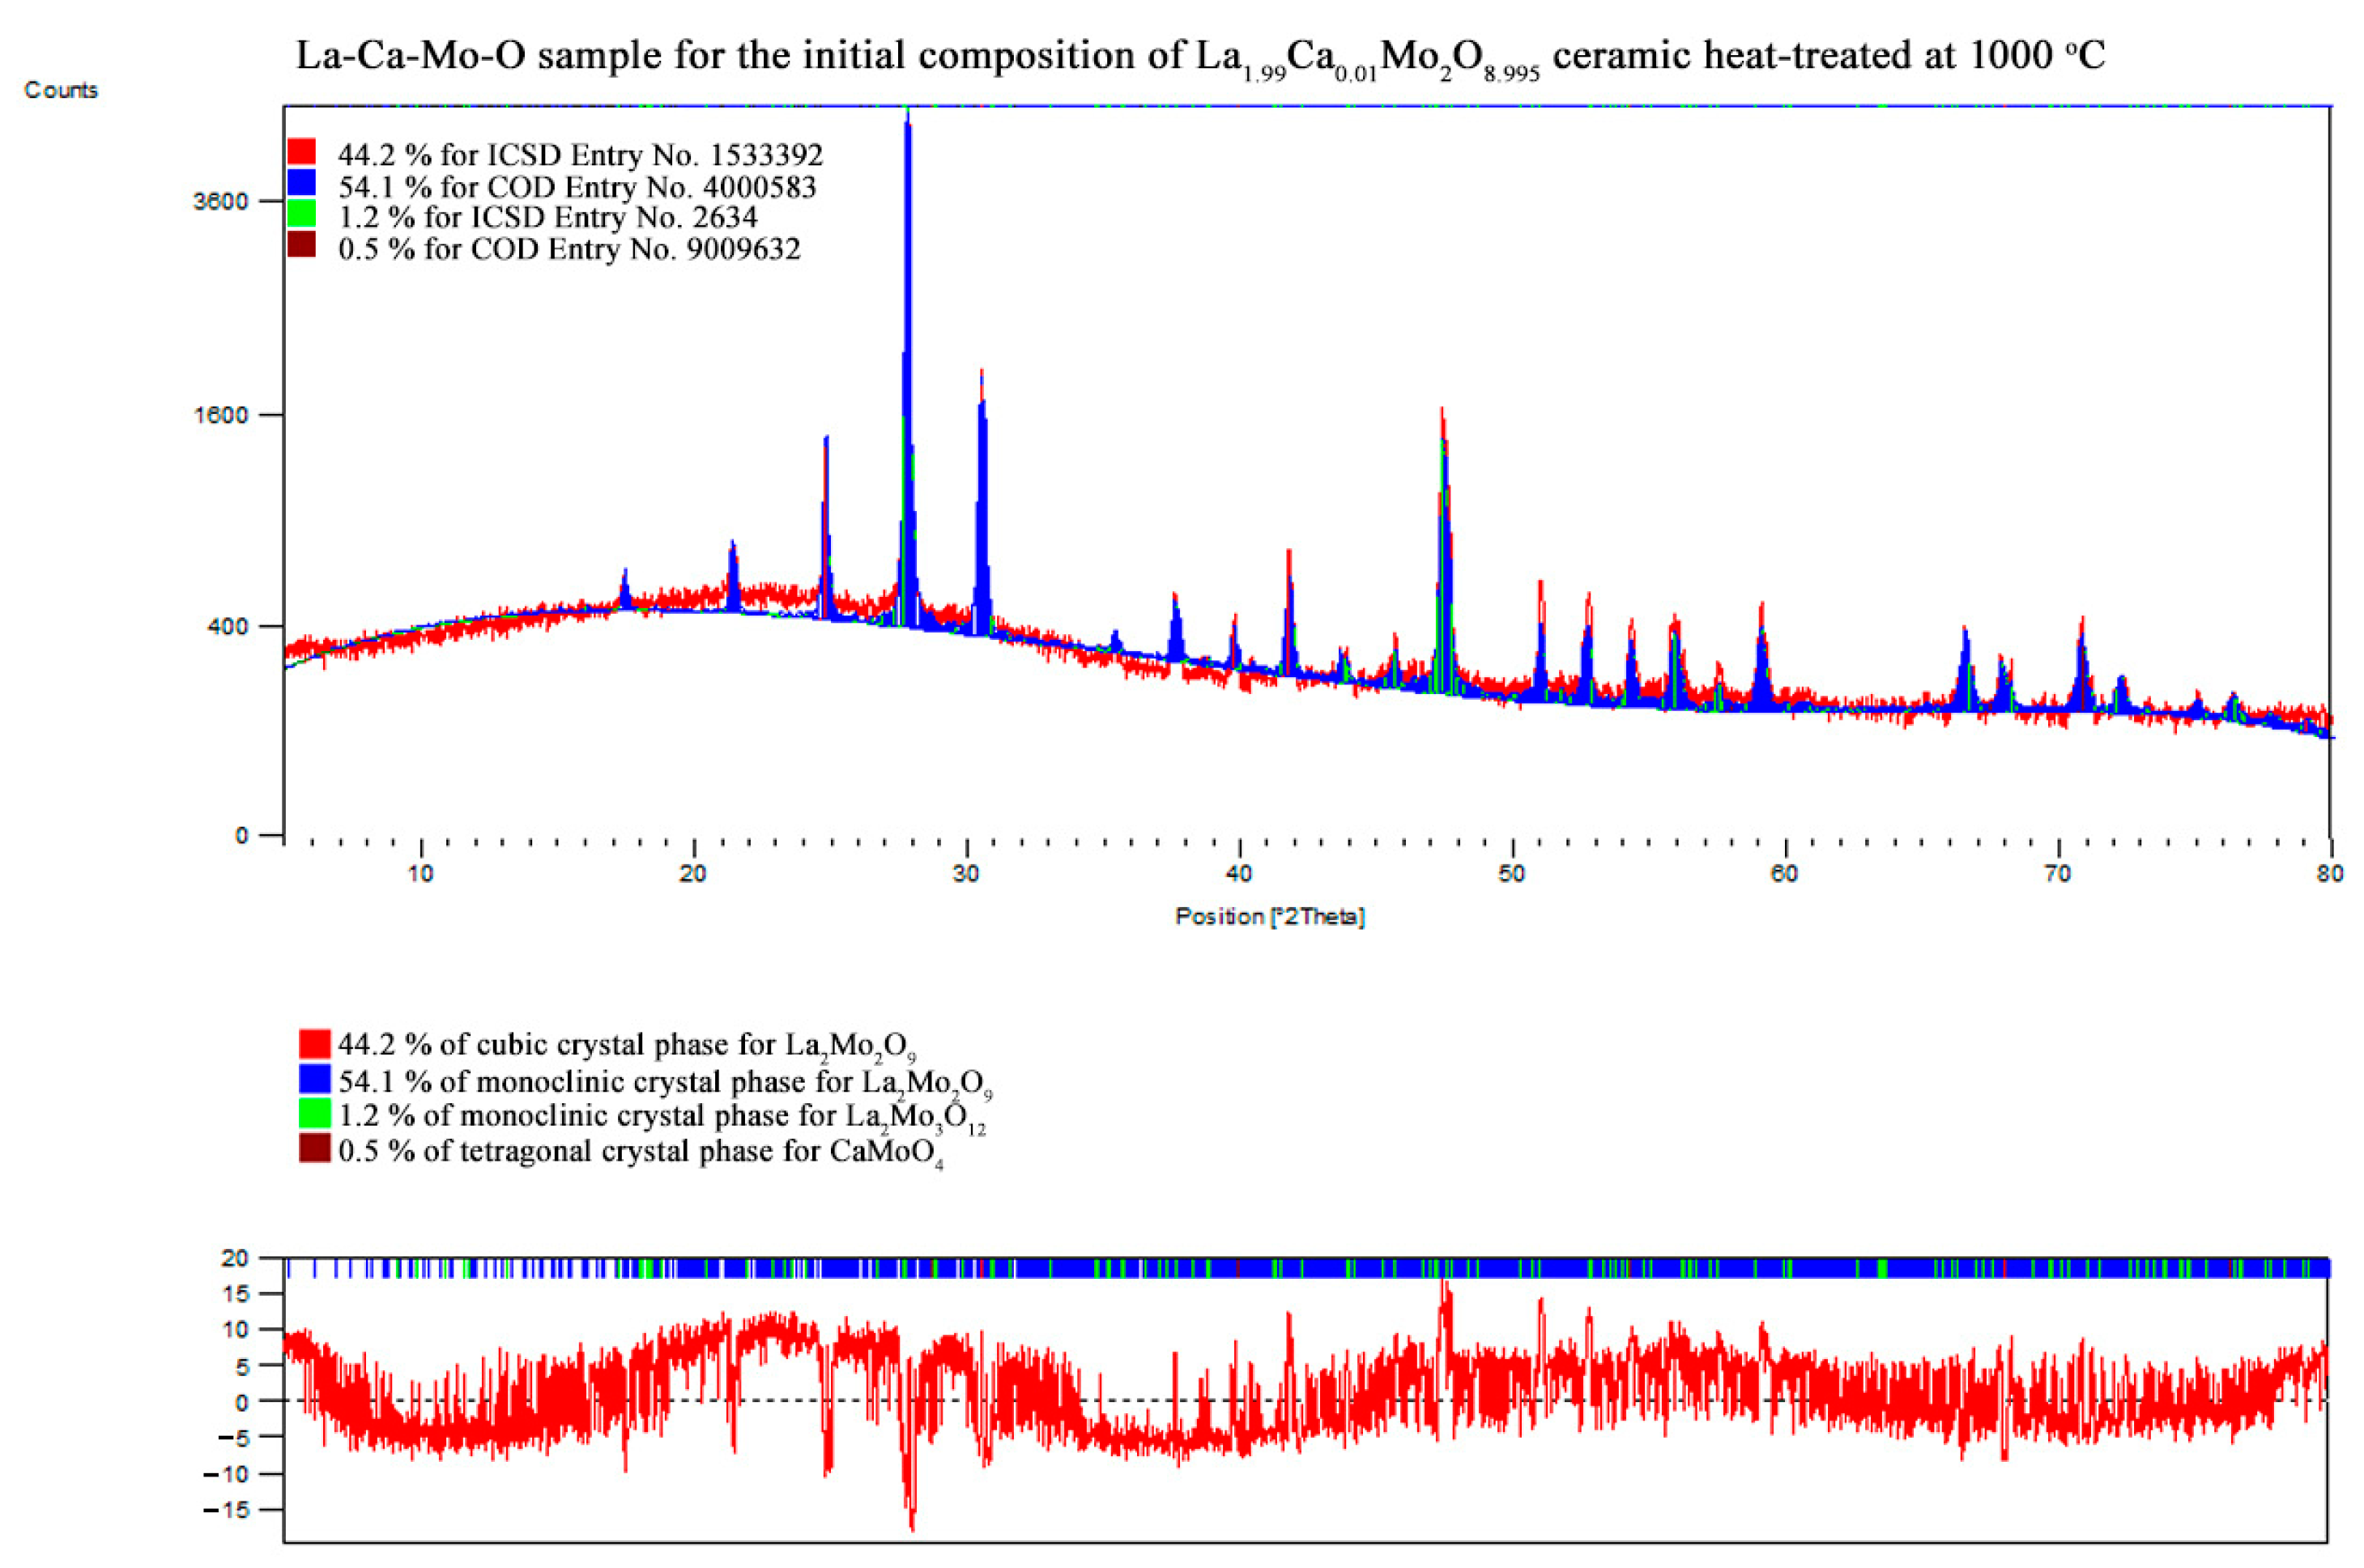
| La1.99Ca0.01Mo2O8.995 | La2Mo2O9 | monoclinic | 54.1 | 71.50 | 1431.437 | 2145.437 | 2856.032 | 10.55389 | 1.79591 |
| 90.00000 | 90.38470 | 90.00000 | |||||||
| La2Mo2O9 | cubic | 44.2 | 46.61 | 715.103 | 715.103 | 715.103 | |||
| 90.00000 | 90.00000 | 90.00000 | |||||||
| La2Mo3O12 | monoclinic | 1.2 | 41.08 | 1739.278 | 1186.510 | 1624.259 | |||
| 90.00000 | 107.93130 | 90.00000 | |||||||
| CaMoO4 | tetragonal | 0.5 | – | – | – | – | |||
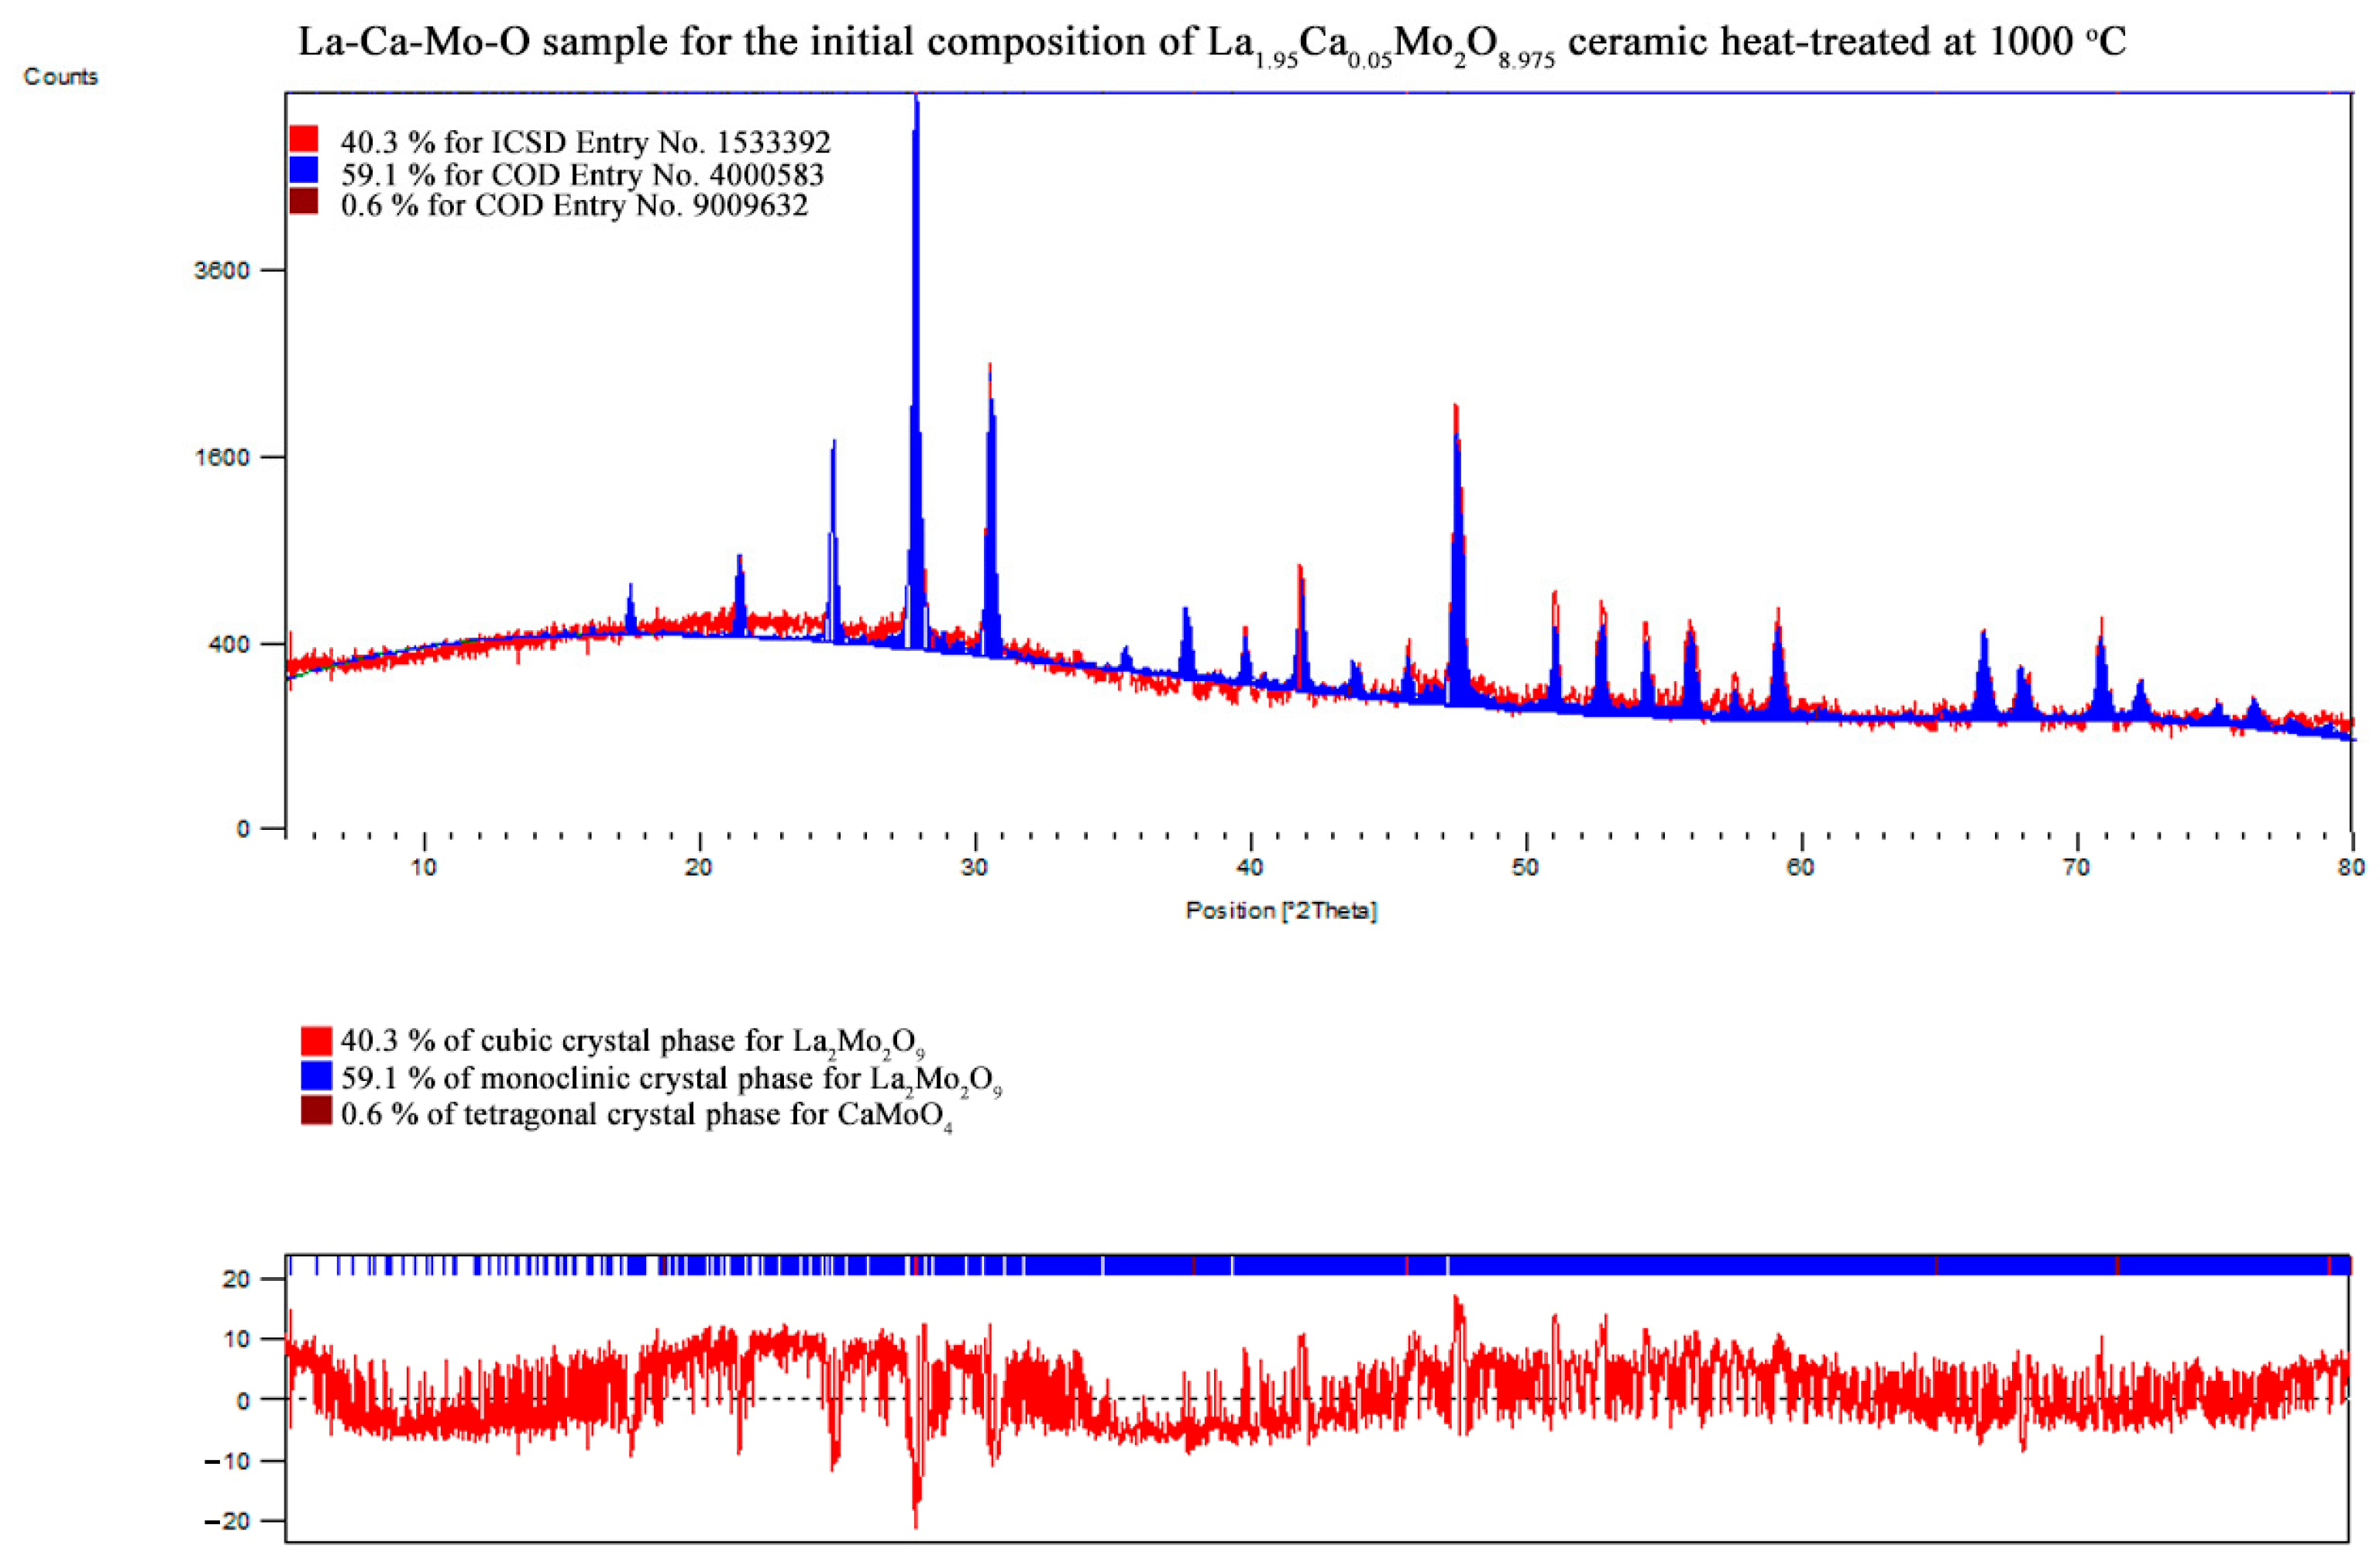
| La1.95Ca0.05Mo2O8.975 | La2Mo2O9 | monoclinic | 59.1 | 70.52 | 1431.201 | 2145.733 | 2857.156 | 10.32976 | 1.76384 |
| 90.00000 | 90.35389 | 90.00000 | |||||||
| La2Mo2O9 | cubic | 40.3 | 48.10 | 715.171 | 715.171 | 715.171 | |||
| 90.00000 | 90.00000 | 90.00000 | |||||||
| CaMoO4 | tetragonal | 0.6 | – | – | – | – | |||
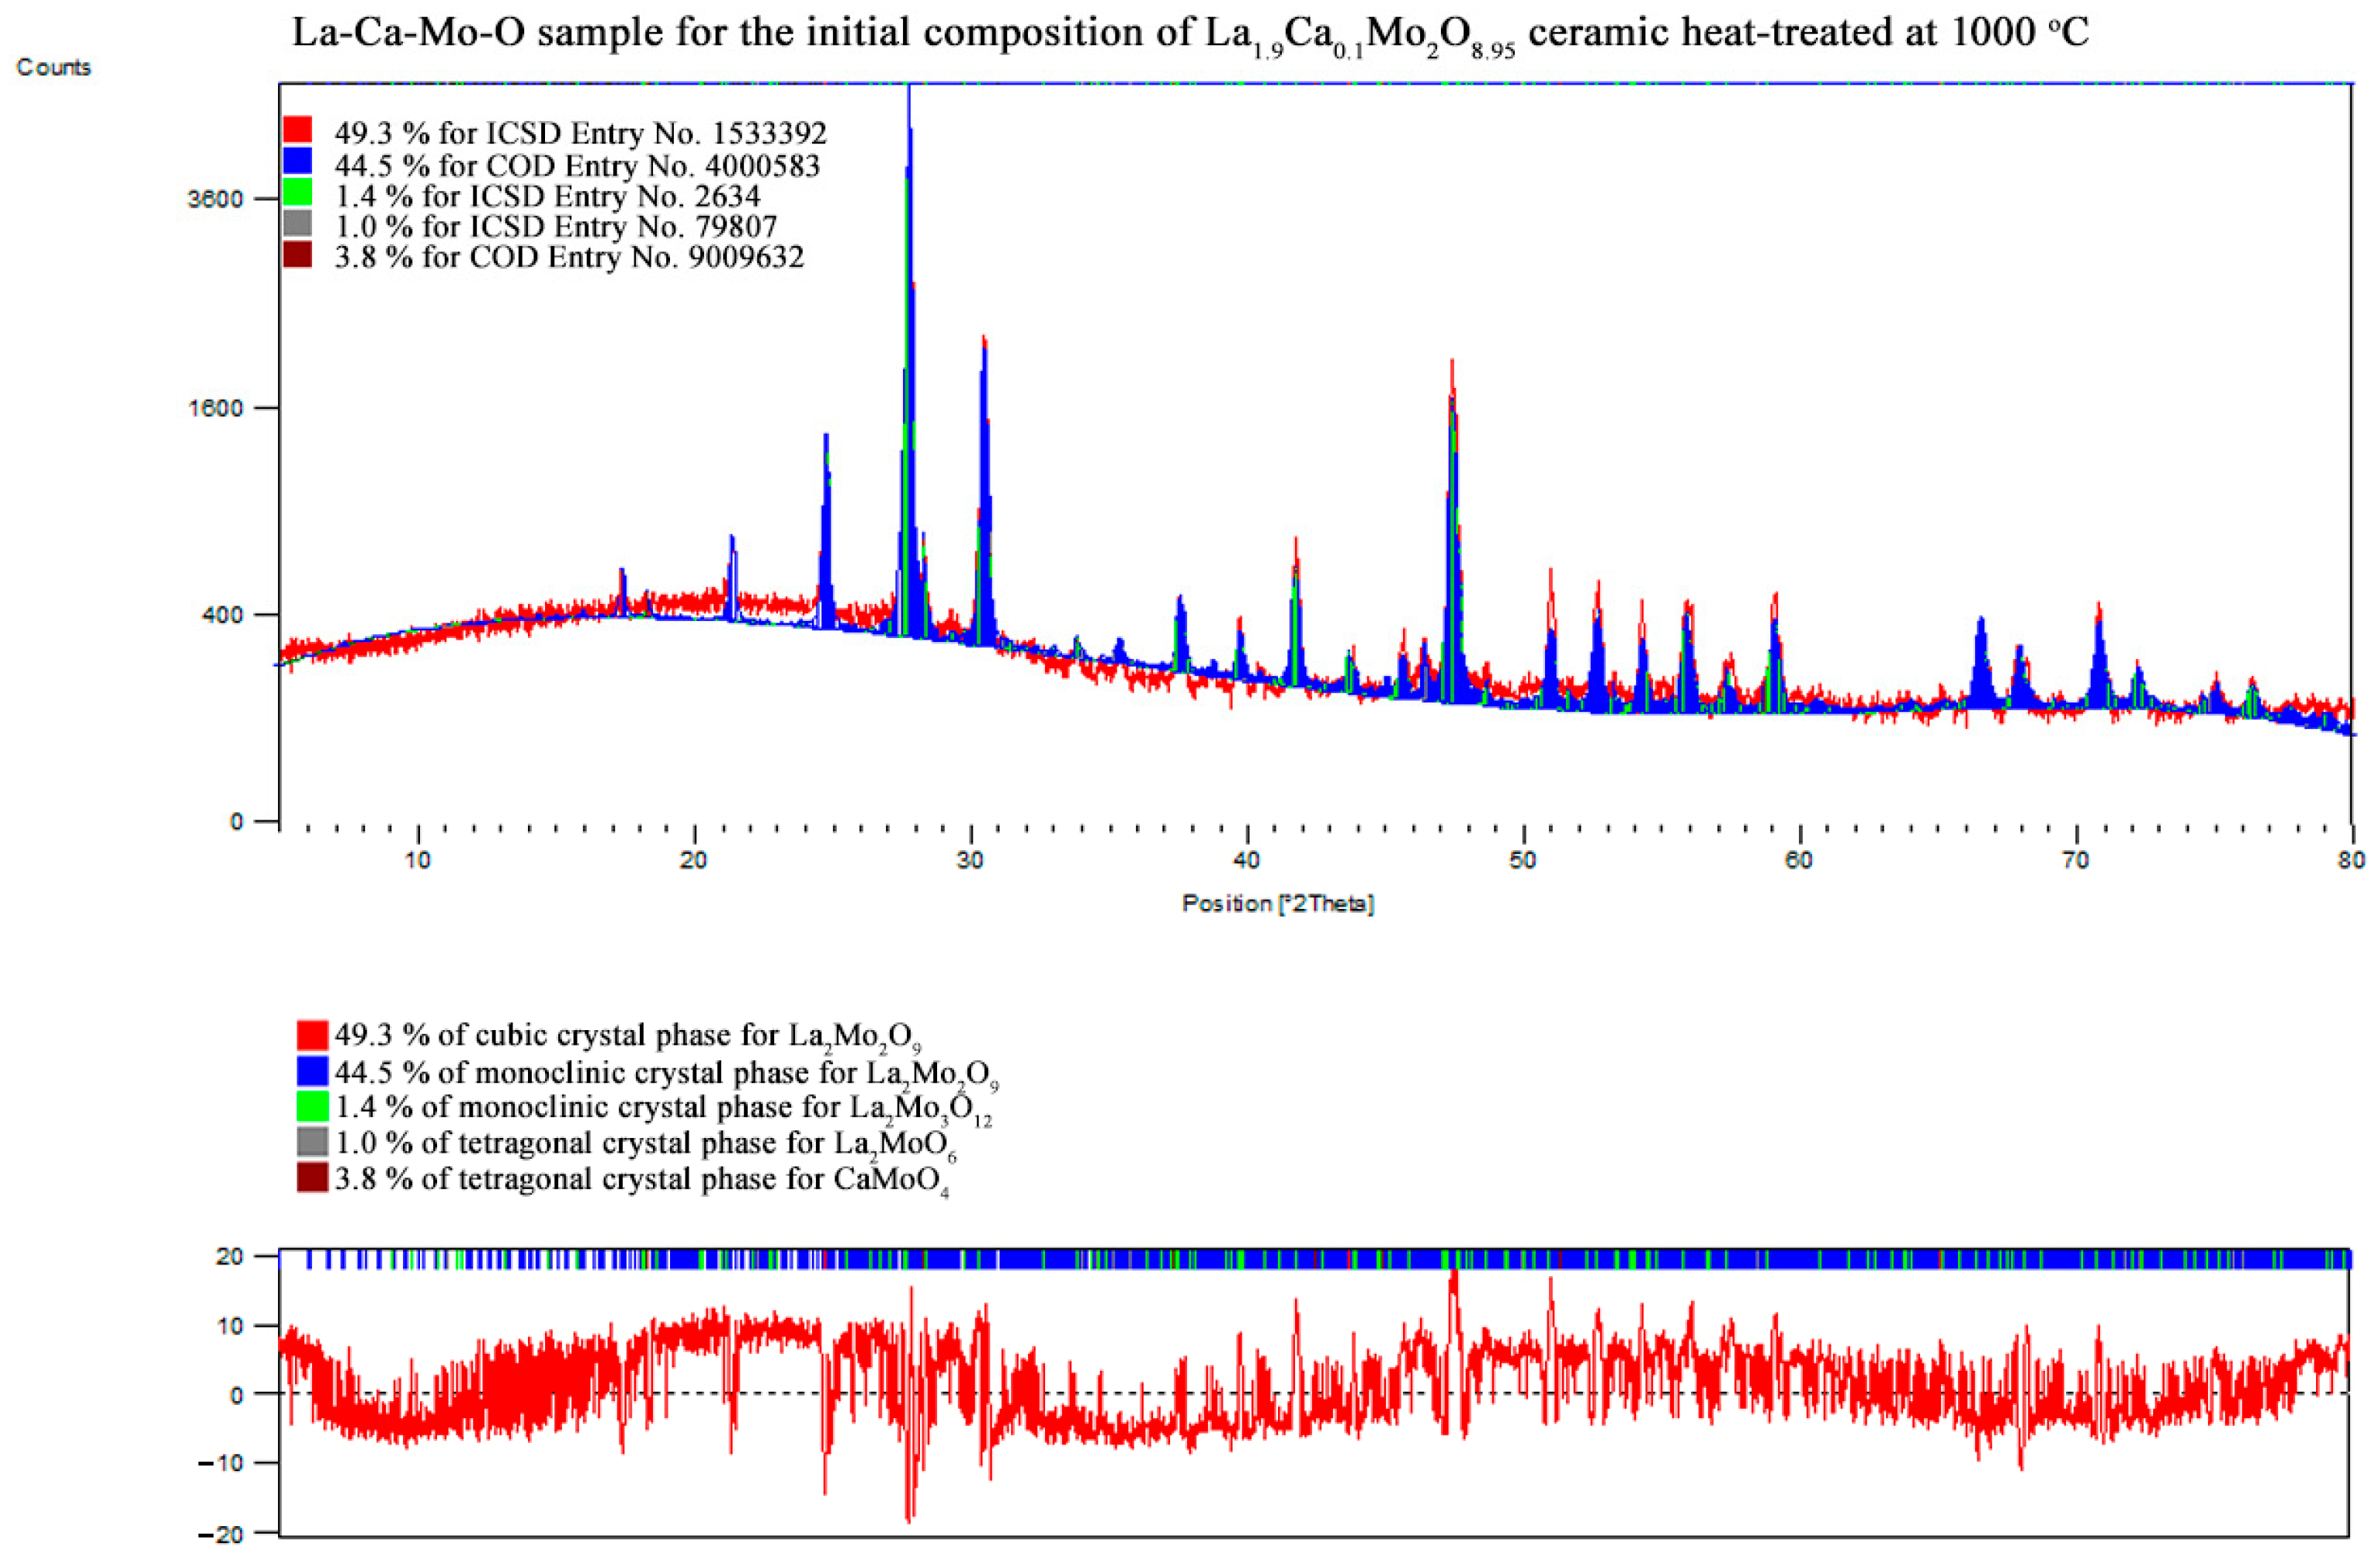
| La1.9Ca0.1Mo2O8.95 | La2Mo2O9 | monoclinic | 44.5 | 35.83 | 1432.385 | 2140.825 | 2855.251 | 12.83825 | 2.41047 |
| 90.00000 | 90.15601 | 90.00000 | |||||||
| La2Mo2O9 | cubic | 49.3 | 42.06 | 714.384 | 714.384 | 714.384 | |||
| 90.00000 | 90.00000 | 90.00000 | |||||||
| CaMoO4 | tetragonal | 3.8 | – | – | – | – | |||
| La2Mo3O12 | monoclinic | 1.4 | 43.47 | 1719.584 | 1166.525 | 1614.533 | |||
| 90.00000 | 108.09910 | 90.00000 | |||||||
| La2MoO6 | tetragonal | 1.0 | 42.52 | 582.792 | 582.792 | 3031.347 | |||
| 90.00000 | 90.00000 | 90.00000 | |||||||
| La1.85Ca0.15Mo2O8.925 | La2Mo2O9 | monoclinic | 76.0 | 66.77 | 1430.812 | 2144.216 | 2854.451 | 16.89944 | 2.2630 |
| 90.00000 | 90.36139 | 90.00000 | |||||||
| La2Mo2O9 | cubic | 17.1 | 44.52 | 714.631 | 714.631 | 714.631 | |||
| 90.00000 | 90.00000 | 90.00000 | |||||||
| CaMoO4 | tetragonal | 5.8 | 59.84 | 526.101 | 526.101 | 1153.607 | |||
| 90.00000 | 90.00000 | 90.00000 | |||||||
| La2Mo3O12 | monoclinic | 1.1 | 42.68 | 1732.883 | 1168.940 | 1619.405 | |||
| 90.00000 | 107.77000 | 90.00000 | |||||||
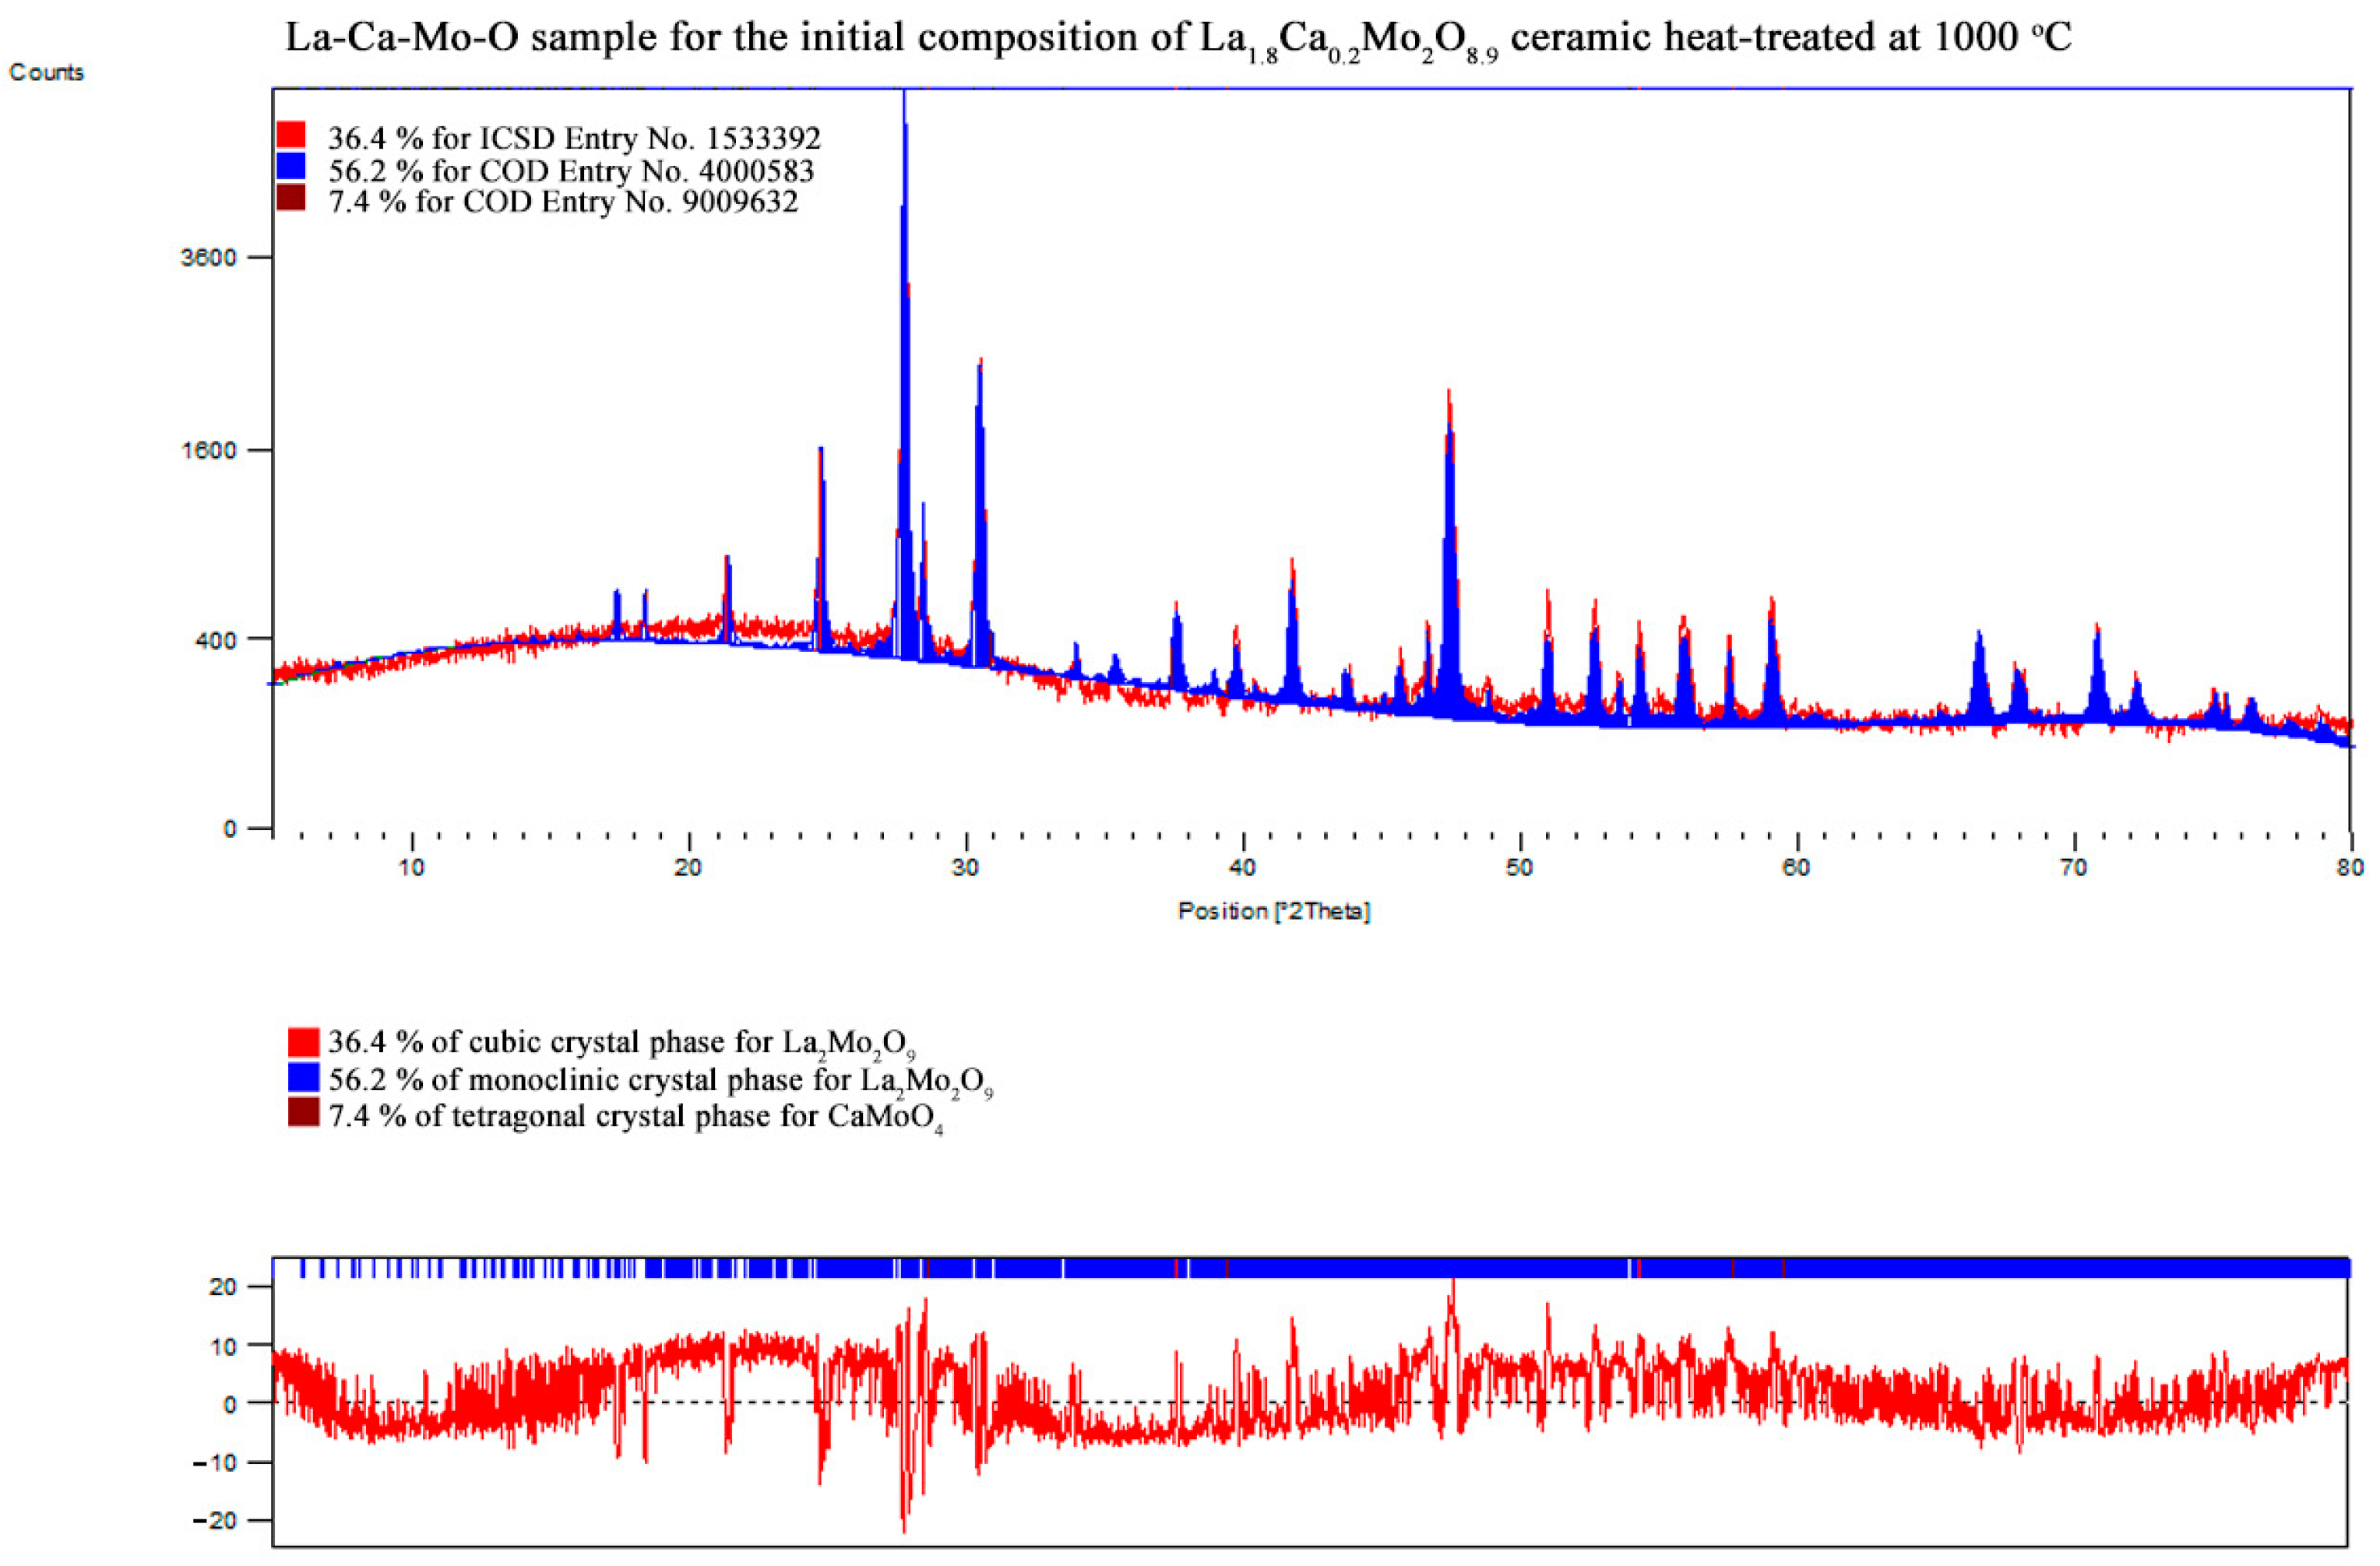
| La1.8Ca0.2Mo2O8.9 | La2Mo2O9 | monoclinic | 56.2 | 45.44 | 1428.985 | 2143.602 | 2858.397 | 12.46852 | 2.36196 |
| 90.00000 | 90.31453 | 90.00000 | |||||||
| La2Mo2O9 | cubic | 36.4 | 46.98 | 714.584 | 714.584 | 714.584 | |||
| 90.00000 | 90.00000 | 90.00000 | |||||||
| CaMoO4 | tetragonal | 7.4 | 58.26 | 525.675 | 525.675 | 1151.621 | |||
| 90.00000 | 90.00000 | 90.00000 | |||||||
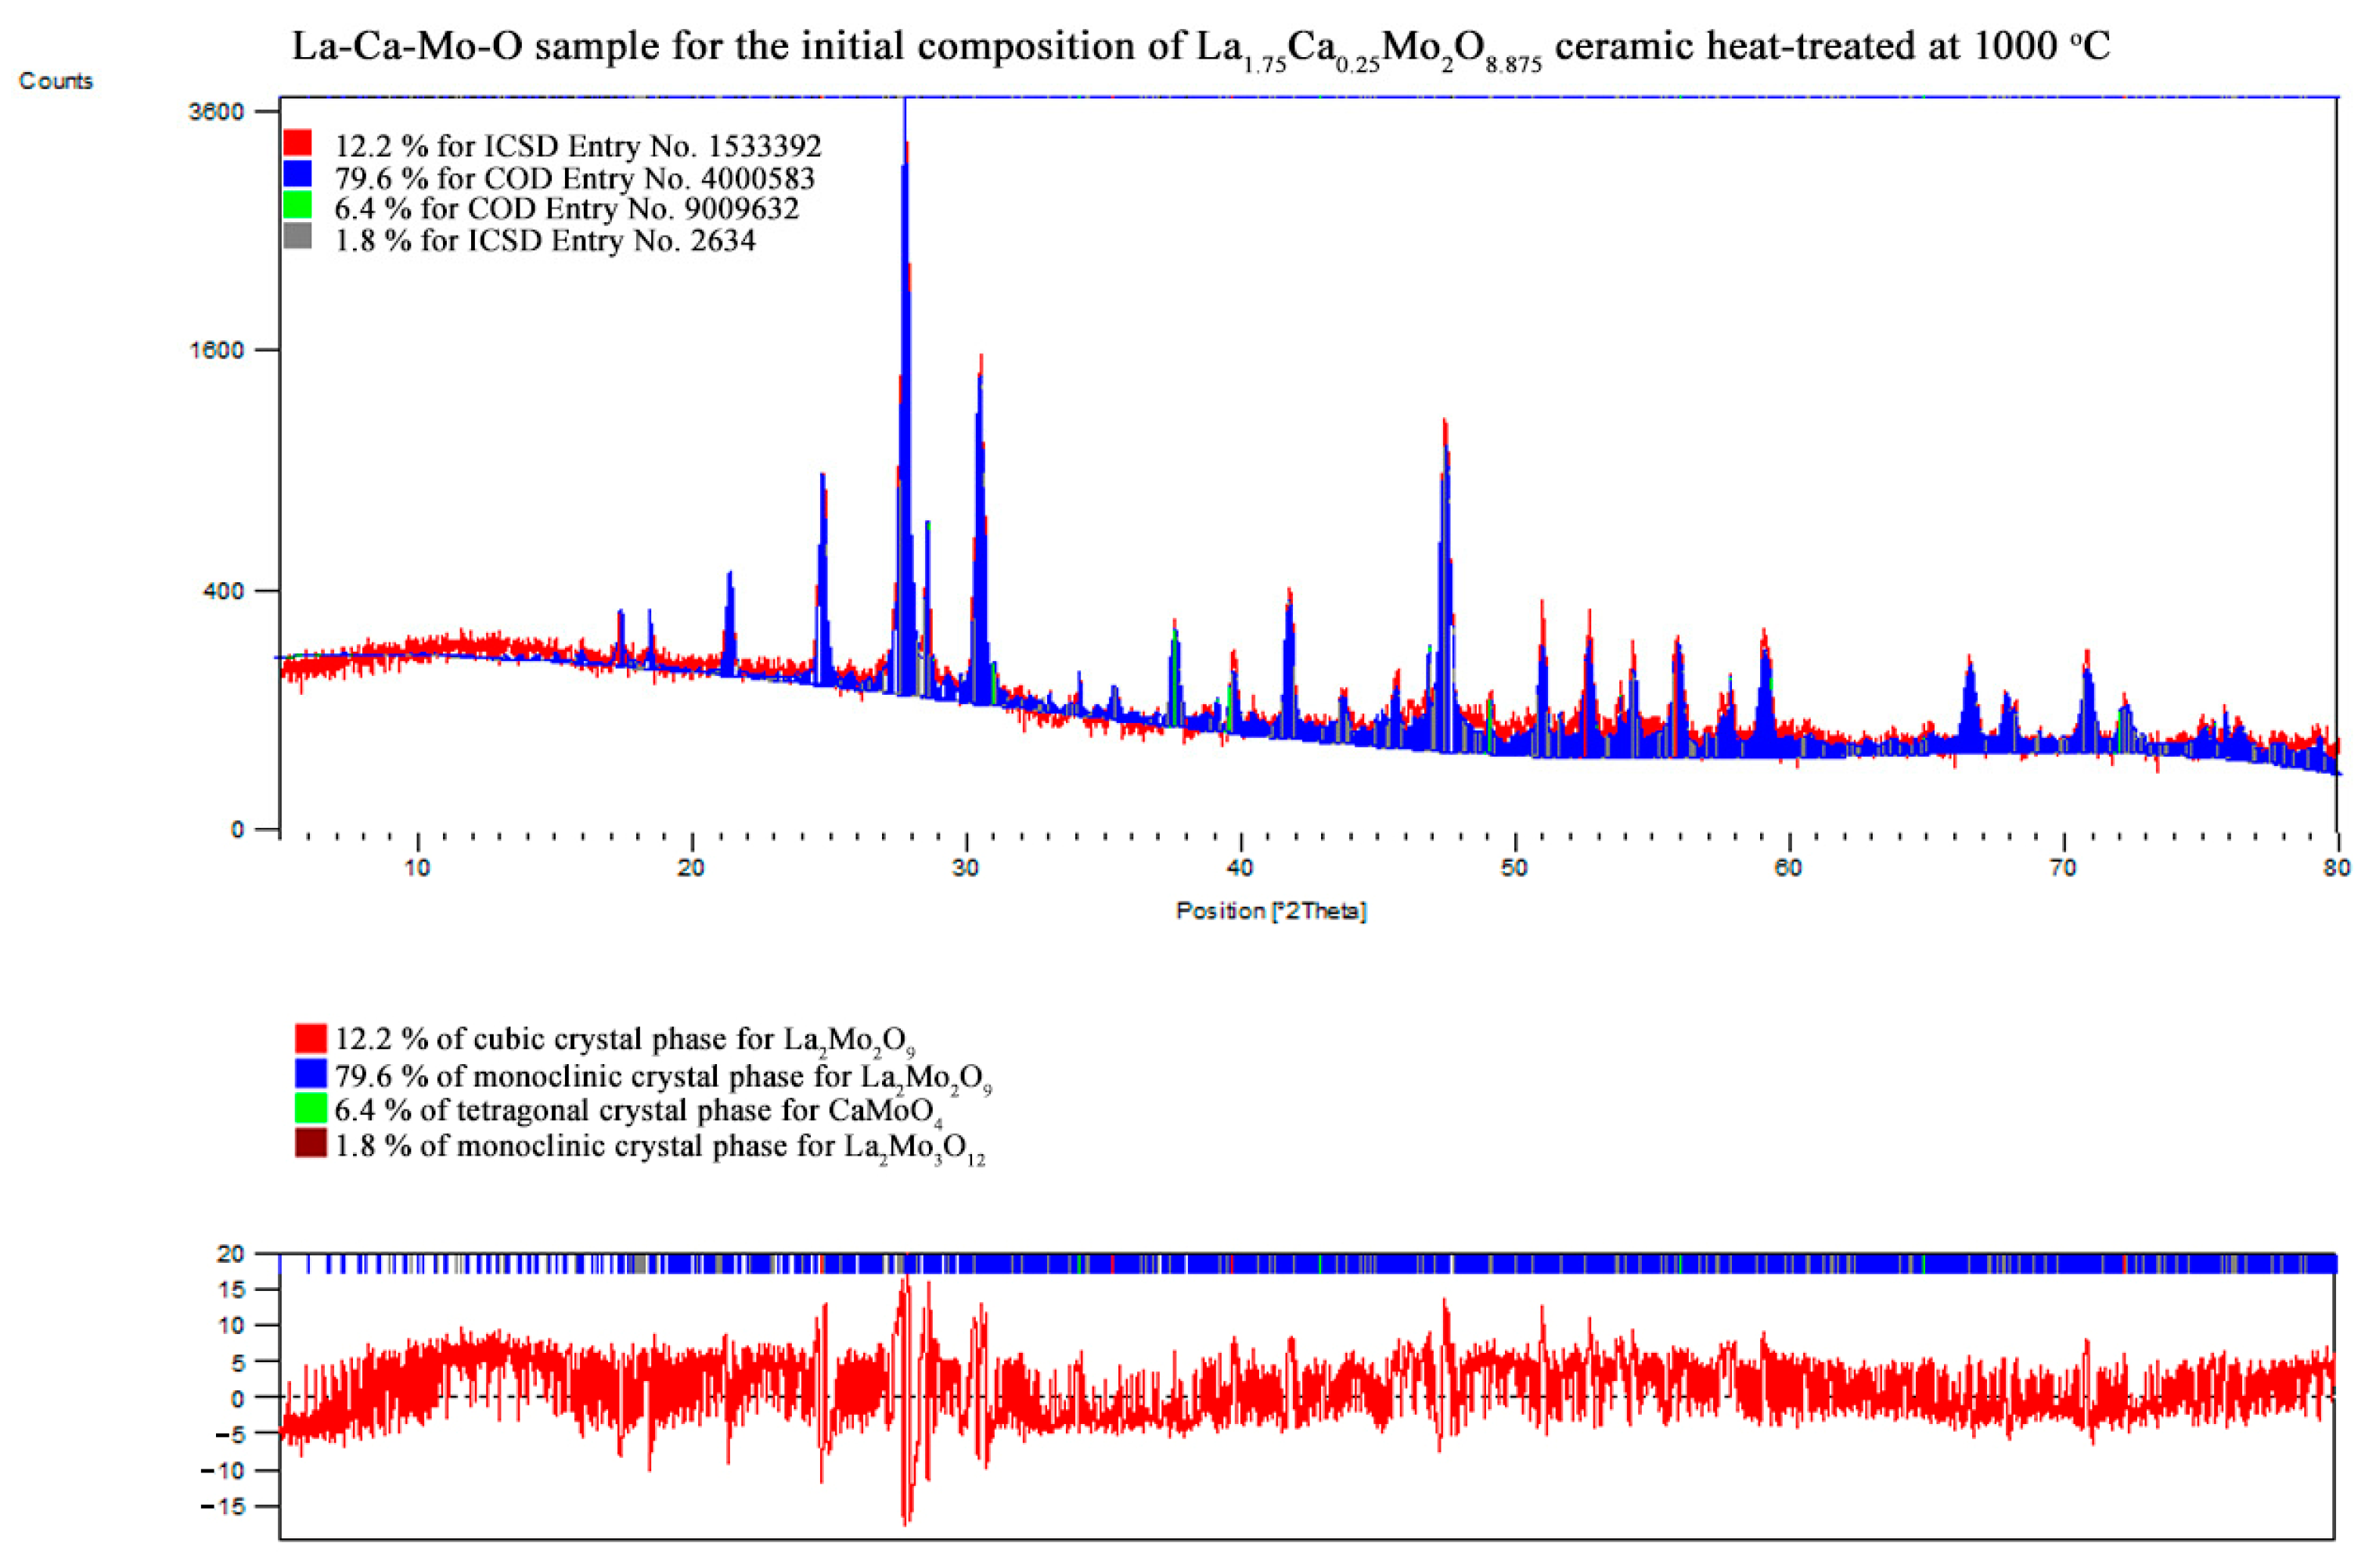
| La1.75Ca0.25Mo2O8.875 | La2Mo2O9 | monoclinic | 79.6 | 45.63 | 1430.900 | 2142.097 | 2850.290 | 14.09104 | 1.54335 |
| 90.00000 | 90.29116 | 90.00000 | |||||||
| La2Mo2O9 | cubic | 12.2 | 39.32 | 714.035 | 714.035 | 714.035 | |||
| 90.00000 | 90.00000 | 90.00000 | |||||||
| CaMoO4 | tetragonal | 6.4 | 48.20 | 523.288 | 523.288 | 1146.182 | |||
| 90.00000 | 90.00000 | 90.00000 | |||||||
| La2Mo3O12 | monoclinic | 1.8 | 46.96 | 1732.404 | 1167.824 | 1617.912 | |||
| 90.00000 | 107.70840 | 90.00000 | |||||||
| La1.7Ca0.3Mo2O8.85 | La2Mo2O9 | monoclinic | 76.1 | 64.96 | 1430.166 | 2143.528 | 2854.548 | 13.81435 | 1.44730 |
| 90.00000 | 90.34066 | 90.00000 | |||||||
| La2Mo2O9 | cubic | 13.8 | 45.66 | 714.447 | 714.447 | 714.447 | |||
| 90.00000 | 90.00000 | 90.00000 | |||||||
| CaMoO4 | tetragonal | 9.1 | 67.30 | 523.476 | 523.476 | 1146.807 | |||
| 90.00000 | 90.00000 | 90.00000 | |||||||
| La2Mo3O12 | monoclinic | 1.0 | 66.99 | 1733.132 | 1169.219 | 1619.159 | |||
| 90.00000 | 107.79630 | 90.00000 | |||||||
Disclaimer/Publisher’s Note: The statements, opinions and data contained in all publications are solely those of the individual author(s) and contributor(s) and not of MDPI and/or the editor(s). MDPI and/or the editor(s) disclaim responsibility for any injury to people or property resulting from any ideas, methods, instructions or products referred to in the content. |
© 2023 by the authors. Licensee MDPI, Basel, Switzerland. This article is an open access article distributed under the terms and conditions of the Creative Commons Attribution (CC BY) license (https://creativecommons.org/licenses/by/4.0/).
Share and Cite
Žalga, A.; Gaidamavičienė, G. Thermoanalytical and X-ray Diffraction Studies on the Phase Transition of the Calcium-Substituted La2Mo2O9 System. Materials 2023, 16, 813. https://doi.org/10.3390/ma16020813
Žalga A, Gaidamavičienė G. Thermoanalytical and X-ray Diffraction Studies on the Phase Transition of the Calcium-Substituted La2Mo2O9 System. Materials. 2023; 16(2):813. https://doi.org/10.3390/ma16020813
Chicago/Turabian StyleŽalga, Artūras, and Giedrė Gaidamavičienė. 2023. "Thermoanalytical and X-ray Diffraction Studies on the Phase Transition of the Calcium-Substituted La2Mo2O9 System" Materials 16, no. 2: 813. https://doi.org/10.3390/ma16020813
APA StyleŽalga, A., & Gaidamavičienė, G. (2023). Thermoanalytical and X-ray Diffraction Studies on the Phase Transition of the Calcium-Substituted La2Mo2O9 System. Materials, 16(2), 813. https://doi.org/10.3390/ma16020813


