
Simulation and Experimental of Infiltration and Solidification Process for Al2O3(3D)/5083Al Interpenetrating Phase Composite for High Speed Train Prepared by Low-Pressure Infiltration


Abstract
:1. Introduction
2. Digital Analogue
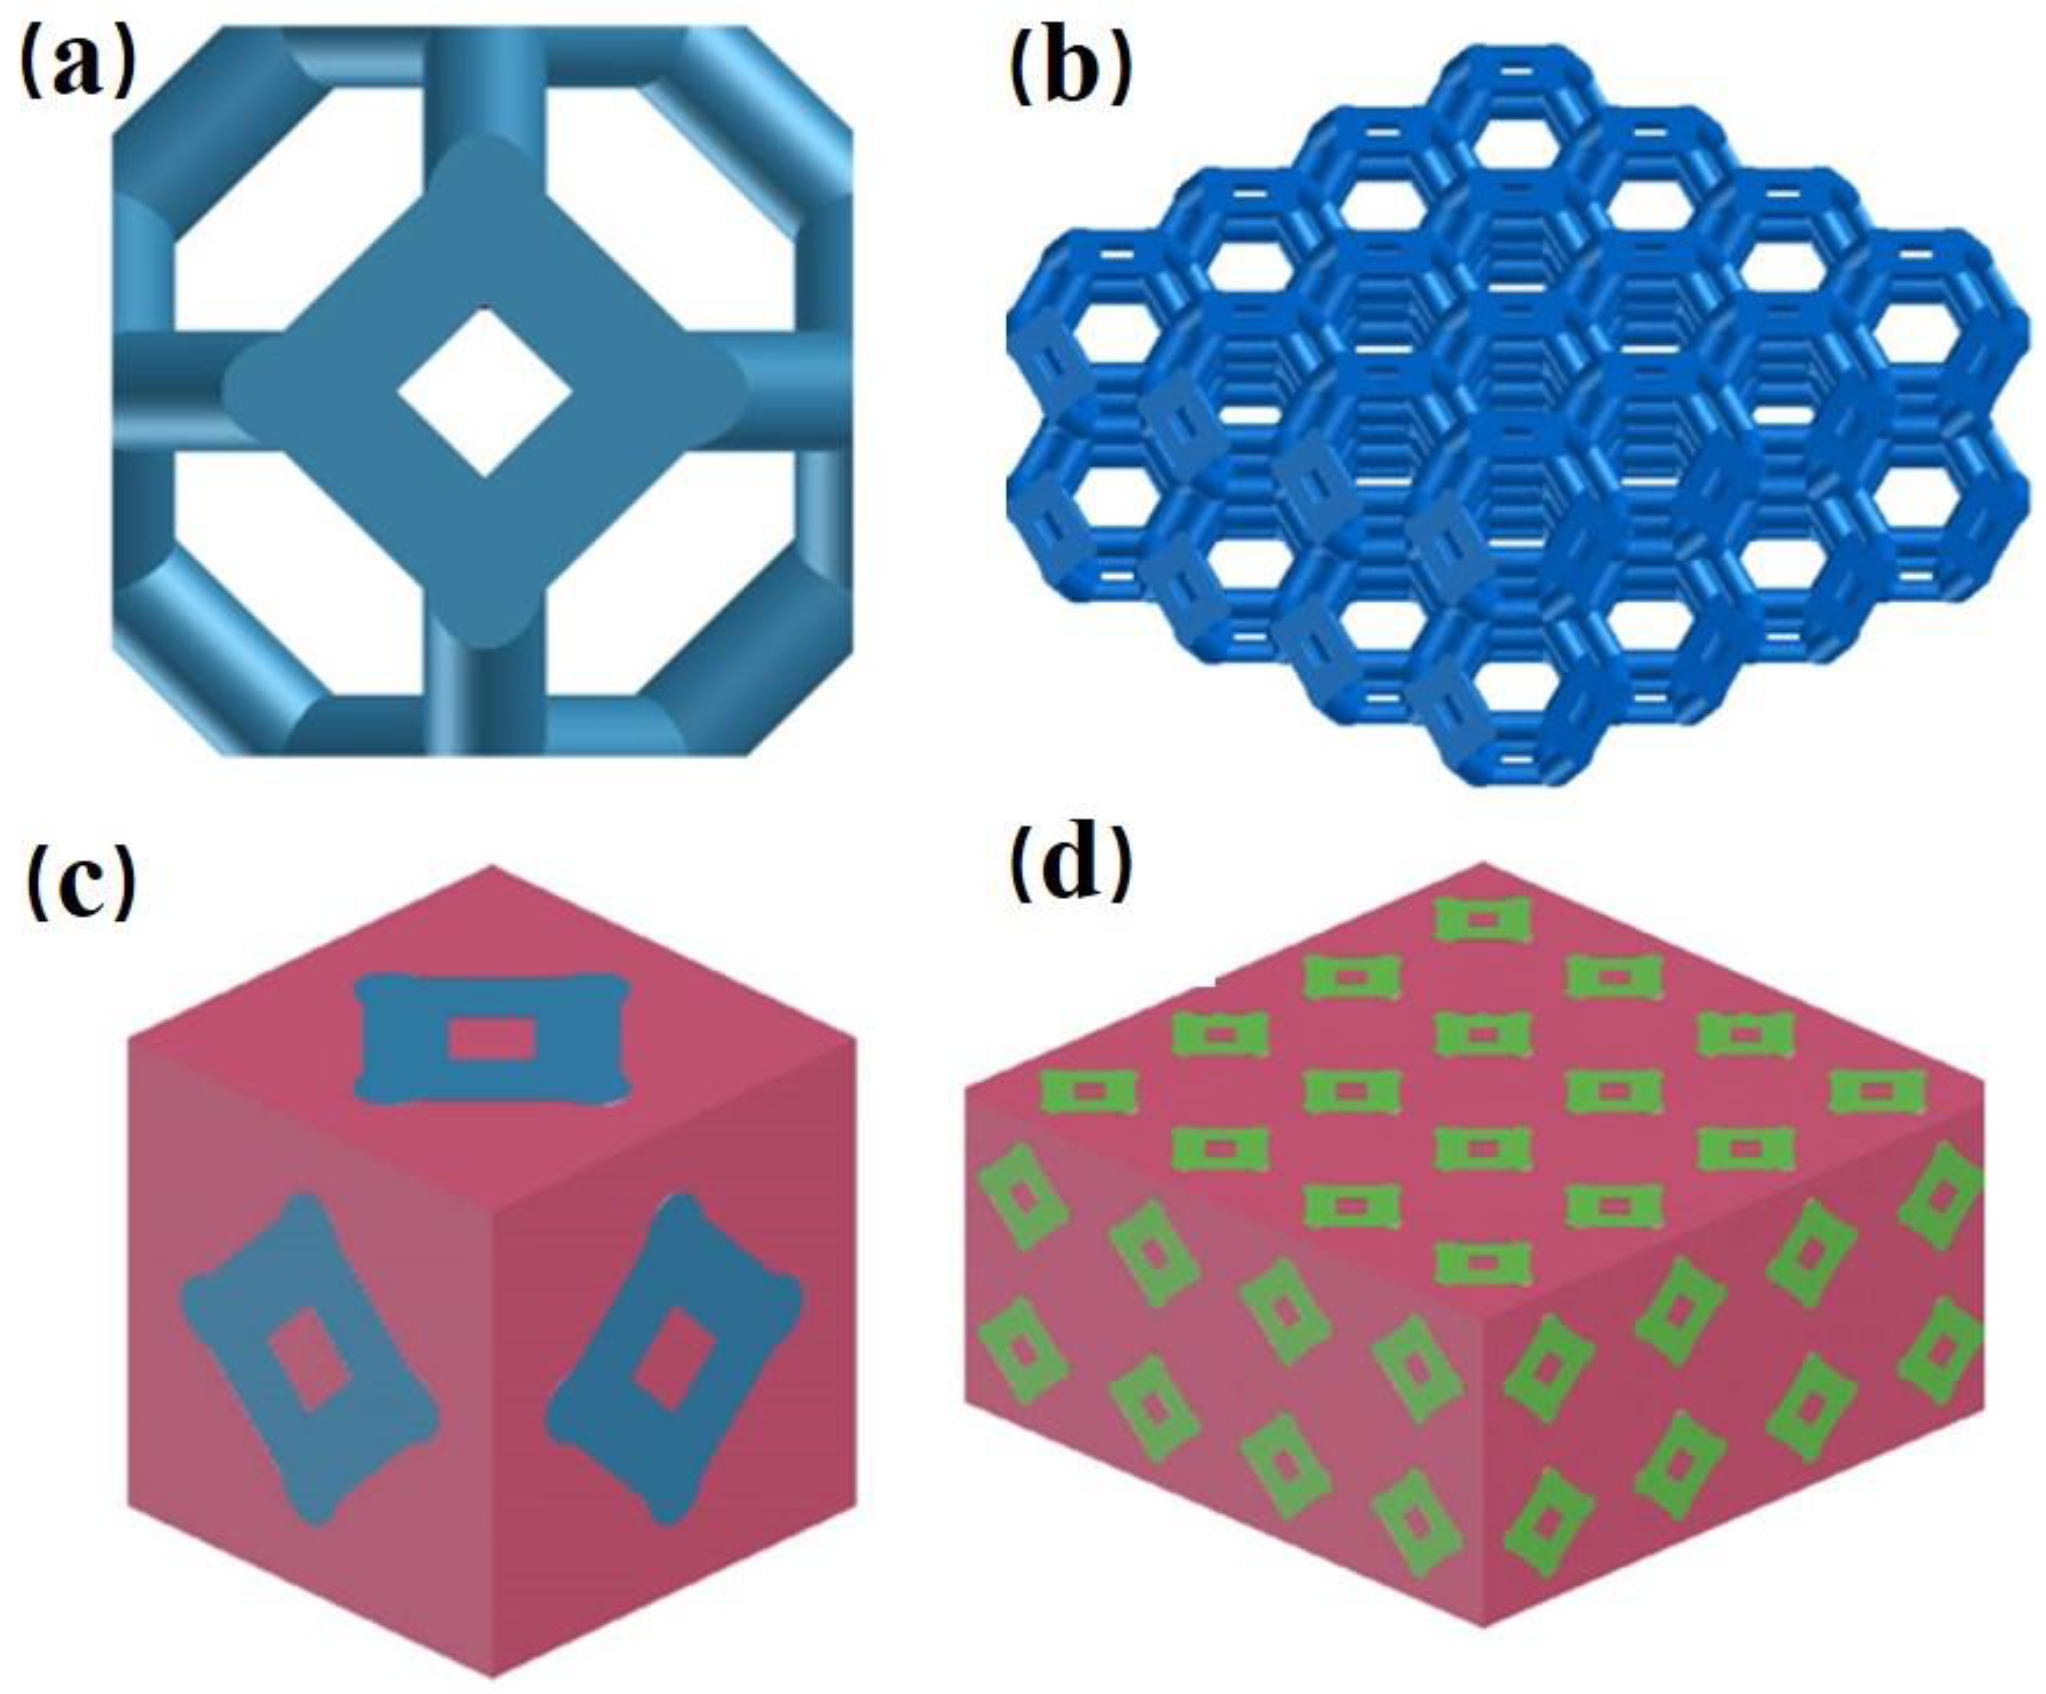
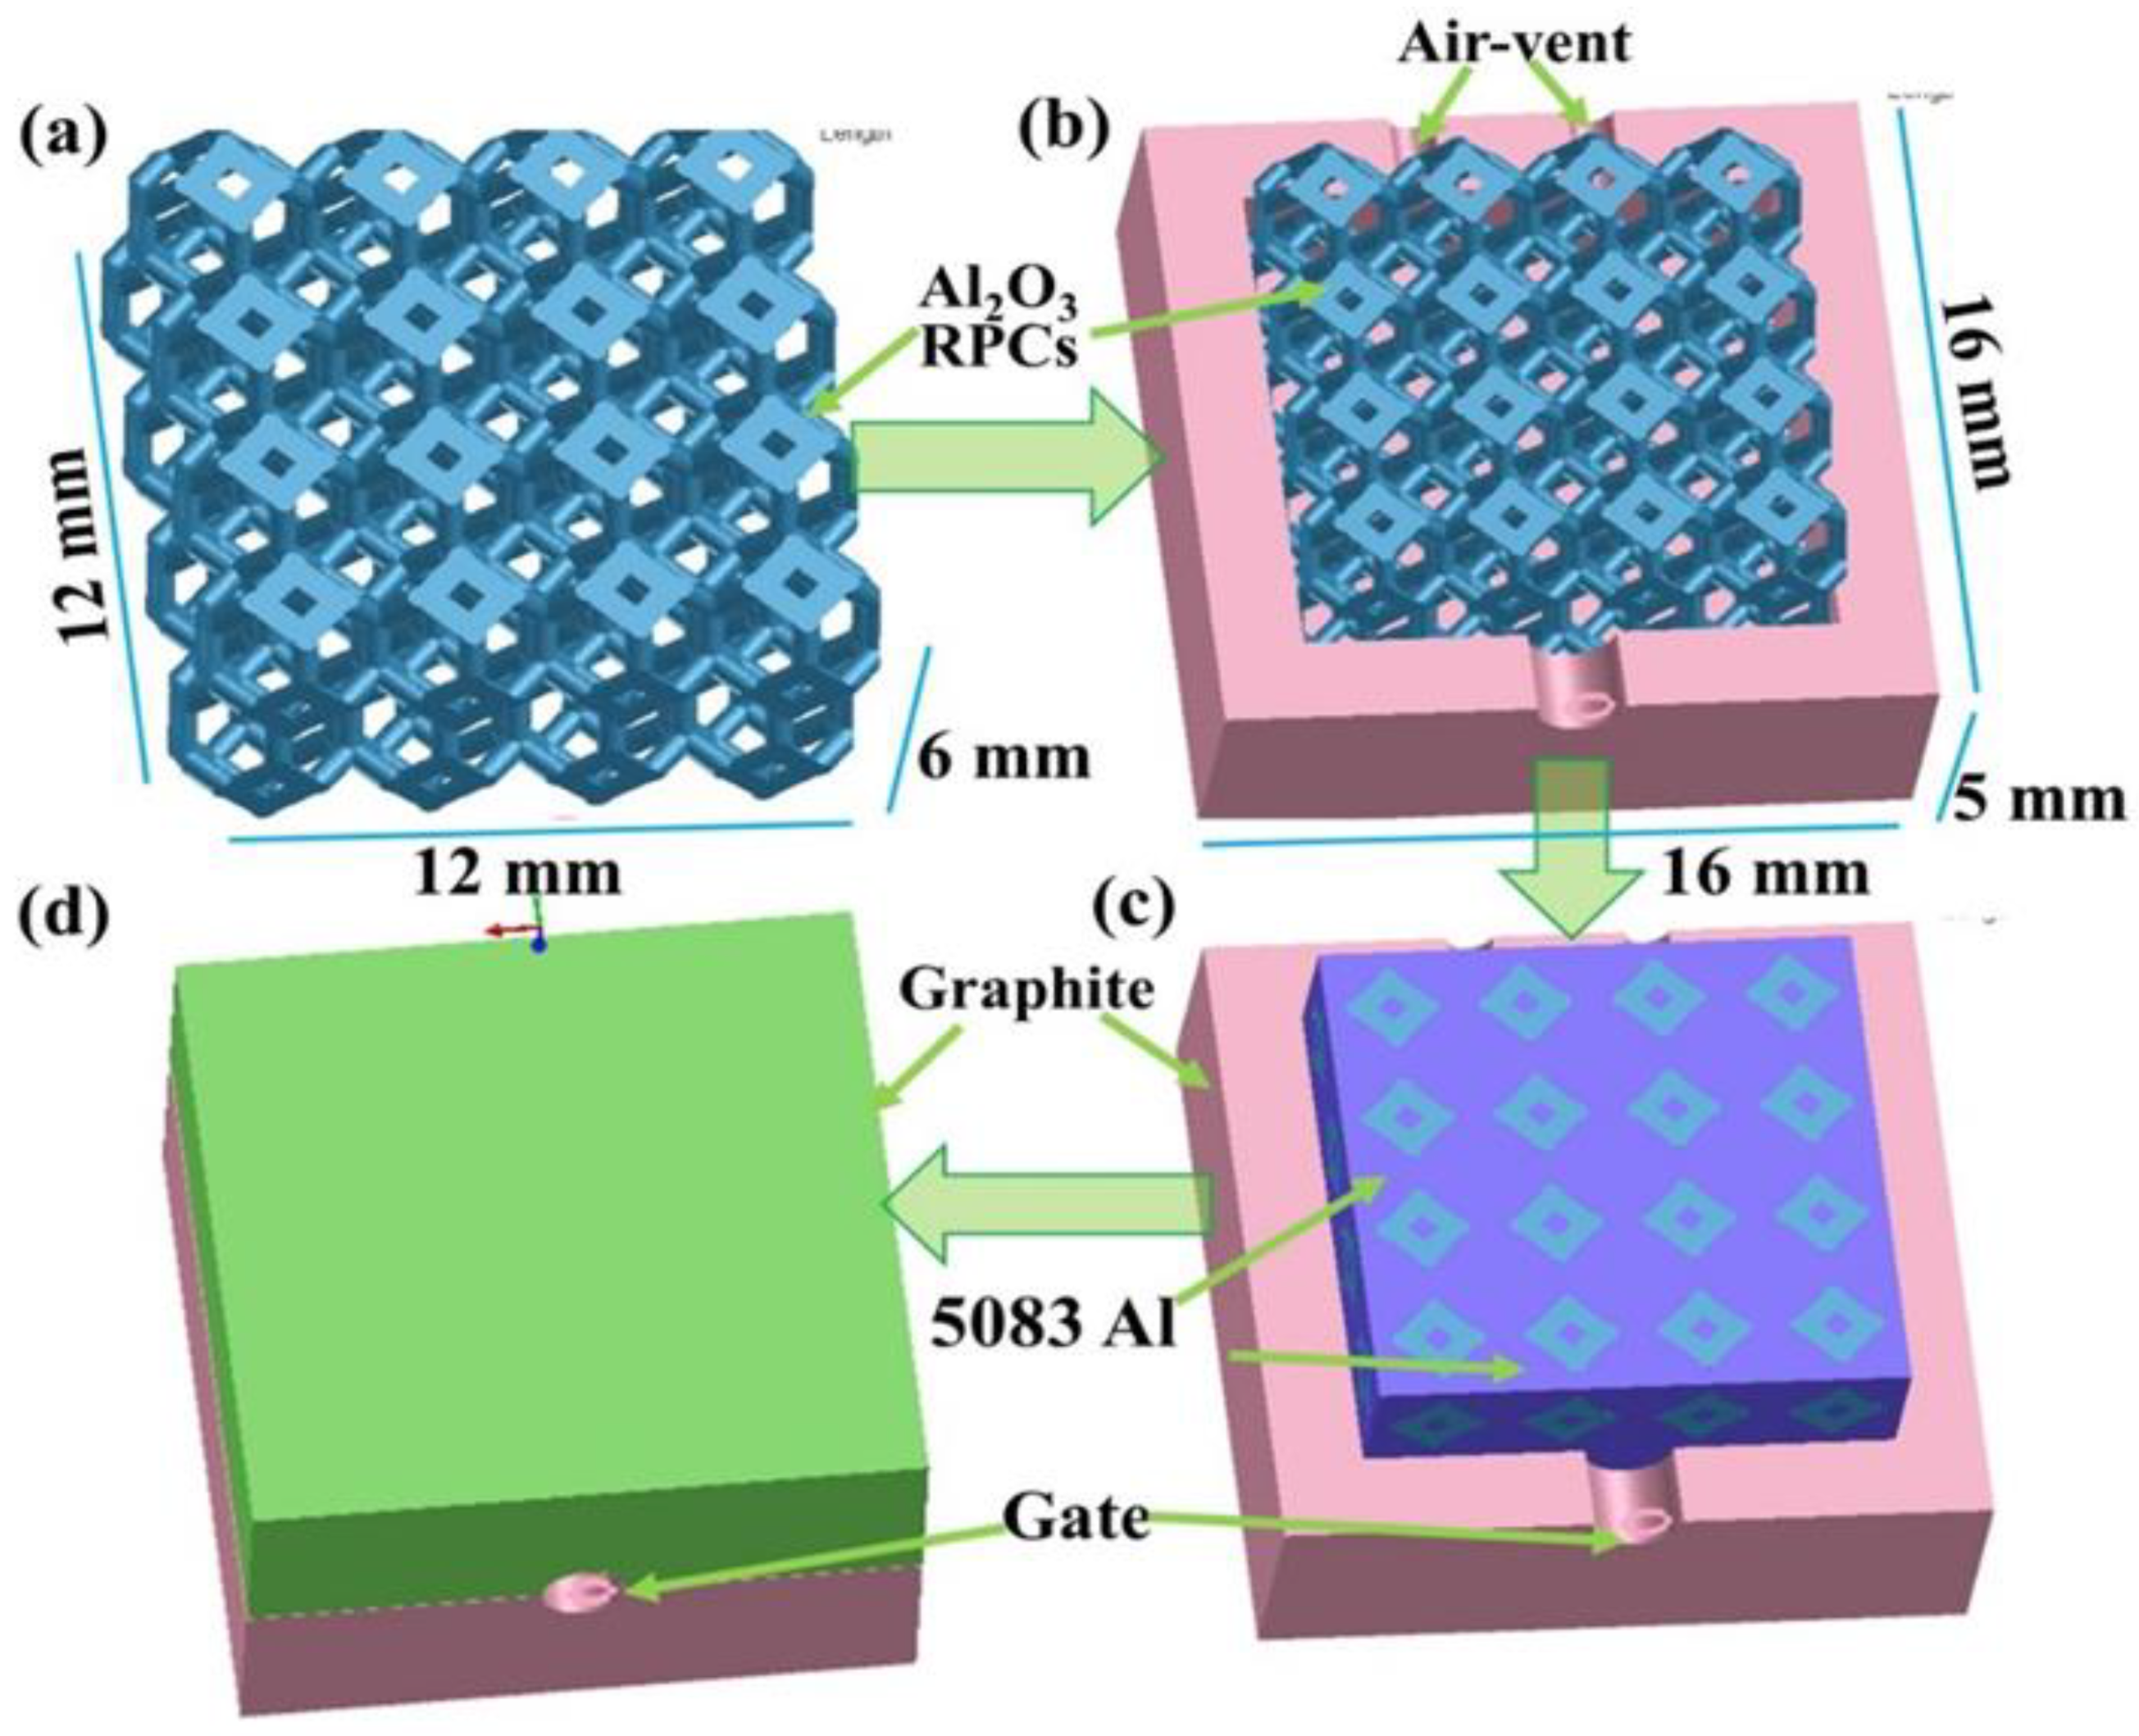
2.1. Geometrical Model
2.2. Governing Equations
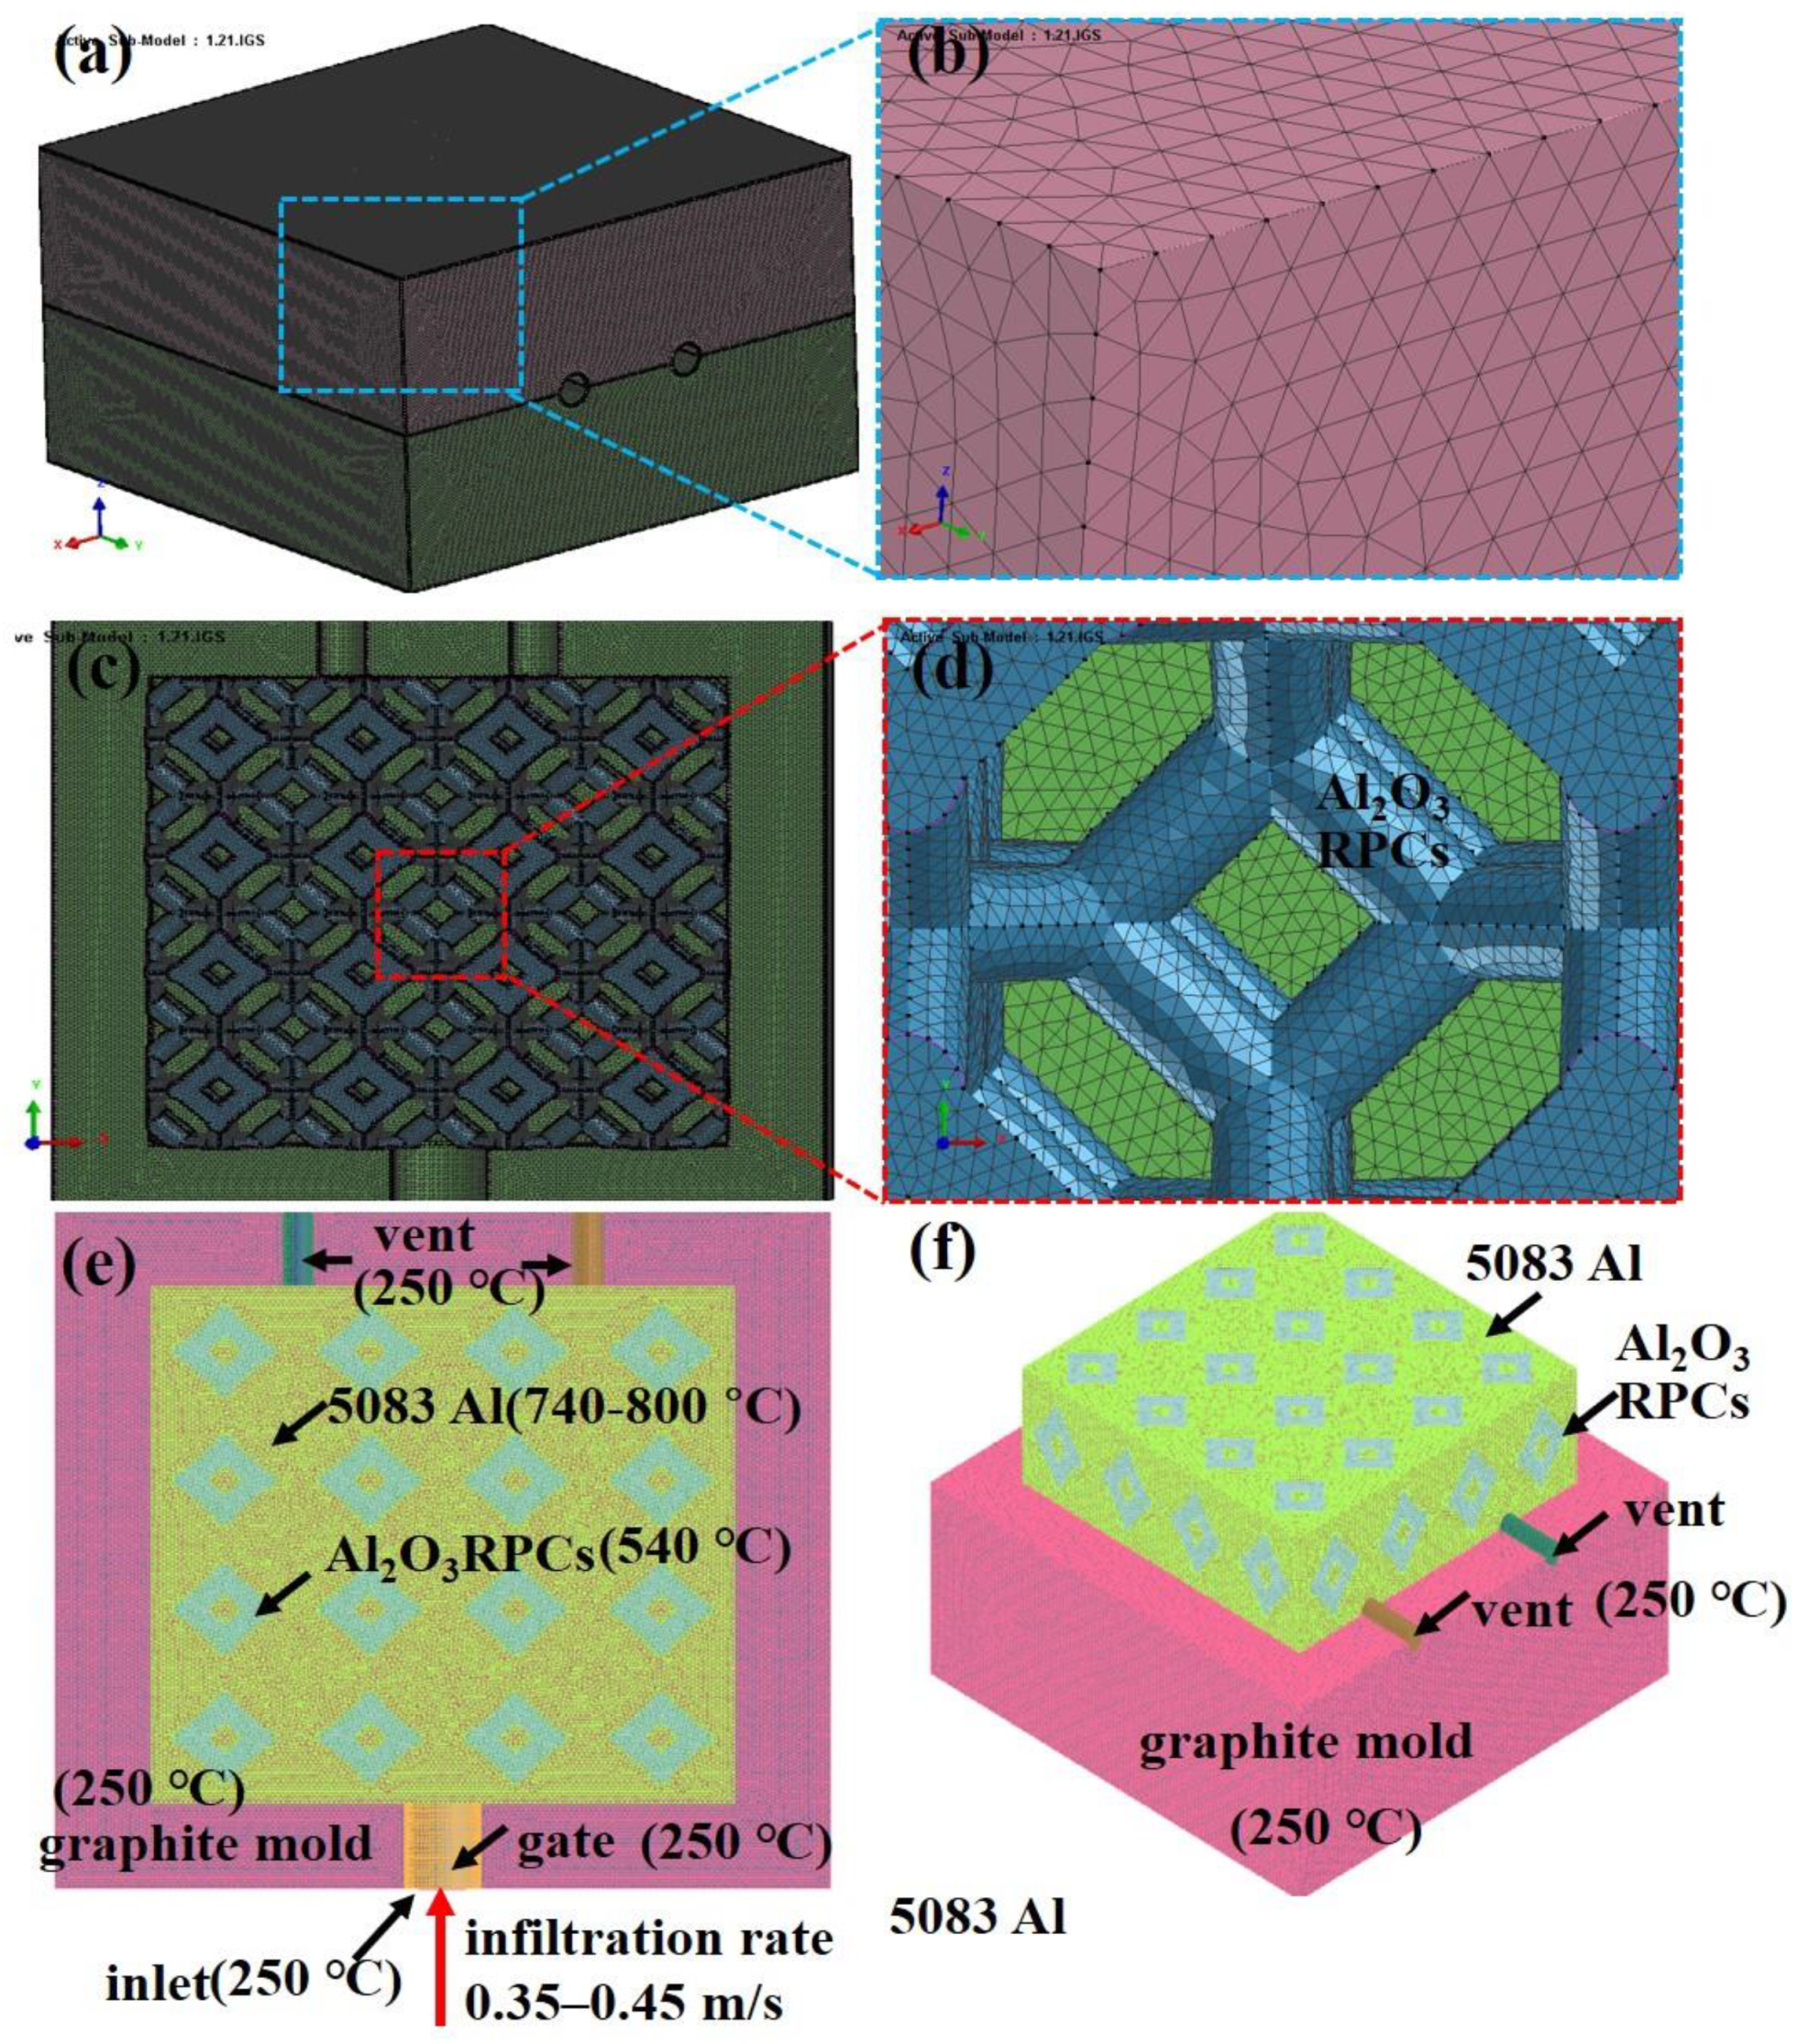
2.3. Numerical Procedure
3. Material Preparation and Material Characterization
3.1. Material Preparation
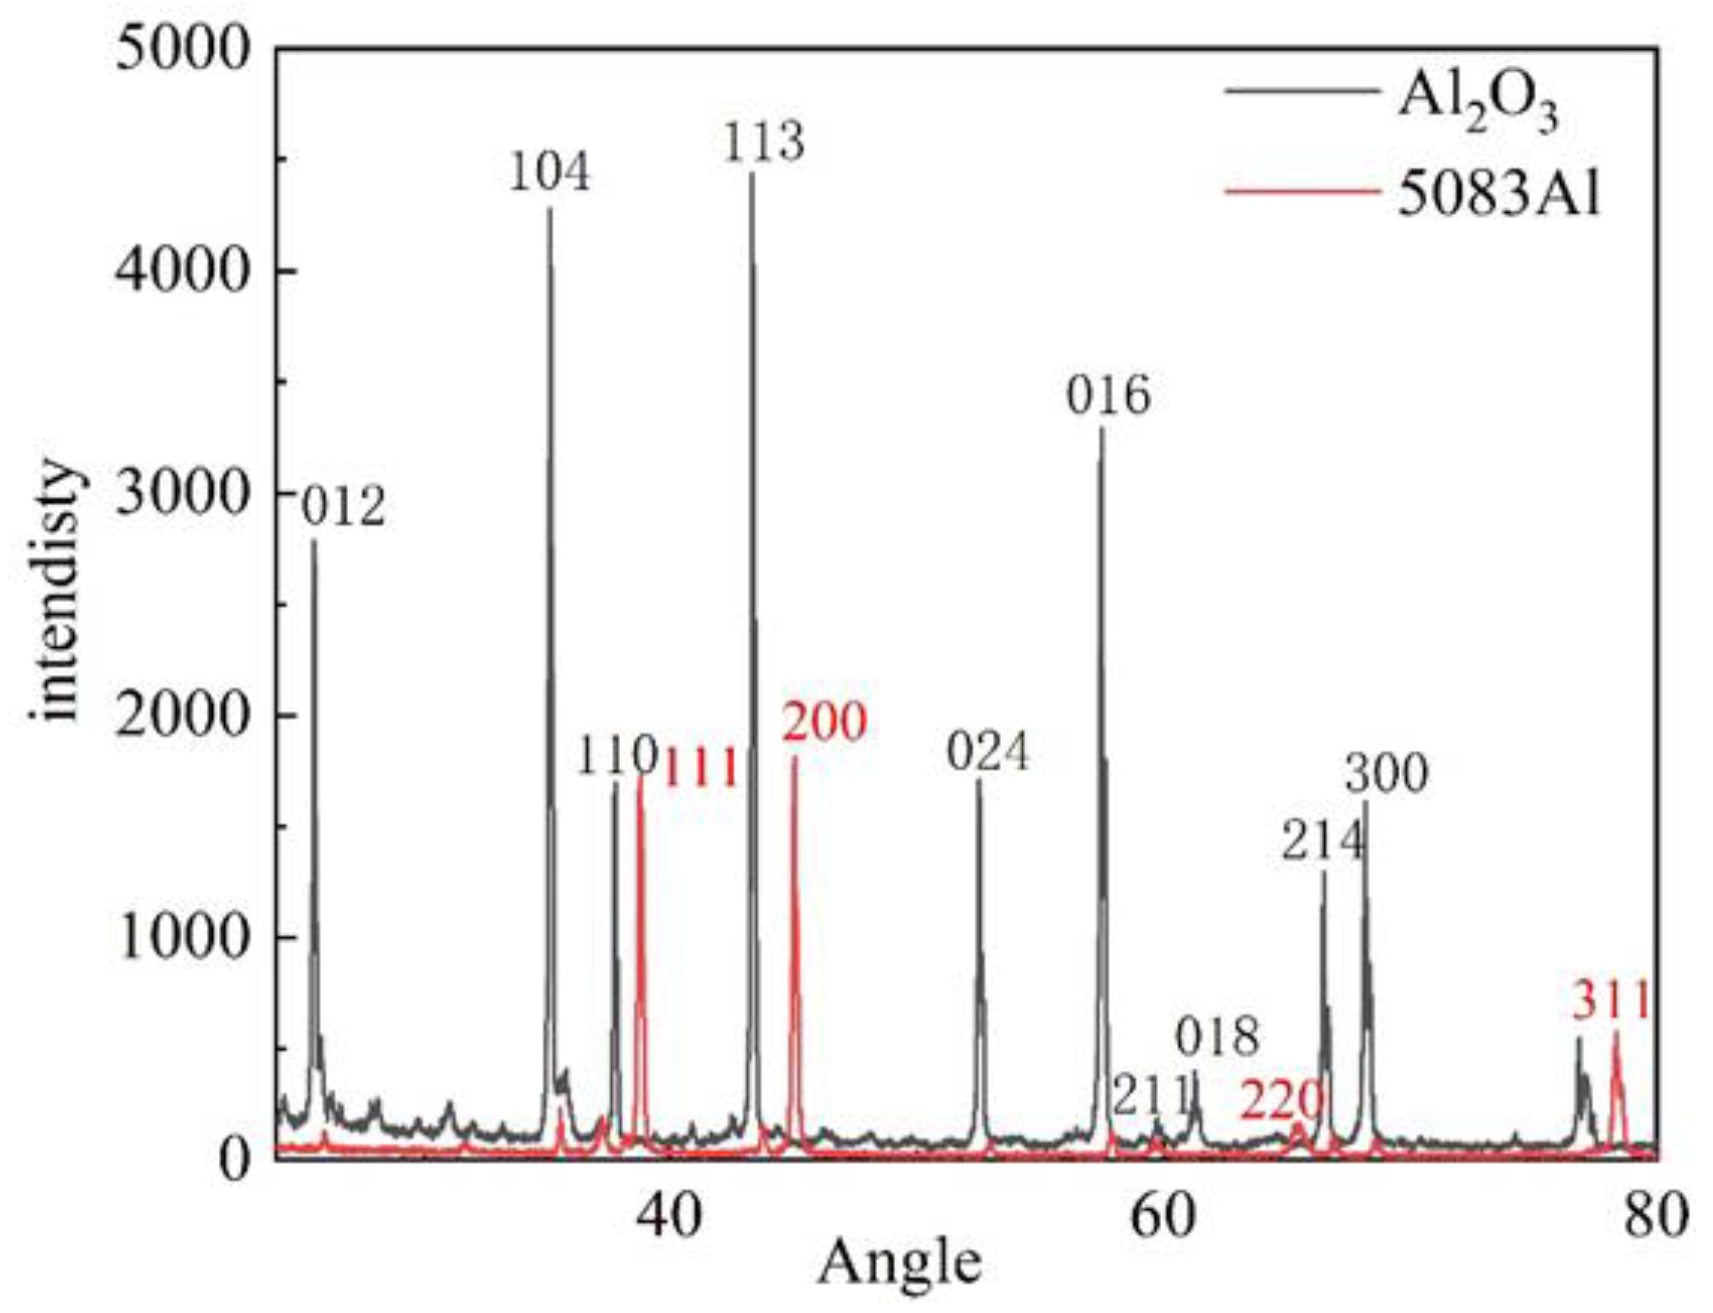
3.2. Material Characterization
4. Results and Discussion
4.1. Effect of Pouring Temperature on Infiltration Depth
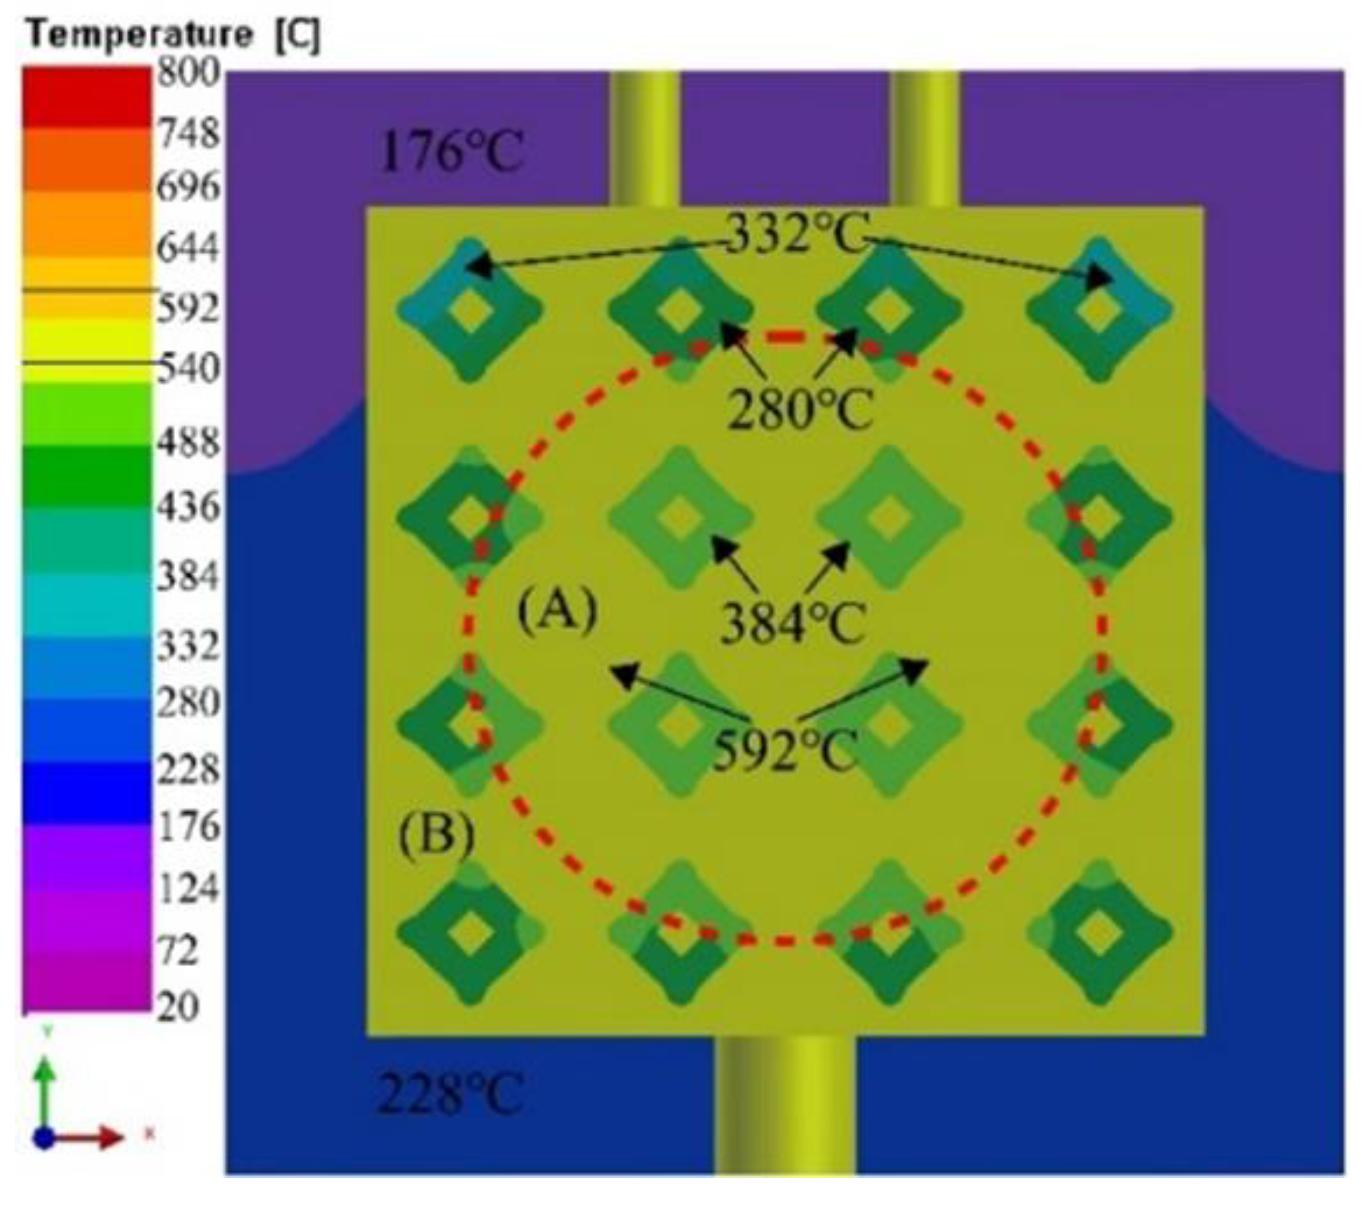
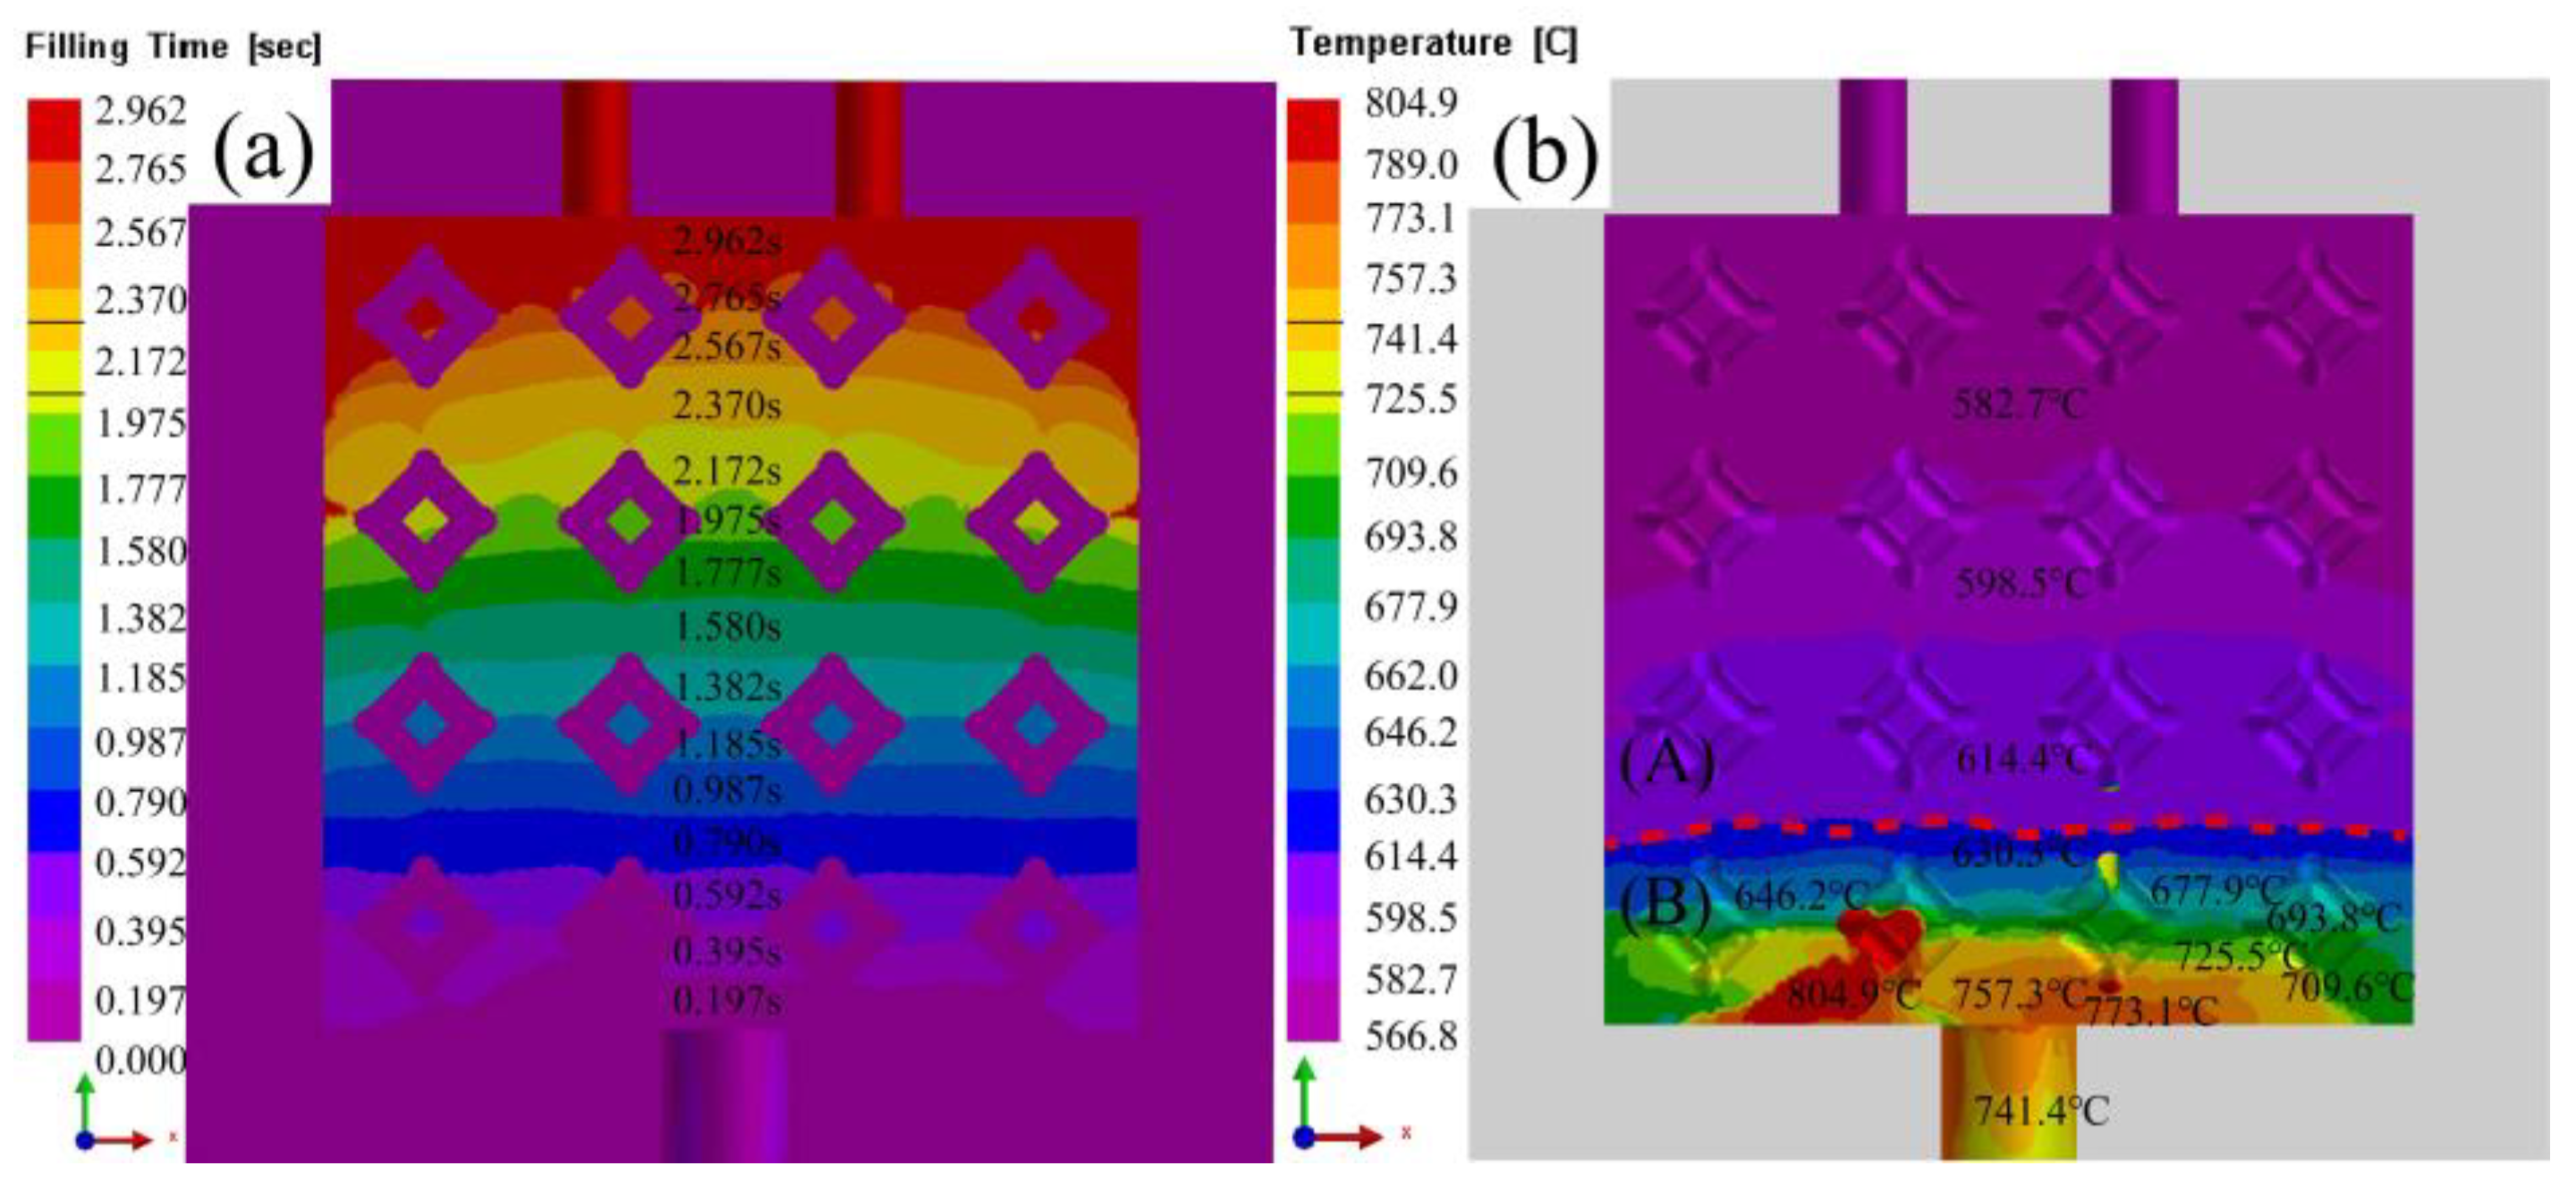
4.2. Flow Field and Temperature Field of Liquid 5083Al at PT 800 °C
4.3. Effect of Porosity of Al2O3(3D) on Liquid 5083Al with PV 0.4 m/s and PT 800 °C in LPIP
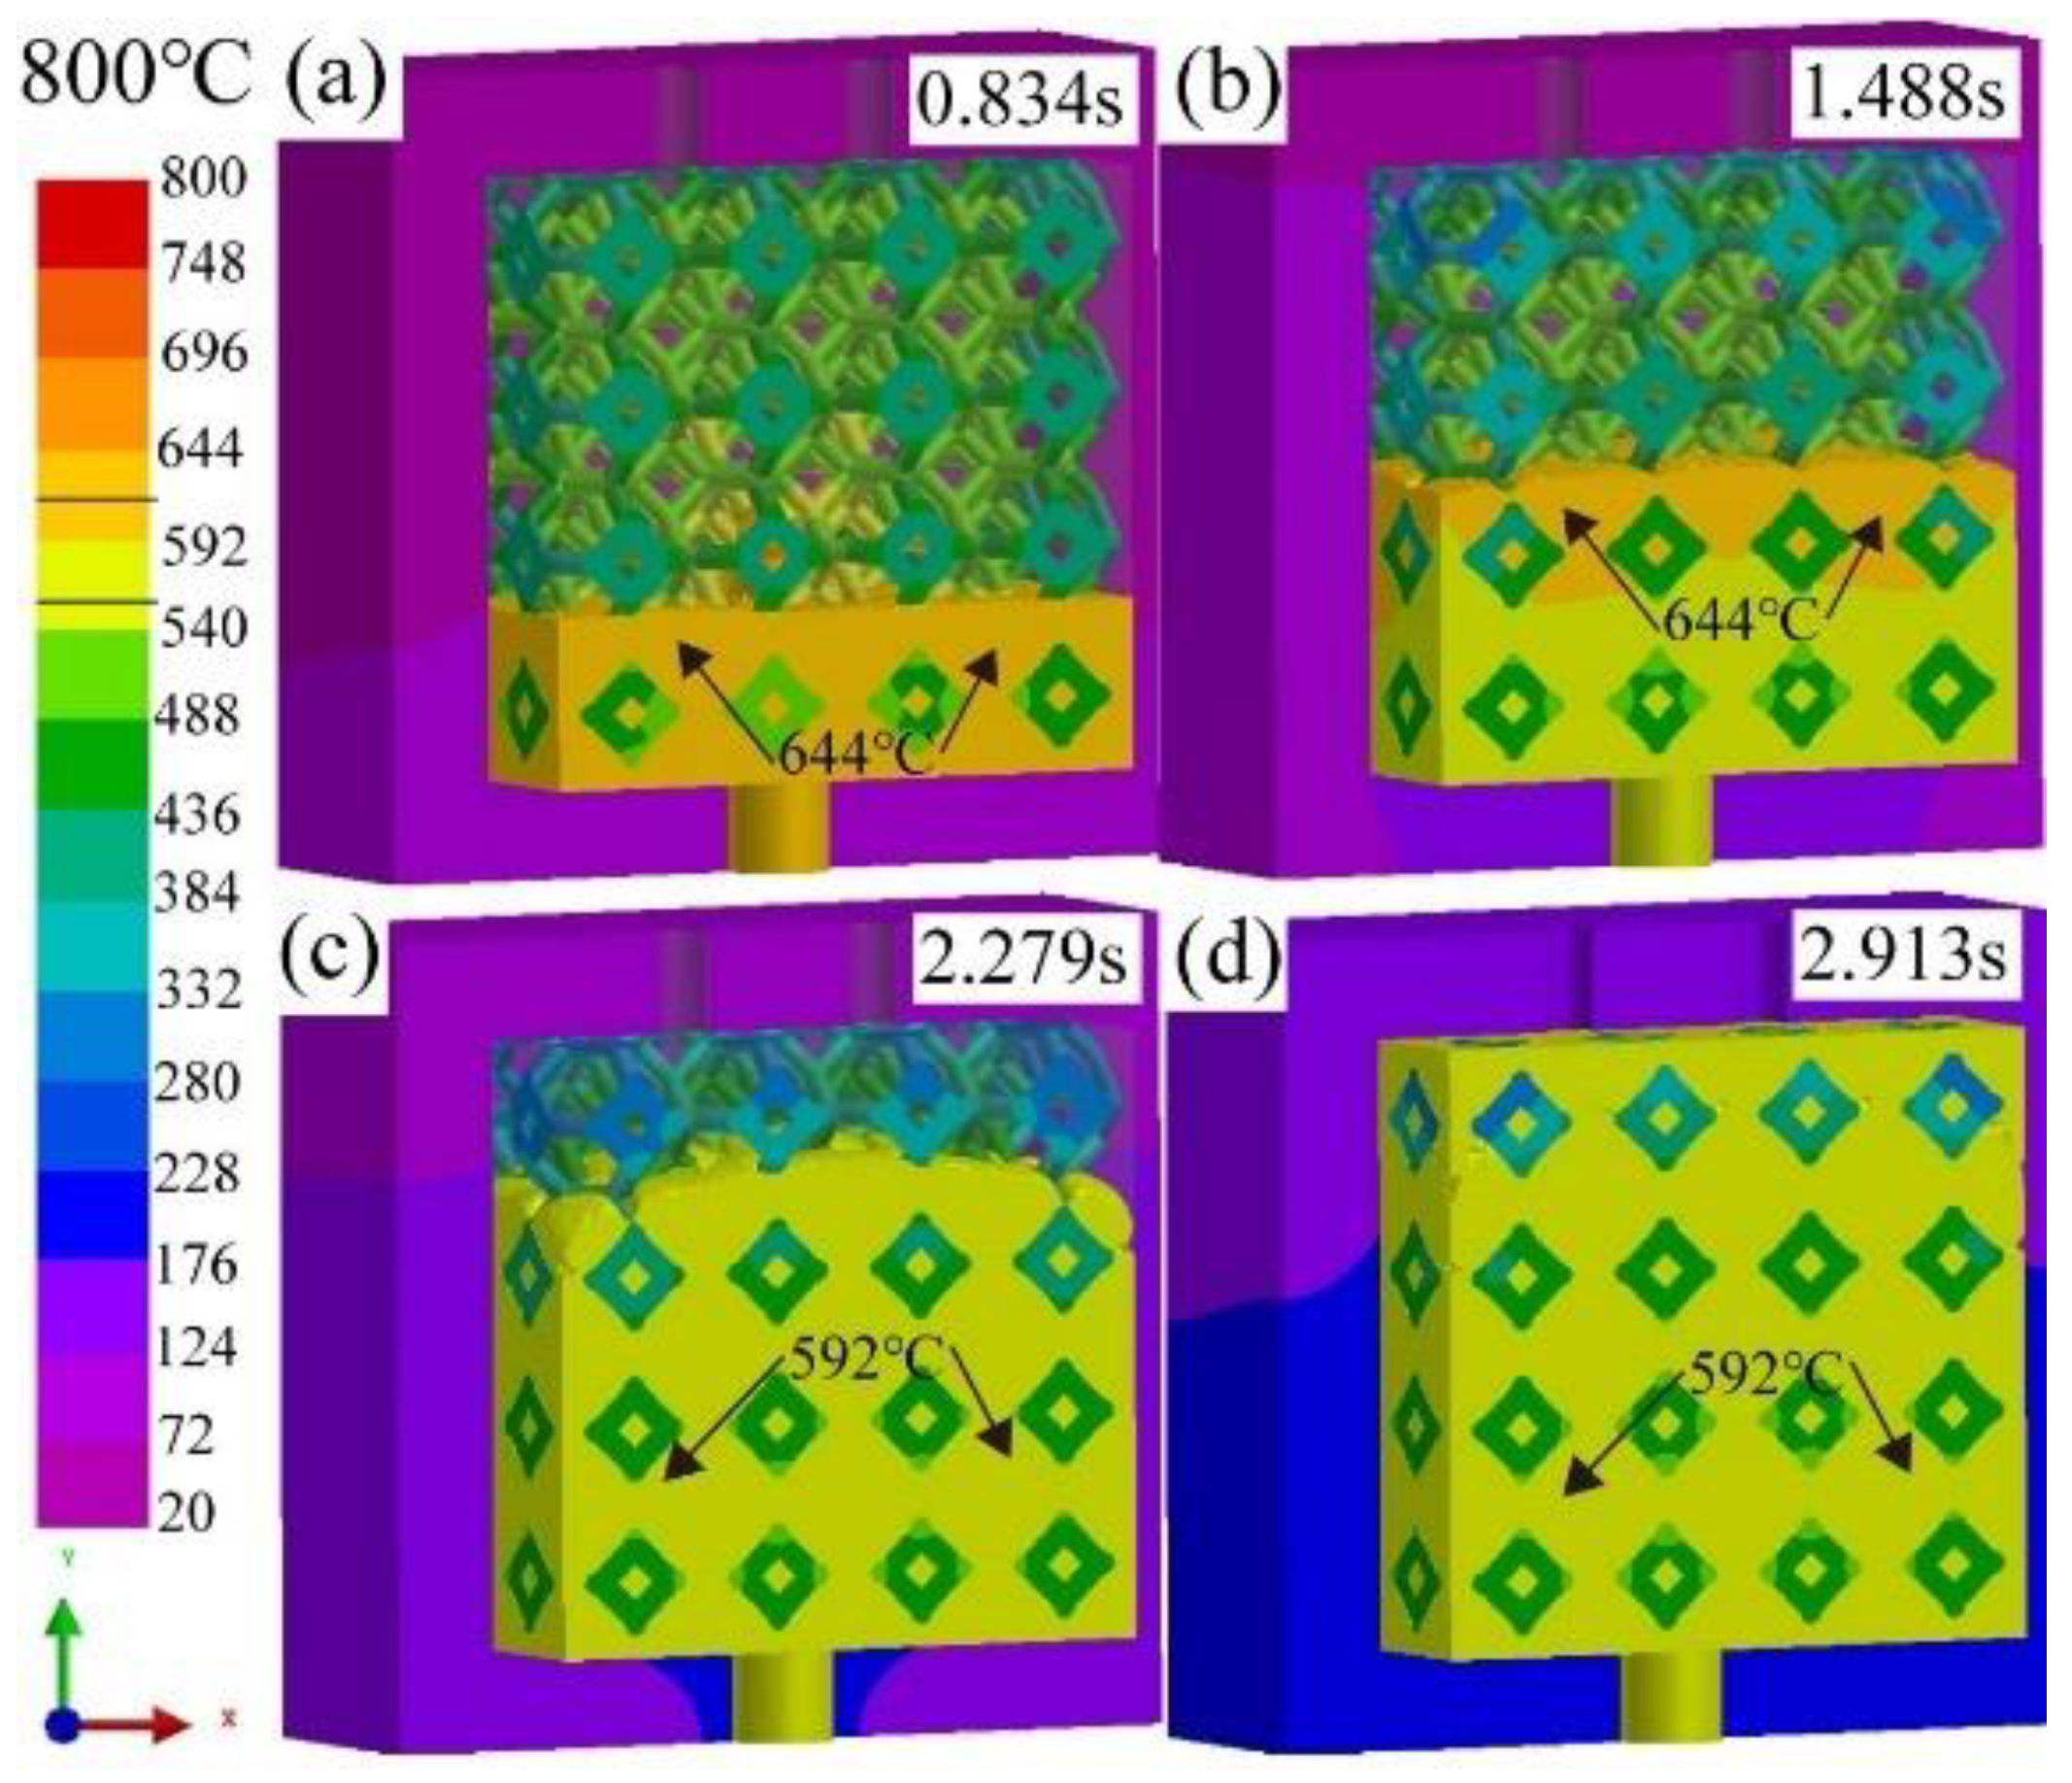
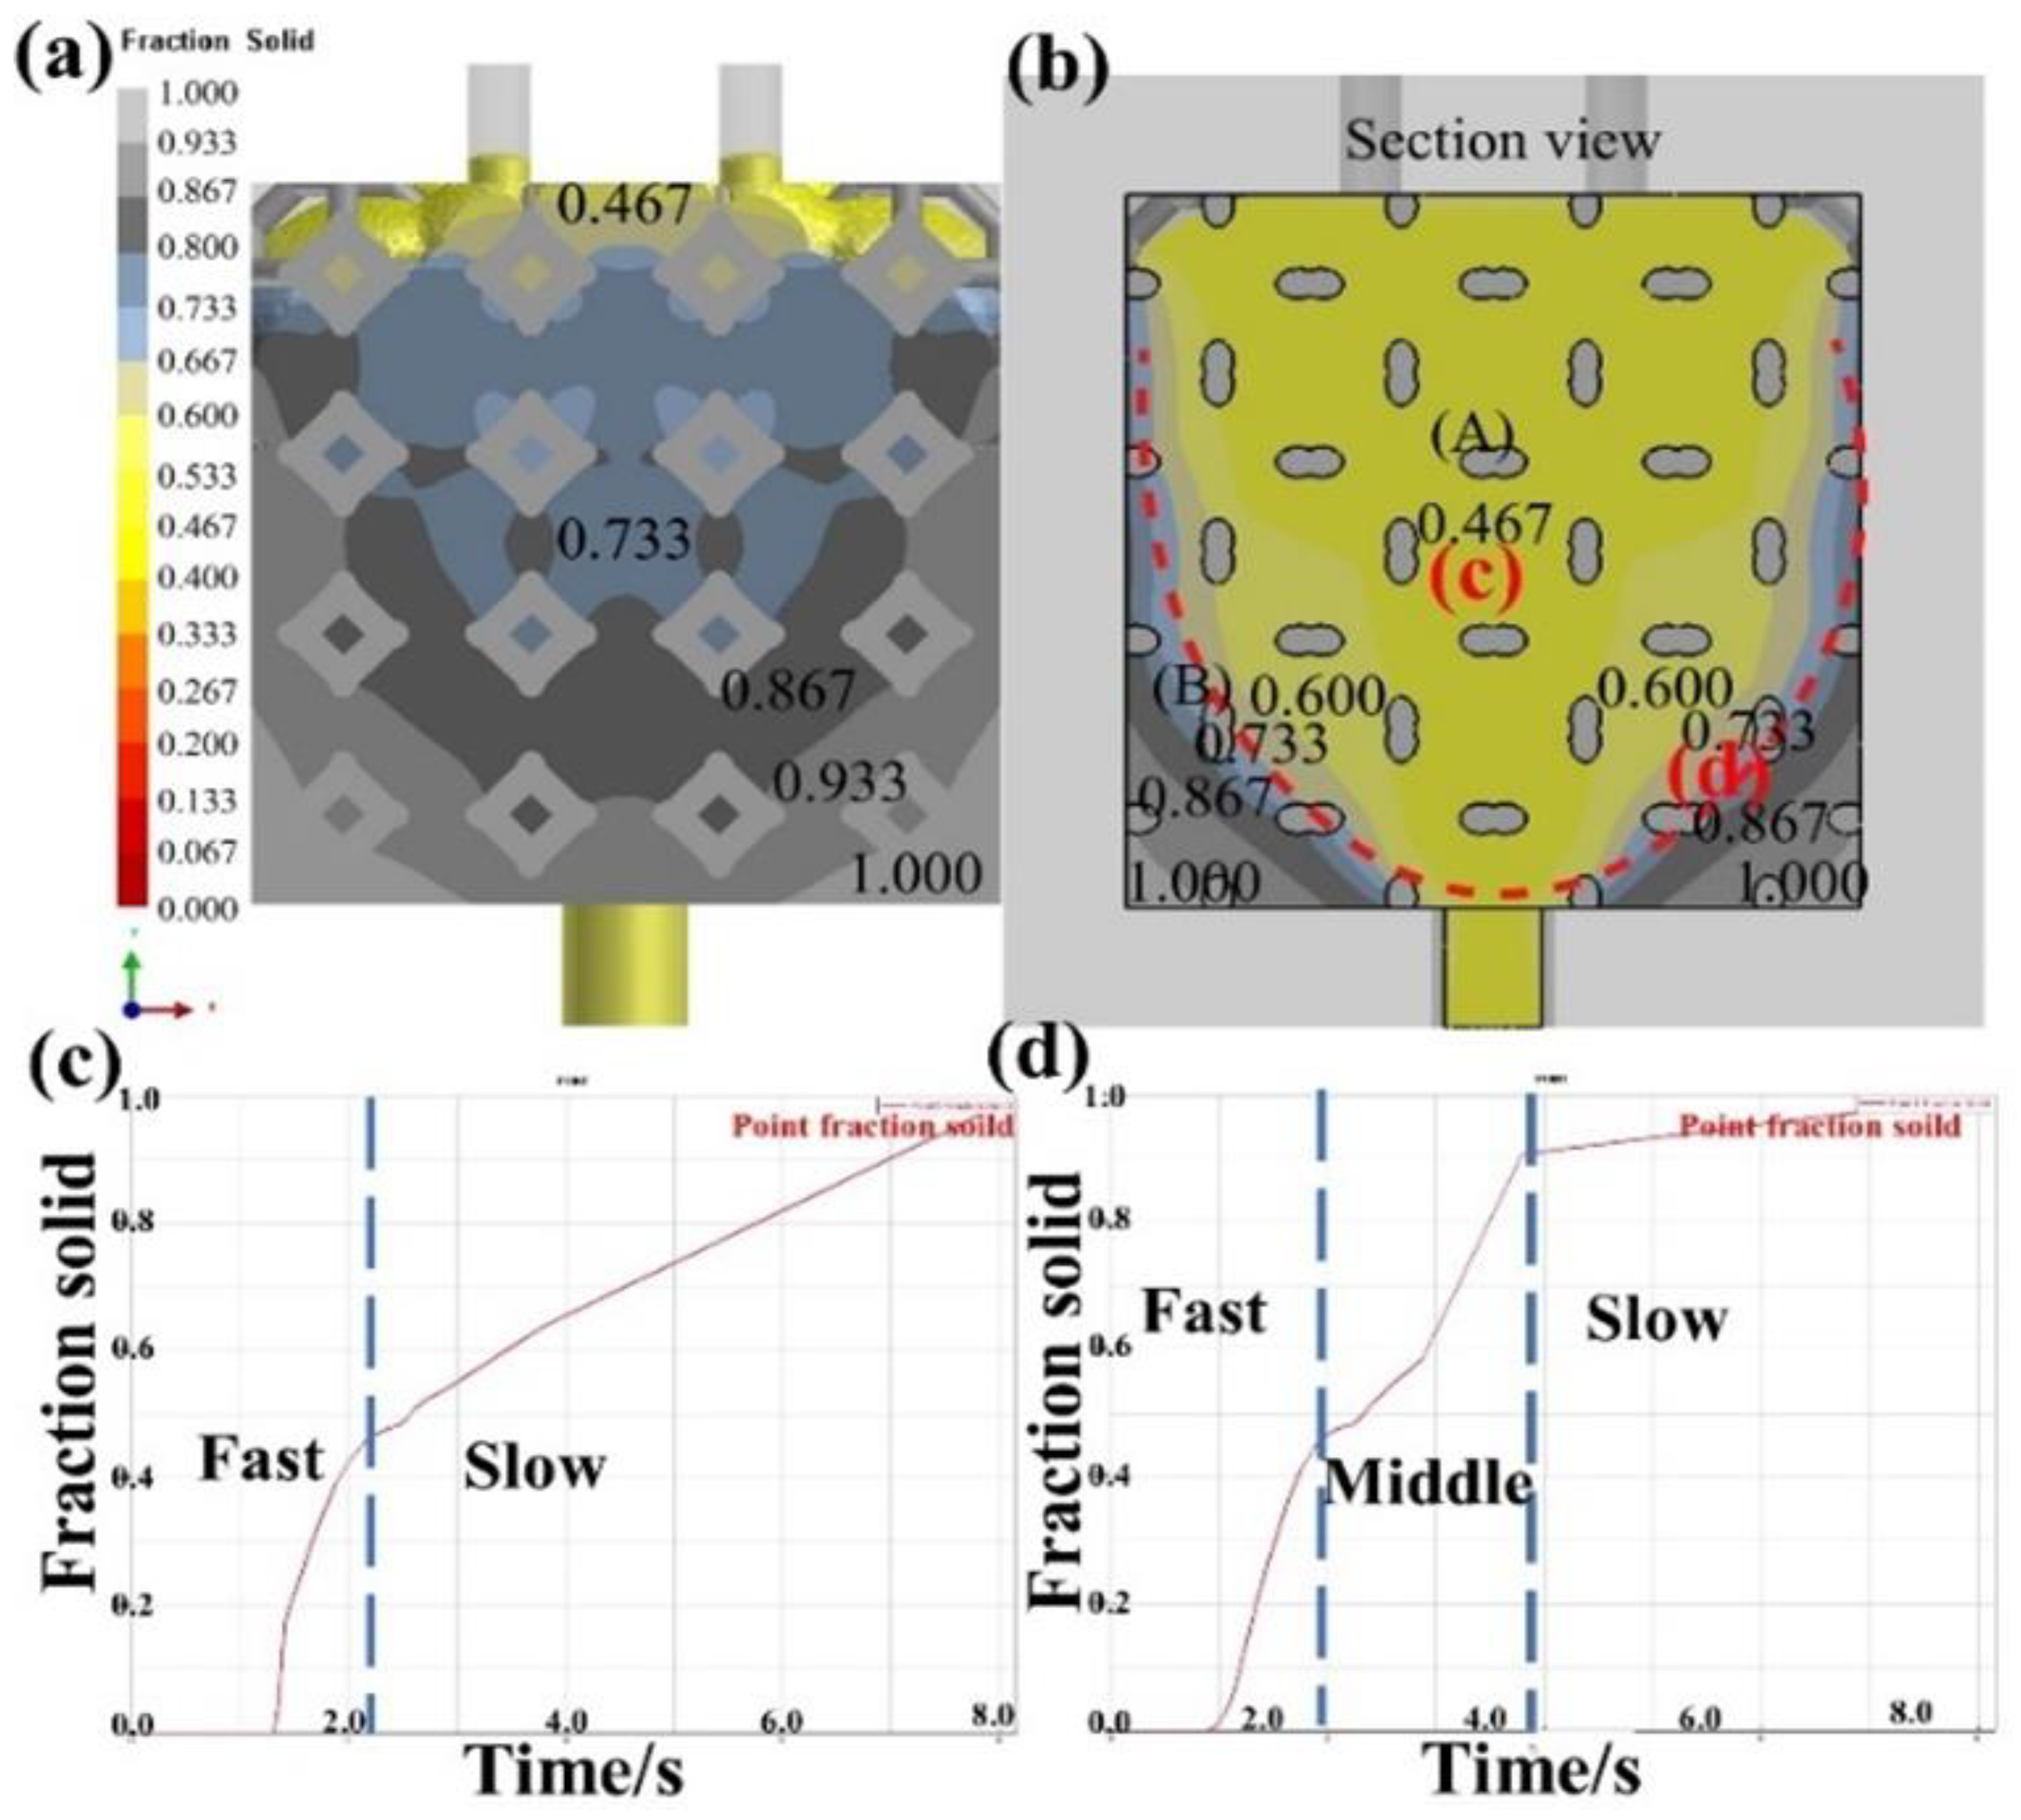
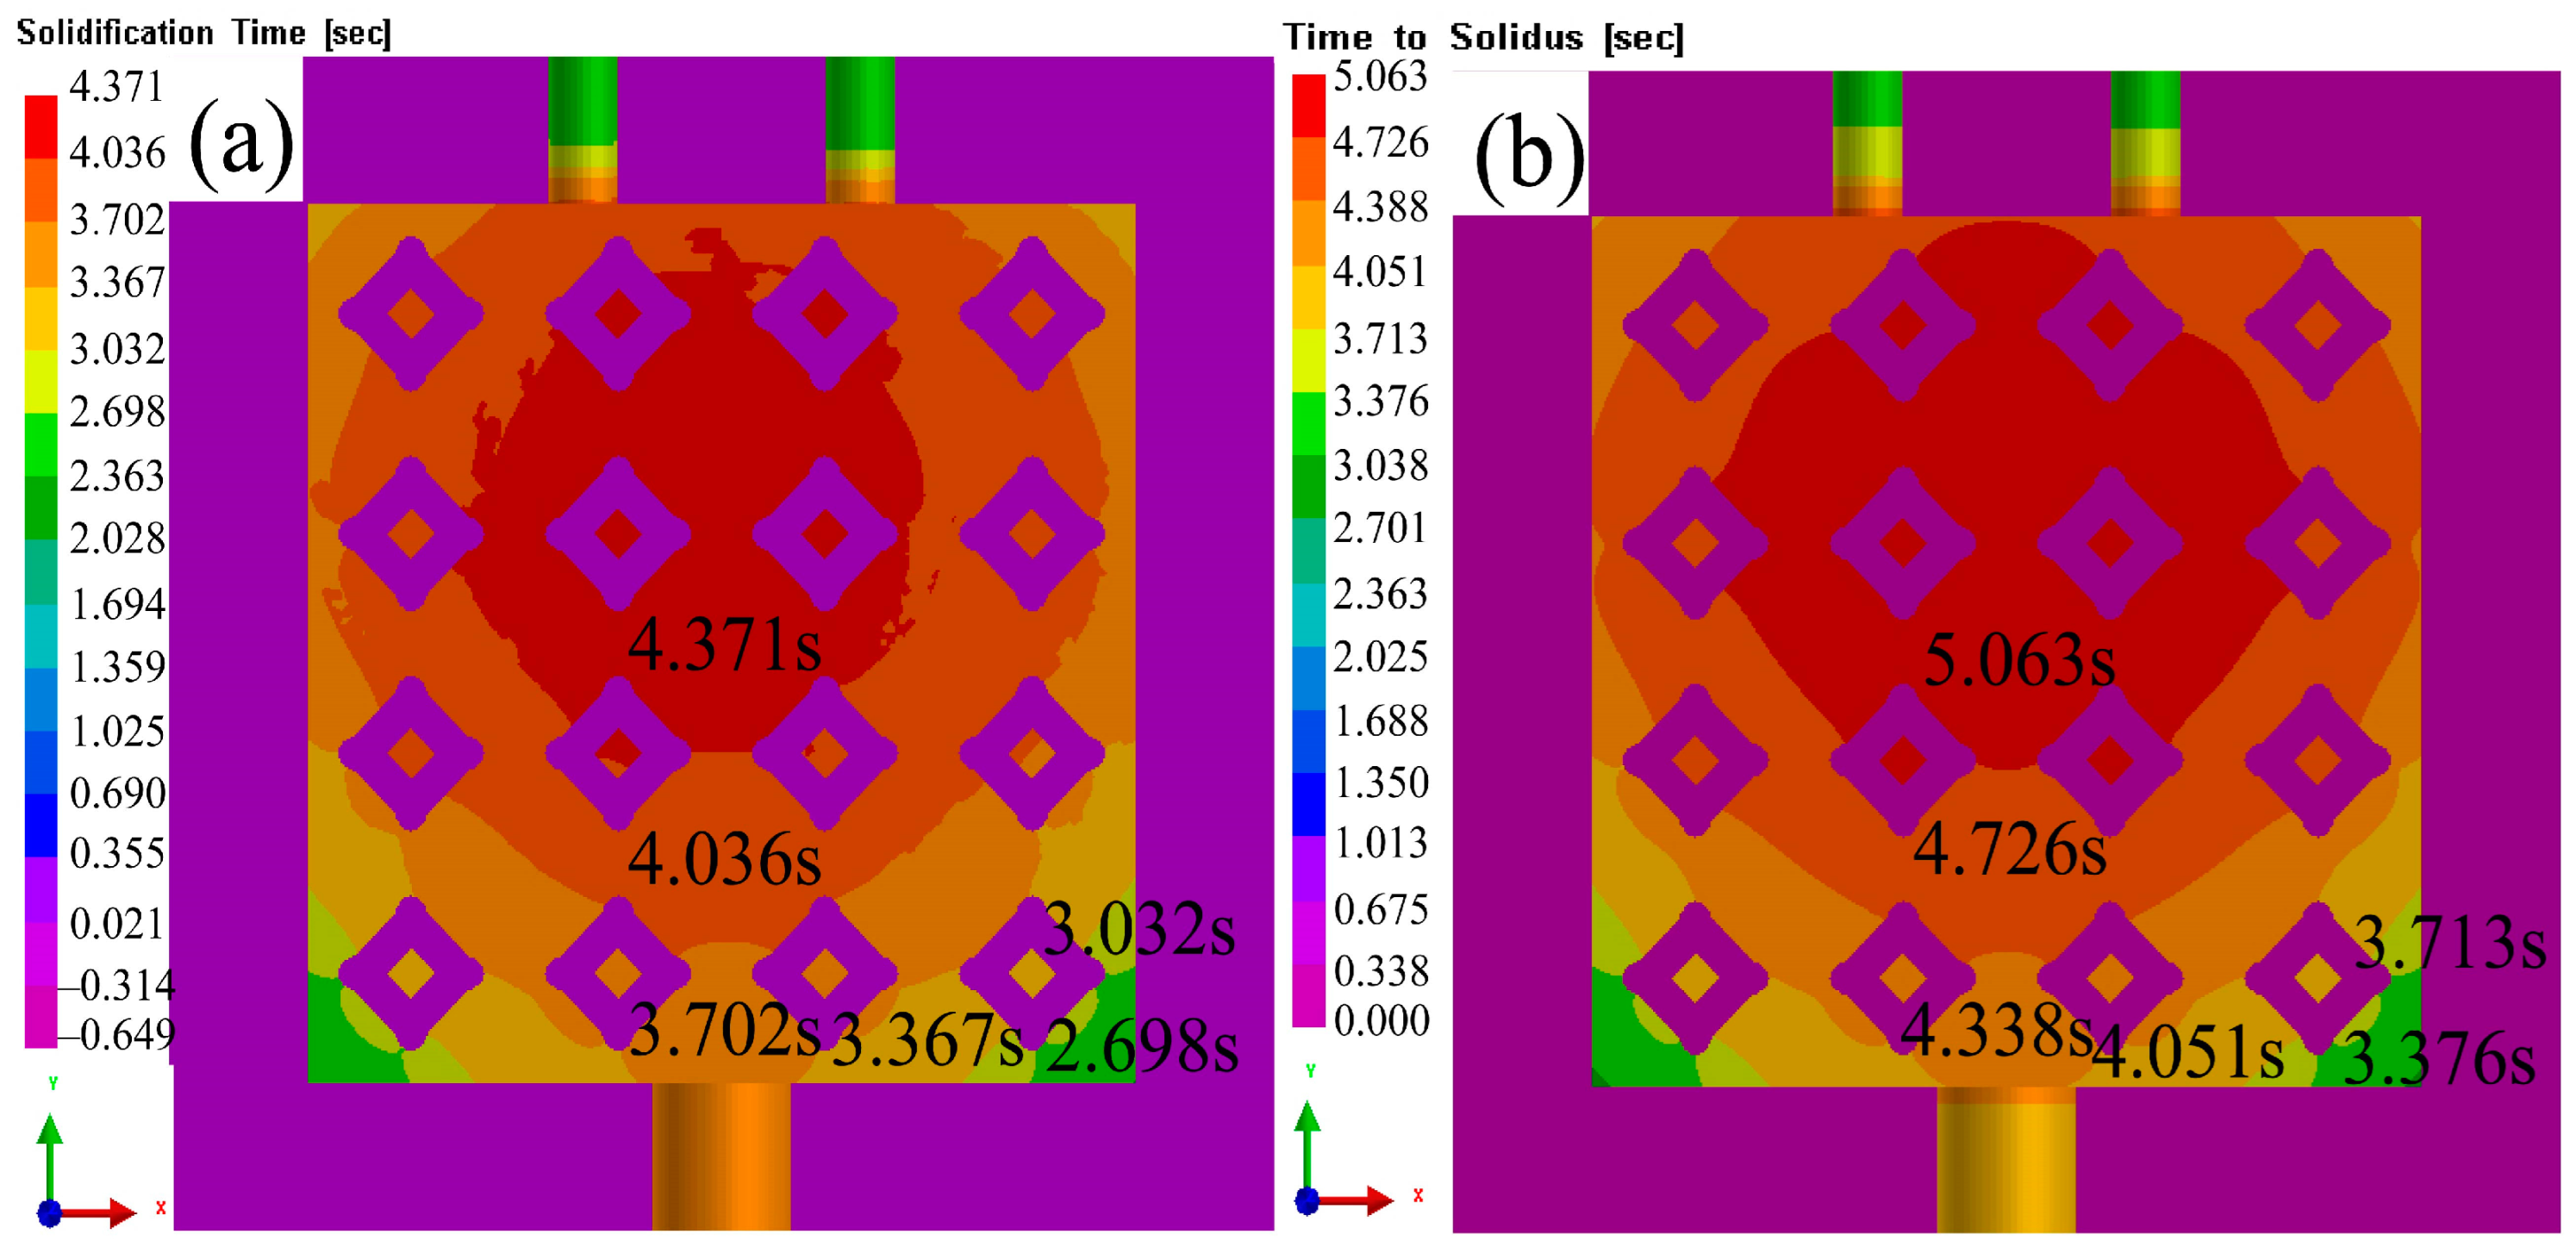
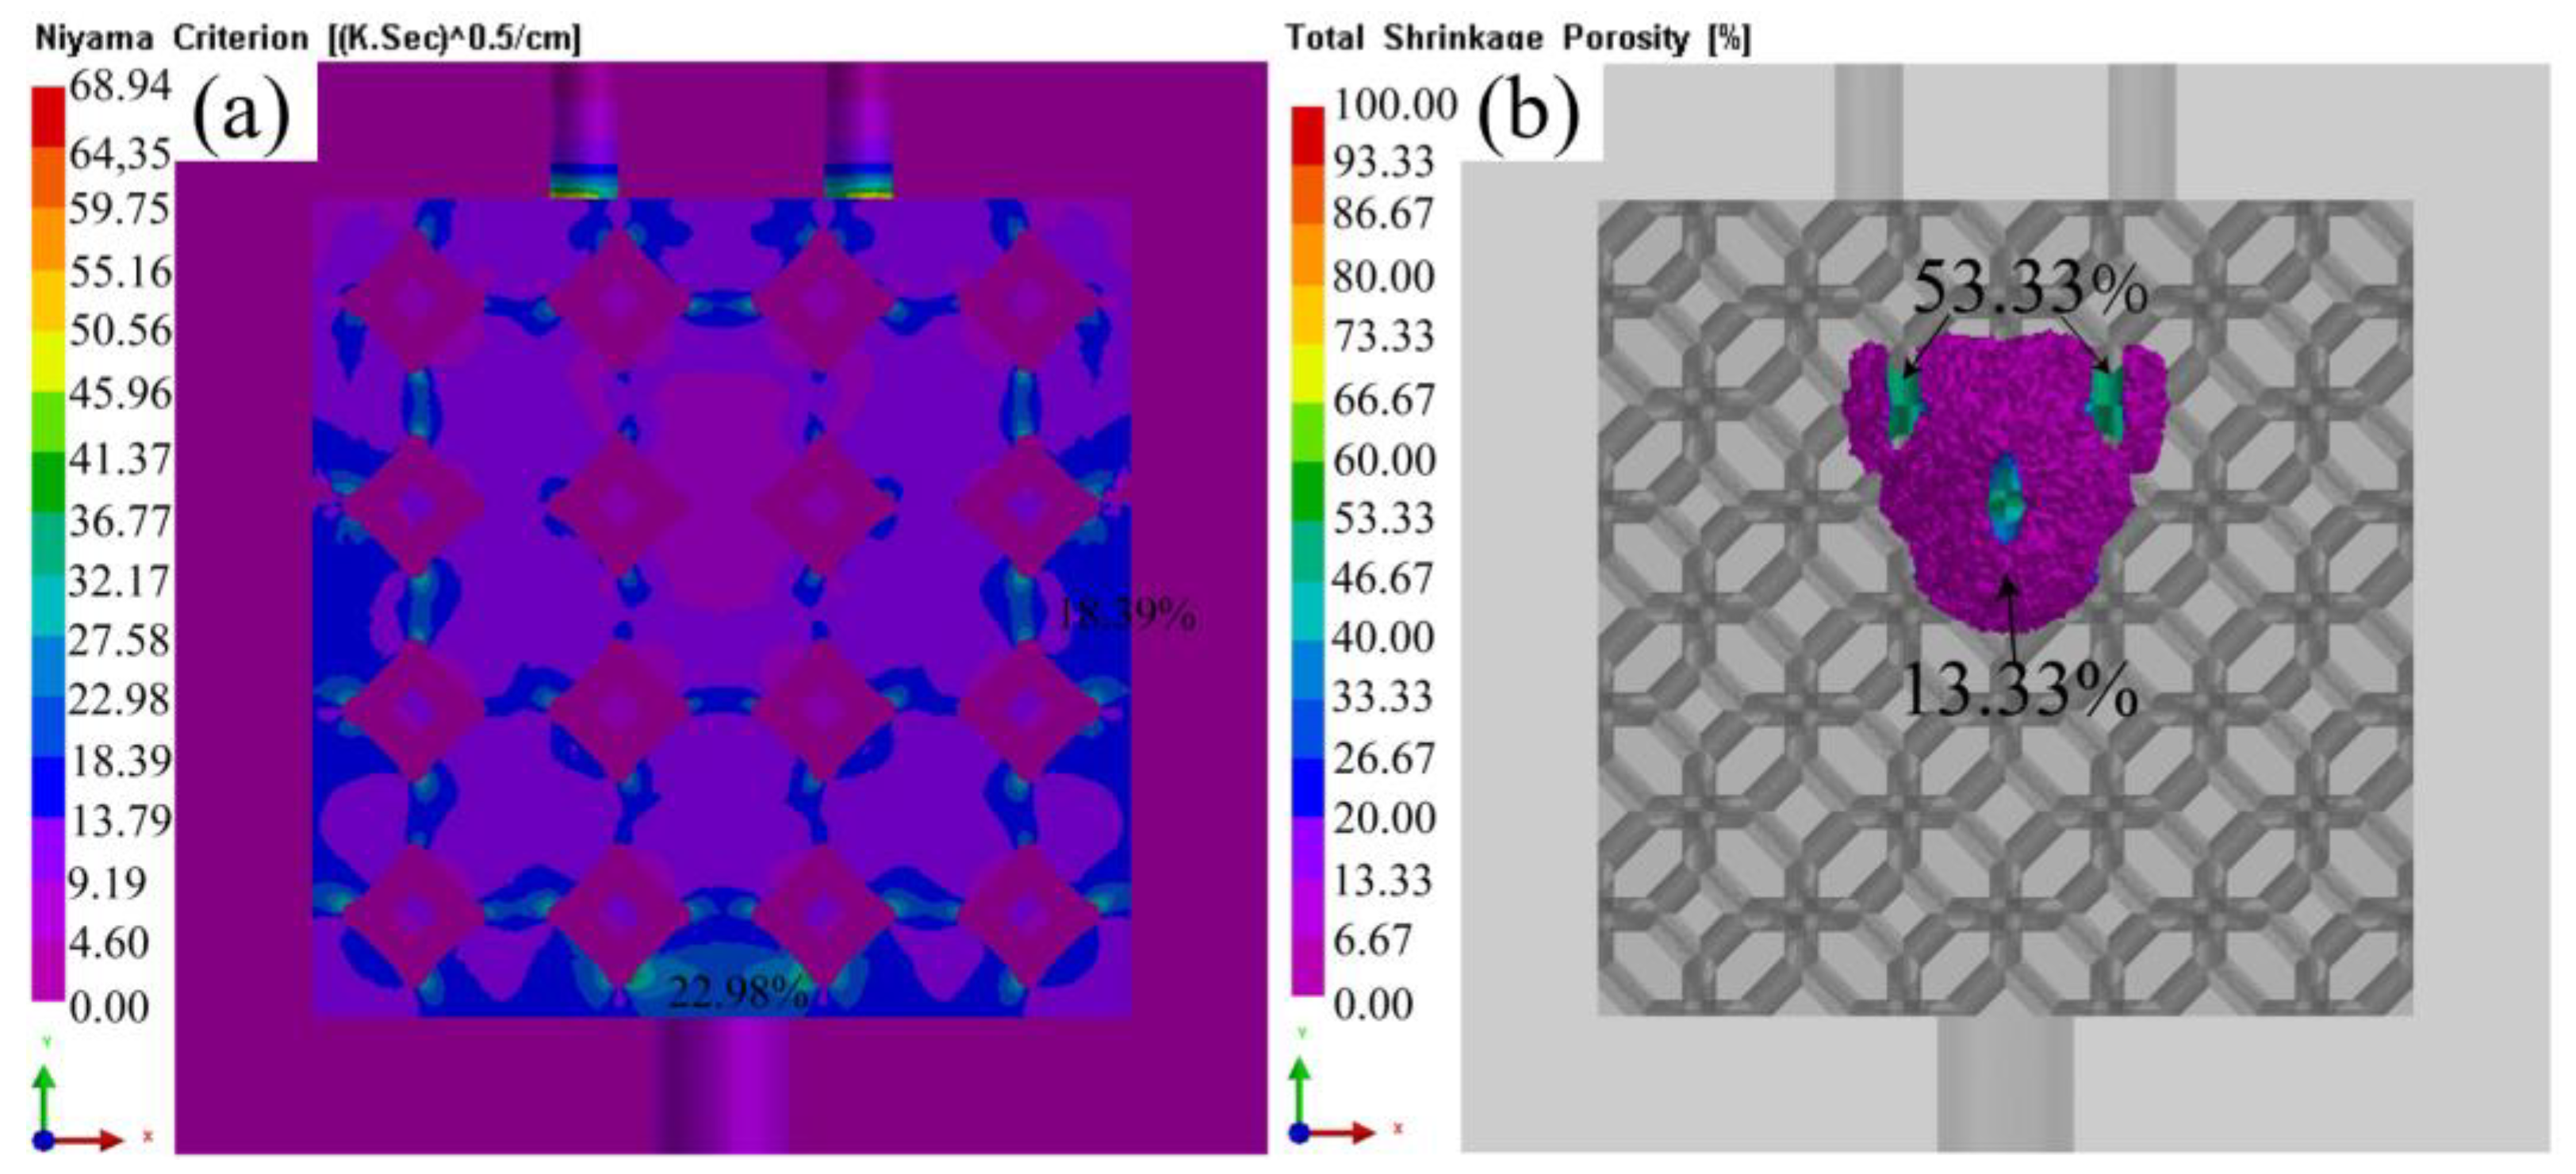
4.4. Solidification Process
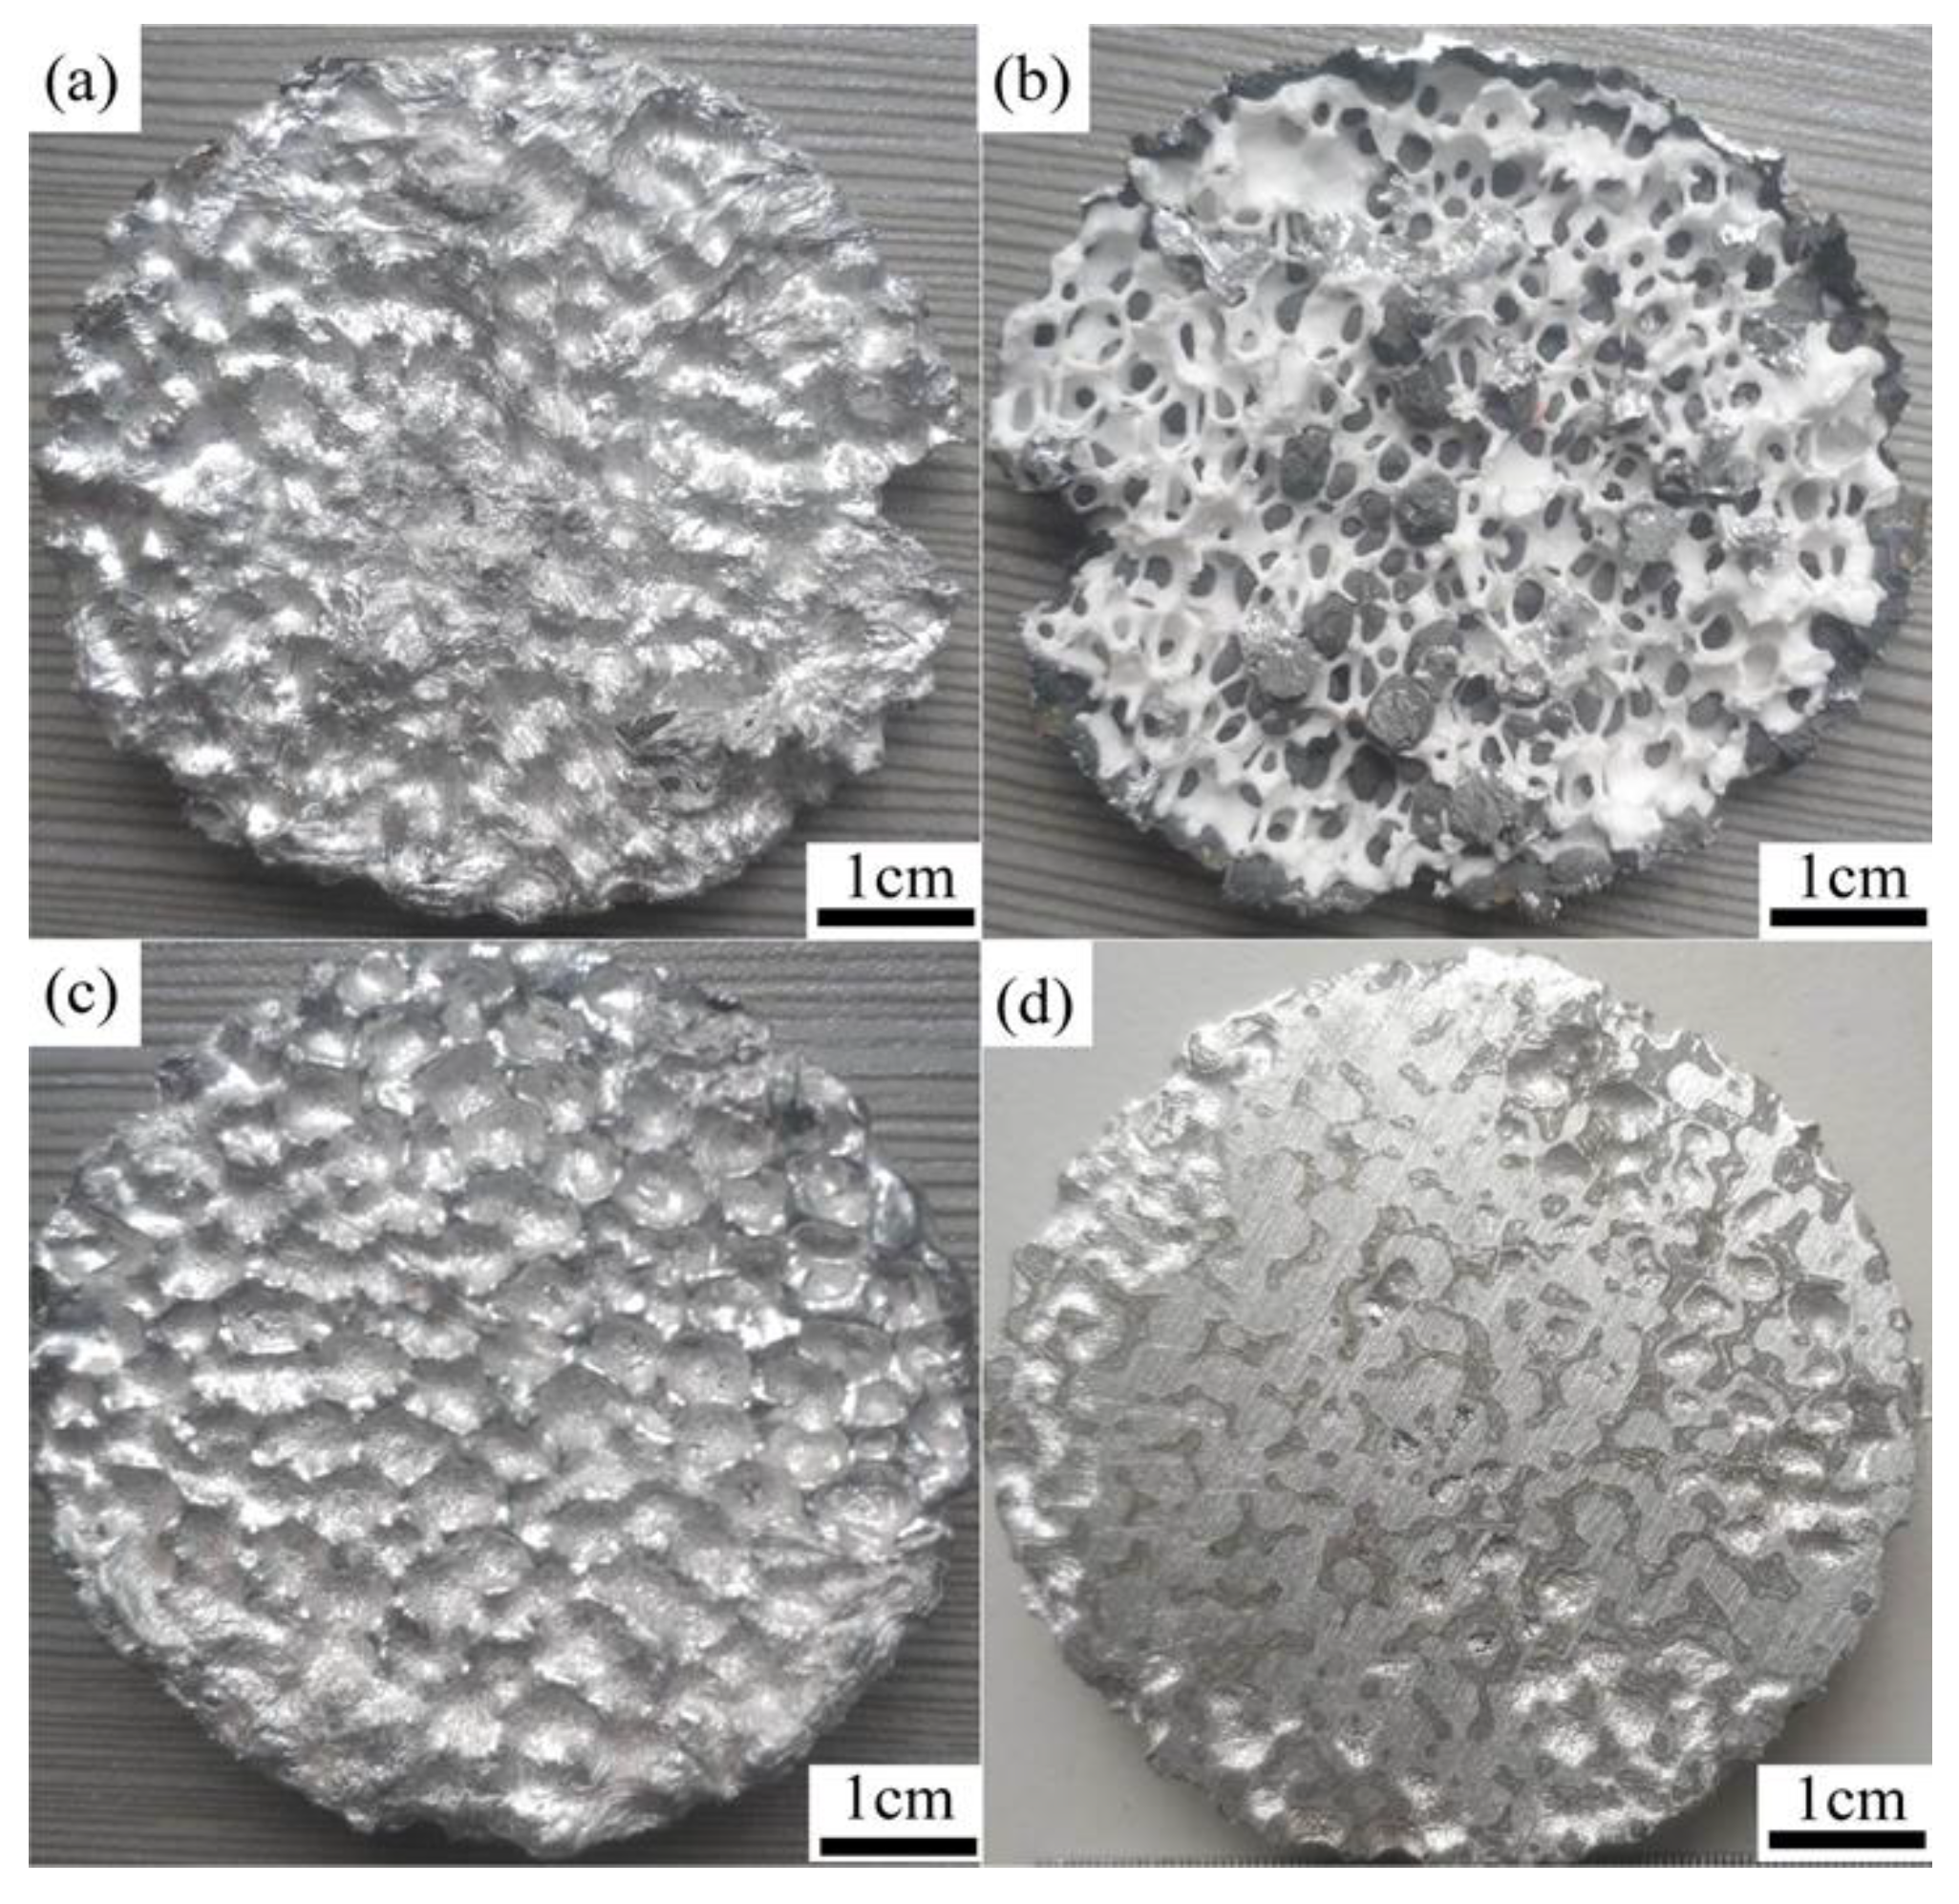
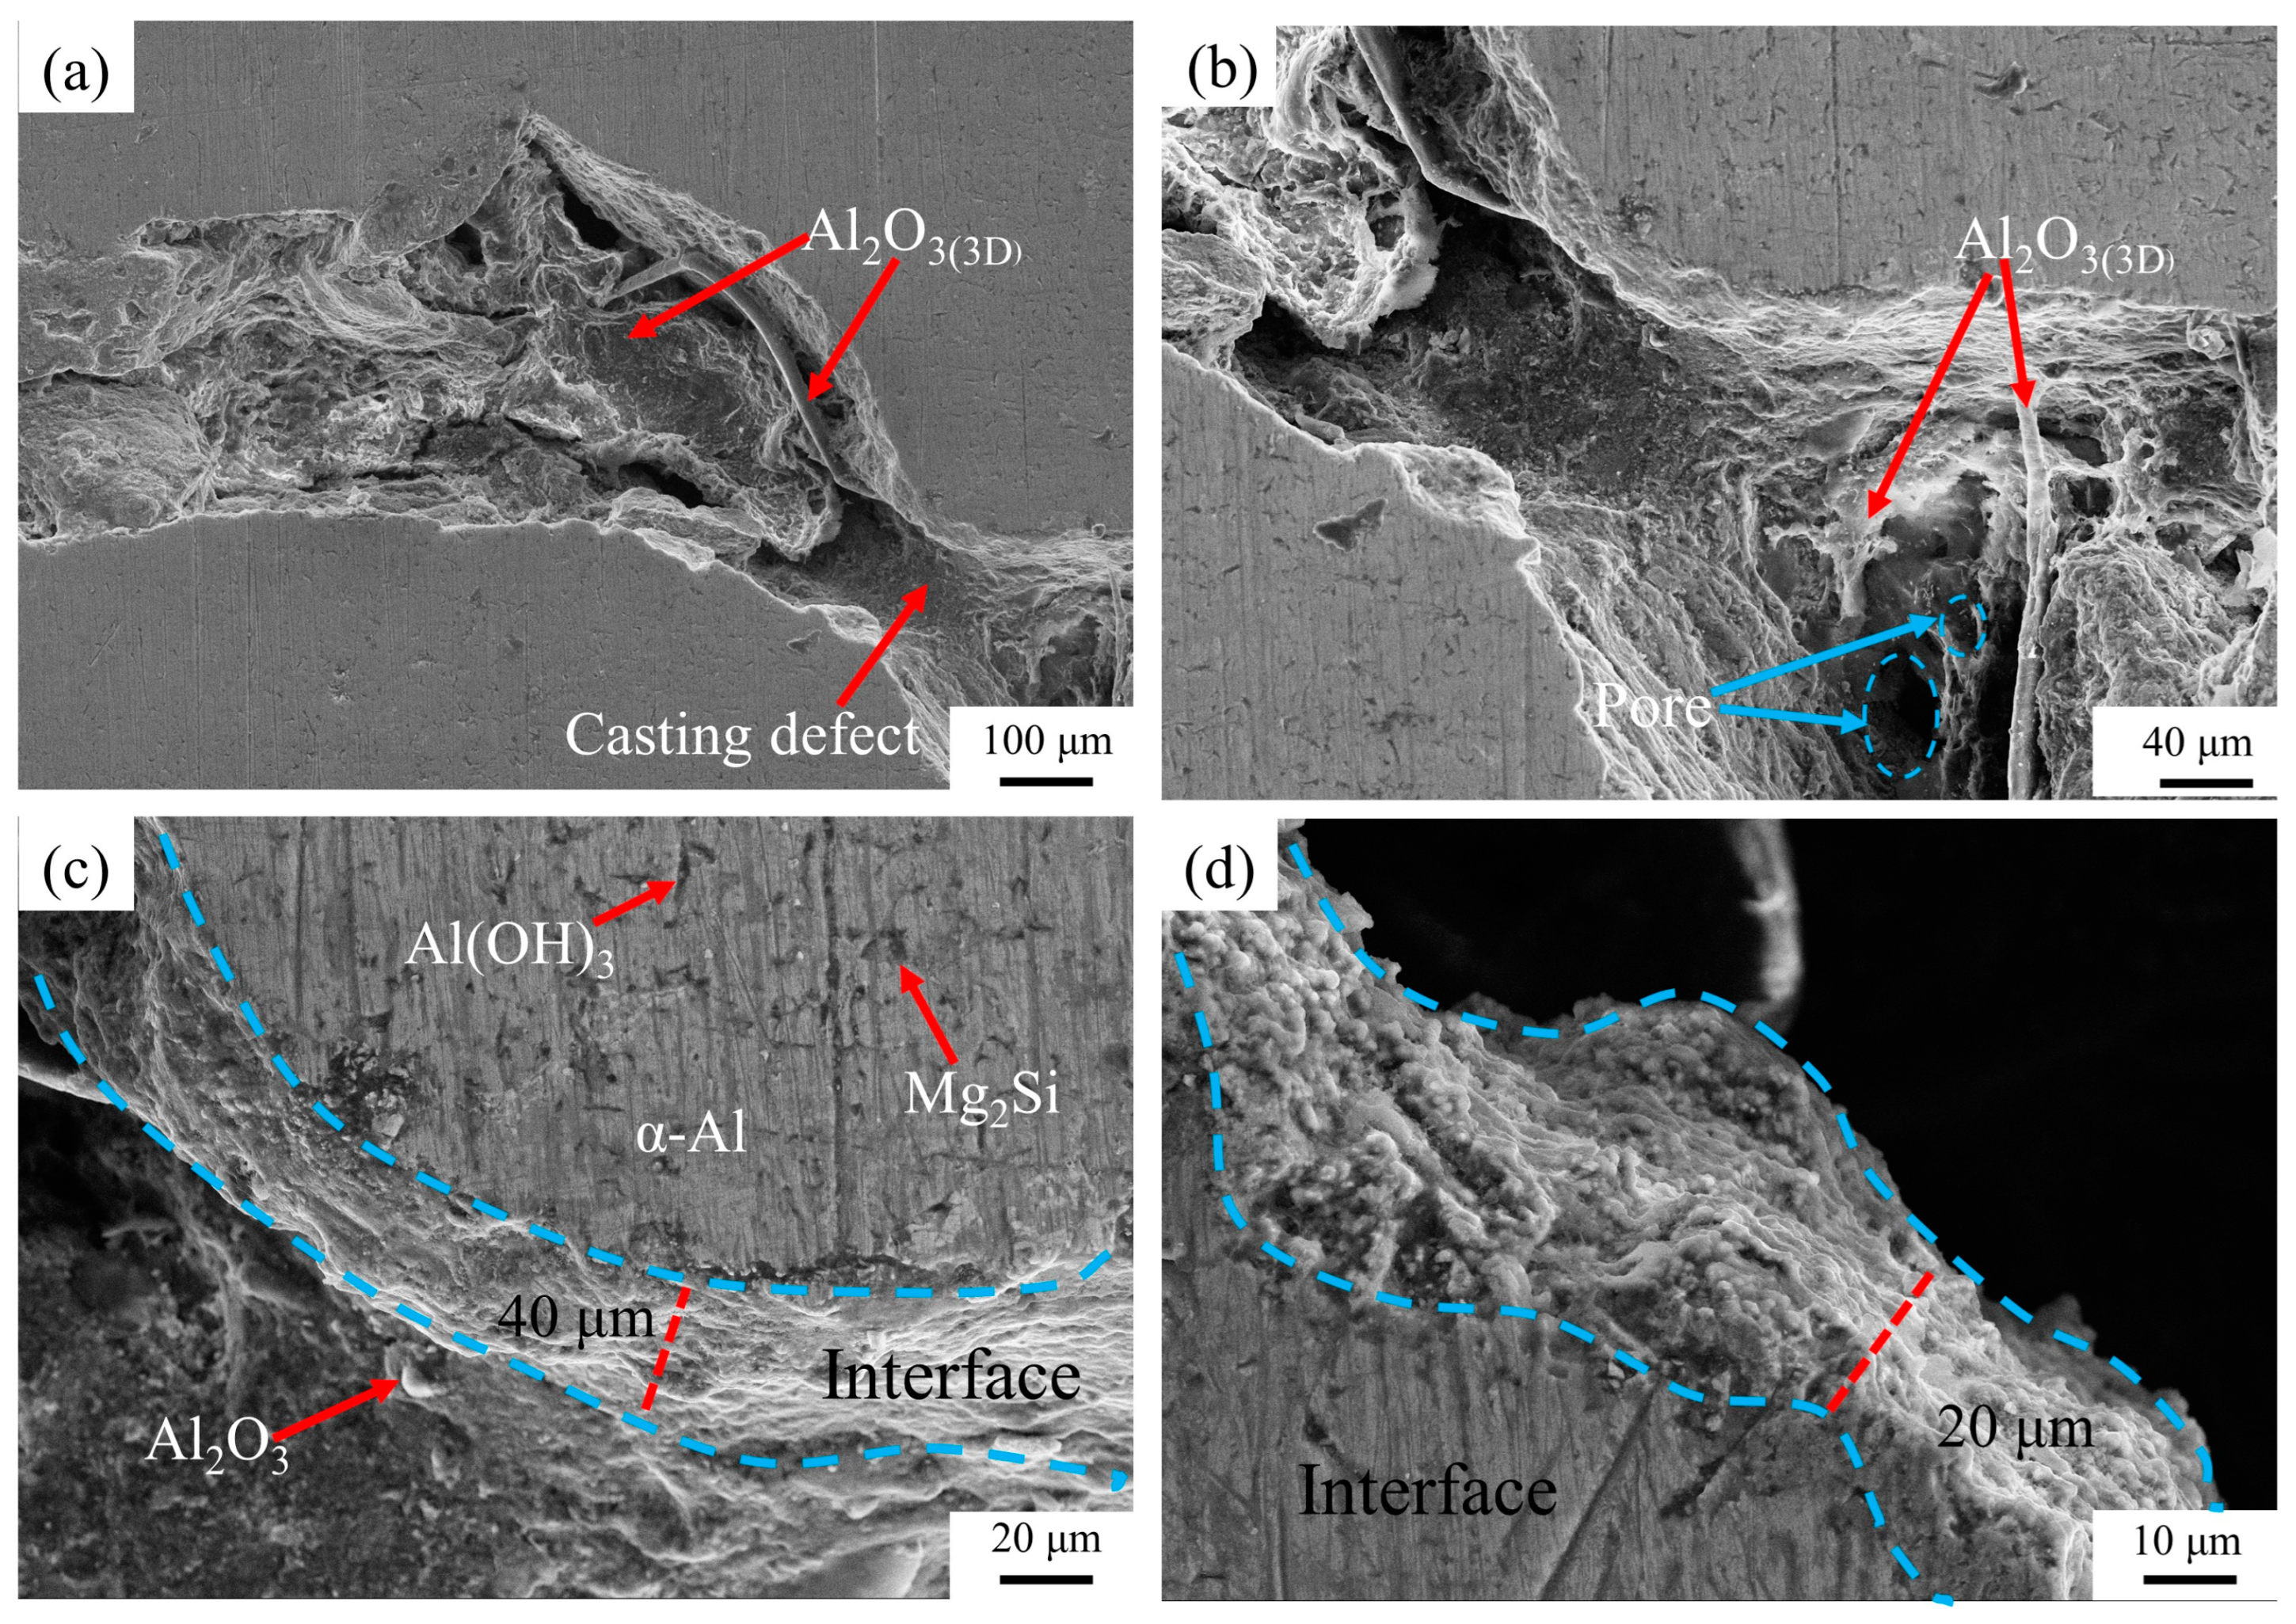
4.5. IPC Casting Process
5. Conclusions
Author Contributions
Funding
Institutional Review Board Statement
Informed Consent Statement
Data Availability Statement
Conflicts of Interest
References
- Kota, N.; Charan, M.S.; Laha, T.; Roy, S. Review on development of metal/ceramic interpenetrating phase composites and critical analysis of their properties. Ceram. Int. 2022, 48, 1451–1483. [Google Scholar]
- Jiang, L.; Jiang, Y.; Yu, L.; Yang, H.; Li, Z.; Ding, Y. Thermo-Mechanical Coupling Analyses for Al Alloy Brake Discs with Al2O3-SiC(3D)/Al Alloy Composite Wear-Resisting Surface Layer for High-Speed Trains. Materials 2019, 12, 3155. [Google Scholar] [PubMed]
- Yu, L.; Hao, S.; Nong, X.; Cao, X.; Zhang, C.; Liu, Y.; Yan, Y.; Jiang, Y. Comparative Study on the Corrosion Resistance of 6061Al and SiC(3D)/6061Al Composite in a Chloride Environment. Materials 2021, 14, 7730. [Google Scholar]
- Schukraft, J.; Horny, D.; Schulz, K.; Weidenmann,K. A. 3D modeling and experimental investigation on the damage behavior of an interpenetrating metal ceramic composite (IMCC) under compression. Mater Sci. Eng. A. 2022, 844, 143147. [Google Scholar]
- Zhao, D.; Haijun, S.; Liu, Y.; Shen, Z.; Liu, H.; Guo, Y.; Li, X.; Dong, D.; Jiang, H.; Liu, C.; et al. Ultrahigh-Strength Porous Ceramic Composites via a Simple Directional Solidification Process. Nano Lett. 2022, 22, 2405–2411. [Google Scholar]
- Etemadi, R.; Wang, B.; Pillai, K.M.; Niroumand, B.; Omrani, E.; Rohatgi, P. Pressure infiltration processes to synthesize metal matrix composites—A review of metal matrix composites, the technology and process simulation. Mater. Manuf. Process. 2018, 33, 1261–1290. [Google Scholar]
- da Silva, C.C.; Volpato, G.M.; Fredel, M.C.; Tetzlaff, U. Low-pressure processing and microstructural evaluation of unidirectional carbon fiber-reinforced aluminum-nickel matrix composites. J. Mater. Process.Tech. 2019, 269, 10–15. [Google Scholar]
- Akbarnejad, S.; Tilliander, A.; Sheng, D.-Y.; Jönsson, P.G. Effect of Batch Dissimilarity on Permeability of Stacked Ceramic Foam Filters and Incompressible Fluid Flow: Experimental and Numerical Investigation. Metals 2022, 12, 1001. [Google Scholar]
- Du, J.; Chong, X.; Jiang, Y.; Feng, J. Numerical simulation of mold filling process for high chromium cast iron matrix composite reinforced by ZTA ceramic particles. Int. J. Heat Mass Trans. 2015, 89, 872–883. [Google Scholar]
- Chang, C.-Y. Numerical simulation of the pressure infiltration of fibrous preforms during MMC processing. Adv. Compos. Mater. 2006, 15, 287–300. [Google Scholar]
- Chang, C.-Y. Simulation of molten metal through a unidirectional fibrous preform during MMC processing. J. Mater. Process. Tech. 2009, 209, 4337–4342. [Google Scholar]
- Guan, J.T.; Qi, L.H.; Jian, L.I.U.; Zhou, J.M.; Wei, X.L. Threshold pressure and infiltration behavior of liquid metal into fibrous preform. Trans. Nonferrous Met. Soc. China 2013, 23, 3173–3179. [Google Scholar]
- Regulski, W.; Szumbarski, J.; Łaniewski-Wołłk, Ł.; Gumowski, K.; Skibiński, J.; Wichrowski, M.; Wejrzanowski, T. Pressure drop in flow across ceramic foams—A numerical and experimental study. Chem. Eng. Sci. 2015, 137, 320–337. [Google Scholar]
- Zabaras, N.; Samanta, D. A stabilized volume-averaging for flow in porous media and binary alloy solidification processes. Int. J. Numer. Meth. Eng. 2004, 60, 1103–1138. [Google Scholar] [CrossRef]
- Wehinger, G.D.; Heitmann, H.; Kraume, M. An artificial structure modeler for 3D CFD simulations of catalytic foams. Chem. Eng. J. 2016, 284, 543–556. [Google Scholar]
- Nie, Z.; Lin, Y.; Tong, Q. Numerical investigation of pressure drop and heat transfer through open cell foams with 3D Laguerre-Voronoi model. Int. J. Heat Mass. Trans. 2017, 113, 819–839. [Google Scholar]
- Buonomo, B.; di Pasqua, A.; Manca, O.; Nappo, S.; Nardini, S. Entropy generation analysis of laminar forced convection with nanofluids at pore length scale in porous structures with Kelvin cells. Int. Commun. Heat Mass. Trans. 2022, 132, 105883. [Google Scholar]
- Li, Y.; Yang, B.; Zhang, M.; Wang, H.; Gong, W.; Lai, R.; Li, Y.; Teng, J. The corrosion behavior and mechanical properties of 5083Al-Mg alloy manufactured by additive friction stir deposition. Corros. Sci. 2023, 213, 110972. [Google Scholar]
- Nkoua, C.; Josse, C.; Proietti, A.; Basseguy, R.; Blanc, C. Corrosion behaviour of the microbially modified surface of 5083Aluminium alloy. Corros.Sci. 2023, 210, 110812. [Google Scholar]
- Yu, L.; Zhang, C.; Liu, Y.; Yan, Y.; Xu, P.; Jiang, Y.; Cao, X. Comparing the Corrosion Resistance of 5083Al and Al2O33D/5083Al Composite in a Chloride Environment. Materials 2022, 16, 86. [Google Scholar] [CrossRef] [PubMed]
- Buonomo, B.; Pasqua, A.D.; Manca, O.; Sekrani, G.; Poncet, S. Numerical Analysis on Pressure Drop and Heat Transfer in Nanofluids at Pore Length Scale in Open Metal Porous Structures with Kelvin Cells. Heat Trans. Eng. 2020, 42, 1614–1624. [Google Scholar]
- Dong, C. Numerical Simulation of Metal Melt Flows in Mold Cavity with Ceramic Porous Media. Ceram-Silik. 2016, 60, 129–135. [Google Scholar] [CrossRef]
- Lu, S.-L.; Xiao, F.-R.; Zhang, S.-J.; Mao, Y.-W.; Liao, B. Simulation study on the centrifugal casting wet-type cylinder liner based on ProCAST. Appl. Therm. Eng. 2014, 73, 512–521. [Google Scholar]
- Liu, L.-B.; Hu, C.-H.; Zhang, Y.-H.; Song, C.-J.; Zhai, Q.-J. Melt flow, solidification structures, and defects in 316 L steel strips produced by vertical centrifugal casting. Adv.Manuf. 2023. [Google Scholar]
- Hammel, E.C.; Ighodaro, O.L.R.; Okoli, O.I. Processing and properties of advanced porous ceramics: An application based review. Ceram. Int. 2014, 40, 15351–15370. [Google Scholar]
- Zhang, S.; Zhu, M.; Zhao, X.; Xiong, D.; Wan, H.; Bai, S.; Wang, X. A pore-scale, two-phase numerical model for describing the infiltration behaviour of SiC p /Al composites. Compos. Part A Appl. Sci. Manuf. 2016, 90, 71–81. [Google Scholar]
- Prakash, S.A.; Hariharan, C.; Arivazhagan, R.; Sheeja, R.; Raj, V.A.A.; Velraj, R. Review on numerical algorithms for melting and solidification studies and their implementation in general purpose computational fluid dynamic software. J. Energy Storage 2021, 36, 102341. [Google Scholar]
- Kaur, I.; Singh, P. Numerical investigation on conjugate heat transfer in octet-shape-based single unit cell thick metal foam. Int. Commun. Heat Mass Transf. 2021, 121, 105090. [Google Scholar]
- Guo, X.; Liu, R.; Wang, J.; Shuai, S.; Xiong, D.; Bai, S.; Zhang, N.; Gong, X.; Wang, X. 3D actual microstructure-based modeling of non-isothermal infiltration behavior and void formation in liquid composite molding. Appl. Math. Model. 2021, 94, 388–402. [Google Scholar]
- Lacoste, E.; Arvieu, C.; Mantaux, O. Numerical Modeling of Fiber-Reinforced Metal Matrix Composite Processing by the Liquid Route: Literature Contribution. Metall. Mater. Trans. B. 2018, 49, 831–838. [Google Scholar]
- Nong, X.D.; Jiang, Y.L.; Fang, M.; Yu, L.; Liu, C.Y. Numerical analysis of novel SiC3D/Al alloy co-continuous composites ventilated brake disc. Int. J. Heat Mass.Trans. 2017, 108, 1374–1382. [Google Scholar]
- Xue, L.; Wang, F.; Ma, Z.; Wang, Y. Effects of surface-oxidation modification and heat treatment on silicon carbide 3D/AlCu 5 MgTi composites during vacuum-pressure infiltration. Appl. Surf. Sci. 2015, 356, 795–803. [Google Scholar]
- Ma, X.; Zhao, Y.F.; Tian, W.J.; Qian, Z.; Chen, H.W.; Wu, Y.Y.; Liu, X.F. A novel Al matrix composite reinforced by nano-AlN(p) network. Sci. Rep. 2016, 6, 34919. [Google Scholar] [CrossRef] [PubMed]
- Potoczek, M.; Śliwa, R. Microstructure and Physical Properties of AlMg/Al2O3 Interpenetrating Composites Fabricated by Metal Infiltration into Ceramic Foams. Arch. Metall. Mater. 2011, 56. [Google Scholar] [CrossRef]


| Elements | Si | Cu | Mg | Zn | Mn | Ti | Cr | Fe | Al |
|---|---|---|---|---|---|---|---|---|---|
| Wt.% | 0.4 | 0.03 | 4.5 | 0.27 | 0.50 | 0.15 | 0.07 | 0.15 | Balance |
| Volumes | Initial Temperature/°C | Boundary | HTC/ (W·m−2·°C−1) |
|---|---|---|---|
| graphite inlet graphite gate graphite mold liquid 5083Al Al2O3(3D) RPC | 250 250 250 740, 760, 800 540 | graphite inlet & graphite gate liquid 5083Al & graphite mould liquid 5083Al & graphite inlet and gate liquid 5083Al & Al2O3(3D) RPC | EQUIV 1416 1000 480 |
Disclaimer/Publisher’s Note: The statements, opinions and data contained in all publications are solely those of the individual author(s) and contributor(s) and not of MDPI and/or the editor(s). MDPI and/or the editor(s) disclaim responsibility for any injury to people or property resulting from any ideas, methods, instructions or products referred to in the content. |
© 2023 by the authors. Licensee MDPI, Basel, Switzerland. This article is an open access article distributed under the terms and conditions of the Creative Commons Attribution (CC BY) license (https://creativecommons.org/licenses/by/4.0/).
Share and Cite
Jiang, Y.; Xu, P.; Zhang, C.; Jin, F.; Li, Y.; Cao, X.; Yu, L. Simulation and Experimental of Infiltration and Solidification Process for Al2O3(3D)/5083Al Interpenetrating Phase Composite for High Speed Train Prepared by Low-Pressure Infiltration. Materials 2023, 16, 6634. https://doi.org/10.3390/ma16206634
Jiang Y, Xu P, Zhang C, Jin F, Li Y, Cao X, Yu L. Simulation and Experimental of Infiltration and Solidification Process for Al2O3(3D)/5083Al Interpenetrating Phase Composite for High Speed Train Prepared by Low-Pressure Infiltration. Materials. 2023; 16(20):6634. https://doi.org/10.3390/ma16206634
Chicago/Turabian StyleJiang, Yanli, Pianpian Xu, Chen Zhang, Fengjun Jin, Yichao Li, Xiuling Cao, and Liang Yu. 2023. "Simulation and Experimental of Infiltration and Solidification Process for Al2O3(3D)/5083Al Interpenetrating Phase Composite for High Speed Train Prepared by Low-Pressure Infiltration" Materials 16, no. 20: 6634. https://doi.org/10.3390/ma16206634
APA StyleJiang, Y., Xu, P., Zhang, C., Jin, F., Li, Y., Cao, X., & Yu, L. (2023). Simulation and Experimental of Infiltration and Solidification Process for Al2O3(3D)/5083Al Interpenetrating Phase Composite for High Speed Train Prepared by Low-Pressure Infiltration. Materials, 16(20), 6634. https://doi.org/10.3390/ma16206634