


Alternative Solid Activators from Waste Glass for One-Part Alkali-Activated Fly Ash/Red Mud Cements


 , ,
, , 
 and
and
Abstract
:1. Introduction
2. Materials and Methods
2.1. Materials
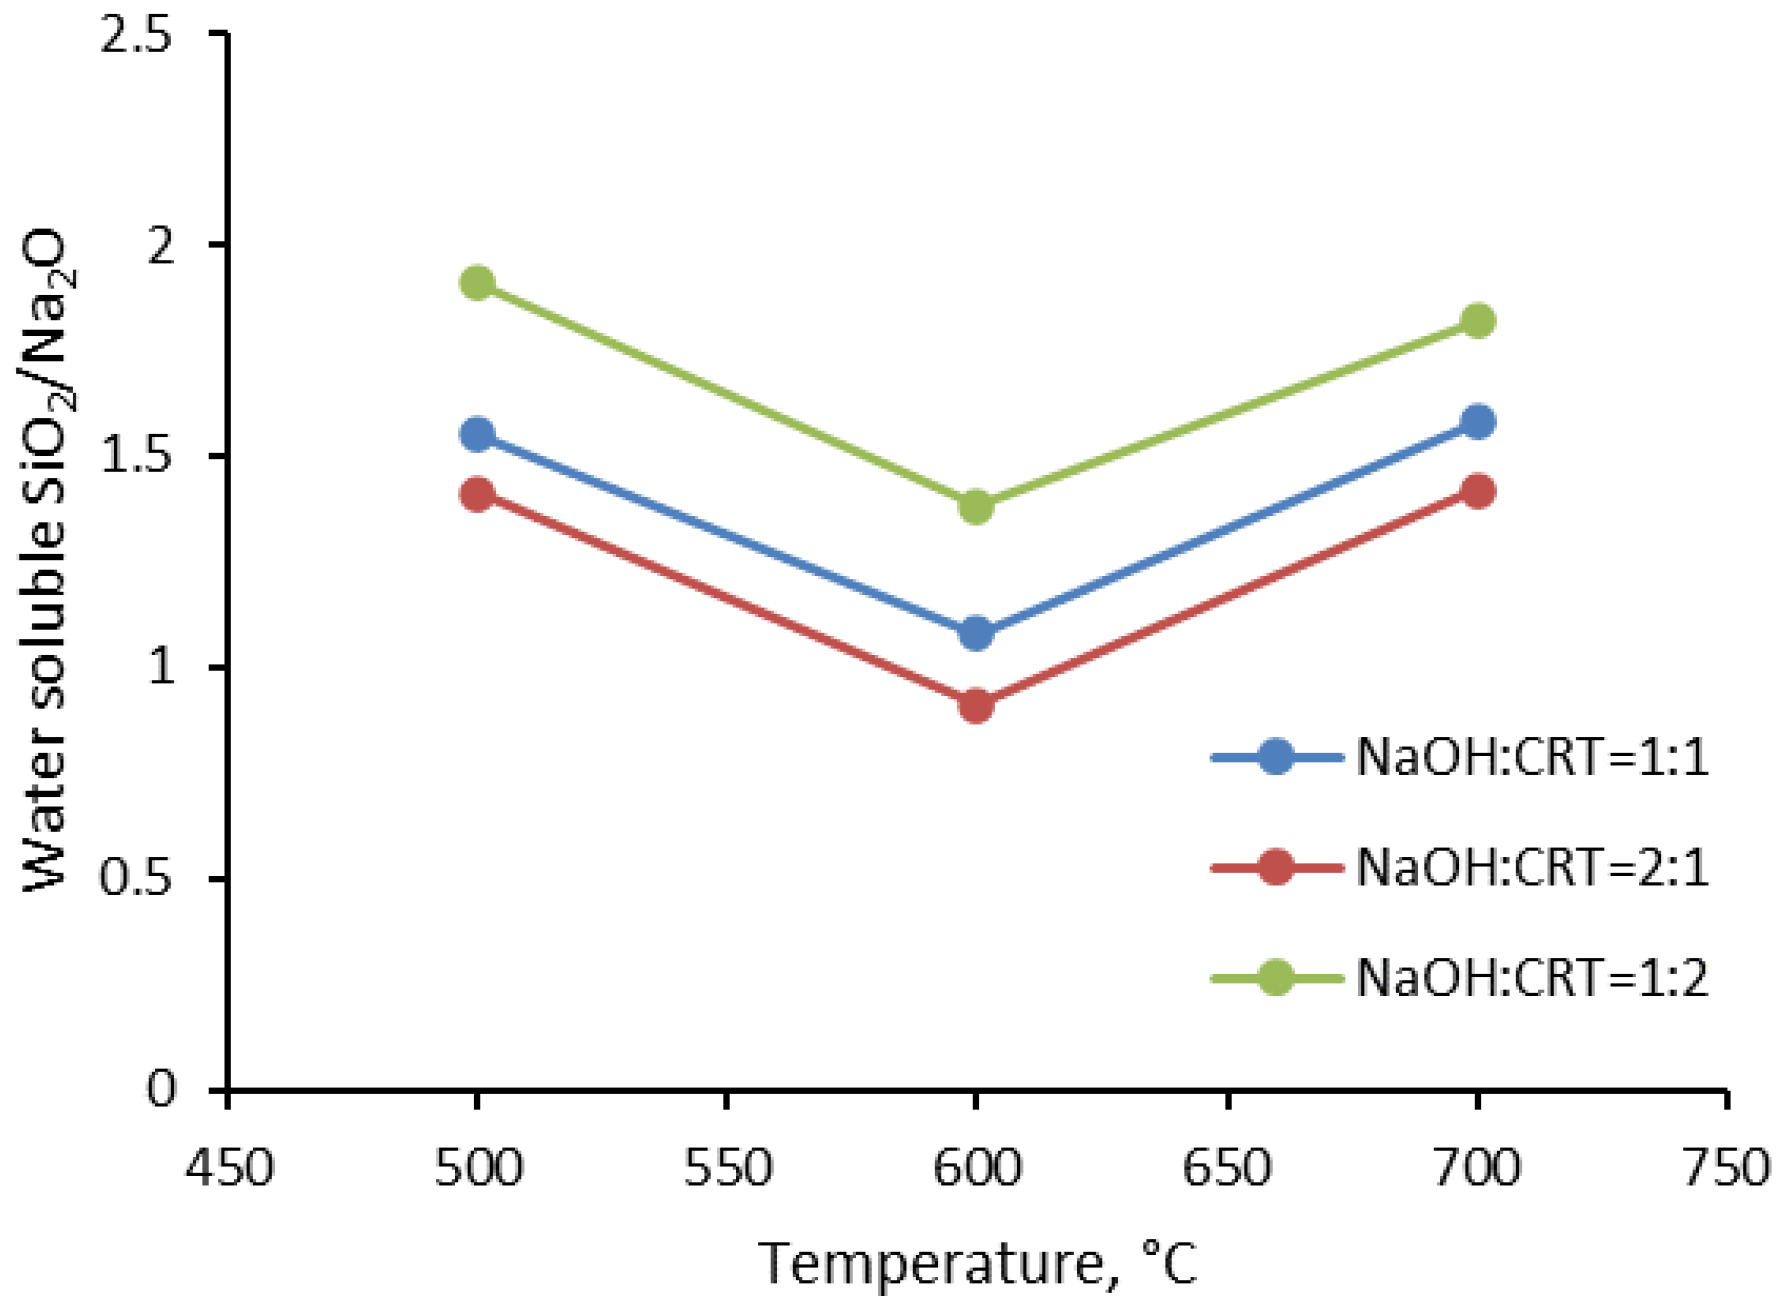
2.2. Solid Alkaline Activator Preparation
2.3. One-Part Alkali-Activated Fly Ash/Red Mud Cements Preparation
2.4. Characterization and Testing of Solid Alkaline Activators and One-Part Alkali-Activated Fly Ash/Red Mud Pastes
3. Results and Discussion
3.1. Physico-Chemical Characterization of Solid Activators
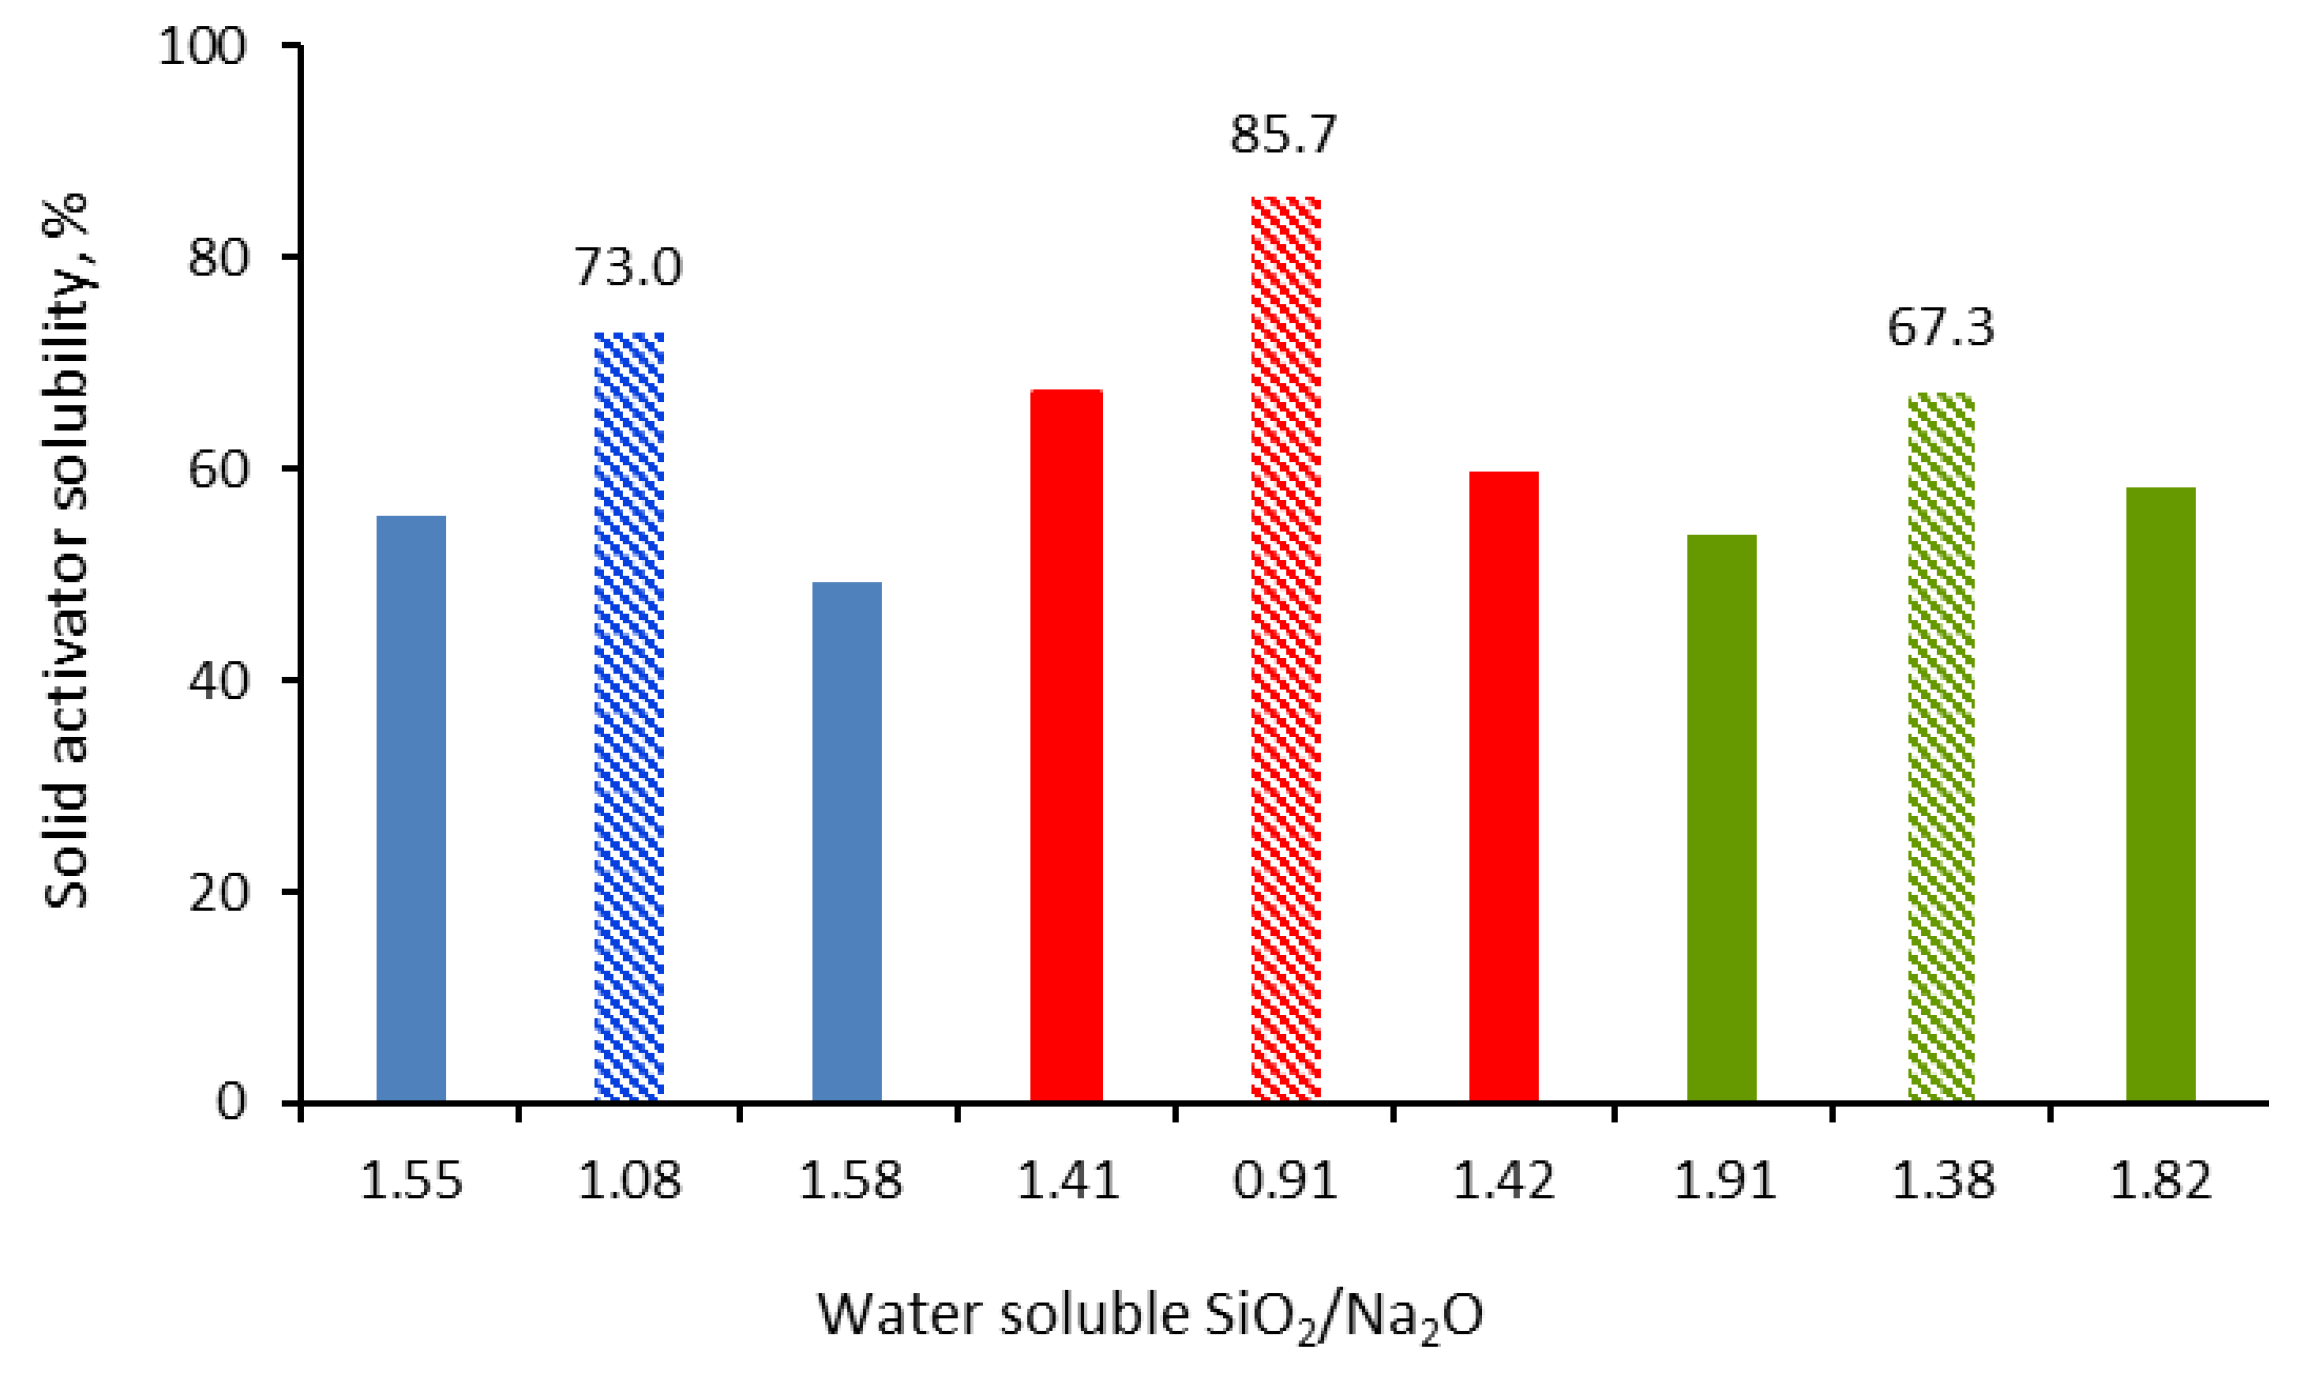
3.1.1. Water Solubility
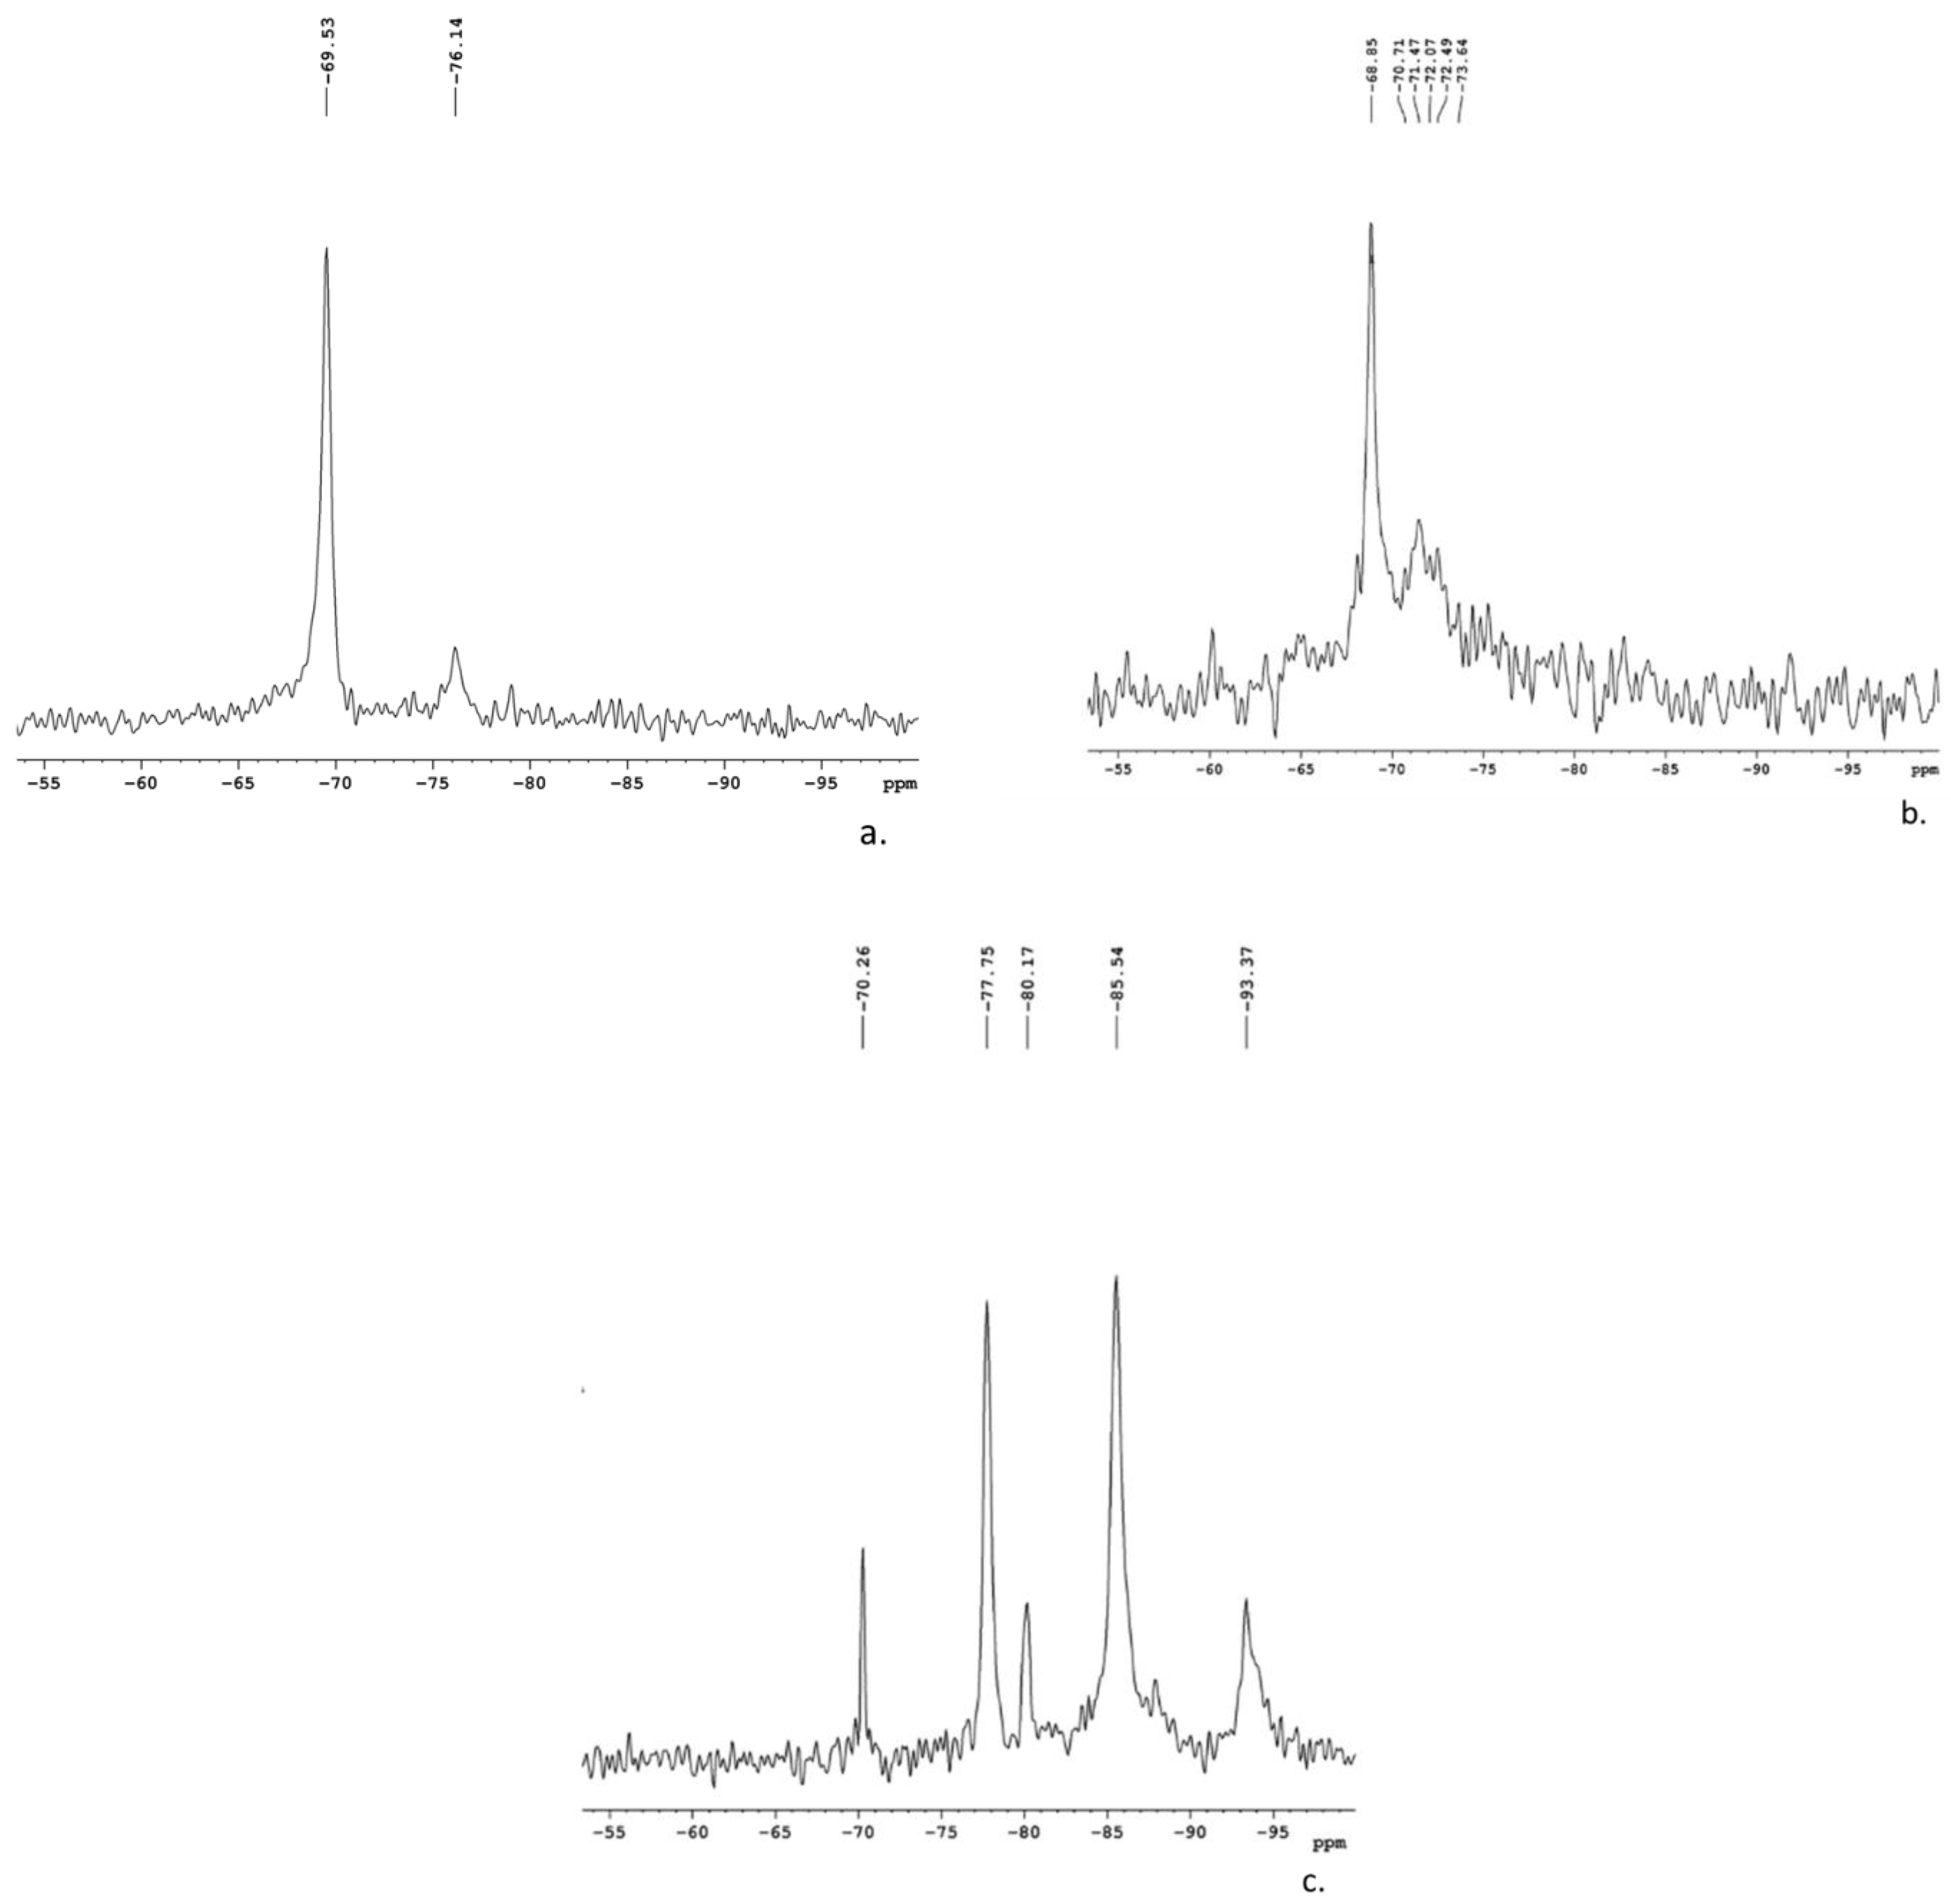
3.1.2. MAS-NMR Spectroscopy
3.1.3. X-ray Photoelectron Spectroscopy
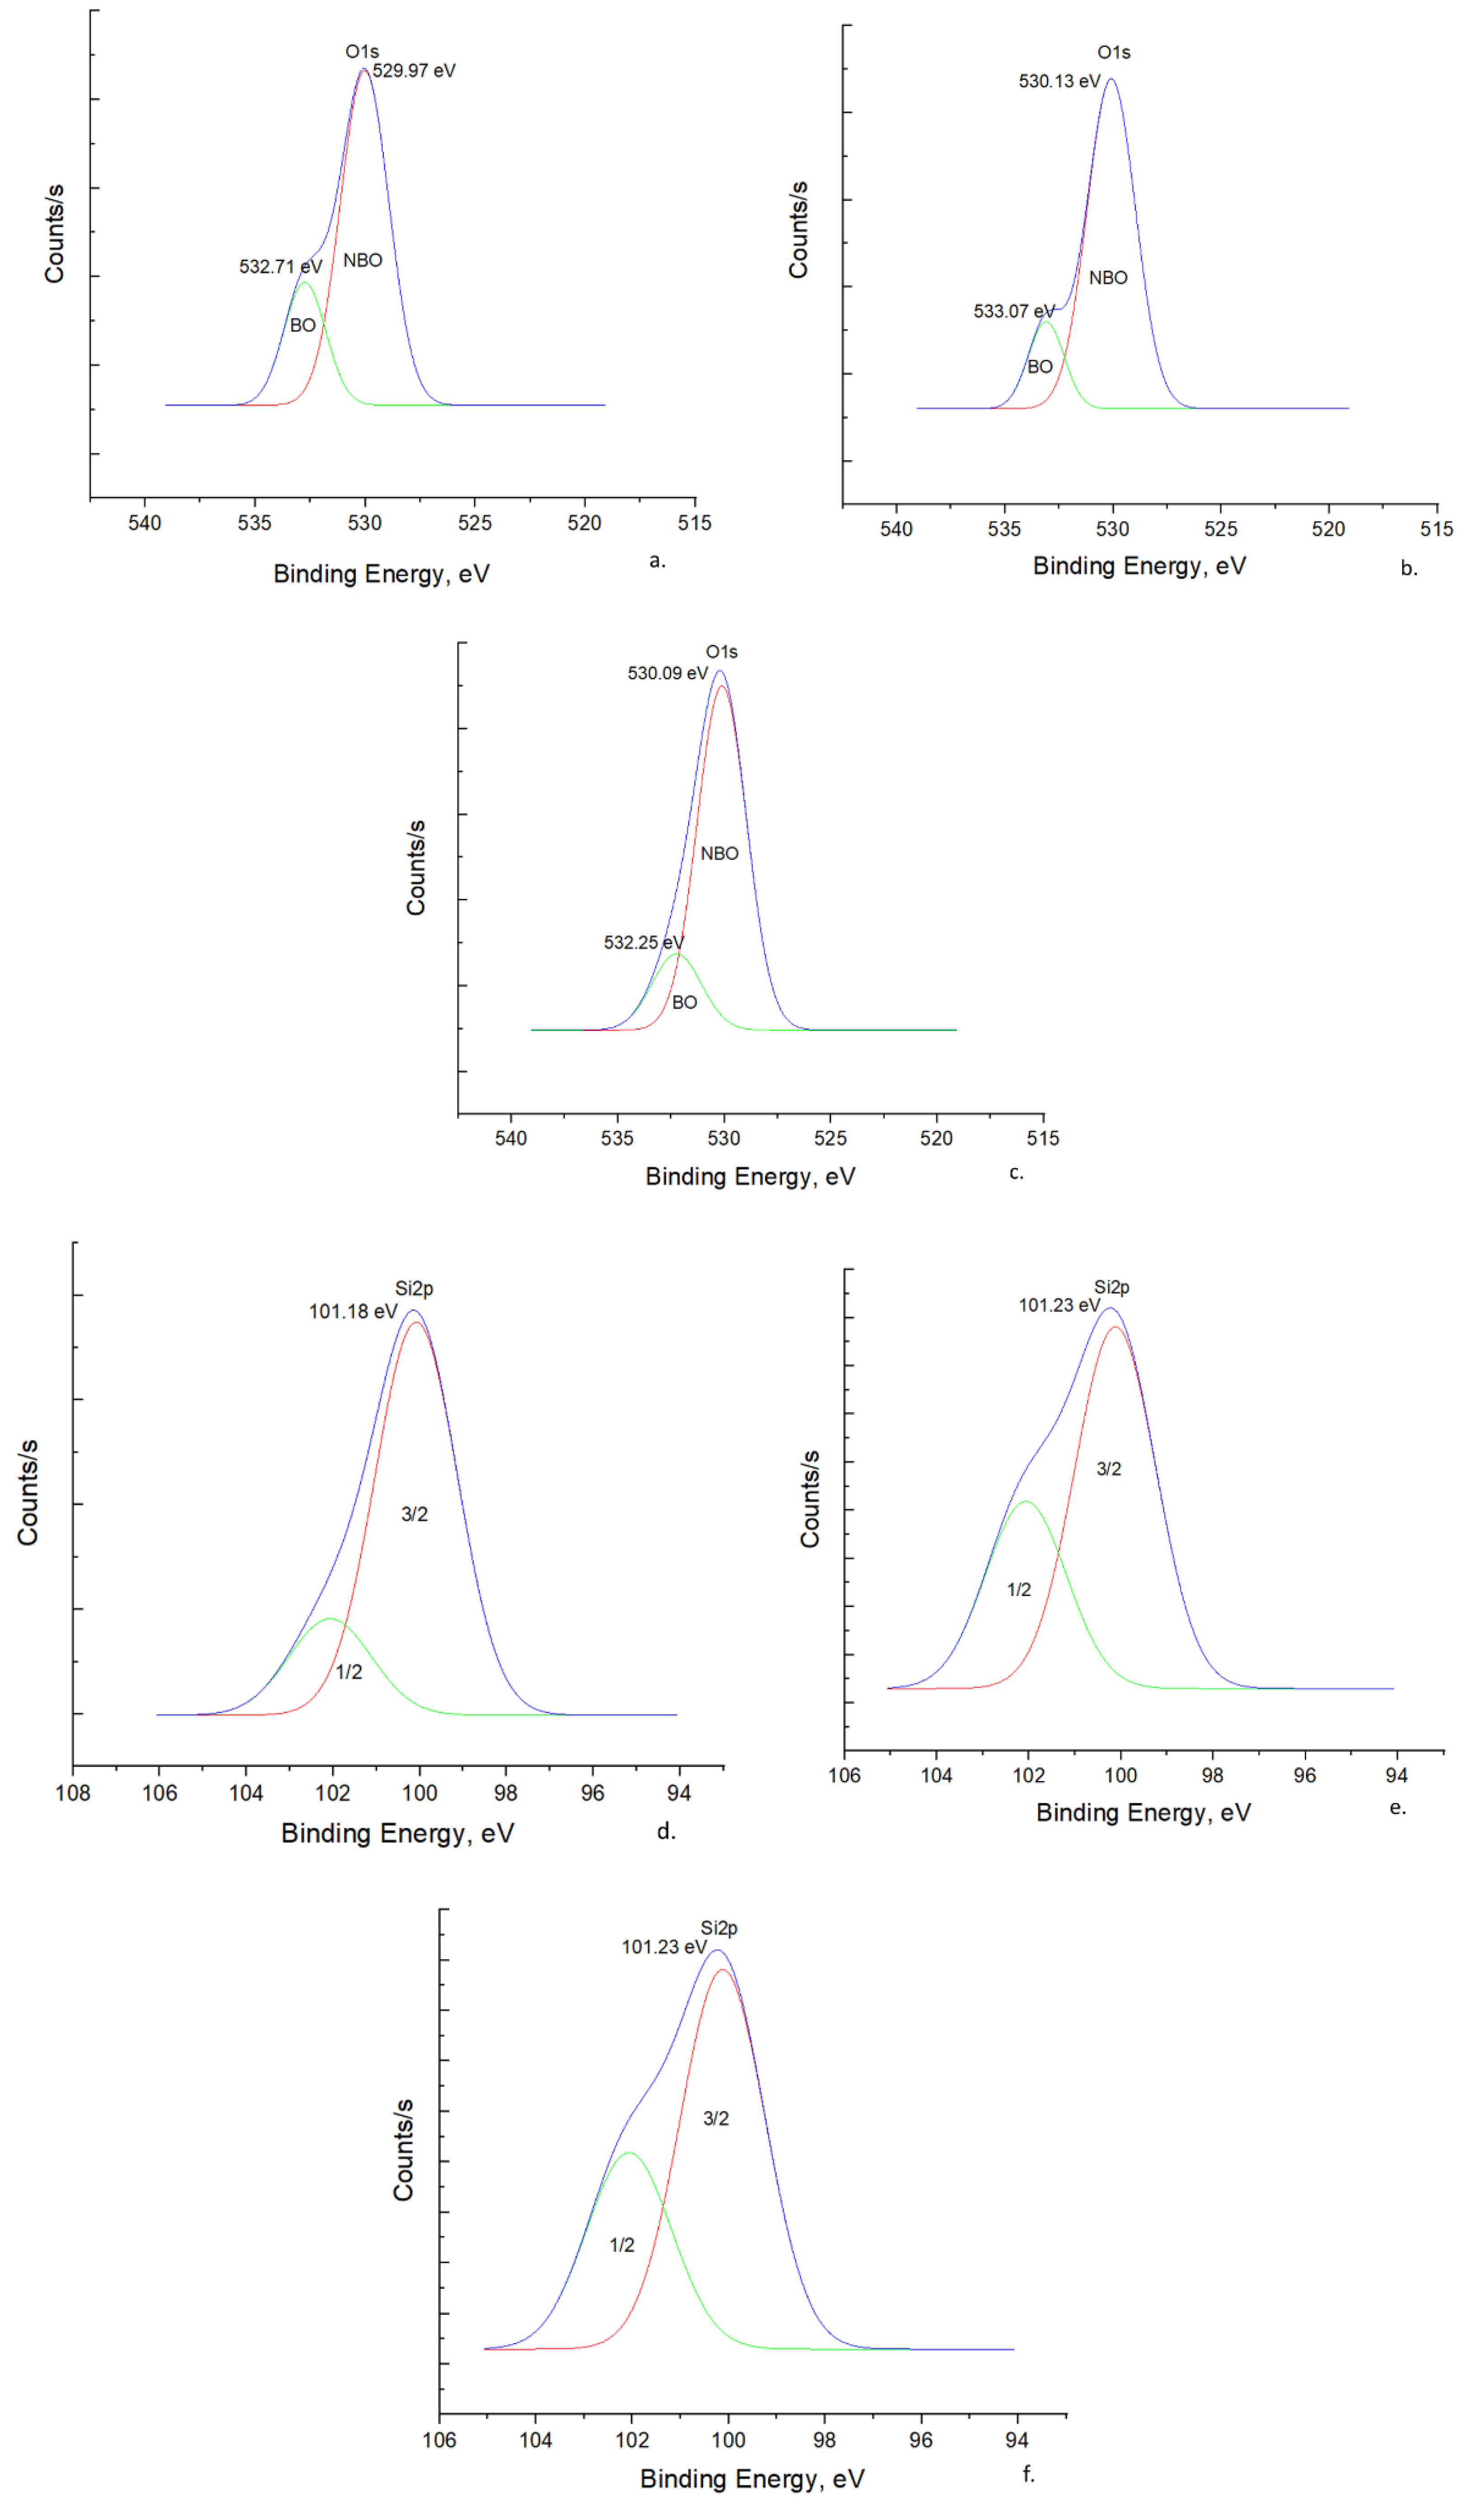
O 1s Spectra
Si 2p Spectra
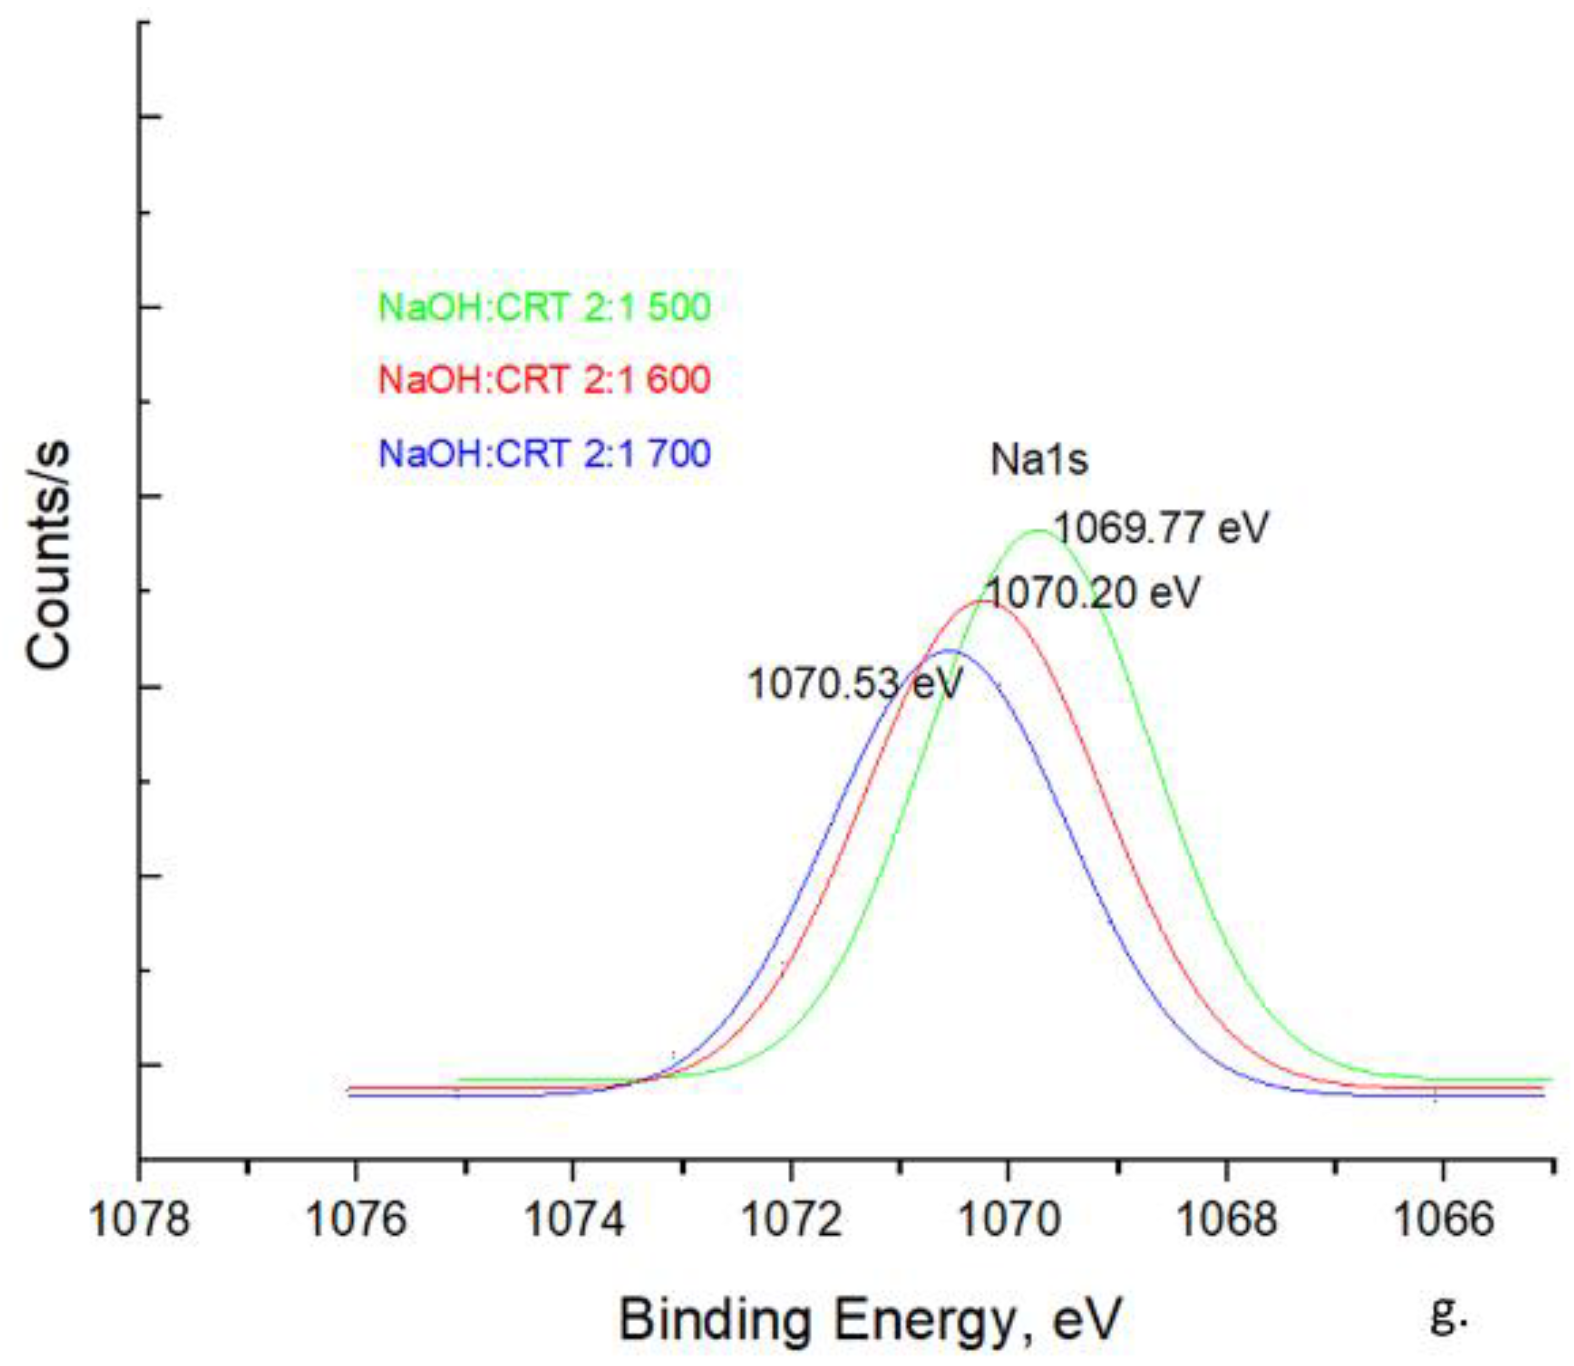
Na 1s Spectra
3.1.4. FT-IR Spectroscopy
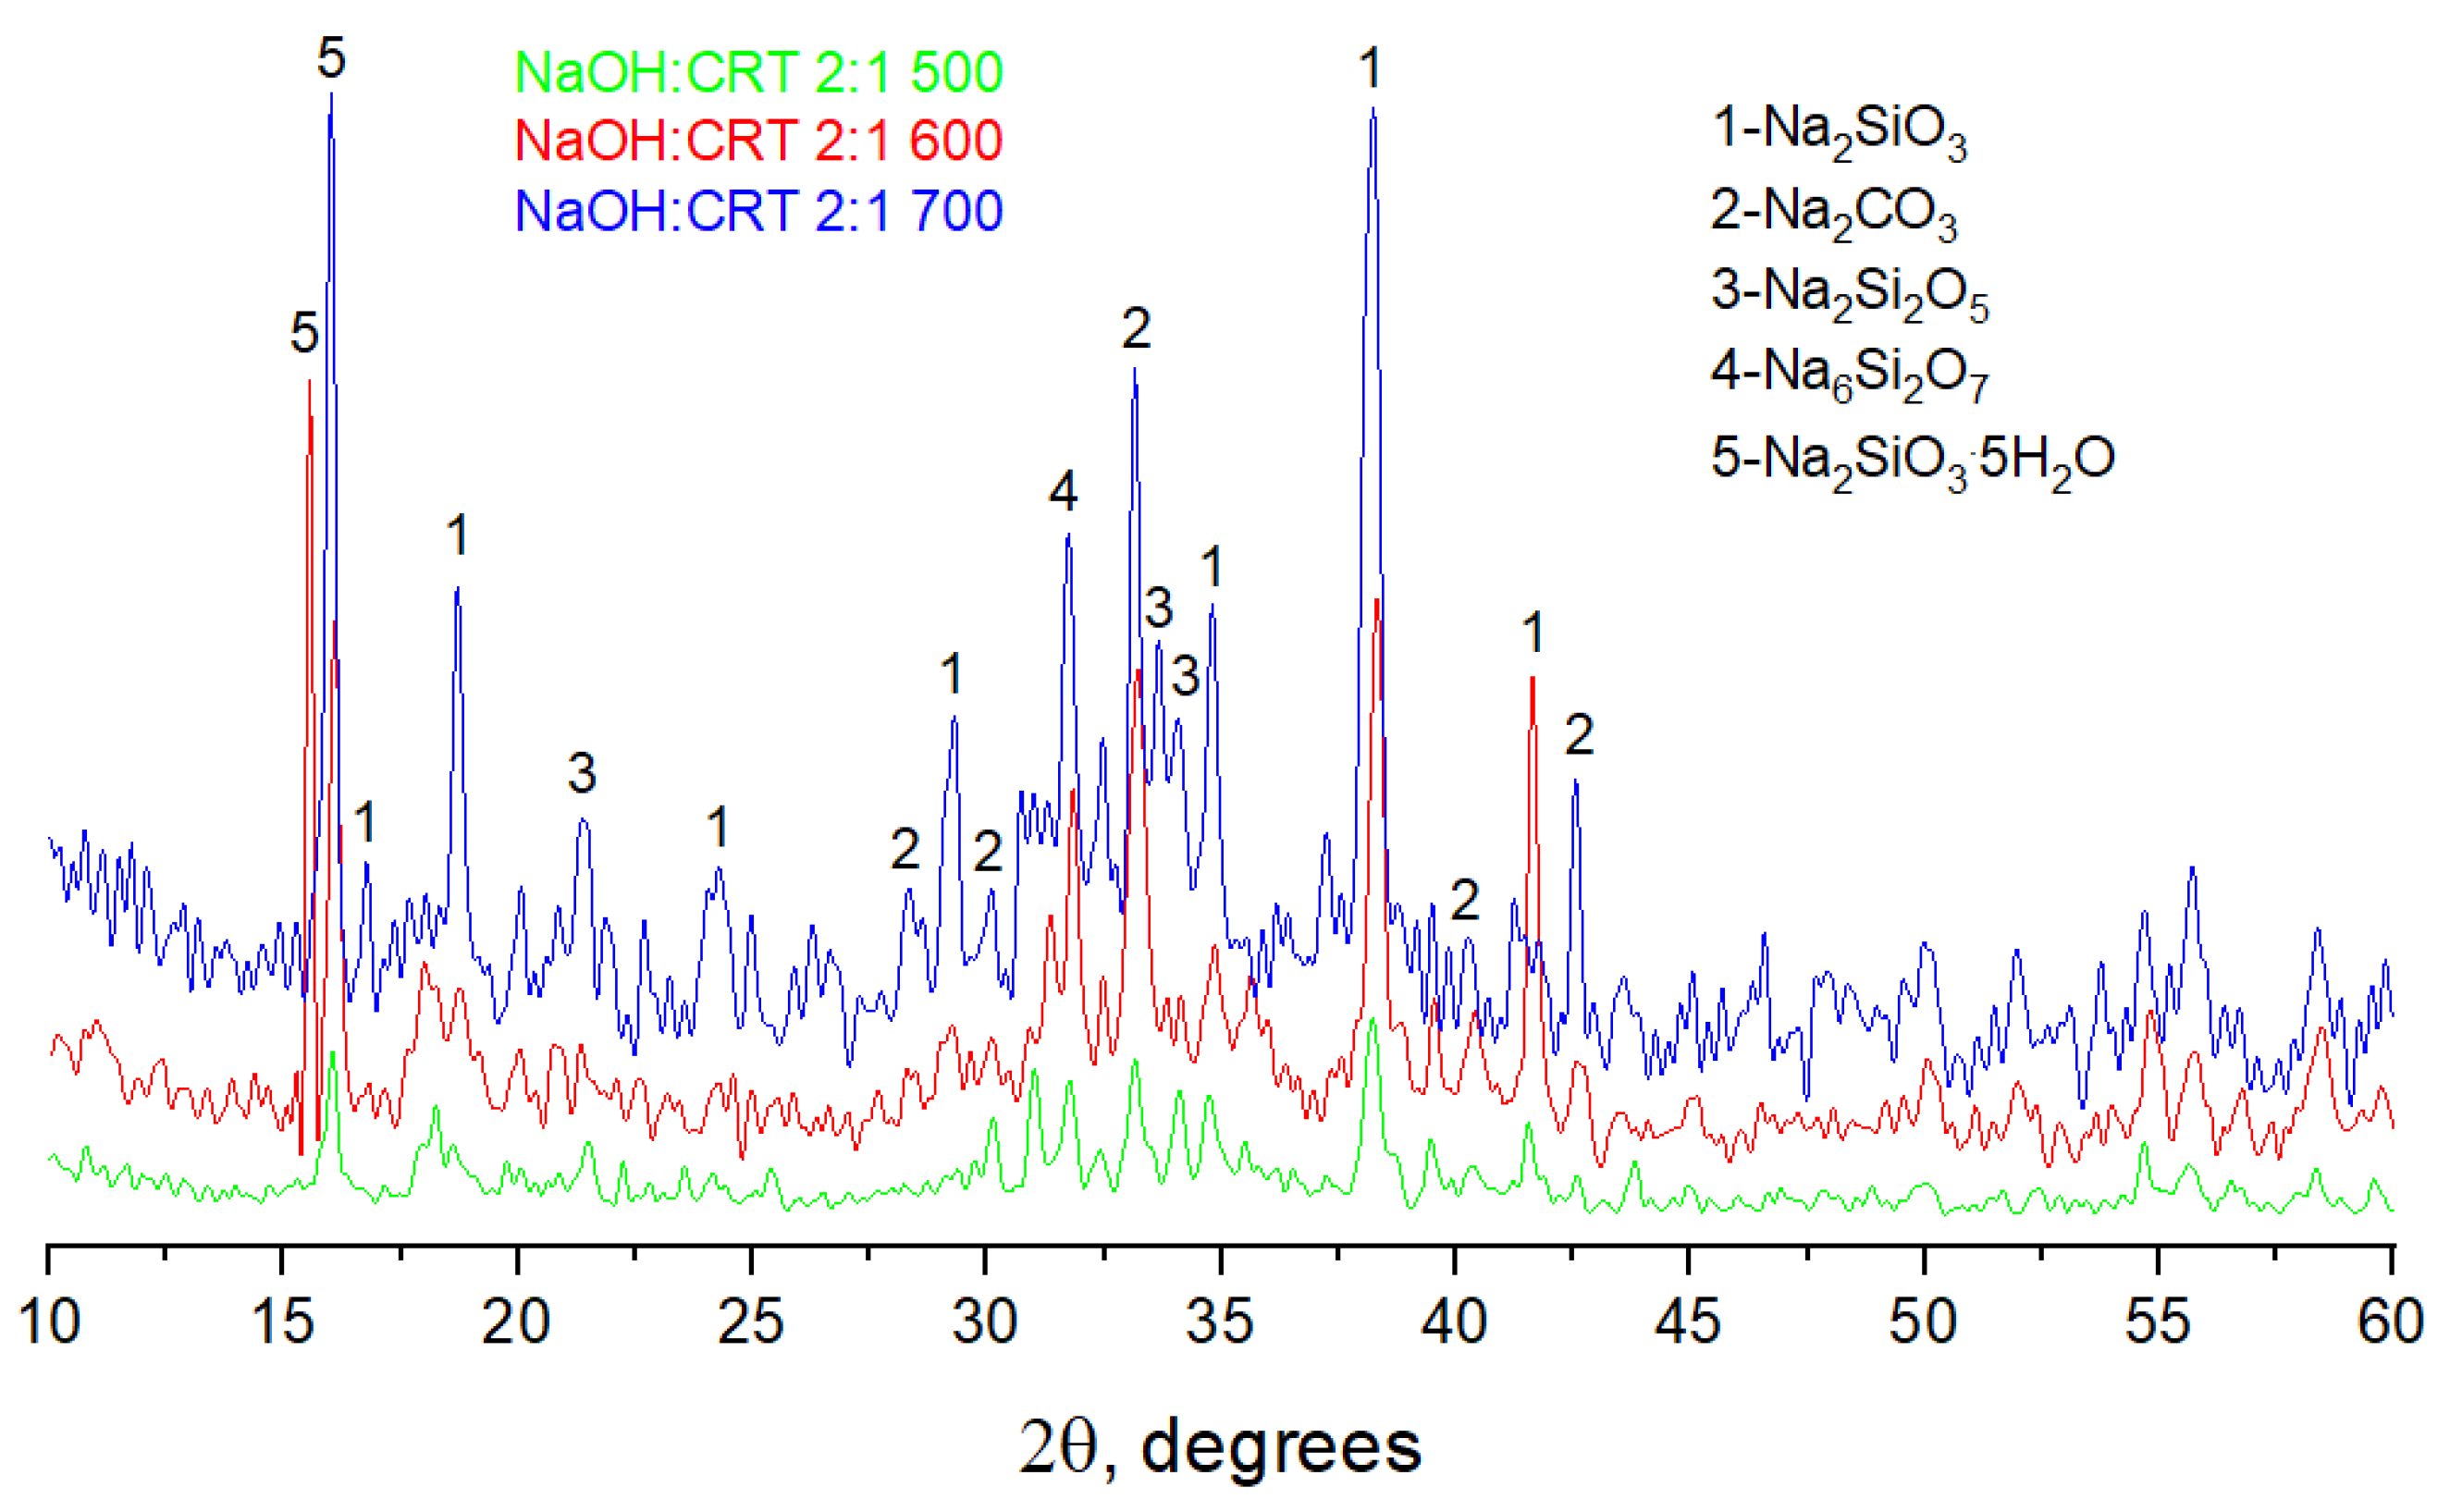
3.1.5. X-ray Diffractometry
3.2. Mechanical and Microstructural Characterization of One-Part Alkali-Activated Materials
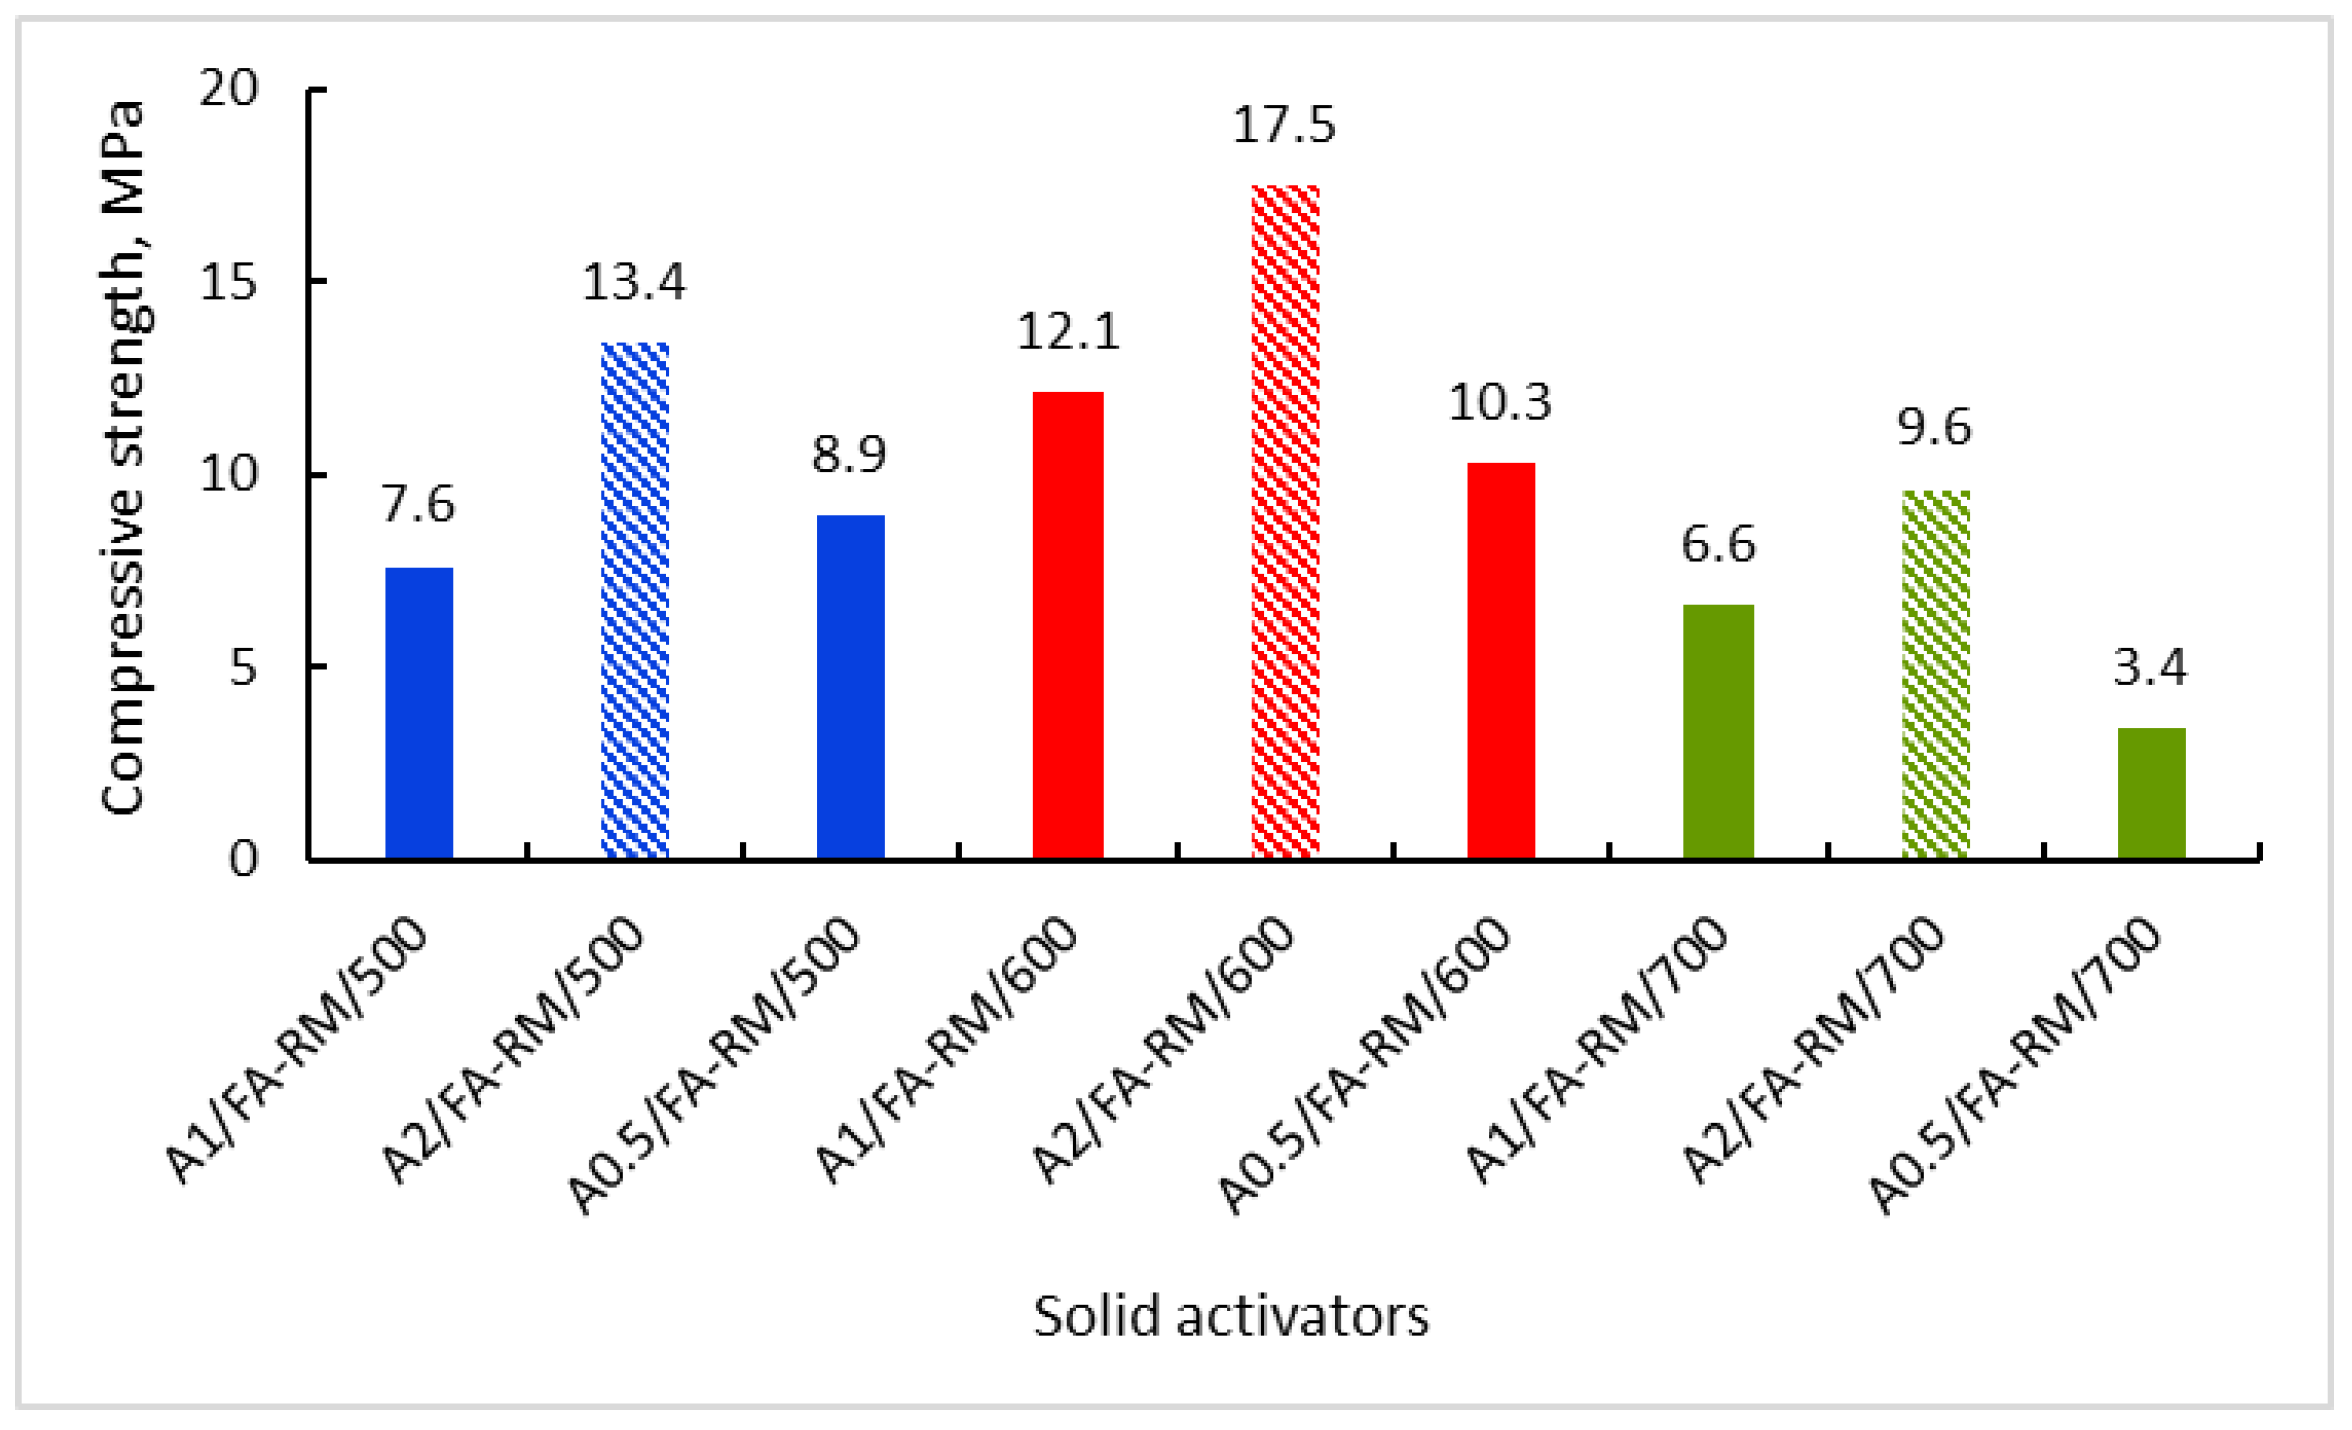
3.2.1. Compressive Strength
3.2.2. SEM-EDX Spectroscopy
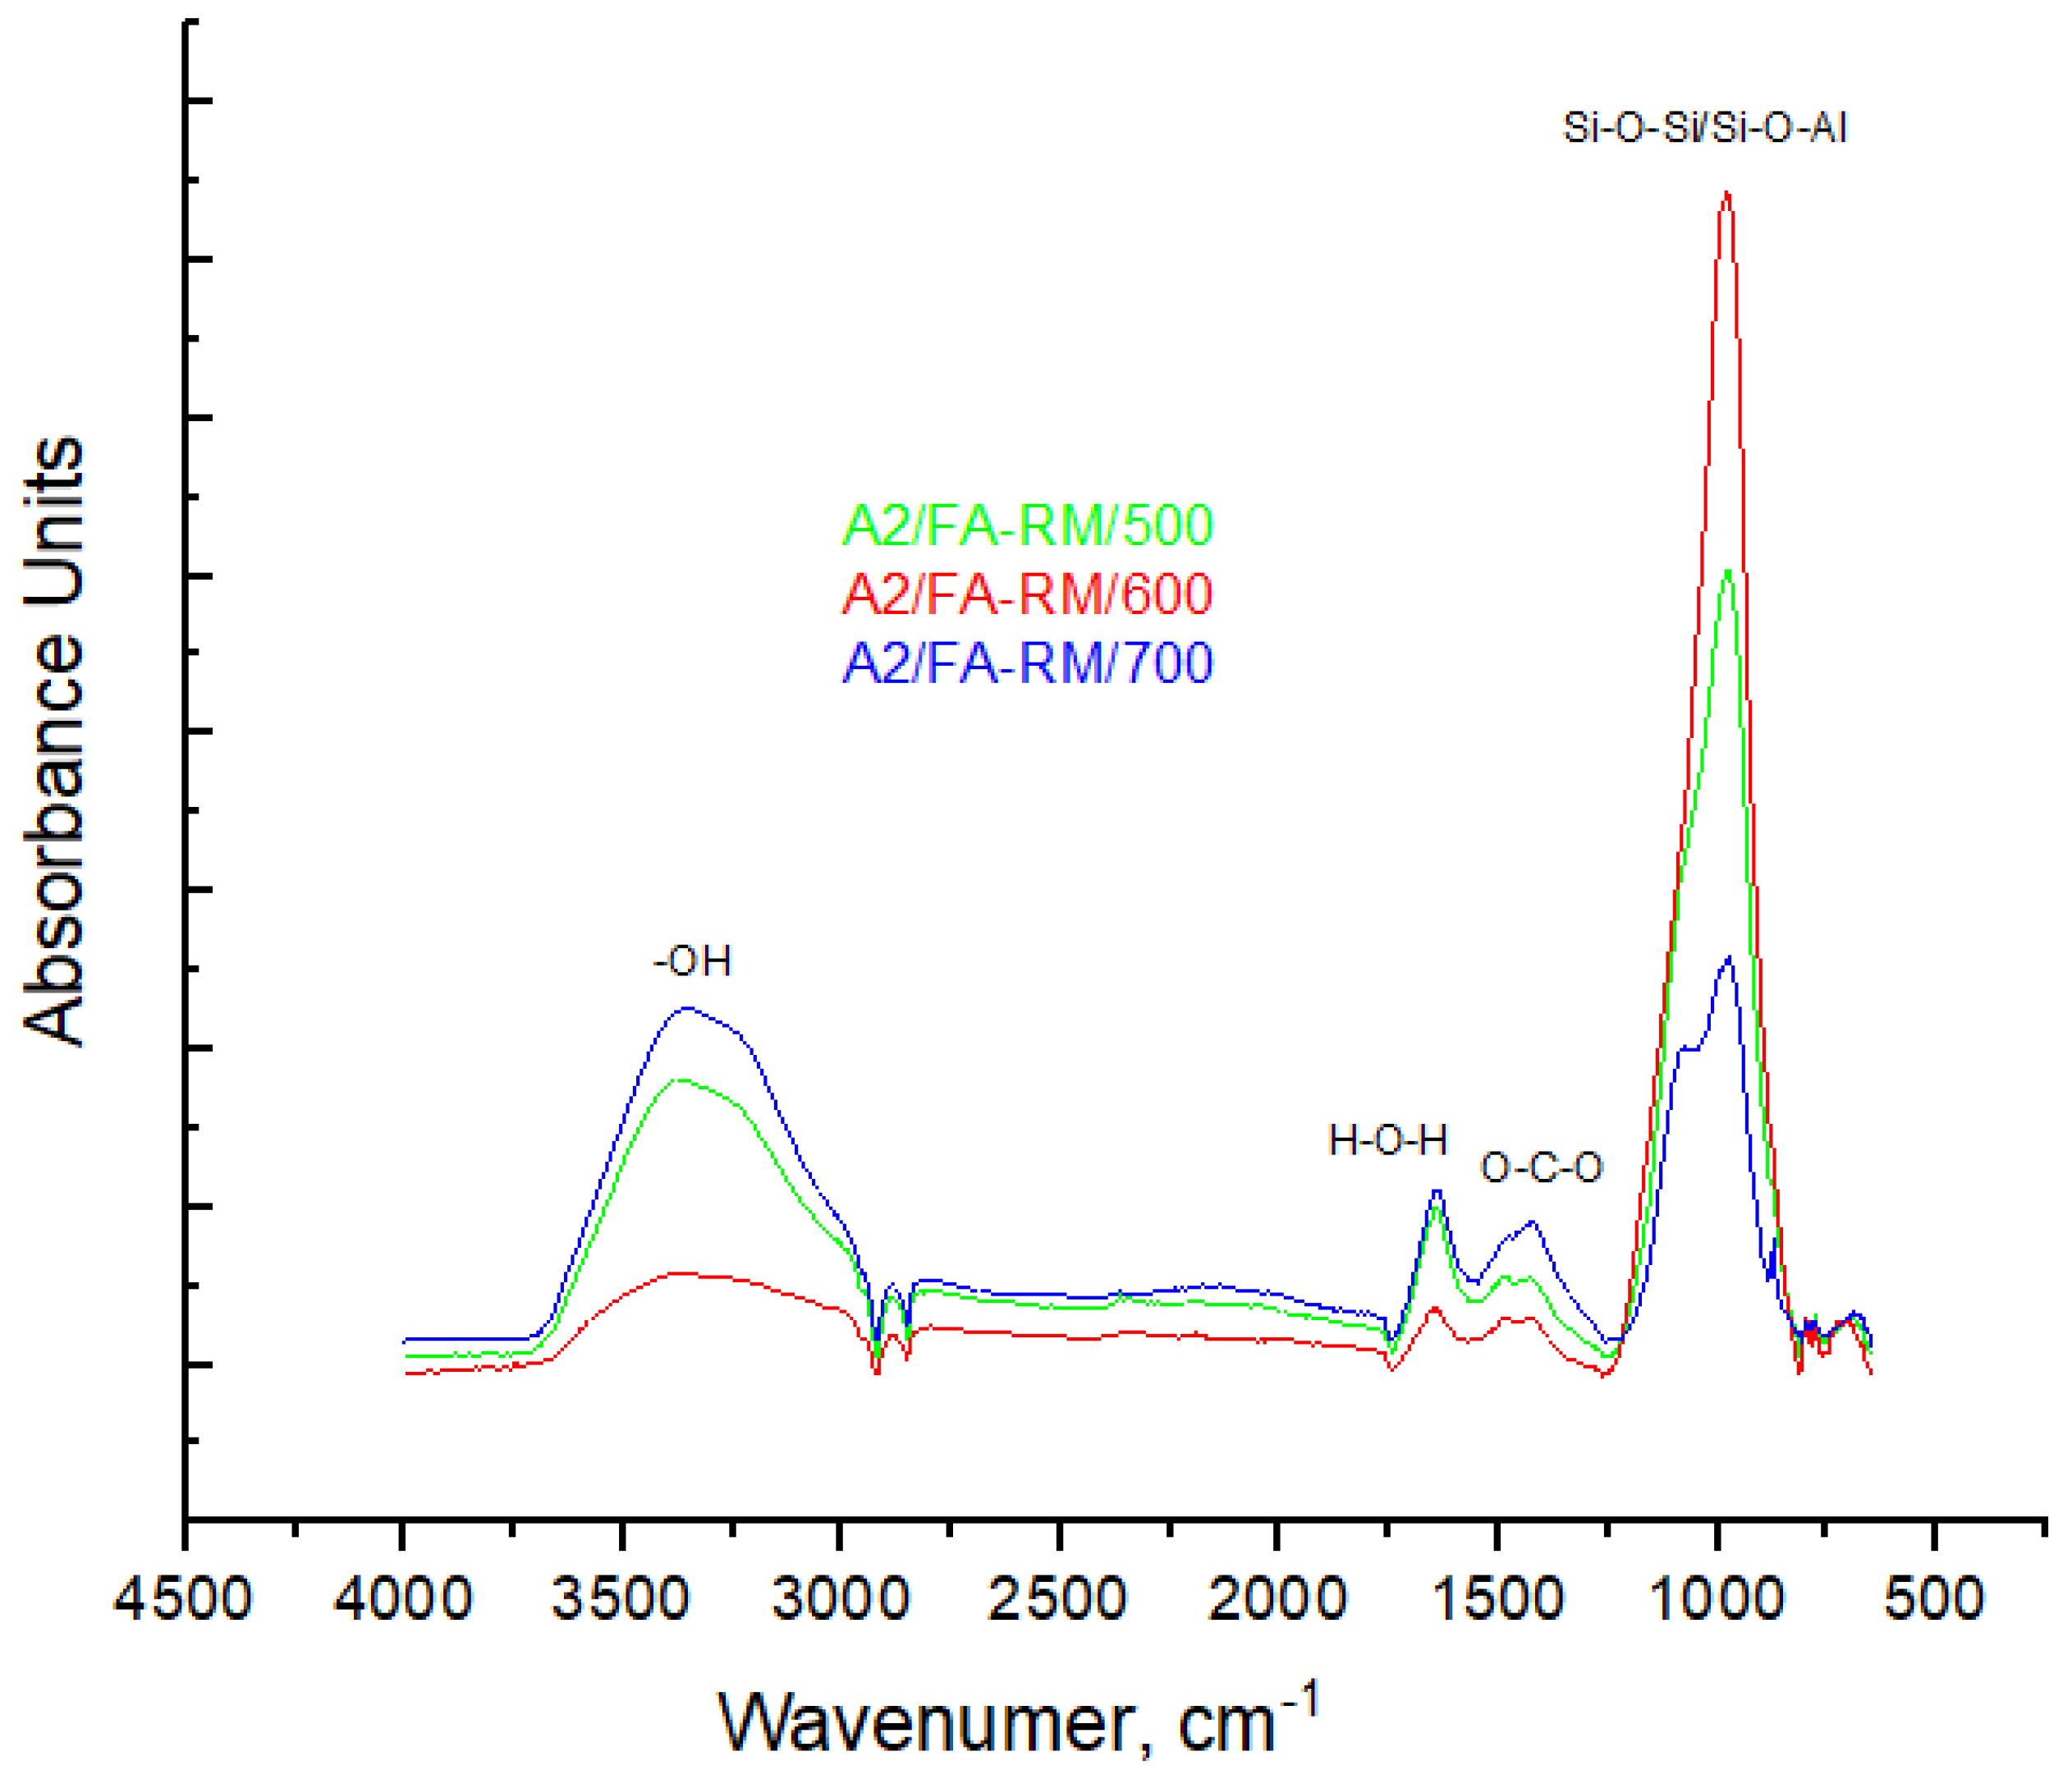
3.2.3. FT-IR Spectroscopy
4. Conclusions
Author Contributions
Funding
Institutional Review Board Statement
Informed Consent Statement
Data Availability Statement
Conflicts of Interest
References
- Luukkonen, T.; Abdollahnejad, Z.; Yliniemi, J.; Kinnunen, P.; Illikainen, M. One-part alkali-activated materials: A review. Cem. Concr. Res. 2018, 10, 21–34. [Google Scholar] [CrossRef]
- Adesanya, E.; Ohenoja, K.; Di Maria, A.; Kinnunen, P.; Illikainen, M. Alternative alkali-activator from steel-making waste for one-part alkali-activated slag. J. Clean. Prod. 2020, 274, 123020. [Google Scholar] [CrossRef]
- Fernández-Jiménez, A.; Palomo, A. Composition and microstructure of alkali activated fly ash binder: Effect of the activator. Cem. Concr. Res. 2005, 35, 1984–1992. [Google Scholar] [CrossRef]
- Opiso, E.M.; Tabelin, C.B.; Maestre, C.V.; Aseniero, J.P.J.; Park, I.; Villacorte-Tabelin, M. Synthesis and characterization of coal fly ash and palm oil fuel ash modified artisanal and small-scale gold mine (ASGM) tailings based geopolymer using sugar mill lime sludge as Ca-based activator. Helyon 2021, 7, e06654. [Google Scholar] [CrossRef] [PubMed]
- Provis, G.L. Alkali-activated materials. Cem. Concr. Res. 2018, 114, 40–48. [Google Scholar] [CrossRef]
- Ye, N.; Chen, Y.; Yang, J.; Liang, S.; Hu, Y.; Hu, J.; Zhu, S.; Fan, W.; Xiao, B. Transformations of Na, Al, Si and Fe species in red mud during synthesis of one-part geopolymers. Cem. Concr. Res. 2017, 101, 123–130. [Google Scholar] [CrossRef]
- Abdel-Gawwad, H.A.; Rashad, A.M.; Heikal, M. Sustainable utilization of pretreated concrete waste in the production of one-part alkali-activated cement. J. Clean. Prod. 2019, 232, 318–328. [Google Scholar] [CrossRef]
- Guo, W.; Zhang, Z.; Bai, Y.; Zhao, G.; Sang, Z.; Zhao, Q. Development and characterization of a new multi-strength level binder system using soda residue-carbide slag as composite activator. Constr. Build. Mater. 2021, 291, 123367. [Google Scholar] [CrossRef]
- Bouchikhi, A.; Benzerzour, M.; Abriak, N.E.; Maherzi, W.; Pajany, Y.M. Waste glass reuse in geopolymer binder prepared with metakaolin. Acad. J. Civ. Eng. 2019, 37, 539–544. [Google Scholar] [CrossRef]
- Abdulkareem, M.; Havukainen, J.; Nuortila-Jokinen, J.; Horttanainen, M. Environmental and economic perspective of waste-derived activators on alkali-activated mortars. J. Clean. Prod. 2021, 280, 124651. [Google Scholar] [CrossRef]
- Adesanya, E.; Ohenoja, K.; Luukkonen, T.; Kinnunen, P.; Illikainen, M. One-part geopolymer cement from slag and pretreated paper sludge. J. Clean. Prod. 2018, 185, 168–175. [Google Scholar] [CrossRef]
- Luo, Y.; Bao, S.; Zhang, Y. Preparation of one-part geopolymeric precursors using vanadium tailing by thermal activation. J. Am. Ceram. Soc. 2020, 103, 779–783. [Google Scholar] [CrossRef]
- Elzeadani, M.; Bompa, D.V.; Elghazouli, A.Y. One part alkali activated materials: A state-of-the-art review. J. Build. Eng. 2022, 57, 104871. [Google Scholar] [CrossRef]
- Konig, K.; Traven, K.; Pavlin, M.; Ducman, D. Evaluation of locally available amorphous waste materials as a source for alternative alkali activators. Ceram. Int. 2021, 47, 4864–4873. [Google Scholar] [CrossRef]
- Bobirică, C.; Orbeci, C.; Bobirică, L.; Palade, P.; Deleanu, C.; Pantilimon, C.M.; Pîrvu, C.; Radu, I.C. Influence of red mud and waste glass on the microstructure, strength, and leaching behavior of bottom ash-based geopolymer composites. Sci. Rep. 2020, 10, 19827. [Google Scholar] [CrossRef]
- ASTM D 1428-56; T Tentative Methods of Test for Sodium and Potassium Ions in Industrial Water and Water-Formed Deposits by Flame Photometry. ASTM International: West Conshohocken, PA, USA, 1960.
- ASTM D 859-00; Standard Test Method for Silica in Water. ASTM International: West Conshohocken, PA, USA, 2021.
- ASTM C39/C39M-14; Standard Test Method for Compressive Strength of Cylindrical Concrete Specimens. ASTM International: West Conshohocken, PA, USA, 2014.
- Rasuli, M.I.; Tajunnisa, Y.; Yamamura, A.; Shigeishi, M.A. Consideration on the one-part mixing method of alkali-activated material: Problems of sodium silicate solubility and quick setting. Heliyon 2022, 8, e08783. [Google Scholar] [CrossRef]
- Lo, K.-W.; Lin, W.-T.; Lin, Y.-W.; Cheng, T.-W.; Lin, K.-L. Synthesis metakaolin-based geopolymer incorporated with SiC sludge using design of experiment method. Polymers 2022, 14, 3395. [Google Scholar] [CrossRef]
- Keawthun, M.; Krachodnok, S.; Chaisena, A. Conversion of waste glasses into sodium silicate solutions. Int. J. Chem. Sci. 2014, 12, 83–91. [Google Scholar]
- Méar, F.; Yot, P.; Cambon, M.; Ribes, M. The characterization of waste cathode-ray tube glass. Waste Manag. 2006, 26, 1468–1476. [Google Scholar] [CrossRef]
- de Lucas, A.; Rodríguez, L.; Sánchez, P.; Carmona, M.; Romero, P.; Lobato, J. Comparative study of the solubility of the crystalline layered silicates α-Na2Si2O5 and δ-Na2Si2O5 and the amorphous silicate Na2Si2O5. Ind. Eng. Chem. Res. 2004, 43, 1472–1477. [Google Scholar] [CrossRef]
- Vinai, R.; Soutsos, M. Production of sodium silicate powder from waste glass cullet for alkali activation of alternative binders. Cem. Concr. Res. 2019, 116, 45–56. [Google Scholar] [CrossRef]
- Mori, H. Extraction of silicon dioxide from waste colored glasses by alkali fusion using sodium hydroxide. J. Ceram. Soc. Jpn. 2003, 111, 376–381. [Google Scholar] [CrossRef]
- Foletto, E.L.; Gratieri, E.; de Oliveira, L.H.; Jahn, S.L. Conversion of rice hull ash into soluble sodium silicate. Mater. Res. 2006, 9, 335–338. [Google Scholar] [CrossRef]
- Ishwarya, G.; Singh, B.; Deshwal, S.; Bhattacharyy, S.K. Effect of sodium carbonate/sodium silicate activator on the rheology, geopolymerization and strength of fly ash/slag geopolymer pastes. Cem. Concr. Compos. 2019, 97, 226–238. [Google Scholar] [CrossRef]
- Stebbins, J.F. Anionic speciation in sodium and potassium silicate glasses near the metasilicate ([Na,K]2SiO3) composition: 29Si, 17O, and 23Na MAS NMR. J. Non-Cryst. Solids. X 2020, 6, 100049. [Google Scholar] [CrossRef]
- Gharzouni, A.; Joussein, E.; Samet, B.; Baklouti, S.; Pronier, S.; Sobrados, I.; Sanz, J.; Rossignol, S. The effect of an activation solution with siliceous species on the chemical reactivity and mechanical properties of geopolymers. J. Sol Gel Sci. Technol. 2014, 73, 250–259. [Google Scholar] [CrossRef]
- Bobirică, C.; Shim, J.-H.; Pyeon, J.-H.; Park, J.-Y. Influence of waste glass on the microstructure and strength of inorganic polymers. Ceram. Int. 2015, 41, 13638–13649. [Google Scholar] [CrossRef]
- Luukkonen, T.; Sreenivasan, H.; Abdollahnejad, Z.; Yliniemi, J.; Kantola, A.; Telkki, V.V.; Kinnunen, P.; Illikainen, M. Influence of sodium silicate powder silica modulus for mechanical and chemical properties of dry-mix alkali-activated slag mortar. Constr. Build. Mater. 2020, 233, 117354. [Google Scholar] [CrossRef]
- Mekki, A.; Holland, D.; McConville, C.F.; Salim, M. An XPS study of iron sodium silicate glass surfaces. J. Non-Cryst. Solids. 1996, 208, 267–276. [Google Scholar] [CrossRef]
- Dalby, K.N.; Nesbitt, H.W.; Zakaznova-Herzog, V.P.; King, P.L. Resolution of bridging oxygen signals from O 1s spectra of silicate glasses using XPS: Implications for O and Si speciation. Geochim. Cosmochim. Acta 2007, 71, 4297–4313. [Google Scholar] [CrossRef]
- Sawyer, R.; Nesbitt, H.W.; Secco, R.A. High resolution X-ray Photoelectron Spectroscopy (XPS) study of K2O–SiO2 glasses: Evidence for three types of O and at least two types of Si. J. Non-Cryst. Solids 2012, 358, 290–302. [Google Scholar] [CrossRef]
- Ryu, Y.B.; Lee, S.M. Infrared spectra and thermal properties of sodium silicate solutions. Korean J. Met. Mater. 2018, 56, 72–78. [Google Scholar] [CrossRef]
- Xing, J.; Zhao, Y.L.; Wang, Q.; Qiu, J.P.; Sun, X.G. Preparation and characterization of metal mine tailings based backfiling material through geopolymerization. IOP Conf. Ser. Mater. Sci. Eng. 2019, 479, 012023. [Google Scholar] [CrossRef]
- Gaggiano, R.; De Graeve, I.; Mol, J.M.C.; Verbeken, K.; Kestens, L.A.I.; Terryn, H. An infrared spectroscopic study of sodium silicate adsorption on porous anodic alumina. Surf. Interface Anal. 2013, 45, 1098–1104. [Google Scholar] [CrossRef]
- Vinai, R.; Ntimugura, F.; Cutbill, W.; Evans, R.; Zhao, Y. Bio-derived sodium silicate for the manufacture of alkali-activated binders: Use of bamboo leaf ash as silicate source. Int. J. Appl. Ceram. Technol. 2022, 19, 1235–1248. [Google Scholar] [CrossRef]
- ASTM C90-16a; Standard Specification For Loadbearing Concrete Masonry Units. ASTM International: West Conshohocken, PA, USA, 2014.
- Marin, N.; Orbeci, C.; Bobirică, L.; Boşomoiu, M.; Bobirică, C. Long-term leaching assessment of alkali-activated materials based on compliance leaching tests. UPB Sci. Bull. Ser. B 2023, in press. [Google Scholar]
- Rowles, M.R.; O’Connor, B.H. Chemical and structural microanalysis of aluminosilicate geopolymers synthesized by sodium silicate activation of metakaolinite. J. Am. Ceram. Soc. 2009, 92, 2354–2361. [Google Scholar] [CrossRef]
- Garcia-Lodeiro, I.; Palomo, A.; Fernández-Jiménez, A.; Macphee, D.E. Compatibility studies between N-A-S-H and C-A-S-H gels. Study in the ternary diagram Na2O–CaO–Al2O3–SiO2–H2O. Cem. Concr. Res. 2011, 41, 923–931. [Google Scholar] [CrossRef]
- Fernández-Jiménez, A.; Monzó, M.; Vincent, M.; Barba, A.; Palamo, A. Alkaline activation of metakaolin-fy ash mixtures: Obtain of Zeoceramics and Zeocements. Microporous Mesoporous Mater. 2008, 108, 41–49. [Google Scholar] [CrossRef]
- Li, K.-L.; Shiu, H.-S.; Shie, J.-L.; Cheng, T.W.; Hwang, C.-L. Effect of composition on characteristics of thin film transistor liquid crystal display (TFT-LCD) waste glass-metakaolin-based geopolymers. Constr. Build. Mater. 2012, 36, 501–507. [Google Scholar] [CrossRef]
- Criado, M.; Palomo, A.; Fernández-Jiménez, A. Alkali activation of fly ashes. Part 1: Effect of curing conditions on the carbonation of the reaction products. Fuel 2005, 84, 2048–2054. [Google Scholar] [CrossRef]
- Lutz, H.D.; Eckers, W.; Haeuseler, H. OH stretching frequencies of solid hydroxides and of free OH− ions. J. Mol. Struct. 1982, 80, 221–224. [Google Scholar] [CrossRef]


| Oxide, (wt. %) | Waste Glass | Fly Ash | Red Mud |
|---|---|---|---|
| SiO2 | 49.60 | 42.80 | 11.00 |
| Al2O3 | 5.70 | 21.41 | 21.00 |
| CaO | 1.50 | 2.21 | 5.63 |
| Fe2O3 | 0.15 | 9.85 | 42.78 |
| SO3 | 7.60 | 2.70 | 1.10 |
| K2O | 6.15 | 2.14 | 0.37 |
| Na2O | 5.00 | 4.13 | 7.25 |
| P2O5 | 0.20 | - | 4.75 |
| Cl | 4.5 | 3.6 | 1.40 |
| PbO | 12.10 | - | - |
| BaO | 6.97 | - | - |
| NiO | 0.02 | - | - |
| CuO | 0.04 | 0.02 | - |
| ZnO | 0.12 | 0.03 | - |
| SrO | 0.35 | - | - |
| MgO | - | 3.30 | - |
| MnO | - | 1.08 | - |
| TiO2 | - | 0.87 | 1.37 |
| Cr2O3 | - | 0.03 | 0.25 |
| Br | - | 0.31 | - |
| LOI (loss on ignition) | - | 5.52 | 3.10 |
| Assortments | Alkali Fusion Temperature, (°C) | NaOH/CRT, (wt. Ratio) |
|---|---|---|
| NaOH/CRT 1:2 500 | 500 | 1:2 |
| NaOH/CRT 1:1 500 | 1:1 | |
| NaOH/CRT 2:1 500 | 2:1 | |
| NaOH/CRT 1:2 600 | 600 | 1:2 |
| NaOH/CRT 1:1 600 | 1:1 | |
| NaOH/CRT 2:1 600 | 2:1 | |
| NaOH/CRT 1:2 700 | 700 | 1:2 |
| NaOH/CRT 1:1 700 | 1:1 | |
| NaOH/CRT 2:1 700 | 2:1 |
| Assortments | Activator Synthesis Temperature, (°C) | Fly Ash, (wt. %) | Red Mud, (wt. %) | Solid Activator, (wt. %) |
|---|---|---|---|---|
| A0.5/FA-RM/500 | 500 | 85 | 5 | 10 |
| A1/FA-RM/500 | ||||
| A2/FA-RM/500 | ||||
| A0.5/FA-RM/600 | 600 | |||
| A1/FA-RM/600 | ||||
| A2/FA-RM/600 | ||||
| A0.5/FA-RM/700 | 700 | |||
| A1/FA-RM/700 | ||||
| A2/FA-RM/700 |
Disclaimer/Publisher’s Note: The statements, opinions and data contained in all publications are solely those of the individual author(s) and contributor(s) and not of MDPI and/or the editor(s). MDPI and/or the editor(s) disclaim responsibility for any injury to people or property resulting from any ideas, methods, instructions or products referred to in the content. |
© 2023 by the authors. Licensee MDPI, Basel, Switzerland. This article is an open access article distributed under the terms and conditions of the Creative Commons Attribution (CC BY) license (https://creativecommons.org/licenses/by/4.0/).
Share and Cite
Marin, N.; Orbeci, C.; Bobiricǎ, L.; Rău, I.; Deleanu, C.; Bîru, E.I.; Stănescu, P.O.; Berbecaru, A.C.; Matei, E.; Bobiricǎ, C. Alternative Solid Activators from Waste Glass for One-Part Alkali-Activated Fly Ash/Red Mud Cements. Materials 2023, 16, 6707. https://doi.org/10.3390/ma16206707
Marin N, Orbeci C, Bobiricǎ L, Rău I, Deleanu C, Bîru EI, Stănescu PO, Berbecaru AC, Matei E, Bobiricǎ C. Alternative Solid Activators from Waste Glass for One-Part Alkali-Activated Fly Ash/Red Mud Cements. Materials. 2023; 16(20):6707. https://doi.org/10.3390/ma16206707
Chicago/Turabian StyleMarin, Nicolaie, Cristina Orbeci, Liliana Bobiricǎ, Ileana Rău, Calin Deleanu, Elena Iuliana Bîru, Paul Octavian Stănescu, Andrei Constantin Berbecaru, Ecaterina Matei, and Constantin Bobiricǎ. 2023. "Alternative Solid Activators from Waste Glass for One-Part Alkali-Activated Fly Ash/Red Mud Cements" Materials 16, no. 20: 6707. https://doi.org/10.3390/ma16206707
APA StyleMarin, N., Orbeci, C., Bobiricǎ, L., Rău, I., Deleanu, C., Bîru, E. I., Stănescu, P. O., Berbecaru, A. C., Matei, E., & Bobiricǎ, C. (2023). Alternative Solid Activators from Waste Glass for One-Part Alkali-Activated Fly Ash/Red Mud Cements. Materials, 16(20), 6707. https://doi.org/10.3390/ma16206707