Communication

The Kinetics of Carrier Trap Parameters in Na8Al6Si6O24(Cl,S)2 Hackmanite

1
Department of Radiological Science, Cheongju University, Cheongju 28503, Republic of Korea
2
Department of Biomedical Engineering, Keimyung University, Daegu 42601, Republic of Korea
3
Department of Medical Informatics, School of Medicine, Keimyung University, Daegu 42601, Republic of Korea
*
Author to whom correspondence should be addressed.
Materials 2023, 16(20), 6776; https://doi.org/10.3390/ma16206776
Submission received: 12 September 2023 / Revised: 16 October 2023 / Accepted: 18 October 2023 / Published: 20 October 2023
(This article belongs to the Section Optical and Photonic Materials)

Abstract

:
Tenebrescence has been reported to have a high potential for personal ultraviolet (UV) detection. Color changes can detect UV doses and can also be used as visual sensors for X-rays. Hackmanite is known to exhibit tenebrescence. This study investigated the kinetics of electron-trapping levels contributing to the luminescence of Na8Al6Si6O24(Cl,S)2 hackmanite using thermoluminescence. The glow curves were measured at a heating rate of 5 K/s on hackmanite irradiated with X-rays. The physical parameters of the electron-trapping levels were evaluated by analyzing them using the deconvolution, peak shape, and initial rise methods. The Na8Al6Si6O24(Cl,S)2 hackmanite had at least five trapping levels, with activation energies of 0.78, 1.12, 1.86, 1.26, and 1.18 eV and corresponding peak trap lifetimes of 3.59, 2.71, 1.47, 3.34, and 3.91 s, respectively. The estimated migration time was 15.0 s.

1. Introduction

Hackmanite is primarily formed in low-silica and highly alkaline magma. It is commonly found within the cavities of volcanic blocks that have erupted from rock types, such as syenite and phonolite, and in metamorphosed limestone [1]. Hackmanite is also called tenebrescent sodalite or hackmanite, owing to its properties [2,3]. Among these, hackmanite has optical properties, such as photoluminescence and phosphorescence, and is known to exhibit reversible photochromism when exposed to ultraviolet (UV) and X-rays [4]. This phenomenon is called tenebrescence, which is based on the formation of color centers (F-centers) that trap electrons at defect energy levels with a band gap [2,5,6]. Tenebrescence has been commercially utilized in manufacturing lenses, clothing, filters, and smart coatings, and a high potential for personal UV detection has been reported [4]. Just as simple color changes can indicate UV doses, they can also be used as visual sensors for X-rays [7]. The X-ray-induced coloring of minerals was first reported in the 1950s, and since the late 20th century, it has been widely reported in various inorganic materials [4,8,9]. Recently, research on X-ray-induced photochromism for personal X-ray visualization has focused on metal–organic systems [10,11,12,13,14]. Tenebrescence occurs when a material is exposed to UV radiation, where chloride conductors capture the electrons of anionic polysulfide species (e.g., S 2 2 ) [4]. Visible light and heat can re-emit electrons to the valence band, allowing the material to return to its original color; thus, these F-centers are quasi-stable. The lattice defects caused by electron or hole traps and the intentionally added impurity ions within the material cause continuous coloring. The yield of continuous luminescence owing to trapped electrons depend on the activation energy and frequency factor of the trap [13].
This study elucidates the physical characteristics of the electron trap levels that contribute to X-ray-induced coloring in Na8Al6Si6O24(Cl,S)2 hackmanite using thermoluminescence phenomena. The activation energy (E), frequency factor (s), and kinetic order (m) contributing to luminescence were determined using the peak shape, initial rise, and deconvolution methods.

2. Materials and Methods

2.1. Theory

As shown in Figure 1, the tenebrescence mechanism involves the trapping of electrons by Cl vacancies, which create color centers owing to the UV exposure of S 2 2 ions that absorb energy in the visible light range [1]. When sufficient energy is provided, the captured electrons recombine at the luminescence center and return to the hydrosulfide. Na8Al6Si6O24(Cl,S)2 hackmanite also exhibits a characteristic orange/red luminescence when exposed to UV radiation, owing to the transition of the S 2 lattice [1]. In this case, afterglow is observed for several seconds or longer. This phenomenon is called phosphorescence or permanent luminescence. Afterglow is caused by the continuous luminescence of charge carriers that are captured and released slowly rather than forbidden transitions (as in the case of phosphorescence) and always lasts longer than the emission lifetime of the emitting ion. Energy can be stored in a persistent luminescent phosphor, owing to the electron or hole traps within the material. Trap levels are related to lattice defects and intentionally added impurity ions, and exist as single or multiple traps. Electron carriers trapped at the trap levels can be activated through high-temperature thermal stimulation. They emit light through recombination from the trap levels, a phenomenon called thermoluminescence (TL). The yield of continuous luminescence within a phosphor strongly depends on the activation energy (depth of the trap) and frequency factor within the capture trap [13].
The physical parameters of the captured electron trap level can be determined by analyzing the TL phenomenon. TL is a phenomenon in which electrons from the valence band that absorb the energy of radiation irradiated to a medium are excited to the conduction band and then trapped at the electron trap level. When heat is applied, the trapped electrons are re-excited and emit light as they descend to the ground level [15,16]. Luminescence is used in personal dosimetry because the amount of luminescence generated at this time is proportional to the radiation dose. The temperature applied to the sample determines the amount of light emitted, expressed as a TL glow curve (glow curve) and can be used to obtain physical information regarding the electron trap level [17]. There are various methods for analyzing TL glow curves, such as the peak shape [18], initial rise [19], and heating rate [20] methods. Physical parameter analyses of trap levels using artificial intelligence libraries have also been performed [21]. This study used the peak shape and initial rise methods to determine the physical parameters of the trap level. The peak shape method proposed by Chen [20] determines the physical parameters of a TL electron trap level by obtaining the values of ω, τ, and δ, which are parameters of the peak at the center temperature (Tg) of a single TL intensity curve and at points corresponding to half the height of the TL intensity. In general-order TL, when electrons trapped in the trap level emit light through thermostimulation, a phenomenon in which some of these electrons are recombined to the trap level also occurs. The values of TL peak parameters ω, τ, and δ are determined based on the recombination rate, and the higher the recombination rate, the higher the value of the symmetry factor (μg (/δ)). Chen [20] determined the activation energy (E) of the TL peak using three parameters of the TL peak, combining Equations (1)–(3) into a single TL glow curve peak, and obtained the kinetic order (m) and frequency factor (s) using Equations (4) and (5), respectively.
E ω = 2.52 + 10.2 μ g 0.42 k T g 2 ω 2 k T g ,
E T = 1.51 + 3 μ g 0.42 k T g 2 τ 1.58 + 4.2 μ g 0.42 2 k T g ,
E δ = 0.976 + 7.3 μ g 0.42 k T g 2 δ ,
m = e ( 2.962 + 7.064 μ g ) ,
s = e E k T g β k T g 2 ( 1 + 2 k T g E ) 1 ,
where E is the activation energy (eV), k is the Boltzmann constant at 8.617 × 10⁻⁵ (eV/K), μg is the symmetry factor (=ω/δ), T is the heating temperature, Tg is the peak temperature of the glow peak (K), m is the kinetic order, s is the frequency factor (s−1), and β is the heating rate (K/s). The activation energy (E) refers to the depth of electron traps contributing to TL. The kinetic order (m) is a physical quantity representing the luminescence and recombination of electrons trapped in TL; it increases for a significant amount of recapture. Frequency factors indicate the frequency of electrons trapped at the capture level.
Rawat et al. [19] proposed the initial rise method for determining the activation energy of the trap level from the initial rise in the TL glow curve. The initial rise method can be used to determine the activation energy using Equation (6) in the early stages of the increasing intensity of the TL glow curve. From Equation (6), the activation energy can be determined from the slope of a straight line on a graph of the logarithm value ln[I(T)] of TL intensity against 1/T.
ln I T = E k T + C ,
where E is the activation energy of the trap level (eV), I(T) is the TL intensity of the glow curve according to the heating temperature, k is the Boltzmann constant at 8.617 × 10⁻⁵ (eV/K), and T is the heating temperature (K).
The activation energy and frequency factor of the trap level determine the lifetime (τ) of electron carriers trapped at the trap level, as expressed in Equation (7) [22].
1 τ t r a p T , E = s r e E k T , τ m i g = i τ i ,
where τ t r a p is the trap lifetime (s), τ m i g is the migration time (s), E is the activation energy (eV), T is the temperature (K), k is the Boltzmann constant at 8.617 × 10⁻⁵ (eV/K), and s is the frequency factor (s−1).

2.2. X-ray Diffraction (XRD) of Na8Al6Si6O24(Cl,S)2 Hackmanite

Figure 2 shows a photograph of the hackmanite crystals used in this study. This crystal was pale gray, 7 mm long, 5 mm wide, and 3 mm thick. The structure and phase composition of the Na8Al6Si6O24(Cl,S)2 hackmanite sample were determined through powder XRD using a Shimadzu XRD-6100 X-ray diffractometer (Kyoto, Japan) with a Cu-Kα X-ray source. The XRD pattern was measured in the 2θ range of 10° to 80°. The XRD pattern of the sample, as shown in Figure 3, was well indexed to the same structure as that of reference No. 01-072-0029;15336 (ICSD), except for a few peaks at approximately 30°. The crystal structure and space group of the hackmanite are cubic, with a lattice constant of 8.870 Å and (218) [23,24].

2.3. TL Reader

Figure 4 shows the reader (Neosis Korea, Neo TL reader, Daegeon, Republic of Korea) used to obtain the TL measurements of the Na8Al6Si6O24(Cl,S)2 hackmanite sample at room temperature with a fixed heating rate of 5 K/s. X-rays were irradiated using a diagnostic X-ray generator (MIS Co., Daegeon, Republic of Korea) with a tube voltage, a tube current, and an irradiation time of 70 kV, 200 mA, and 0.2 ms, respectively. The exposure at a distance of 100 cm was 76 mR. The measured glow curve was separated through deconvolution using the TL/OSL Glow Curve Analyzer (ver. 1.1.0), and each peak was analyzed [25,26].

3. Results and Discussion

3.1. Measurement of the TL Glow Curve of Na8Al6Si6O24(Cl,S)2

Figure 5 shows the temperature over time and the TL glow curve of the Na8Al6Si6O24(Cl,S)2 hackmanite, measured using the Neo TL reader. The TL glow curve was measured from room temperature to a maximum of 570 K at a heating rate (β) of 5 K/s. The upper graph in Figure 5 presents the heating temperature measurement of the TL reader, and the sample temperature linearly increases in the measurement range from 273 K to 643 K. The lower graph in Figure 5 shows the glow curve measured at this time, and the TL measured data sampling rate was 10 Hz. The measured TL glow curve of the Na8Al6Si6O24(Cl,S)2 crystal comprised multiple peaks. The TL glow peaks were analyzed after removing the background.

3.2. Analyzed TL Trap Parameters through the De-Convolution Method

Figure 6 shows the TL glow curve of the Na8Al6Si6O24(Cl,S)2 hackmanite after removing the background, which was separated into glow peaks using the TL/OSL Glow Curve Analyzer (ver. 1.1.0) software. As shown in Figure 6, five of the six separated peaks, accounting for 99% of the total luminescence, were determined as the main peaks contributing to hackmanite’s thermoluminescence, and, at this time, the figure of merit (FOM) representing the goodness of fit of the deconvolution data was 4.9% [27]. At least five peaks were observed, indicating the existence of over five trap levels with different energy levels. Table 1 lists the physical parameters of the five main traps determined through deconvolution. For the second peak, which contributed the most to luminescence, the activation energy of the trap level was approximately 1.13 eV and the frequency factor was 4.94 × 10¹³ s−1.

3.3. Analysis of TL Trap Parameters through the Peak Shape Method

Figure 7 shows the peak shape analysis results of peaks 1 and 2, that is, the main peaks of the Na8Al6Si6O24(Cl,S)2 hackmanite. Using a heating rate of 5 K/s, the peak temperatures obtained for peaks 1 and 2 were T1g = 365 K and T2g = 403 K, respectively, and the half-widths of the peaks were ω1 = 40.1 K and ω2 = 42.7 K, respectively. The symmetry factors for peaks 1 and 2 were μ1g(δ1/ω1) = 0.46 and μ2g(δ2/ω2) = 0.53, respectively. The activation energies, kinetic orders, and frequency factors of the Na8Al6Si6O24(Cl,S)2 hackmanite trap levels were determined through the peak shape method using Equations (1)–(5) and are listed in Table 2.

3.4. Analysis of TL Trap Parameters through the Initial Rise Method

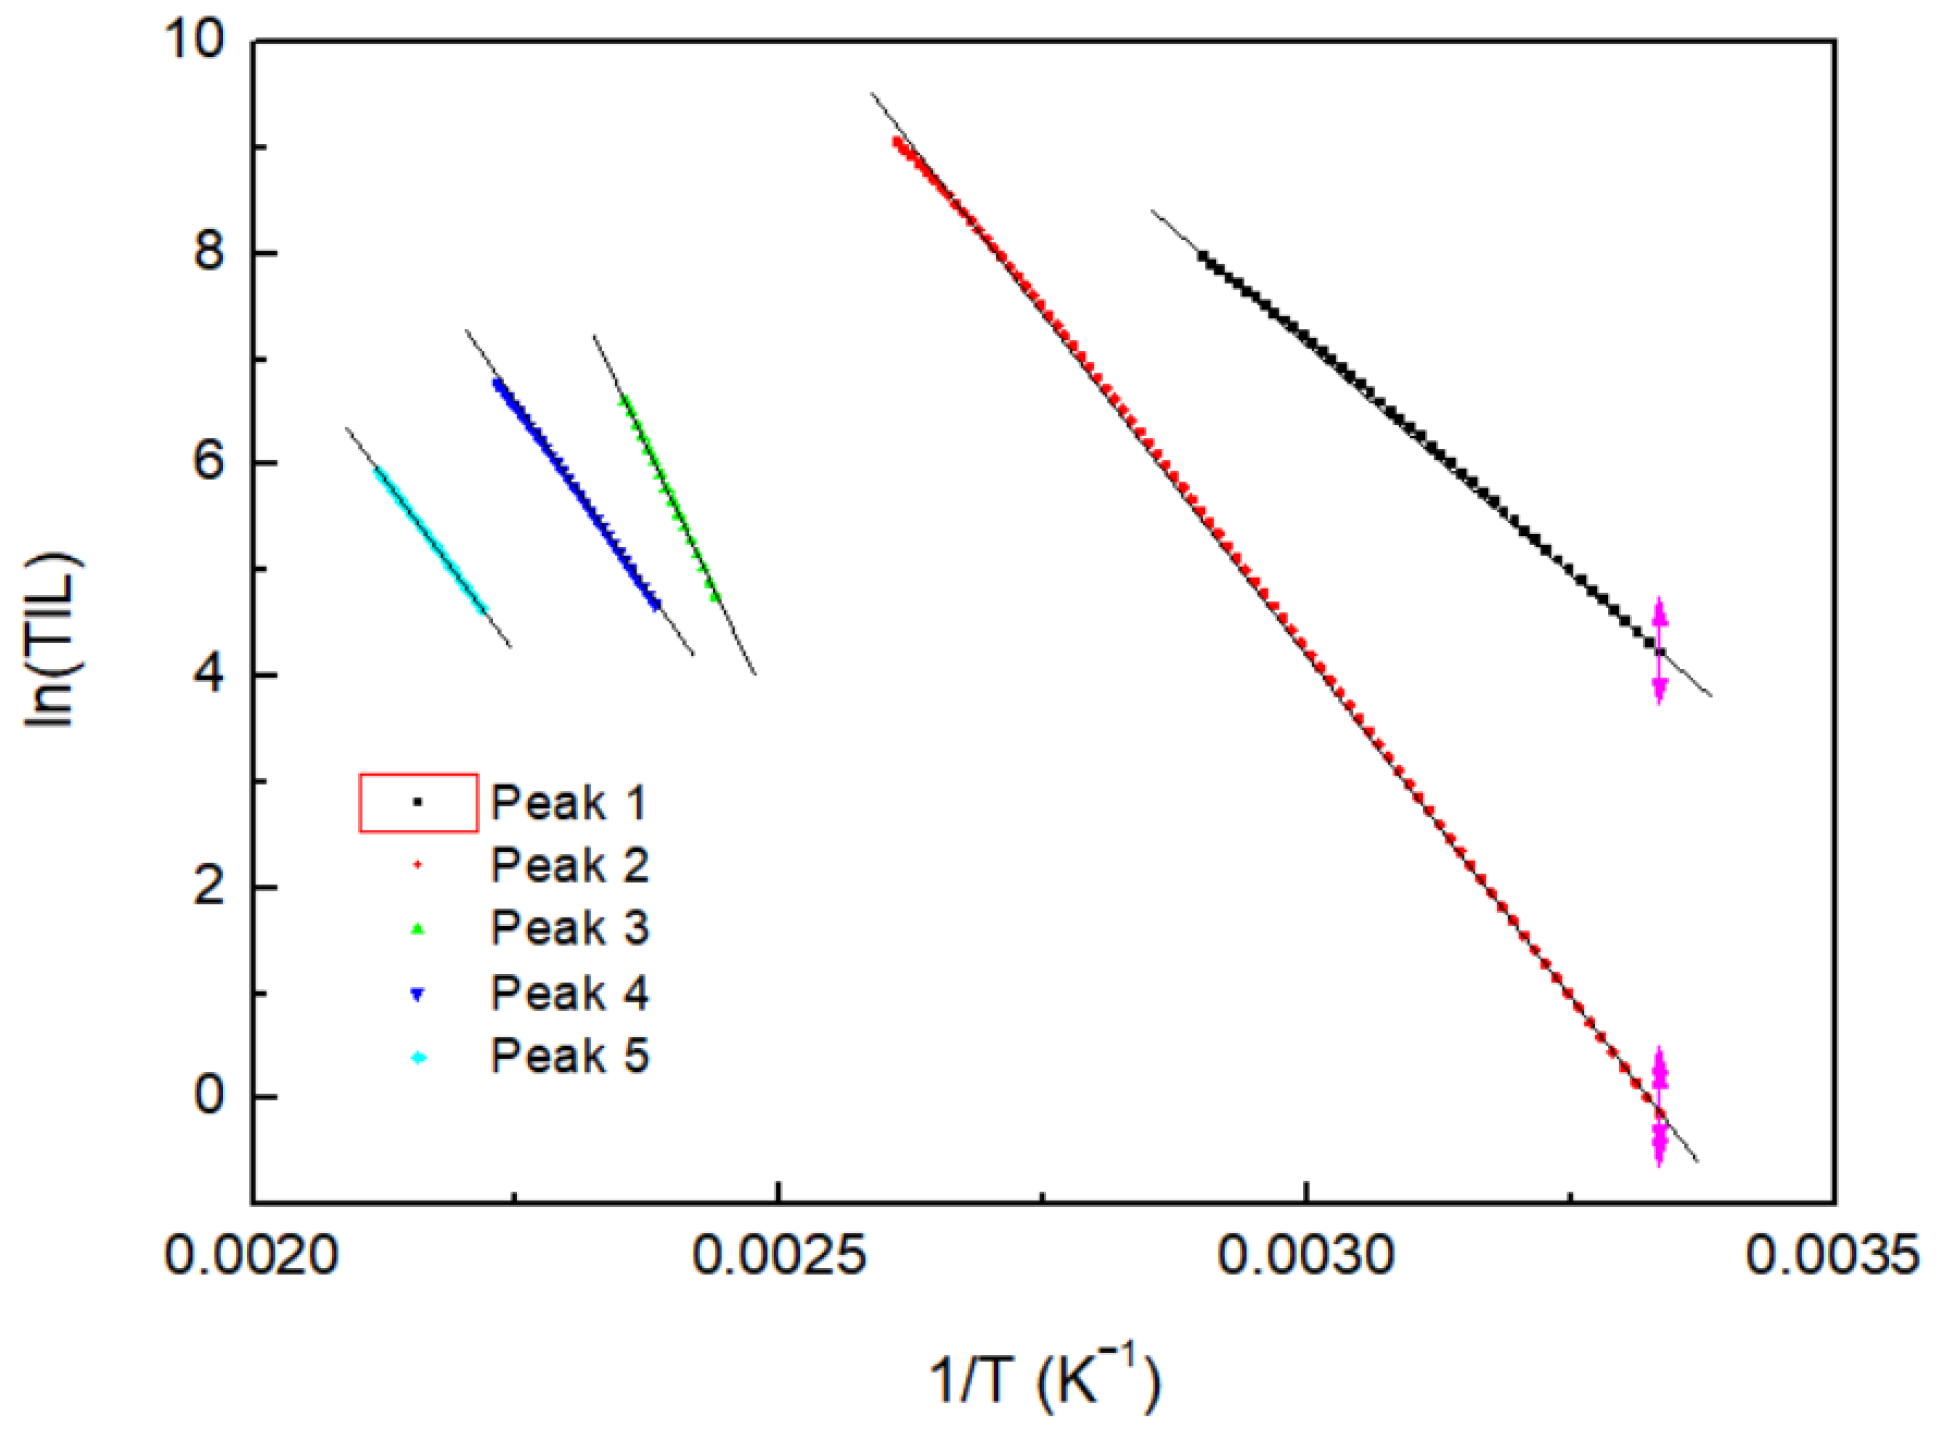
The initial rise method can determine the activation energy regardless of the kinetic order from the initial temperature rise during the heating of the TL glow curve. Figure 8 shows the fitting of ln (I(T)) vs. 1/T for the initial increase in the peaks in the TL glow curve of the Na8Al6Si6O24(Cl,S)2 hackmanite. The activation energy was determined from the slope of the fitted linear function. Table 2 lists the activation energies of the five peaks of the Na8Al6Si6O24(Cl,S)2 hackmanite that were determined through the initial rise method. The activation energies of 0.75, 1.11, 1.85, 1.21, and 1.14 eV are similar to the results obtained through the peak shape method.
Hackmanite is known to exhibit color-change characteristics when exposed to radiation and slow emission (afterglow), owing to a temporal delay. These characteristics are attributed to the activity of electrons captured at the trap level. The Na8Al6Si6O24(Cl,S)2 hackmanite TL trap level parameters obtained through the deconvolution, peak shape, and initial rise methods were within an acceptable error range. The initial rise method is generally known to measure slightly lower temperatures than other measurement methods because it analyzes the initial temperature rise during heating [19]. The experimentally determined lifetimes of the peak traps were 3.59, 2.71, 1.47, 3.34, and 3.91 s, and the migration time estimated using Equation (7) was 15.0 s.

4. Conclusions

This study measured a TL glow curve with a peak at 402 K at a 5 K/s heating rate to analyze the electron capture traps of Na8Al6Si6O24(Cl,S)2 hackmanite. The analysis using the deconvolution method revealed that the glow curve of Na8Al6Si6O24(Cl,S)2 hackmanite had over five trap levels contributing to luminescence. The physical parameters of each trap level were determined. The trap level depth yielded the same results within the acceptable error range for the deconvolution, peak shape, and initial rise methods. In addition, a direct correlation between the activation energy and frequency factor of the trap level and the lifetime of each trap was confirmed. A migration time of 15.0 s was determined, and a correlation between the trap level contributing to the persistent luminescence and the TL of Na8Al6Si6O24(Cl,S)2 hackmanite was confirmed.

Author Contributions

Conceptualization, S.-H.K.; methodology, S.-H.K.; software, S.-C.K.; formal analysis, S.-H.K.; data curation, S.-H.K.; writing—original draft preparation, S.-C.K.; writing—review and editing, S.-H.K.; project administration, S.-C.K.; funding acquisition, S.-H.K. and S.-C.K. All authors have read and agreed to the published version of the manuscript.

Funding

This work received support from the Radiation Technology R&D program, funded by the Ministry of Science and ICT, National Research Foundation of Korea (2020M2C8A1056950).

Institutional Review Board Statement

Not applicable.

Informed Consent Statement

Not applicable.

Data Availability Statement

The datasets used and/or analyzed during the current study are available from the corresponding author on reasonable request.

Conflicts of Interest

The authors declare no conflict of interest.

References

  1. Agamah, C.; Vuori, S.; Colinet, P.; Norrbo, I.; de Carvalho, J.M.; Nakamura, L.K.O.; Lindblom, J.; van Goethem, L.; Emmermann, A.; Saarinen, T.; et al. Hackmanite-The Natural Glow-in-the-Dark Material. Chem. Mater. 2020, 32, 8895–8905. [Google Scholar] [CrossRef]
  2. Norrbo, I.; Gluchowski, P.; Hyppänen, I.; Laihinen, T.; Laukkanen, P.; Mäkelä, J.; Mamedov, F.; Santos, H.S.; Sinkkonen, J.; Tuomisto, M.; et al. Mechanisms of Tenebrescence and Persistent Luminescence in Synthetic Hackmanite Na8Al6Si6O24(Cl,S)2. ACS Appl. Mater. Interfaces 2016, 8, 11592–11602. [Google Scholar] [CrossRef] [PubMed]
  3. Williams, E.R.; Simmonds, A.; Armstrong, J.A.; Weller, M.T. Compositional and structural control of tenebrescence. J. Mater. Chem. 2010, 20, 10883–10887. [Google Scholar] [CrossRef]
  4. Vuori, S.; Colinet, P.; Norrbo, I.; Steininger, R.; Saarinen, T.; Palonen, H.; Paturi, P.; Rodrigues, L.C.V.; Göttlicher, J.; Le Bahers, T.; et al. Detection of X-Ray Doses with Color-Changing Hackmanites: Mechanism and Application. Adv. Opt. Mater. 2021, 9, 2100762. [Google Scholar] [CrossRef]
  5. Medved, D.B. Hackmanite and its tenebrescent properties. J. Earth Planet. Mater. 1954, 39, 615–629. [Google Scholar]
  6. Norrbo, I.; Gluchowski, P.; Paturi, P.; Sinkkonen, J.; Lastusaari, M. Persistent Luminescence of Tenebrescent Na8Al6Si6O24(Cl,S)2: Multifunctional Optical Markers. Inorg. Chem. 2015, 54, 7717–7724. [Google Scholar] [CrossRef]
  7. Rahim, F.A.; Miller, A.; McLaughlin, W.L. Response of Radiation Monitoring Labels to Gamma Rays and Electrons. Radiat. Phys. Chem. 1985, 25, 767–775. [Google Scholar] [CrossRef]
  8. Badour, Y.; Jubera, V.; Andron, I.; Frayret, C.; Gaudon, M. Photochromism in inorganic crystallised compounds. Opt. Mater. X 2021, 12, 100110. [Google Scholar] [CrossRef]
  9. Vuori, S.; Byron, H.; Norrbo, I.; Tuomisto, M.; Lastusaari, M. Photochromic photography with hackmanite obtained by large-scale synthesis. J. Ind. Eng. Chem. 2023, 120, 361–373. [Google Scholar] [CrossRef]
  10. Zhang, L.-T.; Fu, Z.-X.; Yin, J.-C.; Liu, M.; Zhang, Y.-Q.; Lan, L.; Li, N.; Bu, X.-H. UV and X-ray dual-induced photochromism in a benzophenone-based metal–organic framework for inkless erasable printing. CrystEngComm 2023, 25, 4019–4023. [Google Scholar] [CrossRef]
  11. Zhang, H.; Wu, X. Calix-Like Metal-Organic Complex for High-Sensitive X-Ray-Induced Photochromism. Adv. Sci. 2015, 3, 1500224. [Google Scholar] [CrossRef] [PubMed]
  12. Lu, H.; Xie, J.; Wang, X.Y.; Wang, Y.; Li, Z.J.; Diefenbach, K.; Pan, Q.J.; Qian, Y.; Wang, J.Q.; Wang, S.; et al. Visible colorimetric dosimetry of UV and ionizing radiations by a dual-module photochromic nanocluster. Nat. Commun. 2021, 12, 2798. [Google Scholar] [CrossRef] [PubMed]
  13. Byron, H.; Norrbo, I.; Lastusaari, M. A zeolite-free synthesis of luminescent and photochromic hackmanites. J. Alloys Compd. 2021, 872, 159671. [Google Scholar] [CrossRef]
  14. El-Faramawy, N.A.; El-Kameesy, S.U.; El-Agramy, A.; Metwally, G. The dosimetric properties of in-house prepared copper doped lithium borate examined using the TL-technique. Radiat. Phys. Chem. 2000, 58, 9–13. [Google Scholar] [CrossRef]
  15. Mori, Y.; Kuroda, I.; Nakajima, S.; Sasaki, T.; Nakai, S. New nonlinear optical crystal: Cesium lithium borate. Appl. Phys. Lett. 1995, 67, 1818–1820. [Google Scholar] [CrossRef]
  16. Basun, S.; Imbusch, G.F.; Jia, D.D.; Yen, W.M. The analysis of thermoluminescence glow curves. J. Lumin. 2003, 104, 283–294. [Google Scholar] [CrossRef]
  17. Majewska, N.; Leśniewki, T.; Mahlik, S.; Grinberg, M.; Chruścińska, A.; Michalik, D.; Sopicka-Lizer, M. Study of persistent luminescence and thermoluminescence in SrSi2N2O2:Eu2+,Ce3+,Dy3+,Nd3+. Phys. Chem. Chem. Phys. 2020, 22, 17152–17159. [Google Scholar] [CrossRef]
  18. Sadek, A.M.; Eissa, H.M.; Basha, A.M.; Kitis, G. Development of the peak fitting and peak shape methods to analyze the thermoluminescence glow-curves generated with exponential heating function. Nucl. Instrum. Methods Phys. Res. B 2014, 330, 103–107. [Google Scholar] [CrossRef]
  19. Rawat, N.S.; Kulkarni, M.S.; Mishra, D.R.; Bhatt, B.C.; Sunta, C.M.; Gupta, S.K.; Sharma, D.N. Use of initial rise method to analyze a general-order kinetic thermoluminescence glow curve. Nucl. Instrum. Methods Phys. Res. B 2009, 267, 3475–3479. [Google Scholar] [CrossRef]
  20. Chen, R.; Huntley, D.J.; Berger, G.W. Analysis of Thermoluminescence Data Dominated by Second-Order Kinetics. Phys. Status Solidi 1983, 79, 251–261. [Google Scholar] [CrossRef]
  21. Abd El-Hafez, A.I.; Yasin, M.N.; Sadek, A.M. GCAFIT—A new tool for glow curve analysis in thermoluminescence nanodosimetry. Nucl. Instrum. Methods Phys. Res. A 2011, 637, 158–163. [Google Scholar] [CrossRef]
  22. Sang, N.D.; Thi, H.H.Q. Using the genetic algorithm to detect kinetic parameters of thermoluminescence glow curves. Nucl. Instrum. Methods Phys. Res. B 2022, 517, 33–42. [Google Scholar] [CrossRef]
  23. Armstrong, J.A.; Weller, M.T. Structural observation of photochromism. Chem. Commun. 2006, 10, 1094–1096. [Google Scholar] [CrossRef] [PubMed]
  24. Goettlicher, J.; Kotelnikov, A.; Suk, N.; Kovalski, A.; Vitova, T.; Steininger, R. Sulfur Kα X-ray absorption near-edge structure spectroscopy on the photochrome sodalite variety hackmanite. Cryst. Mater. 2013, 228, 157–171. [Google Scholar] [CrossRef]
  25. Chung, K.S.; Choe, H.S.; Lee, J.I.; Kim, J.L. A new method for the numerical analysis of thermoluminescence glow curve. Radiat. Meas. 2007, 42, 731–734. [Google Scholar] [CrossRef]
  26. Chung, K.S.; Lee, J.I.; Kim, J.L. A computer program for the deconvolution of the thermoluminescence glow curves by employing the interactive trap model. Radiat. Meas. 2012, 47, 766–769. [Google Scholar] [CrossRef]
  27. Misra, S.K.; Eddy, N.W. IFOM, A formula for universal assessment of goodness-of-fit of gamma ray spectra. Nucl. Instr. Methods 1979, 166, 537–540. [Google Scholar] [CrossRef]
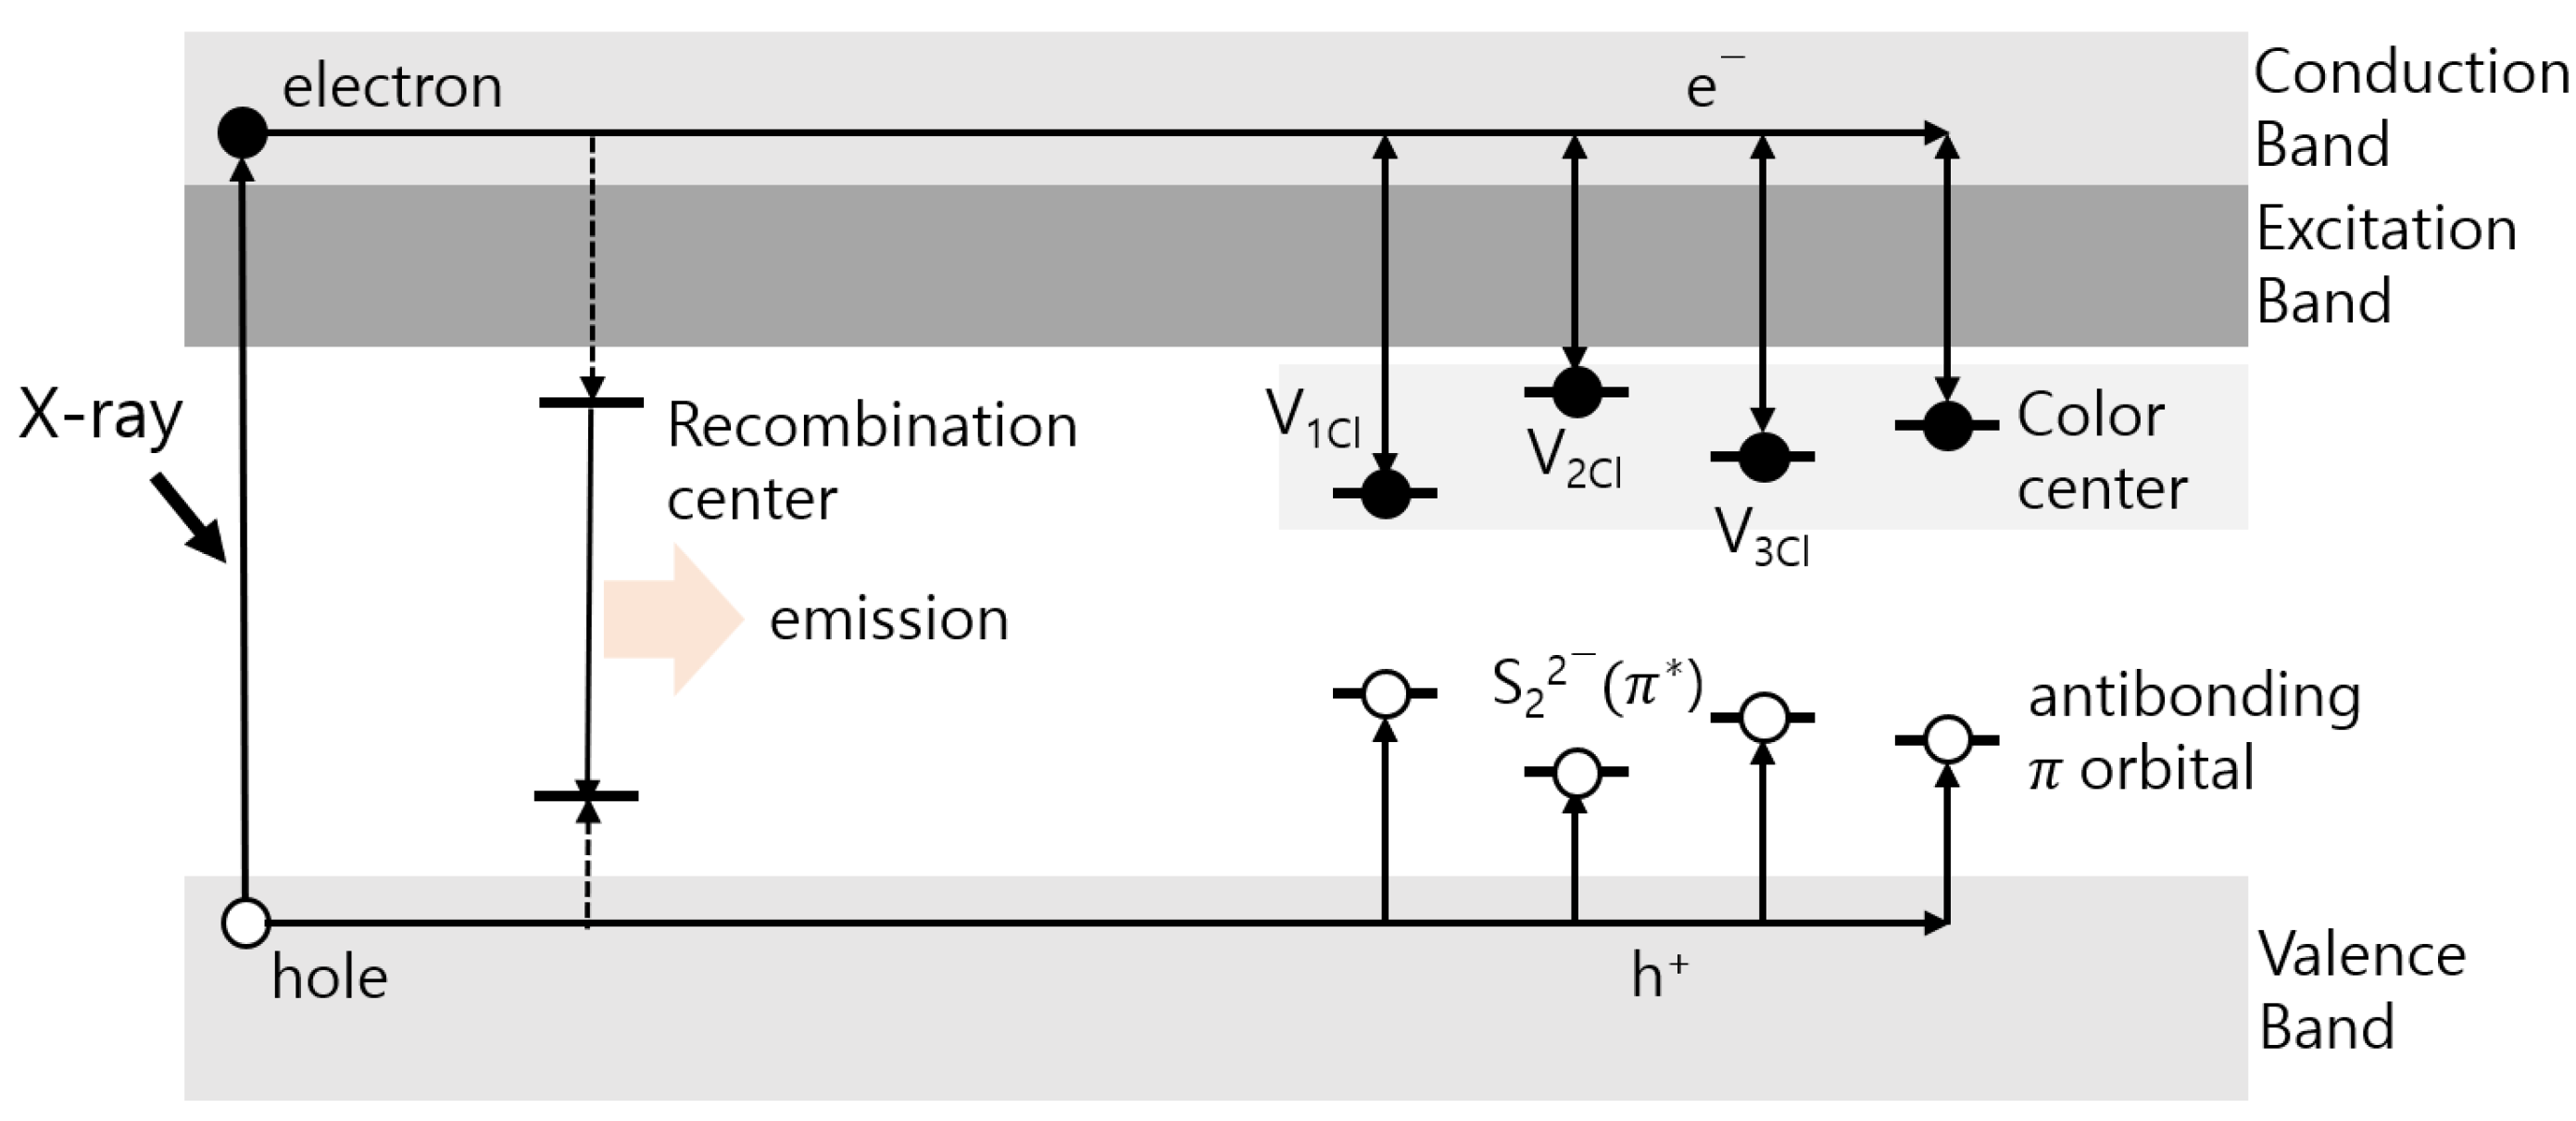
Figure 1. Schematic diagram of the energy band of the persistent luminescence processes.
Materials 16 06776 g001
Figure 2. Photograph of the Na8Al6Si6O24(Cl,S)2 hackmanite sample.
Materials 16 06776 g002
Figure 3. XRD powder diffraction patterns of the hackmanite.
Materials 16 06776 g003
Figure 4. Neo TL reader (Neosis Korea Co., Daejeon, Republic of Korea).
Materials 16 06776 g004
Figure 5. Glow curve of Na8Al6Si6O24(Cl,S)2 and graphical user interface of the TL measurement system (Neosis Korea Co. Daejeon, Republic of Korea).
Materials 16 06776 g005
Figure 6. TL trap parameters of the glow peaks using the TL/OSL Glow Curve Analyzer software (version 1.1.0) [25,26].
Materials 16 06776 g006
Figure 7. Glow curve and first and second peak parameters of the Na8Al6Si6O24(Cl,S)2 hackmanite obtained at a 5 K/s heating rate using the peak shape method.
Materials 16 06776 g007
Figure 8. Activation energies of the Na8Al6Si6O24(Cl,S)2 hackmanite, determined through the initial rise method.
Materials 16 06776 g008
Table 1. Physical parameters of the Na8Al6Si6O24(Cl,S)2 hackmanite determined through deconvolution using the TL/OSL Glow Curve Analyzer (FOM = 4.9%).
PeakActivation Energy (E) (eV)Frequency Factor (s)(s−1)
10.781.33 × 1010
21.134.94 × 1013
31.942.57 × 1021
41.31.51 × 1013
51.191.18 × 1011
Table 2. Physical parameters of the Na8Al6Si6O24(Cl,S)2 hackmanite determined through the peak shape and initial rise methods. * FOM = 4.9%.
PeakTrap Lifetime (s)Temperature (K)μgActivation Energy (eV)
T1Tg T2 ωτδPeak ShapeInitialize
(R2 = 0.998)
Deconv. Method *Avg.
13.59346.5368386.640.1 21.5 18.60.46 0.80   ± 0.02 0.750.78 0.78   ± 0.02
22.71382.9403425.642.7 20.1 22.60.53 1.12   ± 0.02 1.111.13 1.12   ± 0.02
31.47435.4453479.844.4 17.6 26.80.60 1.78   ± 0.05 1.851.94 1.86   ± 0.06
43.34453.6478504.350.7 24.4 26.30.52 1.28   ± 0.01 1.211.3 1.26   ± 0.04
53.91488.3514533.144.8 25.7 19.10.43 1.22   ± 0.01 1.141.19 1.18   ± 0.03
Disclaimer/Publisher’s Note: The statements, opinions and data contained in all publications are solely those of the individual author(s) and contributor(s) and not of MDPI and/or the editor(s). MDPI and/or the editor(s) disclaim responsibility for any injury to people or property resulting from any ideas, methods, instructions or products referred to in the content.