Abstract
The paper presents investigations devoted to the analysis of the thermal contact conduction in a bundle of round steel bars. The phenomenon can be expressed quantitatively with the use of thermal contact conductance (hct). The starting points for the presented analysis were the results of the experimental measurements of the effective thermal conductivity. The measurements were performed for samples of a medium in the form of flat packed beds of bars with three different arrangements: staggered, in-line, and crossed and four bar diameters: 10, 20, 30, and 40 mm. Next, a mathematical model was developed, thanks to which the values of the hct coefficient were calculated for the analyzed cases. This approach consists in analyzing thermal resistances in the medium model, which is defined with an elementary cell. It was established that the value of the hct coefficient in the temperature range of 50–600 °C changes within the range of 50–175 W/(m2·K), and it decreases with an increase in the bar diameter. The final effect of the present study was to develop generalized approximation equations describing changes in thermal contact conductance in the heated bar bundle simultaneously in the temperature and bar diameter function.
1. Introduction
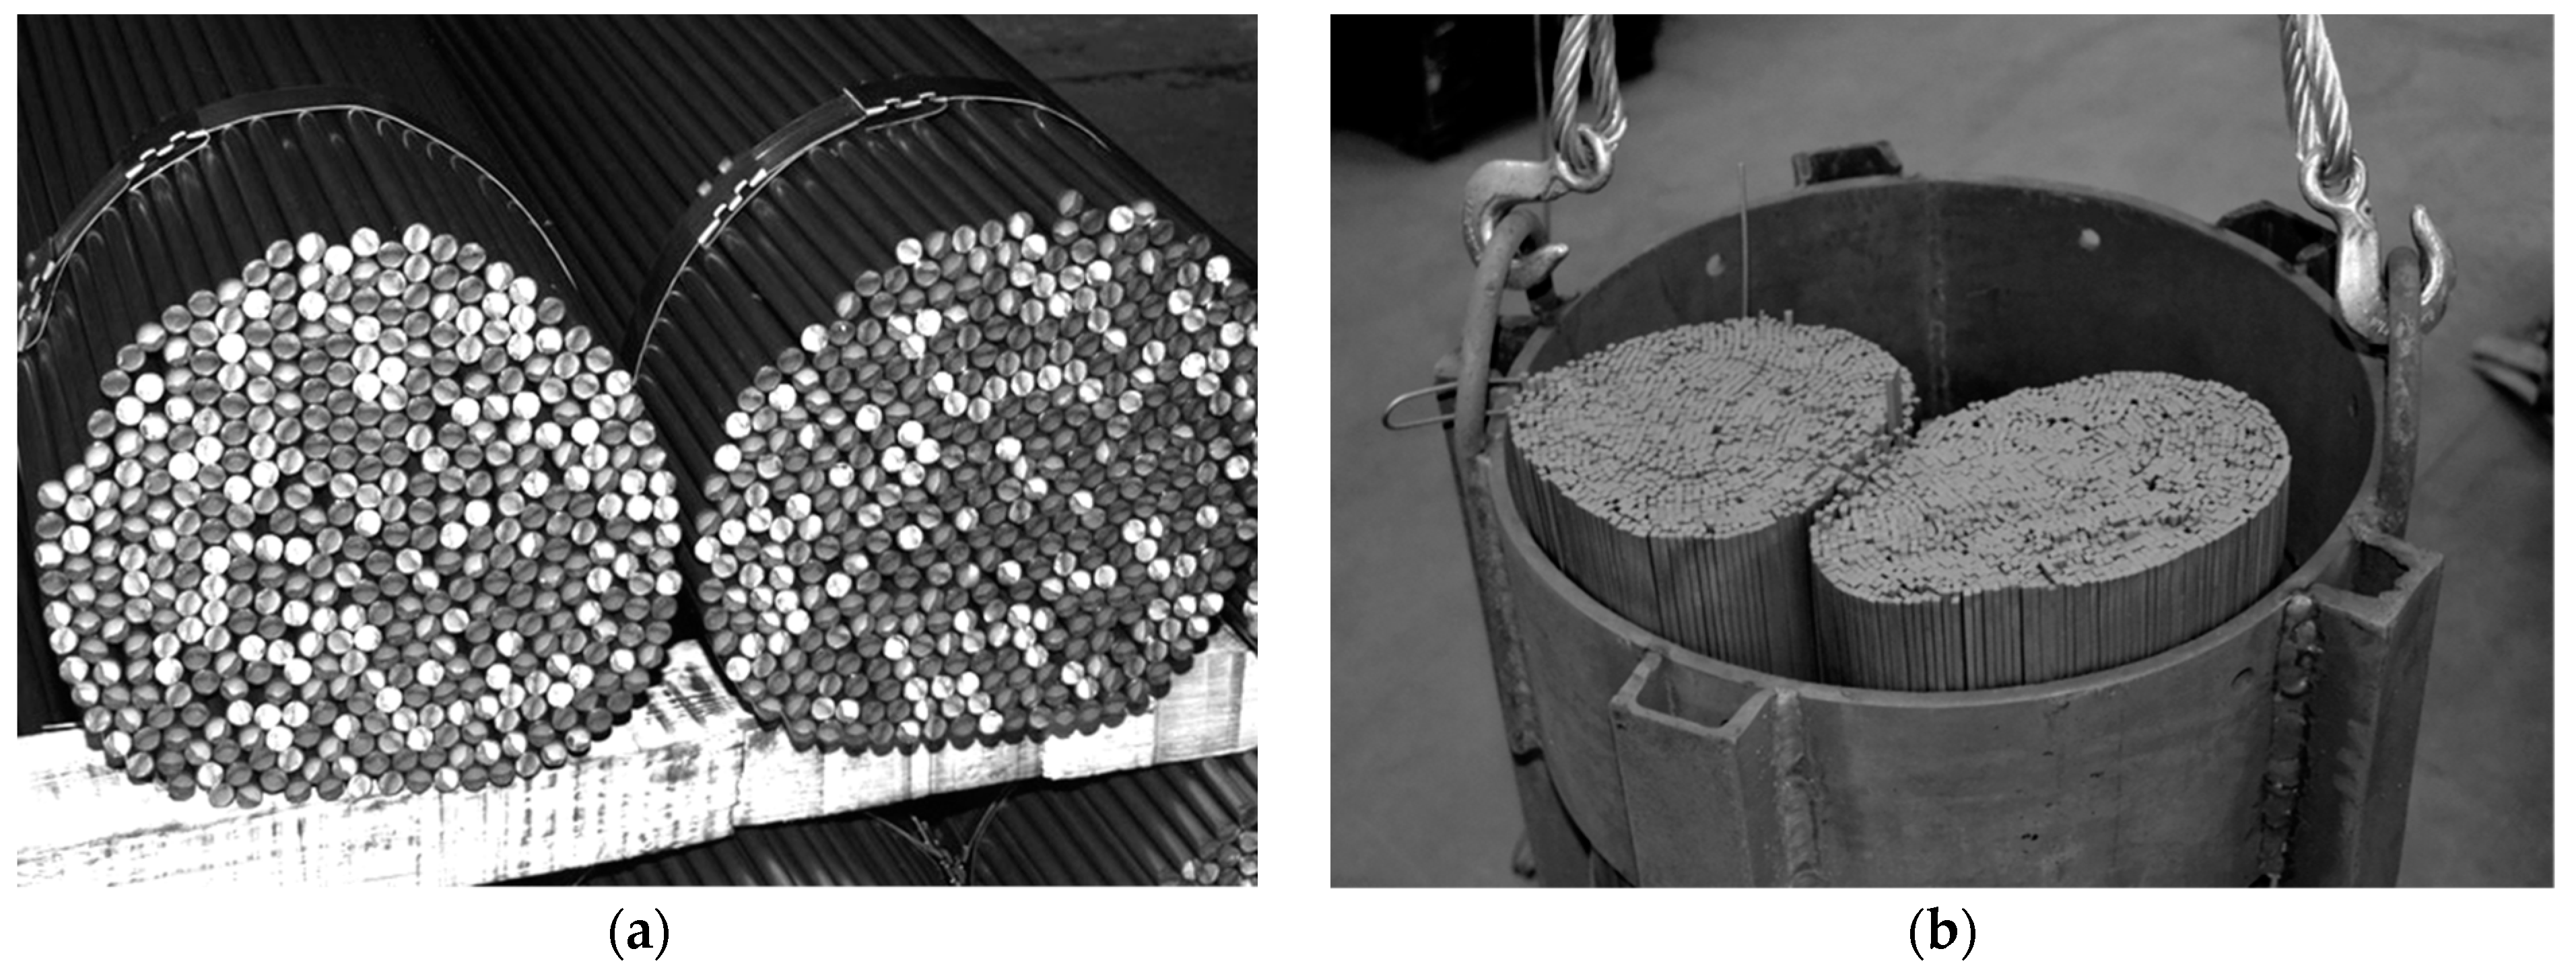
Heat transfer phenomena in low-porosity granular media have been the focus of many scientific and engineering investigations [1,2,3,4,5,6,7]. Bundles of steel bars encountered in metallurgical heat treatment processes are a specific example of such media [8,9]. The bundles of bars presented in Figure 1 are a kind of steel porous charge [10,11].
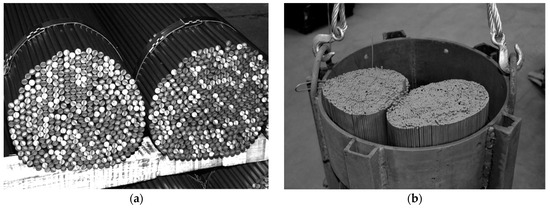
Figure 1.
Bar bundles as an example of a steel porous charge: (a) a general view of a bundle showing its granular structure and (b) bundles prepared for heating in a soaking furnace.
From the macroscopic point of view, the geometry of a bundle can be described with two dimensions: length (lbn) and diameter (dbn). The lbn dimension is usually bigger than the diameter dbn by one order of magnitude. This disproportion means that the speed of temperature changes during the bundle heating and cooling are governed by the thermal processes, which take place in radial direction. In this plane, this charge is characterized by discontinuity of the solid skeleton. For this reason, the basic thermal property of a bundle is the effective thermal conductivity (kef). Knowledge of the value of the kef coefficient is indispensable to efficiently control such heat treatment of a charge. Model calculations are one method of determining the value of kef. In the literature on heat transfer in porous media, there are a number of models that are characterized by different levels of complexity [12,13,14,15,16,17,18]. The simplest models only take into account heat transfer in individual phases (solid and gas ones), which are expressed with the use of the so-called primary parameters. These parameters include the thermal conductivity of a solid skeleton (ks), gas (kg), and medium porosity (φ) [19,20]. More complex models also comprise additional parameters (called secondary parameters), which make it possible to take into account the influence of factors such as the mean size of grains or voids, thermal radiation, and thermal contact conduction between adjacent grains [21,22]. As has been shown based on the authors’ own investigations, only the models which take into account the phenomenon of thermal contact conduction can be applied to calculate the effective thermal conductivity of bar bundles [23]. But in the calculation of the effective thermal conductivity of steel bars with the use of such models, the correct description of the thermal contact conduction phenomena is a very difficult problem. Therefore, knowledge of thermal contact conduction in the bar bundle is critical to model its effective thermal conductivity. This mechanism of heat transfer is quantified by the thermal contact conductance hct, the unit of which is W/(m2·K). The issue of thermal contact conduction is still a current and actively researched topic. Several significant results in this field from recent years can be found in the works of [24,25,26,27]. This paper describes experimental investigations concerned with determining the hct coefficient for bundles of round bars made of low-carbon steel.
2. Materials and Methods
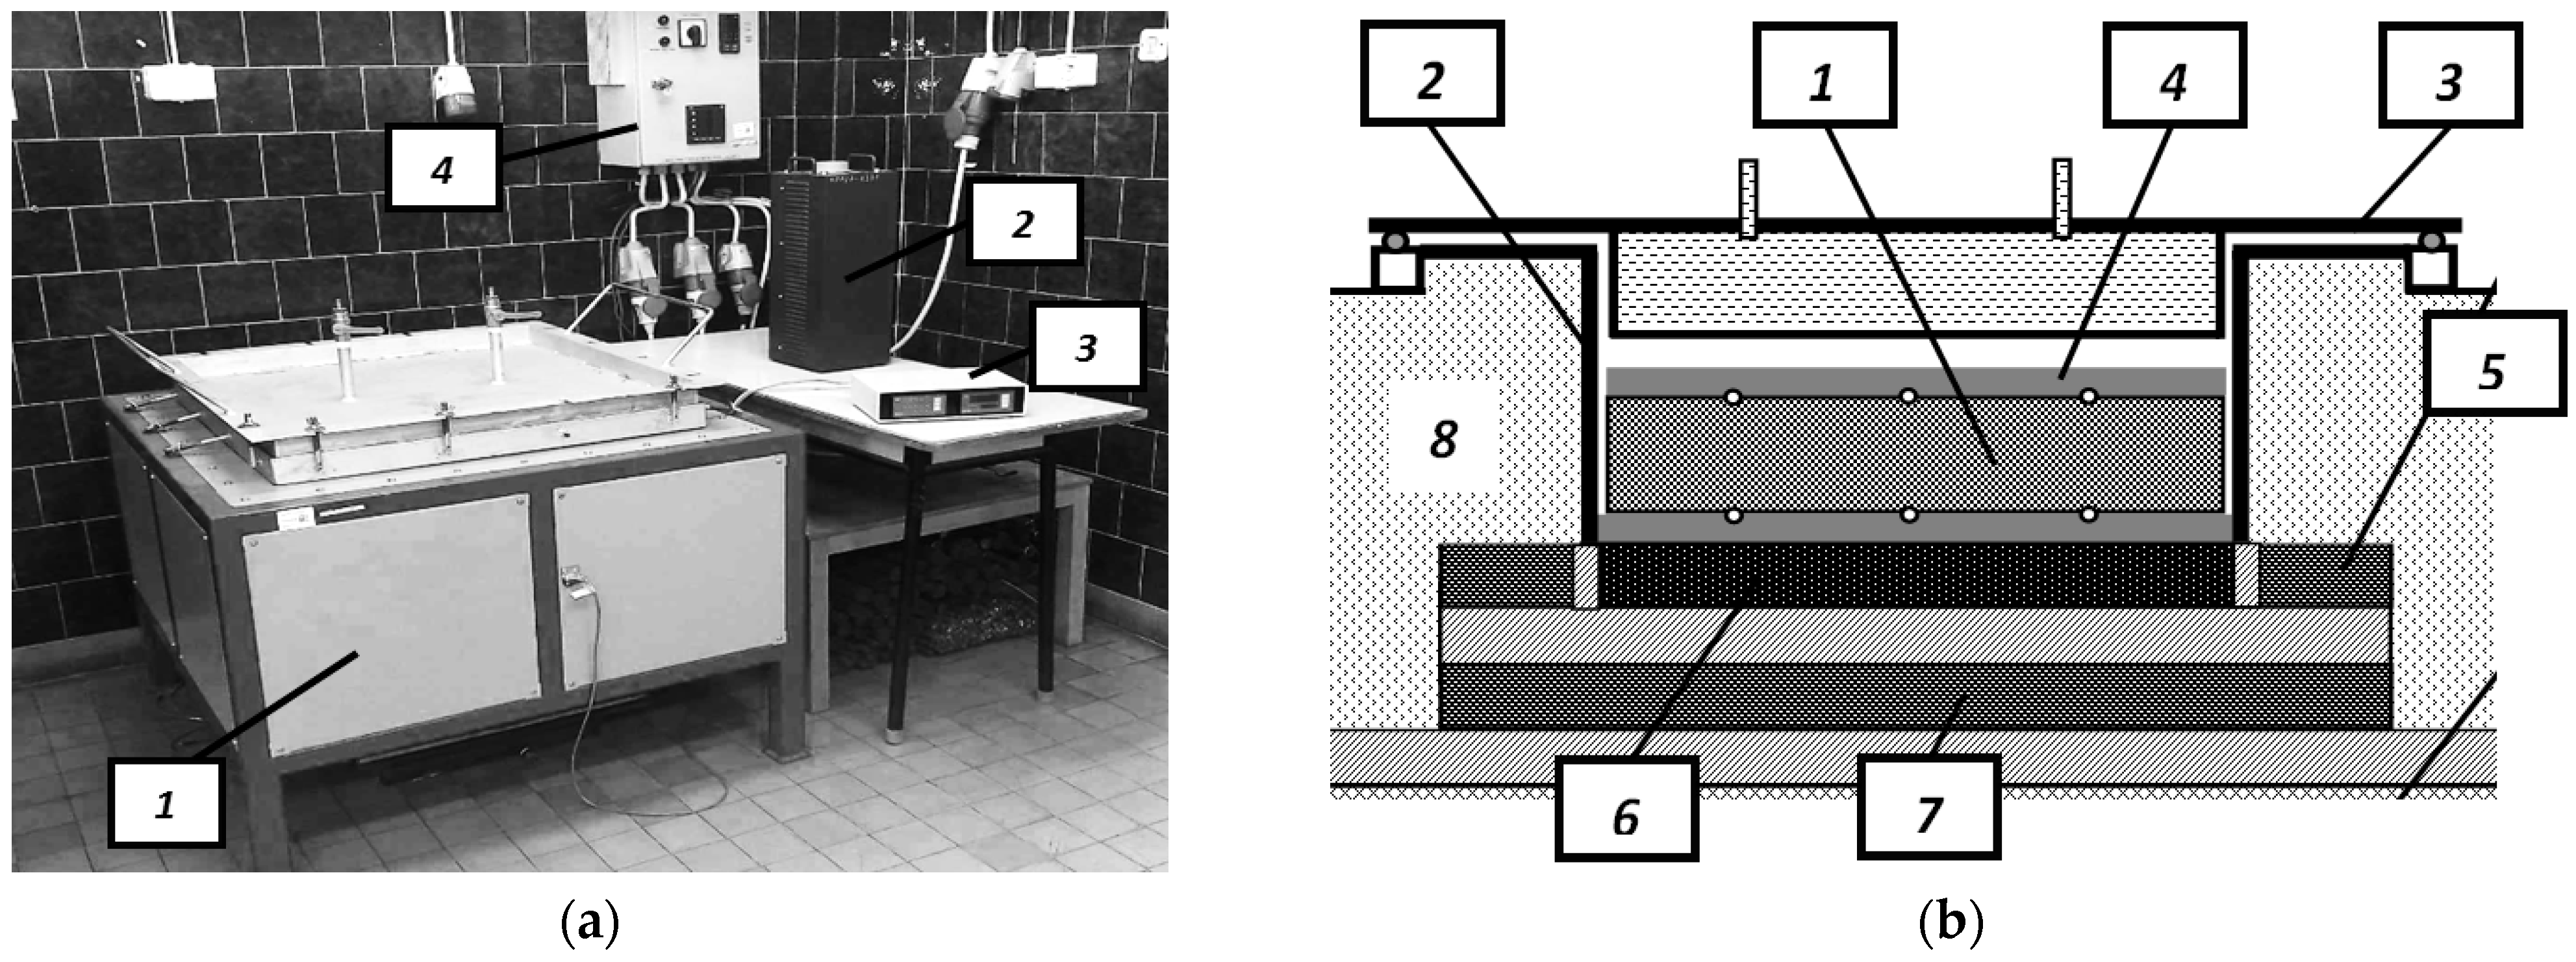
In order to determine the value of the hct coefficient, an original research methodology was used, which is based on the analysis of stationary heat transfer in flat, packed beds of steel bars. The starting points for the analyzed problem were the measurements of the effective thermal conductivity performed on a custom laboratory stand. This stand operates on the principle of a guarded hot-plate apparatus in a one-sided mode described in the ASTM standards [28,29]. Its general view is shown in Figure 2a. The main component of this stand is the heating chamber, which is schematically shown in Figure 2b.
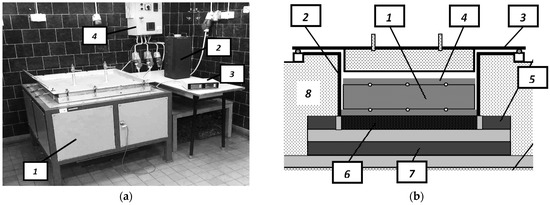
Figure 2.
Testing stand for measuring the effective thermal conductivity: (a) general view of the stand: (1) heating chamber, (2) autotransformer, (3) data logger with temperature meter, and (4) control unit of main and guarded heaters; (b) scheme of the heating chamber: (1) investigated sample, (2) retort with a hot plate, (3) heating chamber cover with a cooler, (4) cold plate, (5) side guarded heater, (6) primary heater, (7) bottom guarded heater, and (8) thermal insulation.
The measurement method consists of applying a stationary, one-dimensional heat flux (q) between the lower and upper surfaces of the specimen. Once a stable condition is achieved, the temperatures at the lower surface (tlo) and the upper surface (tup) are recorded. In a manner akin to the characterization of thermal conductivity for solid materials (ks), the effective thermal conductivity is established as [30,31]:
where (lsp) is the dimension of the sample in the direction of heat flow, denoted as is influenced by factors such as the diameter of the bar, the number of layers in the sample, and their arrangement.
The specimens under examination were positioned at the bottom of a rectangular steel retort with internal dimensions at the base measuring 400 mm × 400 mm. A primary heater with the same transverse dimensions of 400 mm × 400 mm was situated beneath the retort. The heat emitted by the primary heater was entirely transmitted to the sample, ensured by the operation of side- and bottom-guarded heaters. The power of the primary heater could be manually adjusted using an autotransformer, providing control over the measurement temperature. Additionally, a specialized control system automatically regulated the power of the guarded heaters.
Temperature measurements on the lower and upper surfaces were carried out at five opposing locations, using 0.5 mm K-type sheathed thermocouples TP-201 [32], which were connected to a multichannel data logger WRT-9 Box [33]. The thermocouples responsible for recording the bottom surface temperature of the sample were attached to the retort’s bottom, which functioned as the hot plate. In addition, the thermocouples responsible for measuring the top surface temperatures were affixed to a steel plate. This element had a thickness of 15 mm and dimensions of 390 mm × 390 mm, covering the sample and serving as the cold plate.
The heat flux (q) within the sample was calculated as the ratio of the heat flux rate (Q) emitted by the primary heater to its surface area (Aht). The value of Q was considered equal to the current power (Pcu) supplied to this heater. Pcu was measured using a 3-phase power network meter N14 [34]. Measurements were conducted for each sample with different power settings for Pcu, ranging from 200 to 3200 W. This range of power settings allowed for the determination of temperature variations in the coefficient kef. For a more comprehensive understanding of the testing setup and measurement procedure, additional information can be found in the paper written by [35].
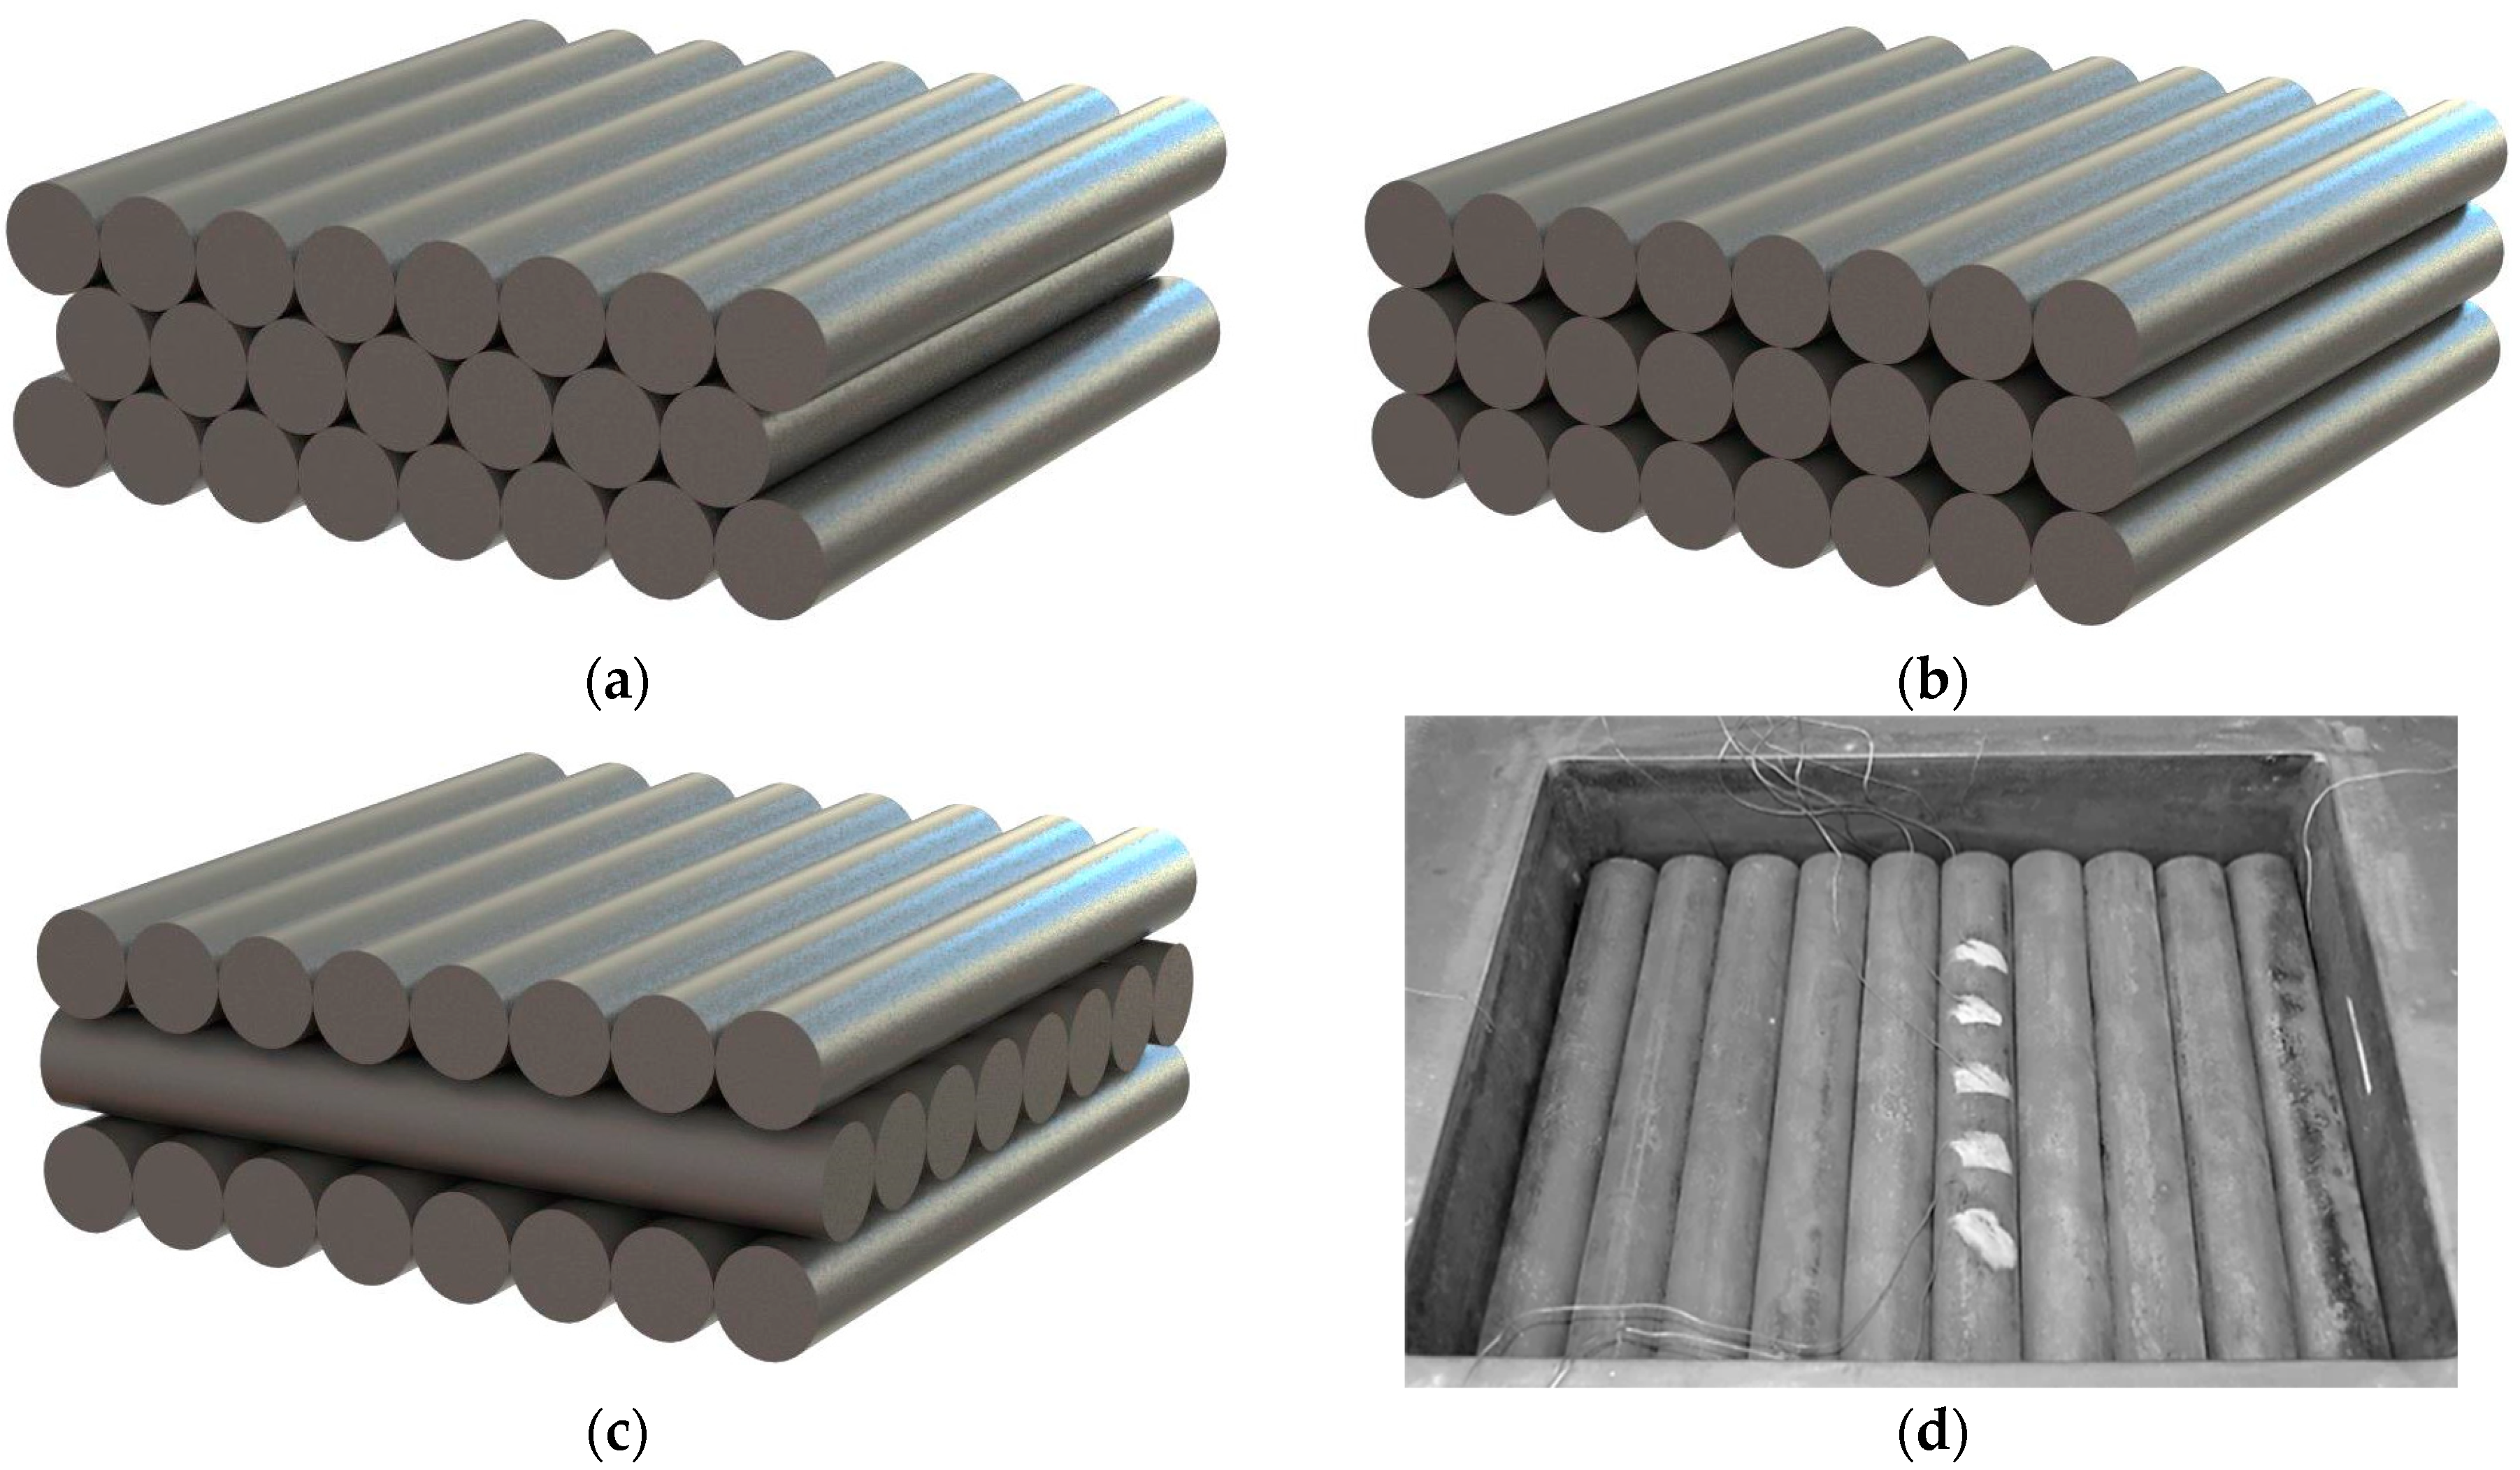
The measurements were performed for 12 samples with four different bar diameters (10, 20, 30, and 40 mm) and three arrangements (staggered ST, in-line IL, and crossed CR) shown in Figure 3. The bars used for the tests were made of S235JRH steel grade, and their chemical composition and mechanical properties are described in the EN 10210-1-2006 standard [36]. According to this document, the maximum element contents in this steel were as follows: C 0.2%; Mn 1.4%; P 0.04%; S 0.04%; and N 0.009%.
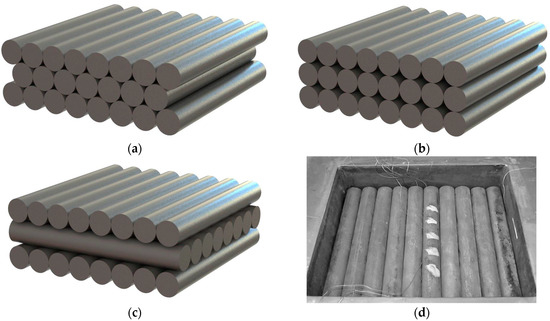
Figure 3.
Investigated samples: (a) a sample with a staggered arrangement, (b) a sample with an in-line arrangement, (c) a sample with a crossed arrangement, and (d) one of the samples made of 40 mm bars inside the heating chamber.
For each sample, experiments were made for the temperature range of 50–600 °C. As can be seen, samples with individual types of arrangement differ in geometrical conditions of contact between adjacent bars. This differentiation of course affects the intensity of thermal contact conduction phenomena. Therefore, comparison of the results obtained for various sample types provides information on the problem analyzed in the study.
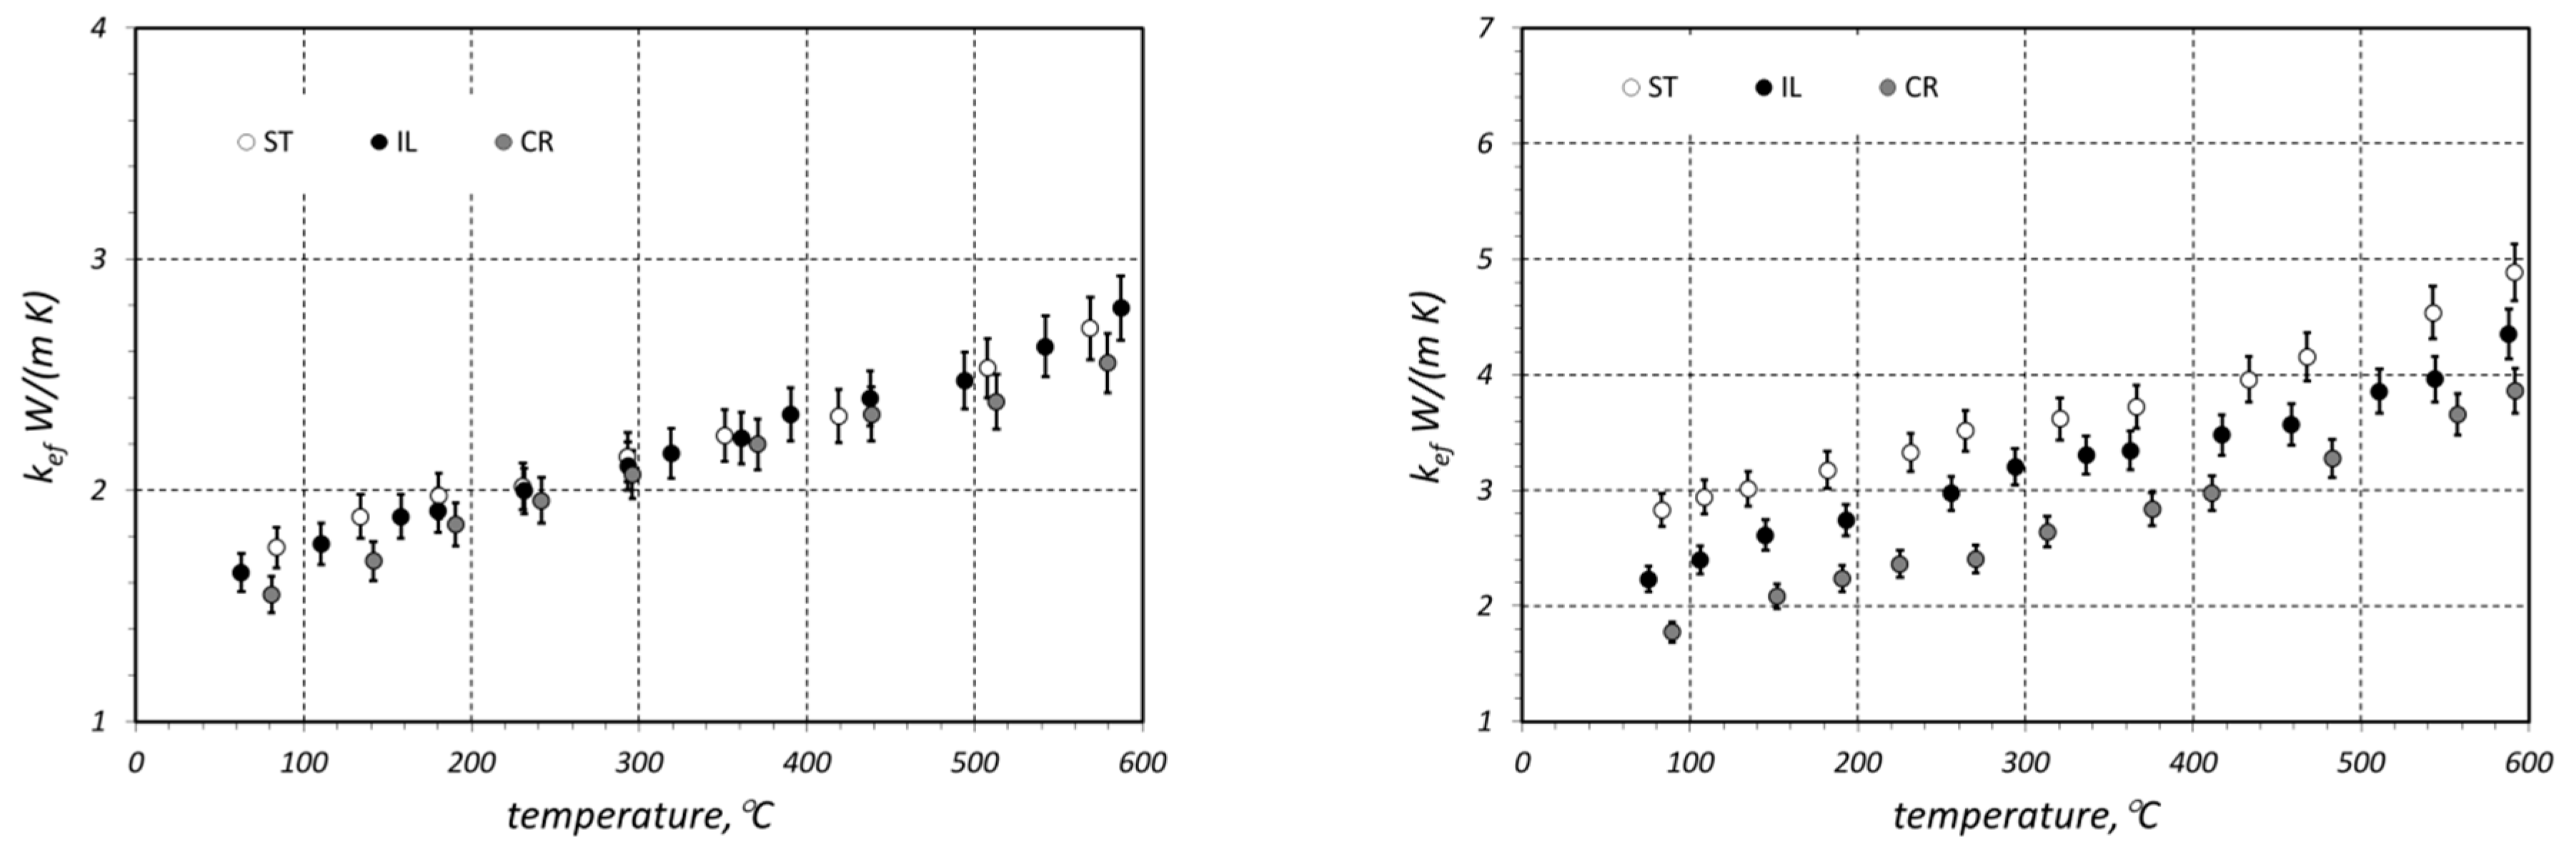
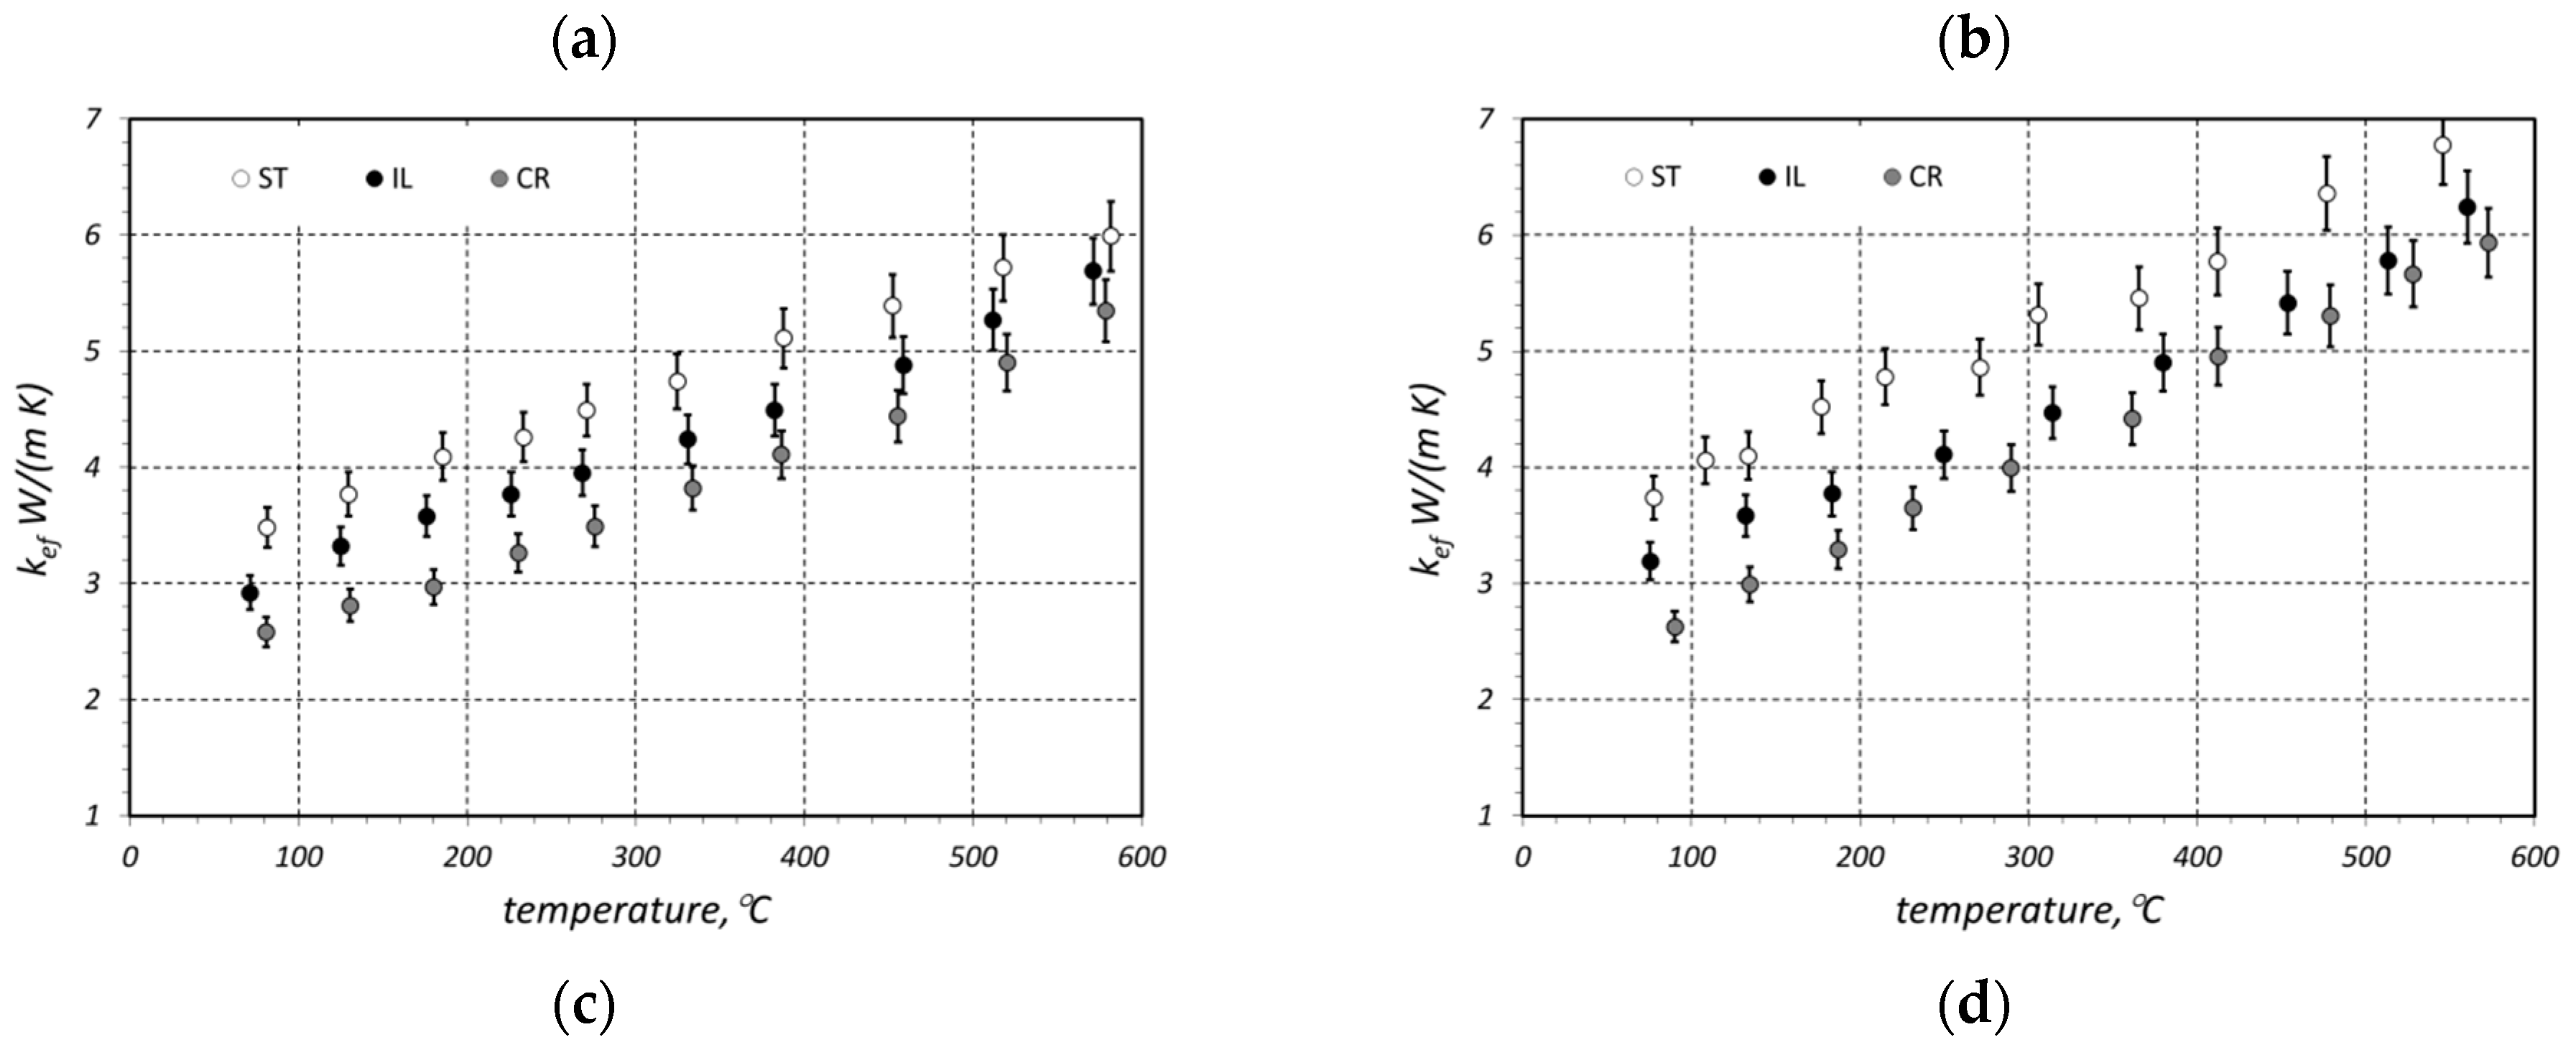
The results of the kef measurements are presented in Figure 4. The maximum measurement uncertainty (δkef) was estimated from an error propagation equation [37], and its maximal value was 4.7% [35]. The parameter δkef is marked in the graphs by error bars. Each of the graphs presents the results obtained for the three samples (with different arrangement) made of bars with the same diameter. Therefore, comparison of the results presented in one diagram reveals the effect of sample arrangement on the value of kef. Except for the samples made of bars with diameter of 10 mm, the results obtained for other cases are unequivocal. The greatest value of kef coefficient was observed for staggered (ST) samples, whereas the lowest value was found for the crossed (CR) arrangement. In the latter type, the bars from individual layers are in contact along the whole length, with one bar in contact with two bars from another layer. In the CR samples, due to the crossing of the bars, the contact occurs on many-times smaller, discrete surfaces. The intermediate values of the effective conductivity were obtained for the in-line samples (IL), where bars were in contact along the whole length. However, in this case, each bar from one layer is in contact with only one bar from the next layer. These results demonstrate that contact conduction, with its intensity in granular materials depending on the contact surface area between the adjacent particles, plays a substantial role in the complex heat flow that occurs in bar bundles.

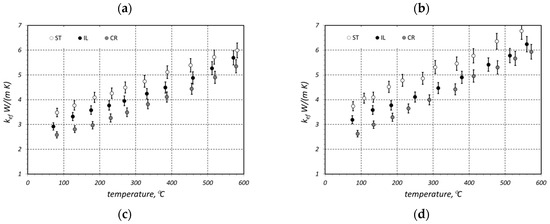
Figure 4.
Measured values of the kef coefficient obtained for samples made of (a) 10 mm bars, (b) 20 mm bars, (c) 30 mm bars, and (d) 40 mm bars.
The lack of clear differentiation between individual arrangements in the case of the samples made of 10 mm bars results from the fact that these bars were substantially less rectilinear. This defect caused the bars in staggered and in-line beds to be in contact not along the whole length but only in insignificant sections. Consequently, the arrangement of these bars did not have a significant effect on thermal contact conduction and on the value of kef coefficient.
The values of the kef coefficient are in the range of 1.5–6.9 W/(m·K). The observed increase in kef with temperature for all the samples has a linear character. For this reason, the temperature changes in this parameter for each case were approximated with the linear relationships:
The values of A0 and A1 coefficients from Equation (2) obtained for individual samples are presented in Table 1. The goodness-of-fit equation to the measurement results is expressed with the coefficient of determination R2, which is also presented in Table 1. The values of R2 close to one confirm a good match.

Table 1.
The values of the A0, A1, and R2 coefficients from Equation (2) obtained for individual samples.
3. Analytical Model
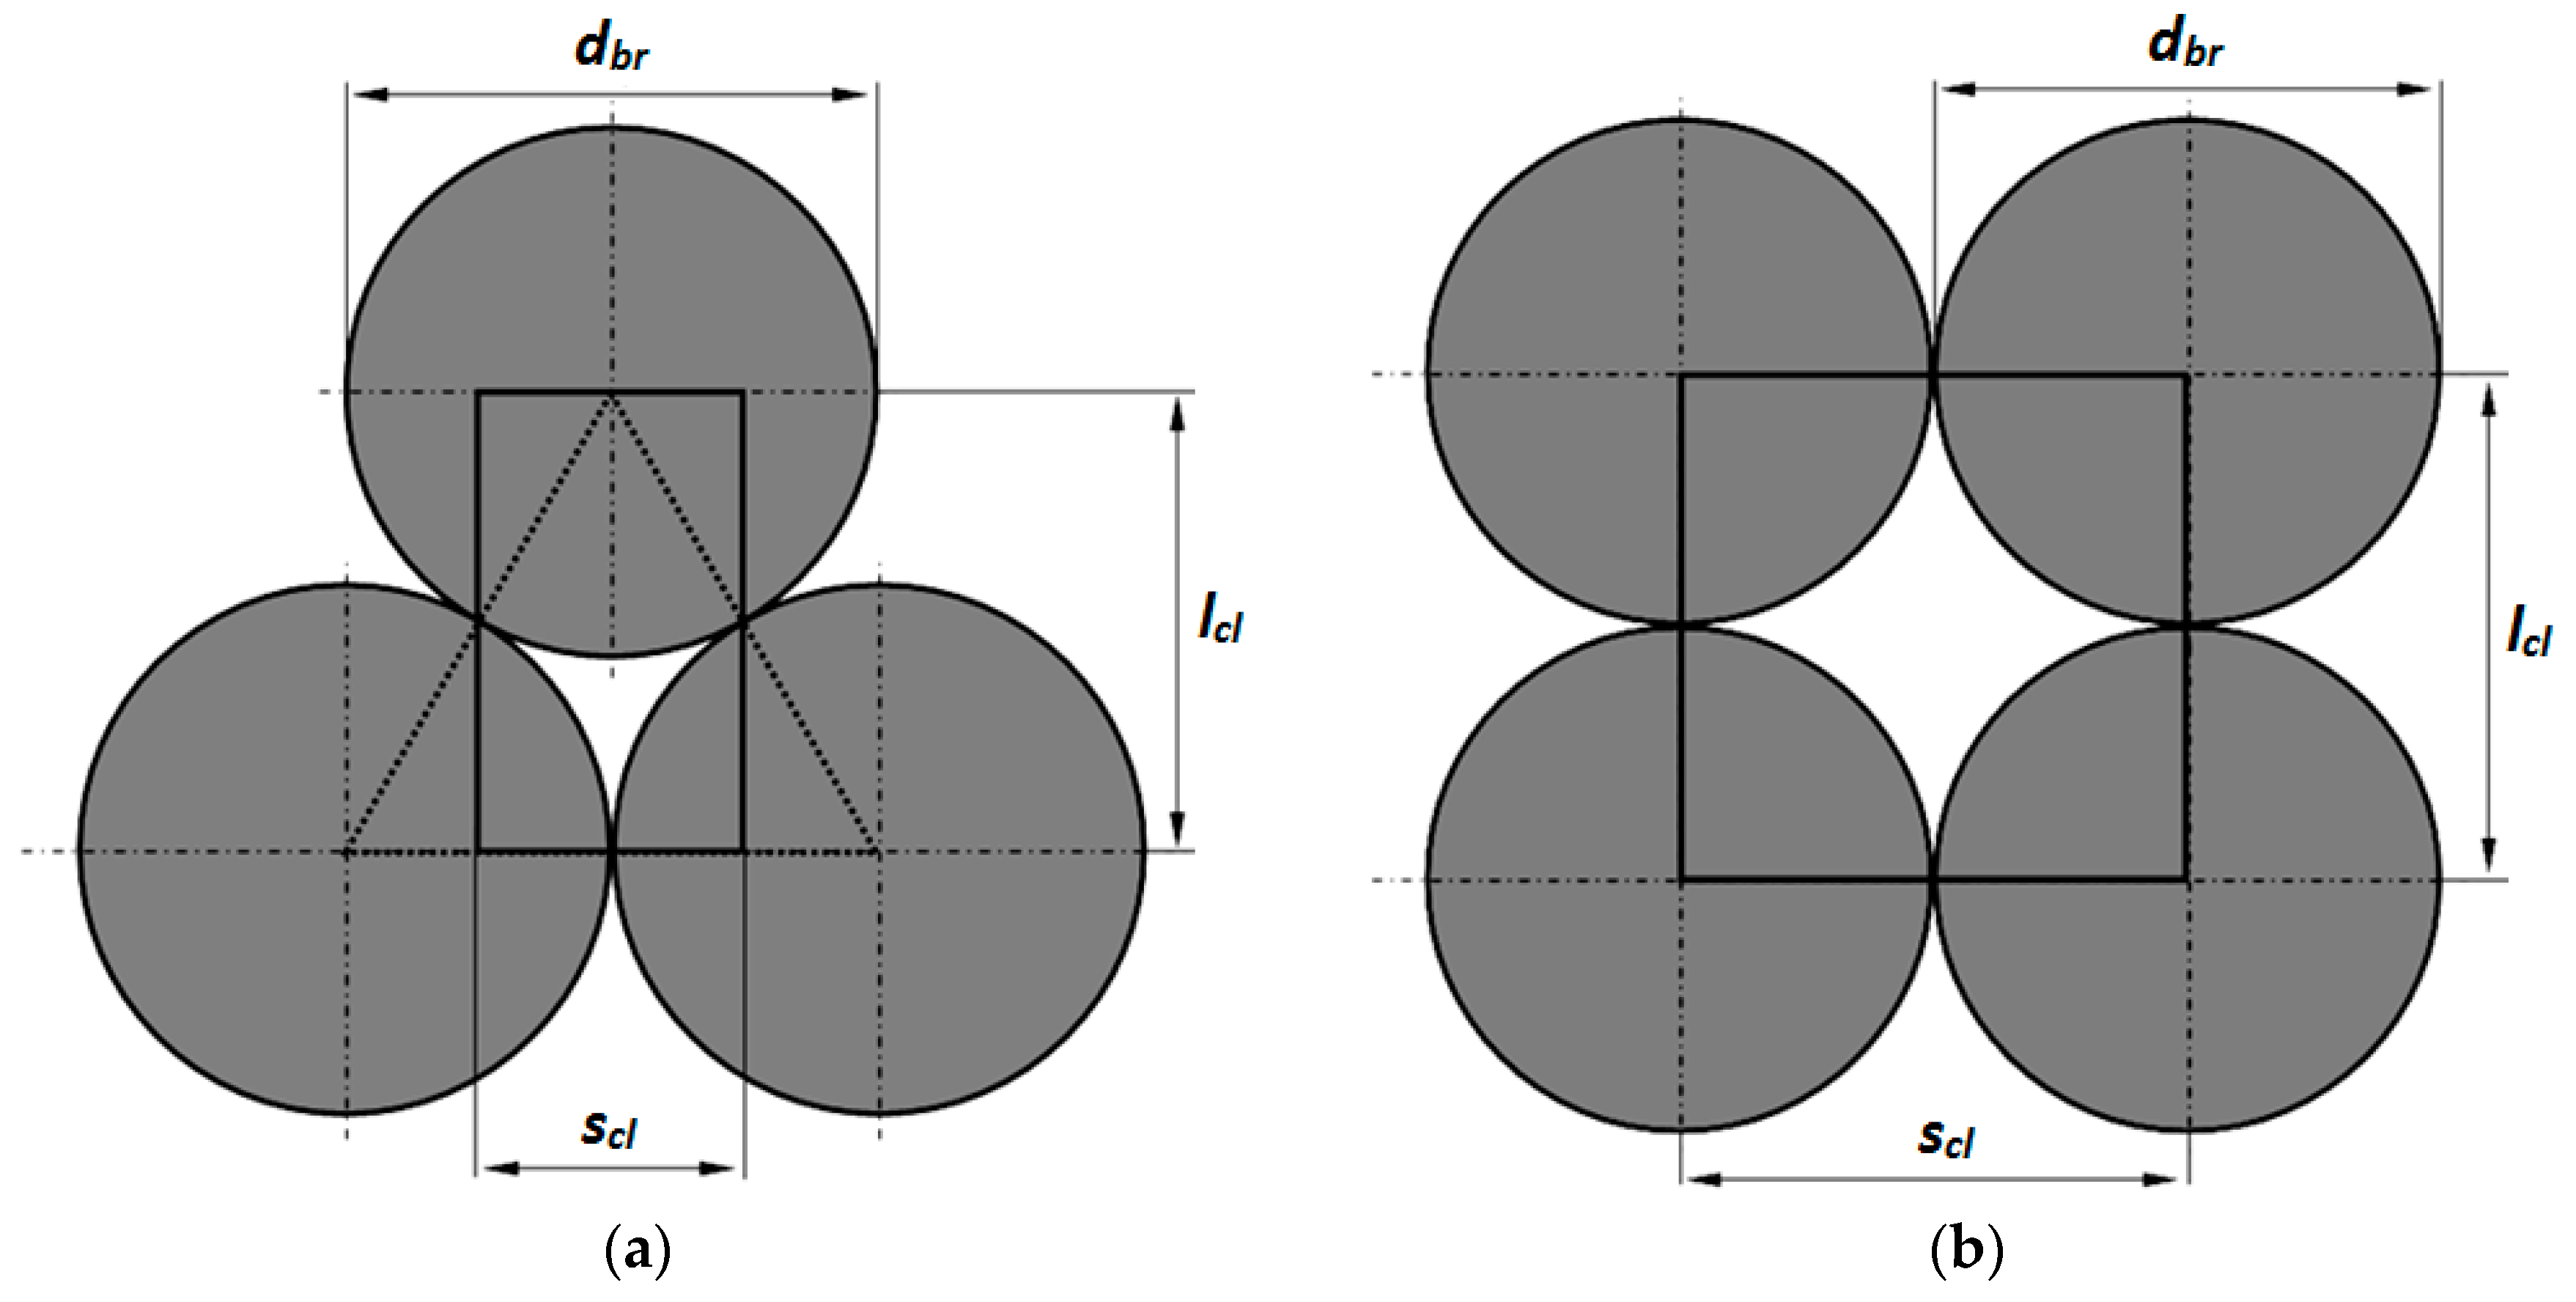
The equations determined for individual samples described by dependence (2) make it possible to calculate thermal contact conductance hct. For this purpose, the special mathematical model of complex heat flow in the bar bed was used. It is assumed that in the analyzed system, heat is transferred by conduction in the section of individual bars, conduction in gas, thermal radiation between the surfaces of bars, and contact conduction. Due to small dimensions of the voids, free convection can be omitted [38]. The starting point of this analysis was the geometrical model of the considered medium in the form of a unit cell. Such an approach is commonly used in the theory of porous and granular materials [21,22,39]. The unit cells defined for the staggered and in-line arrangements are presented in Figure 5. It should be noted that the cell in Figure 5b is also used for crossed structure analysis. This is possible because the crossed structure is very similar to the in-line arrangement. The only difference lies in the fact that in the in-line structure, bars from all layers are arranged parallel to each other, while for the crossed structure, bars from consecutive layers are perpendicular to each other. From the perspective of heat transfer, this only affects the contact conduction because it changes the contact area between the adjacent bars. Therefore, for the heat transfer analysis in the crossed structure, the cell presented in Figure 5b can be utilized.
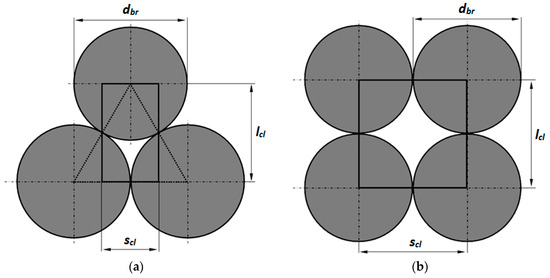
Figure 5.
Unit cells defined for the analyzed medium with (a) staggered arrangement and (b) in-line arrangement.
The analysis of heat transfer mechanisms which take place in the defined unit cell is based on the thermal resistance concept. It is assumed that in these cells, one-dimensional heat transfer occurs in the vertical direction (along the cell dimension which has been denoted as (lcl) in Figure 5). Parameter (scl) in Figure 5 denotes the width of the unit cell. This quantity determines the heat transfer surface area in the unit cell.
The total thermal resistance of the medium Rto is assumed as a series connection of the conduction resistance in the bars Rbr and void thermal resistance Rvo:
The resistance Rvo is calculated as a parallel connection of the thermal contact resistance Rct, conduction resistance in gas Rgs, and radiation resistance Rrd:
The value of Rto resistance can be calculated using the definition of conduction resistance of the plane wall [40]:
where lcl is a cell dimension in the direction of heat flow.
Using Equations (3)–(5), it is possible to calculate the Rto resistance, which is the inverse of thermal contact conductance hct. After several rearrangements, the following dependence was obtained:
The method of calculating the resistances Rbr and Rgs has been described in the work [41]. These resistances take into consideration the thermal conductivity of bar material kbr and gas kgs, which fills the voids. The formulated model assumes that the values of the enumerated coefficients change in the temperature function, which is shown by the following equations:
Equation (7) concerns the thermal conductivity of low-carbon steel with 0.2% carbon content. Bars used during the measurements of the effective thermal conductivity were made of this grade of steel (S235JRH). Equation (8) describes the changes in the thermal conductivity of air. Both equations were determined through approximation of the tabular data available in the literature [42,43].
Radiation resistance Rrd from Equation (6) is described by the following formula [44]:
where σc is the Stefan–Boltzmann constant, Tm is mean absolute temperature of the considered medium, and Xcl is radiation exchange coefficient. This parameter was calculated with the use of the following relations [44]:
Equation (10) refers to the medium (bar bed) with staggered arrangement, while Equation (11) refers to the beds with in-line and crossed arrangements. When calculating the Xcl coefficient, it is necessary to take into account temperature changes in bar emissivity (ε), which is described by the dependence determined by means of experimental investigations, (Equation (12)) [44]:
4. Results and Discussion
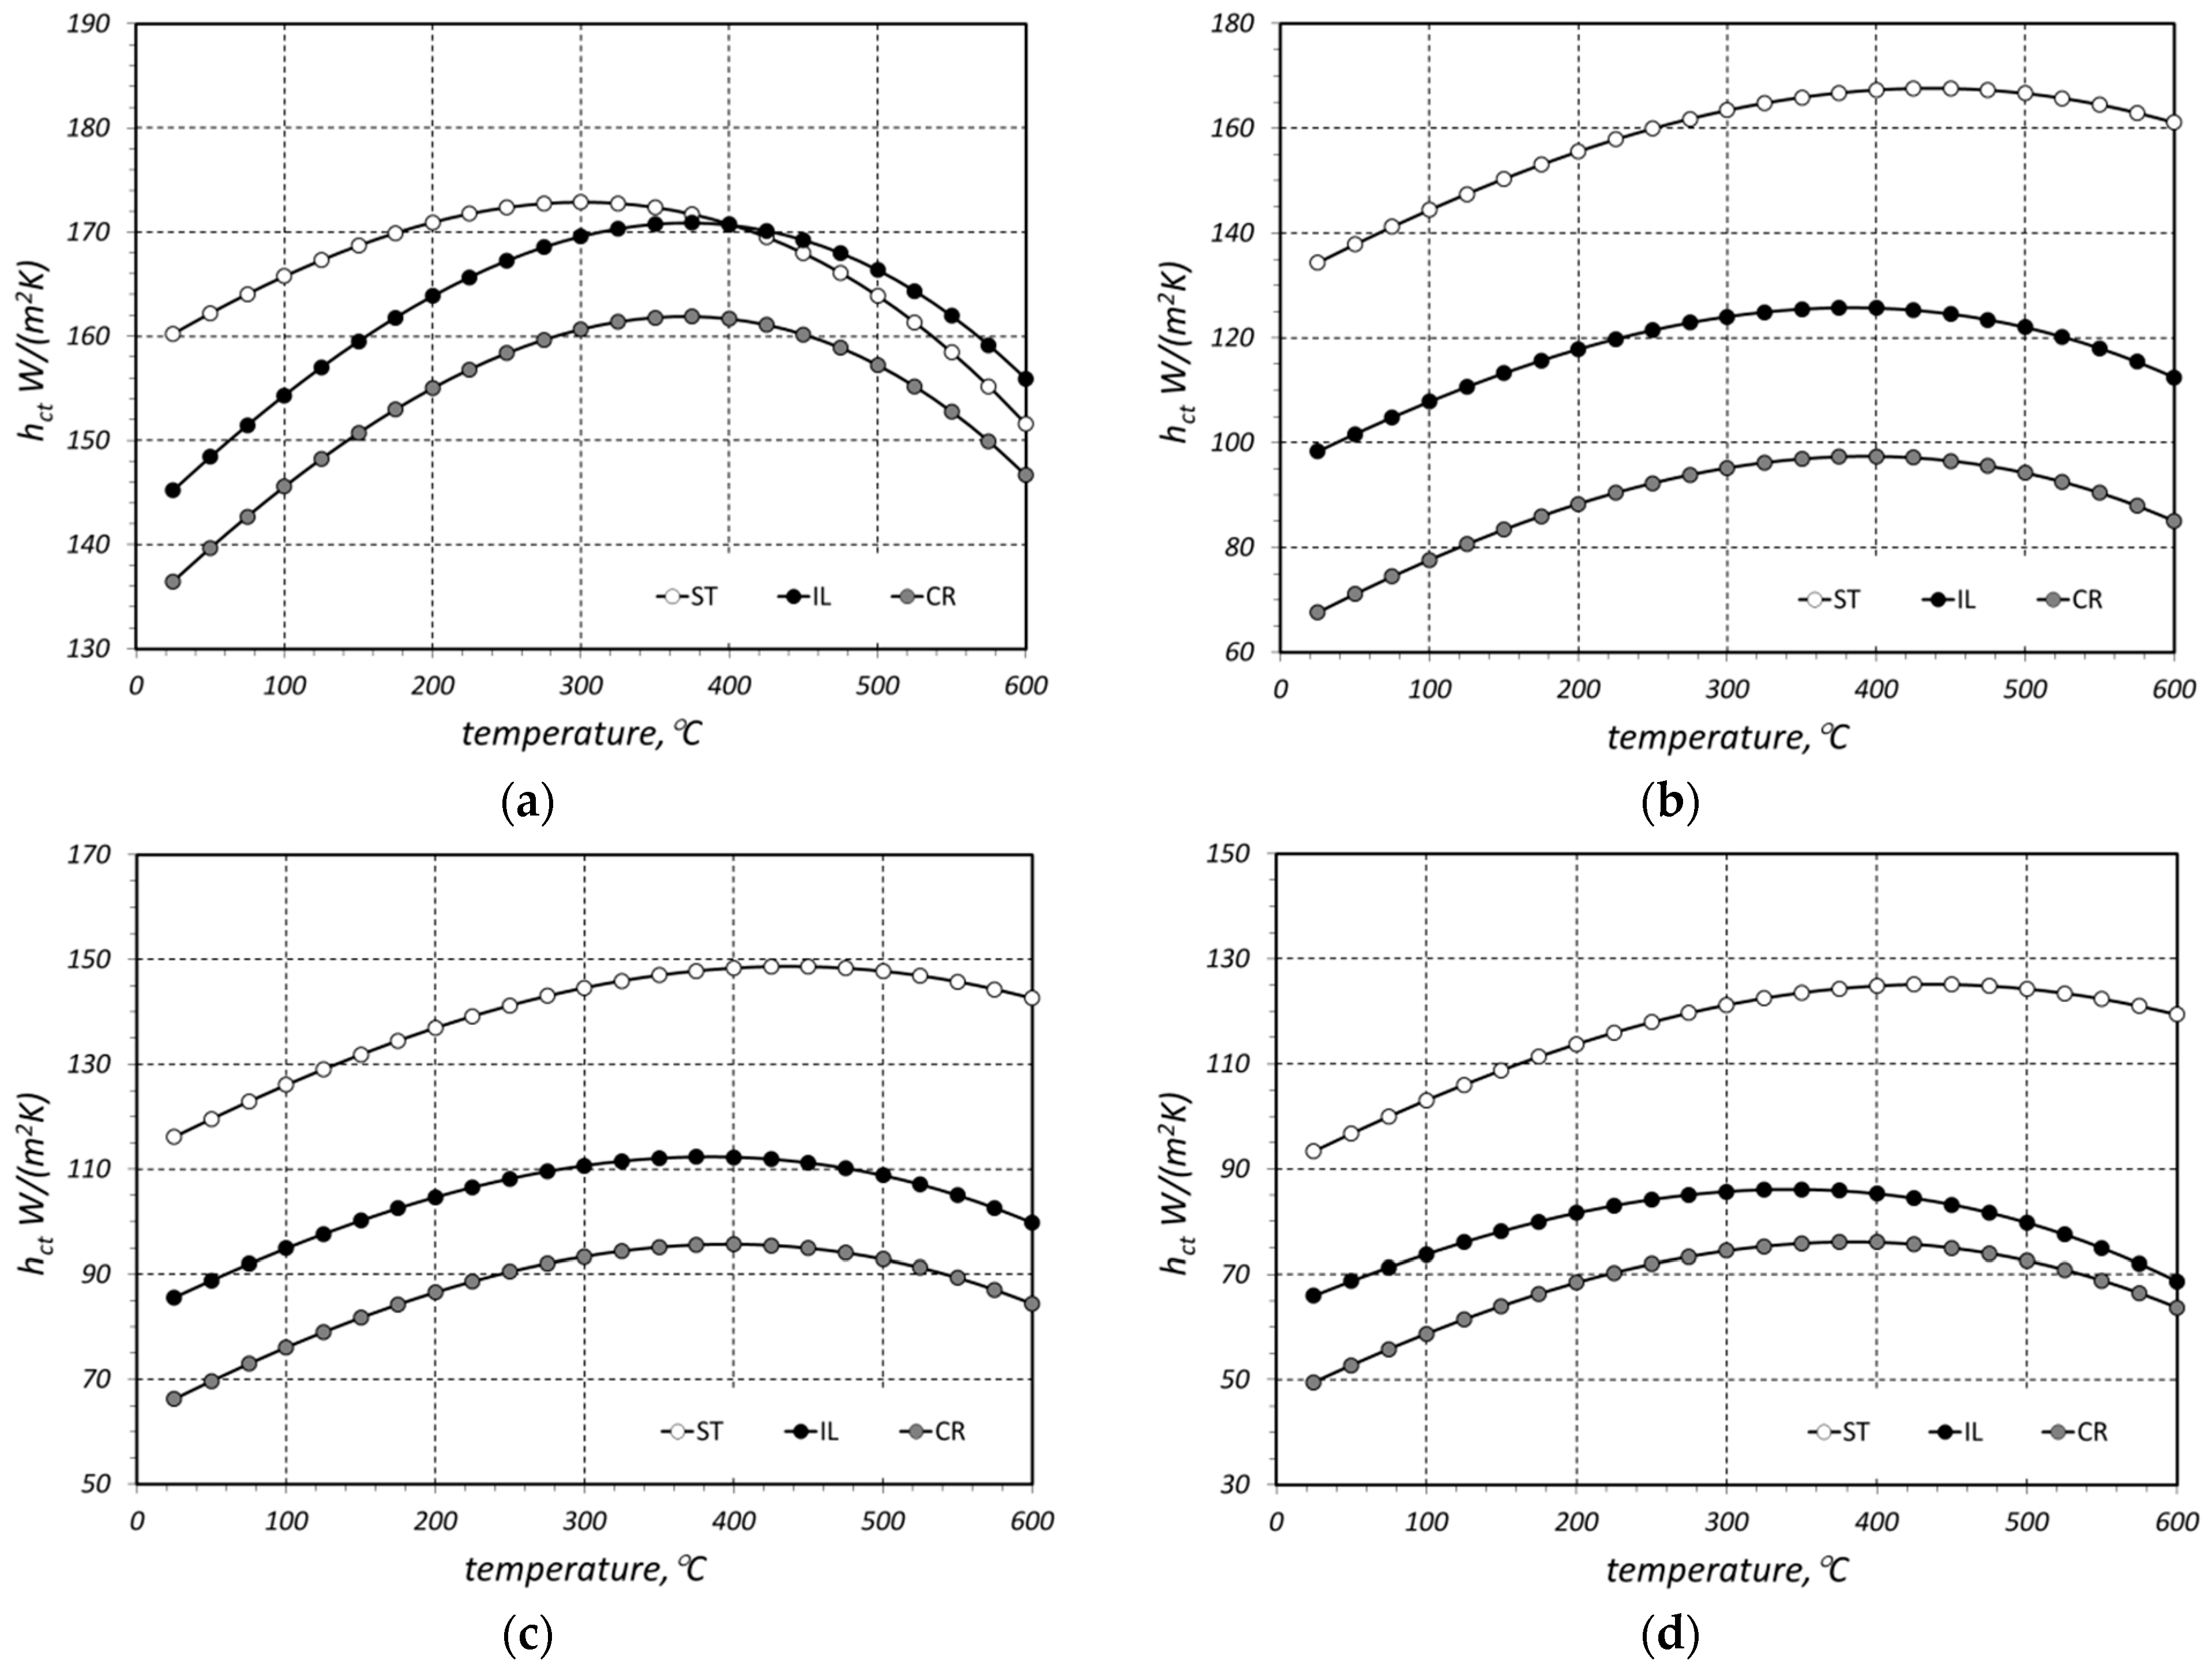
The modelled values of the thermal contact conductance hct of the analyzed bar beds are presented in Figure 6. The whole value range of this parameter is relatively broad, from 50 to 173 W/(m2·K). It can be observed for all the considered cases that the maximum value of the hct coefficient is obtained at a temperature of around 400 °C. At this stage of the investigations, it is not possible to explain this tendency unequivocally due to the complexity of the contact conduction phenomenon. This results from the fact that the value of the hct parameter is a function of many different parameters, for example, surface microhardness, Young’s modulus, Poisson ratio, surface roughness, thermal conductivity of bars which are in contact, or mechanical pressure [45,46,47,48]. The values of all the enumerated factors change with a temperature increase, which in consequence causes a certain change in the hct value. This problem will be subject of further investigations by the authors.
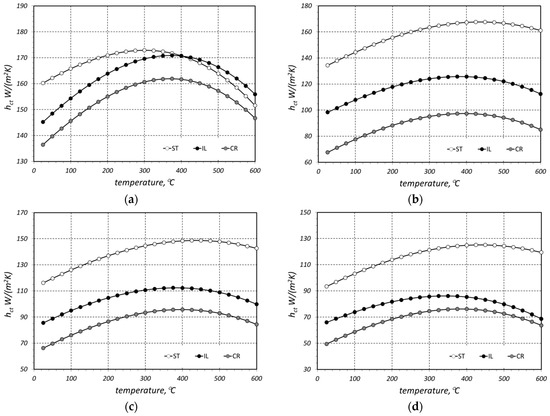
Figure 6.
Modelled values of the thermal contact conductance hct of the bar beds made of (a) 10 mm bars, (b) 20 mm bars, (c) 30 mm bars, and (d) 40 mm bars.
For further analysis, the obtained results were approximated with regression functions in the form of a second-degree polynomial:
The values of the B0, B1, and B2 coefficients from Equation (13) obtained for individual samples are presented in Table 2. The table also contains values of the R2 coefficient, which confirm a good fit of the function to the approximated results.

Table 2.
The values of the B0, B1, B2, and R2 coefficients from Equation (13) for individual samples.
Based on the determined regression equations, for each sample with the analyzed temperature range, the minimum, mean, and maximum values of the hct coefficient were calculated. These results are shown in Table 3. The last column presents the difference between the maximum and minimum values, which is denoted as Δhct.

Table 3.
The values of hct-min, hct-mean, hct-max, and Δhct obtained for individual samples.
Using the hct-mean values obtained for individual samples, the influence of the bar diameter on the intensity of contact conductance was analyzed. As can be seen in Table 3, the samples of 40 mm bars have the lowest values of hct-mean. Using these values, we introduced three parameters, which are defined with the following equations:
The values of these parameters are collated in Table 4. In the case of the samples made of 10 mm bars, the crossed samples have the highest value and the staggered ones have the lowest value. In case of the 20 and 30 mm bars, the in-line samples have the highest values. Data from Table 4 show that, apart from the bar arrangement in the sample, the bar diameter also has a big influence on the contact conductance.

Table 4.
Values of the parameters defined by Equations (14)–(16).
A similar procedure was used in relation to the sample arrangement. The crossed samples are characterized by the lowest hct values. Using these values, the following parameters were defined:
The values of these parameters are presented in Table 5. As can be seen, the change in bar arrangement from the crossed one to the staggered one—apart from the 10 mm bars—increases contact conductance from 60% (30 mm bars) to 78% (20 mm bars). For the 10 mm bars, we can observe a 9% increase. In the case of changing the crossed arrangement to the in-line one, the increase in the hct coefficient value ranges from 16% (40 mm bars) to 32% (20 mm bars). Similarly, as in the previous situation, for the 10 mm bars, this increase was only 6%.

Table 5.
Values of the parameters defined by Equations (17) and (18).
Using the B0, B1, and B2 coefficients from Table 2, a generalization of the obtained results in relation to bar diameter was performed. We analyzed how the above-mentioned coefficients change in the bar diameter function for individual samples. It was established that changes in the B0 and B2 parameters can be described with linear equations in the following form (where diameter dbr is expressed in mm):
The B1 coefficients in the bar diameter function change insignificantly; therefore, for each bar arrangement, a constant, averaged value of B1 was adopted. Using the data from Table 2, the following values were obtained:
By substituting the Expressions (19)–(27) into Equation (13), we obtained generalized approximation equations describing changes in the thermal contact conductance simultaneously in the temperature and bar diameter function:
This may raise the question of why different equations, Equations (6) and (28)–(30), were used to calculate the hct parameter. Formula (6) allowed for the calculation of the hct coefficient based on the results of the experimental studies (measurements of the kef coefficient). In this case, the values of kef were approximated using Equation (2) for the hct parameter calculations. This approach resulted in the outcomes presented in Figure 6. Subsequently, these results underwent a further analysis with the aim of deriving generalized relationships in the form of Equations (28)–(30). These equations, for each of the three considered bar arrangements, enabled the calculation of the hct coefficient as a function of temperature and bar diameter. Equation (6) did not provide this capability; it was only used as an auxiliary tool to derive Equations (28)–(30).
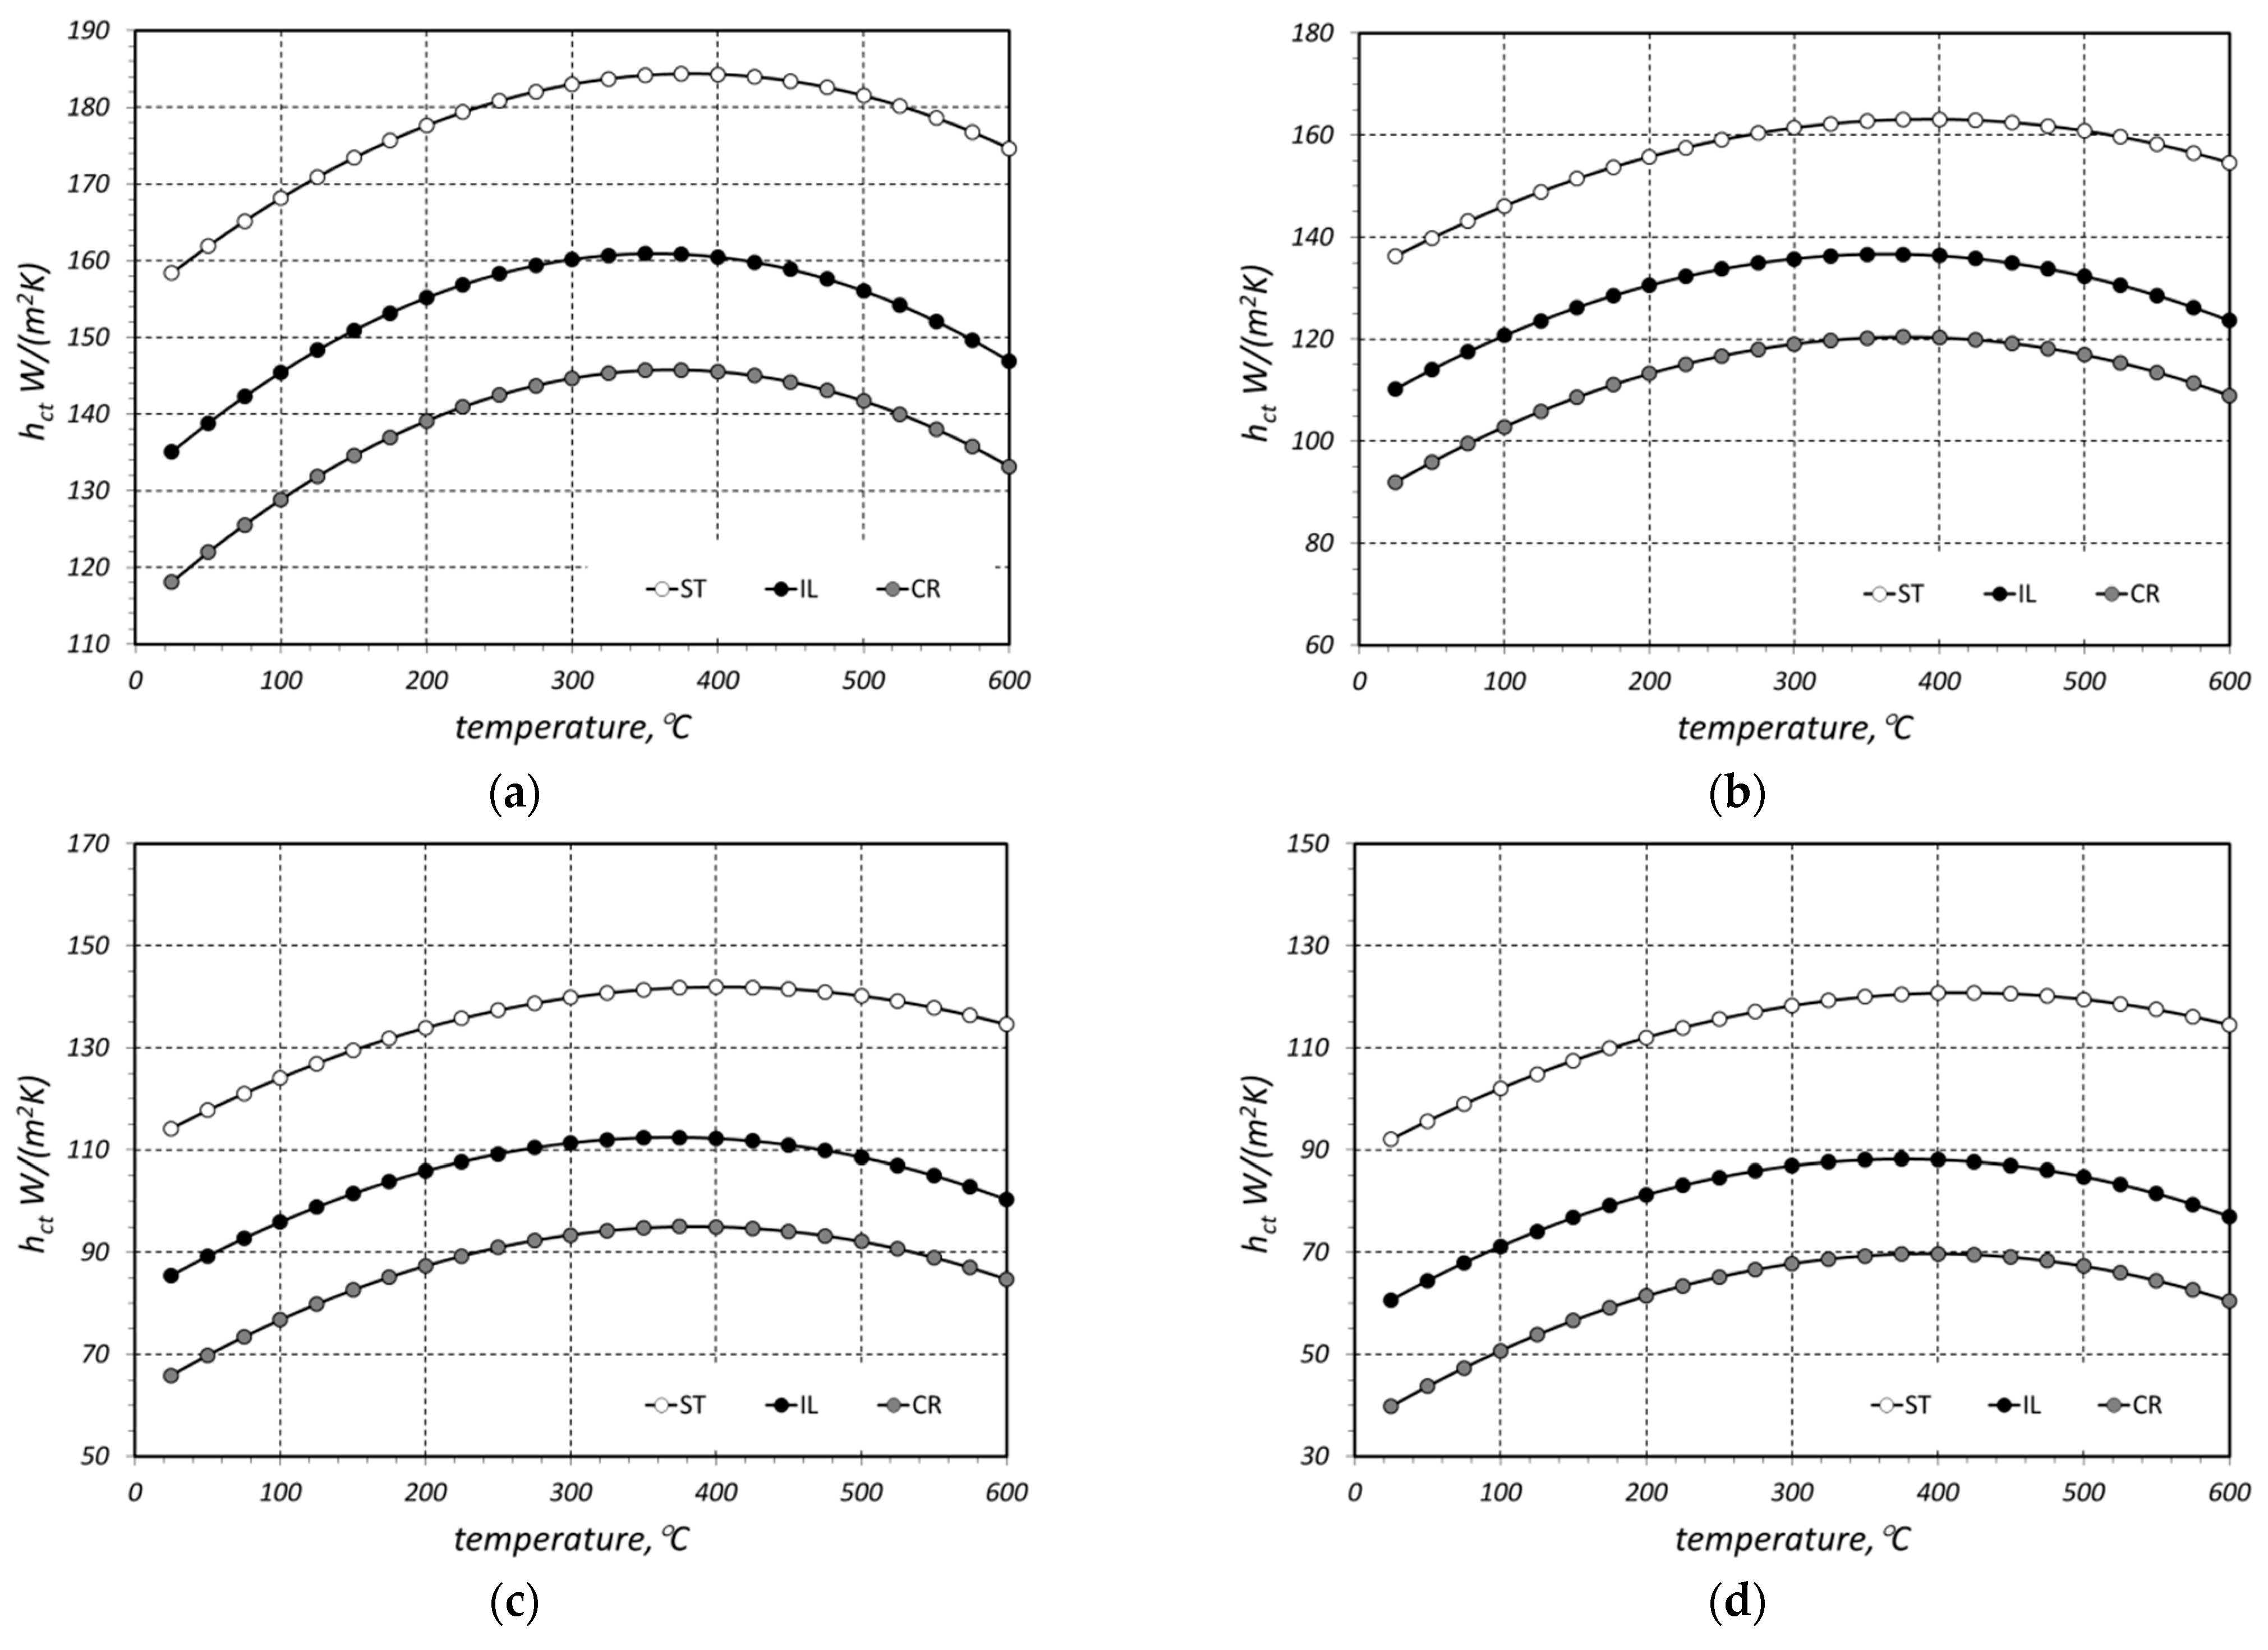
The results of the hct calculations obtained with the use of Equations (28)–(30) are shown in Figure 7. As can be seen, these values differ from the results in Figure 6. In order to define the exact discrepancy between the results from both figures, we used the δhct parameter, which was defined with the following dependence:
where hct-m modelled values of the thermal contact conductance and hct-ap modelled the thermal contact conductance obtained on the basis of approximation Equations (28)–(30). The maximum values of the δhct parameter and the ones which were averaged in relation to temperature are presented in Table 6.
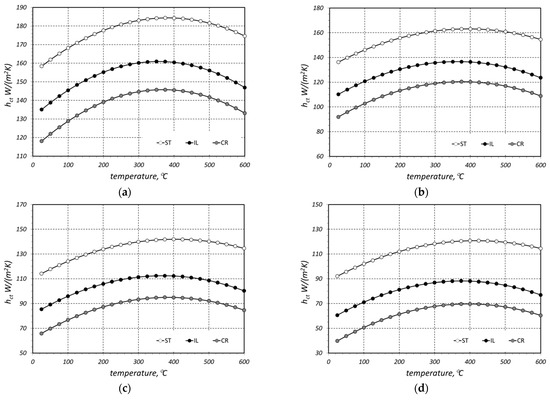
Figure 7.
Values of the thermal contact conductance hct calculated with the use of Equations (27)–(29) for (a) 10 mm bars, (b) 20 mm bars, (c) 30 mm bars, and (d) 40 mm bars.

Table 6.
The maximum and averaged values of the δhct parameter.
This juxtaposition shows that the obtained discrepancies of the results for individual cases are diverse. The highest values of hct-max and δhct-mean equal to 36.1% and 27.3%, respectively, were obtained for the 20 mm bars with a crossed arrangement. For other calculation cases, the values of both parameters did not exceed 20%. When analyzing data from Table 6, it must be stated that from a practical point of view, the most significant results are the ones for the staggered samples. As can be seen in Figure 1, that is the structure of the treated bar bundles. The in-line and crossed arrangements are in this case purely theoretical. The δhct-mean values for the staggered case for further bar diameters equal 6.5%, 1.9%, 3.5%, and 2.5%. This indicates that the values of the hct coefficient obtained with the use of the approximation Equation (28) are relatively compatible with the results of the precise calculations (obtained with the use of a model based on the analysis of thermal resistances).
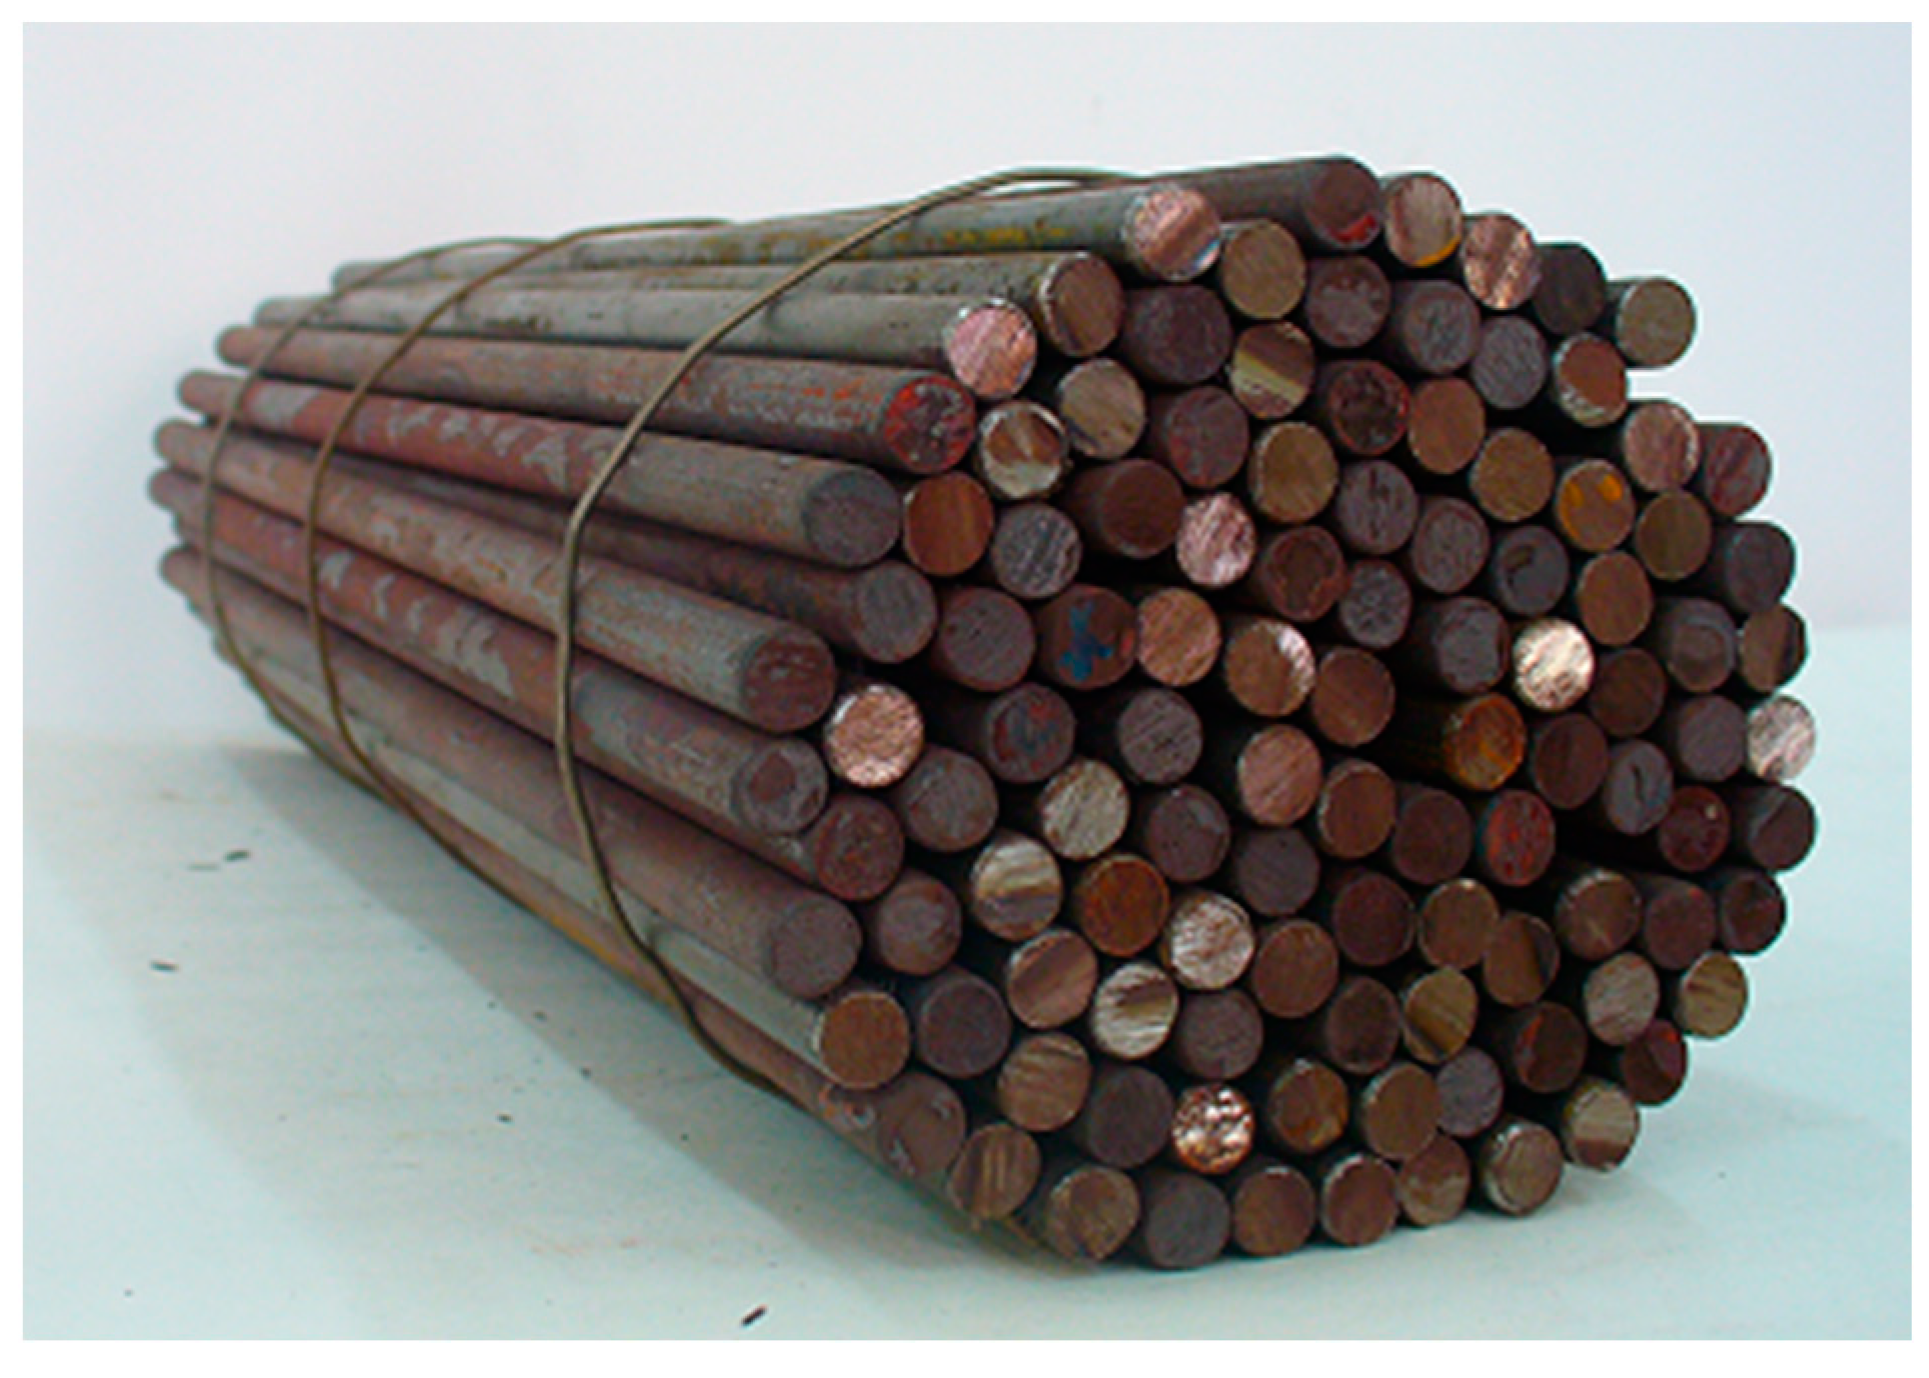
To summarize the conducted research, it was decided to clarify two issues relating directly to industrial practice. The first is the potential industrial applications of various bar arrangements. To address this issue, a photograph of a 10 mm bar bundle was utilized, as shown in Figure 8. This is a model bundle used for laboratory studies. It should be emphasized that bundles of bars heated under industrial conditions, similar to the bundle depicted in Figure 8, often exhibit an irregular arrangement due to the absence of a maximum bar-packing standard. The geometry of such bundles combines staggered and in-line arrangements. In cases where the bars within the bundle are laid out haphazardly, they may even intersect each other. Therefore, depending on the regularity of the bar placement in the bundle, and, consequently, its packing density, all three of the considered arrangements can find industrial applications. For meticulously arranged bundles, the staggered arrangement is the most suitable, while for loosely packed bundles, the crossed arrangement might be the most appropriate. Thus, from an industrial application perspective, each of the analyzed arrangements can be considered. However, to enhance heat transfer intensity, the best solution is the staggered arrangement, and this layout should be pursued when preparing the charge for heating in the furnace.
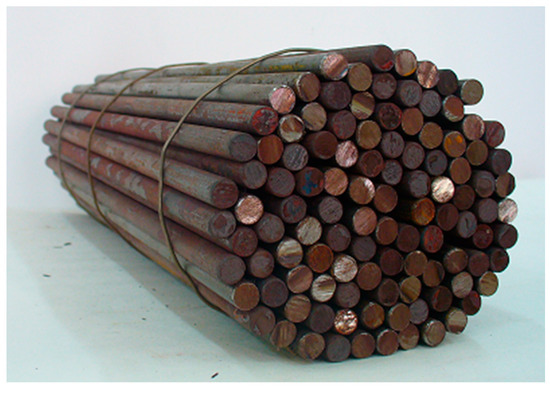
Figure 8.
The bar bundle model used in laboratory research exhibits an irregular arrangement, as seen in this case, which is a combination of staggered and in-line arrangements.
The second issue is which thermal treatments are to be applied according to the temperatures selected in the study. The most common heat treatment for steel bars is recrystallization annealing, typically applied after prior plastic processing. The objective of this operation is to improve the plastic properties of the steel. It is carried out below the austenite transformation temperature (723 °C) but above the recrystallization temperature. For steel, depending on its chemical composition, this temperature range is from 400 °C to 700 °C. Therefore, the process of heating the bundle of bars proceeds from room temperature to around 700 °C. Below approximately 500 °C, the key heat exchange process, in terms of intensity, is conductive heat transfer. However, as previously demonstrated by the authors in their earlier publications [11,38,41,44], above 500 °C, the most significant influence on the heating process of the bundle is thermal radiation. Thus, the analysis of conductive heat transfer within the temperature range chosen by the authors, i.e., from 20 to 600 °C, is highly justified. As seen in Figure 6, after surpassing the temperature of 500 °C, the intensity of thermal contact conduction begins to decrease. When considering the temperature at which the heat treatment of bars is carried out, one must take into account that the heat transfer process in a bundle of bars is a complex phenomenon. It comprises a combination of conduction (within the bars and the gas), contact conduction, and thermal radiation. The changes in the intensity of each of these heat transfer phenomena with the change in the charge temperature occur completely differently. This is a complex issue related to the qualitative heat exchange in a bundle and will be the subject of further analysis.
5. Conclusions
Using the results of the experimental investigations and the model of complex heat transfer based on the analysis of thermal resistances, we determined the values of the thermal contact conductance hct for a bed of steel bars. It was determined that depending on factors such as temperature, diameter, and arrangement of the bars, the values of the hct parameter are within the range from 50 to 173 W/(m2·K). Next, thanks to the approximation of the results of the model calculations for each bar arrangement, we derived generalized approximation equations which enabled the calculation of the value of the hct coefficient for the packed bar bundles simultaneously in the temperature and bar diameter function. The values of the hct coefficient obtained with the use of this equation for a bar bed with a staggered arrangement (which is how bundles are packed during heat treatment) depending on the bar diameter, differ from the results of the model calculations by 1.9 to 6.5%. Taking into account the complexity of the analysis issue, the level of discrepancy of the results can be regarded as satisfactory. In connection with this, the derived equation can be used to develop a universal model of the effective thermal conductivity of round bar bundles with arbitrary porosity. Developing such a model will be the next stage of work by the authors in the area of heating bundles of steel bars. Upon its validation, such a model will be a valuable computational tool for the optimization of heat treatment processes.
Author Contributions
Conceptualization, R.W. and V.B.; methodology, R.W.; measurements, R.W.; formal analysis, R.W. and D.S.; writing—original draft preparation, R.W. and V.B.; visualization, D.S.; supervision, D.S. All authors have read and agreed to the published version of the manuscript.
Funding
This research received no external funding.
Institutional Review Board Statement
Not applicable.
Informed Consent Statement
Not applicable.
Data Availability Statement
The data presented in this study are available in: Wyczółkowski, R. Experimental Investigations of Effective Thermal Conductivity of the Selected Examples of Steel Porous Charge. Solids 2021, 2, 420–436. https://doi.org/10.3390/solids2040027.
Conflicts of Interest
The authors declare no conflict of interest.
References
- Fourie, J.G.; Du Plessis, J.P. A two-equation model for heat conduction in porous media. Transp. Porous Media 2003, 53, 145–161. [Google Scholar] [CrossRef]
- Kunii, D.; Smith, J.M. Heat transfer characteristics of porous rocks. AIChE J. 1960, 6, 71–78. [Google Scholar] [CrossRef]
- Zehner, P.; Schlunder, E.U. Thermal conductivity of granular materials at moderate temperatures. Chem. Ingr. Tech. 1970, 42, 933–941. [Google Scholar] [CrossRef]
- Van Antverpen, W.; du Toit, C.G.; Rousseau, P.G. A review of correlations to model the packing structure and effective thermal conductivity in packed beds of mono–sized spherical particles. Nucl. Eng. Des. 2010, 240, 1803–1818. [Google Scholar] [CrossRef]
- Breitbach, G.; Barthels, H. The radiant heat transfer in the high temperature reactor core after failure of the heat removal system. Nucl. Technol. 1980, 49, 392–399. [Google Scholar] [CrossRef]
- IAEA-TECHDOC-1163; Heat Transport and Afterheat Removal for Gas-Cooled Reactors under Accident Conditions. International Atomic Energy Agency: Vienna, Austria, 2000.
- Singh, R. Thermal conduction through porous systems. In Cellular and Porous Materials, Thermal Properties Simulation and Prediction; WILEY-VCH Verlag GmbH&Co: Hoboken, NJ, USA, 2008; pp. 199–238. [Google Scholar]
- Sahay, S.S.; Krishnan, K. Model based optimization of continuous annealing operation for bundle of packed rods. Ironmak. Steelmak. 2007, 34, 89–94. [Google Scholar] [CrossRef]
- Musiał, D. Numerical analysis of the process of heating of a bed of steel bars. Arch. Metall. Mater. 2013, 58, 63–66. [Google Scholar] [CrossRef]
- Kolmasiak, C.; Wyleciał, T. Heat treatment of steel products as an example of transport phenomenon in porous media. Metalurgija 2018, 57, 363–366. [Google Scholar]
- Wyczółkowski, R.; Bagdasaryan, V.; Gała, M.; Król, P.A. The Review of Chosen Methods Used to Investigate Heat Transfer in a Steel Porous Charge. Energies 2022, 15, 2266. [Google Scholar] [CrossRef]
- Pietrak, K.; Wiśniewski, T.S. A review of models for effective thermal conductivity of composite materiale. J. Power Technol. 2015, 96, 14–24. [Google Scholar]
- Bahrami, M.; Yovanovich, M.M.; Culham, J.R. Effective thermal conductivity of rough spherical packed beds. Int. J. Heat Mass Transf. 2006, 49, 3691–3701. [Google Scholar] [CrossRef]
- Tavman, I.H. Effective thermal conductivity of granular porous material. Int. Commun. Heat Mass Transf. 1996, 23, 169–176. [Google Scholar] [CrossRef]
- Bauer, T.H. A general analytical approach toward the thermal conductivity of porous media. Int. J. Heat Mass Transf. 1993, 36, 4181–4191. [Google Scholar] [CrossRef]
- Gonzo, E.E. Estimating correlations for the effective thermal conductivity of granular materials. Chem. Eng. J. 2002, 90, 299–302. [Google Scholar] [CrossRef]
- Wang, J.; Carson, J.K.; North, M.F.; Cleland, D.J. A new approach to modelling the effective thermal conductivity of heterogeneous materials. Int. J. Heat Mass Transf. 2006, 49, 3075–3085. [Google Scholar] [CrossRef]
- Woodside, W.; Messmer, J. Thermal conductivity of porous media. I: Unconsolidated sands & II: Consolidated sands. J. Appl. Phys. 1961, 32, 1688–1768. [Google Scholar]
- Carson, J.K. Review of effective thermal conductivity models for foods. Int. J. Refrig. 2006, 29, 958–967. [Google Scholar] [CrossRef]
- Carson, J.K.; Lovatt, S.J.; Tanner, D.J.; Cleland, A.C. Thermal conductivity bounds for isotropic porous materials. International, J. Heat Mass Transf. 2005, 48, 2150–2158. [Google Scholar] [CrossRef]
- Palaniswamy, S.K.A.; Venugopal, P.R.; Palaniswamy, K. Effective thermal conductivity modelling with primary and secondary parameters for two-phase materials. Therm. Sci. 2010, 14, 393–407. [Google Scholar] [CrossRef]
- Kaviany, M. Principles of Heat Transfer in Porous Media, 2nd ed.; Springer: New York, NY, USA, 1995. [Google Scholar]
- Wyczółkowski, R.; Bagdasaryan, V.; Tomczyk, B. Modelling of effective thermal conductivity of a packed bed of steel bars with the use of chosen literature models. Compos. Struct. 2022, 282, 115025. [Google Scholar] [CrossRef]
- Yang, X.; Zhang, X.; Cao, B. The Effect of Thermal Contact Number on the Tube–Tube Contact Conductance of Single-Walled Carbon Nanotubes. Nanomaterials 2019, 9, 477. [Google Scholar] [CrossRef] [PubMed]
- Sun, X.; Meng, C.; Duan, T. Fractal model of thermal contact conductance of two spherical joint surfaces considering friction coefficient. Ind. Lubr. Tribol. 2022, 74, 93–101. [Google Scholar] [CrossRef]
- Ashwani, K.; Sachin, R.; Yatika, G.; Neelesh, K.S. Chapter: Thermal Contact Conductance Prediction Using FEM-Based Computational Techniques. In Advanced Computational Methods in Mechanical and Materials Engineering; CRC Press: Boca Raton, FL, USA, 2021. [Google Scholar]
- Guarino, S.; Di Ilio, G.; Venettacci, S. Influence of Thermal Contact Resistance of Aluminum Foams in Forced Convection: Experimental Analysis. Materials 2017, 10, 907. [Google Scholar] [CrossRef] [PubMed]
- ASTM C1044-12; Standard Practice for Using a Guarded-Hot-Plate Apparatus or Thin-Heater Apparatus in the Single-Sided Mode. ASTM International: West Conshohocken, PA, USA, 2012.
- ASTM C177-13; Standard Test Method for Steady-State Heat Flux Measurements and Thermal Transmission Properties by Means of the Guarded-Hot-Plate Apparatus. ASTM International: West Conshohocken, PA, USA, 2013.
- Shu-Yuan, Z.; Bo-Ming, Z.; Xiao-Dong, H. Temperature and pressure dependent effective thermal conductivity of fibrous insulations. Int. J. Therm. Sci. 2009, 48, 440–448. [Google Scholar]
- Yang, X.H.; Lu, T.J.; Kim, T. Temperature effects on the effective thermal conductivity of phase change materials with two distinctive phases. Int. Commun. Heat Mass Transf. 2011, 38, 1344–1348. [Google Scholar] [CrossRef]
- Temperature Sensor TP-201_206 (Sheathed Thermocouple). Available online: https://www.czaki.pl/en/produkt/temperature-sensor-tp-201_206/ (accessed on 1 October 2023).
- Multi-Channel Temperature Recorder WRT-9-BOX. Available online: https://www.czaki.pl/produkt/wrt-9-box/# (accessed on 1 October 2023).
- 3-Phase Power Network Meter N14. Available online: https://www.lumel.com.pl/en/catalogue/product/3-phase-power-network-meter-n14 (accessed on 1 October 2023).
- Wyczółkowski, R. Experimental Investigations of Effective Thermal Conductivity of the Selected Examples of Steel Porous Charge. Solids 2021, 2, 420–436. [Google Scholar] [CrossRef]
- European Steel and Alloy Grades/Numbers Steel Number. Available online: http://www.steelnumber.com/en/steel_composition_eu.php?name_id=645. (accessed on 1 October 2023).
- Tylor, J.R. An Introduction to Error Analysis the Study of Uncertainties in Physical Measurements, 2nd ed.; University Science Books: Sausalito, CA, USA, 1997. [Google Scholar]
- Wyczółkowski, R.; Musiał, D. Analysis of the Occurrence of Natural Convenction in a Bed of Bars in Vertical Temperature Gradient Conditions. Arch. Thermodyn. 2013, 34, 71–83. [Google Scholar] [CrossRef]
- Öchsner, A.; Murch, G.E.; de Lemos, M.J.S. (Eds.) Cellular and Porous Materials: Thermal Properties Simulation and Prediction; WILEY-VCH Verlag GmbH & Co, KGaA: Wenheim, Germany, 2008. [Google Scholar]
- Cengel, Y.A. Heat and Mass Transfer—A Practical Approach, 3rd ed.; Mc Graw Hill: New York, NY, USA, 2007. [Google Scholar]
- Wyczółkowski, R.; Gała, M.; Boryca, J. Computational Model of Heat Conduction in the Steel Round Bar Bundle. Acta Phys. Pol. A 2019, 136, 1001–1007. [Google Scholar] [CrossRef]
- Raźnjević, K. Thermal Table with Diagrams; WNT: Warsaw, Poland, 1966. (In Polish) [Google Scholar]
- Senkara, T. Thermal Calculations of Heating Furnaces in Methalurgy; Slask: Katowice, Poland, 1981. (In Polish) [Google Scholar]
- Wyczółkowski, R.; Urbaniak, D. Modelling of radiation in bar bundles using the thermal resistance concept. J. Thermophys. Heat Transf. 2016, 30, 721–729. [Google Scholar] [CrossRef]
- Furmański, P.; Wiśniewski, T.S.; Banaszek, J. Thermal Contact Resistances and Other Thermal Phenomena at Solid-Solid Interface; Institute of Heat Engineering, Warsaw University of Technology: Warsaw, Poland, 2008. [Google Scholar]
- Savija, I.; Culham, J.R.; Yovanovich, M.M. Revive of thermal conductance models for joints incorporating enhancement materials. J. Thermophys. Heat Transf. 2003, 17, 43–52. [Google Scholar] [CrossRef]
- Yovanovich, M.M. Four decades of research on thermal contact, gap, and joint resistances in microelectronics. IEEE Trans. Compon. Packag. Technol. 2005, 20, 182–206. [Google Scholar] [CrossRef]
- Mikic, B.B. Thermal contact conductance: Theoretical consideration. Int. J. Heat Transf. 1974, 17, 205–214. [Google Scholar] [CrossRef]
Disclaimer/Publisher’s Note: The statements, opinions and data contained in all publications are solely those of the individual author(s) and contributor(s) and not of MDPI and/or the editor(s). MDPI and/or the editor(s) disclaim responsibility for any injury to people or property resulting from any ideas, methods, instructions or products referred to in the content. |
© 2023 by the authors. Licensee MDPI, Basel, Switzerland. This article is an open access article distributed under the terms and conditions of the Creative Commons Attribution (CC BY) license (https://creativecommons.org/licenses/by/4.0/).

