
Impact Fracture Simulation of Laminated Glass Based on Thick Shell Elements and a Cohesive Zone Model

Abstract
:1. Introduction
2. Methodology
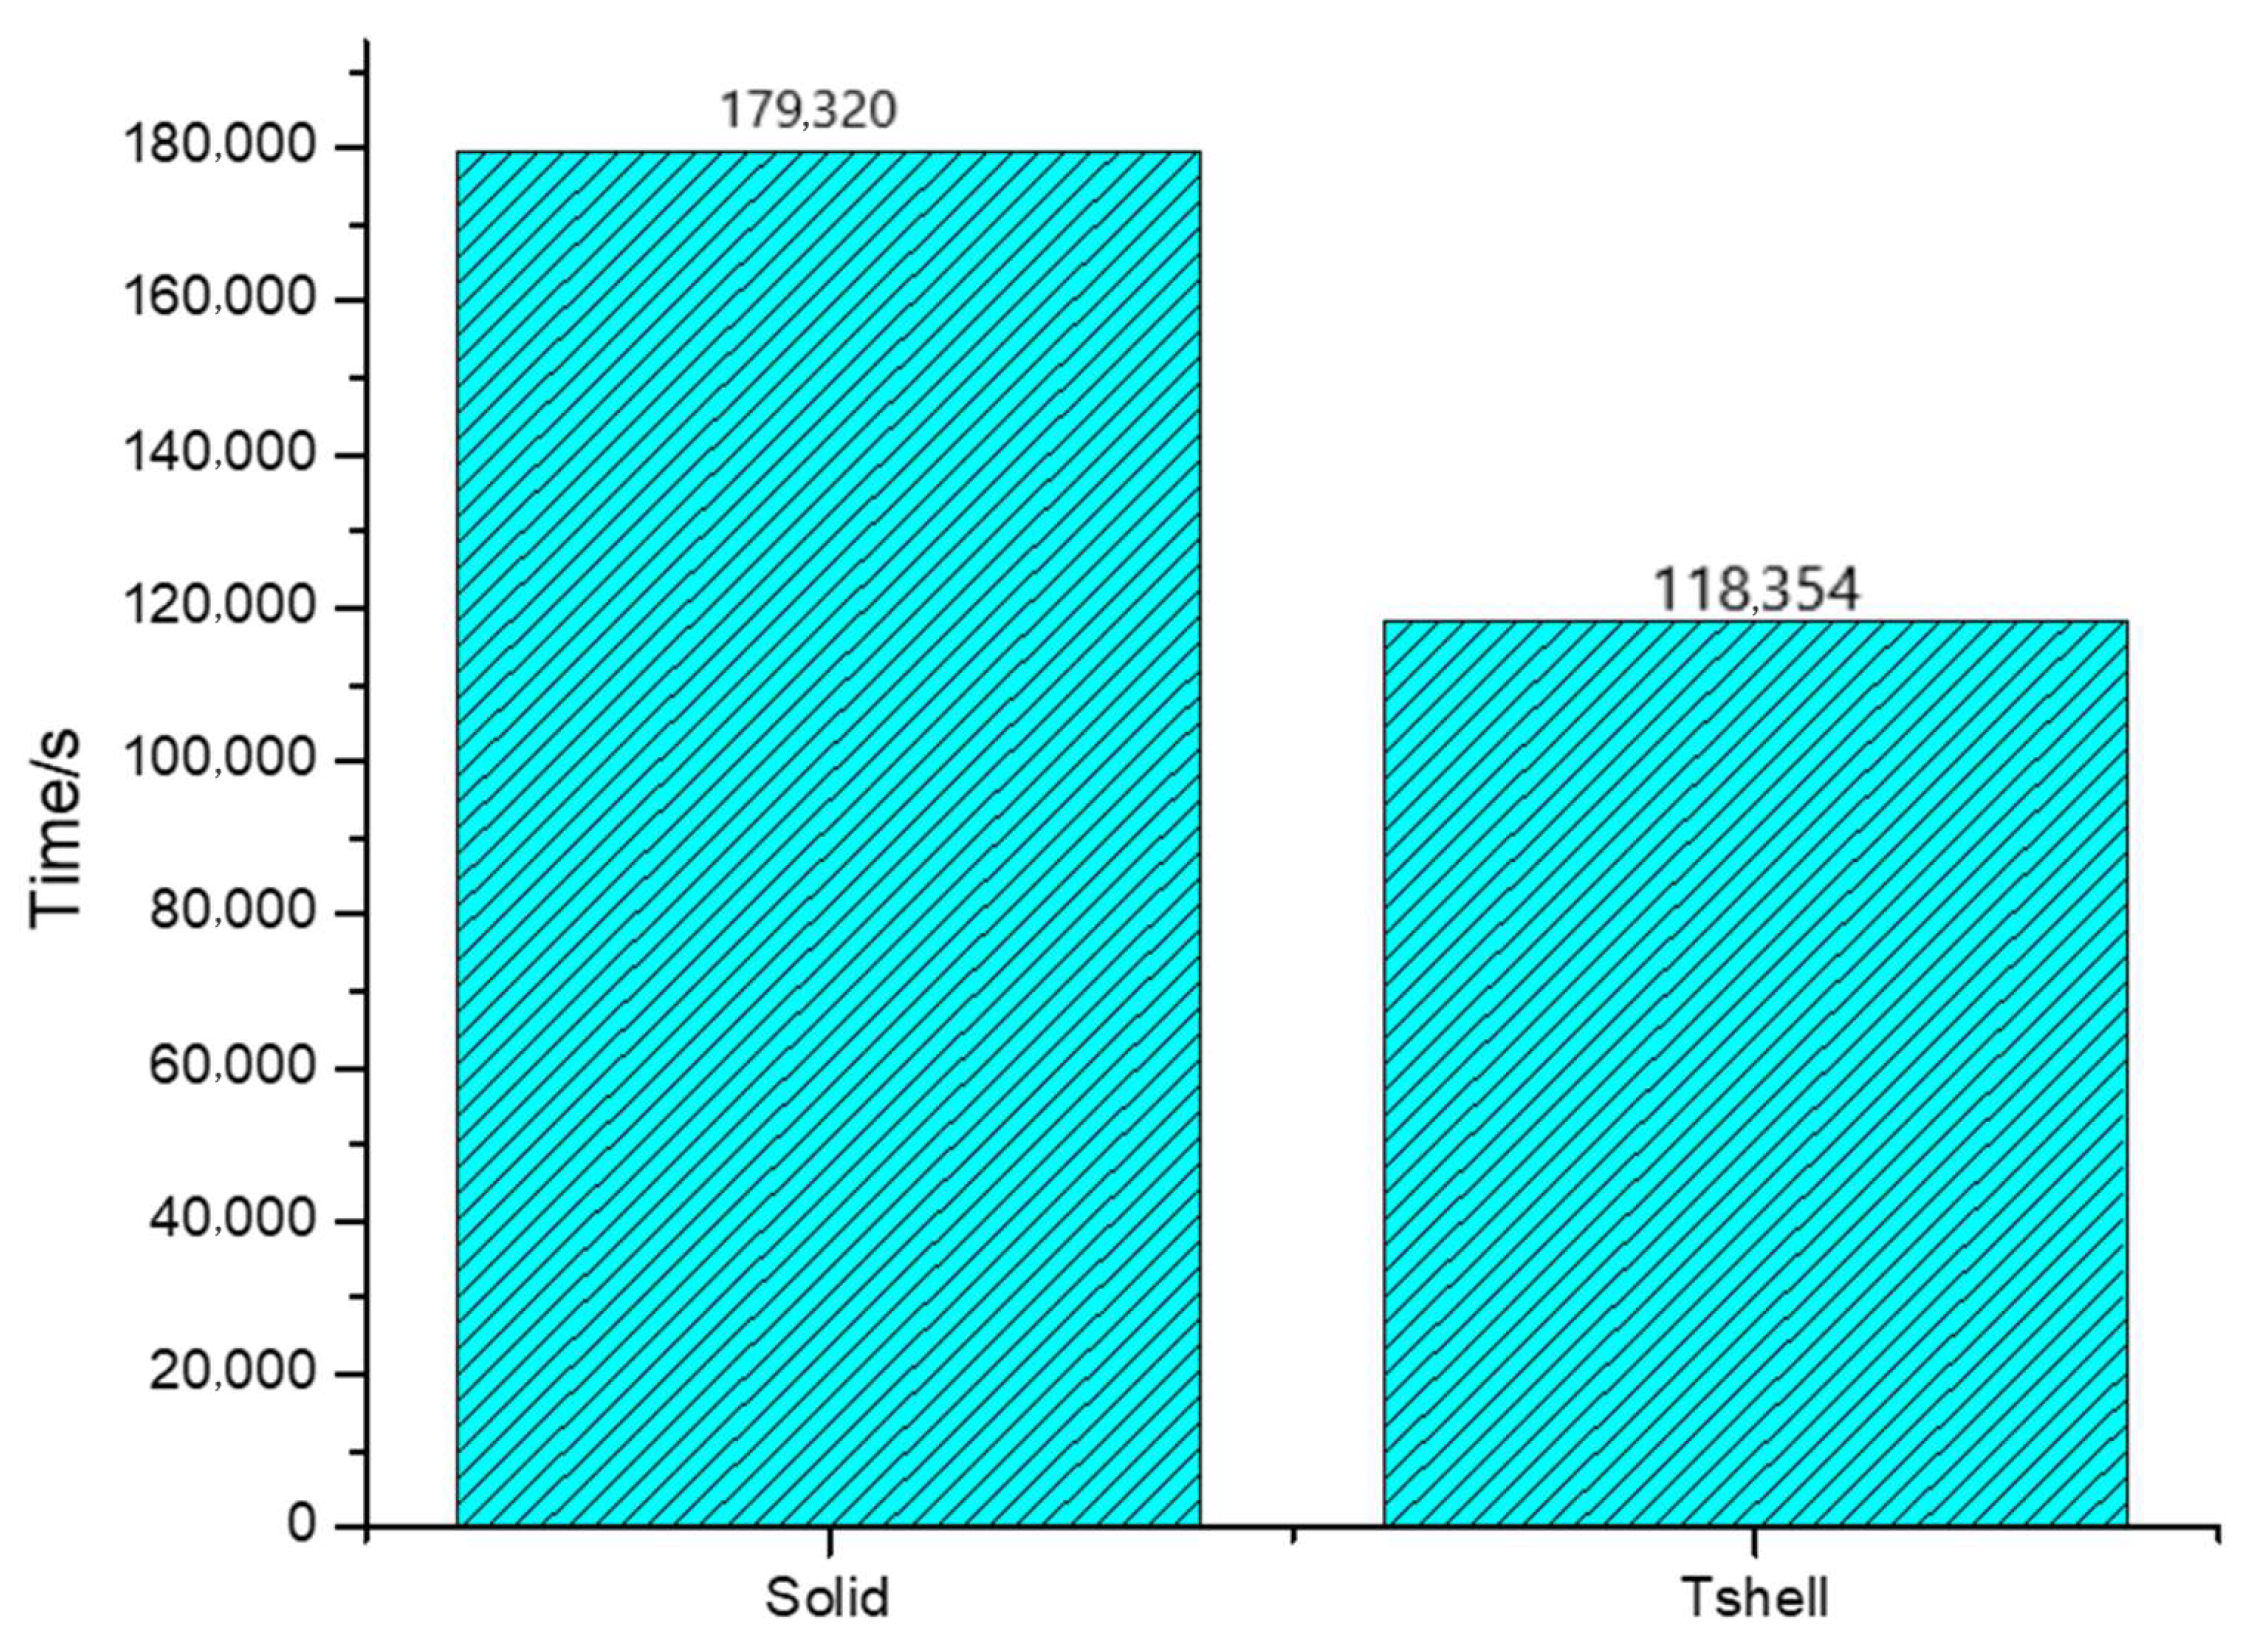
2.1. Tshell Element
2.1.1. Shear-Locking Problem
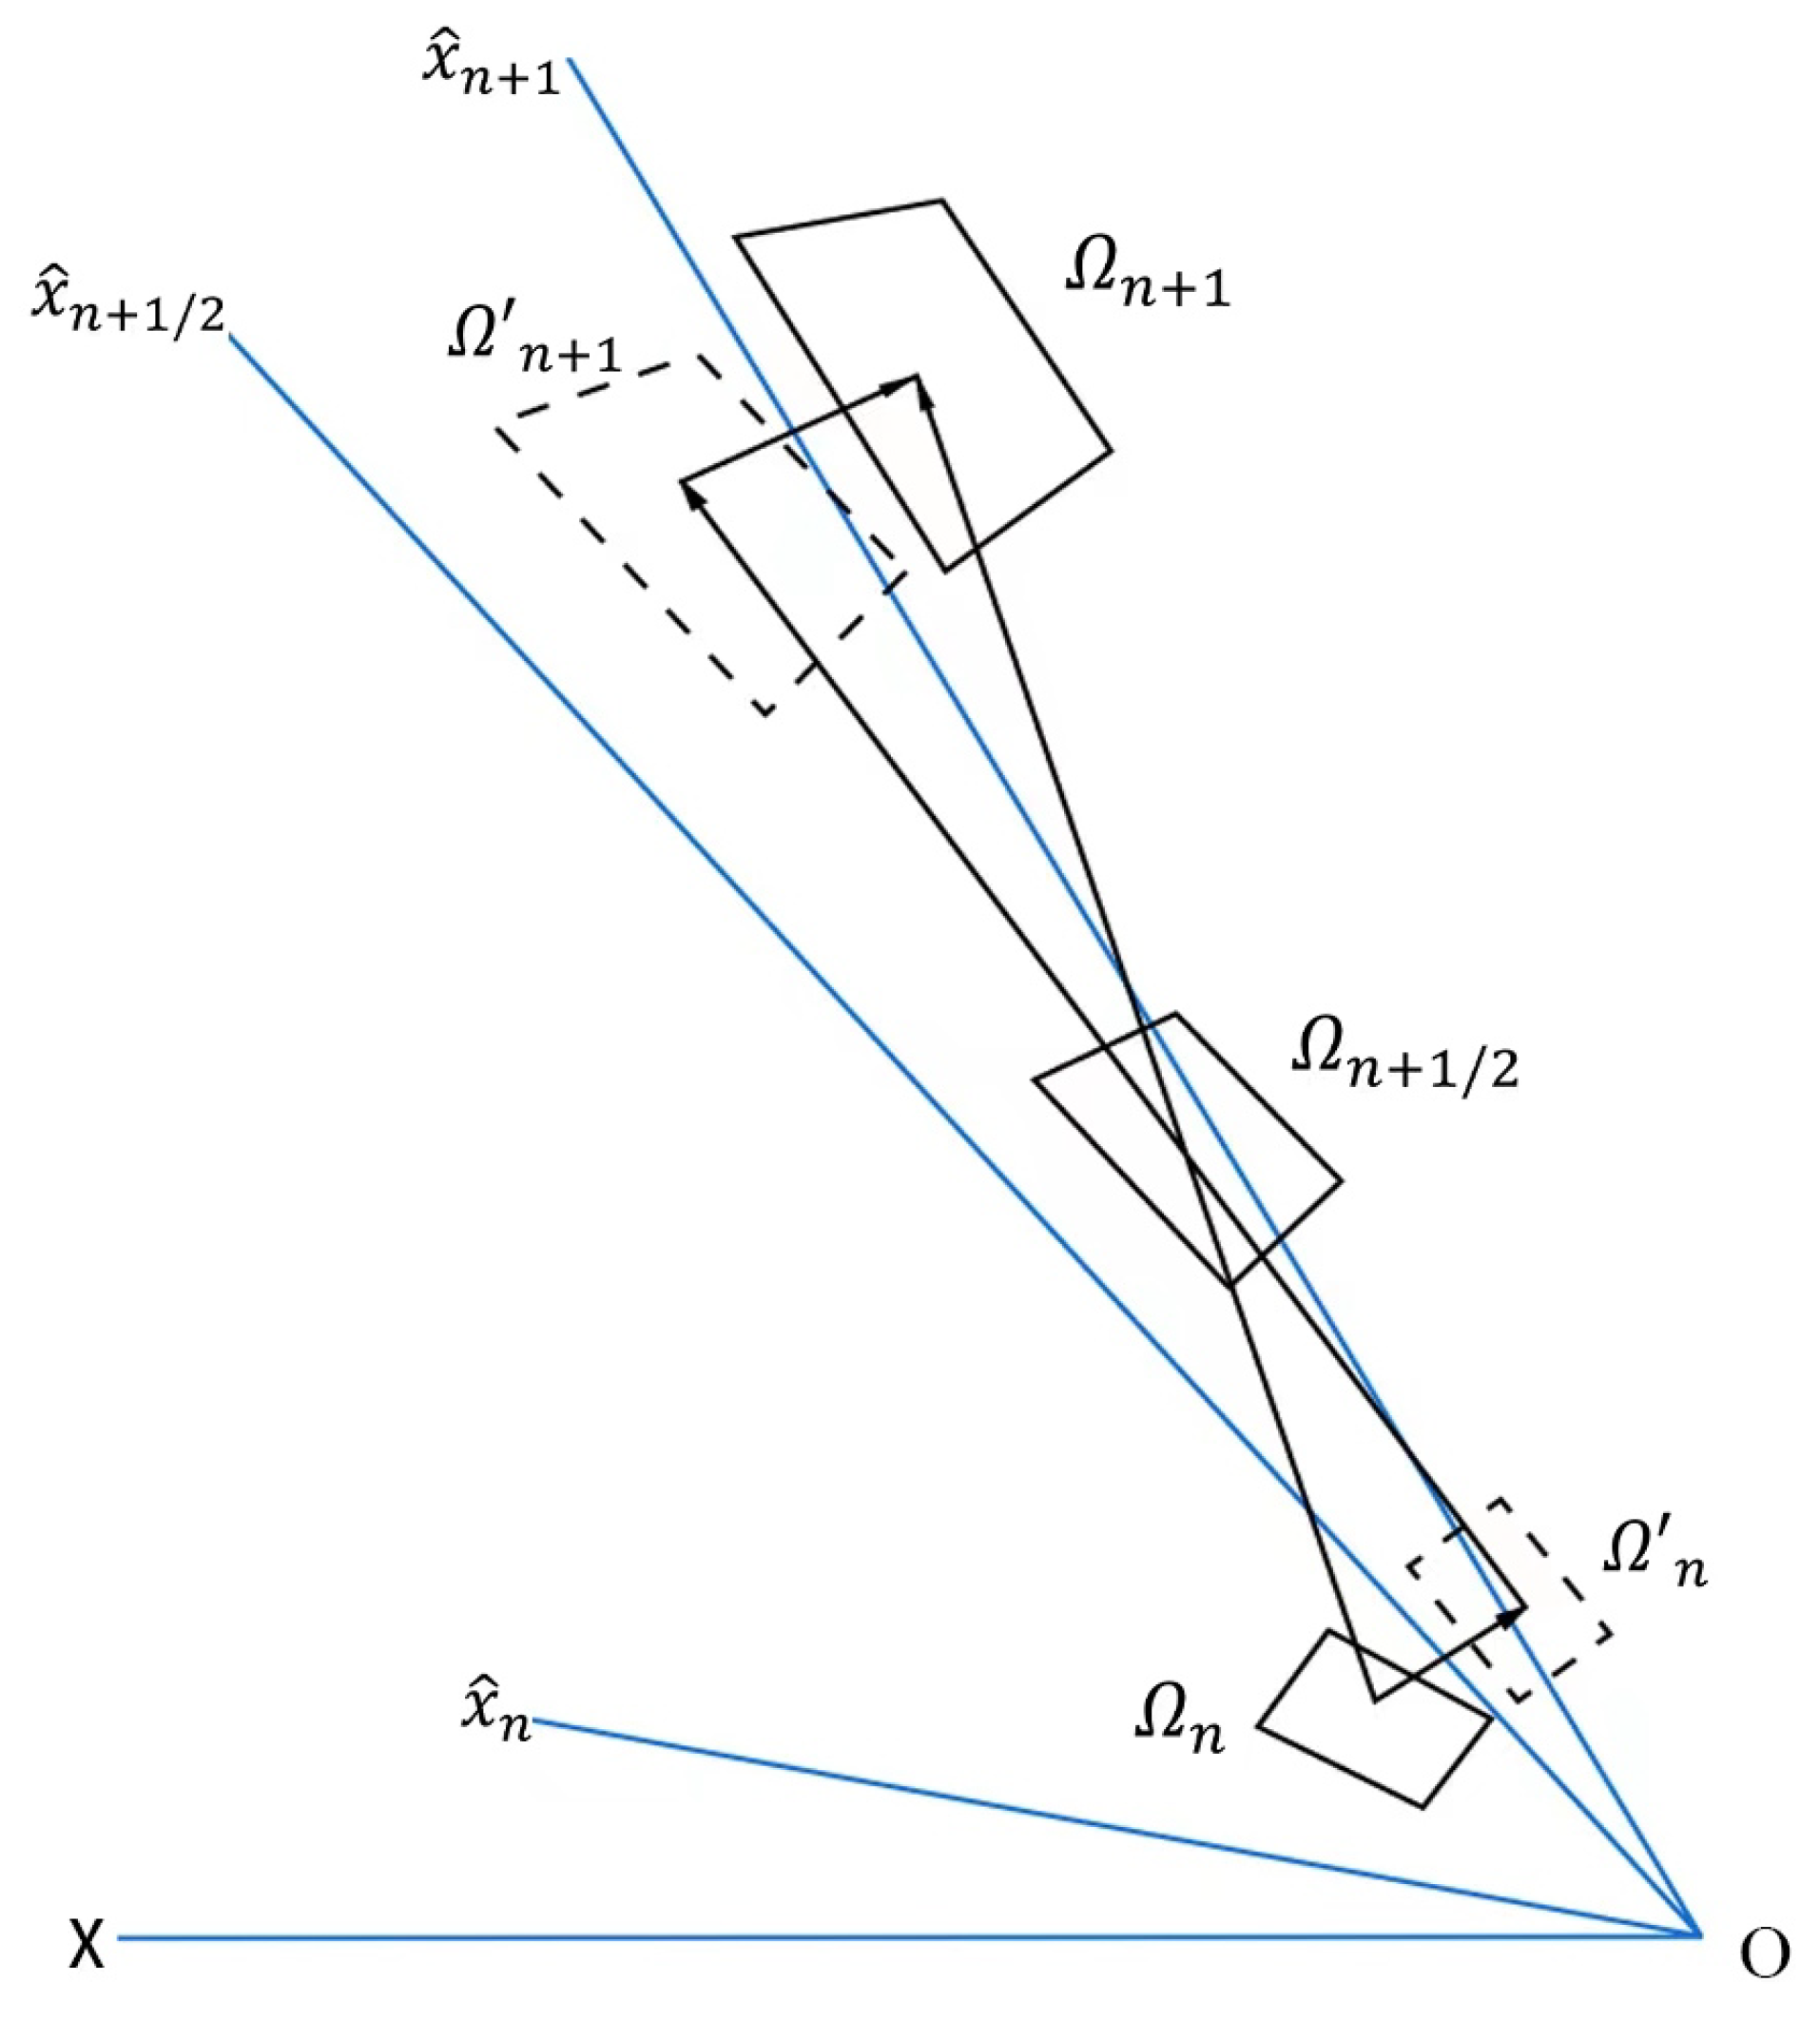
2.1.2. Co-Rotational Coordinate System
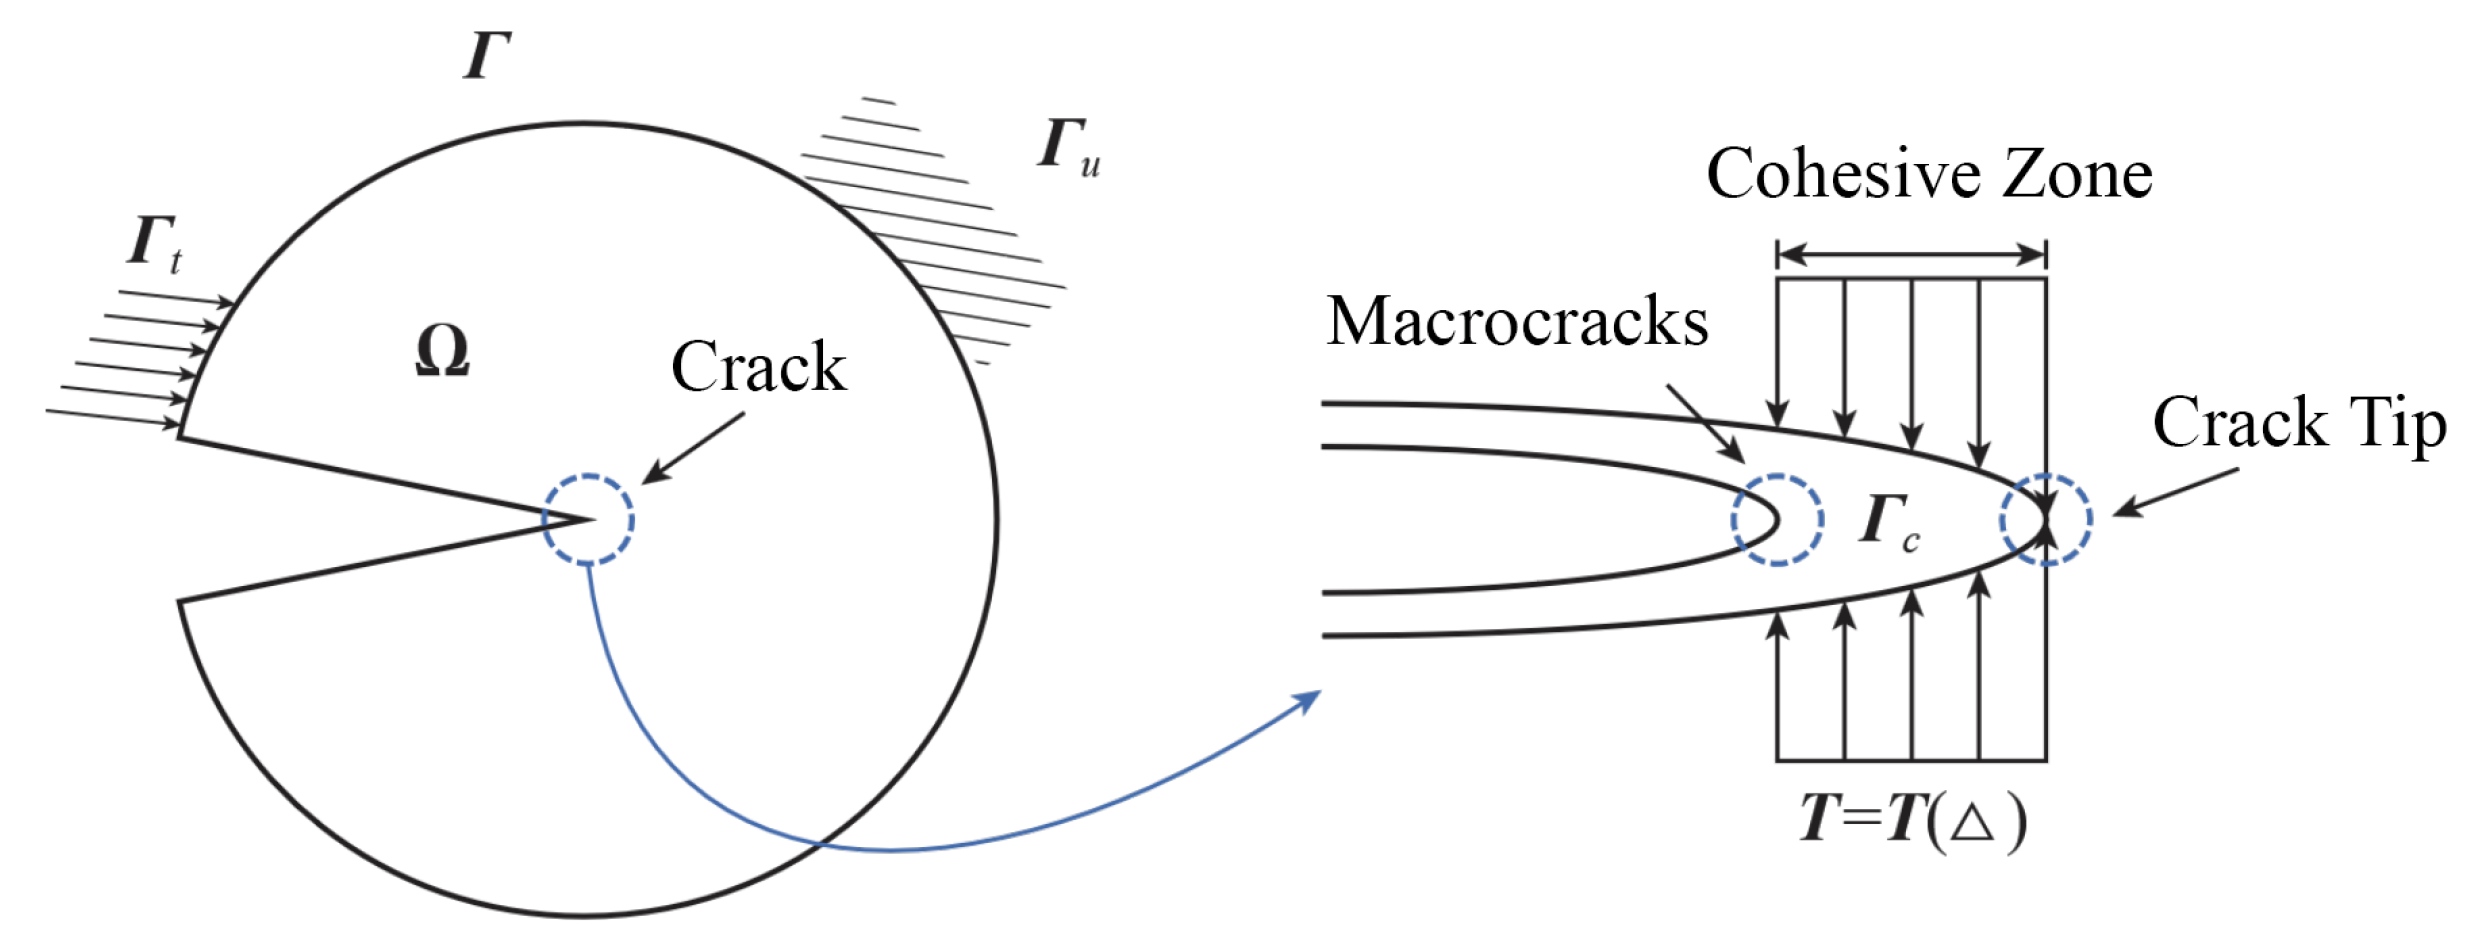
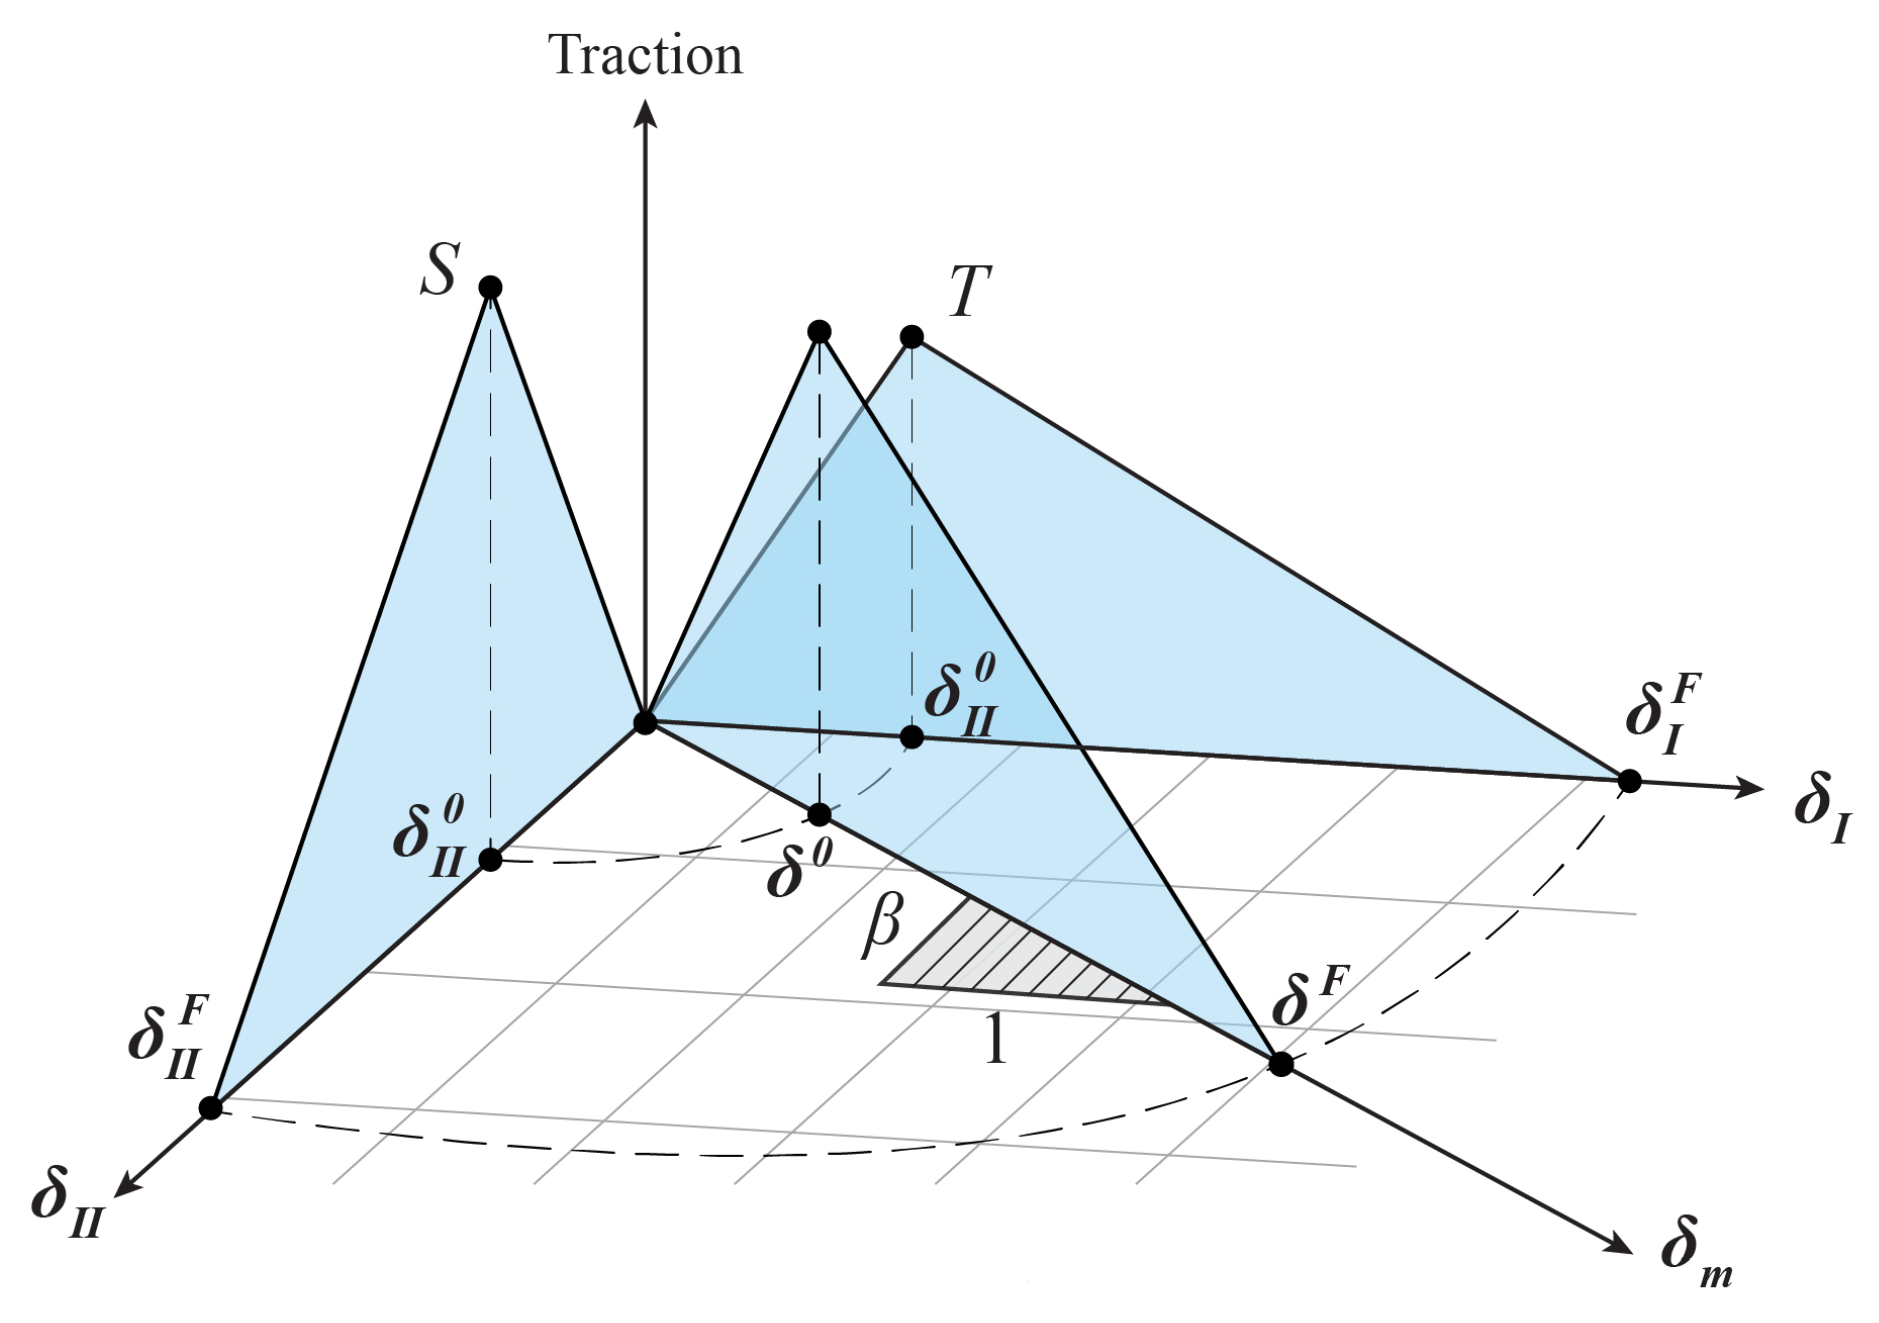
2.2. Intrinsic Cohesive Element
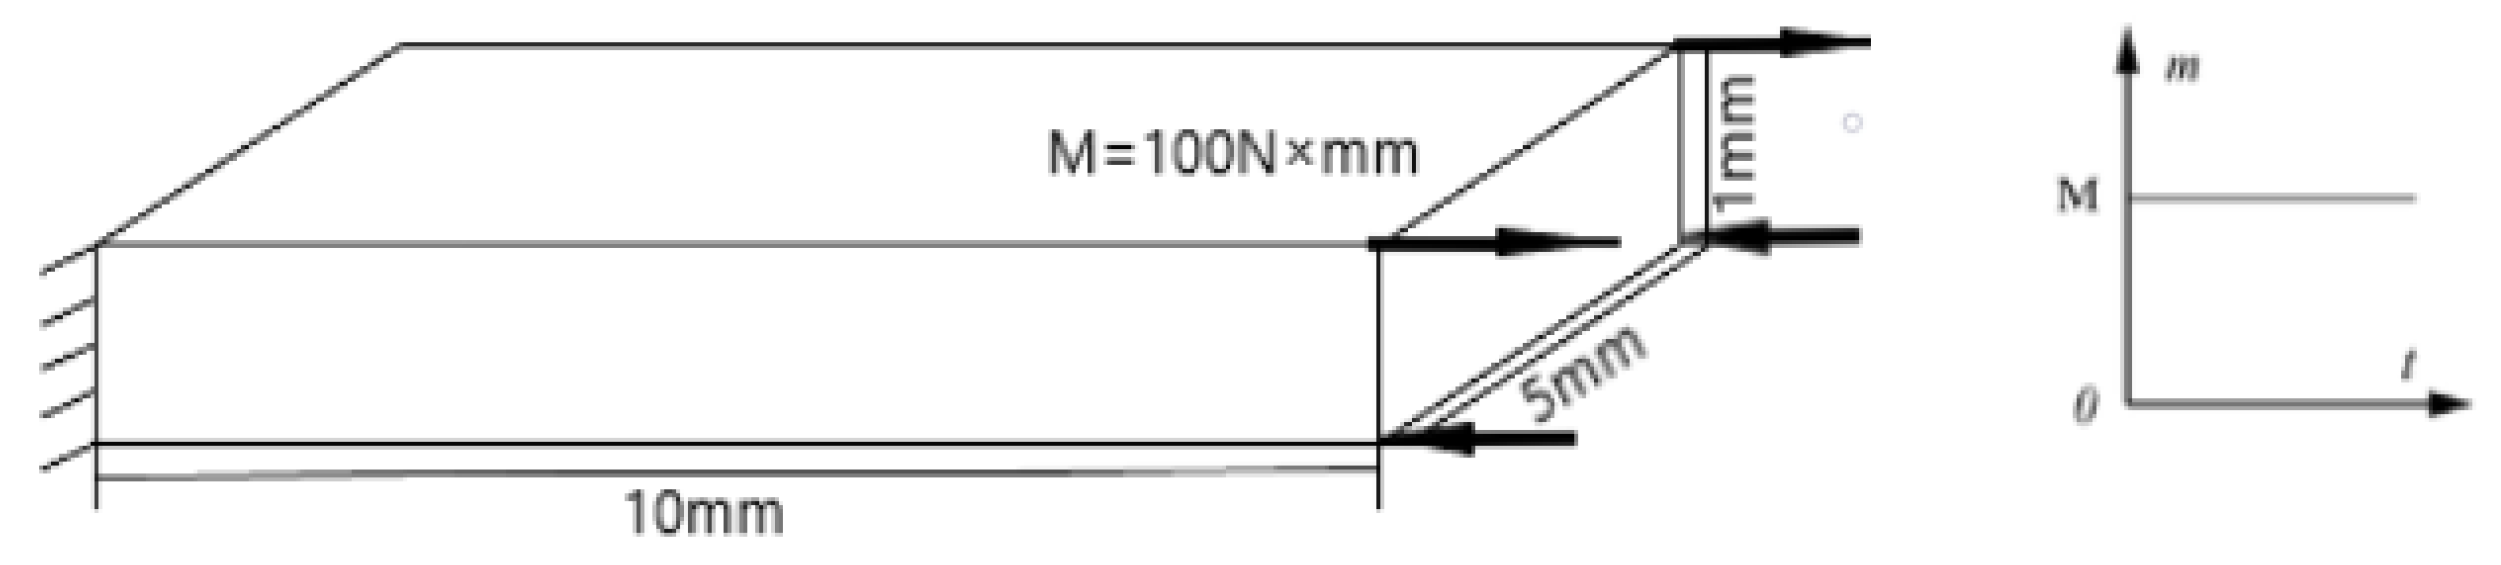
3. The Double Cantilever Beam Test
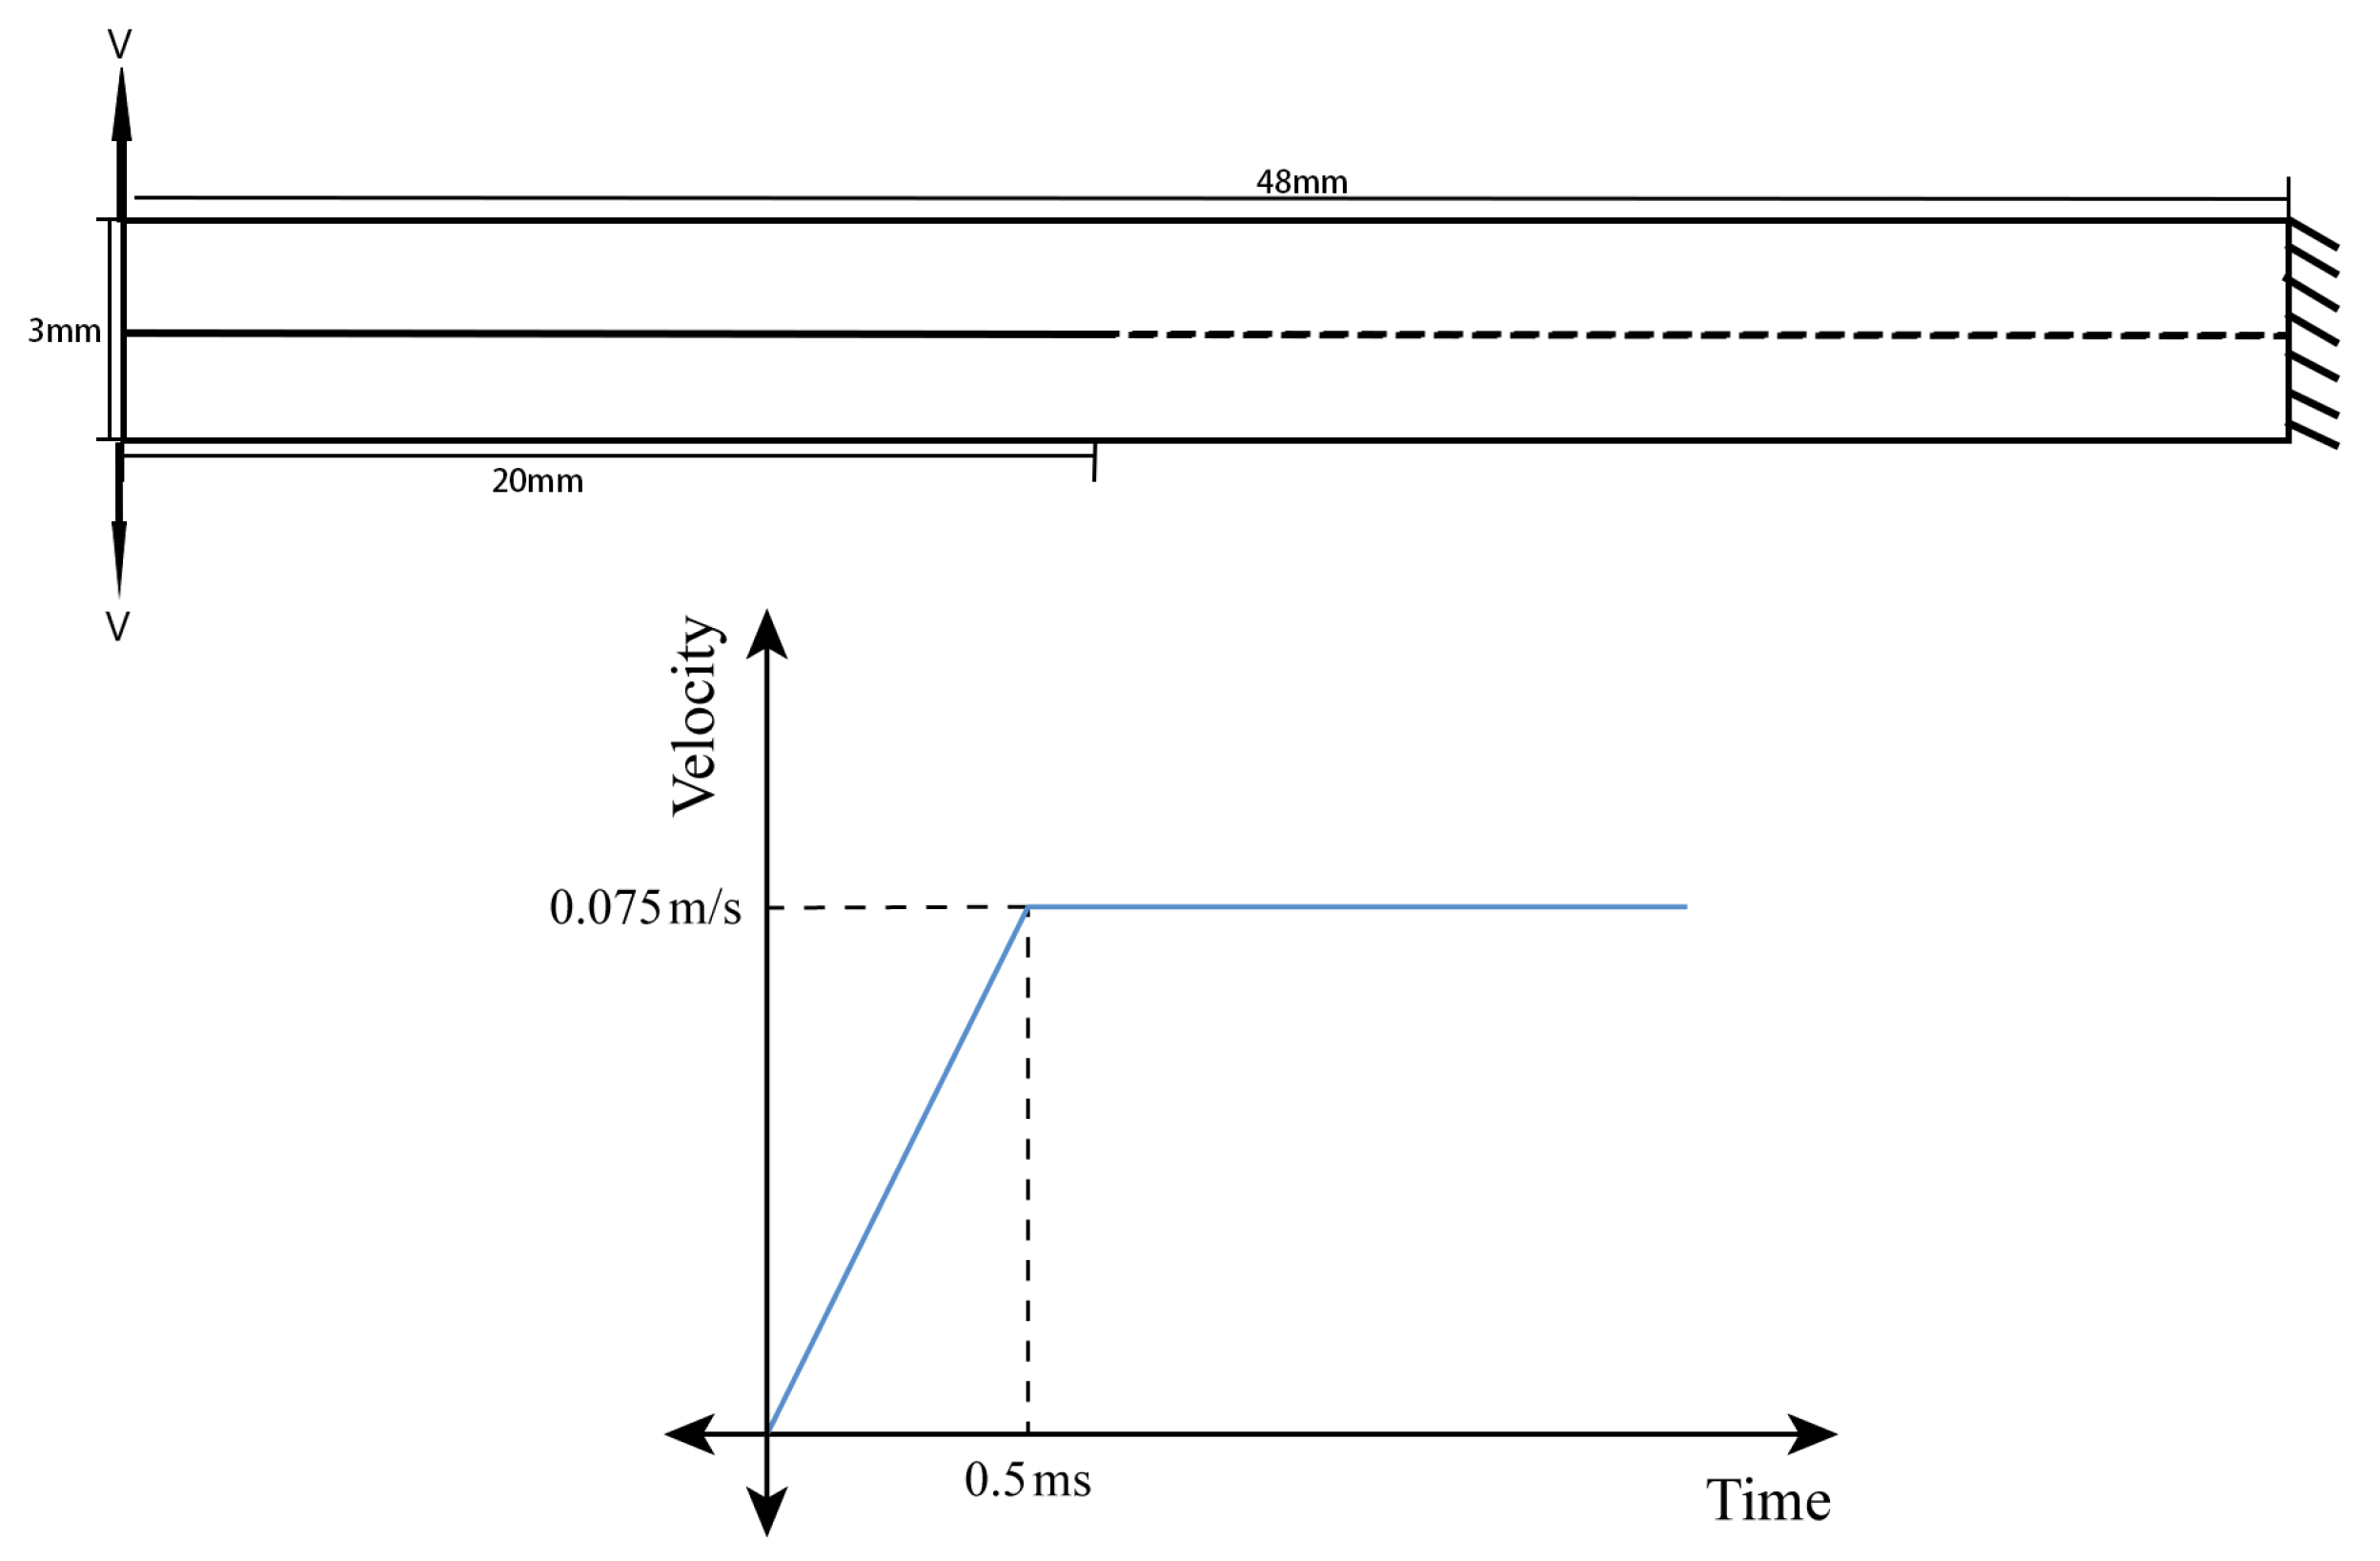
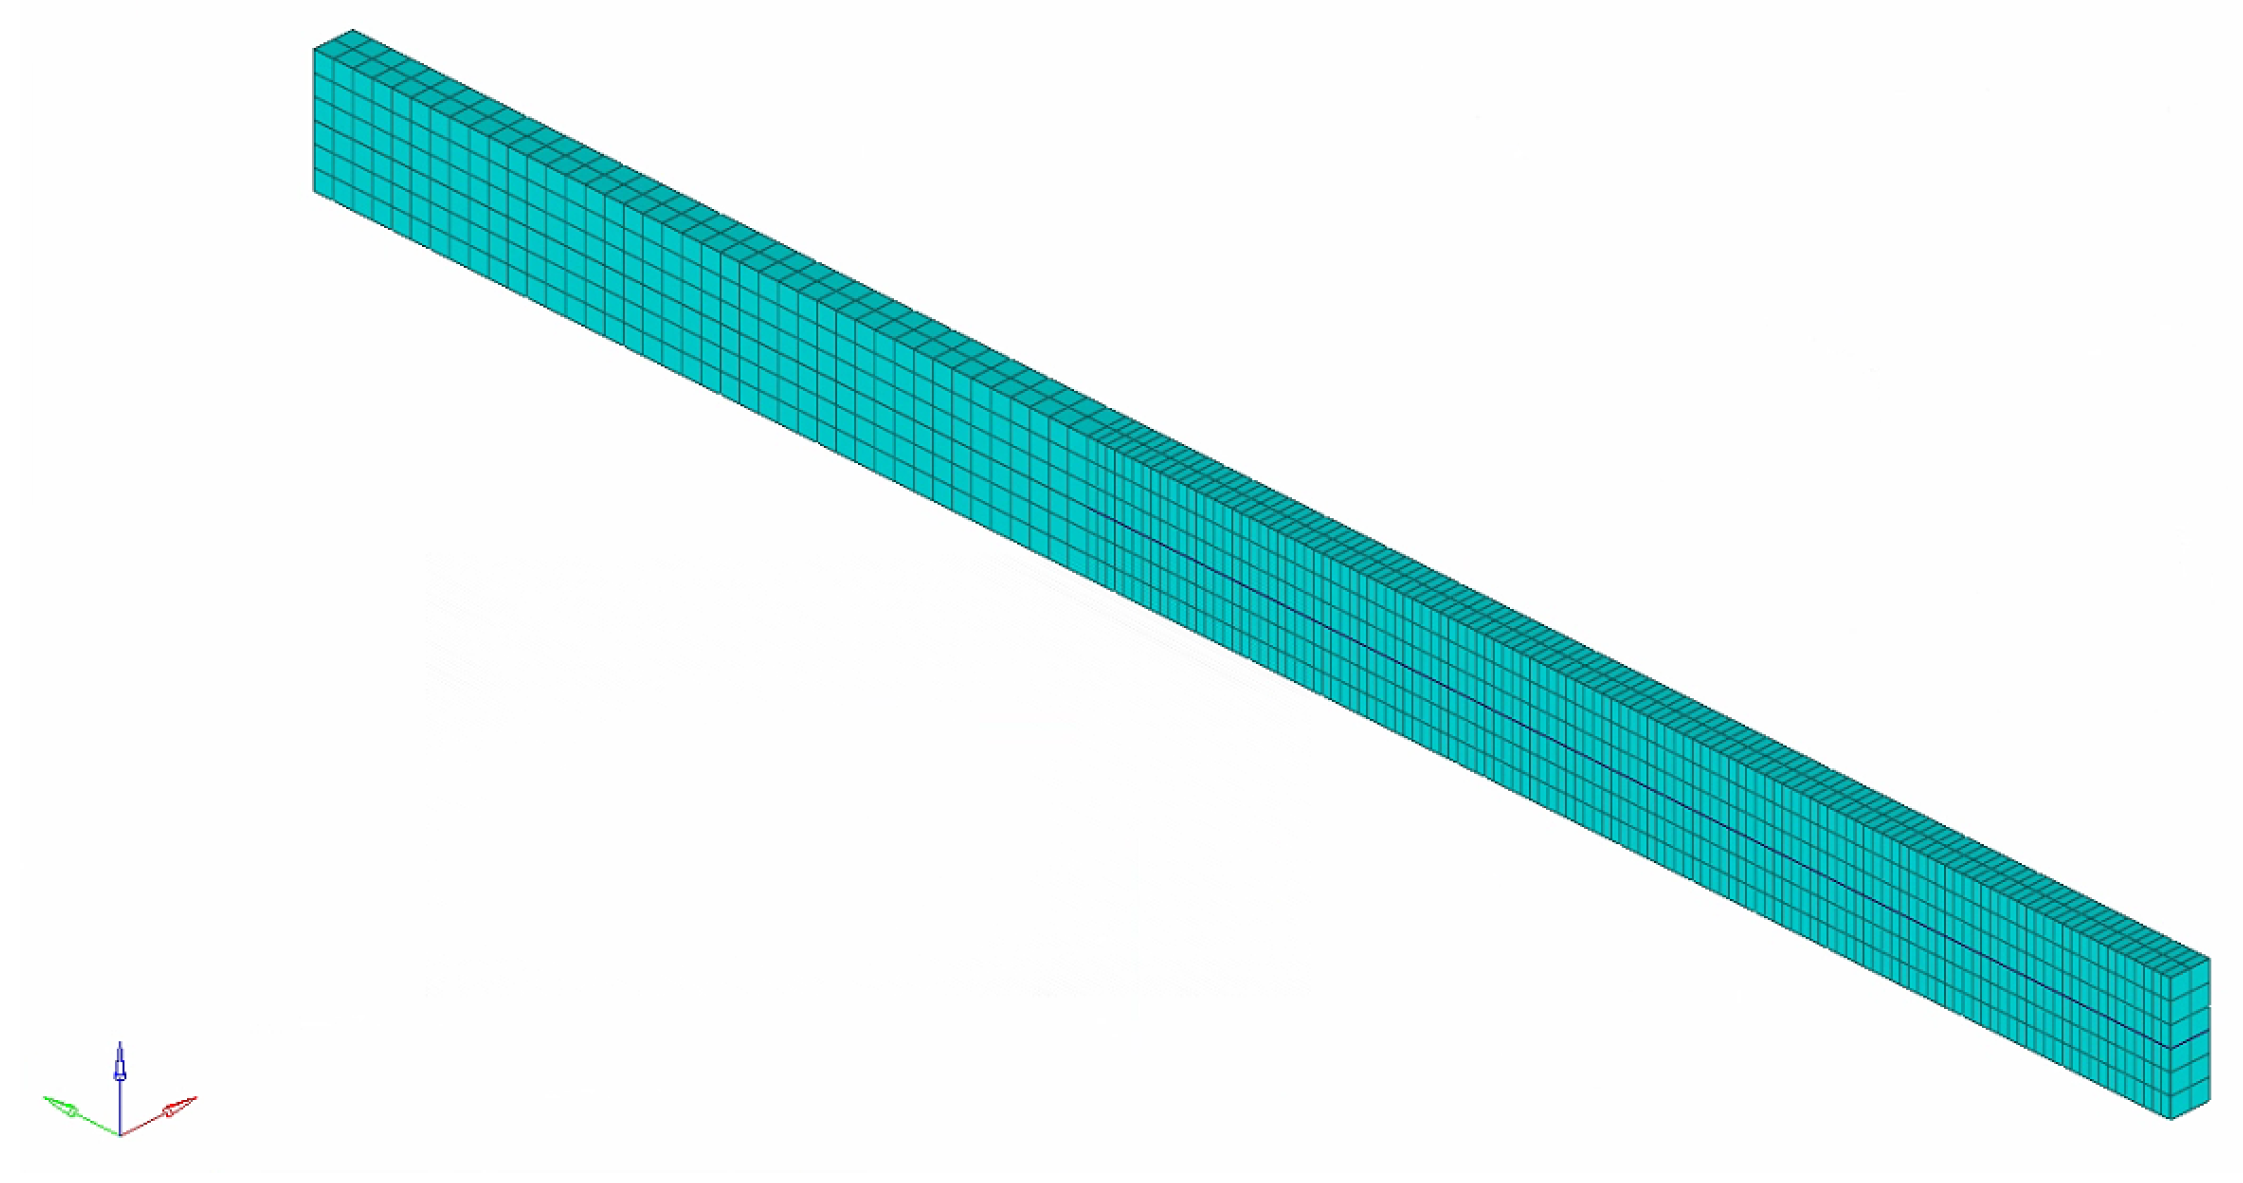
3.1. Example Description
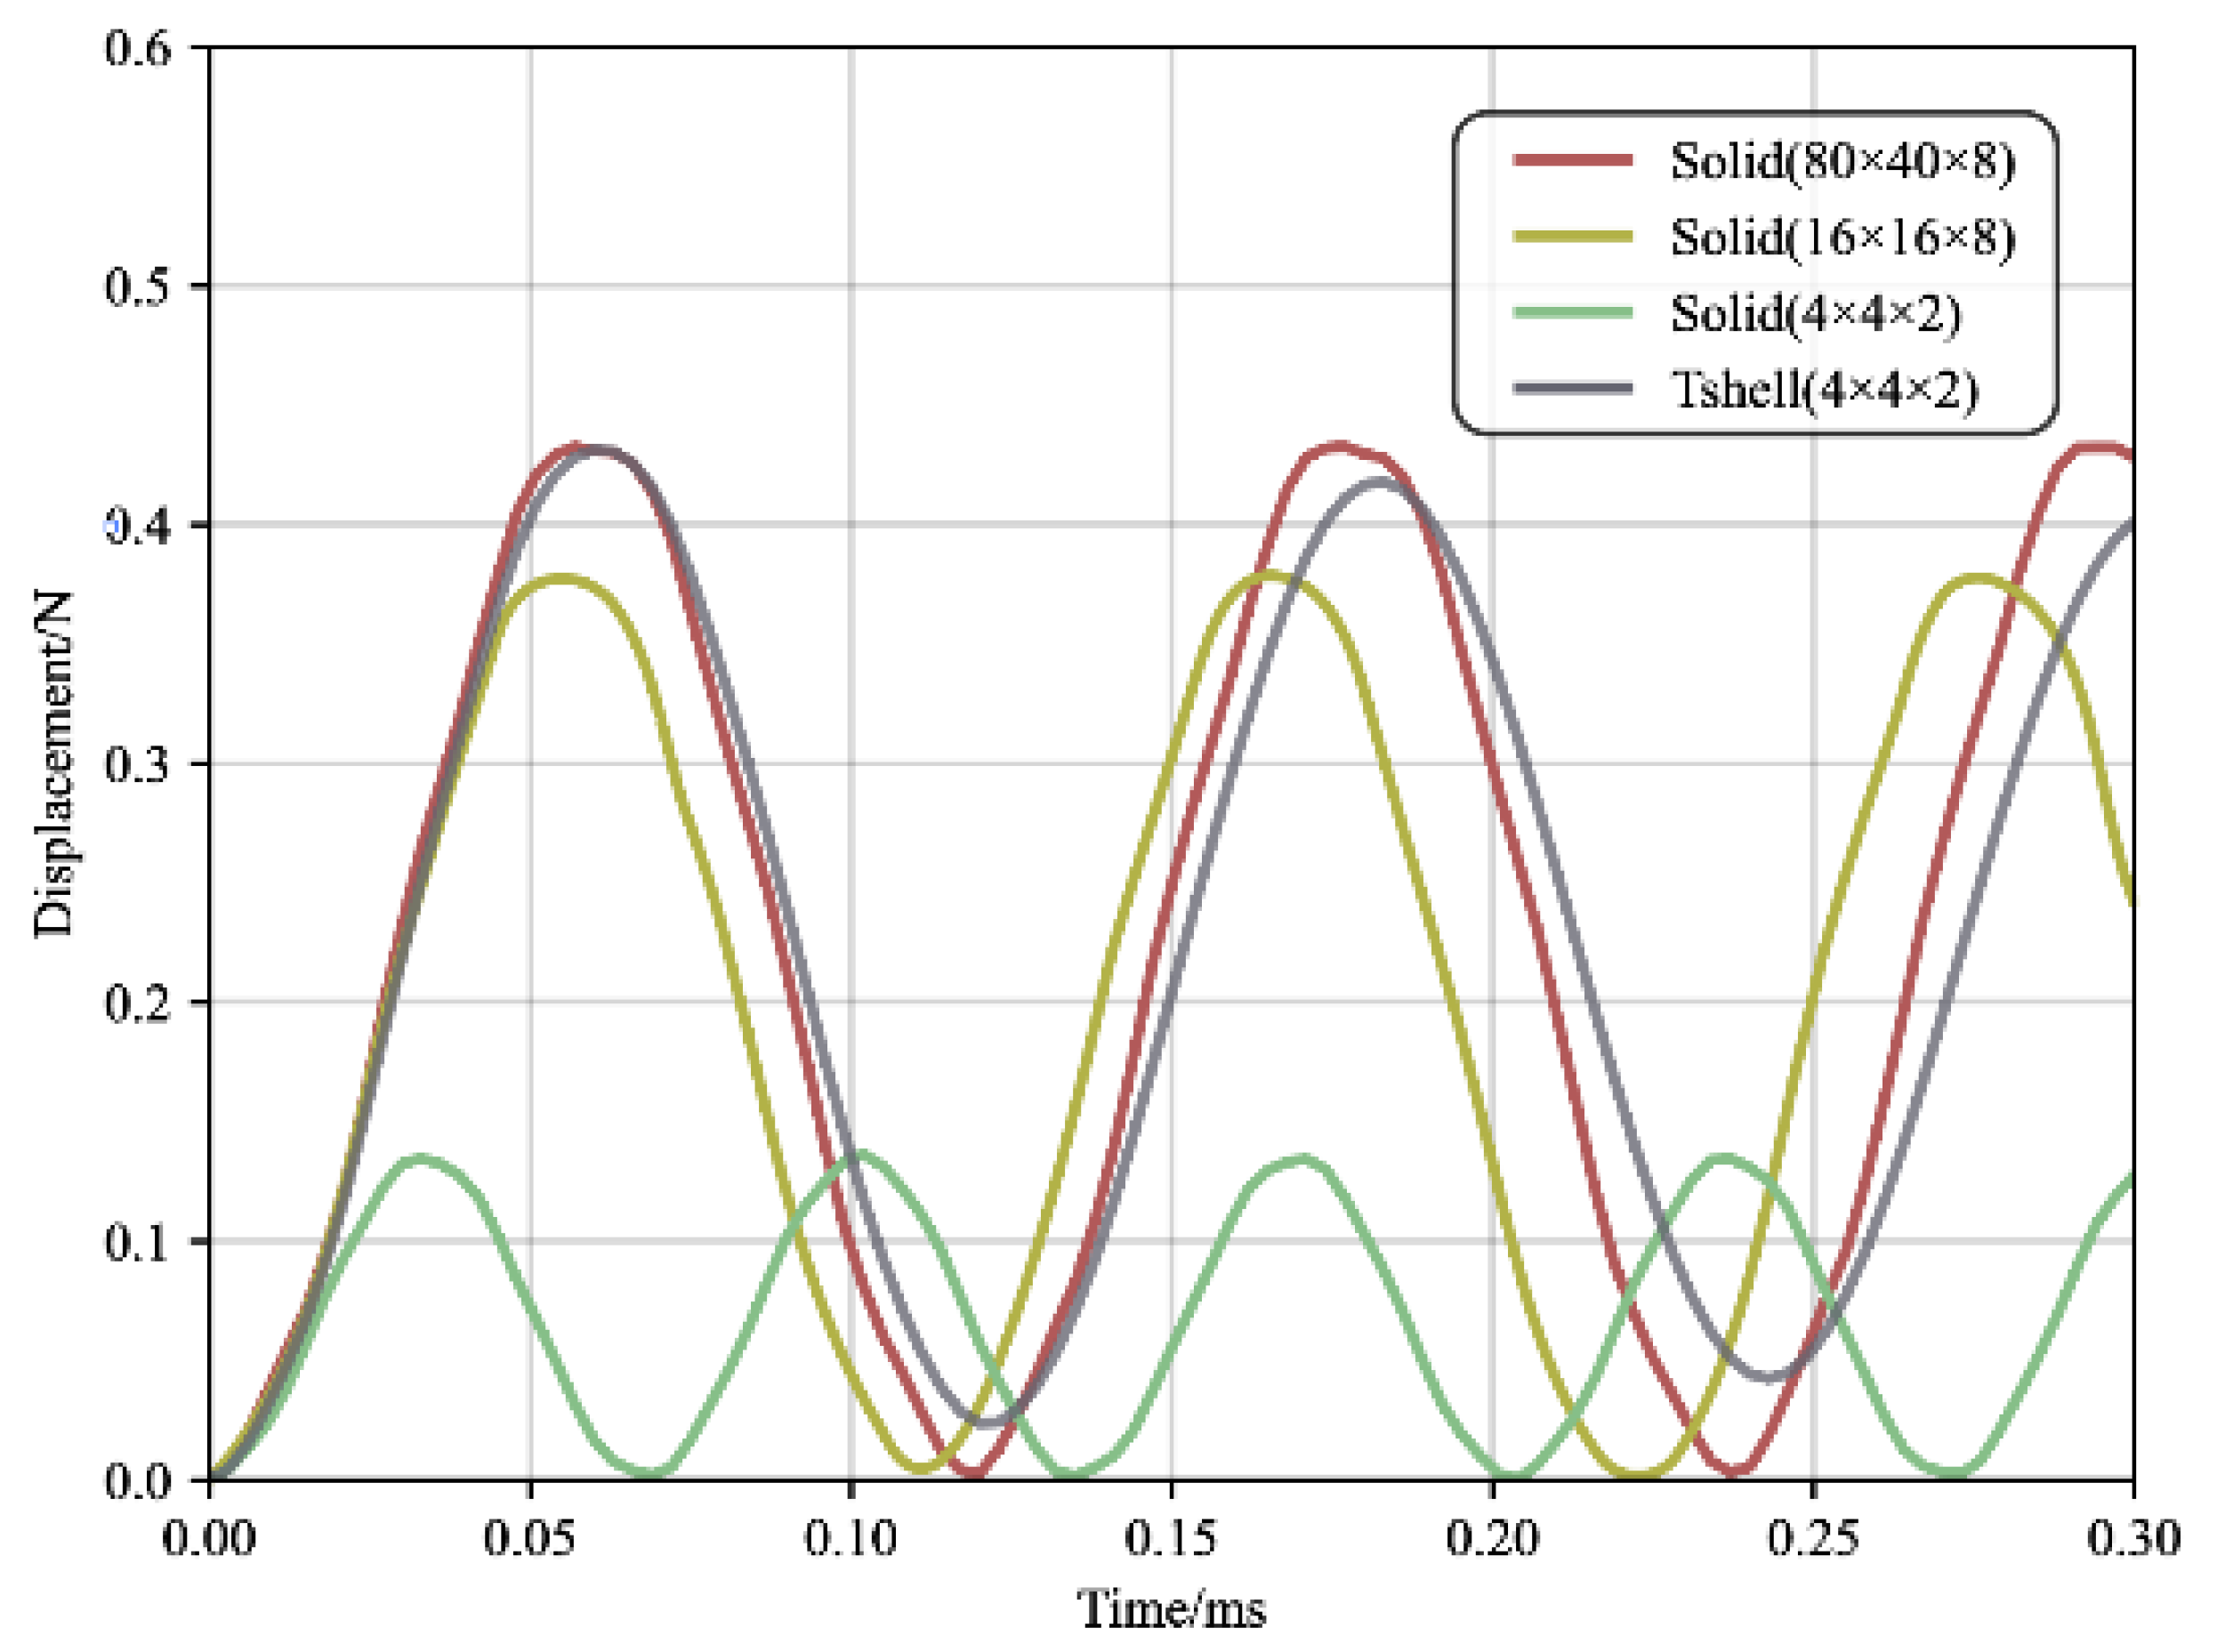
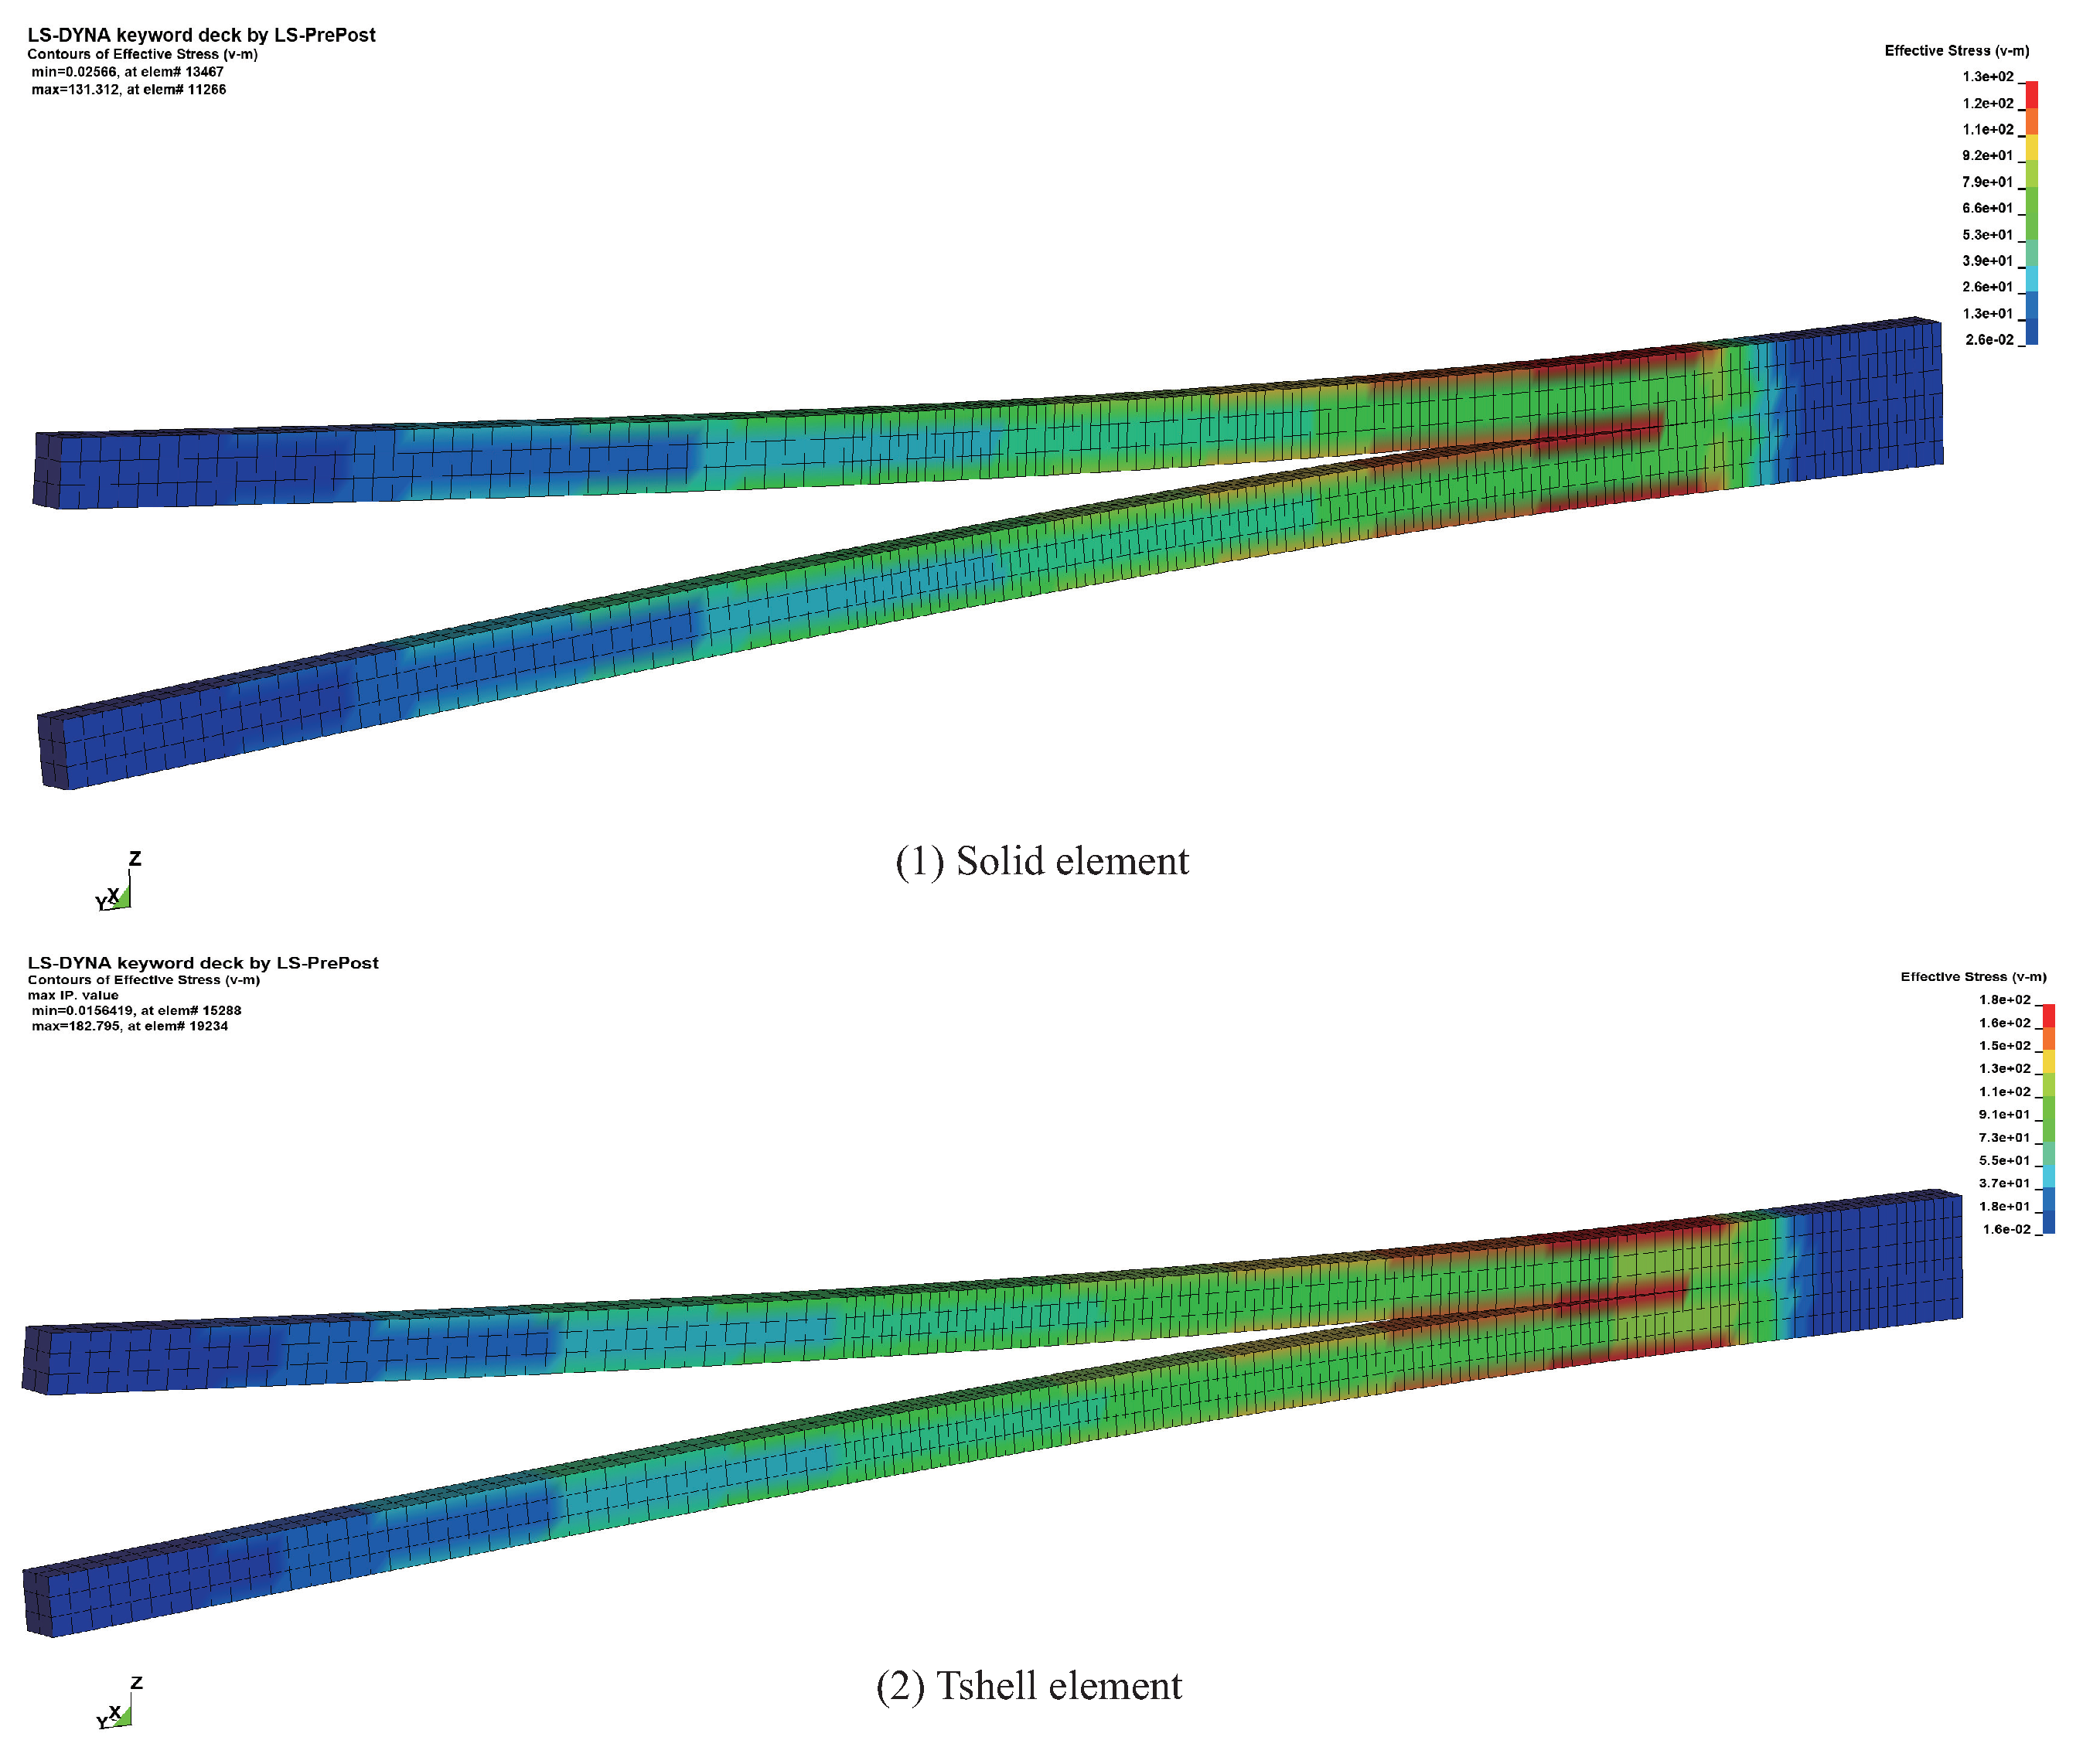
3.2. Numerical Results
4. Simulation of Laminated Glass Plate Drop-Weight Impact
4.1. Laminated Glass Plate Drop-Weight Impact Experimental Apparatus
4.2. PVB Material Model
4.3. Material Definition and Model Description
4.4. Analysis of Simulation Results
5. Application in the Windshield Impact Test
5.1. Introduction of Experimental Equipment
5.2. Results Analysis
6. Parametric Study
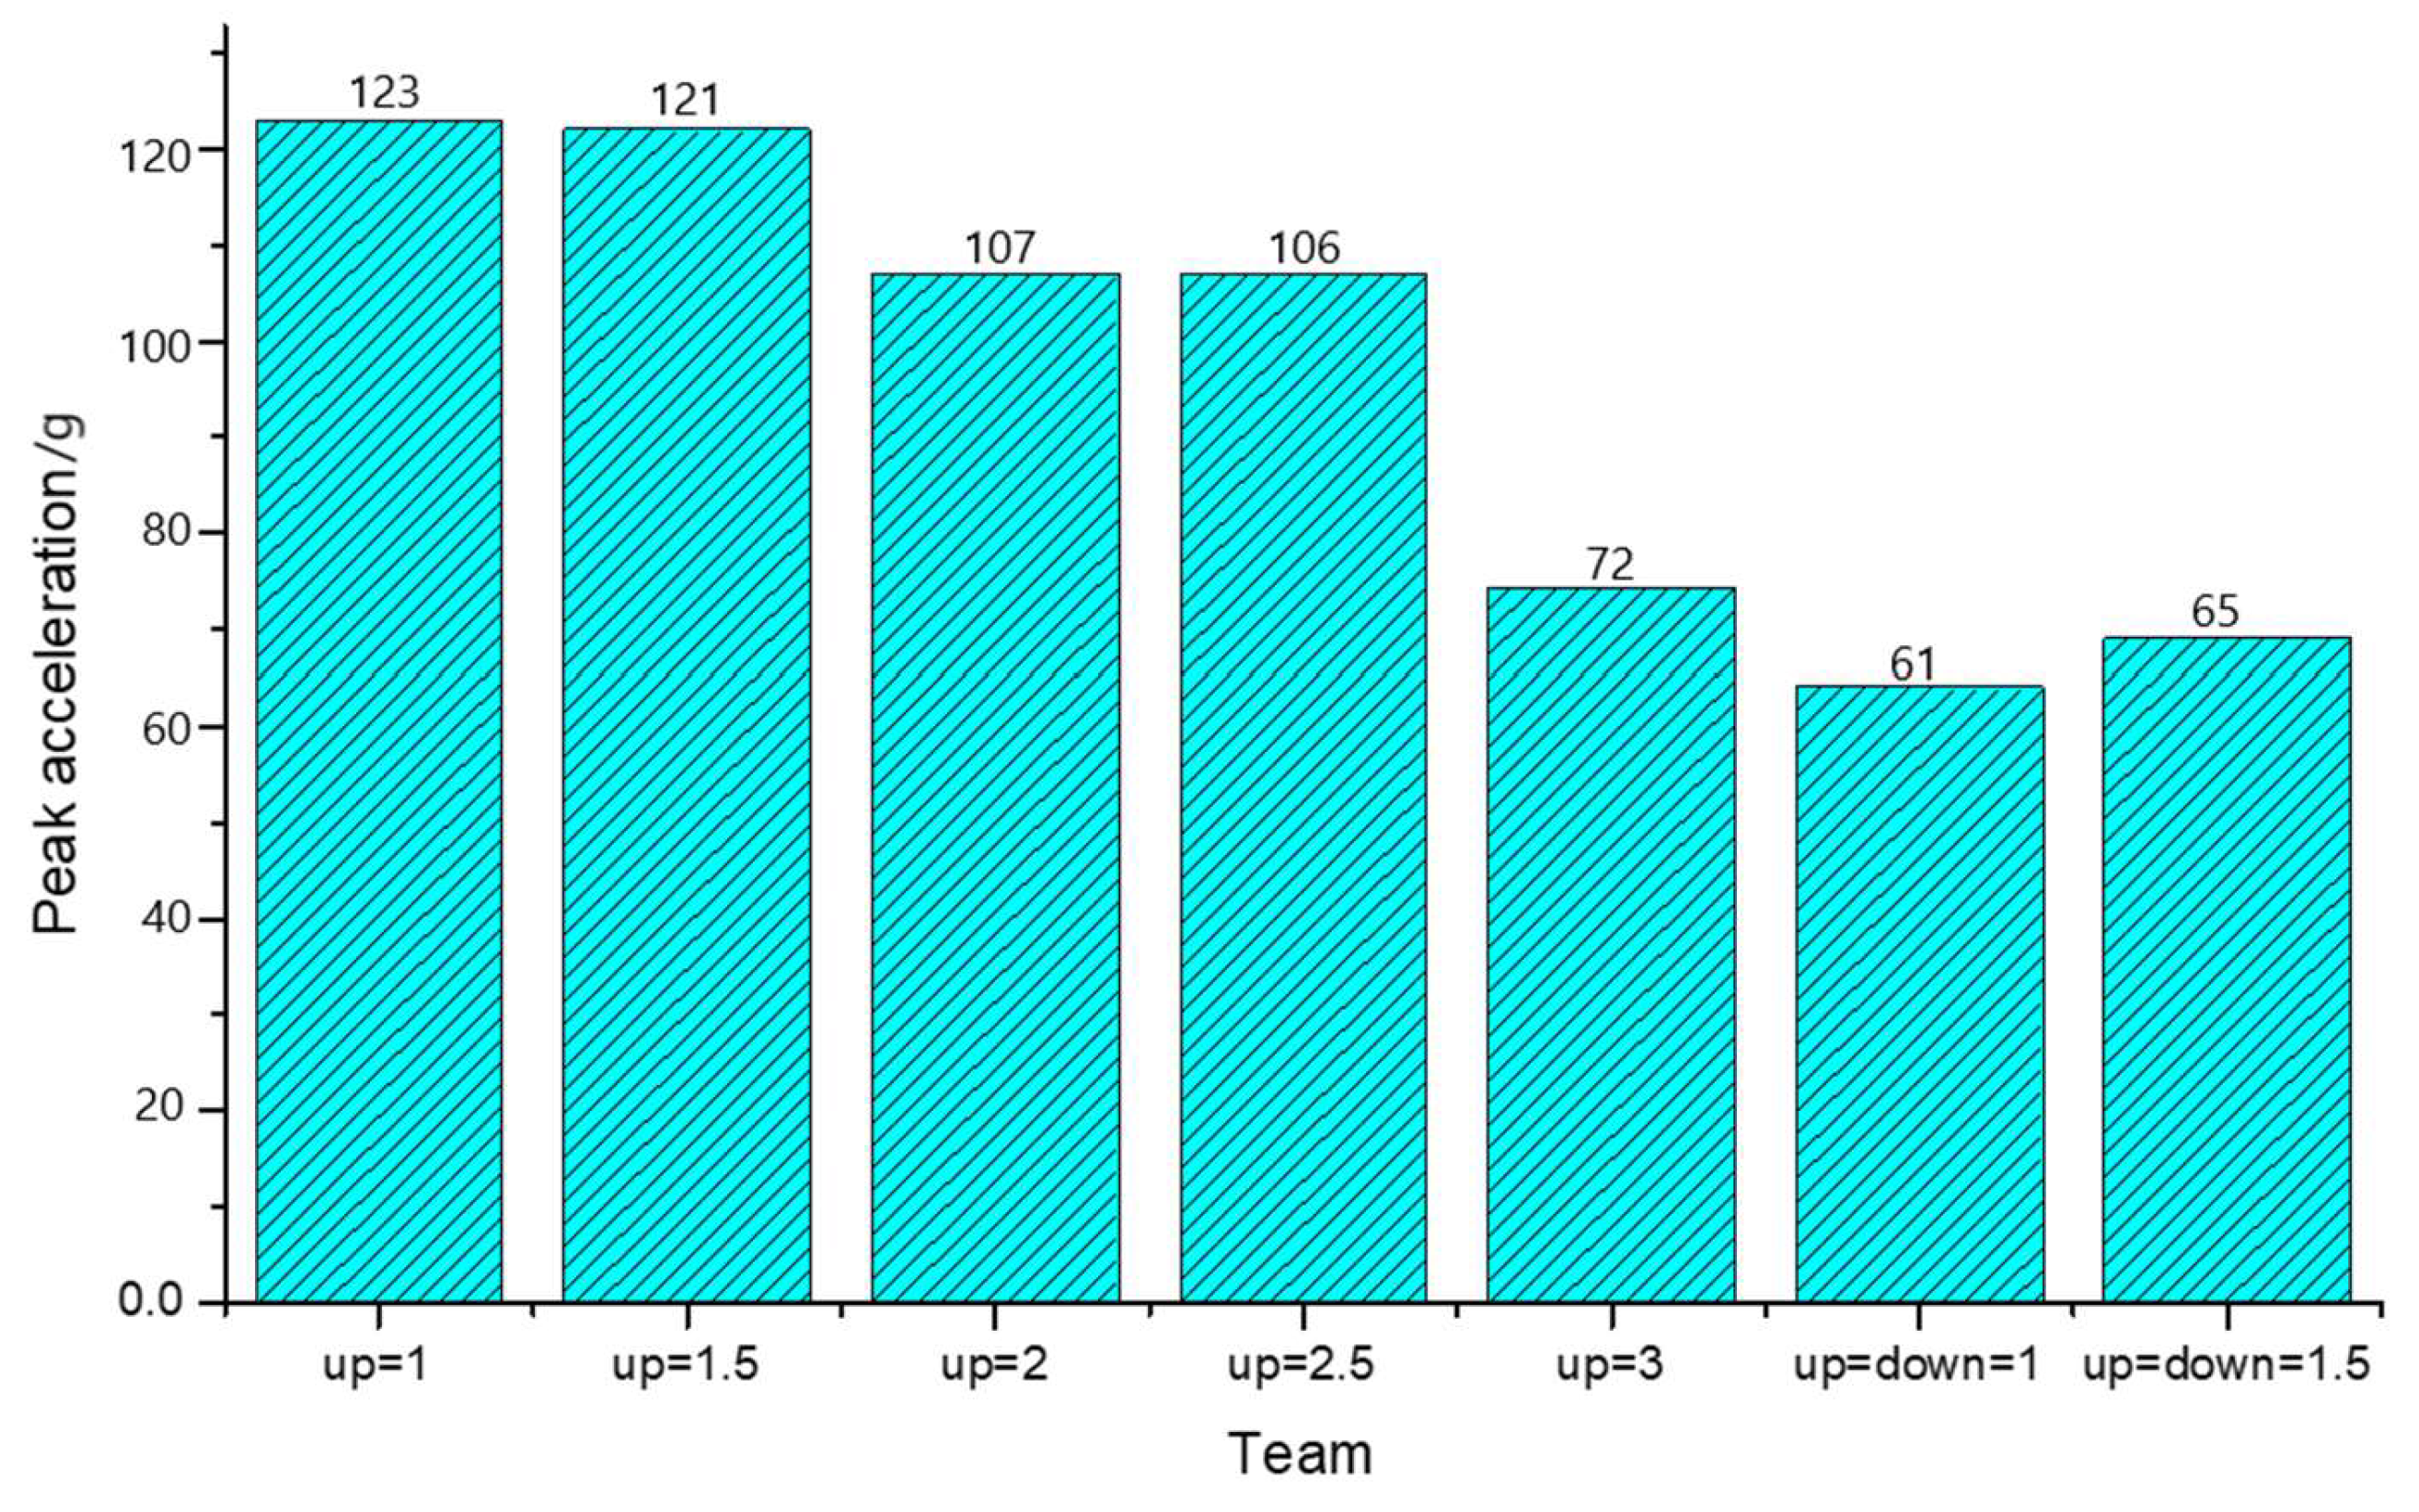
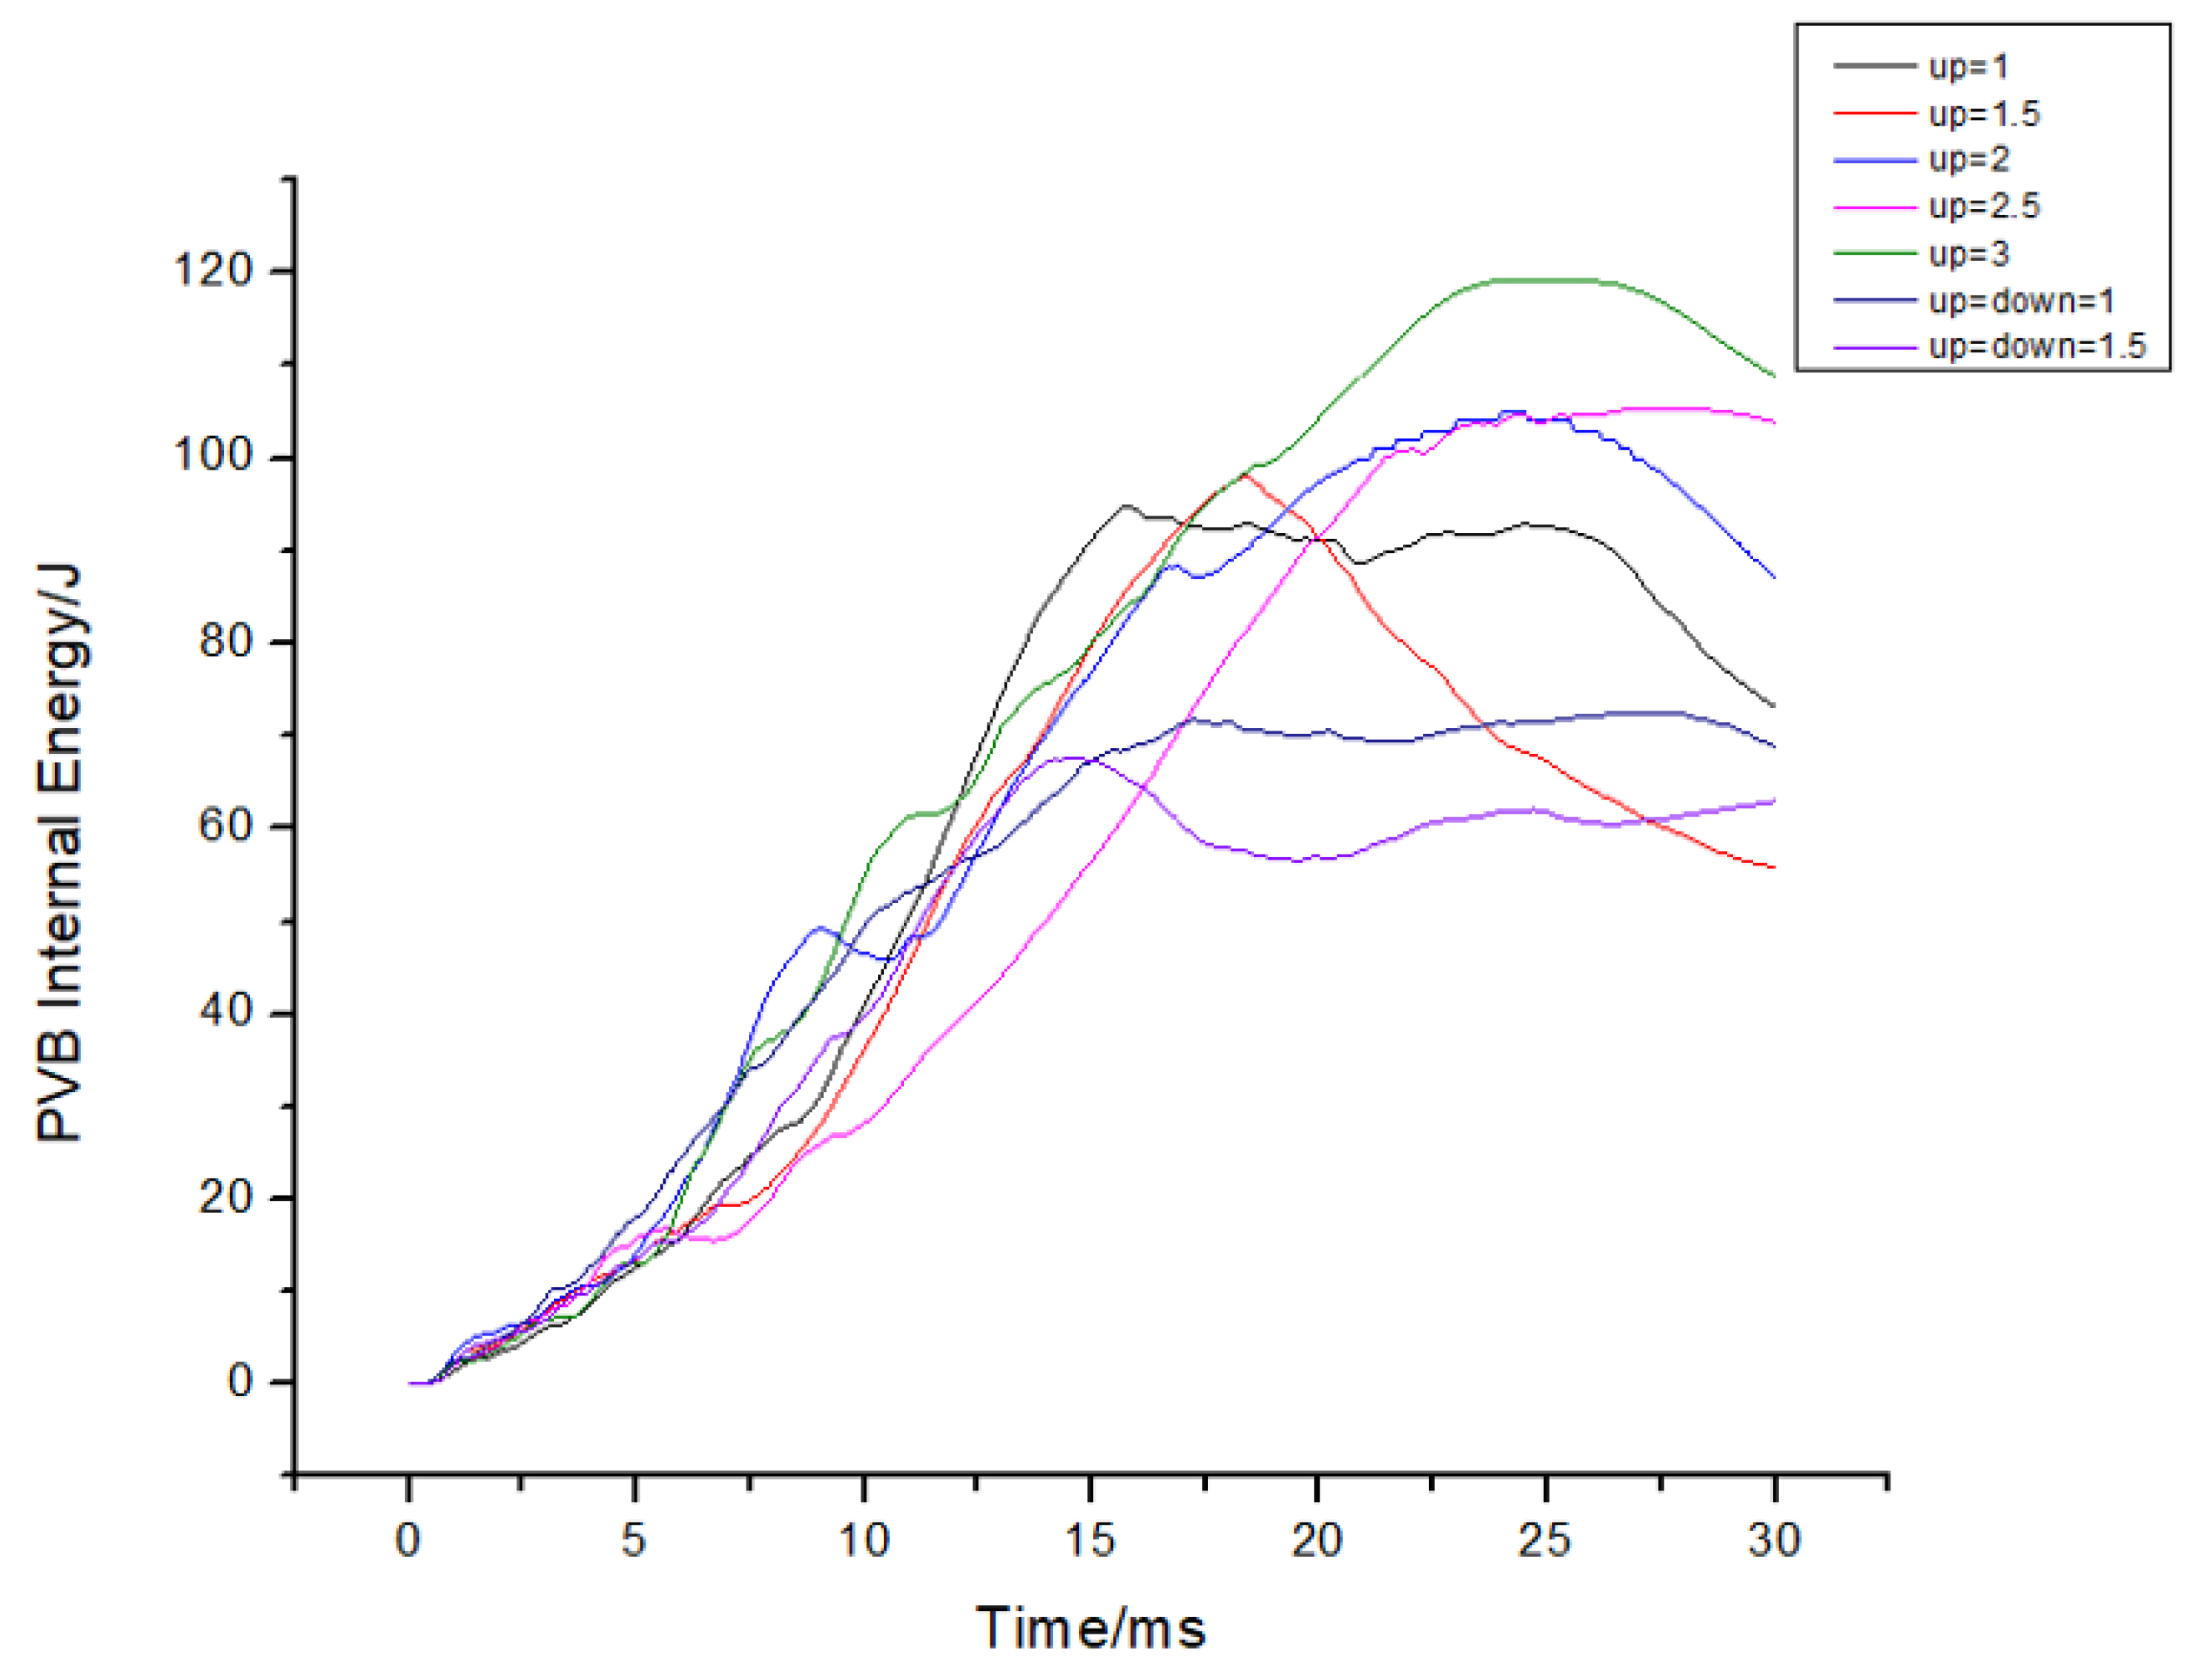
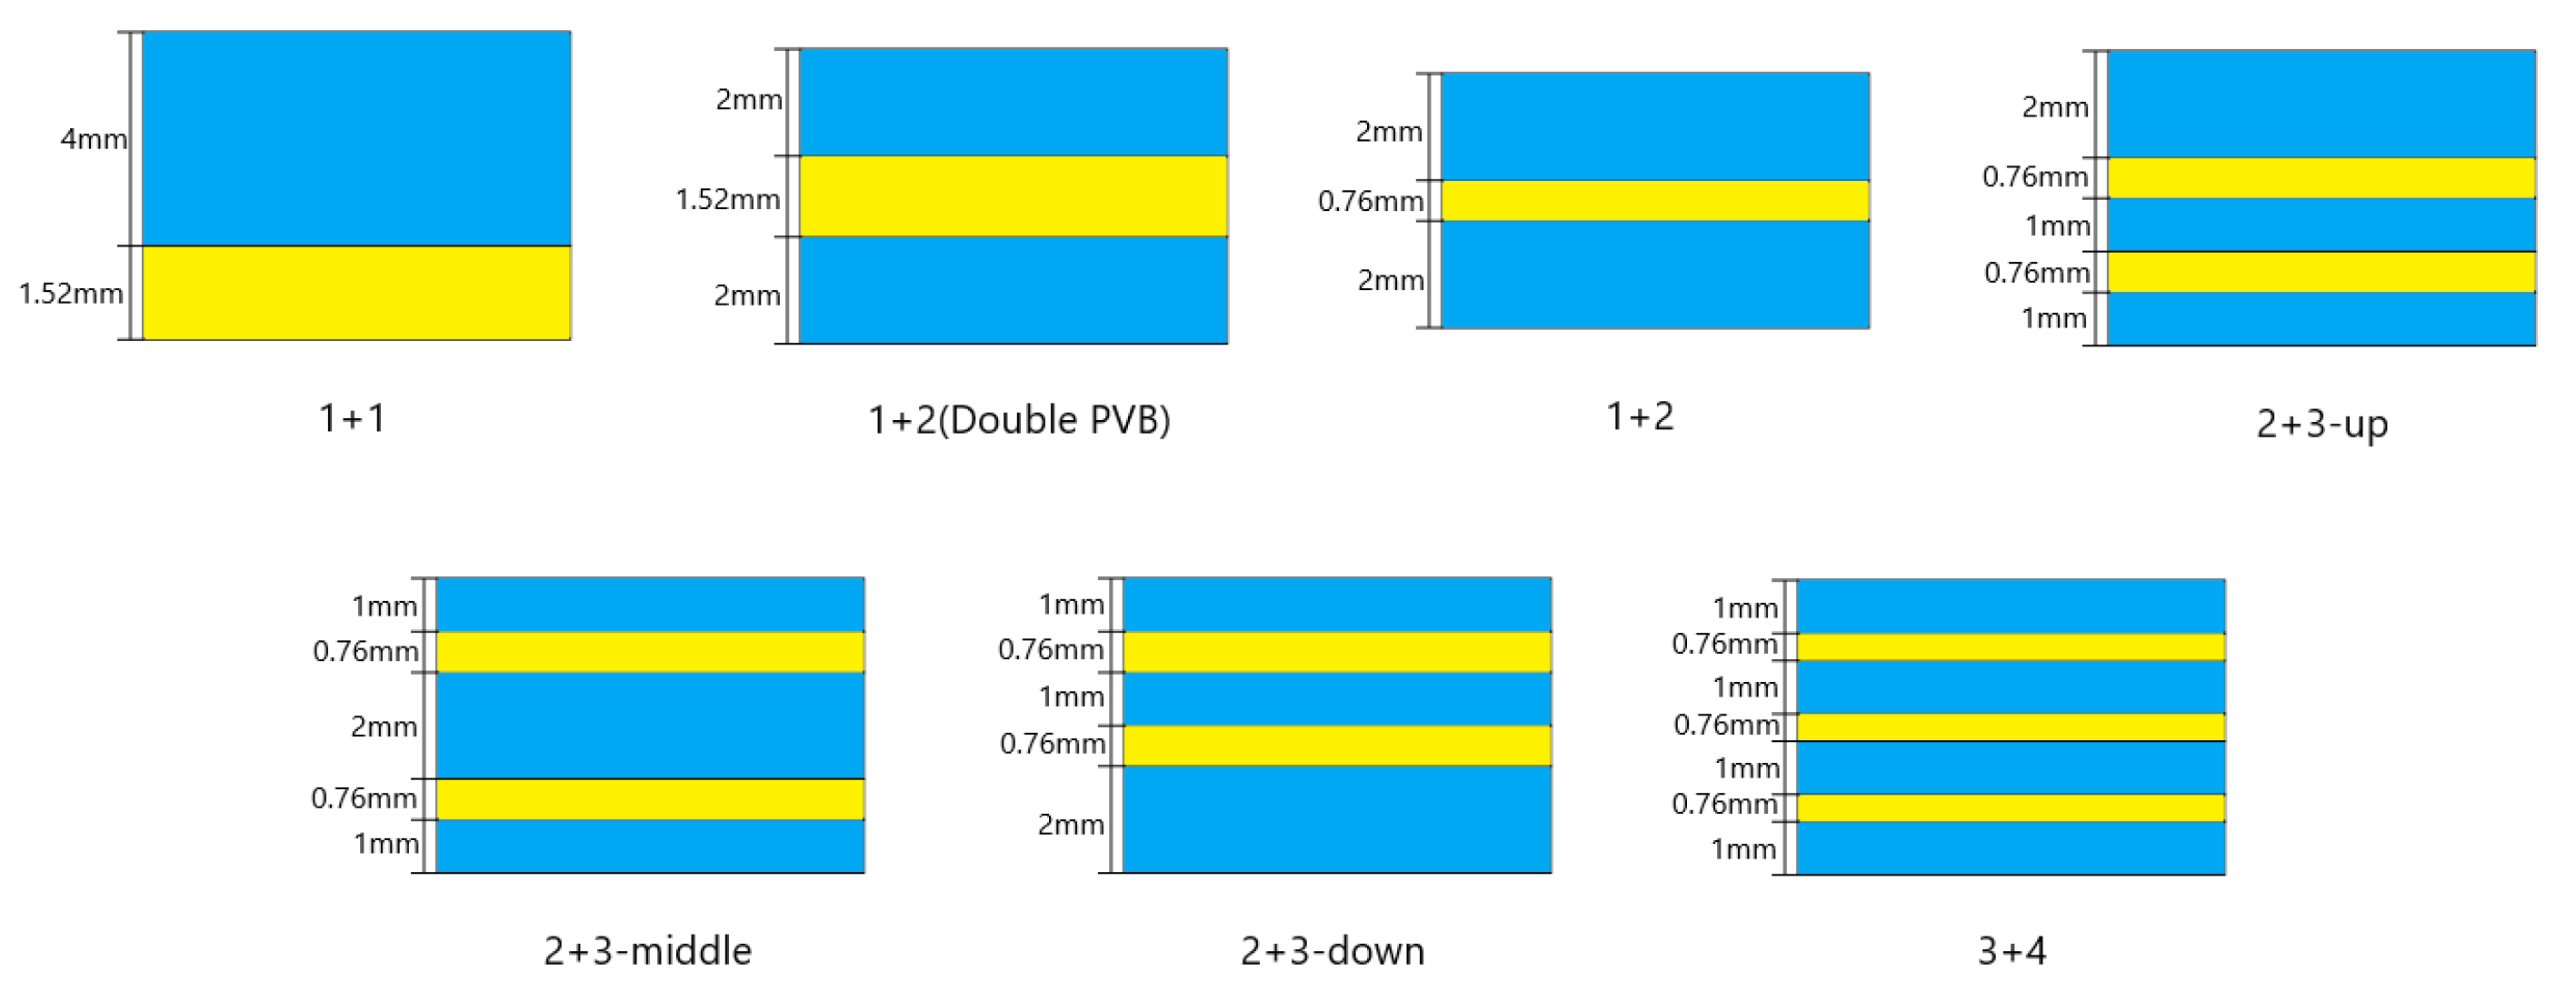
6.1. The Effect of the Thickness Ratio of Each Layer
6.2. The Effect of the Number of Layers
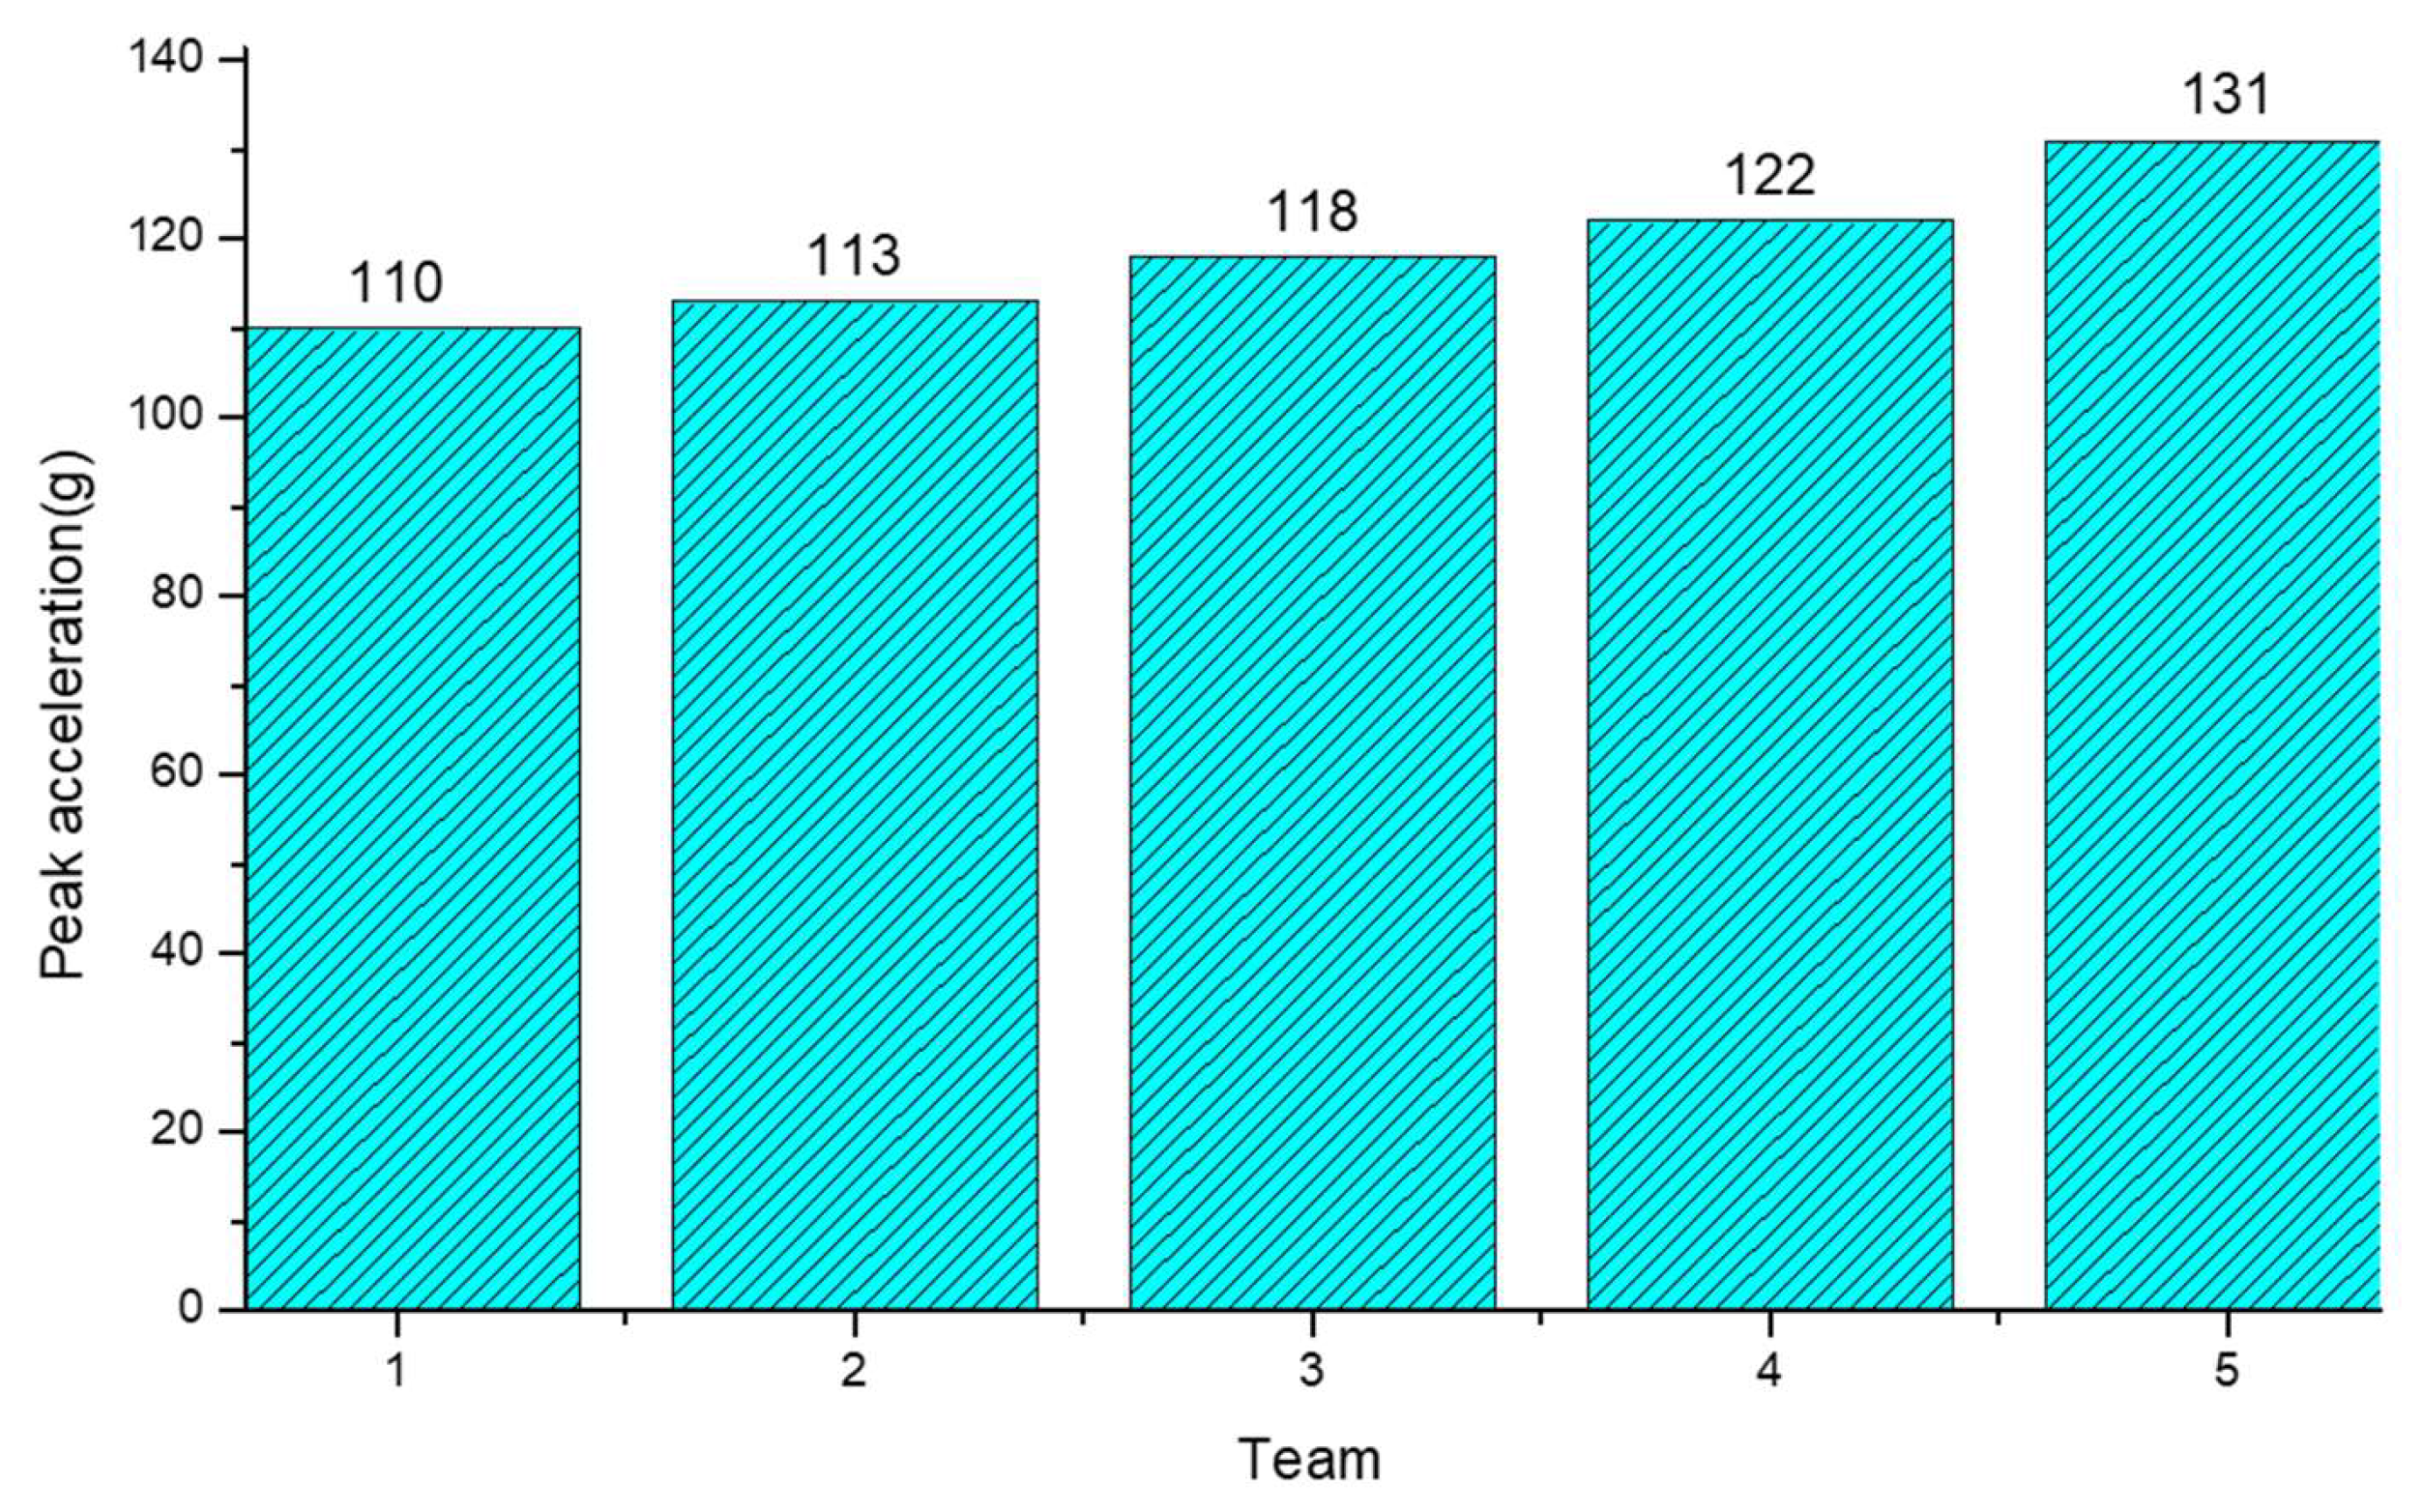
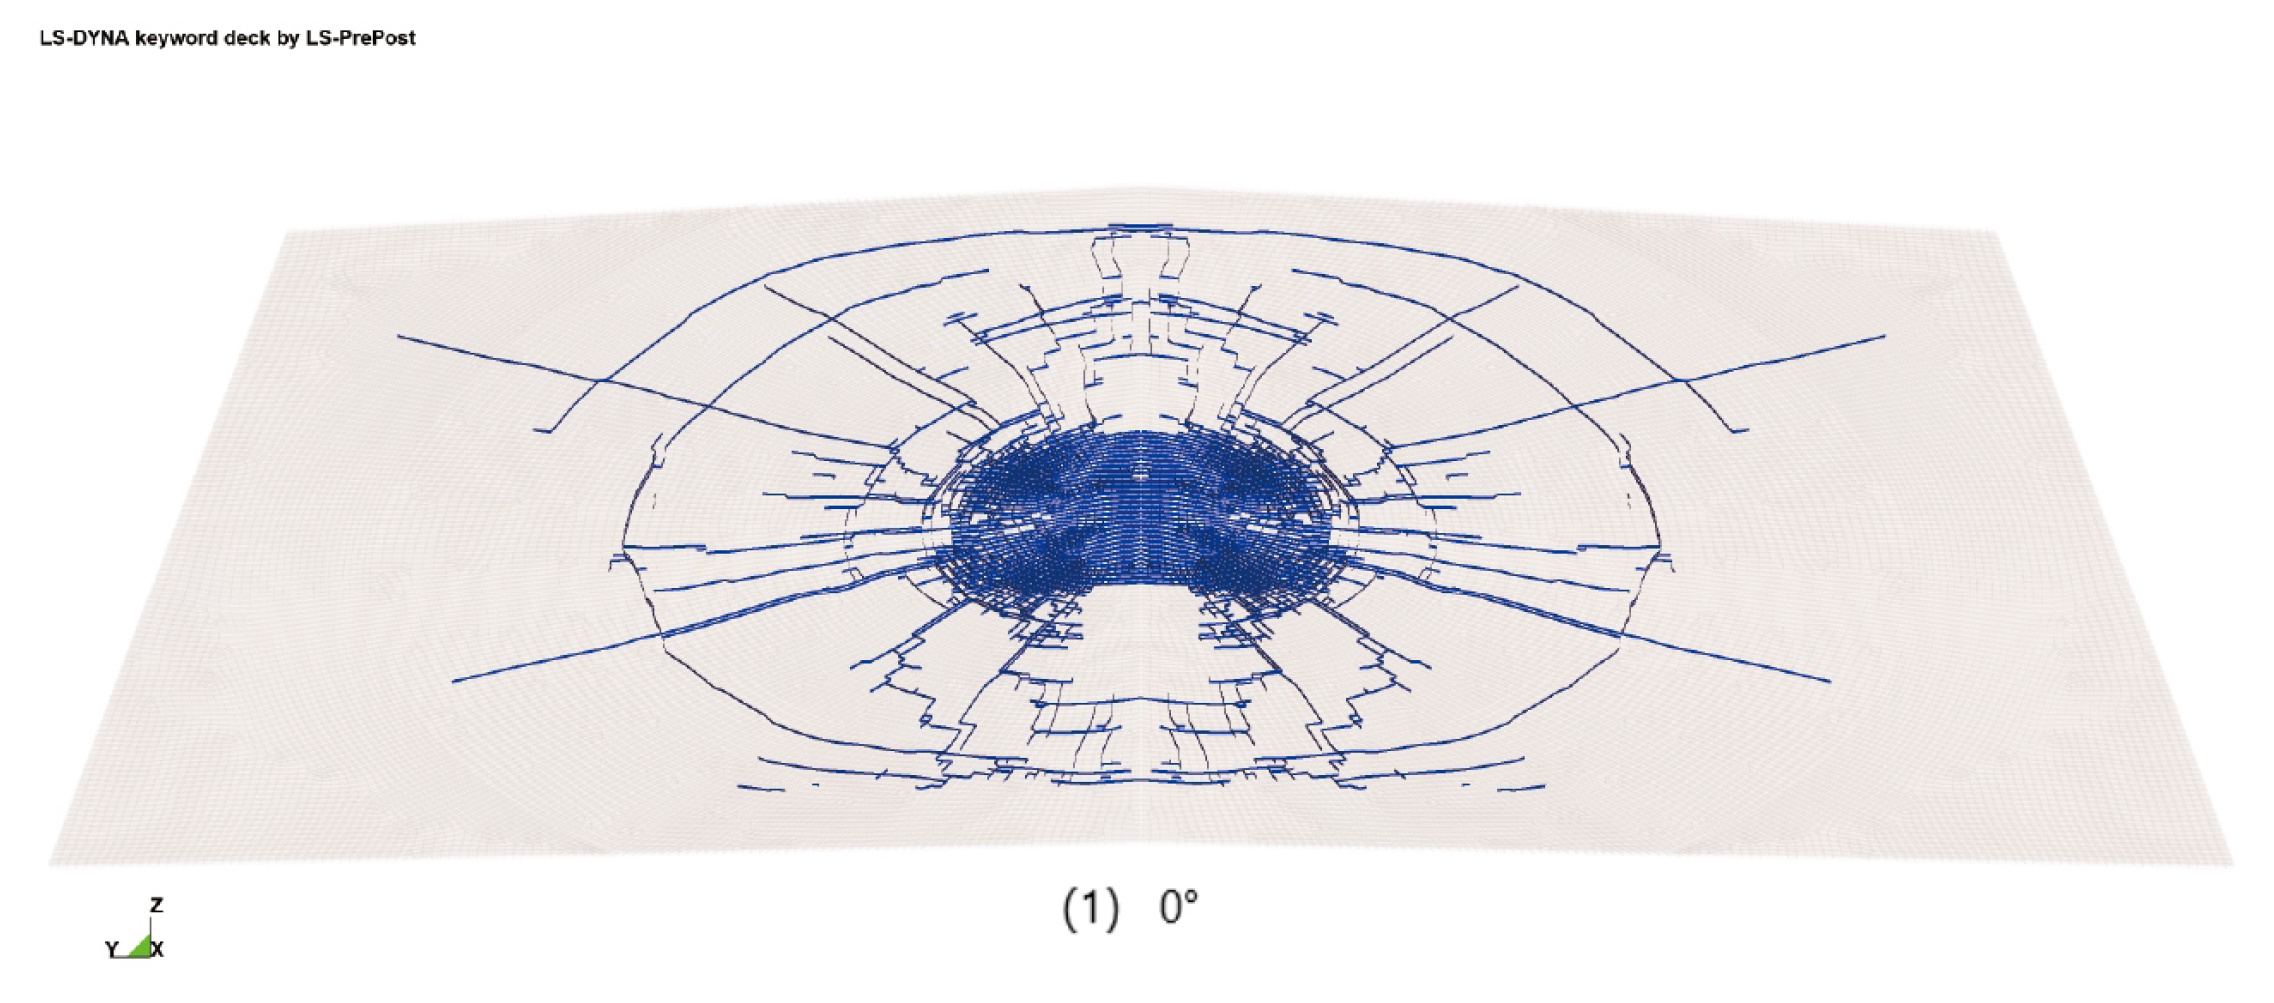
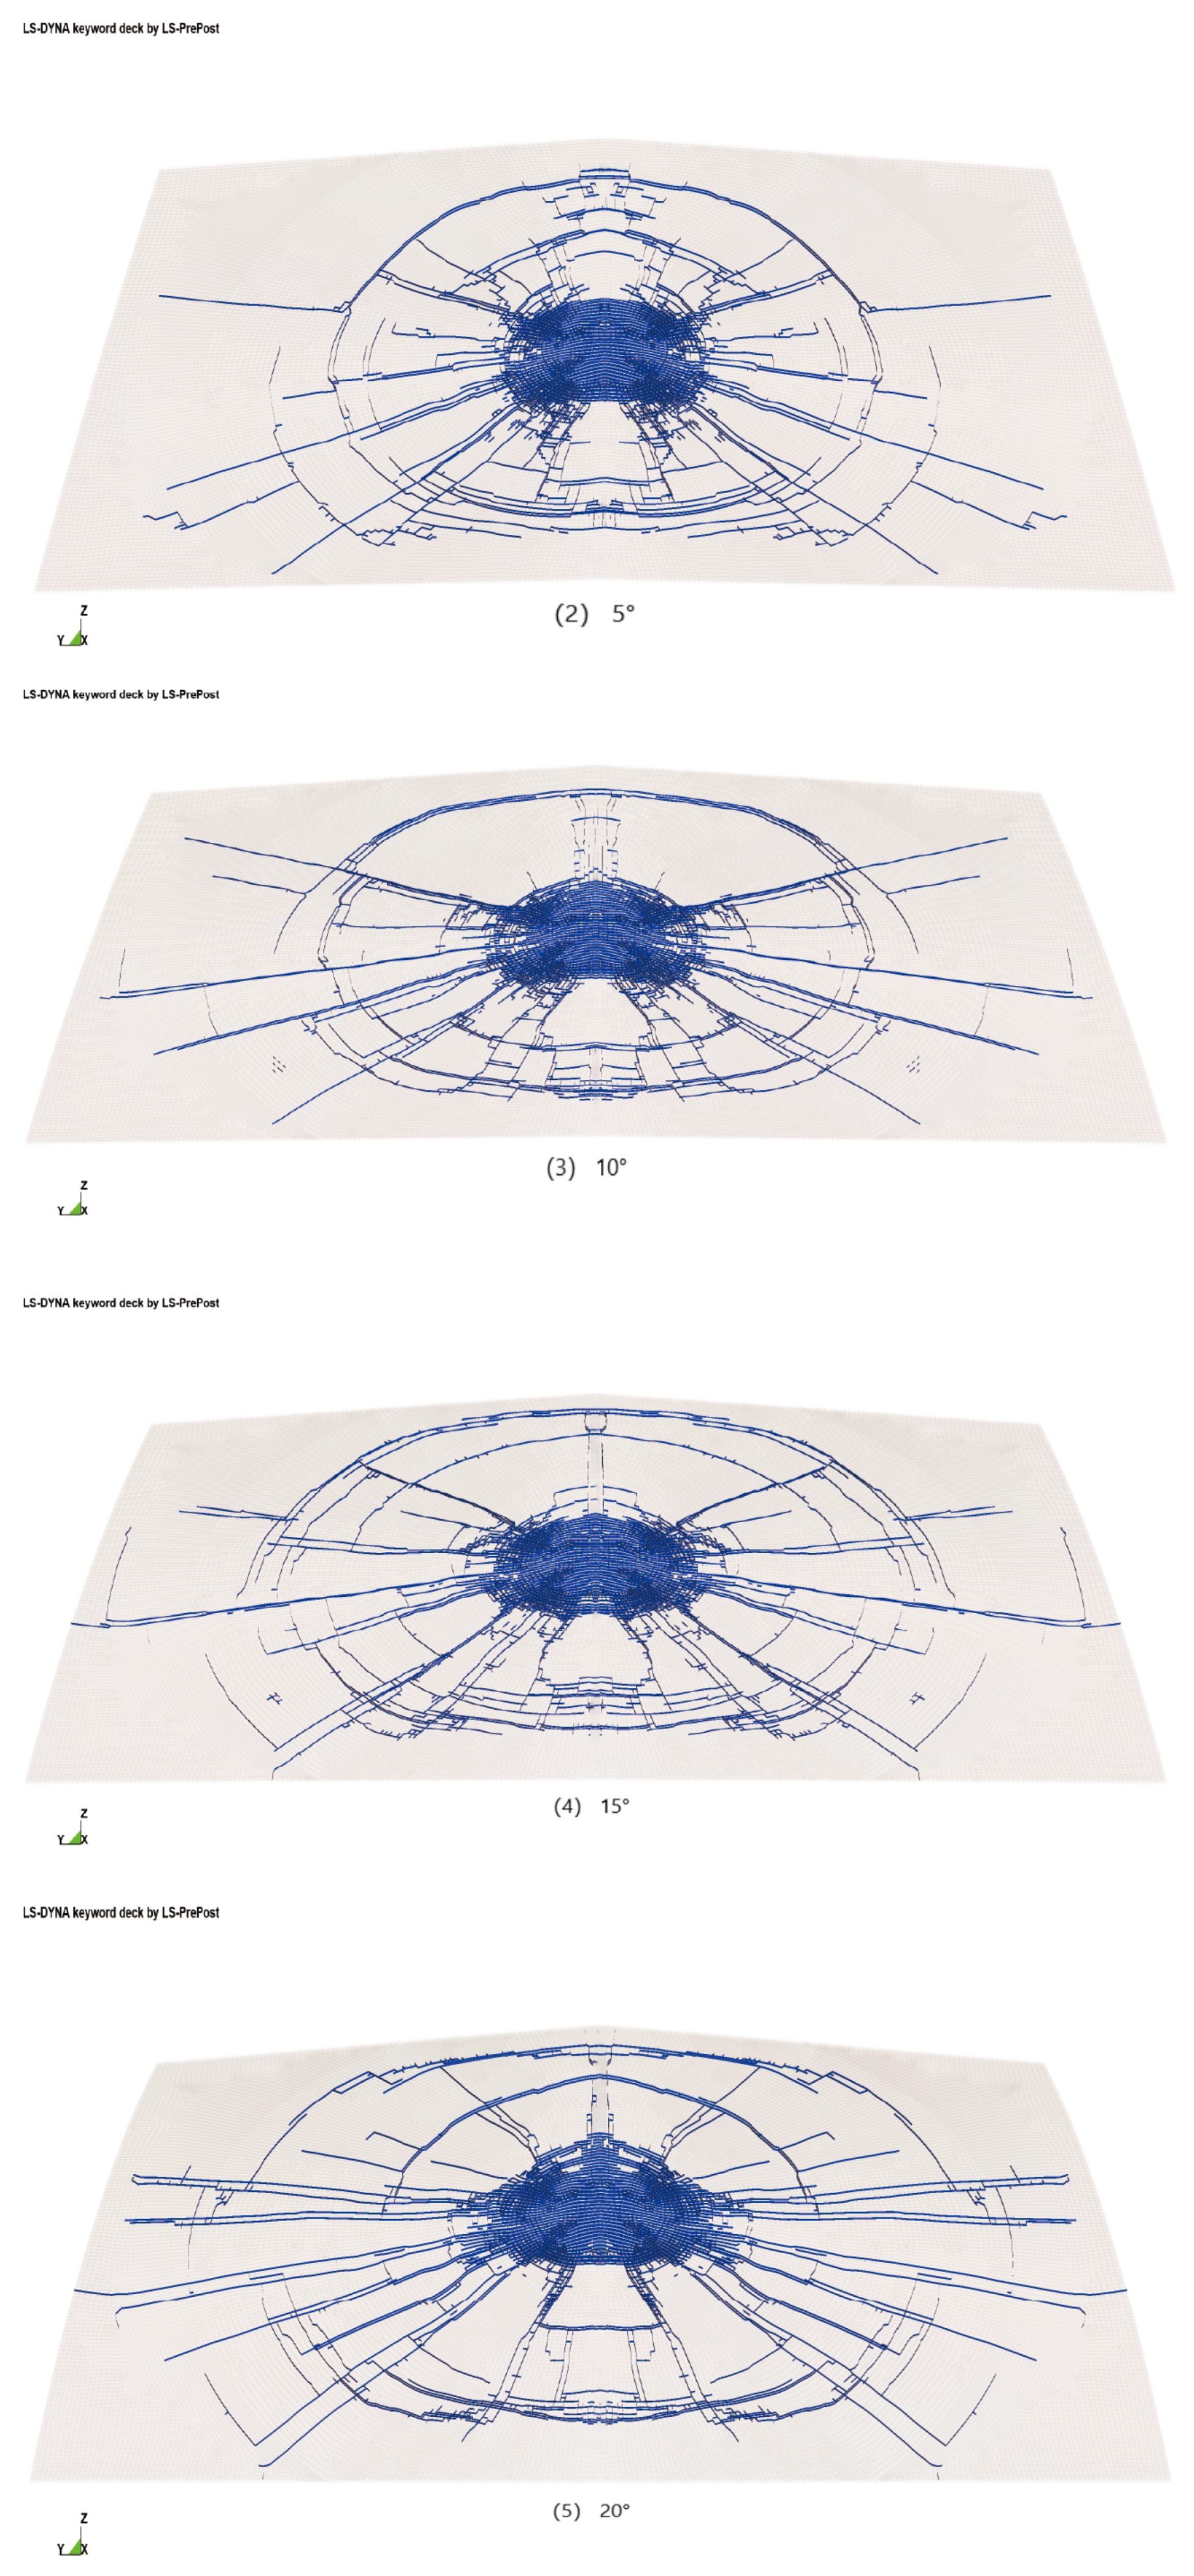
6.3. The Effect of Curvature
7. Conclusions
- (1)
- The effectiveness of combining Tshell and cohesive elements is validated using a DCB example. It is found that this combination yields good calculation results, particularly in the field of glass impact damage. These findings lay a theoretical foundation for future simulation examples and similar studies.
- (2)
- Concerning the issue of different thickness ratios of glass layers, an interesting observation emerges: an increase in the thickness of the upper glass layer correlates with a decrease in the peak acceleration of the dummy-head model. This phenomenon can be attributed to the positioning of the PVB layer in the lower part, which allows it to withstand a greater tensile stress wave. Consequently, the ductility of the PVB material is fully utilized, resulting in a reduction in the peak acceleration of the dummy-head model.
- (3)
- The Tshell and cohesive elements utilized in this study effectively address the issue of shear locking, thereby bolstering the dependability of our findings. When a curvature exists, the arched configuration of the windshield promotes higher resistance against impact, consequently leading to an increased peak acceleration. On the whole, the curvature insignificantly influences the peak acceleration.
Author Contributions
Funding
Institutional Review Board Statement
Informed Consent Statement
Data Availability Statement
Conflicts of Interest
Nomenclature
| the mixed factor of the crack form | |
| the displacement increment in the period of | |
| pure deformation in the global coordinate system | |
| pure rotation in the global coordinate system | |
| the relative displacement of points at the crack interface in this region | |
| the ultimate displacement | |
| virtual configuration at time x | |
| configuration at time x | |
| stress at time x | |
| strain at time x | |
| A and B | material parameters of PVB |
| B | strain matrix |
| the maximum cohesive strength for mode I and mode II | |
| E | Young’s modulus |
| normal or inplane stiffness | |
| Internal force of element | |
| the energy release rate of type I or type II cracks | |
| the critical energy release rate for mode I | |
| , , and | invariants related to R |
| J | Jacobian matrix |
| k | stiffness |
| the tensile strength T of type I crack or shear strength S of type II crack | |
| transformational matrix | |
| the orthogonal transformation matrix | |
| T | cohesive force |
| u | the ultimate displacement in the normal or tangential direction |
| V | element field |
| v | Poisson’s ratio |
| the mixed-mode failure criterion index, where XMU is less than zero | |
| and | the spatial coordinates of the two configurations in global Cartesian coordinates, |
| which are represented using local coordinates | |
| R | the right Cauchy–Green strain tensor |
References
- Toroyan, T. Global status report on road safety. Inj. Prevent. 2009, 15, 286. [Google Scholar] [CrossRef]
- Wang, J.; Xu, Y.; Zhang, W. Finite element simulation of PMMA aircraft windshield against bird strike by using a rate and temperature dependent nonlinear viscoelastic constitutive model. Compos. Struct. 2014, 108, 21–30. [Google Scholar] [CrossRef]
- Yu, G.; Zheng, Y.; Feng, B.; Liu, B.; Meng, K.; Yang, X.; Chen, H.; Xu, J. Computation modeling of laminated crack glass windshields subjected to headform impact. Compos. Struct. 2017, 193, 139–154. [Google Scholar] [CrossRef]
- Pyttel, T.; Liebertz, H.; Cai, J. Failure criterion for laminated glass under impact loading and its application in finite element simulation. Int. J. Impact Eng. 2011, 38, 252–263. [Google Scholar] [CrossRef]
- Munjiza, A.; Owen, D.R.J.; Bicanic, N. A combined finite-discrete element method in transient dynamics of fracturing solids. Eng. Comput. 1995, 12, 145–174. [Google Scholar] [CrossRef]
- Chen, S.; Zang, M.; Xu, W. A three-dimensional computational framework for impact fracture analysis of automotive laminated glass. Comput. Methods Appl. Mech. Eng. 2015, 294, 72–99. [Google Scholar] [CrossRef]
- Areias, P.M.A.; Belytschko, T. Non-linear analysis of shells with arbitrary evolving cracks using XFEM. Int. J. Numer. Methods Eng. 2005, 62, 384–415. [Google Scholar] [CrossRef]
- Liu, B.; Yan, W.; Xu, X. Experimental research on energy absorption characteristic of PVB laminated windshield subjected to headform low-speed impact. J. Mech. Eng. 2013, 49, 128–136. [Google Scholar] [CrossRef]
- Peng, Y.; Yang, J.; Deck, C.; Willinger, R. Finite element modeling of crash test behavior for windshield laminated glass. Int. J. Impact Eng. 2013, 57, 27–35. [Google Scholar] [CrossRef]
- Song, J.; Wang, H.; Belytschko, T. A comparative study on finite element methods for dynamic fracture. Comput. Mech. 2008, 42, 239–250. [Google Scholar] [CrossRef]
- Zang, M.; Lei, Z.; Wang, S. Investigation of impact fracture behavior of automobile laminated glass by 3D discrete element method. Comput. Mech. 2007, 41, 73–83. [Google Scholar] [CrossRef]
- Le, B.; Dau, F.; Charles, J.; Iordanoff, I. Modeling damages and cracks growth in composite with a 3D discrete element method. Compos. Part B Eng. 2016, 91, 615–630. [Google Scholar] [CrossRef]
- André, D.; Jebahi, M.; Iordanoff, I.; Charles, J.-l.; Néauport, J. Using the discrete element method to simulate brittle fracture in the indentation of a silica glass with a blunt indenter. Comput. Methods Appl. Mech. Eng. 2013, 265, 136–147. [Google Scholar] [CrossRef]
- Lei, Z.; Zang, M. An approach to combining 3D discrete and finite element methods based on penalty function method. Comput. Mech. 2010, 46, 609–619. [Google Scholar] [CrossRef]
- Xu, W.; Zang, M.; Gao, W. Adaptive combined DE/FE algorithm for brittle fracture of plane stress problems. Comput. Mech. 2014, 54, 535–546. [Google Scholar] [CrossRef]
- Xu, J.; Li, Y.; Chen, X.; Yan, Y.; Ge, D.; Zhu, M.; Liu, B. Characteristics of windshield cracking upon low-speed impact: Numerical simulation based on the extended finite element method. Comput. Mater. Sci. 2010, 48, 582–588. [Google Scholar] [CrossRef]
- Barenblatt, G.I. The formation of equilibrium cracks during brittle fracture: General ideas and hypotheses, axially-symmetric cracks. J. Appl. Math. Mech. 1959, 23, 622–636. [Google Scholar] [CrossRef]
- Dugdale, D. Yielding of steel sheets containing slits. J. Mech. Phys. Solids 1960, 8, 100–104. [Google Scholar] [CrossRef]
- Geubelle, P.H.; Baylor, J.S. Impact-induced delamination of composites: A 2D simulation. Compos. Part B Eng. 1998, 29, 589–602. [Google Scholar] [CrossRef]
- Turon, A.; Dávila, C.G.; Camanho, P.P.; Costa, J. An engineering solution for mesh size effects in the simulation of delamination using cohesive zone models. Eng. Fract. Mech. 2007, 74, 1665–1682. [Google Scholar] [CrossRef]
- Nguyen, V.P.; Nguyen-Xuan, H. High-order B-splines based finite elements for delamination analysis of laminated composites. Compos. Struct. 2013, 102, 261–275. [Google Scholar] [CrossRef]
- Woo, K.; Cairns, D.S. Selective activation of intrinsic cohesive elements for fracture analysis of laminated composites. Compos. Struct. 2019, 210, 310–320. [Google Scholar] [CrossRef]
- Naumenko, K. Damage patterns in float glass plates: Experiments and peridynamics analysis. Theor. Appl. Fract. Mech. 2022, 118, 103264. [Google Scholar] [CrossRef]
- Giannakeas, I.N. Coupling XFEM and peridynamics for brittle fracture simulation—Part I: Feasibility and effectiveness. Comput. Mech. 2020, 66, 103–122. [Google Scholar] [CrossRef]
- Schmidt, J. Phase-Field Fracture Modelling of Thin Monolithic and Laminated Glass Plates under Quasi-Static Bending. Comput. Mech. 2020, 66, 103–122. [Google Scholar] [CrossRef]
- Wang, D.; Xu, W.; Chen, S.; Zang, M. An extrinsic cohesive shell model for dynamic fracture analyses. Theor. Appl. Fract. Mech. 2018, 97, 165–176. [Google Scholar] [CrossRef]
- Xu, X.; Zou, C.; Zang, M.; Chen, S. Development of a GPU parallel computational framework for impact debonding of coating–substrate interfaces. Thin-Walled Struct. 2022, 175, 109270. [Google Scholar] [CrossRef]
- Hallquist, J.O. LS-DYNA: Theory Manual; Livermore Software Technology Corp.: Livermore, CA, USA, 2006. [Google Scholar]
- Xu, X.; Chen, S.; Wang, D.; Zang, M. An efficient solid-shell cohesive zone model for impact fracture analysis of laminated glass. Theor. Appl. Fract. Mech. 2020, 108, 102660. [Google Scholar] [CrossRef]
- Lin, D. Numerical simulations of impact fracture behavior of an automotive windshield glazing: An intrinsic cohesive approach. Compos. Struct. 2018, 186, 79–93. [Google Scholar] [CrossRef]


| Name | Impactor | Glass | PVB and Rubber |
|---|---|---|---|
| Material model | Rigid | Elastic | Mooney–Rivlin Rubber |
| Density/(kg/m) | —— | 2500 | 1100 |
| Elastic/GPa | 207 | 74 | —— |
| Poisson’s ratio | 0.27 | 0.2 | 0.49 |
| 1 | 2 | 3 | 4 | 5 | 6 | 7 | |
|---|---|---|---|---|---|---|---|
| upper | 1 | 1.5 | 2 | 2.5 | 3 | 1 | 1.5 |
| PVB | 0.76 | 0.76 | 0.76 | 0.76 | 0.76 | 2.76 | 1.76 |
| lower | 3 | 2.5 | 2 | 1.5 | 1 | 1 | 1.5 |
| 1 | 2 | 3 | 4 | 5 | |
|---|---|---|---|---|---|
| curvature | 0° | 5° | 10° | 15° | 20° |
Disclaimer/Publisher’s Note: The statements, opinions and data contained in all publications are solely those of the individual author(s) and contributor(s) and not of MDPI and/or the editor(s). MDPI and/or the editor(s) disclaim responsibility for any injury to people or property resulting from any ideas, methods, instructions or products referred to in the content. |
© 2023 by the authors. Licensee MDPI, Basel, Switzerland. This article is an open access article distributed under the terms and conditions of the Creative Commons Attribution (CC BY) license (https://creativecommons.org/licenses/by/4.0/).
Share and Cite
Xia, W.; Yue, Z.; Zang, M. Impact Fracture Simulation of Laminated Glass Based on Thick Shell Elements and a Cohesive Zone Model. Materials 2023, 16, 6966. https://doi.org/10.3390/ma16216966
Xia W, Yue Z, Zang M. Impact Fracture Simulation of Laminated Glass Based on Thick Shell Elements and a Cohesive Zone Model. Materials. 2023; 16(21):6966. https://doi.org/10.3390/ma16216966
Chicago/Turabian StyleXia, Wei, Zhen Yue, and Mengyan Zang. 2023. "Impact Fracture Simulation of Laminated Glass Based on Thick Shell Elements and a Cohesive Zone Model" Materials 16, no. 21: 6966. https://doi.org/10.3390/ma16216966
APA StyleXia, W., Yue, Z., & Zang, M. (2023). Impact Fracture Simulation of Laminated Glass Based on Thick Shell Elements and a Cohesive Zone Model. Materials, 16(21), 6966. https://doi.org/10.3390/ma16216966