Article

Flat-Band Potential Determination and Catalytical Properties of Sn3O4/SnO2 Heterostructures in the Photo-Electrooxidation of Small Organic Molecules under Ultraviolet (370 nm) and Blue (450 nm) Light

1
Boreskov Institute of Catalysis SB RAS, Pr. Lavrentieva 5, 630090 Novosibirsk, Russia
2
Faculty of Natural Sciences, Chair of Solid-State Chemistry, Novosibirsk State University, Pirogova Str. 1, 630090 Novosibirsk, Russia
3
Voevodsky Institute of Chemical Kinetics and Combustion SB RAS, Laboratory of Nanoparticles, Institutskaya Str. 3, 630090 Novosibirsk, Russia
*
Author to whom correspondence should be addressed.
Materials 2023, 16(23), 7300; https://doi.org/10.3390/ma16237300
Submission received: 20 October 2023 / Revised: 16 November 2023 / Accepted: 18 November 2023 / Published: 23 November 2023
(This article belongs to the Special Issue Advanced Materials for Solar Energy Utilization)

Abstract

:
Sn3O4 are promising semiconductor materials due to their visible light absorption ability. In this work, a series of materials, such as SnO2, Sn3O4 and Sn3O4/SnO2 heterostructures, with different phase ratios were prepared using hydrothermal synthesis. The materials were characterized using X-ray diffraction (XRD), Raman and diffuse reflectance spectroscopy (DRS), high resolution transmission electron microscopy (HRTEM), nitrogen adsorption (BET). Flat-band potentials (EFB) of the samples were determined using the photocurrent onset potential (POP) method. It was shown that the potentials obtained with open circuit potential measurements versus illumination intensity (OCP) likely corresponded to the EFB of SnO2 nanoparticles in heterostructures due to interfacial electron transfer from the conducting band of Sn3O4 to that of SnO2. The photo-electrooxidation processes of a series of organic substrates were studied in the potential range of 0.6–1.4 V vs. RHE under irradiation with ultraviolet (λ = 370 nm) and visible (λ = 450 nm) light. The Sn3O4 sample showed high activity in the photo-electrooxidation of acetone and formic acid in visible light. The Sn3O4/SnO2 samples exhibited noticeable activity only in the oxidation of formic acid. The presence of the SnO2 phase in the Sn3O4/SnO2 samples increased the photocurrent values under ultraviolet illumination, but significantly reduced the oxidation efficiency in visible light.

1. Introduction

Tin dioxide is a promising material with high corrosion stability, high oxidation potential, low toxicity and high economic efficiency [1,2]. SnO2 is widely used as supports for fuel cell catalysts [3], sensors [4], electrodes for supercapacitors [5], conductive transparent material [6], photocatalysts and electrocatalysts for the oxidation of organic substances [1,2,7]. However, the large band-gap energy, about 3.6 ÷ 4 eV, and the recombination of photogenerated electrons and holes [8] do not allow the material to be widely used for working in either visible or solar light and lead to low values of quantum efficiency. Approaches to broadening the wavelength range of light absorption and reducing recombination process comprise doping with various metals and nonmetals, including tin itself, mixed valency tin oxide (e.g., Sn3O4), heterojunction engineering, solid solution with another oxide materials and morphology control [2,9]. With these approaches, an increase in efficiency is achieved either by introducing new energy levels into the band gap or by reducing the band-gap width, which leads to a shift in the absorption edge to the visible region [2].
Sn3O4 and composites based on it are promising materials that arouse increased interest in various photo-stimulated and electrochemical processes, including hydrogen production [10,11,12,13,14], water decomposition [15], oxidation of dyes and organic compounds [16,17,18,19,20,21], sensors [22,23,24], lithium and sodium ion batteries [25,26,27,28], supercapacitors [29], solar cells [30], CO2 reduction [31,32], visible light photodetectors [33], etc. The morphology of Sn3O4 represents a layered structure in which two layers of SnO alternate with a layer of SnO2 [34]. The presence of Sn2+ ions leads to the appearance of absorption in the visible-light region [34] and also forms a morphology as nanosheets [12] or nanowires [13], which significantly increase the specific surface area and its availability for the reaction. The ability to vary the band gap and the position of the conduction band and, hence, the oxidation potential associated with the position of the valence band by adding hydrogen peroxide during synthesis has been shown theoretically and confirmed experimentally [12]. Despite this, the main disadvantage for the use of Sn3O4 is that the potential of the valence band is not high enough for photo-oxidation reactions. To increase the efficiency of charge separation, composites of Sn3O4 with electrically conductive materials based on graphene [10,35], graphene oxide [14,32], Ni foam [19], Sn [20] and heterostructures based on C3N4 [17], SnO [36,37], SnO2 [22,24,38,39,40] and Si nanowires [41] are being studied intensively. Heterostructures based on high valence band oxidation potential of SnO2 with an absorbance in the visible region of Sn3O4 can increase the efficiency of photocatalytic reactions. SnO2-Sn3O4 heterostructures were used as sensors and showed high sensitivity to NO2 due to a large number of oxygen vacancies and improved electron transfer [22]. The structures of Sn3O4/SnO2 were studied in the reaction of CO2 electroreduction to formic acid. The increased efficiency is attributed to the increased adsorption energy of intermediates at the SnO2 and Sn3O4 interface [39]. SnO2–Sn3O4 heterostructures were used as sensors for formaldehyde. The improved performance was attributed to the high concentration of adsorbed oxygen involved in oxidation and the characteristics of the heterophase Schottky junction [24]. SnO/Sn3O4 and SnO2/Sn3O4 heterostructures were studied in the photooxidation of rhodamine B. The authors concluded that such heterostructures are promising in photocatalysis due to the presence of heterojunctions [36].
Despite the many works on Sn3O4, the processes of photo-electrooxidation of organic substances on such materials have been practically not considered. Photoelectrochemical studies are mainly devoted to the characterization of materials with photocurrent values [14,42] and the determination of the position of the flat-band potential with the Mott–Schottky method [13,14,16,32,33,41]. The photo-electrooxidation of rhodamine B on vertically aligned Sn3O4 nanoflakes grown on carbon paper was studied under visible light irradiation. The authors associated the increase in photocurrent with the presence of channels for electron transport and the accessibility of the surface [33]. Sn3O4 was studied in the hydrogen evolution reaction. It was discovered that polarization of the electrode and treatment of the material with phosphoric acid leads to an increase in the efficiency of charge separation and a decrease in photo-corrosion of the material due to a difficulty in capturing holes from Sn (II) ions [43].
In this work, a series of Sn3O4/SnO2 samples with varying phase contents was synthesized. The conduction band potentials were measured using a set of photoelectrochemical methods, and the obtained data were compared. The photo-electrocatalytic properties of materials were studied in the oxidation of a number of simple organic substances (methanol, acetone, formic acid, glycerol) at different potentials under ultraviolet and visible light.

2. Materials and Methods

2.1. Materials

The following materials were used in the work: Sodium citrate pentahydrate (99.99%, special purity, LLC “Khimkraft”), SnCl2*2H2O (analytical grade, JSC “Vekton”), NaOH (special purity, LLC “Component-Reaktiv”), ethanol (J. T. Baker, >99.9% reagent grade), HCl (special purity 35–38 wt.%, Sigma-Tek LLC), acetone (EKOS-1, special purity grade), formic acid (Sigma-Aldridge, reagent grade >95%), glycerol (analytical grade, JSC Vekton), methanol (J. T. Baker, (Ultra) Gradient HPLC grade), Nafion (5 wt.% solution in ethanol, Sigma-Aldrigh).

2.2. Synthesis

Samples TO1 and TO2 were synthesized in accordance with ref. [20]. An amount of 25 mmol of sodium citrate and 10 mmol of tin (II) chloride were dissolved in 50 mL of water with stirring, and 25 mL of 0.2 M sodium hydroxide solution was slowly added. Stirring of the solution continued for 20 min (sample TO1). For sample TO2, the same procedure was followed without the addition of sodium citrate. For sample TO3, the synthesis procedure was slightly modified in accordance with ref. [10]. An amount of 0.01 mol of tin (II) chloride were dissolved in 75 mL of water with stirring, and 25 mL of 4 M sodium hydroxide solution was slowly added. The solution was stirred continuously for 20 min. Then, 6.5 mL of concentrated hydrochloric acid was slowly added to the resulting clear solution. The resulting solutions were transferred to a Teflon autoclave liner (150 mL) and placed in an oven. Hydrothermal synthesis was carried out at 180 °C for 12 h.
For comparison, SnO2 was synthesized (sample TO4). An amount of 3.960 mL of 50 wt.% NaOH solution was diluted to 71.040 mL with water, followed by adding 1.7028 g of tin (II) chloride under vigorous stirring. The resulting clear solution was transferred to a Teflon autoclave liner (150 mL) and placed in an oven. Hydrothermal synthesis was carried out at 150 °C for 24 h.
The resulting yellow-brown (TO1 and TO3), dirty yellow (TO2) and white (TO4) precipitates were separated from the solution and washed 2 times with 0.2 M sodium hydroxide solution and 2 times with ethanol using a centrifuge. The powders were dried in an oven at 60 °C for 12 h.

2.3. Physico-Chemical Characterization

The porous structure was analyzed with low-temperature nitrogen adsorption at 77 K on an ASAP 2400 specific surface area analyzer (Micromeritics, Norcross, GA, USA). X-ray diffraction patterns were obtained using a Thermo ARL X’tra diffractometer (Thermo Fisher Scientific Inc., Ecublens, Switzerland) using a Mythen2R 1D linear detector (Dectris AG, Baden-Daettwil, Switzerland) with CuKα radiation (λ = 1.5418 Å). The value of the average coherent scattering region (CSR) was calculated as the average value over two peaks at 24 and 37° 2θ using the Scherrer formula D = λ/(βcos(θ)), where β is the peak width at half maximum, without taking into account instrumental broadening. The lattice parameters were refined using the POLYCRYSTAL software package [44]. XPS spectra were recorded on a SPECS X-ray photoelectron spectrometer (SPECS Surface Nano Analysis GmbH, Berlin, Germany) using non-monochromatic MgKα radiation (hν = 1253.6 eV). UV–Vis diffuse reflectance spectra (DRS) were recorded using a Cary 300 UV–Vis spectrophotometer (Agilent Technologies Inc., Santa Clara, CA, USA). Raman spectra were recorded using a Horiba Jobin Yvon LabRAM HR spectrometer coupled with an Olympus BX41 optical microscope, an argon laser (wavelength 488 nm) and a CCD Symphony detector (Horiba Ltd., Kyoto, Japan) in backscatter geometry. The HRTEM study was carried out using ThemisZ electron microscope (Thermo Fisher Scientific, Waltham, MA, USA).

2.4. Photoelectrochemical Studies

Catalyst suspension was obtained using ultrasonication of 10 mg of sample and 0.1 mg of Nafion (as ethanol solution) in 0.6 mL of deionized water. Then, suspensions were supported on FTO with drop-casting followed by drying and thermal treatment at 100 °C for 30 min to obtain a uniform layer with mass ratio of ~1.5 mg cm–2 and good stability in Na2SO4 electrolyte. Before the measurements, the sample was mounted to the cell and irradiated in air for 30 min with UV light to completely oxidize the remaining organic impurities. Before each experiment, the potential of mercury sulfate electrode was measured relative to reversible hydrogen electrode (RHE), and the potentials presented in the work were recalculated relative to RHE.
Experiments were performed in homemade three-electrode cell using potentiostat Autolab PG302N with a frequency response analyzer. Mercury sulfate electrode, Pt foil and fluorinated tin oxide (FTO) glass coated with photocatalyst were applied as reference, counter and working electrodes, respectively. An amount of 1 M Na2SO4 and 1 M Na2SO4 + 1 M EtOH were used as electrolytes. Ethanol as hole trap was added in order to reduce recombination effect. High power (100 W) light emitting diodes (LEDs) with a maximum irradiation at 370 nm and 450 nm were used as light sources.
Photo-electrocatalytic oxidation of a series of organic substrates (formic acid, methanol, glycerol and acetone) with concentration of 0.1 M was carried out at constant photon flux of 2 × 1016 cm−2 s−1 in the potential range of 0.6–1.4 V vs. RHE by alternating light phase (30 s)–dark phase (30 s). Impedance measurements were recorded at different potentials using frequency range of 1–50,000 Hz with 10 mV of voltage amplitude. Capacity was calculated according to Equation (1):
C = 1 2 π f Z ,
where C was capacity (F/g), f was frequency (Hz), Z′′ was imaginary part of impedance (Ohm).
Flat-band potential values (EFB) were obtained with three independent Mott–Schottky (MS) plot, open-circuit-potential (OCP) and photocurrent-onset-potential (POP) methods. The values obtained will be referred to as EMS, EOCP and EPOP, respectively. Since these values obtained are quite different, as will be shown later, the correct value of flat-band potential proposed in the work will be denoted as EFB.
EMS was determined using Equation (2):
C s c 2 = 2 N d e 0 ε 0 ε s S 2 ( E E M S k T e 0 ) ,
where Csc (F/g) was the depletion layer capacity, Nd (m−3) was the charge carriers density, e0 was the electron charge (1.6 × 10⁻¹⁹ C), ε0 was the vacuum permittivity (8.85 × 10⁻¹² F m–1), εs was the dielectric constant of material, S (m2) was the electrode surface area, E (V) was the potential of electrode, k (1.381·× 10–23 J K–1) was the Boltzmann constant, T (K) was the temperature.
EPOP was determined from chopped illumination (3 s) of the catalysts at 370 nm when recording cyclic voltammograms with scan rate of 1 mV/s. EPOP was obtained at potential when positive and negative spikes of photocurrents become equal. EOCP was determined from the dependence of OCP of catalyst irradiated by UV light (λ = 370 nm) on light intensity, which ranged from 3 to 190 mW/cm2. EOCP was estimated by extrapolation of measured potentials data to infinite light power density.

3. Results

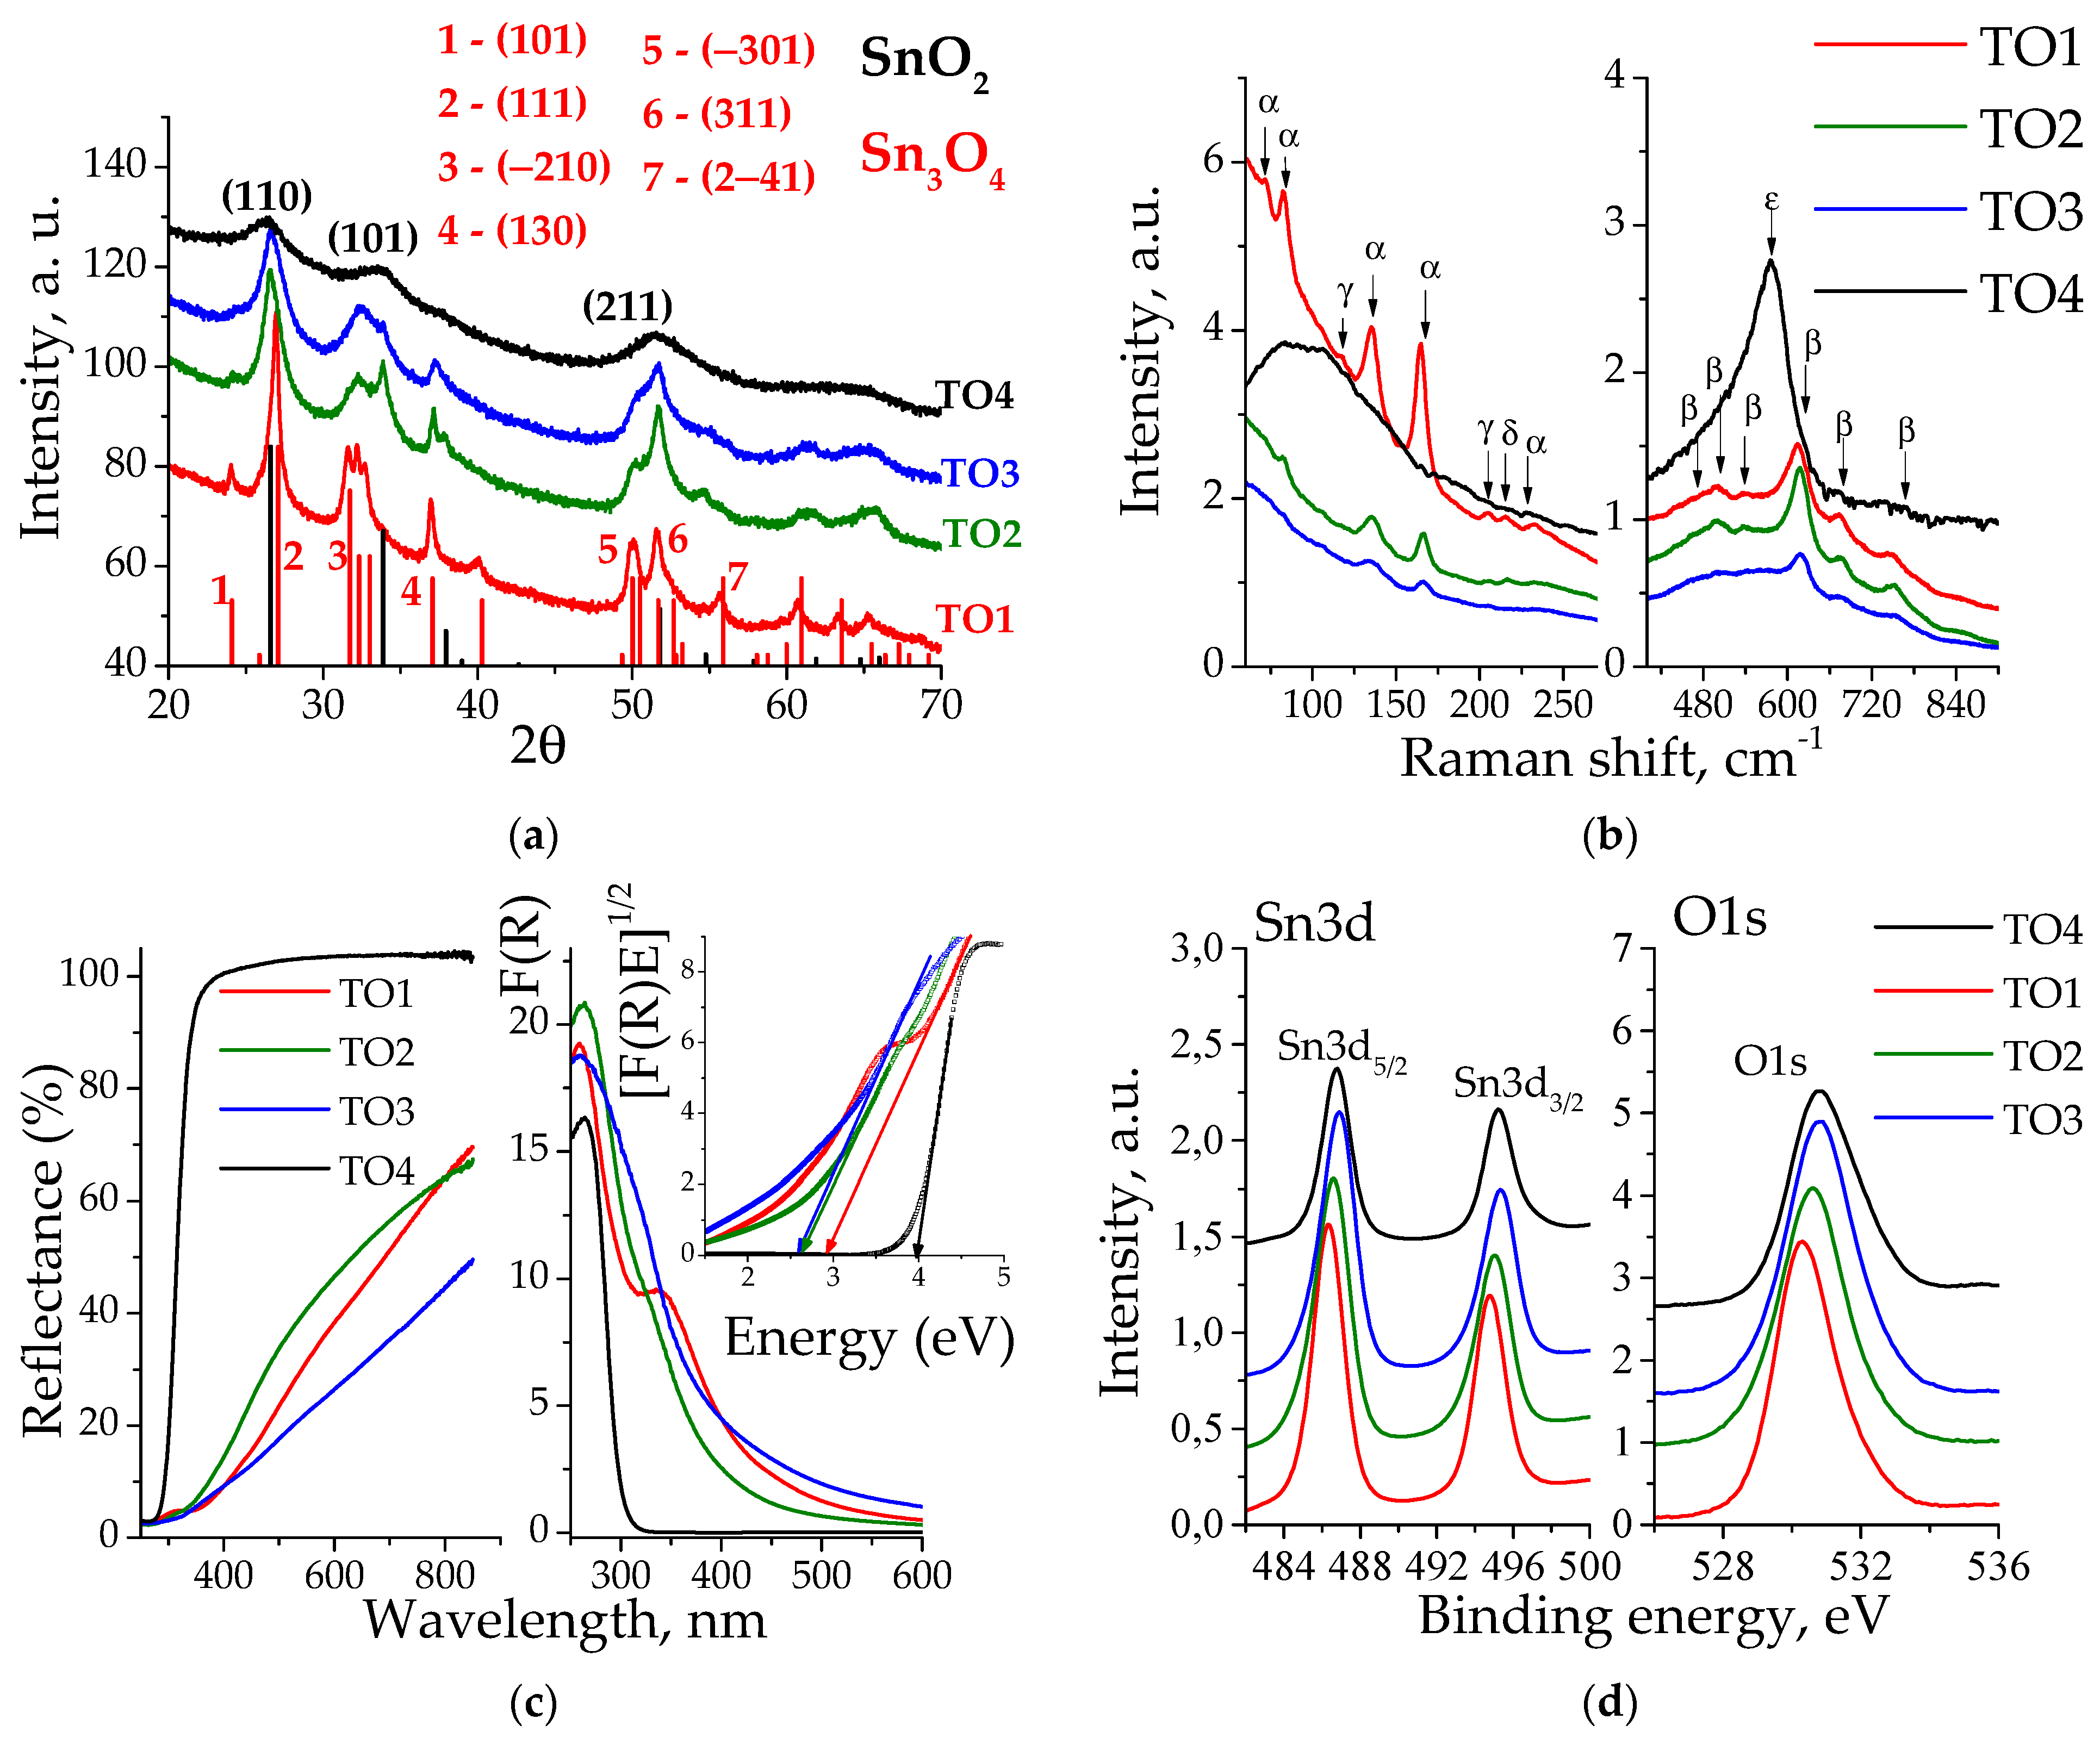
3.1. Physico-Chemical Properties

The XRD analysis (Figure 1a) showed that TO1 represents the triclinic phase Sn3O4 (P−1, PDF #16-0737), while TO4 only showed the SnO2 phase (P42/mnm, PDF #41-1445). Samples TO2 and TO3 contain SnO2 and Sn3O4 phases in different proportions. Table S1 shows the calculated cell parameters. For sample TO1, all observed peaks are slightly shifted to smaller angles relative to those of the Sn3O4 phase, which indicates an increase in unit cell parameters due to the possible presence of water molecules. For samples TO2 and TO3, the observed positions coincide quite well with the literature’s data. The coherent scattering region (CSR) values and phase composition estimates are presented in Table 2 and discussed below.
The Raman spectra (Figure 1b) of a SnO2 phase are characterized by the presence of main peaks at 631 cm−1 (A1g), 773 cm−1 (B2g) and 474 cm−1 (Eg). [46,47,48]. For sample TO4, a large band is observed at 576 cm−1 (ε), characteristic of an amorphous phase with small particle sizes and surface defects [49,50,51]. The presence of 3 nm nanoparticles in TO4 sample is confirmed with XRD data (Table 2). A large number of β peaks with low intensity corresponds to surface phonon vibrations [47]. TO2 and TO3 samples exhibit α peaks at 135 cm−1 and 167 cm−1. For the pure Sn3O4 phase (sample TO1), the intensity of these peaks increases, and new ones appear at 72 cm−1, 83 cm−1. All these peaks are assigned to the Sn3O4 phase [16,19,20,23]. Of the three low intensity peaks observed at 205 cm−1, 215 cm−1 and 233 cm−1, the last one belongs to the Sn3O4 (α) phase. A similar peak at 241 cm−1 was observed for Sn3O4 in refs. [23,25]. The peak at 215 cm−1 (δ) may arise due to the presence of hydroxyl groups. A similar band was reported at 224 cm−1 for Sn3IIO2(OH)2 in ref. [45]. Impurities of the SnO phase (γ) were noted at 118 cm−1 and 205 cm−1 [48]. Since the SnO phases for all samples and the SnO2 phase for TO1 were not observed in the XRD spectrum, it can be assumed that these species may be present in small quantities in the form of amorphous impurities.
In the DRS spectra (Figure 1c), the presence of the Sn3O4 phase results in the visible-light absorption appearance. In Kubelka–Munk coordinates, the spectra are characterized by a wide absorption tail in the visible region extended to more than 600 nm (less than 2 eV). The complex structure of the spectra in Tauc coordinates is most likely caused by the complex structure of energy levels in the band gap due to the interaction of the SnO2 and SnO layers. From the Tauc equation, the band-gap values for indirect transitions were determined in accordance with the literature’s data [15,27,52]. The results are present in Table 2. The XPS spectra are shown in Figure 1d, while the decomposition into spectral components are shown in Figure S1. The TO4 sample in the Sn3d region is characterized by the presence of a doublet at 486.8 eV and at 495.2 eV, which correspond to Sn3d5/2 and Sn3d3/2 bands, respectively. Decomposition of the band at 486.8 eV shows only the Sn4+ form of ions, of which the energy, according to the literature’s data, lies at 486.9 eV [53]. In the oxygen region, decomposition produces bands at 530.7, 532.2 and 535.5 eV associated with lattice oxygen [53,54,55], surface OH groups and/or chemisorbed oxygen [56,57] and with adsorbed water, respectively. The Sn3d5/2 bands of other samples consist of two components at 486.6–486.9 eV and 485.9–486.1 eV, corresponding to Sn4+ and Sn2+ ions, respectively [25,26]. The O1s band decomposes into two components at 530.2 eV (O1) and at 531.5 eV (O2). The assignment of bands of oxygen groups is quite difficult. In some studies, the O1 and O2 bands are assigned to oxygen groups associated with Sn2+ and Sn4+, respectively [21,28]. Since in this work the intensity of the O1 and O2 bands does not correlate with the content of these ions, we attribute O1 to lattice oxygen groups and O2 to chemisorbed oxygen in accordance with ref. [24,25]. The calculated surface composition of the samples is presented in Table 1.
According to Table 1, the surface chemical composition of the TO1 sample is Sn3O3.75, which is close to the ideal Sn3O4. A higher Sn4+ content (46%) than expected (33%) indicates the presence of small amounts of amorphous SnO2 on the surface, which is confirmed by Raman spectra. For samples TO2 and TO3, an increase in the amount of Sn4+ is observed, which correlates with the XRD data, where the content of the SnO2 phase increases. Sample TO4 has the formula SnO1.88 and corresponds to the SnO2 phase. The small size of TO4 particles (CSR 3 nm, Table 2) results in a high content of defective surface oxygen groups. Figure 2 shows the HRTEM data for the TO3 sample. Differently oriented Sn3O4 nanosheets with dimensions of the order of several tens of nanometers and a thickness of about 5 nm are well observed.
The SnO2 phase consists of nanoparticles of 5–10 nm in size, which are in close contact with the surface of Sn3O4 nanosheets. The found nanoparticle sizes correlate with the CSR sizes obtained for this sample with XRD (Table 2). Table 2 summarizes the data obtained with the methods discussed above.
TO1 and TO4 samples represent Sn3O4 and SnO2 phases with CSR sizes of 27 and 3 nm, respectively. The band-gap values obtained are consistent with the literature for these phases: 2.94 eV for Sn3O4 [10] and 3.98 eV for SnO2 [58]. The specific surface area of the TO4 sample is very low (2.05 m2/g), which could be associated with the rigid structure of small-sized SnO2 particles (3 nm). It is noteworthy that the incorporation of SnO2 enhances the specific surface area of Sn3O4/SnO2 heterostructures, as reflected by an increase in the specific surface area from 38.5 m2/g to 95.9 m2/g with an increase in the SnO2 phase content from 0% to 62%.

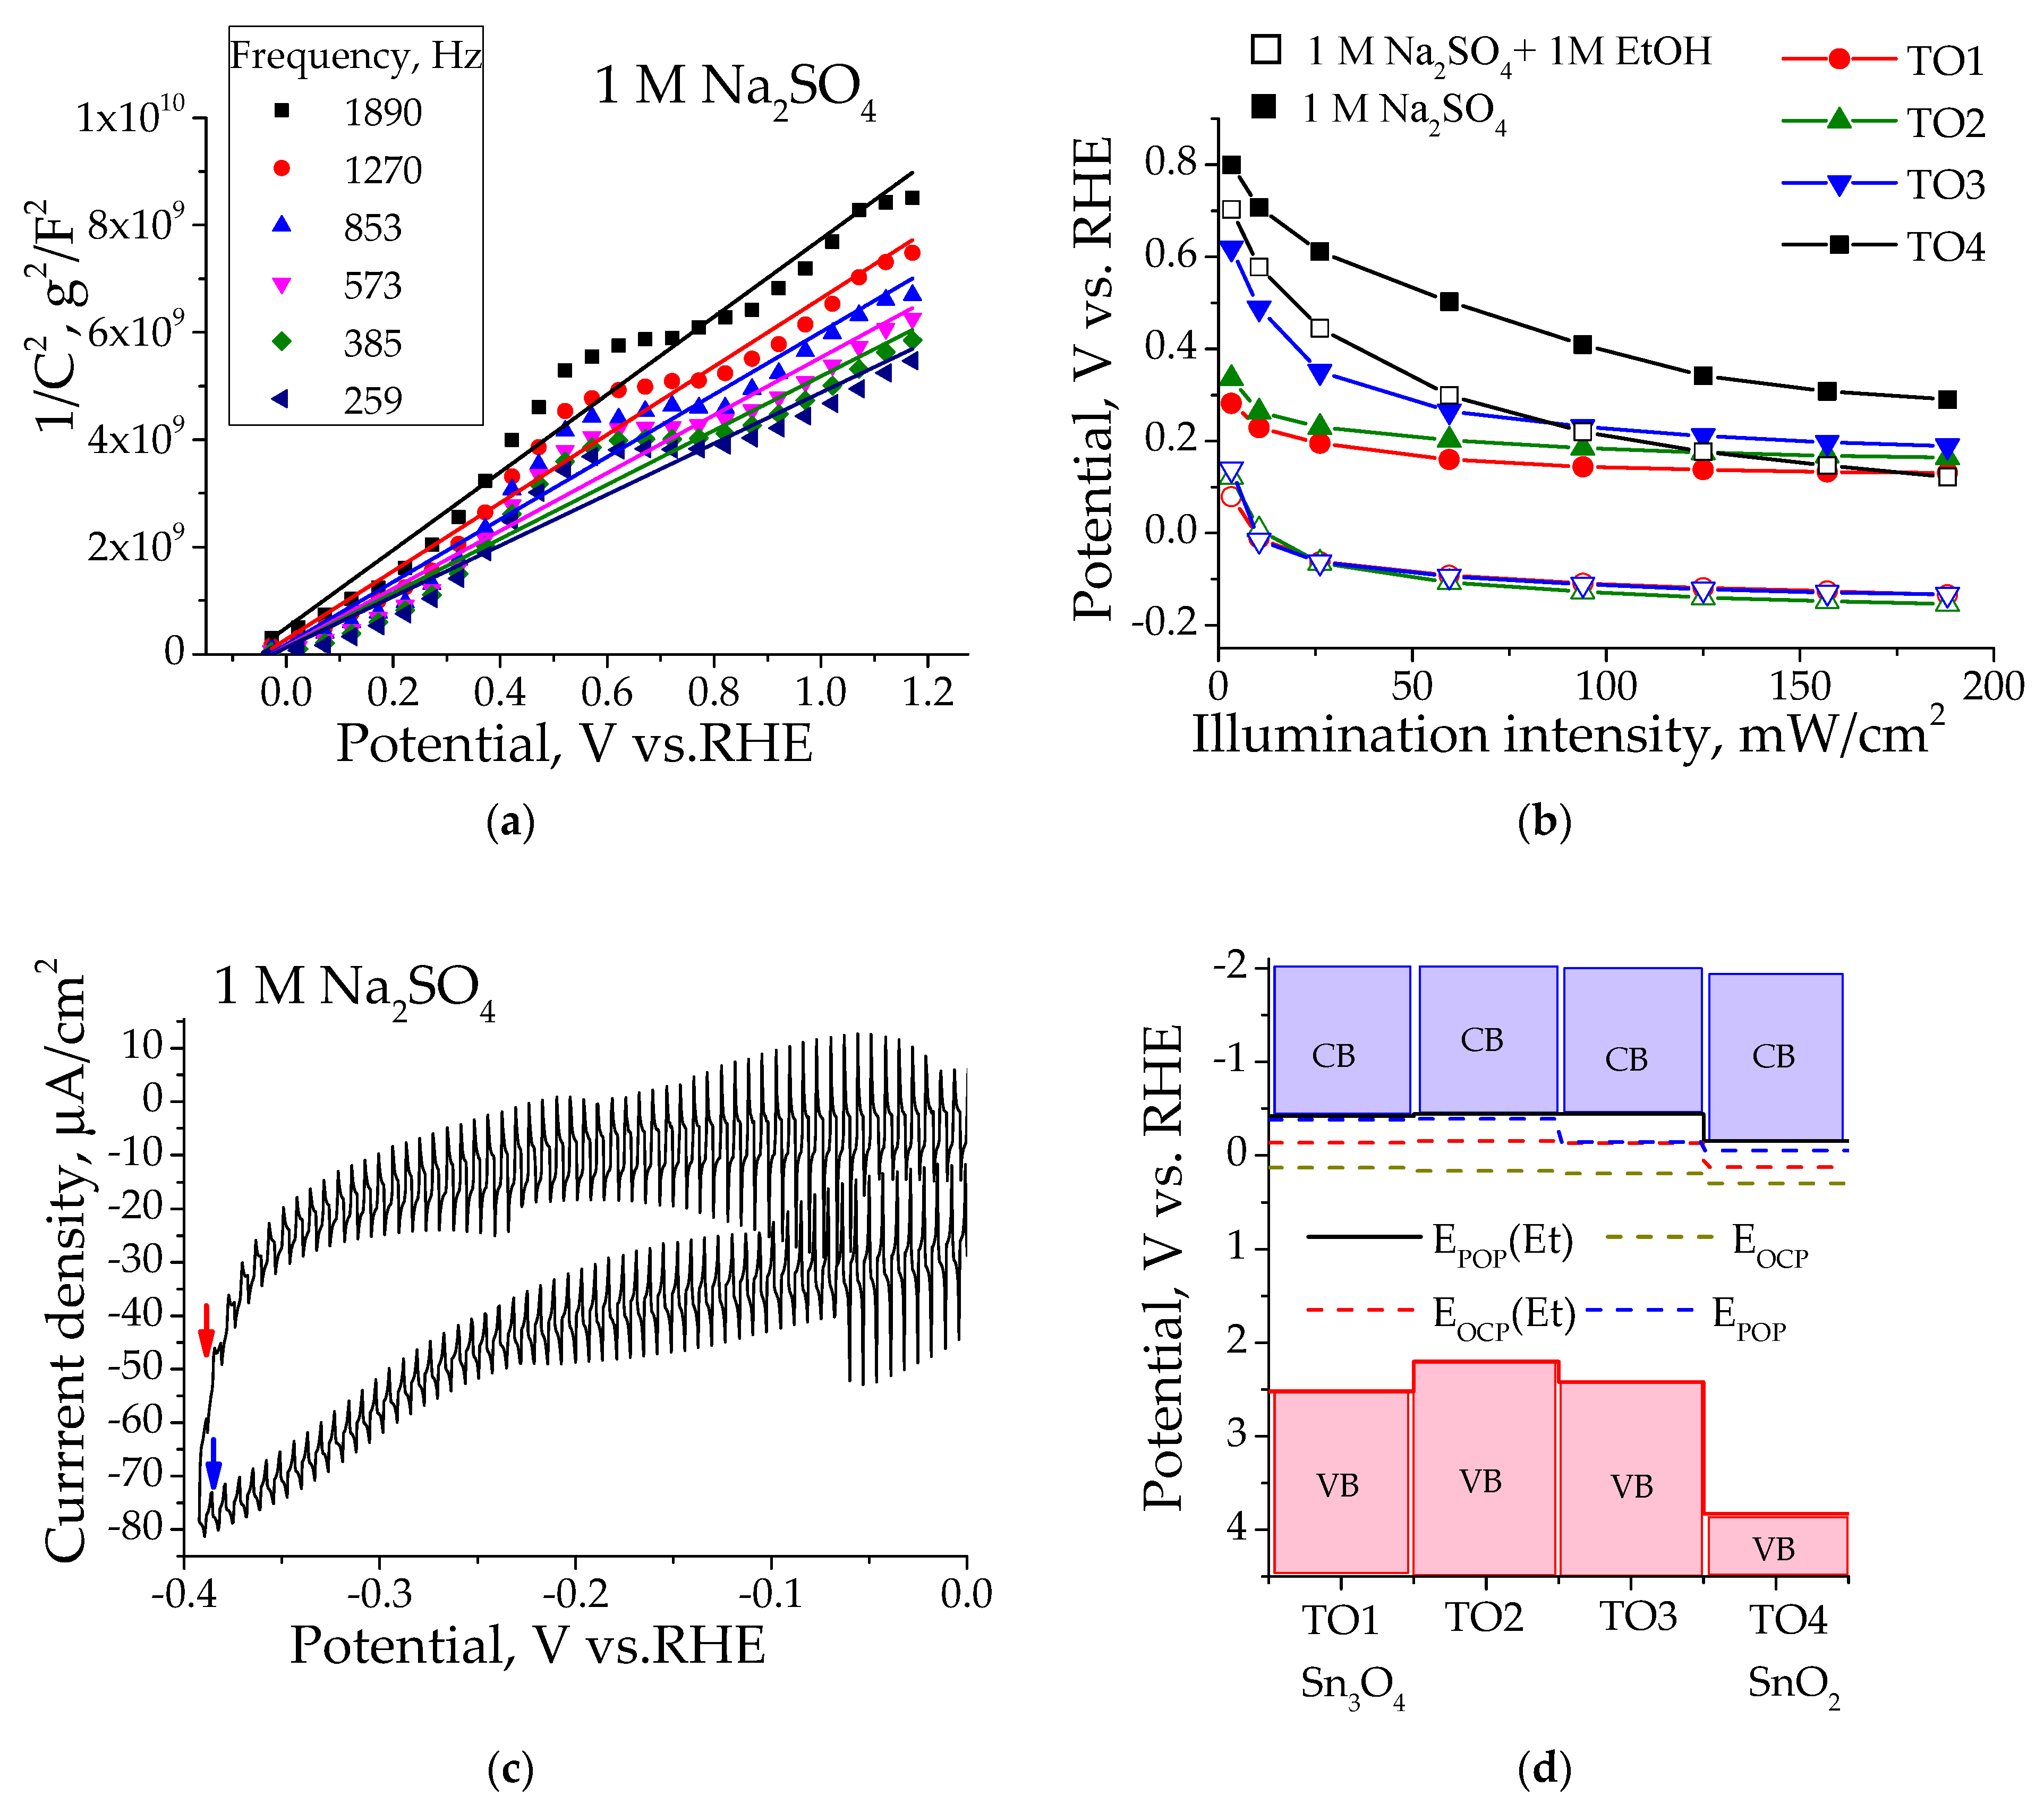
3.2. Flat-Band Potential Determination

The Mott–Schottky (MS), photocurrent onset (POP) and open-circuit potential (OCP) methods were used to determine flat-band potentials in pure electrolyte and with ethanol additives. The obtained data are presented in Figures S2 and S3 and in Figure 3 for TO1 sample. The potentials values obtained are compared in Table 3.
For the MS method, several frequencies were used, and the resulting EMS values were averaged. The observed differences in potential values for different methods may be due to various reasons. EMS values were found to differ significantly from those of other methods. Apparently, the MS method is not applicable in our case for various reasons, which may include the influence of particle size, the influence of the FTO substrate, the presence of two phases with different characteristics and morphology and others [59,60,61]. In the OCP method, as was shown earlier [60], the determined potential can be limited by defect levels below the conduction band, at which rapid recombination occurs. We previously suggested that, for TiO2-N samples, methanol additions reduce the degree of recombination due to an interaction with holes, and the detected EOCP becomes close to the EPOP corresponding to EFB [60]. Previously, we also showed that the POP method for monophase samples can be recommended as the principal one for measuring EFB [60]. Based on these considerations, we assume that the EFB values for the studied samples correspond to the EPOP values measured in the presence of the sacrificial agent ethanol. The obtained EFB values for samples containing the Sn3O4 phase showed similar values of about −0.43 V and did not depend on the SnO2 content. For pure SnO2 (TO4), the EFB value was found to be −0.15 V.
In the literature, EFB values were estimated either from data on the position of the Sn3O4 valence band obtained with XPS or using the MS method, and they were not studied with photoelectrochemical methods. In the first case, such an assessment leads to clearly overestimated values. Thus, the theoretically calculated value was about −2 V vs. EH+/H2 [15], −1.14 eV vs. NHE [17], −1.2 V vs. RHE [62]. Data obtained with the MS method show higher values and a large spread: −0.97 V vs. NHE (=−0.56 V vs. RHE) [13], −0.94 V vs. NHE (=−0.53 V vs. RHE) [32], −0.6 V vs. NHE (=−0.19 V vs. RHE) [33], −1.1 V vs. NHE (=−0.69 V vs. RHE) [16], −1.1 V vs. RHE [41], −0.23 V vs. NHE at pH 0 (=−0.23 V vs. RHE) [14]. Samples synthesized using citrate ions showed values close to ours: −0.3 V vs. SHE at pH 0 (=−0.3 V vs. RHE) [11].
EOCP(Et) values obtained with the addition of ethanol were found to be similar for all samples containing the Sn3O4 phase, which prompted us to plot these values in an energy diagram calculated from the data on the band gap and EFB potentials (Figure 3d). Close EOCP (dark yellow lines) values found for all samples (0.13–0.19 V) and a higher one (0.29 V) found for the TO4 sample having the SnO2 phase suggest that these potentials correspond to defect levels at which rapid recombination of the electron–hole pair occurs [60]. The presence of oxygen vacancies was reported for Sn3O4 at a potential of −0.3 V vs. NHE at pH 7 (=0.09 V vs. RHE) [33], which is close to the value found in our work. The EOCP(Et) (red lines) in the presence of ethanol do not reach the EFB, in contrast to the results obtained for this method in our previous work [60]. However, the values obtained for all samples containing the Sn3O4 phase are similar and coincide with the EFB of the SnO2 (TO4) sample. We assume that interfacial electron transfer may occur from the EFB levels from Sn3O4 in TO2 and TO3 samples to the EFB level of SnO2. Unlike the OCP method, in the POP method, the electrode is polarized, and due to the excess of electrons, the influence of the recombination process is significantly reduced. For TO1, TO2 and TO4 samples, the effect of ethanol is not observed, and the EPOP potentials correspond to EFB. For the TO3 sample with a high content of the SnO2 phase, EPOP in a pure electrolyte is fixed at the level of EFB SnO2 due to interfacial transfer and high recombination, and with the addition of ethanol, it coincides the EFB level of Sn3O4 due to a decrease in recombination.

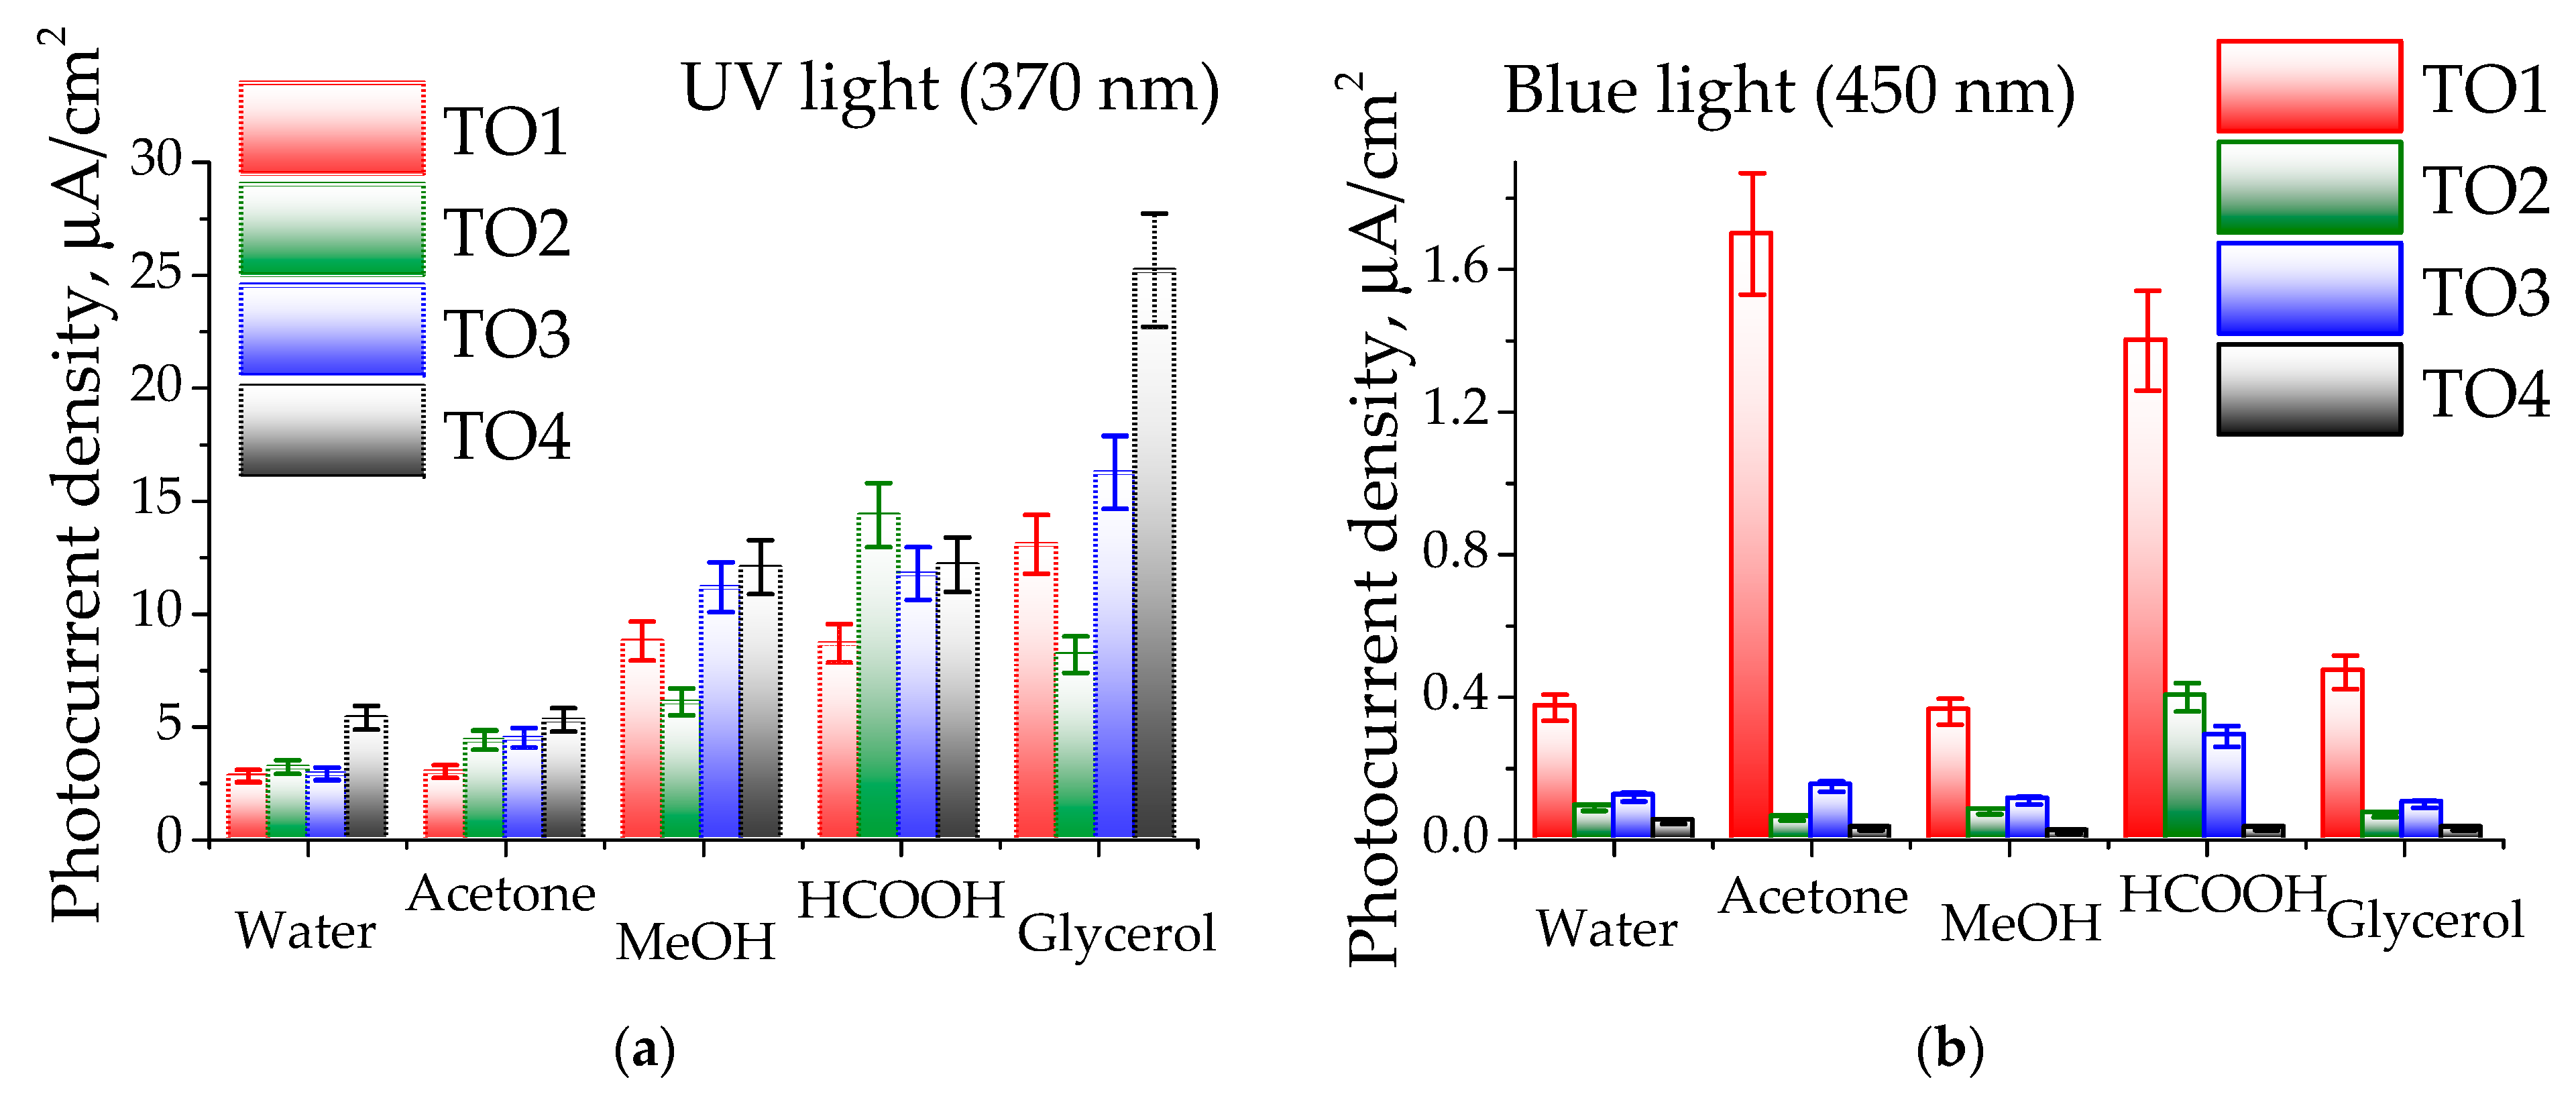
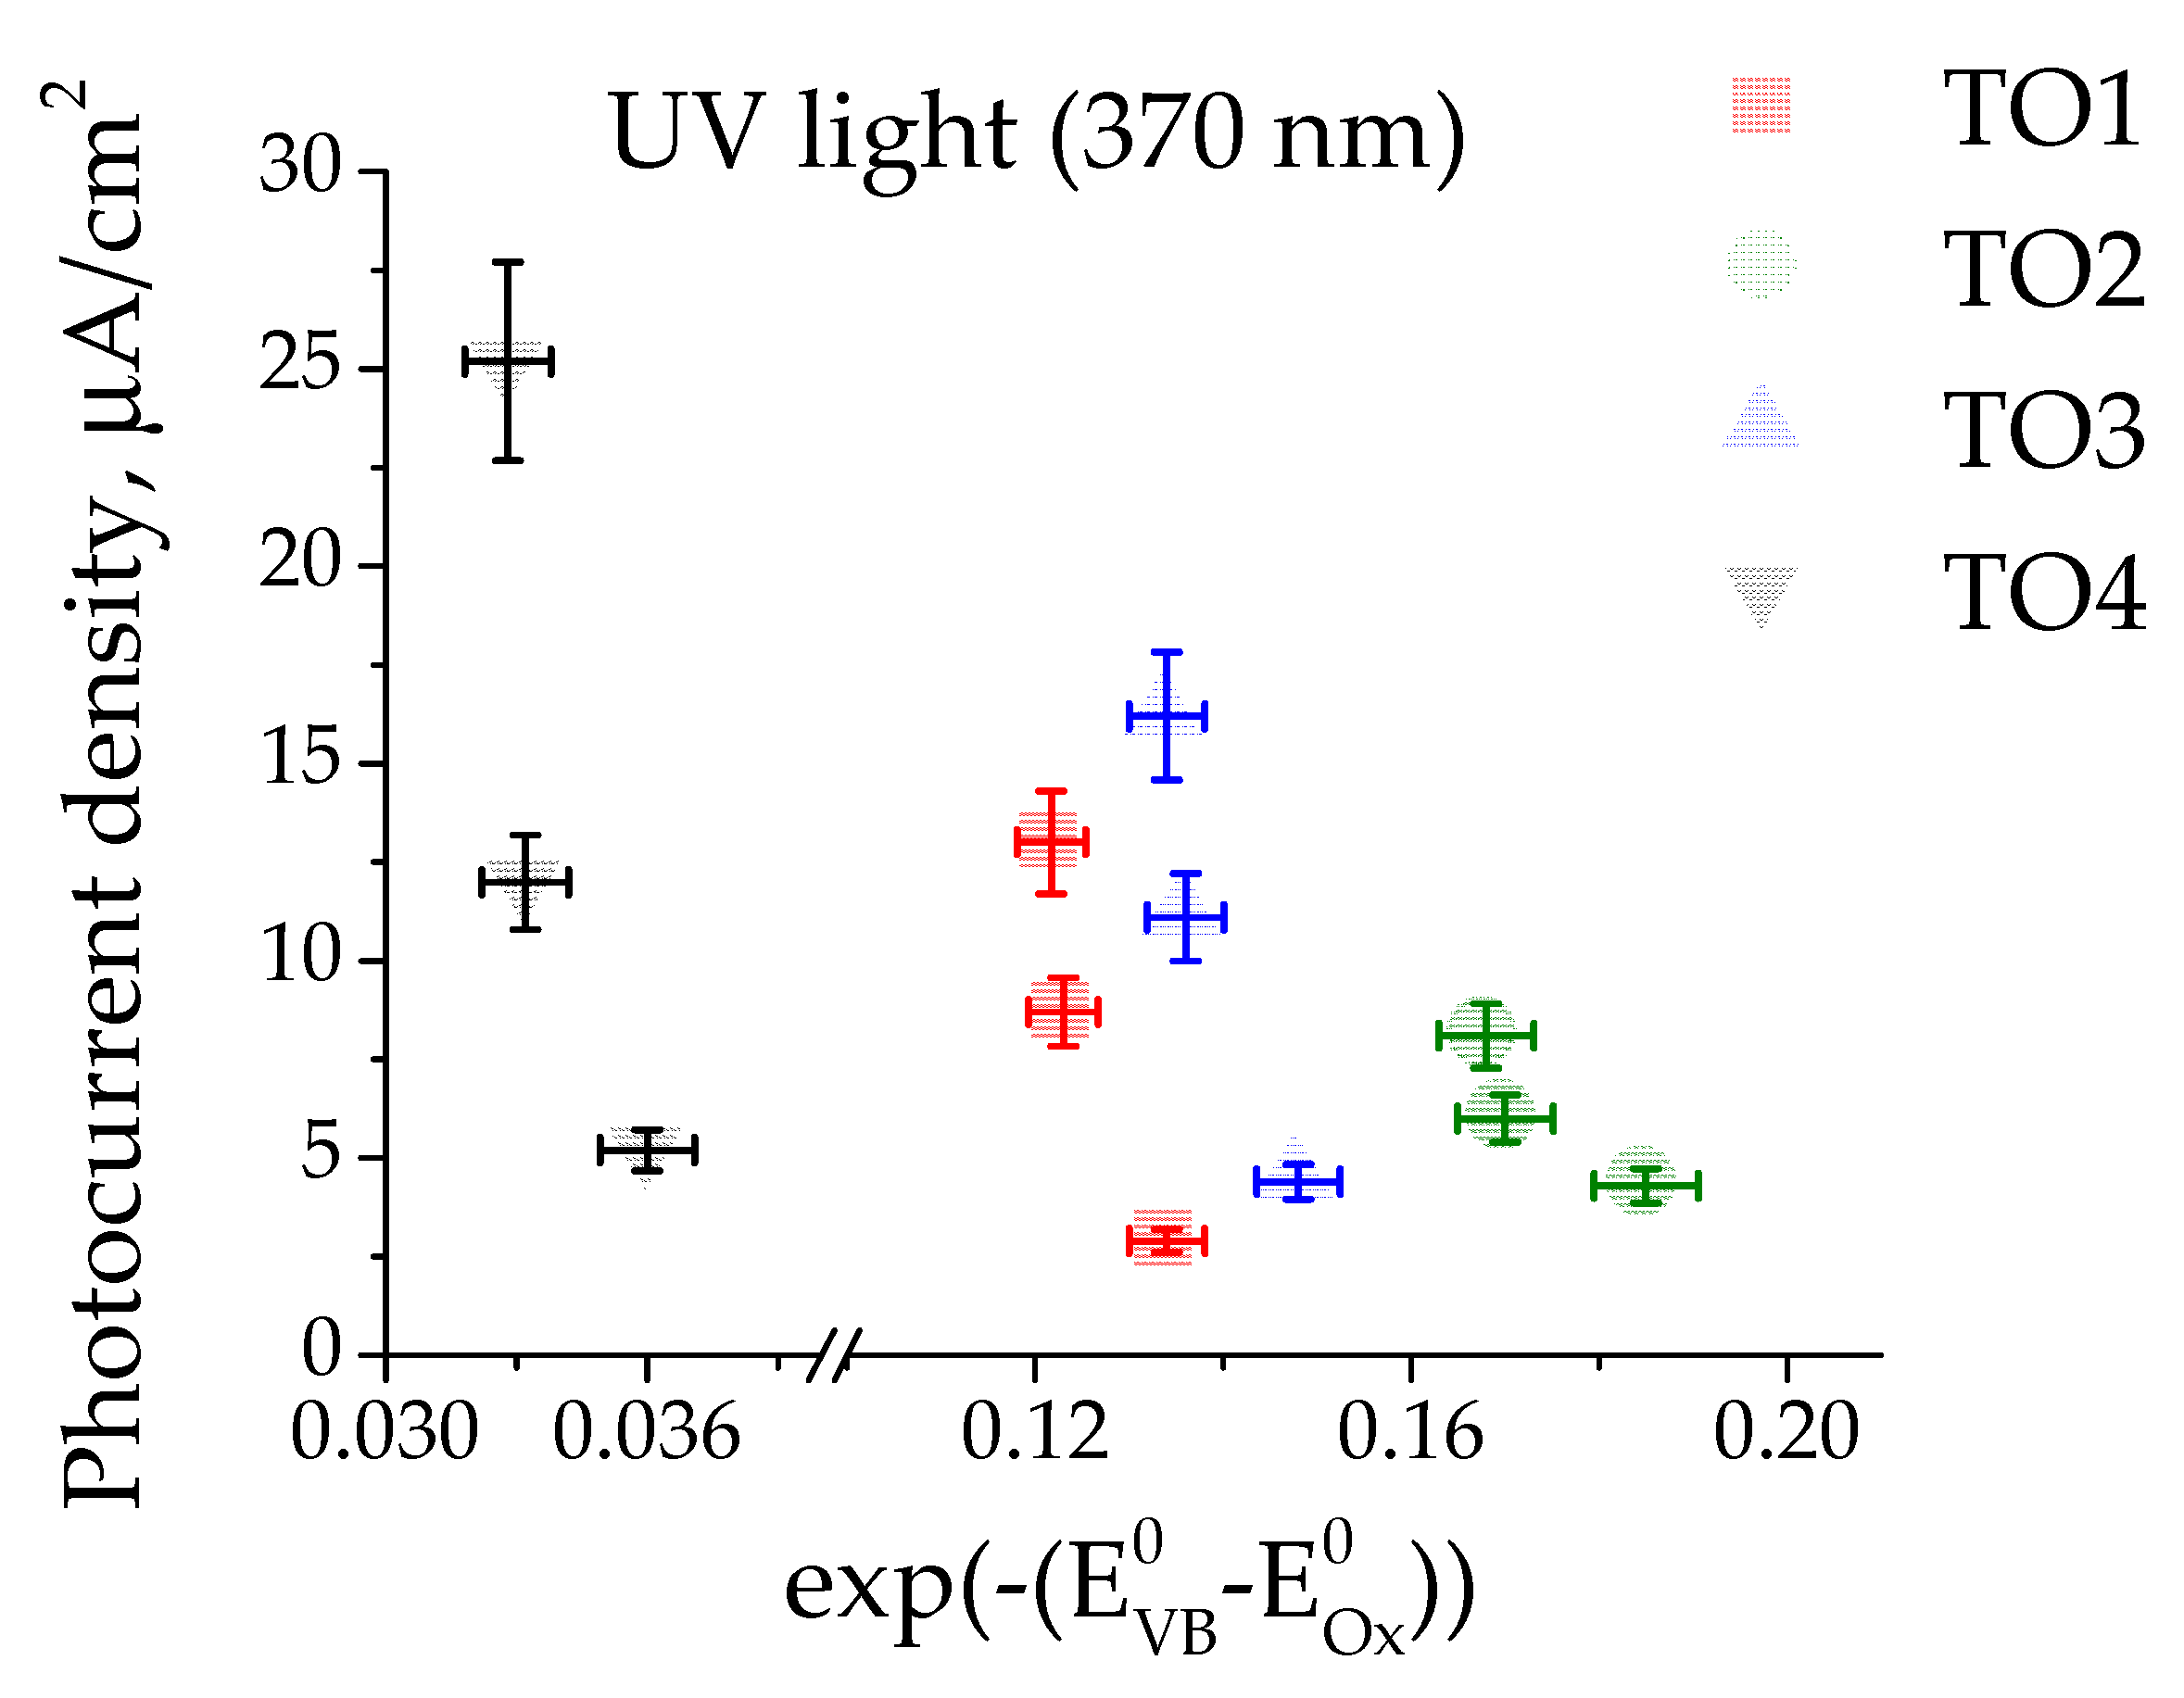
3.3. Photoelectrocatalytic Oxidation of Organic Substrates

The samples were studied in the photoelectrochemical oxidation of small organic molecules (methanol, acetone, glycerol and formic acid). Experiments were carried out at potentials of 0.6, 1 and 1.4 V and at wavelengths of 370 and 450 nm. Dependencies of the current density on time at potential of 1 V vs. RHE are presented in Figure S4. The photocurrent values showed an insignificant increase with the potential (Figure S5). The exception is the TO2 sample, where the current in the oxidation reaction of formic acid under visible light irradiation sharply decreases with increasing potential, which may be due to the deactivation of the catalyst that resulted from the oxidation of Sn2+ ions. Under the influence of UV radiation, the catalysts operate stably and a slight increase in the photocurrent from the potential is observed. Photocurrents were compared at a potential of 1 V vs. RHE. The data are presented in Figure 4.
In general, the photocurrents of samples under UV illumination is several times higher than that found under visible light, which is associated with higher light absorption by the sample. For most materials, it increases in the series water = acetone < methanol < formic acid < glycerol. A comparison of the materials with each other shows that SnO2 (TO4) exhibits the greatest activity in all reactions, except for the oxidation of formic acid, which is explained by the highest potential of the TO4 valence band (Figure 3d). Under visible light irradiation, for all substrates (except formic acid), the activity correlates with the level of the valence band: TO1 (2.52 eV) > TO3 (2.42 eV) > TO2 (2.20 eV). The TO4 sample, representing SnO2, does not absorb visible light, so its photocurrent values are at the detection levels. The photocurrents of TO2 and TO3 samples in the oxidation under visible light of all substrates do not depend on the addition of an organic substrate and correspond to the photocurrents of water oxidation. TO1 is the most active one, and its photocurrent falls in the order acetone > HCOOH ≫ glycerol > methanol = water. The oxidation of formic acid probably proceeds with a different mechanism since all samples are active under both UV and visible light, and the series of photocurrent values differs depending on the type of illumination: TO2 > TO4 > TO3 > TO1 (UV irradiation) and TO1 > TO2 > TO3 (visible light).

4. Discussion

Additions of organic compounds as a sacrificial agent—electron donors—are widely used to increase the yield of hydrogen in photoreforming reactions [63]. The mechanism is the efficient trapping of photoinduced holes, which leads to a sharp decrease in recombination and an increase in the number of free electrons that participate in the formation of hydrogen from water [64]. The amount of hydrogen released during ultraviolet irradiation in an alcohol solution is determined by the number of hydrogen atoms located near the OH groups and decreases in the order glycerol > ethylene glycol > methanol > ethanol [63,65], which is consistent with the results obtained in our work for alcohol compounds (methanol and glycerol) under UV illumination. Oxidation of organic molecules on a surface occurs through a series of successive stages of electron transfer from the adsorbed molecules to the semiconductor. The ref. [66] presents the oxidation pathways of various molecules. Methanol is adsorbed to form methoxy groups, which are successively oxidized to formaldehyde and formate groups. Acetone is successively converted into acetate groups, then into formate groups. Formic acid is adsorbed as formate and oxidized to CO2 and H2O [66].
The low rate of oxidation of acetone under UV irradiation is due to the lower affinity for the surface adsorption of acetone than of alcohols [67,68]. The desorption of acetone from the surface of TiO2 as an intermediate product of the photooxidation of isopropanol was observed in work [68]. The high efficiency of HCOOH oxidation is due to the low isoelectric point of Sn3O4, which lies in the acidic region at pH = 2.5–3 [18] and the acidic nature of formic acid, which leads to strong adsorption of formate ions on the surface of the material, which are more reactive than molecular particles [69]. The resulting series of activity in the oxidation of HCOOH is most likely associated with the influence of the surface pH of the samples. Using formic acid as a sacrificial agent for hydrogen evolution under UV light on strontium titanates resulted in more hydrogen evolution than using methanol [70], which is consistent with our results.
To clarify the influence of the valence band potential on the measured photocurrents, the oxidation potential of organic compounds was assessed, and the dependence was plotted in coordinates photocurrent-exp(−(E0ox−EVB)) (Figure 5), as proposed for alcohols in work [65]. A detailed description of potential calculations is provided in the Supplementary File and Table S2.
With the increase in difference between the valence band of the samples and the oxidation potential of organic compounds, an increase in photocurrents is observed, which is consistent with the hydrogen evolution increase reported in ref. [65]. For each substrate and each sample, the photocurrent under UV illumination increases with increasing valence band potential or decreasing substrate oxidation potential, respectively. The behaviour of acetone and formic acid are different. In the first case, low photocurrent values are associated with a low degree of acetone adsorption. In the second case, the surface acidic properties of the samples play a more decisive role in oxidation. Under visible light, a similar trend is observed.

5. Conclusions

In this work, a series of Sn3O4, SnO2 and Sn3O4/SnO2 samples with different phase ratios were prepared using hydrothermal synthesis. The structure of the samples was confirmed with XRD and Raman spectroscopy. The HRTEM method showed that SnO2 nanoparticles are in close contact with Sn3O4 nanosheets. DRS data showed that all samples containing the Sn3O4 phase absorb light in visible region. Flat-band potential measurements showed that the intermittent illumination (photocurrent onset potential) method with the addition of a sacrificial agent (ethanol) makes it possible to determine the EFB for all samples, while the potential determined with the OCP method most likely corresponds to either the EFB of SnO2 nanoparticles in the Sn3O4/SnO2 samples due to the possibility of interfacial electron transfer to tin dioxide or the potential of defective centers, where charge recombination occurs. The flat-band potentials for samples containing Sn3O4 were determined to be −0.43 V vs. RHE, while that for SnO2 was −0.15 V vs. RHE. The samples were studies in photo-electrocatalytic oxidation of a series of organic substrates (acetone, methanol, glycerol, formic acid) at a potential of 1 V vs. RHE under irradiation with ultraviolet (λ = 370 nm) and visible (λ = 450 nm) light. The presence of the SnO2 phase was shown to increase oxidation photocurrents in the ultraviolet region and to decrease those in the visible region. It was found that the photocurrent magnitudes can be related to the potentials of both the valence band of materials and oxidation of the substrate. For acetone, low photocurrent values were supposed to be associated with a low adsorption value. In the case of formic acid, the acidic properties of the surface are of decisive importance. Under visible light, the Sn3O4 sample showed high activities in the acetone and formic acid photo-electrooxidation, while the Sn3O4/SnO2 samples exhibited noticeable activity only in the oxidation of formic acid.

Supplementary Materials

The following supporting information can be downloaded at: https://www.mdpi.com/article/10.3390/ma16237300/s1, Figure S1: Decomposition of the obtained XPS bands in the Sn3d and O1s energy regions; Figure S2: Dependence of capacitance on potential in Mott–Schottky coordinates (MS method) in pure electrolyte and with ethanol additives; Figure S3. Intermittent irradiation (photocurrent onset potential, POP method) of samples in pure electrolyte and with the addition of ethanol; Figure S4. Dependence of current densities on the time at a potential of 1 V vs. RHE in the electrooxidation of water, acetone, methanol, formic acid and glycerol under irradiation with ultraviolet at 370 nm and visible at 450 nm light; Figure S5. Dependence of photocurrents on the potential in the electrooxidation of water, acetone, methanol, formic acid and glycerol under irradiation with ultraviolet at 370 nm and visible at 450 nm light. Table S1: Comparison of the literature’s data and experimental results of lattice parameters of the Sn3O4 phase in sample TO1 and the SnO2 phase in other samples; Table S2: Standard oxidation potentials (versus NHE) calculated for the different organic substrates; Table S3: The EFB, band-gap and ECB values obtained in this work for TO1–TO4 samples.

Author Contributions

Conceptualization, E.G. and E.K.; methodology, E.G. and E.K.; software, M.L.; investigation, E.G., E.K., A.K., M.M. and E.L.; resources, E.G.; writing—review and editing, E.G., E.K., M.L. and A.K.; visualization, E.G. and E.K.; funding acquisition, E.G. All authors have read and agreed to the published version of the manuscript.

Funding

This research was funded by RUSSIAN SCIENCE FOUNDATION, grant number 22-23-20208 and NOVOSIBIRSK REGION, agreement No. p-21 dated 6 April 2022.

Institutional Review Board Statement

Not applicable.

Informed Consent Statement

Not applicable.

Data Availability Statement

Data are contained within the article and supporting information.

Acknowledgments

Authors express gratitude to Evgenii Gerasimov (BIC SB RAS) for the HRTEM studies and to Artem Ayupov (BIC SB RAS) for low-temperature nitrogen adsorption studies. The studies were performed using facilities of the Shared Research Center “National center of investigation of catalysts” at Boreskov Institute of Catalysis”. Raman spectroscopy was carried out using equipment of the chair of solid-state chemistry and laboratory «MDEST» of the REC «INChT» in Novosibirsk State University.

Conflicts of Interest

The authors declare no conflict of interest.

References

  1. Wang, H.; Li, X.; Zhao, X.; Li, C.; Song, X.; Zhang, P.; Huo, P.; Li, X. A review on heterogeneous photocatalysis for environmental remediation: From semiconductors to modification strategies. Chin. J. Catal. 2022, 43, 178–214. [Google Scholar] [CrossRef]
  2. Sun, C.; Yang, J.; Xu, M.; Cui, Y.; Ren, W.; Zhang, J.; Zhao, H.; Liang, B. Recent intensification strategies of SnO2-based photocatalysts: A review. Chem. Eng. J. 2022, 427, 131564. [Google Scholar] [CrossRef]
  3. Chikunova, I.O.; Semeykina, V.S.; Kuznetsov, A.N.; Kalinkin, P.N.; Gribov, E.N.; Parkhomchuk, E.V. Template-assisted synthesis and electrochemical properties of SnO2 as a cathode catalyst support for PEMFC. Ionics 2020, 26, 1861–1873. [Google Scholar] [CrossRef]
  4. Sharma, A.; Ahmed, A.; Singh, A.; Oruganti, S.K.; Khosla, A.; Arya, S. Review—Recent Advances in Tin Oxide Nanomaterials as Electrochemical/Chemiresistive Sensors. J. Electrochem. Soc. 2021, 168, 027505. [Google Scholar] [CrossRef]
  5. Reddy, M.V.; Linh, T.T.; Hien, D.T.; Chowdari, B.V.R. SnO2 Based Materials and Their Energy Storage Studies. ACS Sustain. Chem. Eng. 2016, 4, 6268–6276. [Google Scholar] [CrossRef]
  6. Dalapati, G.K.; Sharma, H.; Guchhait, A.; Chakrabarty, N.; Bamola, P.; Liu, Q.; Saianand, G.; Sai Krishna, A.M.; Mukhopadhyay, S.; Dey, A.; et al. Tin oxide for optoelectronic, photovoltaic and energy storage devices: A review. J. Mater. Chem. A 2021, 9, 16621–16684. [Google Scholar] [CrossRef]
  7. Mishra, S.R.; Ahmaruzzaman, M. Tin oxide based nanostructured materials: Synthesis and potential applications. Nanoscale 2022, 14, 1566–1605. [Google Scholar] [CrossRef]
  8. Dhanalakshmi, M.; Saravanakumar, K.; Lakshmi Prabavathi, S.; Abinaya, M.; Muthuraj, V. Fabrication of novel surface plasmon resonance induced visible light driven iridium decorated SnO2 nanorods for degradation of organic contaminants. J. Alloys Compd. 2018, 763, 512–524. [Google Scholar] [CrossRef]
  9. Xiong, Y.; Lin, Y.; Wang, X.; Zhao, Y.; Tian, J. Defect engineering on SnO2 nanomaterials for enhanced gas sensing performances. Adv. Powder Mater. 2022, 1, 100033. [Google Scholar] [CrossRef]
  10. Sethi, Y.A.; Kulkarni, A.K.; Ambalkar, A.A.; Panmand, R.P.; Kulkarni, M.V.; Gosavi, S.W.; Kale, B.B. Efficient solar light-driven hydrogen generation using an Sn3O4 nanoflake/graphene nanoheterostructure. RSC Adv. 2021, 11, 29877–29886. [Google Scholar] [CrossRef]
  11. Tanabe, T.; Hashimoto, M.; Mibu, K.; Tanikawa, T.; Gunji, T.; Kaneko, S.; Abe, H.; Miyauchi, M.; Matsumoto, F. Synthesis of single phase Sn3O4: Native visible-light-sensitive photocatalyst with high photocatalytic performance for hydrogen evolution. J. Nanosci. Nanotechnol. 2017, 17, 3454–3459. [Google Scholar] [CrossRef]
  12. Li, L.; Zhang, K.; Jin, W.; Xia, W.; He, J.; Zeng, X. An excellent H2 production photoelectrode based on mixed valence Sn3O4 nanoflake arrays treated by H2O2 hydrothermal reaction. Int. J. Hydrogen Energy 2022, 47, 10594–10602. [Google Scholar] [CrossRef]
  13. Mone, P.; Mardikar, S.; Balgude, S. Morphology-controlled synthesis of Sn3O4 nanowires for enhanced solar-light driven photocatalytic H2 production. Nano-Struct. Nano-Objects 2020, 24, 100615. [Google Scholar] [CrossRef]
  14. Yu, X.; Zhao, Z.; Ren, N.; Liu, J.; Sun, D.; Ding, L.; Liu, H. Top or Bottom, Assembling Modules Determine the Photocatalytic Property of the Sheetlike Nanostructured Hybrid Photocatalyst Composed with Sn3O4 and rGO (GQD). ACS Sustain. Chem. Eng. 2018, 6, 11775–11782. [Google Scholar] [CrossRef]
  15. Manikandan, M.; Tanabe, T.; Li, P.; Ueda, S.; Ramesh, G.V.; Kodiyath, R.; Wang, J.; Hara, T.; Dakshanamoorthy, A.; Ishihara, S.; et al. Photocatalytic water splitting under visible light by mixed-valence Sn3O4. ACS Appl. Mater. Interfaces 2014, 6, 3790–3793. [Google Scholar] [CrossRef]
  16. He, Y.; Li, D.; Chen, J.; Shao, Y.; Xian, J.; Zheng, X.; Wang, P. Sn3O4: A novel heterovalent-tin photocatalyst with hierarchical 3D nanostructures under visible light. RSC Adv. 2014, 4, 1266–1269. [Google Scholar] [CrossRef]
  17. Li, C.; Yu, S.; Dong, H.; Liu, C.; Wu, H.; Che, H.; Chen, G. Z-scheme mesoporous photocatalyst constructed by modification of Sn3O4 nanoclusters on g-C3N4 nanosheets with improved photocatalytic performance and mechanism insight. Appl. Catal. B Environ. 2018, 238, 284–293. [Google Scholar] [CrossRef]
  18. Huda, A.; Suman, P.H.; Torquato, L.D.M.; Silva, B.F.; Handoko, C.T.; Gulo, F.; Zanoni, M.V.B.; Orlandi, M.O. Visible light-driven photoelectrocatalytic degradation of acid yellow 17 using Sn3O4 flower-like thin films supported on Ti substrate (Sn3O4/TiO2/Ti). J. Photochem. Photobiol. A Chem. 2019, 376, 196–205. [Google Scholar] [CrossRef]
  19. Yang, R.; Ji, Y.; Zhang, J.; Zhang, R.; Liu, F.; Chen, Y.; Liang, L.; Han, S.; Yu, X.; Liu, H. Efficiently degradation of polyacrylamide pollution using a full spectrum Sn3O4 nanosheet/Ni foam heterostructure photoelectrocatalyst. Catal. Today 2019, 335, 520–526. [Google Scholar] [CrossRef]
  20. Yang, R.Q.; Liang, N.; Chen, X.Y.; Wang, L.W.; Song, G.X.; Ji, Y.C.; Ren, N.; Lü, Y.W.; Zhang, J.; Yu, X. Sn/Sn3O4−x heterostructure rich in oxygen vacancies with enhanced visible light photocatalytic oxidation performance. Int. J. Miner. Metall. Mater. 2021, 28, 150–159. [Google Scholar] [CrossRef]
  21. Zhang, L.; Liu, X.; Zhang, X.; Zhang, W.; Ma, J.; Wang, Q.; Su, S. Sulfur-doped Sn3O4 nanosheets for improved photocatalytic performance. J. Alloys Compd. 2023, 961, 170904. [Google Scholar] [CrossRef]
  22. Chen, G.; Lu, S.; Shang, Y.; Zeng, W.; Zhan, H.; Mei, J.; He, Z. Sn3O4-SnO2 heterostructure for highly sensitive and selective NO2 sensing at low operating temperature. Nano Express. 2021, 2, 020021. [Google Scholar] [CrossRef]
  23. Masteghin, M.G.; Silva, R.A.; Cox, D.C.; Godoi, D.R.M.; Silva, S.R.P.; Orlandi, M.O. The role of surface stoichiometry in NO2 gas sensing using single and multiple nanobelts of tin oxide. Phys. Chem. Chem. Phys. 2021, 23, 9733–9742. [Google Scholar] [CrossRef]
  24. Yang, X.-Y.; Shi, Y.-T.; Xie, K.-F.; Wang, J.-Y.; Wang, Y.-F.; Zheng, Y.; Fang, S.-M.; Zhang, Y.-H. Engineering of in-plane SnO2-Sn3O4 hierarchical nanoflower heterojunctions for enhanced formaldehyde sensing. Appl. Surf. Sci. 2023, 614, 156110. [Google Scholar] [CrossRef]
  25. Chen, X.; Huang, Y.; Zhang, K.; Feng, X.; Wei, C. Novel hierarchical flowers-like Sn3O4 firstly used as anode materials for lithium ion batteries. J. Alloys Compd. 2017, 690, 765–770. [Google Scholar] [CrossRef]
  26. Chothe, U.P.; Ambalkar, A.A.; Ugale, C.K.; Kulkarni, M.V.; Kale, B.B. Synergy of a heteroatom (P-F) in nanostructured Sn3O4 as an anode for sodium-ion batteries. Sustain. Energy Fuels 2021, 5, 2678–2687. [Google Scholar] [CrossRef]
  27. Furukawa, M.; Iwamoto, D.; Inamori, K.; Tateishi, I.; Katsumata, H.; Kaneco, S. Synthesis of Tungsten-Modified Sn3O4 through the Cetyltrimethylammonium Bromide-Assisted Solvothermal Method for Dye Decolorization under Visible Light Irradiation. Catalysts 2023, 13, 1179. [Google Scholar] [CrossRef]
  28. Jia, H.; Cao, X.; Pan, A.; Huang, L.; Yin, B.; Chen, J.; Tan, X.; Tang, Y.; Han, M.; Liang, S. Vertically oriented Sn3O4 nanoflakes directly grown on carbon fiber cloth for high-performance lithium storage. Inorg. Chem. Front. 2019, 6, 1468–1474. [Google Scholar] [CrossRef]
  29. Reddy Pallavolu, M.; Tanaya Das, H.; Anil Kumar, Y.; Naushad, M.; Sambasivam, S.; Hak Jung, J.; Joo, S.W. Marigold flower-like Sn3O4 nanostructures as efficient battery-type electrode material for high-performing asymmetric supercapacitors. J. Electroanal Chem. 2022, 920, 116641. [Google Scholar] [CrossRef]
  30. Fadaam, S.A.; Ali, H.M.; Salih, A.A.; Obaid, M.A.; Sabeeh Ali, A.; Habubi, N.F. Synthesis and characterization of metastable phases of SnO and Sn3O4 thin films for solar cells applications. J. Phys. Conf. Ser. 2021, 1963, 012003. [Google Scholar] [CrossRef]
  31. Liu, L.X.; Zhou, Y.; Chang, Y.C.; Zhang, J.R.; Jiang, L.P.; Zhu, W.; Lin, Y. Tuning Sn3O4 for CO2 reduction to formate with ultra-high current density. Nano Energy 2020, 77, 105296. [Google Scholar] [CrossRef]
  32. Romeiro, F.C.; Silva, B.C.; Martins, A.S.; Zanoni, M.V.B.; Orlandi, M.O. Superior performance of rGO-tin oxide nanocomposite for selective reduction of CO2 to methanol. J. CO2 Util. 2021, 46, 101460. [Google Scholar] [CrossRef]
  33. Xia, W.; Qian, H.; Zeng, X.; Dong, J.; Wang, J.; Xu, Q. Visible-Light Self-Powered Photodetector and Recoverable Photocatalyst Fabricated from Vertically Aligned Sn3O4 Nanoflakes on Carbon Paper. J. Phys. Chem. C 2017, 121, 19036–19043. [Google Scholar] [CrossRef]
  34. Berengue, O.M.; Simon, R.A.; Chiquito, A.J.; Dalmaschio, C.J.; Leite, E.R.; Guerreiro, H.A.; Guimarães, F.E.G. Semiconducting Sn3O4 nanobelts: Growth and electronic structure. J. Appl. Phys. 2010, 107, 033717. [Google Scholar] [CrossRef]
  35. Zhang, W.; Zheng, M.; Li, F.; You, Y.; Jiang, D.; Yuan, H.; Ma, L.; Shen, W. SnOx/graphene anode material with multiple oxidation states for high-performance Li-ion batteries. Nanotechnology 2021, 32, 195407. [Google Scholar] [CrossRef]
  36. Xia, W.; Wang, H.; Zeng, X.; Han, J.; Zhu, J.; Zhou, M.; Wu, S. High-efficiency photocatalytic activity of type II SnO/ Sn3O4 heterostructures via interfacial charge transfer. Crystengcomm 2014, 16, 6841–6847. [Google Scholar] [CrossRef]
  37. Zeng, W.; Liu, Y.; Chen, G.; Zhan, H.; Mei, J.; Luo, N.; He, Z.; Tang, C. SnO- Sn3O4 heterostructural gas sensor with high response and selectivity to parts-per-billion-level NO2 at low operating temperature. RSC Adv. 2020, 10, 29843–29854. [Google Scholar] [CrossRef]
  38. Zeng, W.; Liu, Y.; Mei, J.; Tang, C.; Luo, K.; Li, S.; Zhan, H.; He, Z. Hierarchical SnO2– Sn3O4 heterostructural gas sensor with high sensitivity and selectivity to NO2. Sens. Actuators B Chem. 2019, 301, 127010. [Google Scholar] [CrossRef]
  39. Wu, J.; Xie, Y.; Du, S.; Ren, Z.; Yu, P.; Wang, X.; Wang, G.; Fu, H. Heterophase engineering of SnO2/ Sn3O4 drives enhanced carbon dioxide electrocatalytic reduction to formic acid. Sci. China Mater. 2020, 63, 2314–2324. [Google Scholar] [CrossRef]
  40. Huda, A.; Mahendra, I.P.; Ichwani, R.; Handoko, C.T.; Ngoc, H.M.; Yudono, B.; Bustan, M.D.; Gulo, F. High efficient visible-light activated photo catalytic semiconductor SnO2/ Sn3O4 heterostructure in direct blue 71 (DB71) degradation. Rasayan J. Chem. 2019, 12, 308–318. [Google Scholar] [CrossRef]
  41. Yang, R.; Ji, Y.; Li, Q.; Zhao, Z.; Zhang, R.; Liang, L.; Liu, F.; Chen, Y.; Han, S.; Yu, X.; et al. Ultrafine Si nanowires/ Sn3O4 nanosheets 3D hierarchical heterostructured array as a photoanode with high-efficient photoelectrocatalytic performance. Appl. Catal. B Environ. 2019, 256, 117798. [Google Scholar] [CrossRef]
  42. Jana, S.; Konar, S.; Mitra, B.C.; Mondal, A.; Mukhopadhyay, S. Fabrication of a new heterostructure Au/Pt/SnO2: An excellent catalyst for fast reduction of para-nitrophenol and visible light assisted photodegradation of dyes. Mater. Res. Bull. 2021, 141, 111351. [Google Scholar] [CrossRef]
  43. Chen, L.; Yue, S.; Wang, J.; Chen, W.; Zhang, Y.; Xie, M.; Han, W. Overall water splitting on surface-polarized Sn3O4 through weakening the trap of Sn(II) to holes. Appl. Catal. B Environ. 2021, 299, 120689. [Google Scholar] [CrossRef]
  44. Tsybulya, S.V.; Cherepanova, S.V.; Soloviyova, L.P. Polycrystal software package for IBM/PC. J. Struct. Chem. 1996, 37, 332–334. [Google Scholar] [CrossRef]
  45. Eckold, P.; Rolff, M.; Niewa, R.; Hügel, W. Synthesis, characterization and in situ Raman detection of Sn3O2(OH)2-xClx phases as intermediates in tin corrosion. Corros. Sci. 2015, 98, 399–405. [Google Scholar] [CrossRef]
  46. Gaur, L.K.; Chandra Mathpal, M.; Kumar, P.; Gairola, S.P.; Agrahari, V.; Martinez, M.A.R.; Aragon, F.F.H.; Soler, M.A.G.; Swart, H.C.; Agarwal, A. Observations of phonon anharmonicity and microstructure changes by the laser power dependent Raman spectra in Co doped SnO2 nanoparticles. J. Alloys Compd. 2020, 831, 154836. [Google Scholar] [CrossRef]
  47. Yu, K.N.; Xiong, Y.; Liu, Y.; Xiong, C. Microstructural change of nano-SnO2 grain assemblages with the annealing temperature. Phys. Rev. B 1997, 55, 2666. [Google Scholar] [CrossRef]
  48. Zaraska, L.; Gawlak, K.; Wiercigroch, E.; Malek, K.; Kozieł, M.; Andrzejczuk, M.; Marzec, M.M.; Jarosz, M.; Brzózka, A.; Sulka, G.D. The effect of anodizing potential and annealing conditions on the morphology, composition and photoelectrochemical activity of porous anodic tin oxide films. Electrochim. Acta 2019, 319, 18–30. [Google Scholar] [CrossRef]
  49. Ilka, M.; Bera, S.; Kwon, S.H. Influence of surface defects and size on photochemical properties of SnO2 nanoparticles. Materials 2018, 11, 904. [Google Scholar] [CrossRef]
  50. Kar, A.; Olszówka, J.; Sain, S.; Sloman, S.R.I.; Montes, O.; Fernández, A.; Pradhan, S.K.; Wheatley, A.E.H. Morphological effects on the photocatalytic properties of SnO2 nanostructures. J. Alloys Compd. 2019, 810, 151718. [Google Scholar] [CrossRef]
  51. Liu, L.Z.; Wu, X.L.; Gao, F.; Shen, J.C.; Li, T.H.; Chu, P.K. Determination of surface oxygen vacancy position in SnO2 nanocrystals by Raman spectroscopy. Solid State Commun. 2011, 151, 811–814. [Google Scholar] [CrossRef]
  52. Wang, D.; Lin, Z.; Miao, C.; Jiang, W.; Li, H.; Liu, C.; Che, G. An S-scheme photocatalyst constructed by modifying Ni-doped Sn3O4 micro-flowers on g-C3N4 nanosheets for enhanced visible-light-driven hydrogen evolution. J. Ind. Eng. Chem. 2022, 113, 380–388. [Google Scholar] [CrossRef]
  53. Babu, B.; Neelakanta Reddy, I.; Yoo, K.; Kim, D.; Shim, J. Bandgap tuning and XPS study of SnO2 quantum dots. Mater. Lett. 2018, 221, 211–215. [Google Scholar] [CrossRef]
  54. Sun, M.; Su, Y.; Du, C.; Zhao, Q.; Liu, Z. Self-doping for visible light photocatalytic purposes: Construction of SiO2/SnO2/SnO2:Sn2+ nanostructures with tunable optical and photocatalytic performance. RSC Adv. 2014, 4, 30820–30827. [Google Scholar] [CrossRef]
  55. Davar, F.; Salavati-Niasari, M.; Fereshteh, Z. Synthesis and characterization of SnO2 nanoparticles by thermal decomposition of new inorganic precursor. J. Alloys Compd. 2010, 496, 638–643. [Google Scholar] [CrossRef]
  56. Chuvenkova, O.A.; Domashevskaya, E.P.; Ryabtsev, S.V.; Yurakov, Y.A.; Popov, A.E.; Koyuda, D.A.; Nesterov, D.N.; Spirin, D.E.; Ovsyannikov, R.Y.; Turishchev, S.Y. XANES and XPS investigations of surface defects in wire-like SnO2 crystals. Phys. Solid State 2015, 57, 153–161. [Google Scholar] [CrossRef]
  57. Nagasawa, Y.; Choso, T.; Karasuda, T.; Shimomura, S.; Ouyang, F.; Tabata, K.; Yamaguchi, Y. Photoemission study of the interaction of a reduced thin film SnO2 with oxygen. Surf. Sci. 1999, 433, 226–229. [Google Scholar] [CrossRef]
  58. Gribov, E.N.; Koshevoy, E.I.; Chikunova, I.O.; Parmon, V.N. Template-Assisted SnO2: Synthesis, Composition, and Photoelectrocatalytical Properties. Catalysts 2023, 13, 168. [Google Scholar] [CrossRef]
  59. Hankin, A.; Bedoya-Lora, F.E.; Alexander, J.C.; Regoutz, A.; Kelsall, G.H. Flat band potential determination: Avoiding the pitfalls. J. Mater. Chem. A 2019, 7, 26162–26176. [Google Scholar] [CrossRef]
  60. Koshevoy, E.; Gribov, E.; Polskikh, D.; Lyulyukin, M.; Solovyeva, M.; Cherepanova, S.; Kozlov, D.; Selishchev, D. Photoelectrochemical Methods for Determination of Flat-Band Potential in Semiconducting Photocatalysts: A Comparison Study. Langmuir 2023, 39, 13466–13480. [Google Scholar] [CrossRef]
  61. Patel, M.Y.; Mortelliti, M.J.; Dempsey, J.L. A compendium and meta-analysis of flatband potentials for TiO2, ZnO, and SnO2 semiconductors in aqueous media. Chem. Phys. Rev. 2022, 3, 011303. [Google Scholar] [CrossRef]
  62. Liu, Y.S.; Yamaguchi, A.; Yang, Y.; Aisnada, A.N.E.; Uchida, S.; Abe, H.; Ueda, S.; Yamaguchi, K.; Tanabe, T.; Miyauchi, M. Synthesis and Characterization of the Orthorhombic Sn3O4 Polymorph. Angew. Chem. Int. Ed. Engl. 2023, 62, e202300640. [Google Scholar] [CrossRef] [PubMed]
  63. Fajrina, N.; Tahir, M. A critical review in strategies to improve photocatalytic water splitting towards hydrogen production. Int. J. Hydrogen Energy 2019, 44, 540–577. [Google Scholar] [CrossRef]
  64. Corredor, J.; Rivero, M.J.; Rangel, C.M.; Gloaguen, F.; Ortiz, I. Comprehensive review and future perspectives on the photocatalytic hydrogen production. J. Chem. Technol. Biotechnol. 2019, 94, 3049–3063. [Google Scholar] [CrossRef]
  65. Chen, W.-T.; Chan, A.; Al-Azri, Z.H.N.; Dosado, A.G.; Nadeem, M.A.; Sun-Waterhouse, D.; Idriss, H.; Waterhouse, G.I.N. Effect of TiO2 polymorph and alcohol sacrificial agent on the activity of Au/TiO2 photocatalysts for H2 production in alcohol–water mixtures. J. Catal. 2015, 329, 499–513. [Google Scholar] [CrossRef]
  66. Kohl, D. Surface processes in the detection of reducing gases with SnO2-based devices. Sens. Actuators 1989, 18, 71–113. [Google Scholar] [CrossRef]
  67. Xu, W.; Raftery, D.; Francisco, J.S. Effect of Irradiation Sources and Oxygen Concentration on the Photocatalytic Oxidation of 2-Propanol and Acetone Studied by in Situ FTIR. J. Phys. Chem. B 2003, 107, 4537–4544. [Google Scholar] [CrossRef]
  68. Gu, Q.; Fu, X.; Wang, X.; Chen, S.; Leung, D.Y.C.; Xie, X. Photocatalytic reforming of C3-polyols for H2 production. Appl. Catal. B Environ. 2011, 106, 689–696. [Google Scholar] [CrossRef]
  69. Li, L.; Guo, W.; Zhu, Y.; Wu, Y. Hydrogen production by photoelectrochemically splitting solutions of formic acid. ChemSusChem 2011, 4, 1475–1480. [Google Scholar] [CrossRef]
  70. Zielinska, B.; Borowiakpalen, E.; Kalenczuk, R. Photocatalytic hydrogen generation over alkaline-earth titanates in the presence of electron donors. Int. J. Hydrogen Energy 2008, 33, 1797–1802. [Google Scholar] [CrossRef]
Figure 1. (a) XRD patterns. Bars show reflections and relative intensities of SnO2 (black) and Sn3O4 (red) phases. Indexes of main reflections are also presented; (b) Raman shifts in the wavenumber range of 60–270 cm−1 (left) and 400–900 cm−1 (right). Greek letters indicate phases found: α—Sn3O4, β—SnO2, γ—SnO, δ—Sn3IIO2(OH)2 [45], ε—SnO2; (c) Spectra of DRS (left), Kubelka–Munk transformed (right) and Tauc plots (inset); (d) XPS spectra in Sn3d (left) and O1s (right) regions.
Materials 16 07300 g001
Figure 2. High-resolution TEM microphotographs of TO3 sample in low (left) and high (right) resolution.
Materials 16 07300 g002
Figure 3. (a) MS plot obtained for TO1 sample; (b) Dependence of the open-circuit potential on the light intensity (OCP method) in pure electrolyte (full symbols) and with the addition of ethanol (empty symbols). The errors in determining potentials are ± 15 mV for all samples; (c) POP method for TO1 sample in pure electrolyte; (d) Potential values of the conduction band (CB), calculated valence band (VB) and potential levels, obtained by POP and OCP methods in pure electrolyte and with the addition of ethanol (Et).
Materials 16 07300 g003
Figure 4. Photocurrents density in the electrooxidation of various organic substrates at a potential of 1 V RHE under (a) UV illumination (λ = 370 nm) and (b) visible light illumination (λ = 450 nm). Electrolyte—1 M Na2SO4 + 0.1 M organic substrate.
Materials 16 07300 g004
Figure 5. Dependence of photocurrents density in ultraviolet light regions on the difference in the oxidation potentials of organic substrates (E0ox) and the valence band of the samples (EVB). Symbols and colors indicate the following samples: red squares—TO1, olive circles—TO2, blue triangles—TO3, black inverted triangles—TO4. Photocurrents of formic acid are not shown here.
Materials 16 07300 g005
Table 1. Surface chemical composition of the samples according to decomposition of XPS spectra.
Sample Sn2+, % 1Sn4+, % 1O1, % 2O2, % 2Surface Composition
TO154468119SnO1.25
TO23862946SnO1.3
TO32872919SnO1.43
TO4010081 319 4SnO1.88
1 In relation to the Sn content, 2 In relation to the O content, 3 Lattice oxygen, 4 Defective oxygen.
Table 2. Results obtained with XRD, DRS and low-temperature nitrogen adsorption methods. The phase composition was estimated from the ratio of the integral intensities of the diffraction maxima (111) for Sn3O4 and (110) for SnO2.
SampleCSR 1, nmPhase Composition, %Band-Gap Width, eVSBET 2, m2/gVpore 3, cm3/g
Sn3O4SnO2Sn3O4SnO2
TO127-10002.9438.50.077
TO224946542.64630.131
TO3125.538622.8695.90.098
TO4-301003.982.050.008
1 Coherent scattering region; 2 specific surface area determined by Brunauer–Emmet–Teller method; 3 specific pore volume.
Table 3. Values of potentials (V vs. RHE) measured by MS (EMS), POP (EPOP) and OCP (EOCP) methods as well as EFB values corresponding to EPOP obtained in ethanol-containing electrolyte EPOP(Et).
SampleEMS, V EPOP, VEOCP, VEFB, V
TO1−0.06 ± 0.02−0.380.127−0.42
TO1 + EtOH−0.04 ± 0.02−0.42−0.133
TO2−0.04 ± 0.04−0.390.163−0.44
TO2 + EtOH−0.01 ± 0.03−0.44−0.155
TO30.04 ± 0.03−0.140.191−0.44
TO3 + EtOH0.01 ± 0.03−0.44−0.131
TO4−0.11 ± 0.03−0.050.295−0.15
TO4 + EtOH−0.26 ± 0.04−0.150.121
Disclaimer/Publisher’s Note: The statements, opinions and data contained in all publications are solely those of the individual author(s) and contributor(s) and not of MDPI and/or the editor(s). MDPI and/or the editor(s) disclaim responsibility for any injury to people or property resulting from any ideas, methods, instructions or products referred to in the content.

