
Equivalent Heat Treatments and Mechanical Properties in Cold-Rolled TiNiFe Shape-Memory Alloys

 and
and
Abstract
:1. Introduction
2. Materials and Methods
3. Recrystallization Model Results
4. Results and Discussion
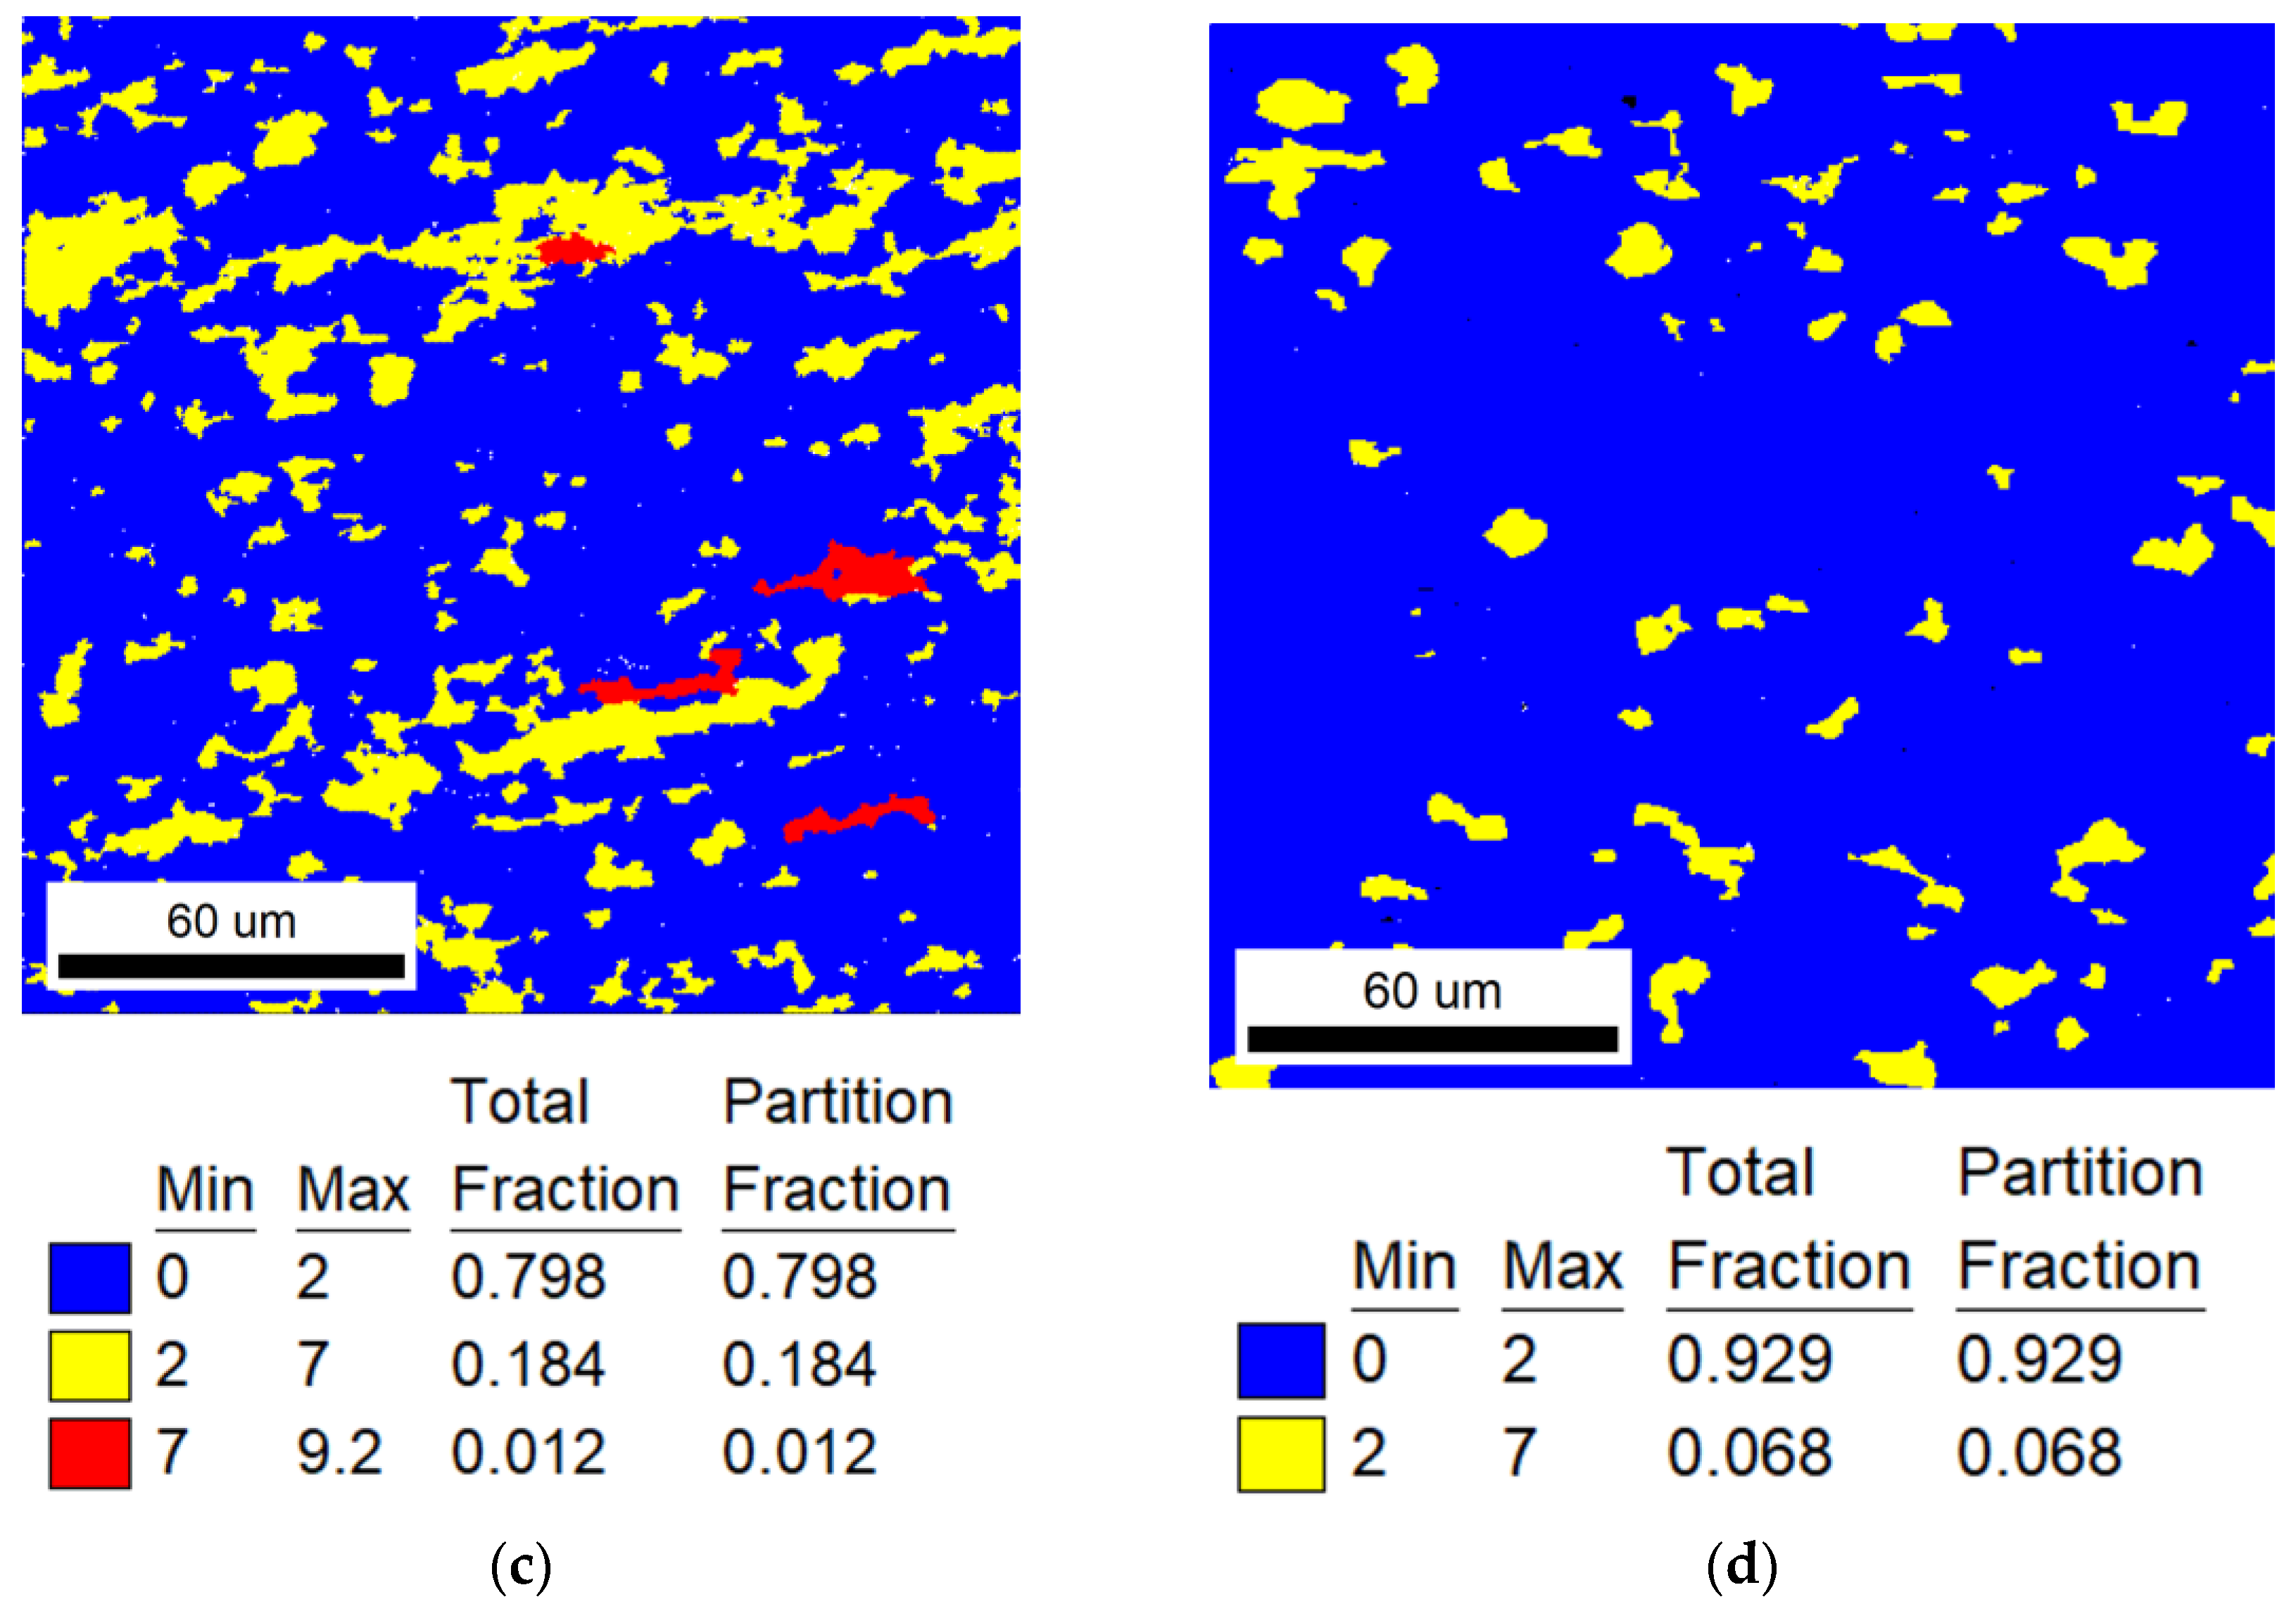
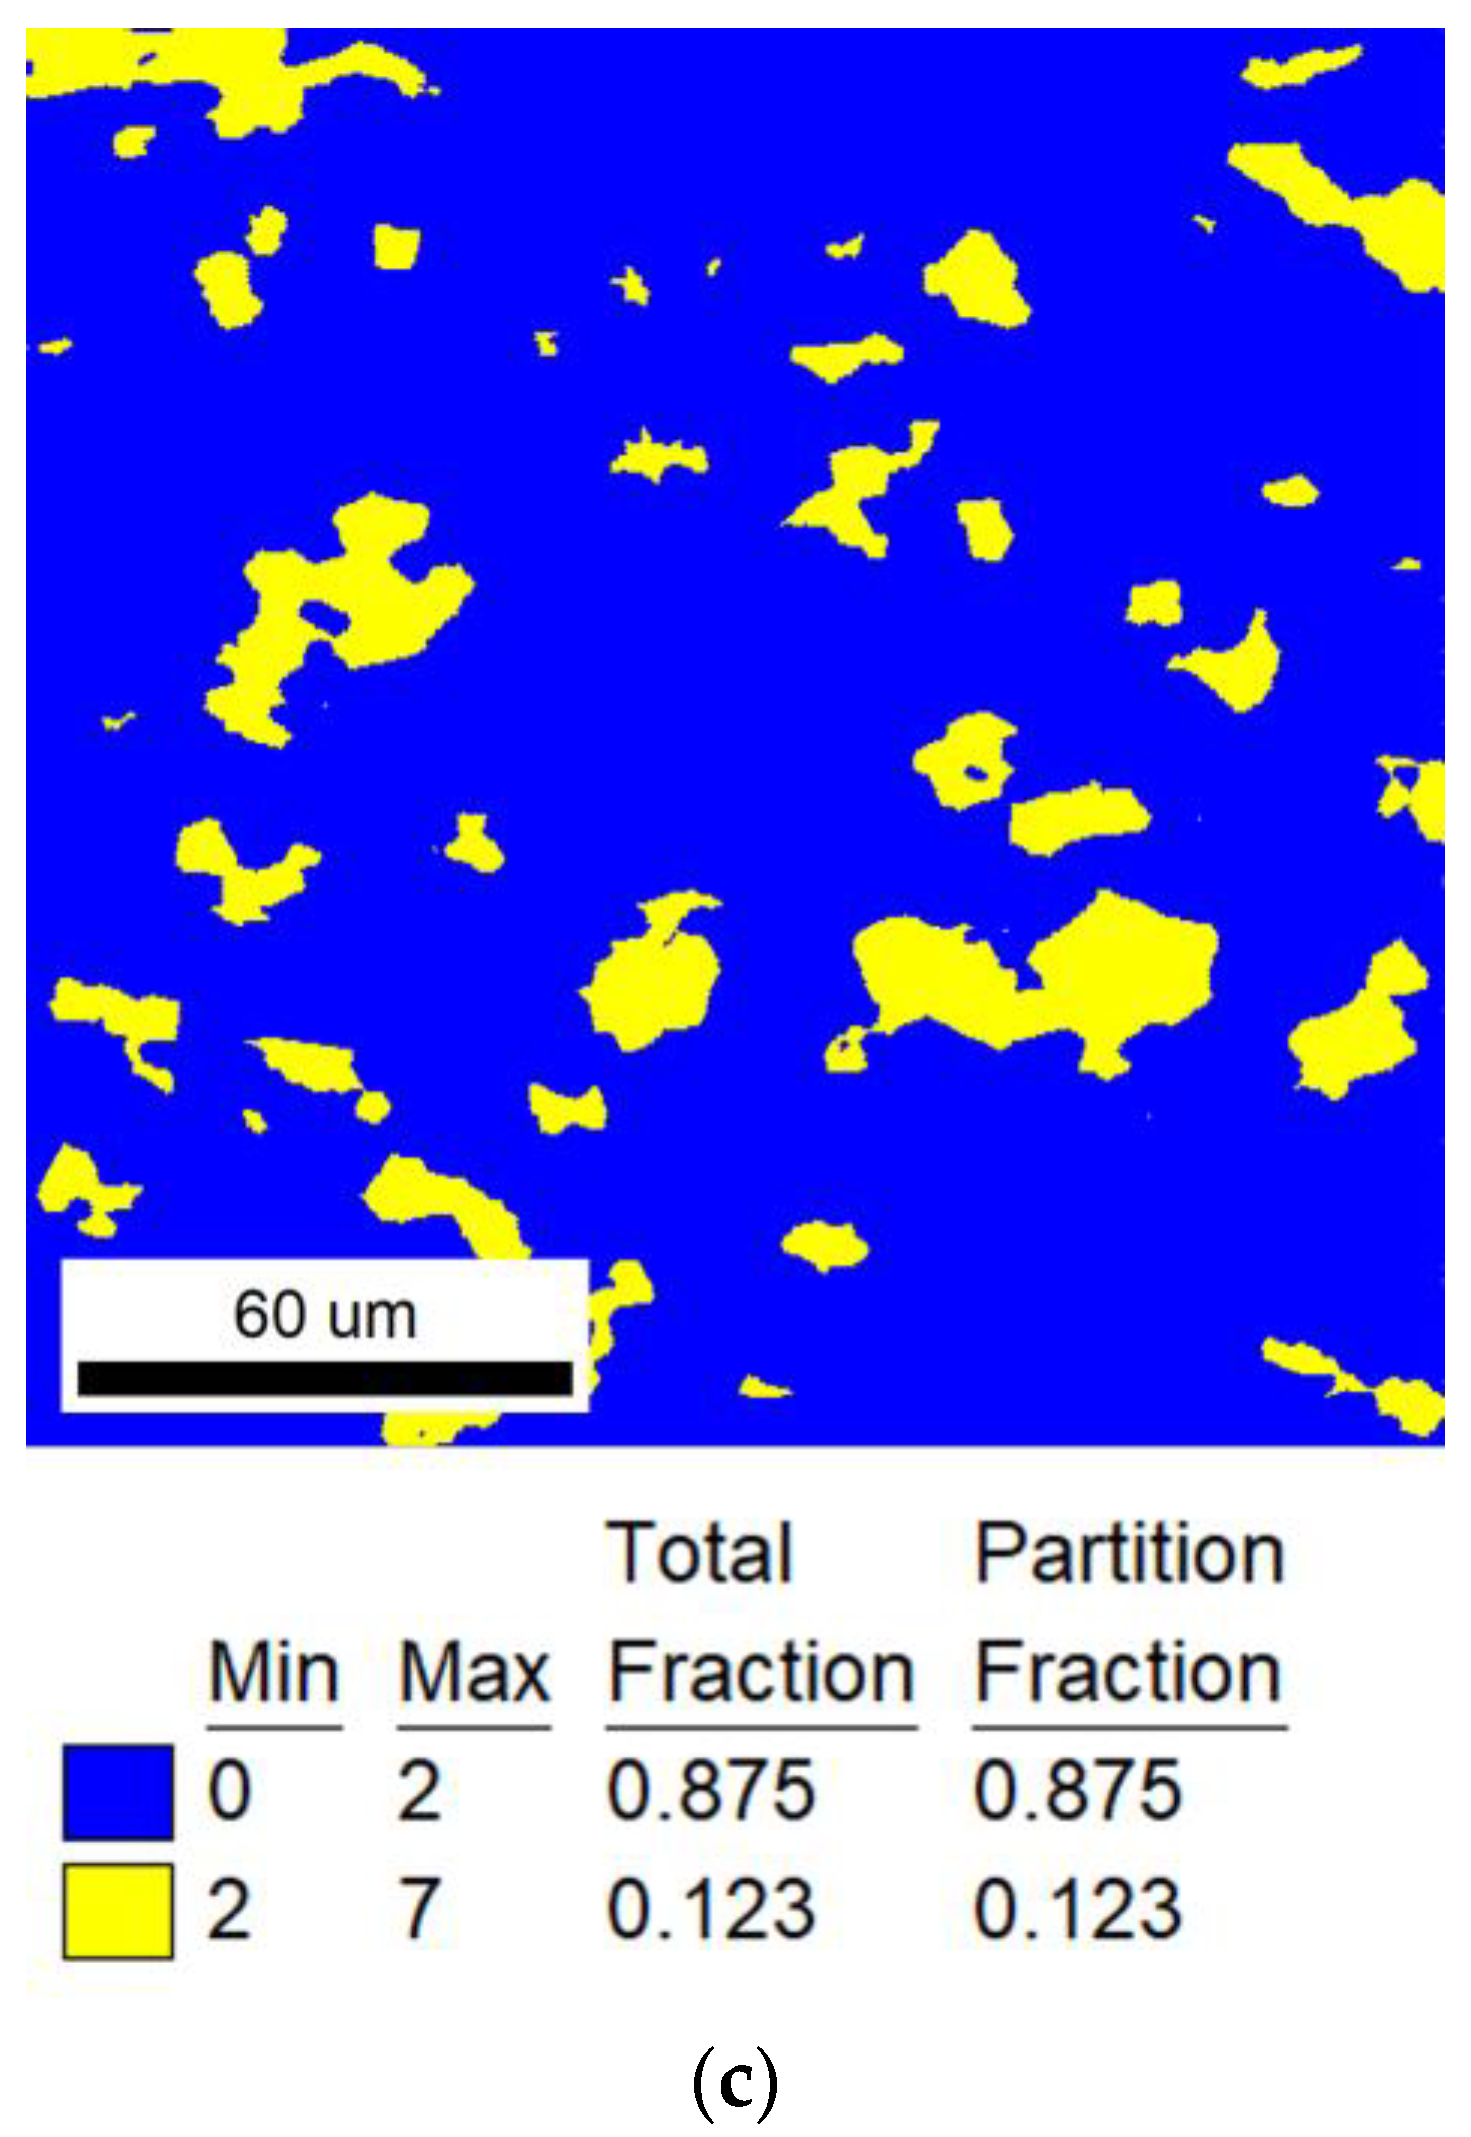
4.1. Analysis of the Recrystallization Process
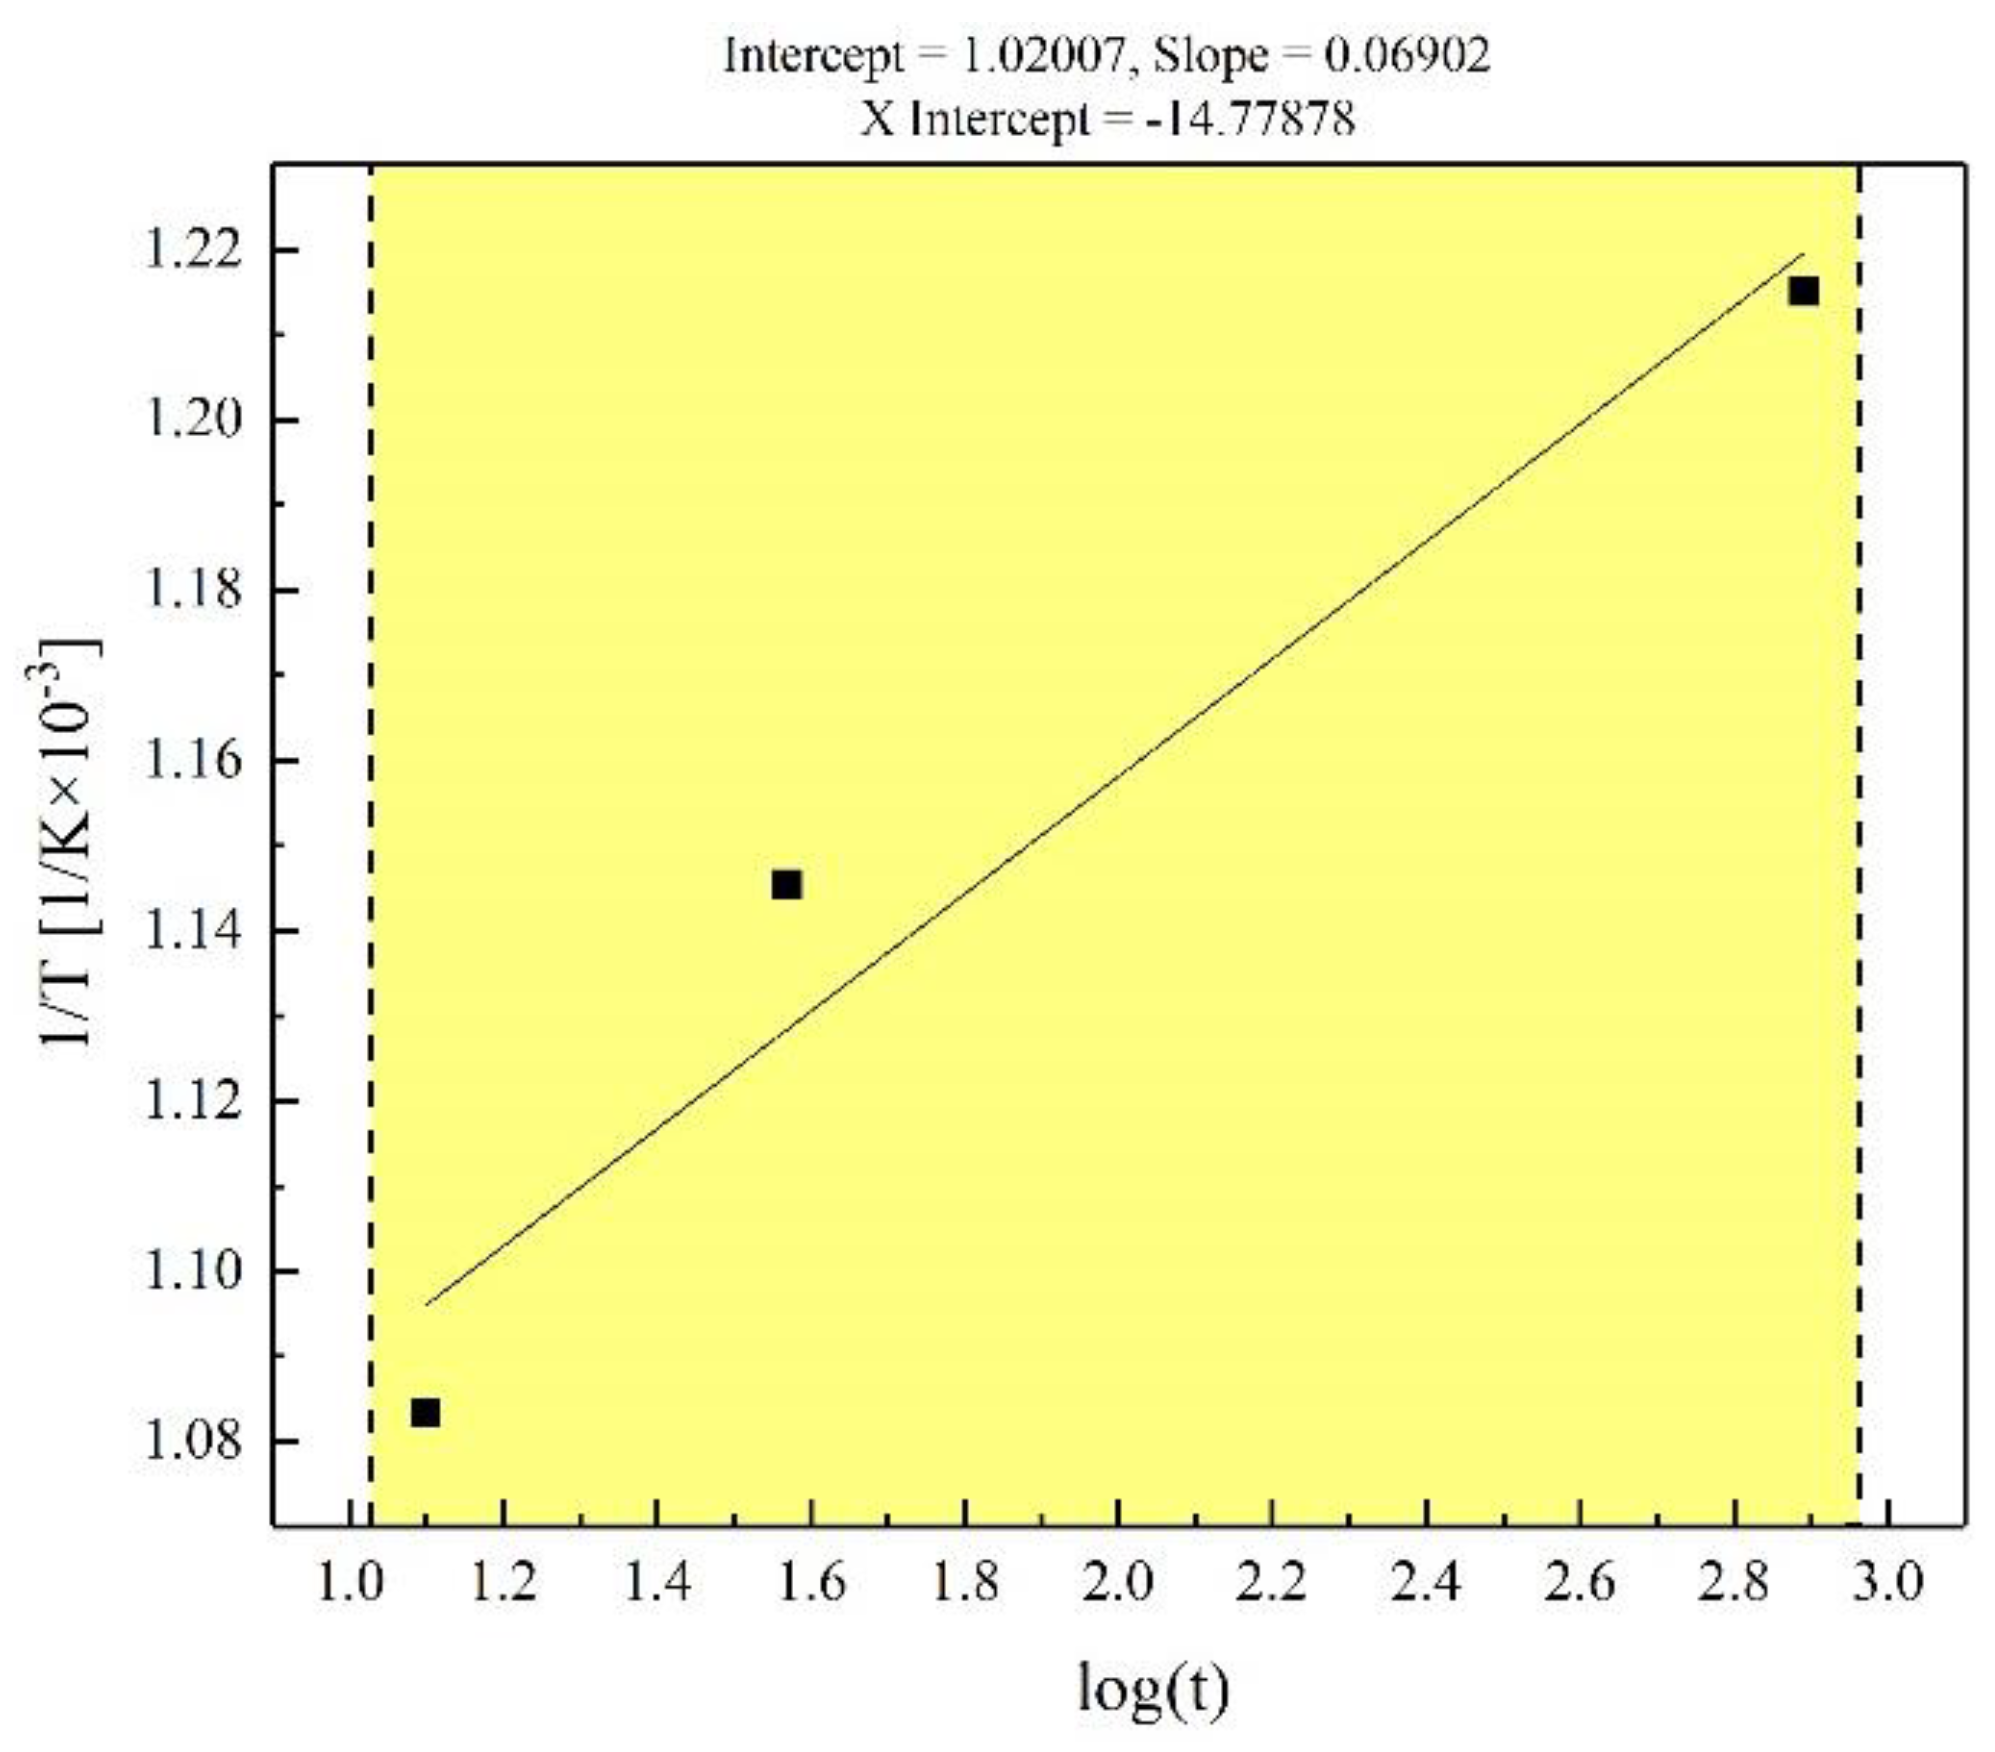
4.2. Application of the Recrystallization Model
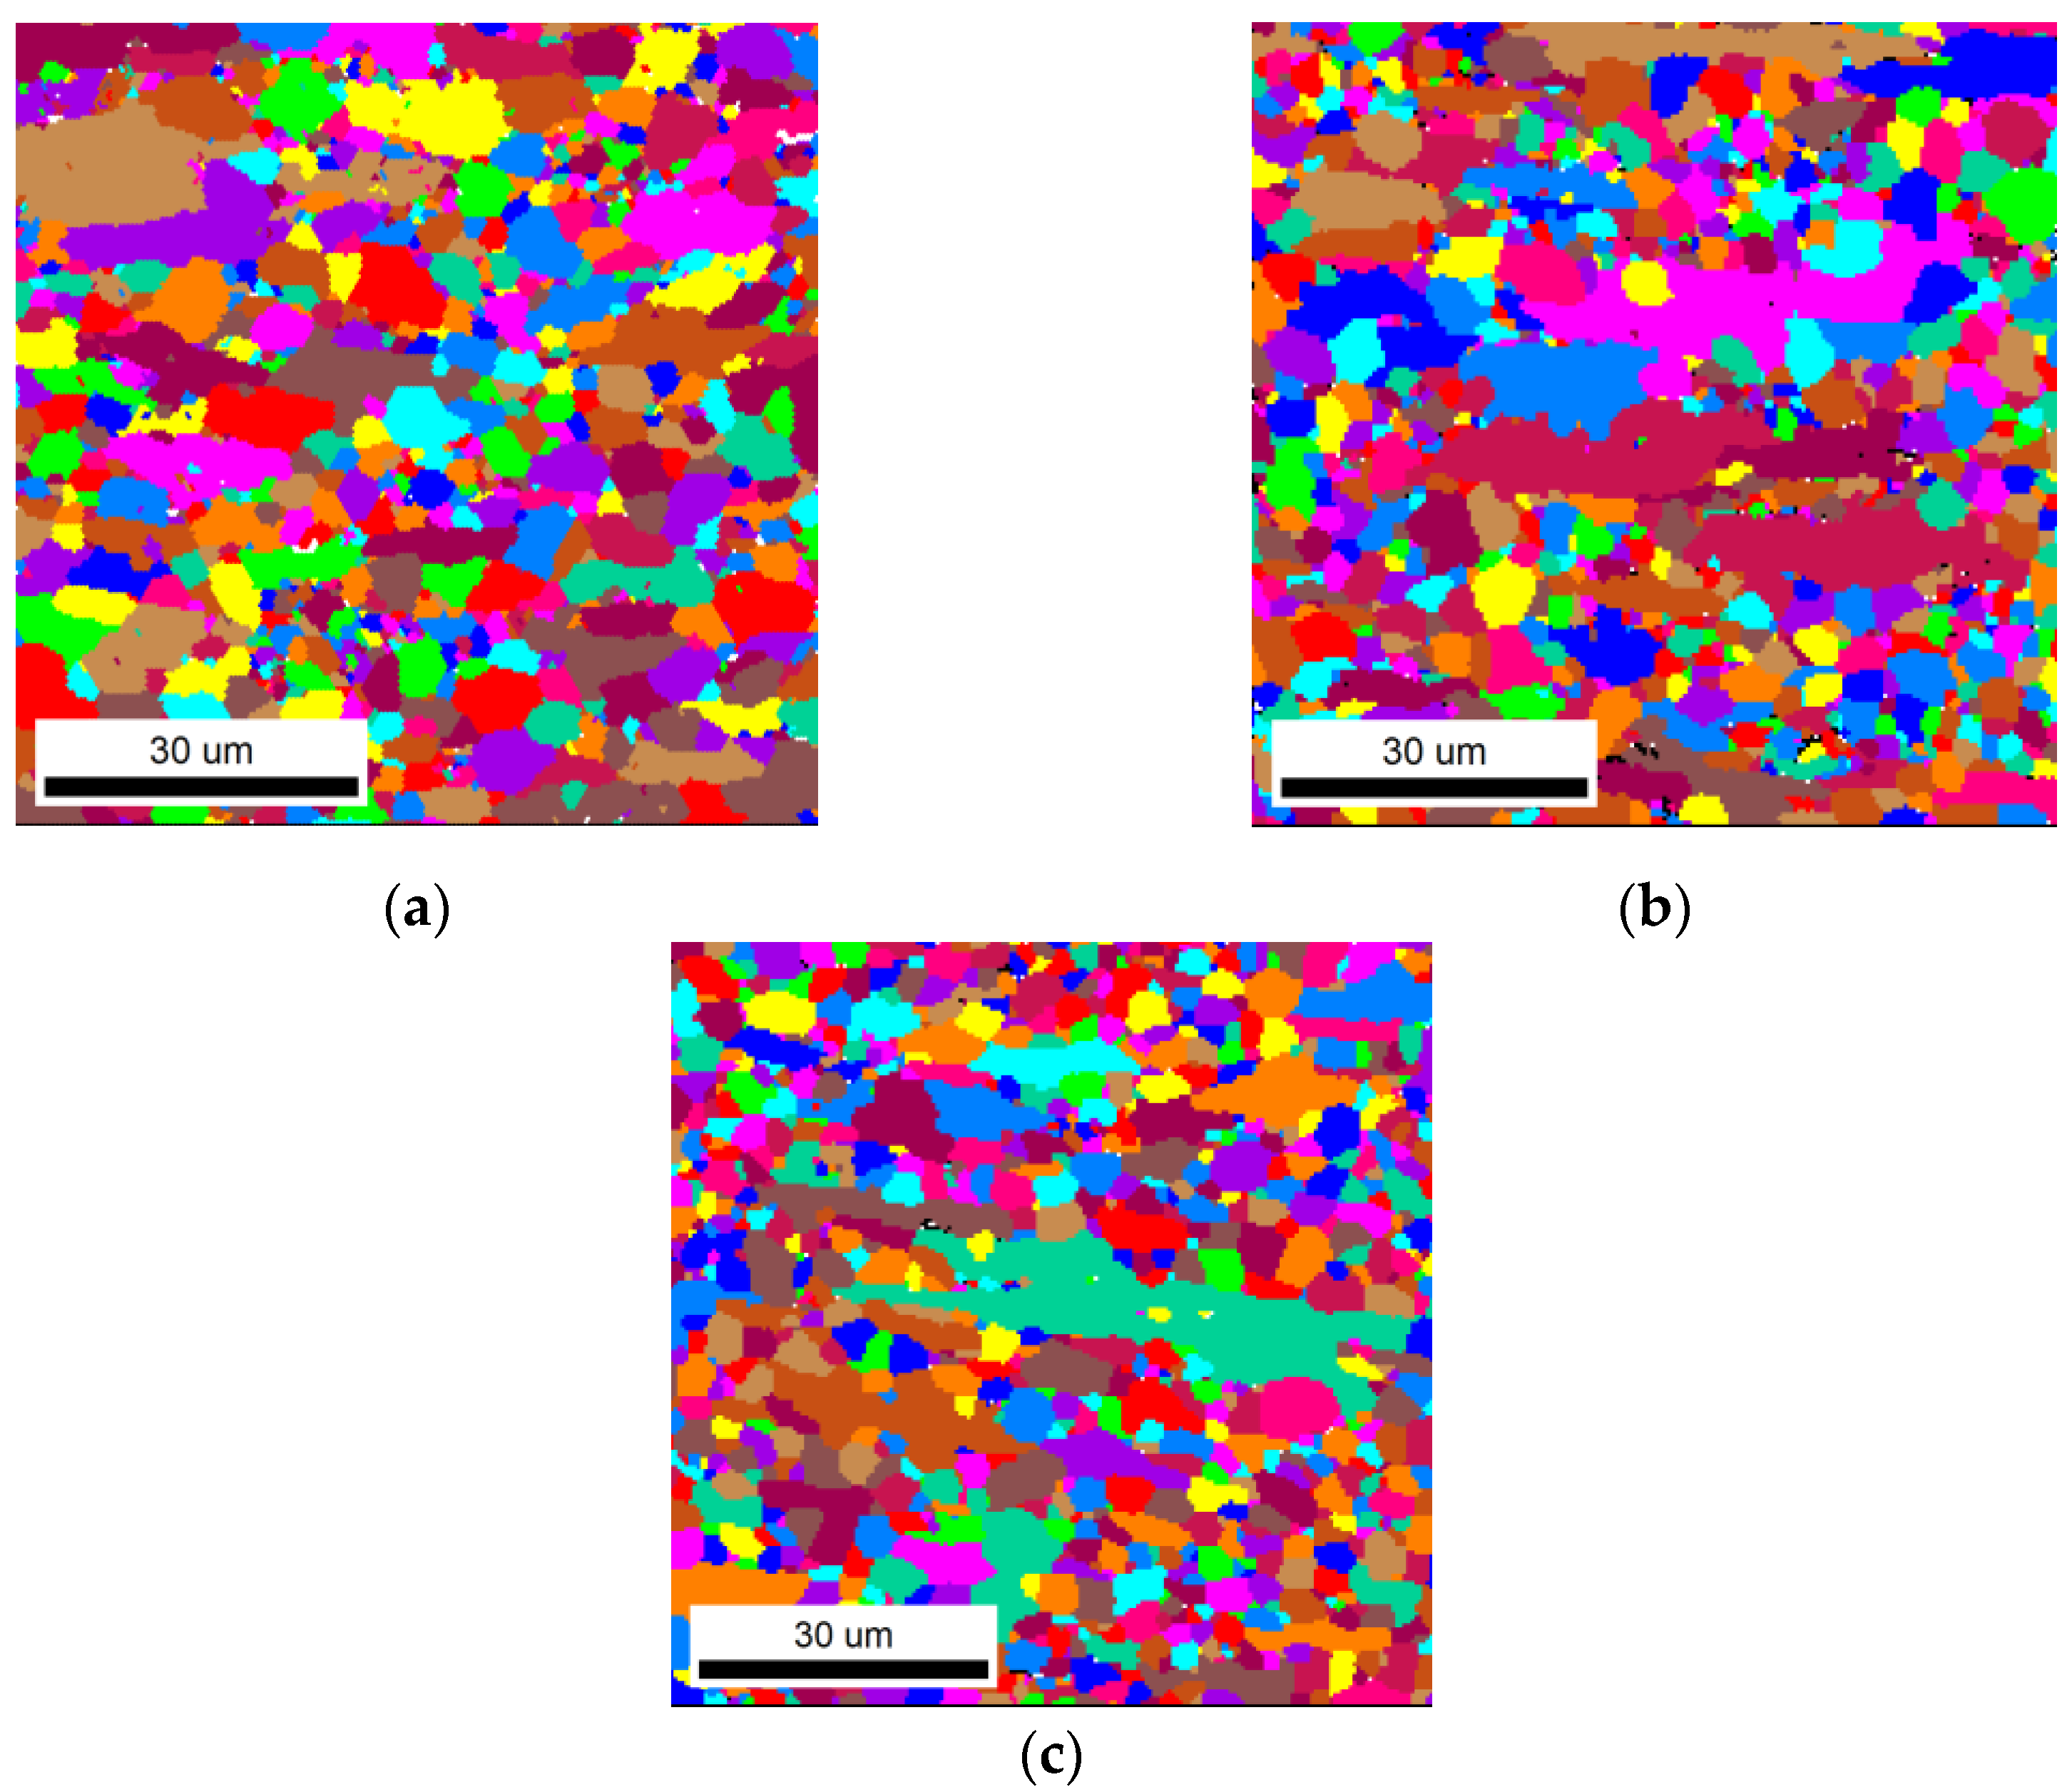
4.3. Model Validation
5. Conclusions
- 1.
- The formula for obtaining similar microstructures at different constant heat−treatment temperatures of TiNiFe alloys can be formed as Equation (12).
- 2.
- We analyzed and established prediction formulas for the microstructure of cold−rolled TiNiFe alloys at commonly used annealing temperatures (823 K, 873 K and 923 K), providing theoretical guidance for calculating the microstructure at different annealing times at commonly used heat−treatment temperatures.
- 3.
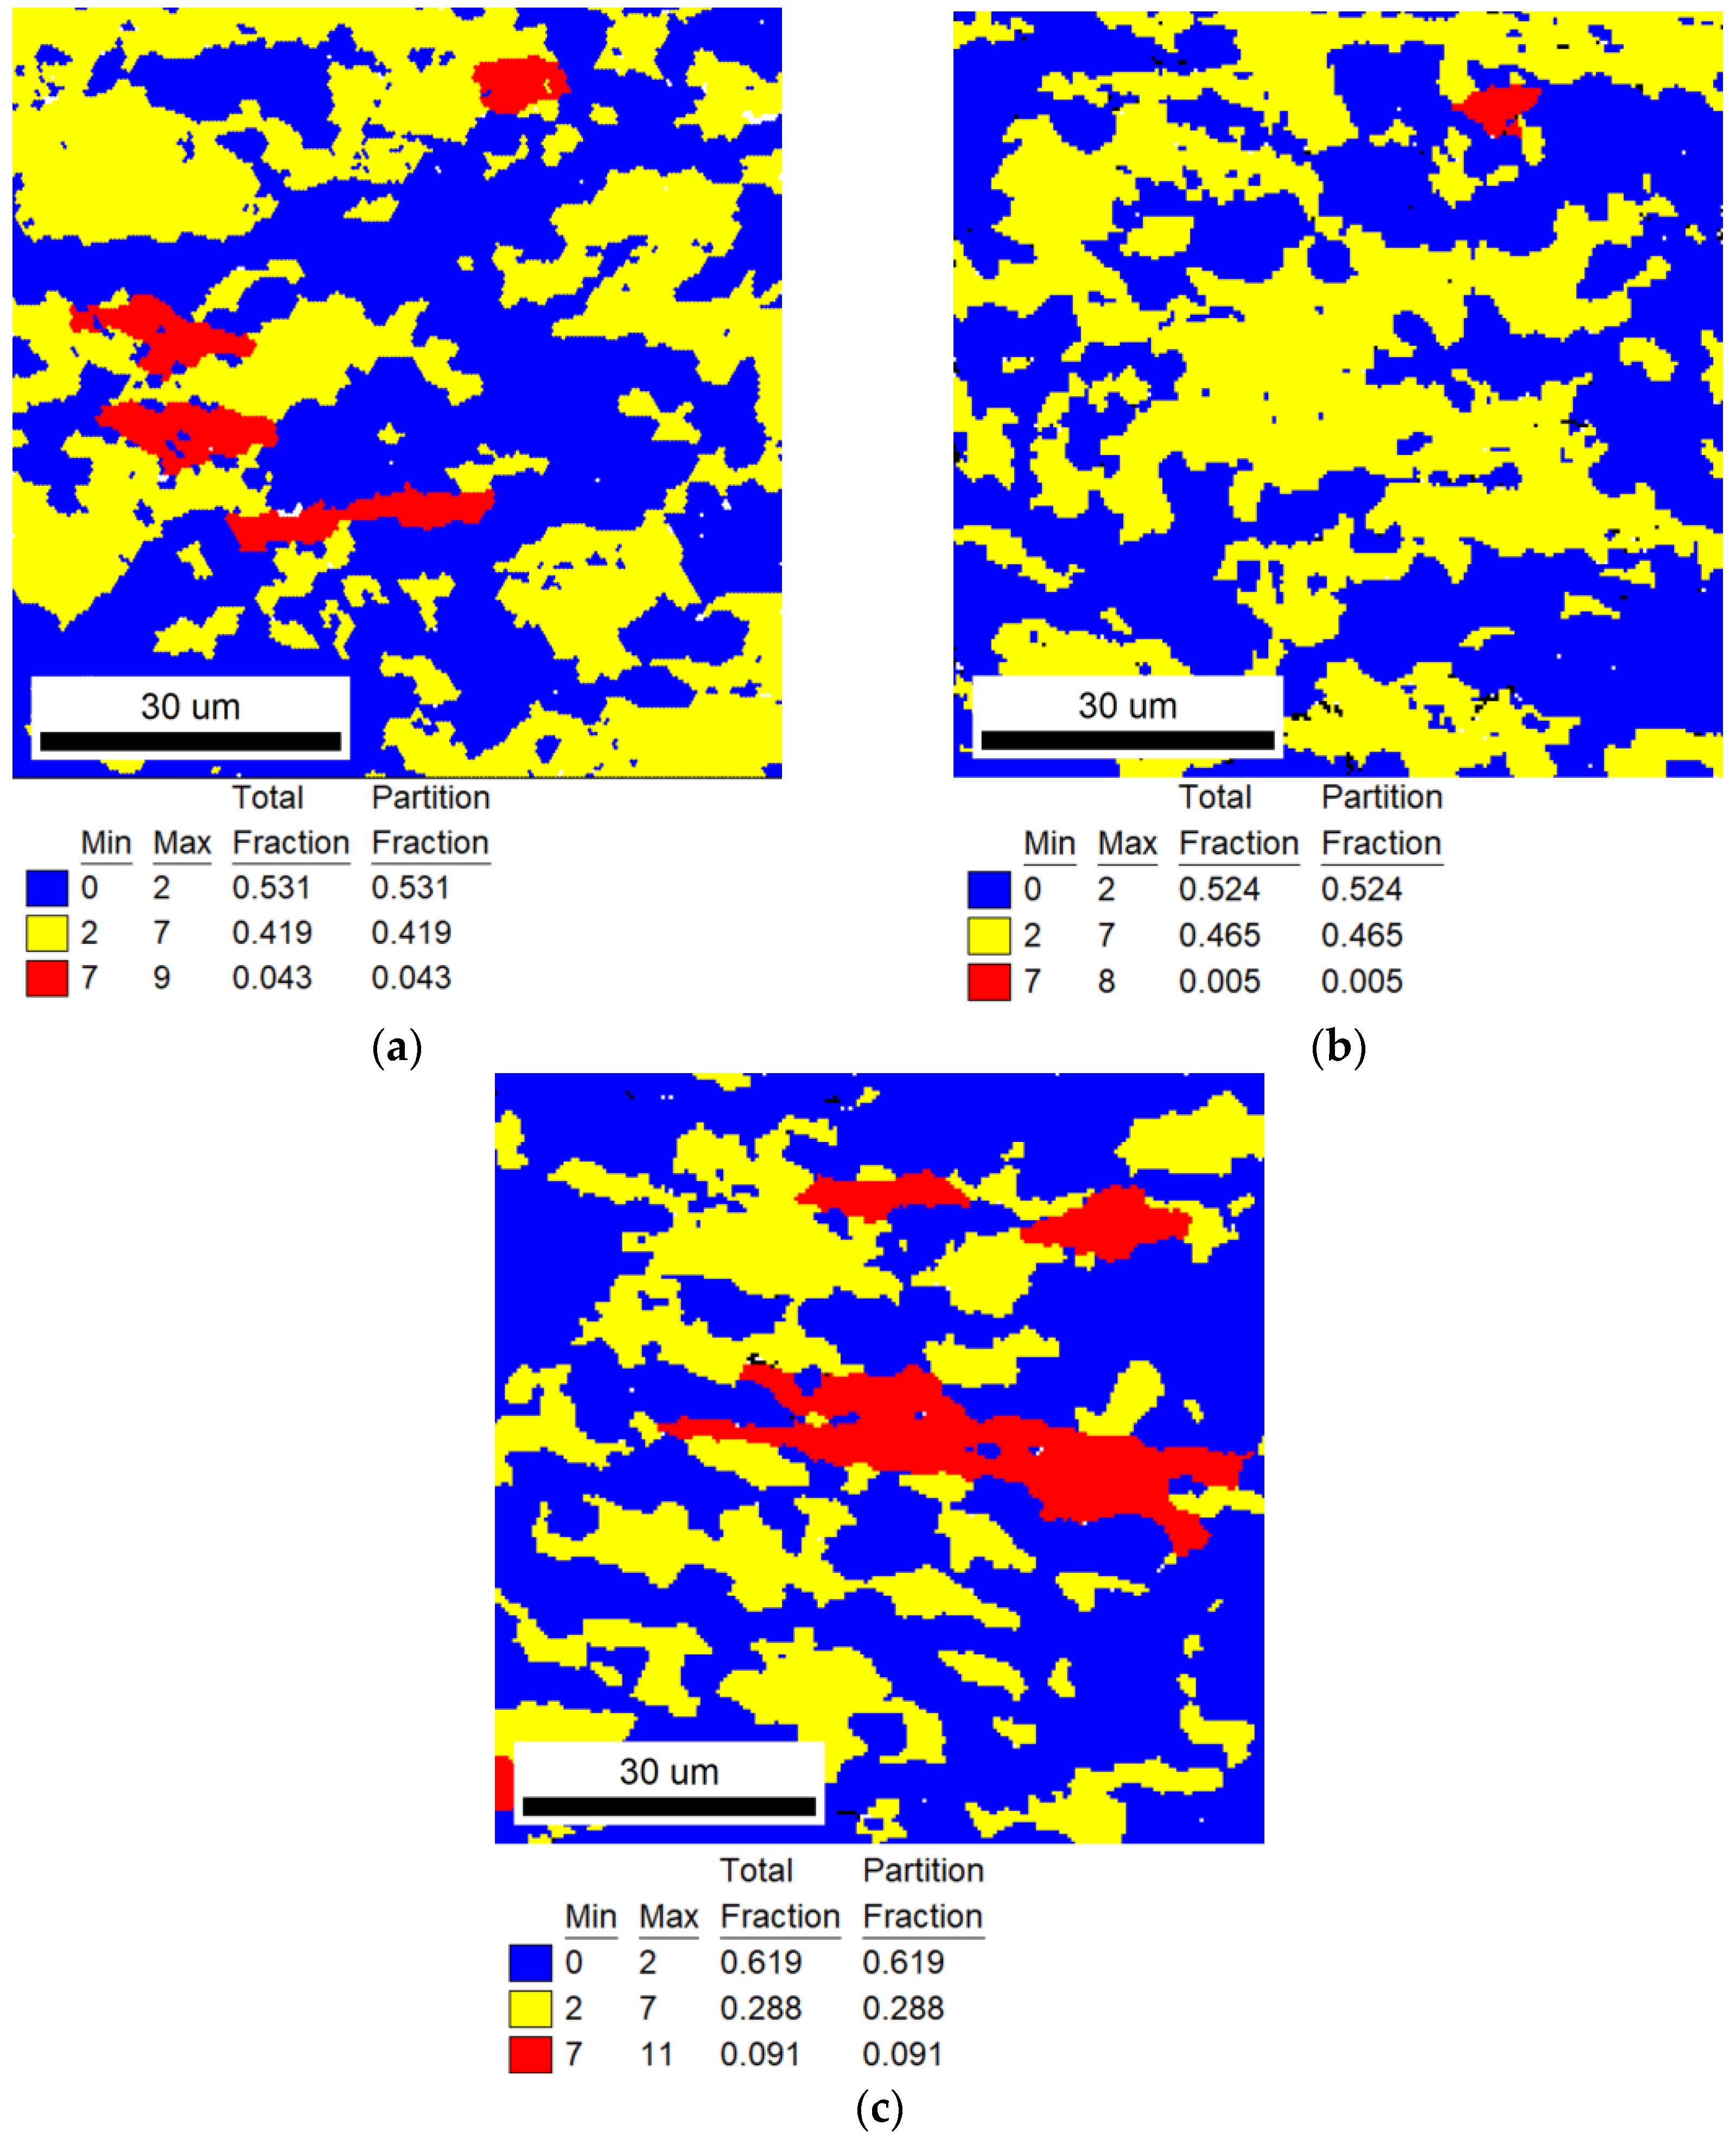
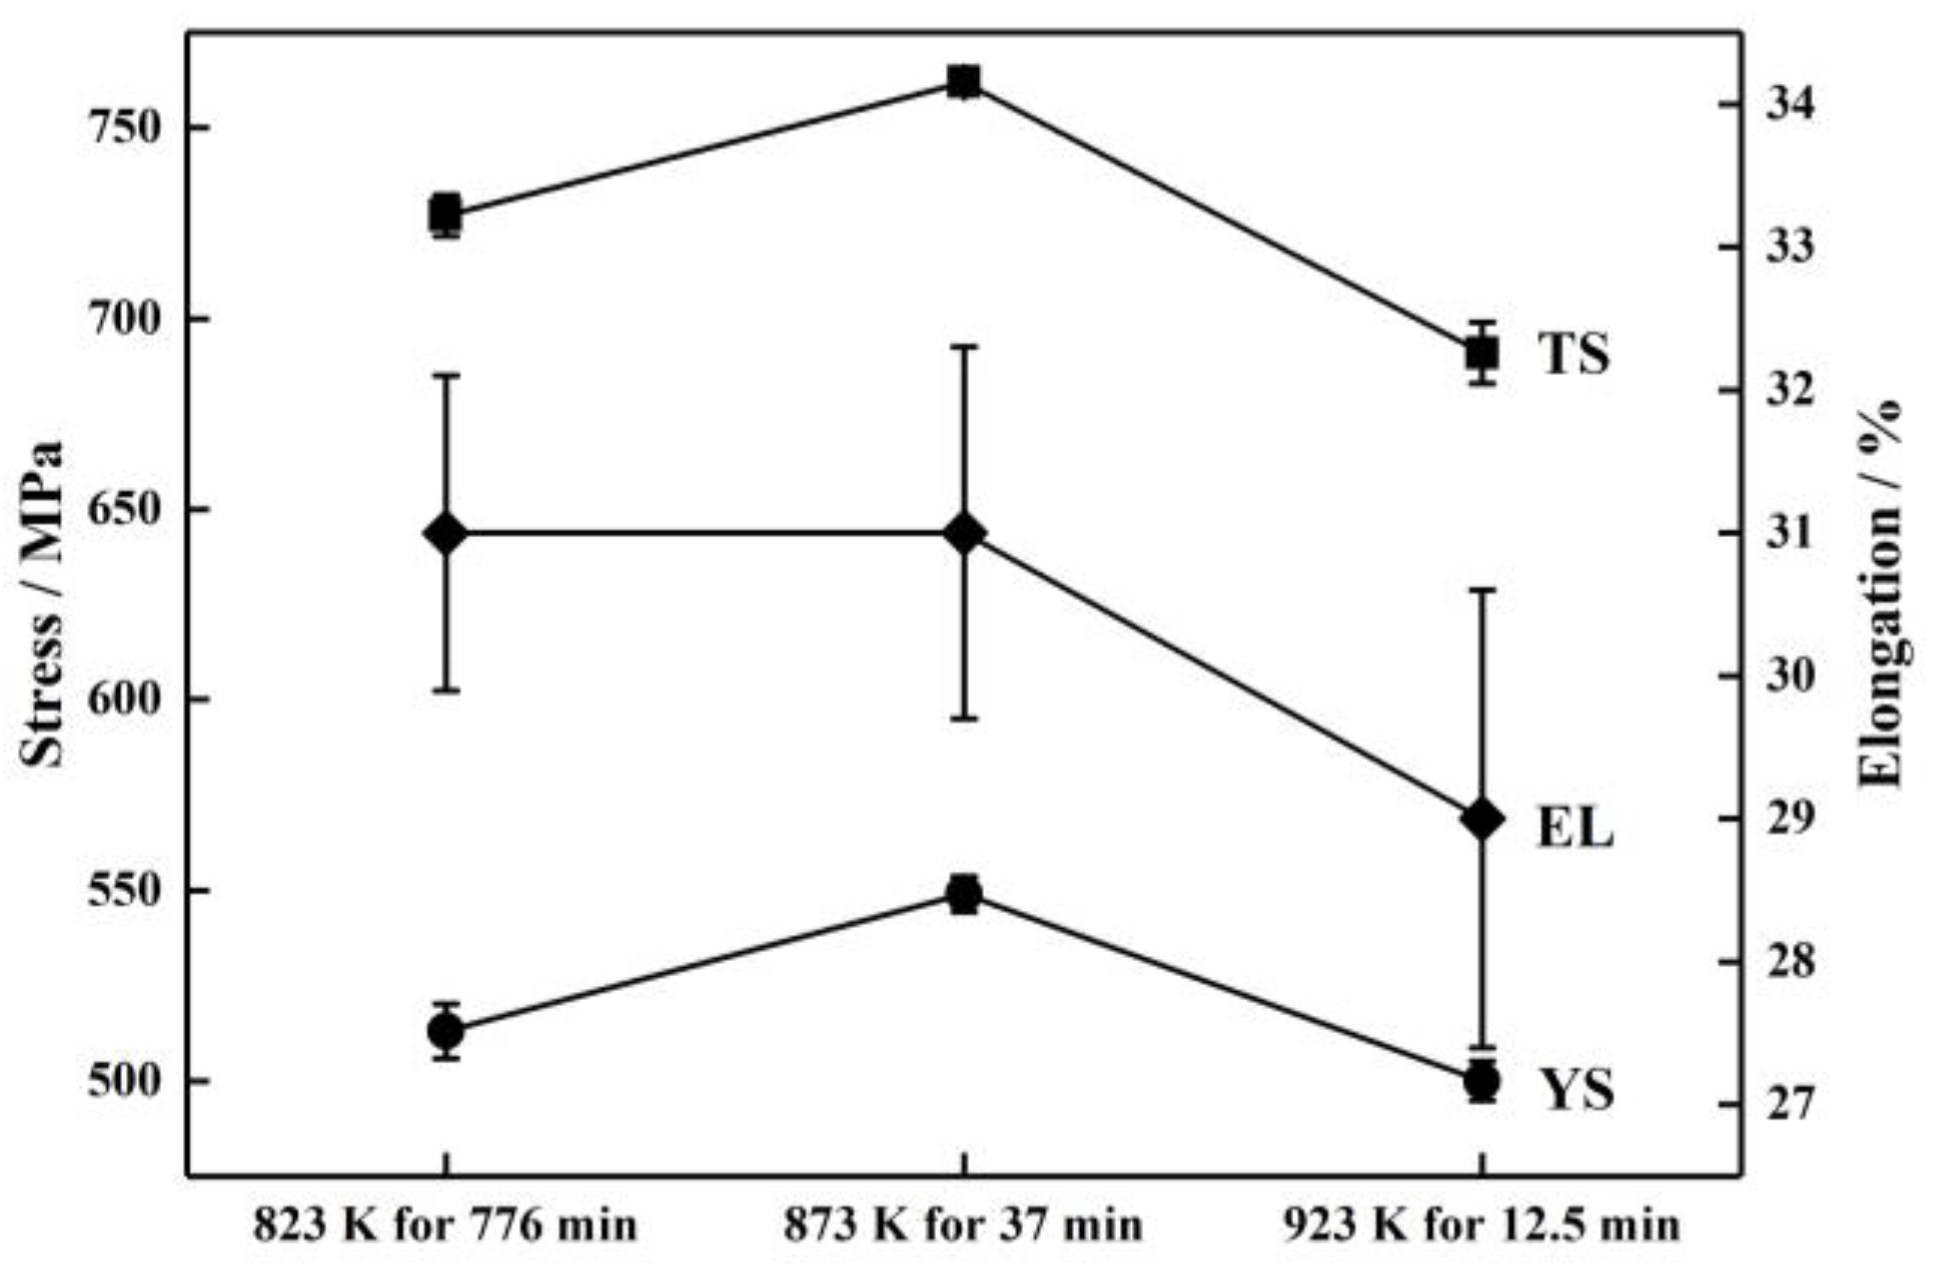
- After the calculated annealing treatment, cold−rolled TiNiFe alloy sheets have similar microstructures and properties but the sample annealed at 873 K for 37 min has superior microstructures (average grain size is 4.2 μm) and properties (superior TS, YS, EL and recovery stress). Considering the feasibility of the annealing process, annealing at 873 K for 37 min is the optimal annealing process for obtaining a 50% recrystallized structure.
Author Contributions
Funding
Institutional Review Board Statement
Informed Consent Statement
Data Availability Statement
Conflicts of Interest
References
- Otsuka, K.; Ren, X. Physical metallurgy of Ti-Ni-based shape memory alloys. Prog. Mater. Sci. 2005, 50, 511–678. [Google Scholar] [CrossRef]
- Cai, W.; Meng, X.L.; Zhao, L.C. Recent development of Ti-Ni-based shape memory alloys. Curr. Opin. Solid State Mater. Sci. 2005, 9, 296–302. [Google Scholar] [CrossRef]
- Otsuka, K.; Ren, X. Recent Developments in the research of shape memory alloys. Intermetallics 1999, 7, 511–528. [Google Scholar] [CrossRef]
- Mao, S.C.; Li, H.X.; Liu, Y.; Deng, Q.S.; Wang, L.H.; Zhang, Y.F.; Zhang, Z.; Han, X.D. Stress-induced martensitic transformation in nanometric NiTi shape memory alloy strips: An in situ TEM study of the thickness/size effect. J. Alloys Compd. 2013, 579, 100–111. [Google Scholar] [CrossRef]
- Chen, C.H.; Wu, S.K. Martensitic transformation and pseudoelasticity of aged Ti50.1Ni49.7Si0.2 shape memory ribbon. Mater Sci. Eng. A 2014, 593, 85–91. [Google Scholar] [CrossRef]
- Xu, K.F.; Luo, J.; Li, C.; Shen, Y.L.; Li, C.J.; Ma, X.; Li, M.Q. Mechanisms of stress-induced martensitic transformation and transformation-induced plasticity in NiTi shape memory alloy related to superelastic stability. Scr. Mater. 2022, 217, 114775. [Google Scholar] [CrossRef]
- Yuan, X.B.; Chen, B.; Liu, F.S.; Xu, Q.; Ma, W. Transformation behaviors and superelasticity of Ti50Ni48Fe2 shape memory alloy subjected to cold-rolling and subsequent annealing. Rare Met. 2014, 33, 652–656. [Google Scholar] [CrossRef]
- Lee, H.C.; Shen, J.J.; Chang, Y.T.; Wu, C.T.; Chen, C.H. Evolutions of superelasticity and elastocaloric effect of Ti50Ni48Fe2 and aged-hardened Ni-rich Ti49.2Ni49.3Fe1.5 shape memory alloys under cyclic compressive deformation. J. Alloys Compd. 2022, 893, 162352. [Google Scholar] [CrossRef]
- Li, P.Y.; Jia, Y.F.; Wang, Y.S.; Li, Q.; Meng, F.Y.; He, Z.R. Effect of Fe addition on microstructure and mechanical properties of as-cast Ti49Ni51 alloy. Materials 2019, 12, 3114. [Google Scholar] [CrossRef] [PubMed]
- Zhang, Y.Q.; Jiang, S.Y.; Zhu, X.M.; Zhao, Y.N.; Liang, Y.L.; Sun, D. Influence of Fe addition on phase transformation behavior of NiTi shape memory alloy. Trans. Nonferrous Met. Soc. 2017, 27, 1580–1587. [Google Scholar] [CrossRef]
- Niu, J.G.; Geng, W.T. Anti-precursor effect of Fe on martensitic transformation in TiNi alloys. Acta Mater. 2016, 104, 18–24. [Google Scholar] [CrossRef]
- Liu, X.; Li, H.; Zhang, Y.H.; Yang, Z.W.; Gu, Q.F.; Wang, X.H.; Zhang, Y.F.; Yang, J.C. Cryogenic temperature deformation behavior and shape memory mechanism of NiTiFe alloy. Intermetallics 2023, 162, 107997. [Google Scholar] [CrossRef]
- Tu, C.H.; Wu, S.K.; Lin, C.; Huang, B.Y. A study on two R-phase transformations in intermediate temperature aged Ni-rich TiNiFe-based shape memory alloys. Intermetallics 2021, 132, 107123. [Google Scholar] [CrossRef]
- Liu, X.; Li, H.; Guan, H.; Yang, Z.W.; Zhang, Y.H.; Gu, Q.F.; Yang, J.C. Degradation of recovery properties after heat treatment in hot-forged NiTiFe alloy. J. Alloys Compd. 2022, 928, 167171. [Google Scholar] [CrossRef]
- Liang, Q.L.; Zhao, S.S.; Liang, C.X.; Zhao, T.F.; Wang, D.; Ding, X.D.; Li, S.L.; Wang, Y.D.; Zheng, Y.F.; Ren, X.B.; et al. Strain states and unique properties in cold-rolled TiNi shape memory alloys. Acta Mater. 2022, 231, 117890. [Google Scholar] [CrossRef]
- Ma, W.; Chen, B.; Liu, F.S.; Xu, Q. Phase transformation behaviors and mechanical properties of Ti50Ni49Fe1 alloy with severe plastic deformation. Rare Met. 2013, 32, 448–452. [Google Scholar] [CrossRef]
- Liang, Y.L.; Jiang, S.Y.; Zhang, Y.Q.; Hu, L.; Zhao, C.Z. Microstructure evolution and deformation mechanism of NiTiFe shape memory alloy based on plane strain compression and subsequent annealing. Mater. Chem. Phys. 2018, 215, 112–120. [Google Scholar] [CrossRef]
- Jiang, S.Y.; Yu, J.B.; Zhang, Y.Q.; Xing, X.D. Mechanically-induced martensite transformation of NiTiFe shape memory alloy subjected to plane strain compression. Trans. Nonferrous Met. Soc. 2020, 30, 1325–1334. [Google Scholar] [CrossRef]
- Li, Y.F.; Kang, X.Y.; Yin, X.Q.; Xie, H.F.; Mi, X.J. Microstructure and mechanical properties of cold-rolled Ti50Ni47Fe3 shape memory alloy. Trans. Nonferrous Met. Soc. 2014, 24, 2890–2895. [Google Scholar] [CrossRef]
- Chouf, S.; Morin, M.; Belkahla, S.; Guenin, G. Equivalent thermo-mechanical treatments in an equiatomic Ti-Ni shape memory alloy. Mater. Sci. Eng. A 2006, 438–440, 671–674. [Google Scholar] [CrossRef]
- Liu, S.; Li, Y.; Song, X.; Yu, Y.; Ye, W.; Hui, S. Microstructures and Mechanical Properties of Annealed Ti50Ni47Fe3 Shape Memory Alloy. Crystals 2023, 13, 706. [Google Scholar] [CrossRef]
- Johnson, W.A.; Mehl, R.F. Reaction kinetics in processes of nucleation and growth. Trans. Metall. Soc. AIME 1939, 135, 416–442. [Google Scholar]
- Avrami, M. Kinetics of phase change. I general theory. J. Chem. Phys. 1939, 7, 1103–1112. [Google Scholar] [CrossRef]
- Avrami, M. Kinetics of phase change. II transformation-time relations for random distribution of nuclei. J. Chem. Phys. 1940, 8, 212–224. [Google Scholar] [CrossRef]
- Avrami, M. Phase change, and microstructure kinetics of phase change. III. J. Chem. Phys. 1941, 9, 177–184. [Google Scholar] [CrossRef]


| Element | Fe | Ni | C | O | Ti |
|---|---|---|---|---|---|
| Content(wt.%) | 3.27 | 52.16 | 0.028 | 0.031 | Bal. |
| Annealing Temperature T (K) | Annealing Time t (min) | ||||
|---|---|---|---|---|---|
| Range I (Low annealing temperature) | 823 | 300 | 360 | 720 | 1440 |
| Range II (Medium annealing temperature) | 873 | 15 | 30 | 60 | 120 |
| Range III (High annealing temperature) | 923 | 5 | 15 | 30 | |
| Annealing Temperature T (K) | Annealing Time t (min) | Recrystallization Fraction (GOS ≤ 2) φR |
|---|---|---|
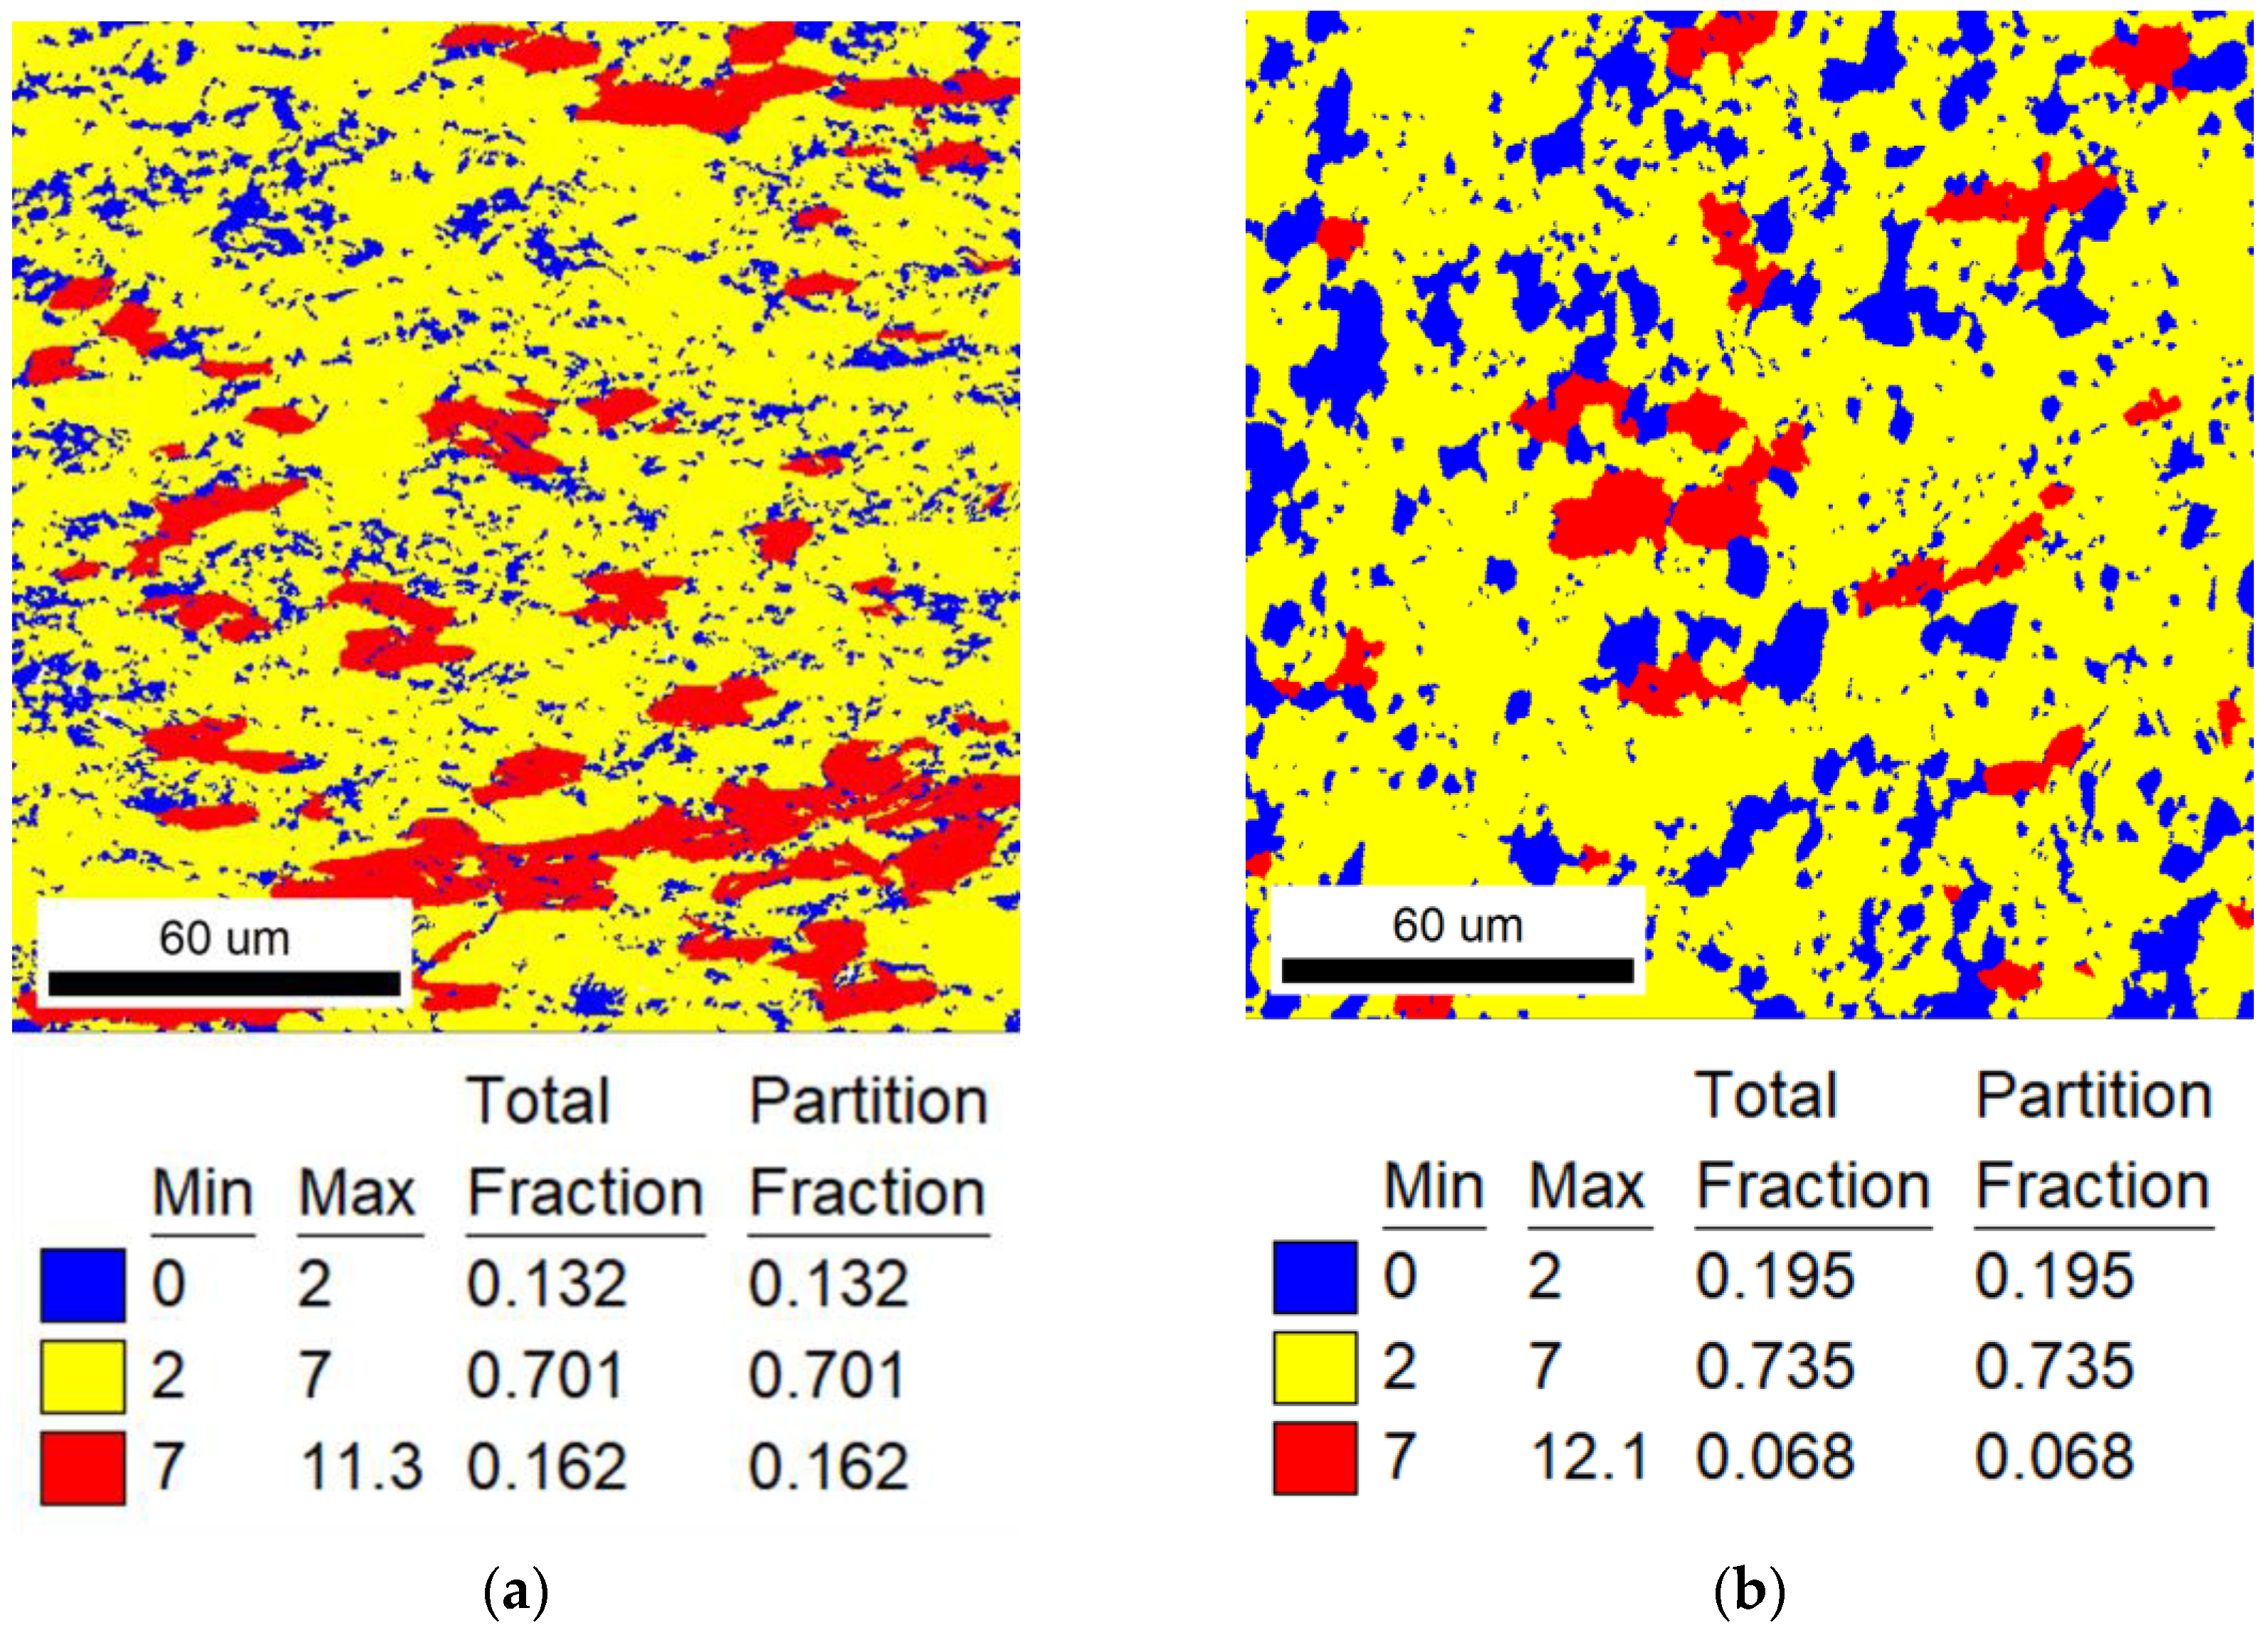
| 823 (Range I) | 300 | 13.2% |
| 360 | 19.5% | |
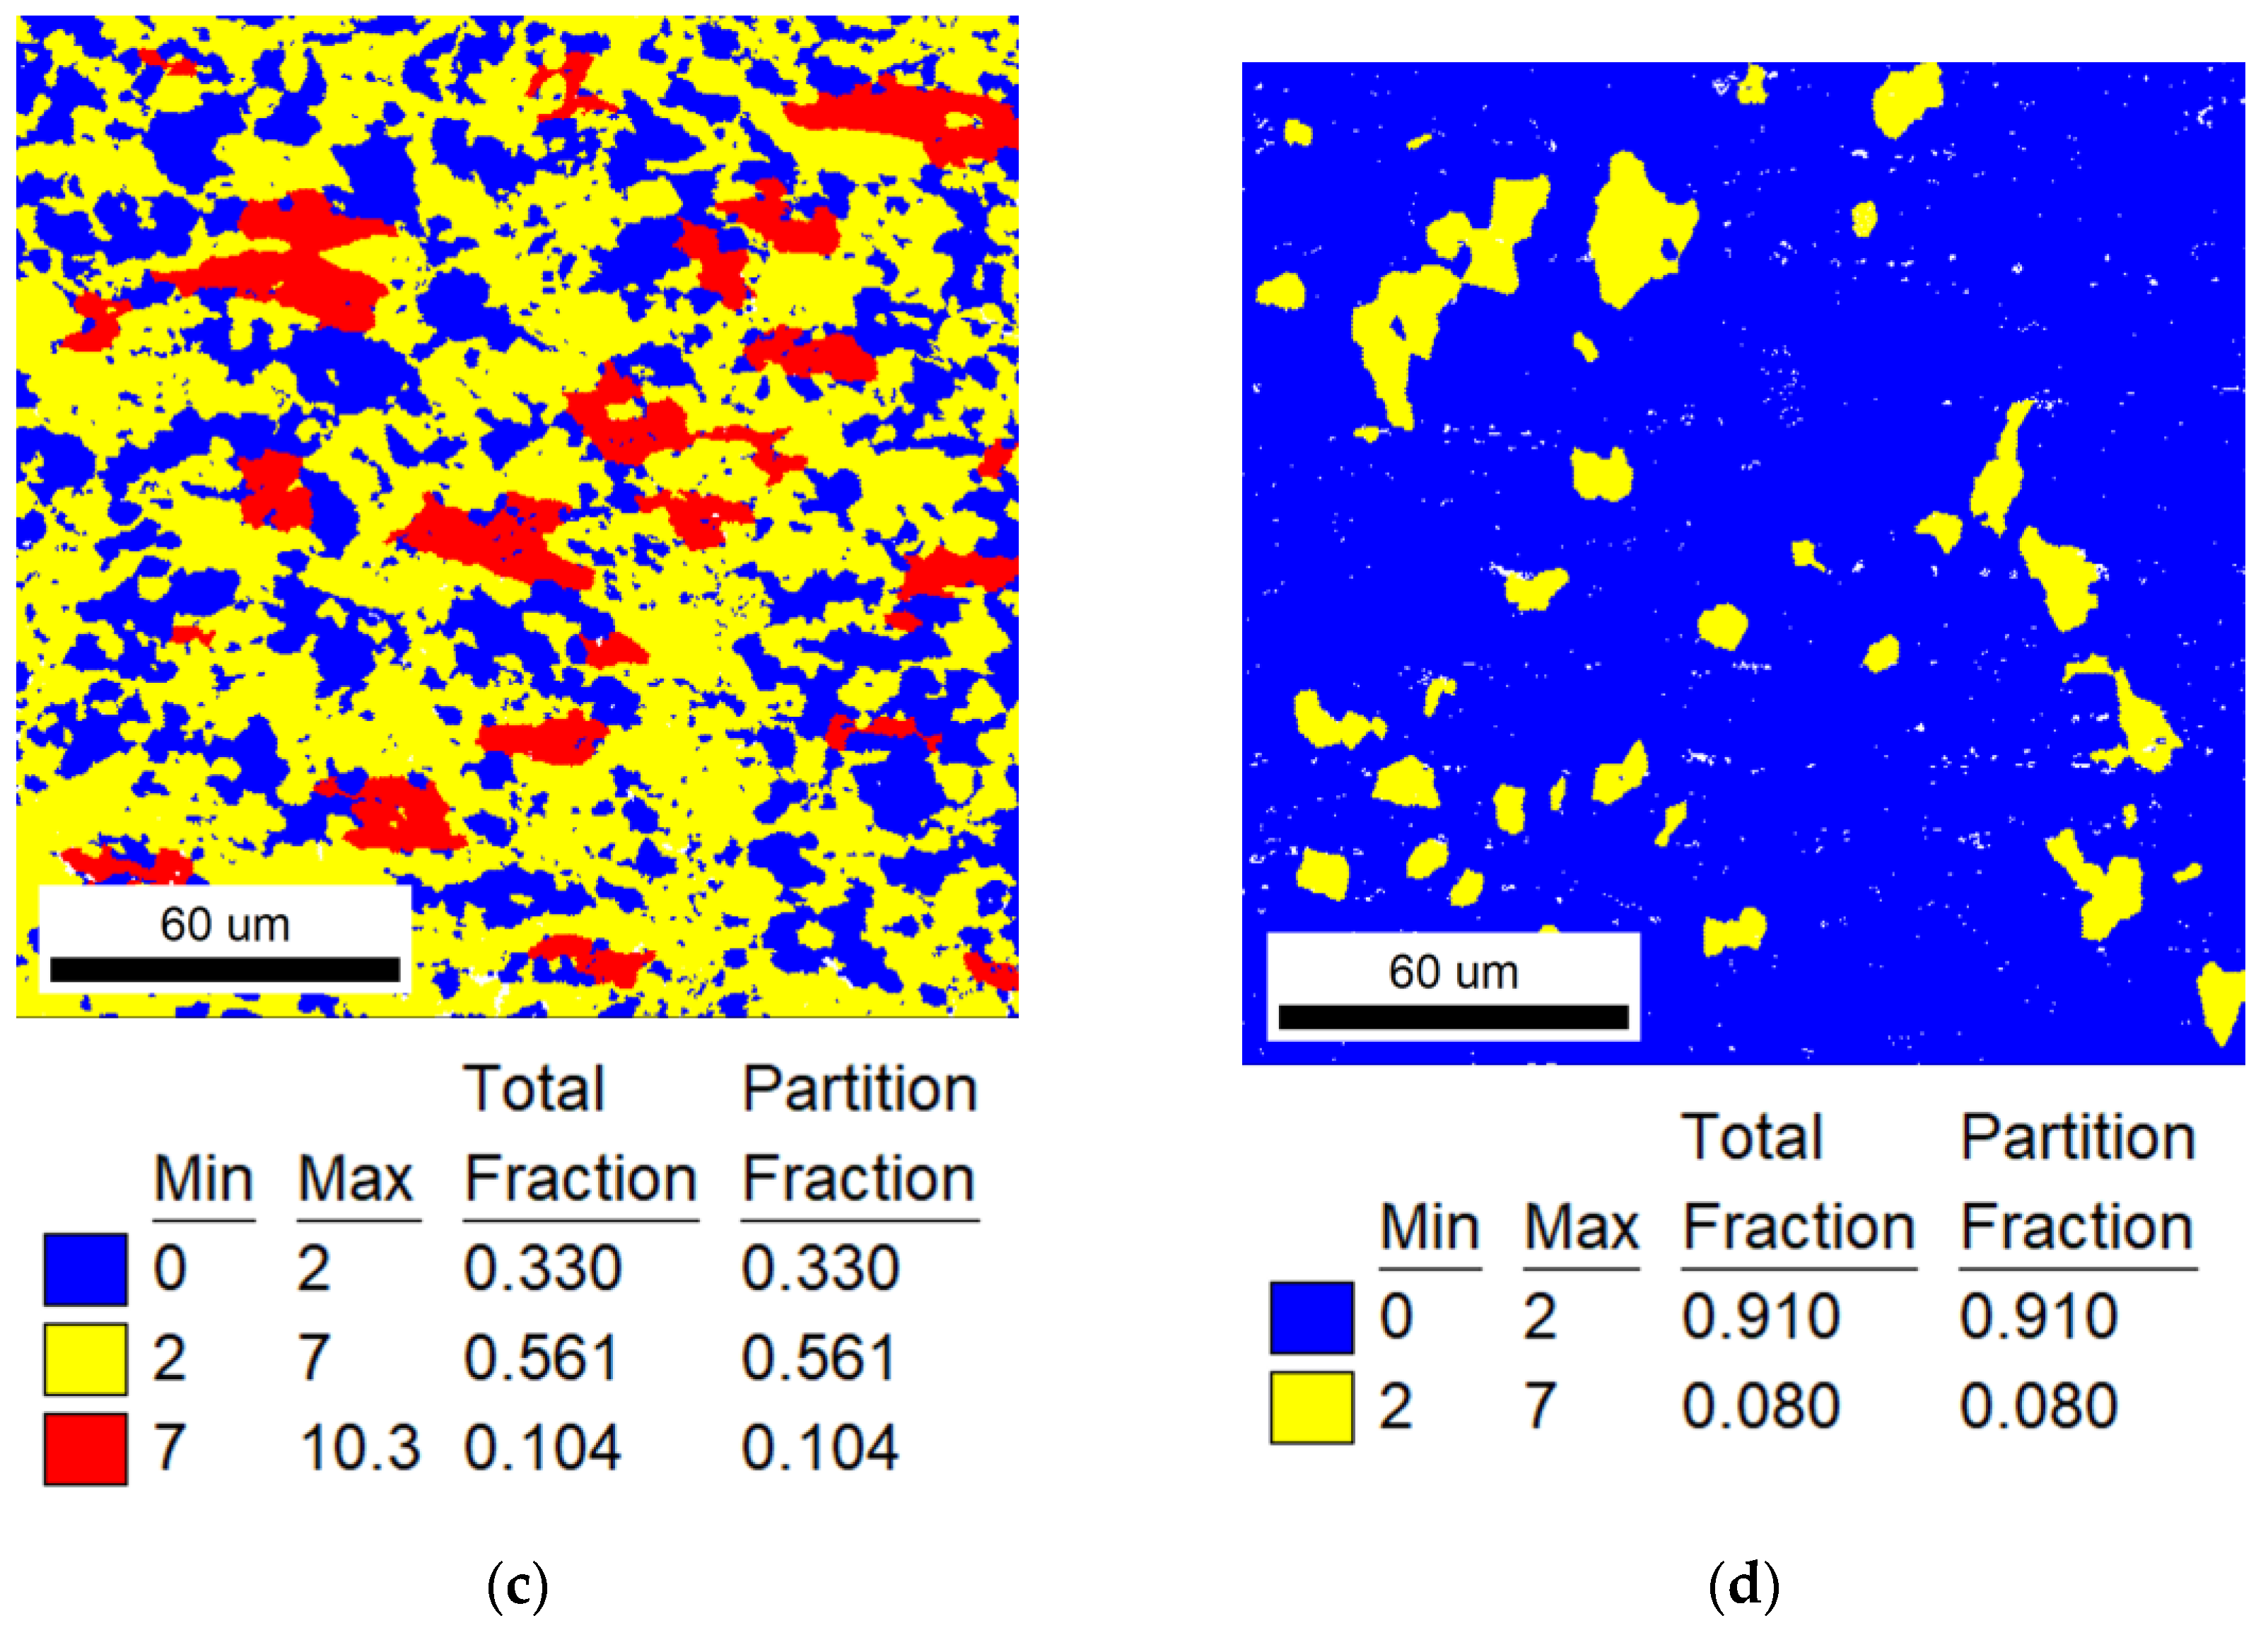
| 720 | 33.0% | |
| 1440 | 91.0% | |
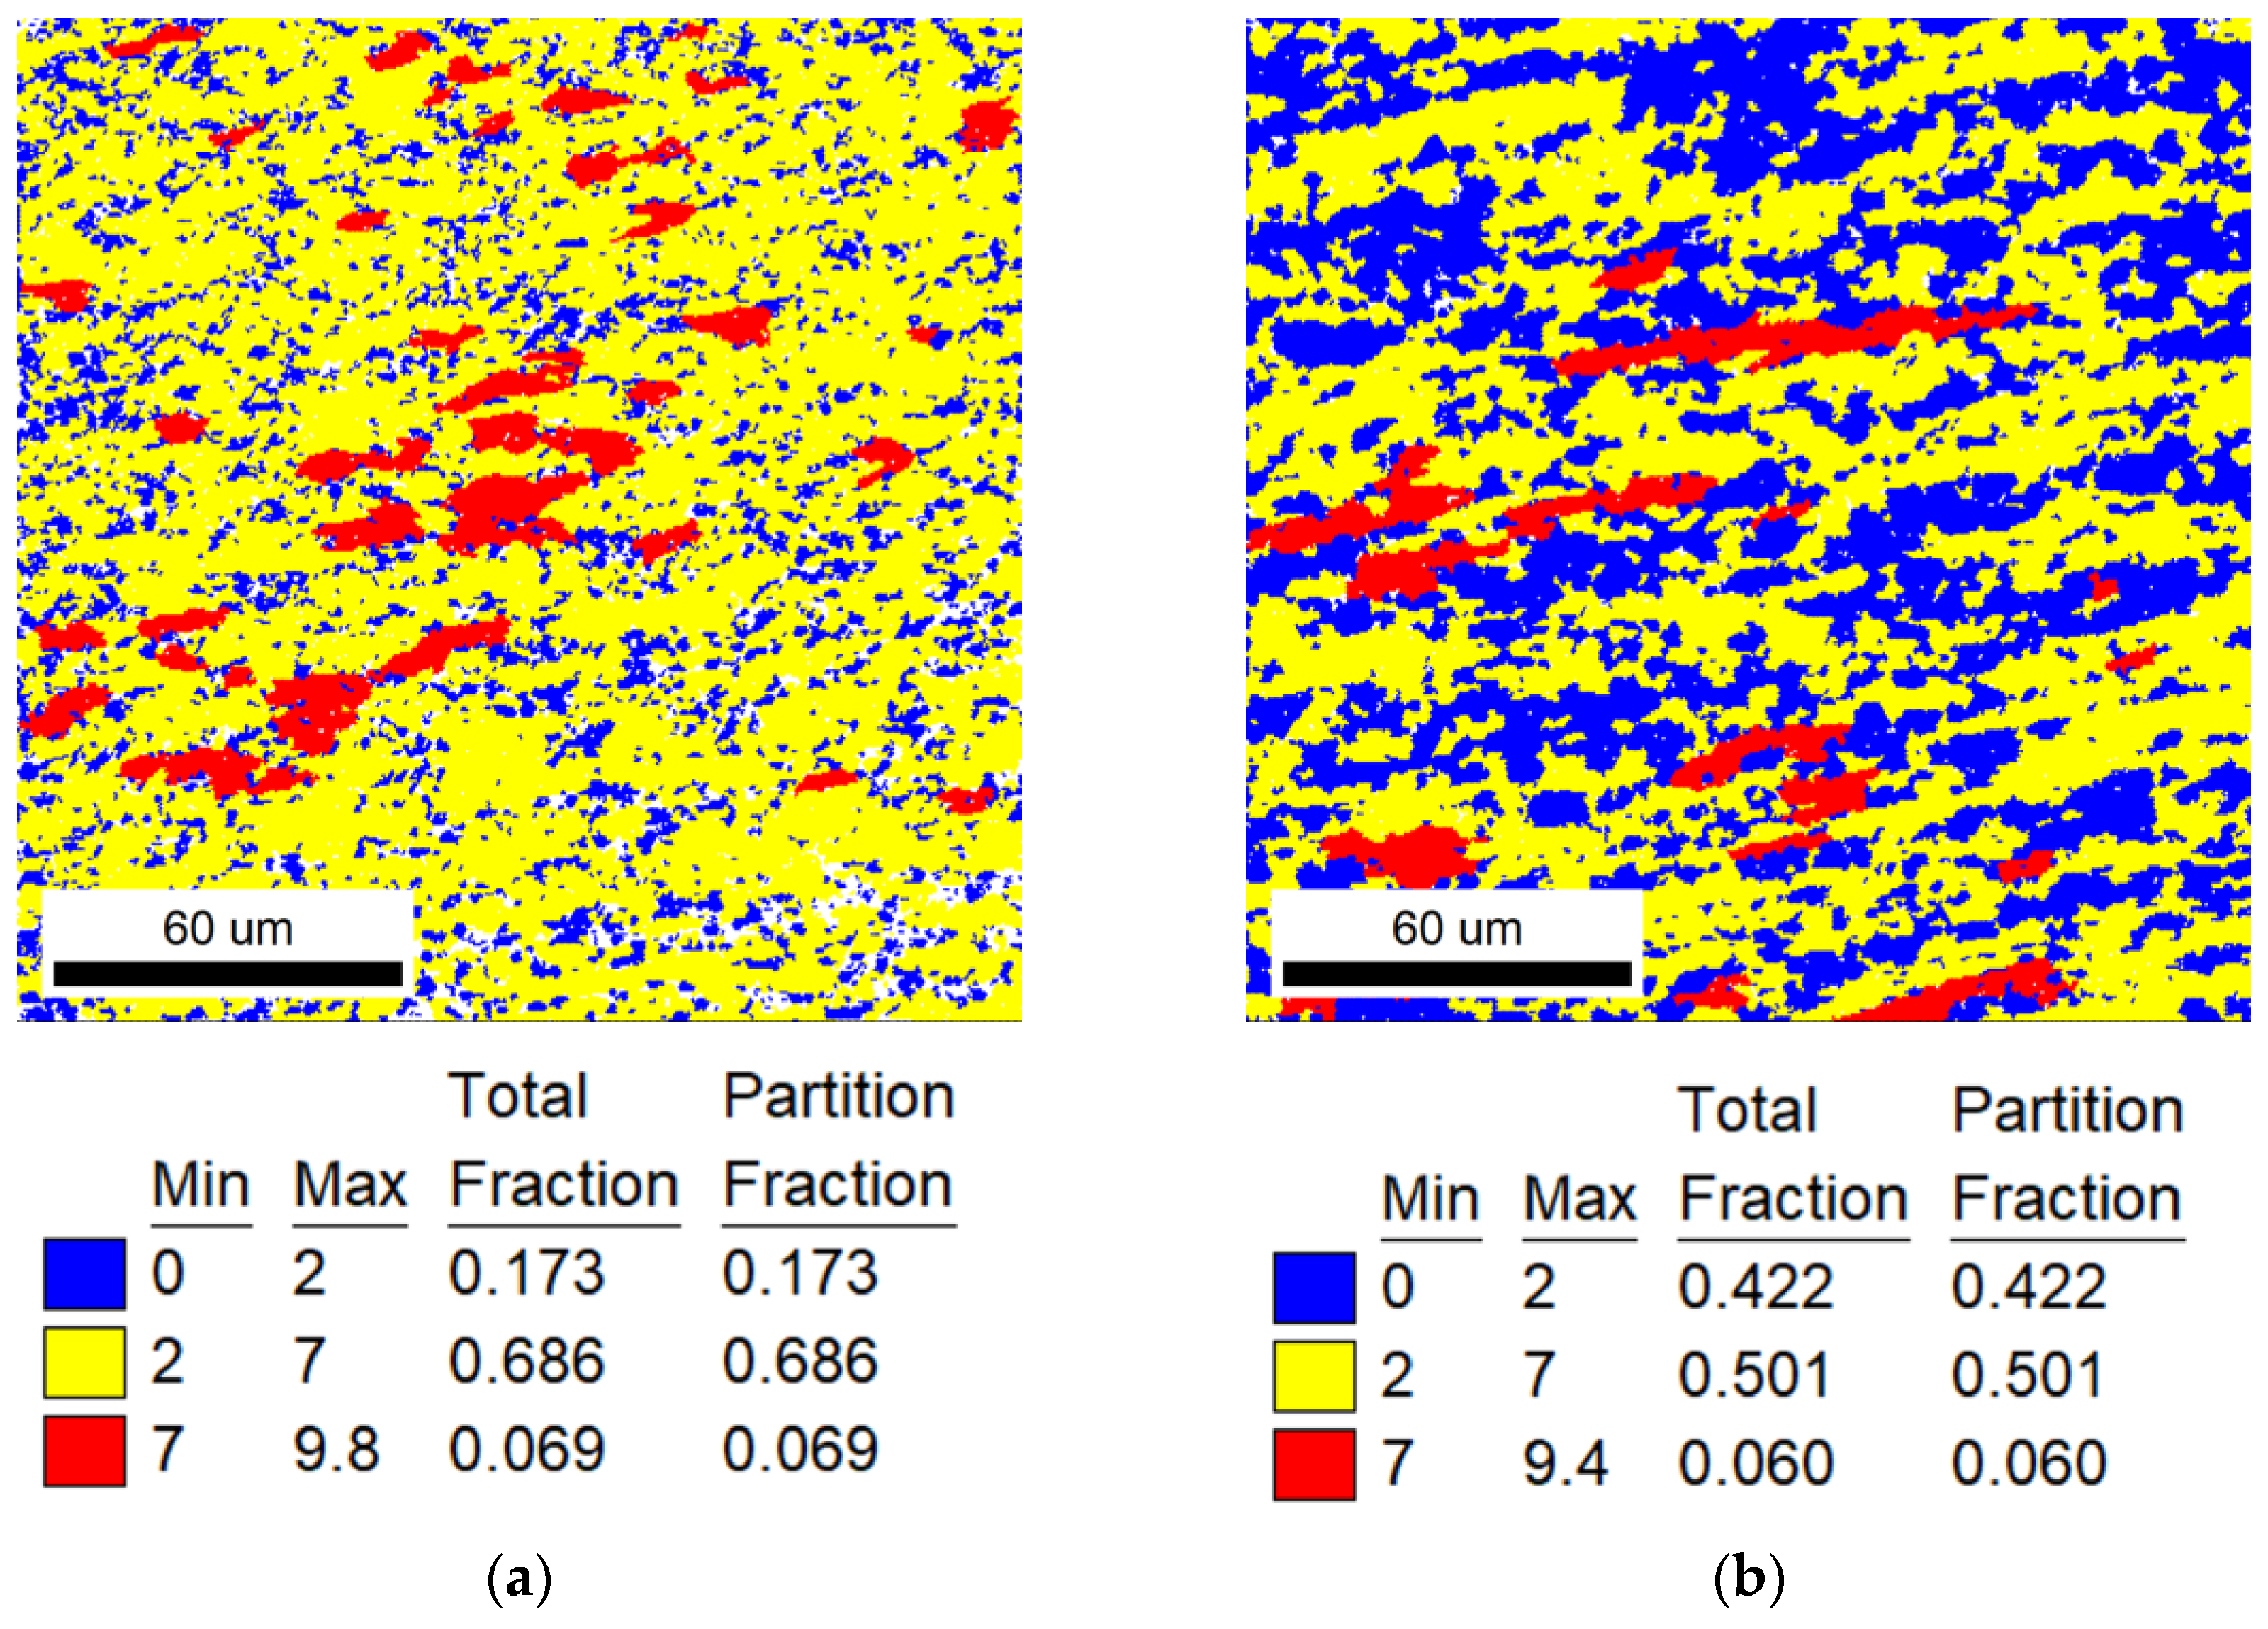
| 873 (Range II) | 15 | 17.3% |
| 30 | 42.2% | |
| 60 | 79.8% | |
| 120 | 92.9% | |
| 923 (Range III) | 5 | 12.7% |
| 15 | 77.7% | |
| 30 | 87.5% |
| Annealing Temperature T (K) | Avrami Model |
|---|---|
| 823 (range I) | |
| 873 (range II) | |
| 923 (range III) |
| Annealing Temperature T (K) | Annealing Time lgt | Annealing Time t (min) |
|---|---|---|
| 823 (range I) | 2.89 | 776 |
| 873 (range II) | 1.57 | 37 |
| 923 (range III) | 1.10 | 12.5 |
| Annealing Temperature T (K) | Annealing Time t (min) | Recrystallization Fraction φR | Deviation from φR = 50% |
|---|---|---|---|
| 823 (range I) | 776 | 53.1% | 3.1% |
| 873 (range II) | 37 | 52.4% | 2.4% |
| 923 (range III) | 12.5 | 61.9% | 11.9% |
Disclaimer/Publisher’s Note: The statements, opinions and data contained in all publications are solely those of the individual author(s) and contributor(s) and not of MDPI and/or the editor(s). MDPI and/or the editor(s) disclaim responsibility for any injury to people or property resulting from any ideas, methods, instructions or products referred to in the content. |
© 2023 by the authors. Licensee MDPI, Basel, Switzerland. This article is an open access article distributed under the terms and conditions of the Creative Commons Attribution (CC BY) license (https://creativecommons.org/licenses/by/4.0/).
Share and Cite
Liu, S.; Hui, S.; Li, Y.; Song, X.; Yu, Y.; Ye, W. Equivalent Heat Treatments and Mechanical Properties in Cold-Rolled TiNiFe Shape-Memory Alloys. Materials 2023, 16, 7395. https://doi.org/10.3390/ma16237395
Liu S, Hui S, Li Y, Song X, Yu Y, Ye W. Equivalent Heat Treatments and Mechanical Properties in Cold-Rolled TiNiFe Shape-Memory Alloys. Materials. 2023; 16(23):7395. https://doi.org/10.3390/ma16237395
Chicago/Turabian StyleLiu, Shuwei, Songxiao Hui, Yanfeng Li, Xiaoyun Song, Yang Yu, and Wenjun Ye. 2023. "Equivalent Heat Treatments and Mechanical Properties in Cold-Rolled TiNiFe Shape-Memory Alloys" Materials 16, no. 23: 7395. https://doi.org/10.3390/ma16237395