Article

The Influence of Potassium Hexafluorophosphate on the Morphology and Anticorrosive Properties of Conversion Coatings Formed on the AM50 Magnesium Alloy by Plasma Electrolytic Oxidation

by
Łukasz Florczak
1,*,
Barbara Kościelniak
2,
Agnieszka Kramek
3 and
Andrzej Sobkowiak
1,*
1
Department of Physical Chemistry, Faculty of Chemistry, Rzeszow University of Technology, 35-959 Rzeszow, Poland
2
Department of Materials Science, Faculty of Mechanical Engineering and Aeronautics, Rzeszow University of Technology, 35-959 Rzeszow, Poland
3
Department of Component Manufacturing and Production Organization, Faculty of Mechanics and Technology, Rzeszow University of Technology, 37-450 Stalowa Wola, Poland
*
Authors to whom correspondence should be addressed.
Materials 2023, 16(24), 7573; https://doi.org/10.3390/ma16247573
Submission received: 7 November 2023 / Revised: 5 December 2023 / Accepted: 7 December 2023 / Published: 9 December 2023
(This article belongs to the Special Issue Plasma Electrolytic Oxidation: Technologies and Applications)

Abstract

:
In this study, conversion coatings were produced on the AM50 magnesium alloy by a plasma electrolytic oxidation (PEO) process in alkaline-silicate electrolyte with the addition of potassium hexafluorophosphate, using a unipolar pulse power source. The coating microstructure and its composition were determined using scanning electron microscopy (SEM) and an X-ray photoelectron spectroscopy (XPS). The corrosion resistance of the conversion coatings was evaluated by means of potentiodynamic polarization tests (PDP) and electrochemical impedance spectroscopy (EIS) in a dilute Harrison solution (DHS). It has been found that the properties (microstructure, composition, and coating thickness) of the obtained layer and, therefore, their anticorrosive resistance strongly depend on the electrolyte composition. The best anticorrosive properties were observed in the layers obtained in the presence of 2.5 g/L KPF6. It was found that the conversion coating produced with the addition of hexafluorophosphate is characterized by a different morphology (sponge-like) and better anticorrosion properties, in comparison to the coating obtained with the addition of fluoride and orthophosphate salts commonly used in PEO synthesis. The sponge-like structure, which is similar to bone structure in combination with the presence of phosphates in the layer, can increase the biocompatibility and the possibility of self-healing of this coating. However, neither Mg(PF6)2, nor any other compounds containing PF6, have been found in the layers produced.

1. Introduction

Magnesium is the lightest construction material (1.74 g/mL), but due to its high reactivity and poor mechanical properties, it is practically not used in its pure form. The most frequently added alloying element is aluminum, which ensures high strength, creep resistance, and anticorrosive properties. The addition of zinc increases the ductility and castability, and improves the strength of the alloy at room temperature. Manganese increases the strength of the alloy, enables its weldability, and increases the hardness of Mg-Al alloys. Calcium primarily increases the biocompatibility of alloys (accelerates bone growth), improves the mechanical properties, and the anticorrosive properties. The addition of rare earth elements, for example, Ce, La, Nd, and Gd, improves the mechanical properties at elevated temperatures, and the resistance to corrosion [1,2].
Magnesium alloys, due to their excellent properties—such as a high strength to weight ratio, good dimensional stability, electromagnetic shielding, and biocompatibility—are widely used in industry. The most commonly used alloys include those with the addition of aluminum and zinc or manganese (AZ and AM series), as well as rare earth elements (RE). Alloys such as AZ91, AM50, or WE43 are used in the electronic, automotive, and aerospace industries [3,4,5,6]. Magnesium-calcium alloys can be used in biomedical applications, e.g., biodegradable orthopedic implants [7,8]. However, magnesium alloys are characterized by very low corrosion resistance, which is caused by the high chemical activity of magnesium, and also by the unstable passive layer formed on the surface of the alloys [2,9,10,11]. To improve the corrosion resistance of magnesium alloys, an appropriate surface treatment is necessary to produce anticorrosive coatings on the substrate [12,13]. Plasma electrolytic oxidation (PEO) is a useful technique for developing a protective coating on magnesium alloys, which involves generating sparks on the alloy surface to produce relatively thick, dense, and hard ceramic oxide coatings [14,15,16,17,18,19,20].
This is a high-voltage anodization process, in which metallic magnesium, acting as the anode of the system, is oxidized to Mg2+, which reacts with components of the electrolyte. Since strongly alkaline baths (pH~13) are used in the process the most often, the intermediate product is magnesium hydroxide [Mg(OH)2], which, as a result of the high process temperature (approximately 3000 K), is immediately dehydrated to form magnesium oxide (MgO), the main end product of the PEO process. When using additives in the electrolytic bath, such as silicates, phosphates, aluminates, or fluorides, appropriate magnesium salts are also incorporated into the coating structure [17]. The formation of the conversion coating in the PEO process occurs simultaneously with the intensive evolution of gases (oxygen and hydrogen), and therefore the overall process is the sum of electrochemical processes, plasma chemical reactions, and thermal diffusion of oxygen [20].
The most commonly used types of baths in the PEO process include silicate [21,22] and phosphate electrolytes [23,24], which ensure appropriate mechanical and anticorrosive properties of the coatings are produced [25,26]. Baths combining both components are also used to further optimize the protective properties of the synthesized surface layers. The presence of silicate increases the hardness of coatings, and phosphates improve biocompatibility and biodegradability, which is particularly important in biomedical applications of magnesium alloys [27,28]. In the case of phosphates, the properties of coatings depend not only on their amount, but also on the kind of compound used, for example: Na3PO4 [23,24,29], Na2HPO4 [30], (NaPO3)6 [28,31], and Na4P2O7 [32]. Another important ingredient often added to PEO baths is fluoride, which increases the corrosion resistance, surface hardness, and wear resistance of the protective layer [33,34,35]. Simple fluorides (NaF [33], KF [34], or CaF2 [36]) are used the most frequently, but attempts have also been made to use substances containing multifluoride anions, for example K2ZrF6 [37,38,39], K2TiF6 [40,41], NaSiF6 [42,43], Na3AlF6 [44,45], and NaBF4 [46].
In this study, the influence of the addition of KPF6 to electrolytes on the structure and anticorrosive properties of PEO coatings produced on the AM50 magnesium alloy has been investigated. To our knowledge, the application of KPF6 to electrolytic baths has not yet been reported. The analysis of the impact of the addition of KPF6 on the PEO process is interesting because there are reports in the literature that state that the PF6 ion is not hydrolyzed in a strongly alkaline medium (pH > 12) [47], unlike K2ZrF6 [39], K2TiF6 [41], or Na3AlF6 [44]. Therefore, the formation of a polyfluorine magnesium salt in the structure of the conversion coating is possible, as we found in the case of the addition of NaBF4 salt [46]. The properties of conversion coatings prepared at the optimal concentration of hexafluorophosphate ions have also been compared with those produced in a bath containing equimolar amounts of fluorine and phosphorus in the form of the most commonly used fluoride and orthophosphate salts.

2. Materials and Methods

2.1. Materials and Coatings Preparation

AM50 magnesium alloy (Neo Cast, Krakow, Poland), with the composition presented in Table 1, was used as substrate for PEO treatment. Before PEO, the specimens in the shape of rectangular plates of 50 mm × 50 mm × 8 mm were polished with SiC abrasive paper to a grit of 1200. The samples were then washed in deionized water, ultrasonically degreased with acetone, and dried. Subsequently, they were electrochemically activated as anodes in a saturated NaF solution for 5 min at a voltage equal to 80 V (DC). Immediately after this procedure, the sample was rinsed with deionized water and submitted to the PEO process.
The electrolyte used in the PEO process consists of NaOH (4 g/L) and Na2SiO3·5H2O (10 g/L). The coatings were prepared in the electrolyte without and with KPF6 in an amount ranging from 0.5 to 4.0 g/L. Additionally, the synthesis was carried out in a bath containing a mixture of NaF and Na3PO4, instead of KPF6. All solutions were prepared using commercially available, analytical grade reagents and deionized water (conductivity below 0.1 μS/cm at 25 °C). The PEO process was performed using a pulse electrical source pe861UA-500-10-24-S (Platnig Electronic GmbH, Sexau, Germany). The electrical parameters were set as follows: frequency 200 Hz, duty cycle 40%, and current density 5 A/dm2. The PEO process time was 10 min and the electrolyte temperature was kept within the 5–15 °C range. The magnesium alloy sample was used as an anode, and stainless steel as a cathode. The coatings obtained were cleaned with deionized water, and dried.

2.2. Coatings Characterization

The thickness of the coatings was measured using a Dualscope MP20 eddy current film thickness measurement gauge (Fischer, Sindelfingen, Germany) with FTA 3.3 H sonde. The average layer thickness and standard derivation of each sample were calculated from 20 measurements.
The surface roughness of the coated surface was measured using a Surftest SJ-210 (Mitutoyo, Kawasaki, Japan). The standard roughness parameter (Ra) as the arithmetic mean deviation was determined based on measurements performed 10 times in a row.
A scanning electron microscope (SEM) Phenom XL (Thermo Fisher Scientific Inc., Waltham, MA, USA) was used to characterize the surface and cross-sectional morphology of the PEO coatings.
An energy dispersive X-ray spectrometer (EDS) attached to an SEM was employed to analyze the elemental distribution in the coating. Composition of outer and inner layer PEO coating was investigated by an X-ray Photoelectron Spectrometer (XPS) using a K-Alpha anode (Thermo Fisher Scientific Inc., Waltham, MA, USA), equipped with an argon ion gun to obtain measurements in the inner layer. All energy values were corrected according to the adventitious C 1s set at 284.5 eV.
Electrochemical corrosion tests were carried out using a PARSTAT 2273 (Princeton Applied Research, Houston, TX, USA) potentiostat in a conventional three-electrode cell with the sample as the working electrode (exposed area 0.785 cm2), a platinum plate as the auxiliary electrode, and a silver chloride electrode immersed directly in a corrosive solution as the reference electrode. The corrosion resistance of the samples was evaluated by using potentiodynamic polarization (PDP) curves and electrochemical impedance spectroscopy (EIS) measurements in a dilute Harrison solution [0.35 wt.% (NH4)2SO4, 0.05 wt.% NaCl] at room temperature (22 ± 1 °C). The potentiodynamic polarization curves were measured from −0.25 to +0.25 V with respect to the open circuit potential (OCP) at a scan rate of 1 mV/s after an initial 3 h exposure in solution to stabilize OCP. The Tafel analysis of the potentiodynamic curves was performed, and the values of the following electrochemical parameters were obtained: corrosion potential (ECORR), corrosion current density (jCORR), and anodic (βA) and cathodic (βC) Tafel slopes. Polarization resistance (RP) was calculated according to the Stern-Geary equation [49]:
R P = β A · β c 2.303 · j CORR ( β A + β C )
EIS measurements were conducted at AC frequencies ranging from 100 kHz to 10 mHz at an interval of 10 points per decade, with 10 mV rms after an initial 3 h exposure in solution. The results obtained were analyzed using an equivalent circuit, which was found by the fitting procedure implemented in the ZSimpWin 3.21 software (EChem Software, Ann Arbor, MI, USA).

3. Results and Discussion

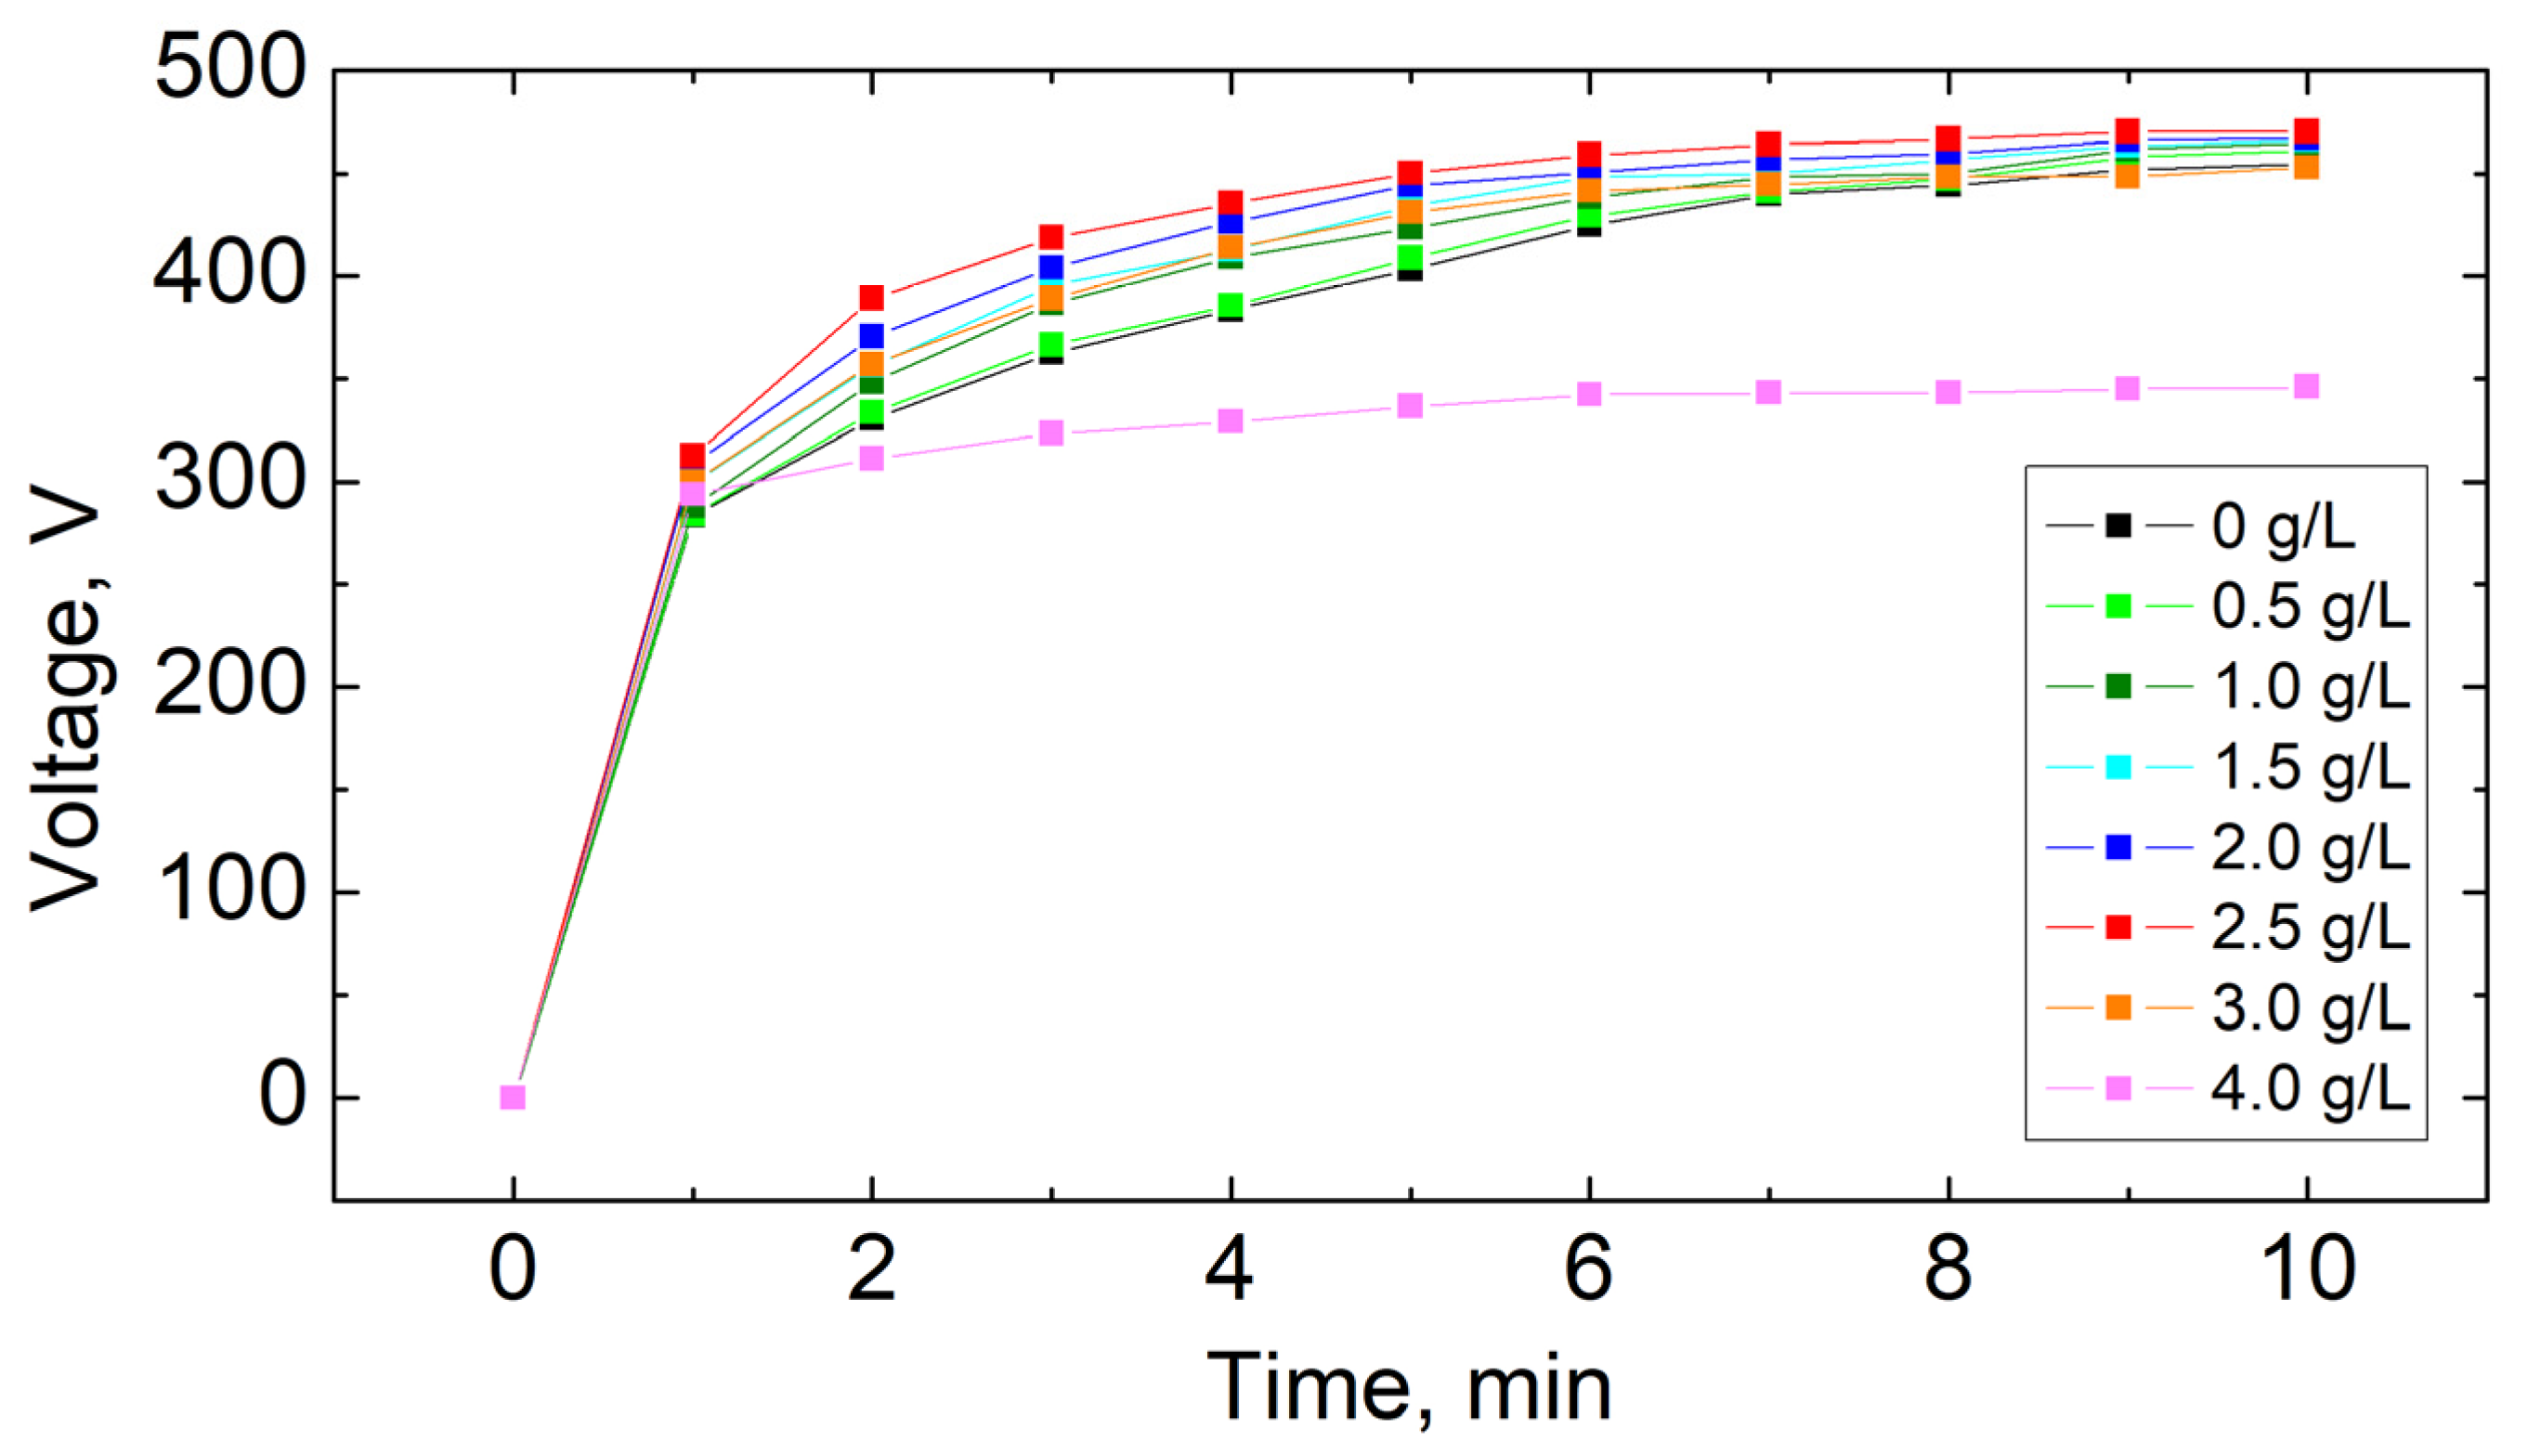
3.1. Plasma Electrolytic Oxidation Process

A voltage-time curve was used to investigate the influence of electrolyte composition on the PEO process (Figure 1). Three typical stages were identified during the PEO process, which included conventional anodization (without discharges), spark anodization (with small white discharges), and micro-arc oxidation (with large orange discharges). Figure 2 presents images of samples at particular stages. These stages are separated by characteristic voltage values called breakdown voltage and critical voltage. Based on observations of the surface of magnesium alloy samples during the PEO process, it was found that the composition of the electrolyte did not noticeably affect the value of breakdown voltage and critical voltage, which were approximately equal to 200 V and 450 V, respectively. The time for the first visible sparks to appear, which means that the breakdown voltage was reached, was approximately 30 s, regardless of the amount of KPF6 in the solution. Table 2 presents the time values needed to reach the critical voltage (450 V) and the final voltage values for different concentrations of KPF6 in the electrolyte.
The increase in KPF6 concentration in the electrolyte up to 2.5 g/L decreases the time to reach the critical voltage from 8.8 to 5.0 min. In these cases, the obtained coatings are smooth, continuous, and without visible damage. Higher KPF6 content causes the time to increase, and for 4 g/L the critical voltage is not achieved. The final voltage values also increase with the addition of KPF6 up to 2.5 g/L (from 455 to 470 V), and then decrease to 346 V for KPF6 concentration equal to 4 g/L addition. When the critical voltage is not achieved, the oxidation process is unstable, with visible local burns resulting from the formation of local pits on the surface of the magnesium sample after the PEO process. (Figure 3).

3.2. Thickness and Roughness of PEO Coatings

The effect of KPF6 concentration on the average thickness and surface roughness of PEO coatings formed on the magnesium alloy is shown in Figure 4.
The measured thickness and roughness coefficient (Ra) of the conversion coating produced by the PEO process in the base bath (without KPF6 content) were 8.4 and 0.76 µm, respectively. The introduction of KPF6 into the electrolyte in an amount of up to 3 g/L increases the thickness of the coating to 16.4 μm, simultaneously increasing its roughness coefficient to 2.11 μm. The addition of a larger amount of KPF6 to the electrolytic bath causes a decrease in the average coating thickness, but also a further increase in its roughness. The coating synthesized in an electrolyte containing 4 g/L KPF6 is characterized by a lower average thickness (8.0 µm) than that produced in the base solution. An increase in the standard deviation value in thickness measurements (from 0.4 to 1.4 µm) and an increase in the roughness coefficient (up to 2.9 µm) means that a heterogeneous porous layer with a more variable structure is formed. This suggests that partial dissolution of the coating can occur.

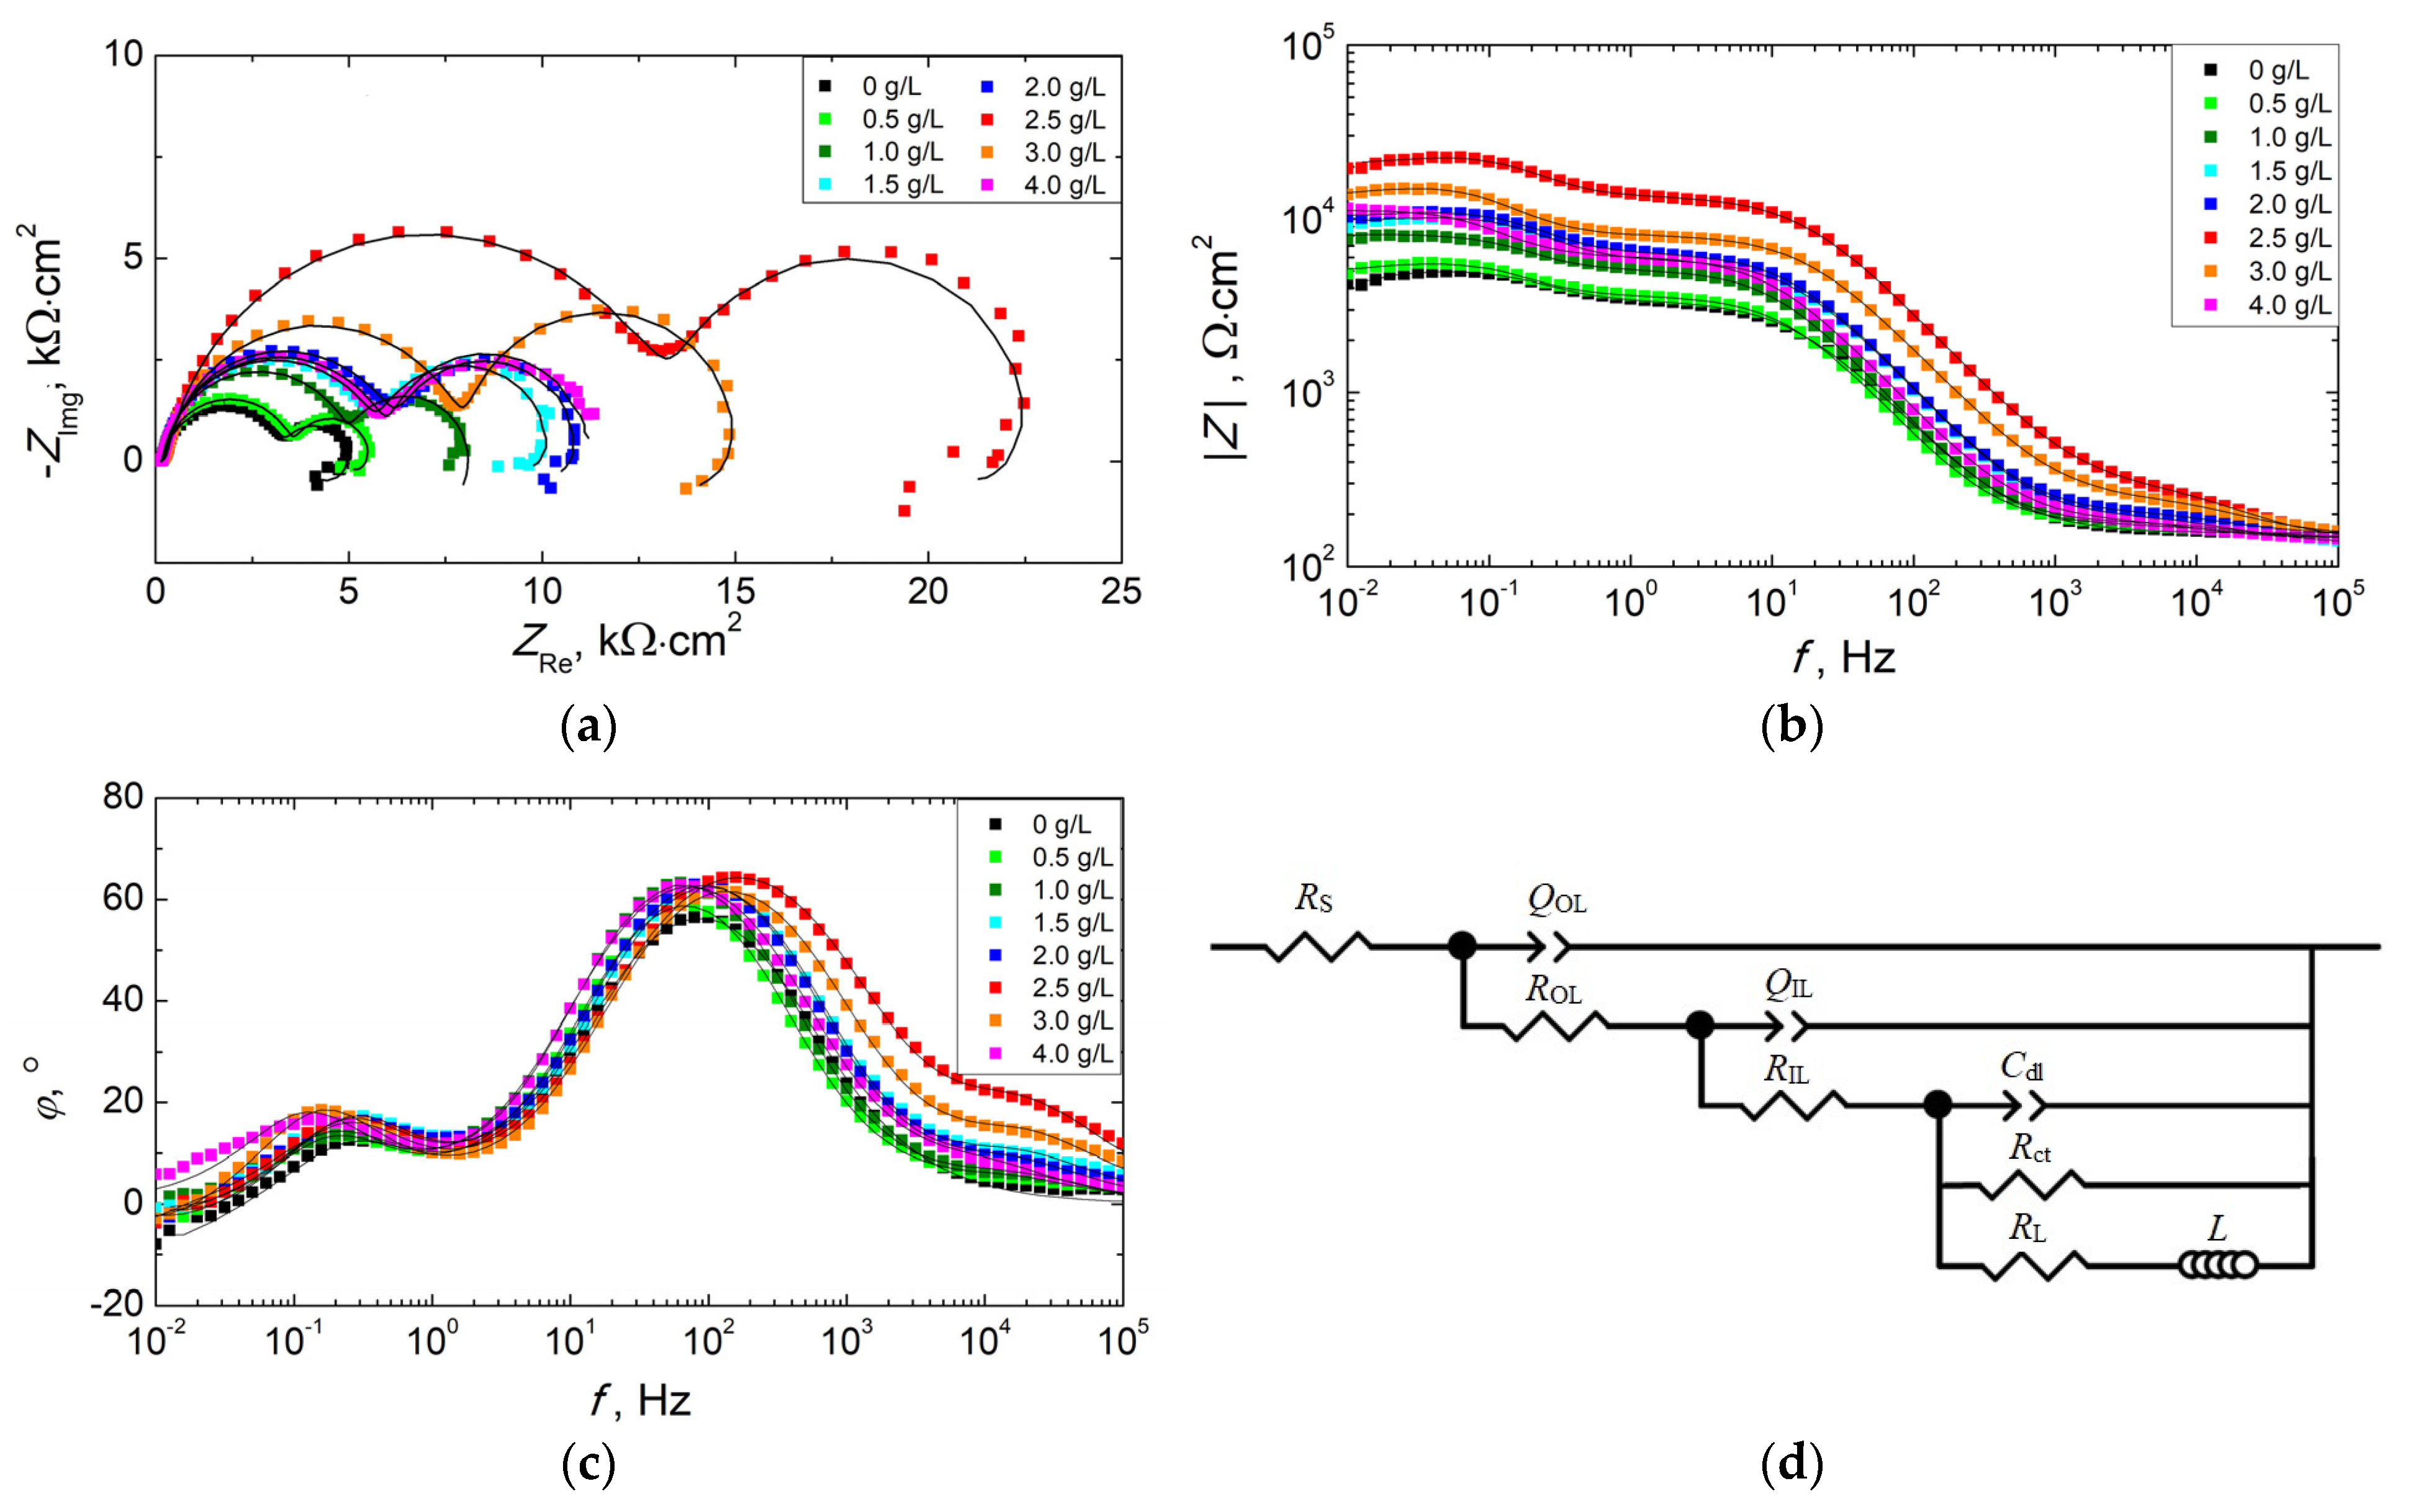
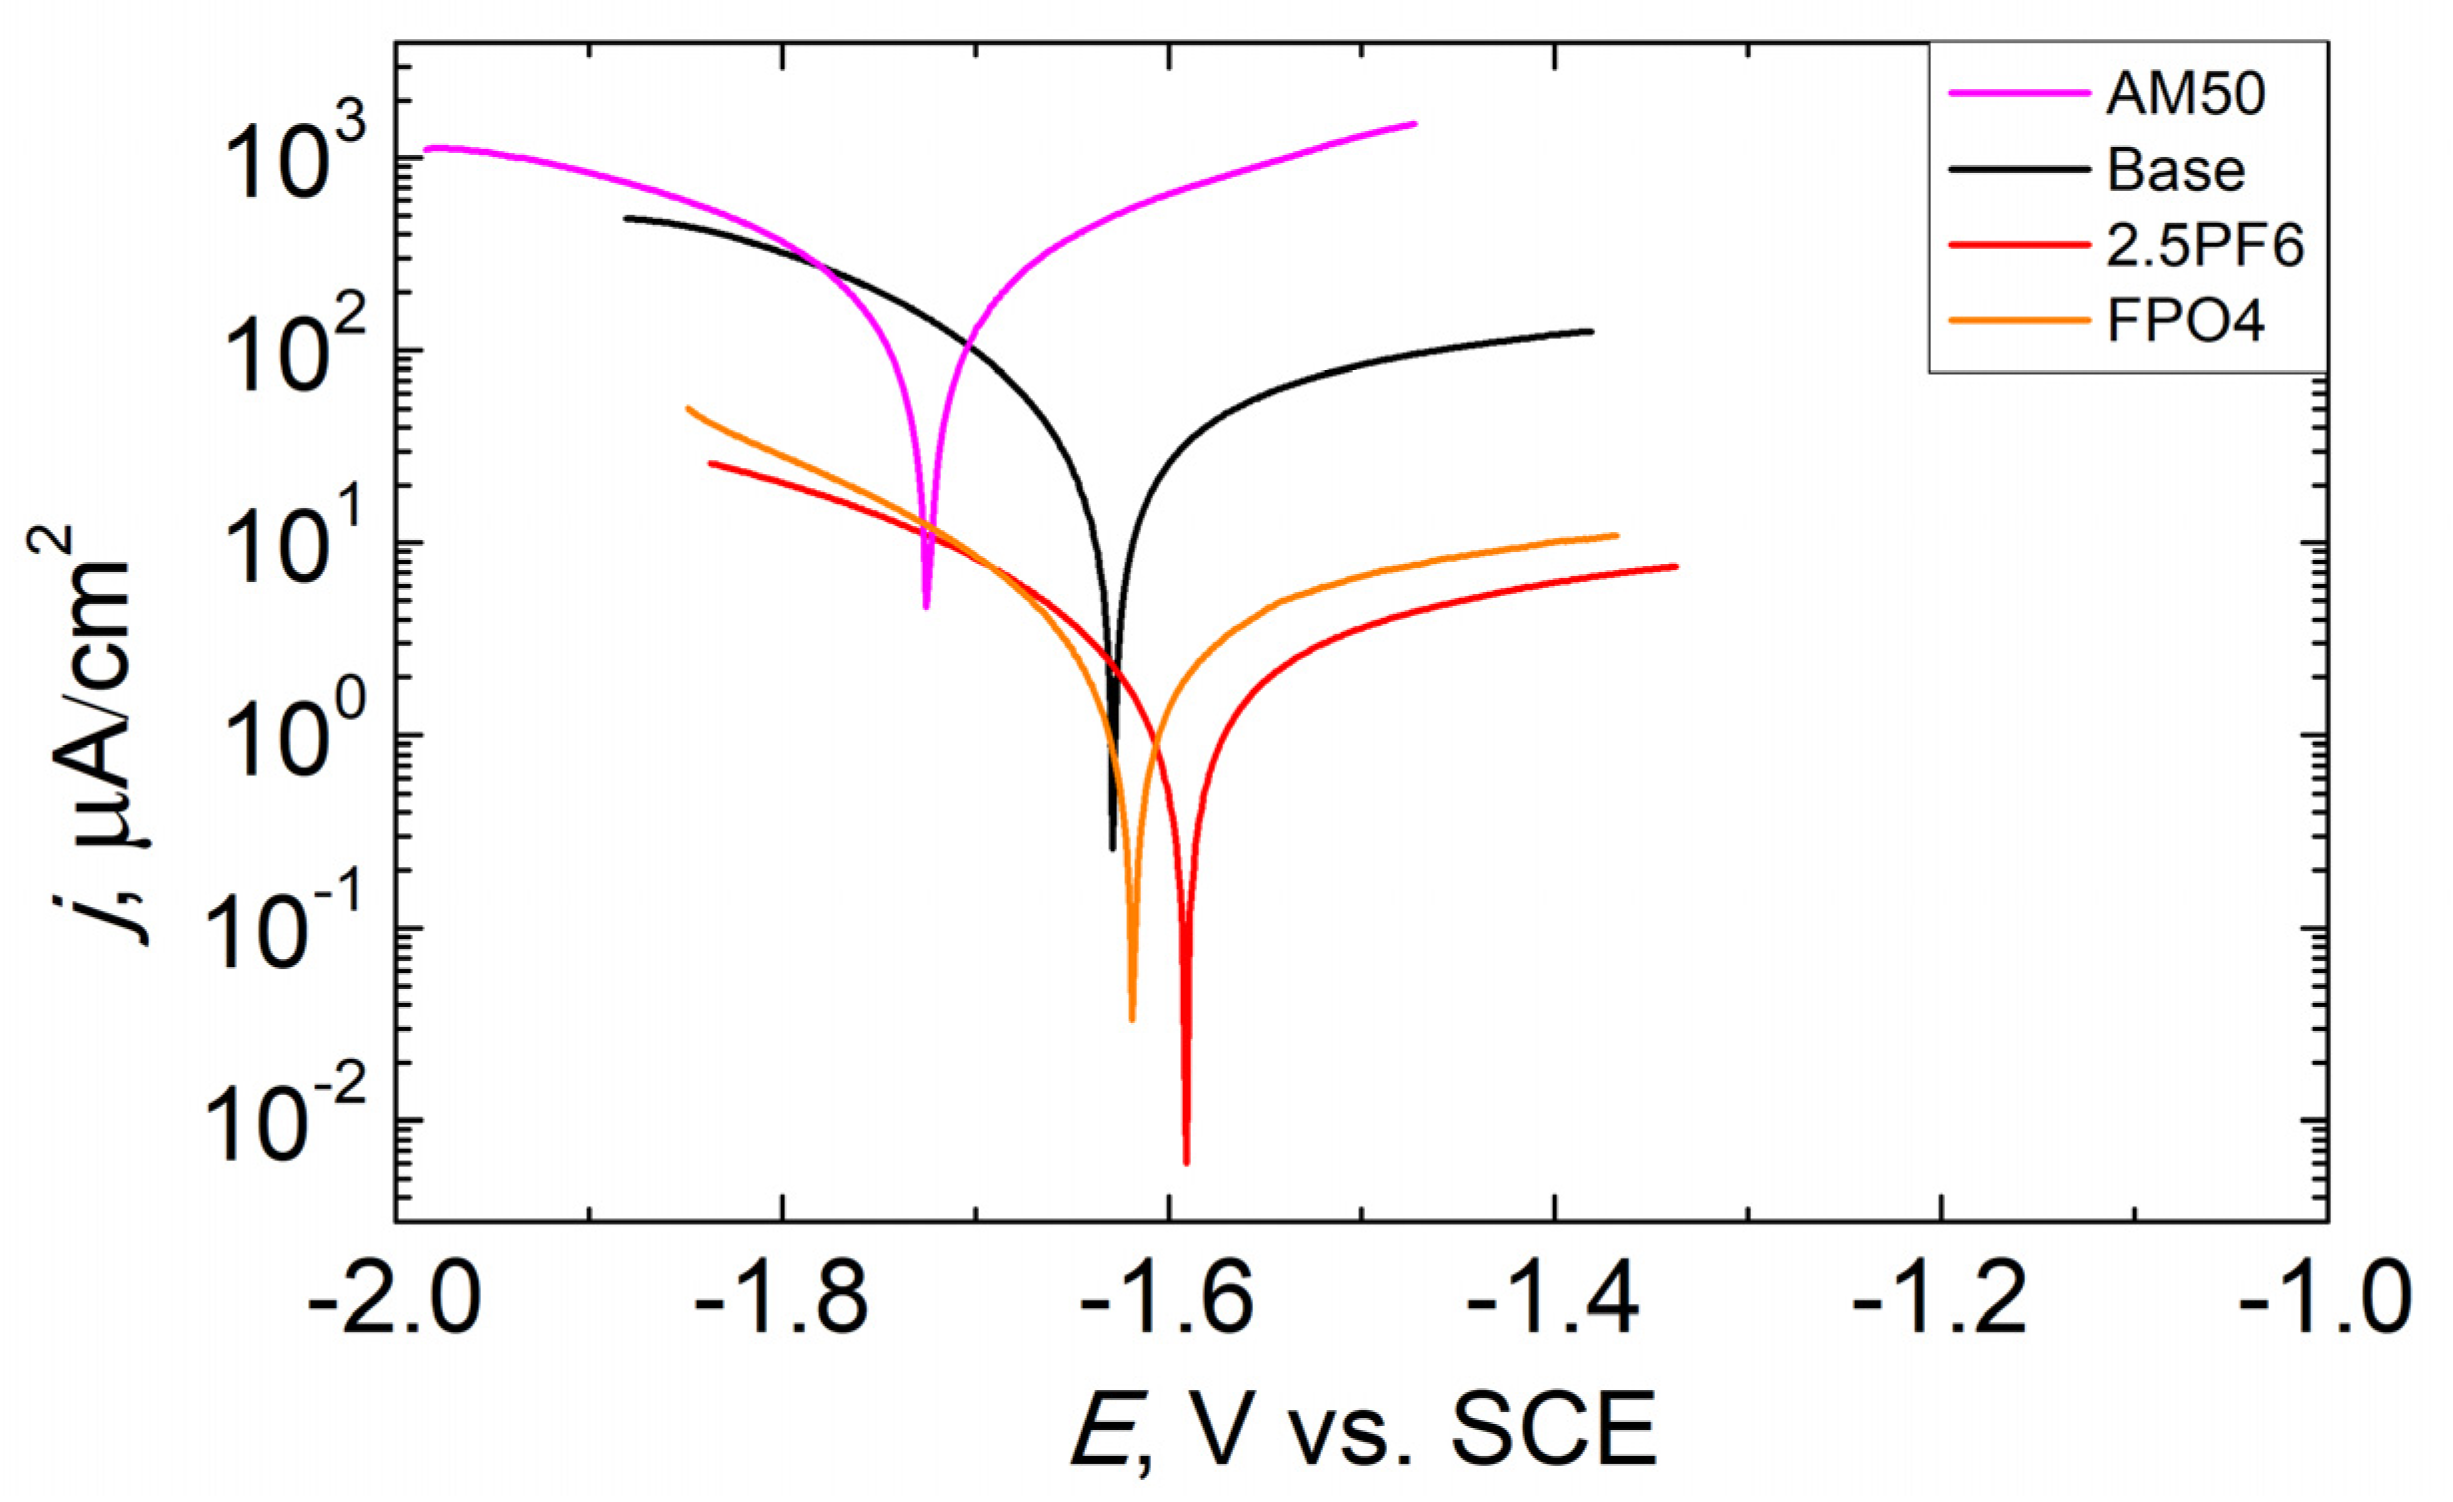
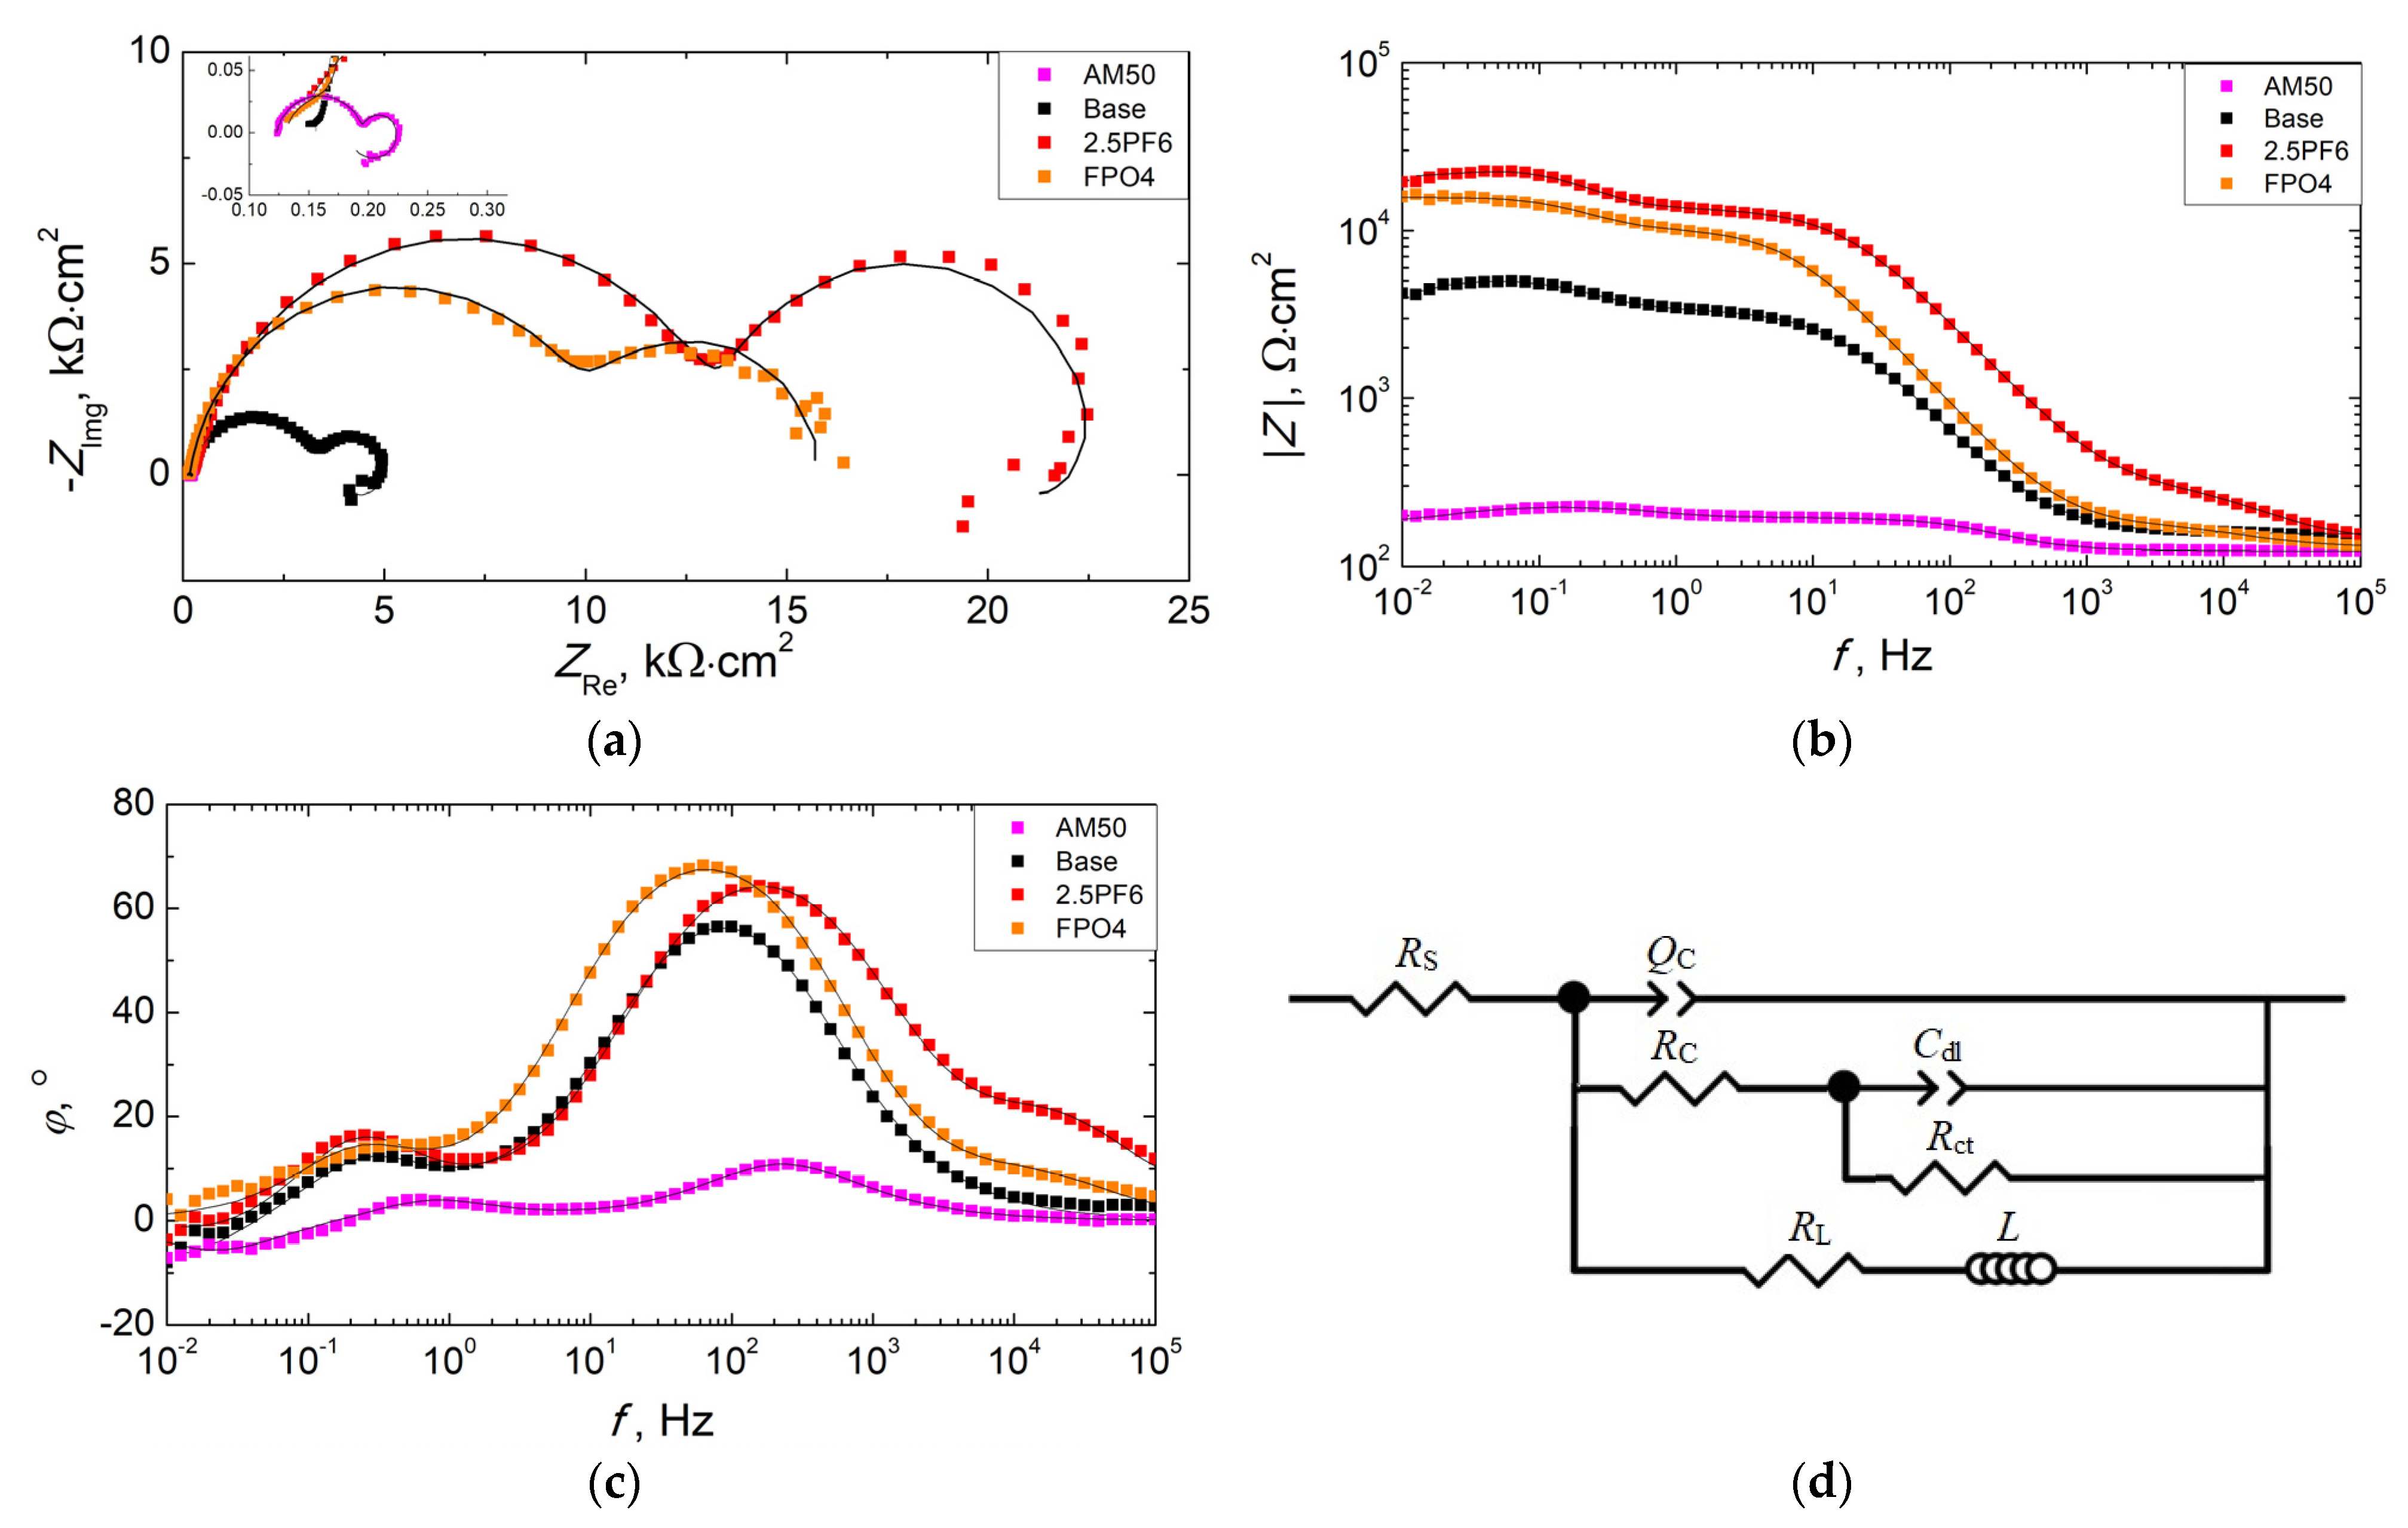
3.3. Corrosion Resistance of PEO Coatings

The anticorrosive performance of all PEO coatings has been evaluated by potentiodynamic polarization (PDP) testing after 3 h immersion in dilute Harrison solution (DHS). The results are shown in Figure 5 and Table 3.
Higher polarization resistance (RP) and lower corrosion current density (jCORR) indicate better corrosion resistance. Based on the recorded curves, it was found that the addition of KPF6 up to 2.5 g/L systematically decreased jCORR (from 33.01 to 1.76 µA/cm2) and increased RP (from 1.04 to 21.09 kΩ∙cm2). The addition of a larger amount of KPF6 reverses the observed trend and reduces the anticorrosive properties of PEO coatings. The corrosion potential (ECORR) shifts to more positive values in the entire tested range of KPF6 concentrations in the electrolyte bath.
To better describe the electrochemical behavior of PEO coatings synthesized in electrolytes with different concentrations of KPF6, electrochemical impedance spectroscopy (EIS) studies have been performed. To achieve the best fit of the data obtained, several equivalent circuits were analyzed, taking into consideration the physical model of the conversion coating and the possible corrosion processes. Finally, the impedance data obtained by EIS (Figure 6a–c) were analyzed using an equivalent circuit (EQC) model, as shown in Figure 6d.
In the circuit selected, RS represents the resistance of the electrolyte between the working and reference electrodes. Two consecutive groups of parallel combinations of resistors (ROL and RIL) and constant phase elements (QOL and QIL) were applied to describe the resistance and capacitance of the outer porous layer (103–105 Hz), and the inner barrier layer (103–101 Hz), respectively. Rct and Cdl represent the resistance of charge transfer and the electrochemical double layer capacitance at the substrate/coating interface, which corresponds to the low frequency time constant (101–10−1 Hz). An inductive loop in the low-frequency range is related to the dissolution of Mg and indicates that pitting corrosion of the substrate takes place. It is represented by the resistance RL and the inductance L [50]. Constant phase elements (Q) used in equivalent circuits were selected instead of pure capacitance for better fitting because the surface of the conversion coatings is physicochemically inhomogeneous, uneven, and rough. The Q impedance is described as:
Z CPE = 1 Q 0 ( j ω ) n
where ω is the angular frequency, j is the imaginary number, Q0 is the constant admittance, and n is the empirical exponent.
The simulated values (fitting parameters) obtained by matching the theoretical model and the experimental data are presented in Table 4. Good fit quality was achieved, which is demonstrated by the low values of the chi-square test (Χ2) and the good agreement between the experimental data and the fitting results (dots and lines in Figure 6a–c).
It is possible to calculate the total resistance (Rtotal) of PEO coatings from the difference between the resistance at low frequency (|Z|f→0) and the resistance of the electrolyte solution (|Z|f→∞) [51,52]. When the frequency goes to zero, the impedance of the capacitive components approaches infinity and the inductive component tends to zero (|ZL|→0). Therefore, the total resistance of the corrosion system can be calculated from a combination of ROL, RIL, Rct, and RL:
R total = | Z | f 0 | Z | f = R OL + R IL + ( 1 R ct + 1 R L ) 1
From the EIS measurements, it follows that after 3 h of immersion in a corrosive medium, the outer layer of the PEO coating has no influence on the anticorrosive properties of the system, and the resistance of the layer is below approximately 0.2 kΩ·cm2. The corrosion resistance of the PEO coatings depends mainly on the resistance of the dense inner layer, and the resistance of charge transfer at the substrate/coating interface [23,31,33,53]. With an increase in the amount of KPF6 in the bath, an increase in the ratio of Rct to RIL is observed, which suggests the influence of the additive on the self-healing processes. The sealing process of PEO coatings on magnesium alloys by corrosion products has been reported [39,53]. However, the presence of aggressive ions in the corrosive medium causes pitting corrosion (dissolution of Mg), which is indicated by the inductive loop in the EIS spectrum at low frequencies [50,51,54]. The addition of up to 2.5 g/L KPF6 to the electrolyte bath increases the corrosion resistance of the PEO coatings, while its larger amounts result in a reduction in the protective properties of the coatings. The best anticorrosive properties were demonstrated by the PEO coating prepared with the addition of 2.5 g/L KPF6 (Rtotal = 20.61 kΩ·cm2). The observed decrease in the anticorrosive properties of the coatings obtained at higher concentrations is probably due to the hydrolysis of KPF6 during the PEO process, with the release of HF. The hydrolysis process of KPF6 leading to the formation of HF has been reported [55,56]. An increase in the concentration of KPF6 in electrolytic baths can induce the local appearance of larger amounts of HF in the reaction environment, which can cause damage to the formed coatings.
To show the advantage of using KPF6 instead of the combination of NaF and Na3PO4, which are commonly applied as additives to the PEO electrolyte baths, the anticorrosive properties of the layers obtained in different electrolytes, listed in Table 5, have been compared. In the baths containing fluorine and phosphorus, their contents were equimolar. The bath containing 2.5 g/L KPF6 was chosen for comparison, as the coatings obtained in this electrolyte have shown the best anticorrosive properties. The results of the measurements of potentiodynamic polarization and electrochemical impedance spectroscopy for the coatings obtained, and also for the uncoated AM50 magnesium, are presented in Figure 7 and Figure 8, as well as Table 6 and Table 7.
The uncoated AM50 magnesium alloy shows a very high corrosion rate in the DHS solution (corrosion current density and polarization resistance are equal to 140 μA/cm2 and 220 Ω·cm2, respectively). The PEO treatment in the base electrolyte increases the corrosion resistance of the substrate by more than 4 times. The introduction of additives containing fluorine and phosphorus into the electrolyte further increases the anticorrosive properties of conversion coatings, and the presence of an additive in the form of a single salt (KPF6) is more effective than a mixture of fluoride and orthophosphate (jCORR and RP are equal to 1.76 μA/cm2, 21.09 kΩ·cm2 and 2.75 μA/cm2, and 13.41 kΩ·cm2, for 2.5PF6 and FPO4 samples, respectively).
The impedance spectrum obtained for the coating produced on the FPO4 sample (with NaF and Na3PO4) does not show a visible induction loop at low frequencies. This means that the value of the total resistance (Rtotal) is equal to the sum of ROL, RIL, and Rct). In the case of the EIS spectrum of the uncoated AM50 alloy, the occurrence of two capacitive loops (at high and medium frequencies) and an impedance loop at low frequencies can be observed. The first capacitive loop is the result of a naturally formed oxide layer in an aqueous environment (RC, QC), while the second loop can be associated with the charge-transfer process (Rct, Cdl). The visible inductive loop indicates the presence of localized corrosion (RL, QL) [52]. The equivalent circuit model used to fit the EIS data for measurements on the uncoated magnesium alloy is shown in Figure 8d. The total resistance (Rtotal) in this case could be obtained by a combination of RC, Rct, and RL:
R total = ( 1 R C + R ct + 1 R L ) 1
The results obtained have shown that the conversion coatings produced in the PEO process significantly increase the corrosion resistance of the AM50 magnesium alloy (Rtotal = 3.8 kΩ·cm2). The introduction of additives into the silicate base bath further improves the barrier properties of the coatings. The addition of KPF6 makes it possible to obtain better anticorrosive properties of the synthesized coating, compared to a mixture of NaF and Na3PO4 with an equimolar content of fluorine and phosphorus (the total resistance for the 2.5PF6 sample is higher, compared to the FPO4 sample).

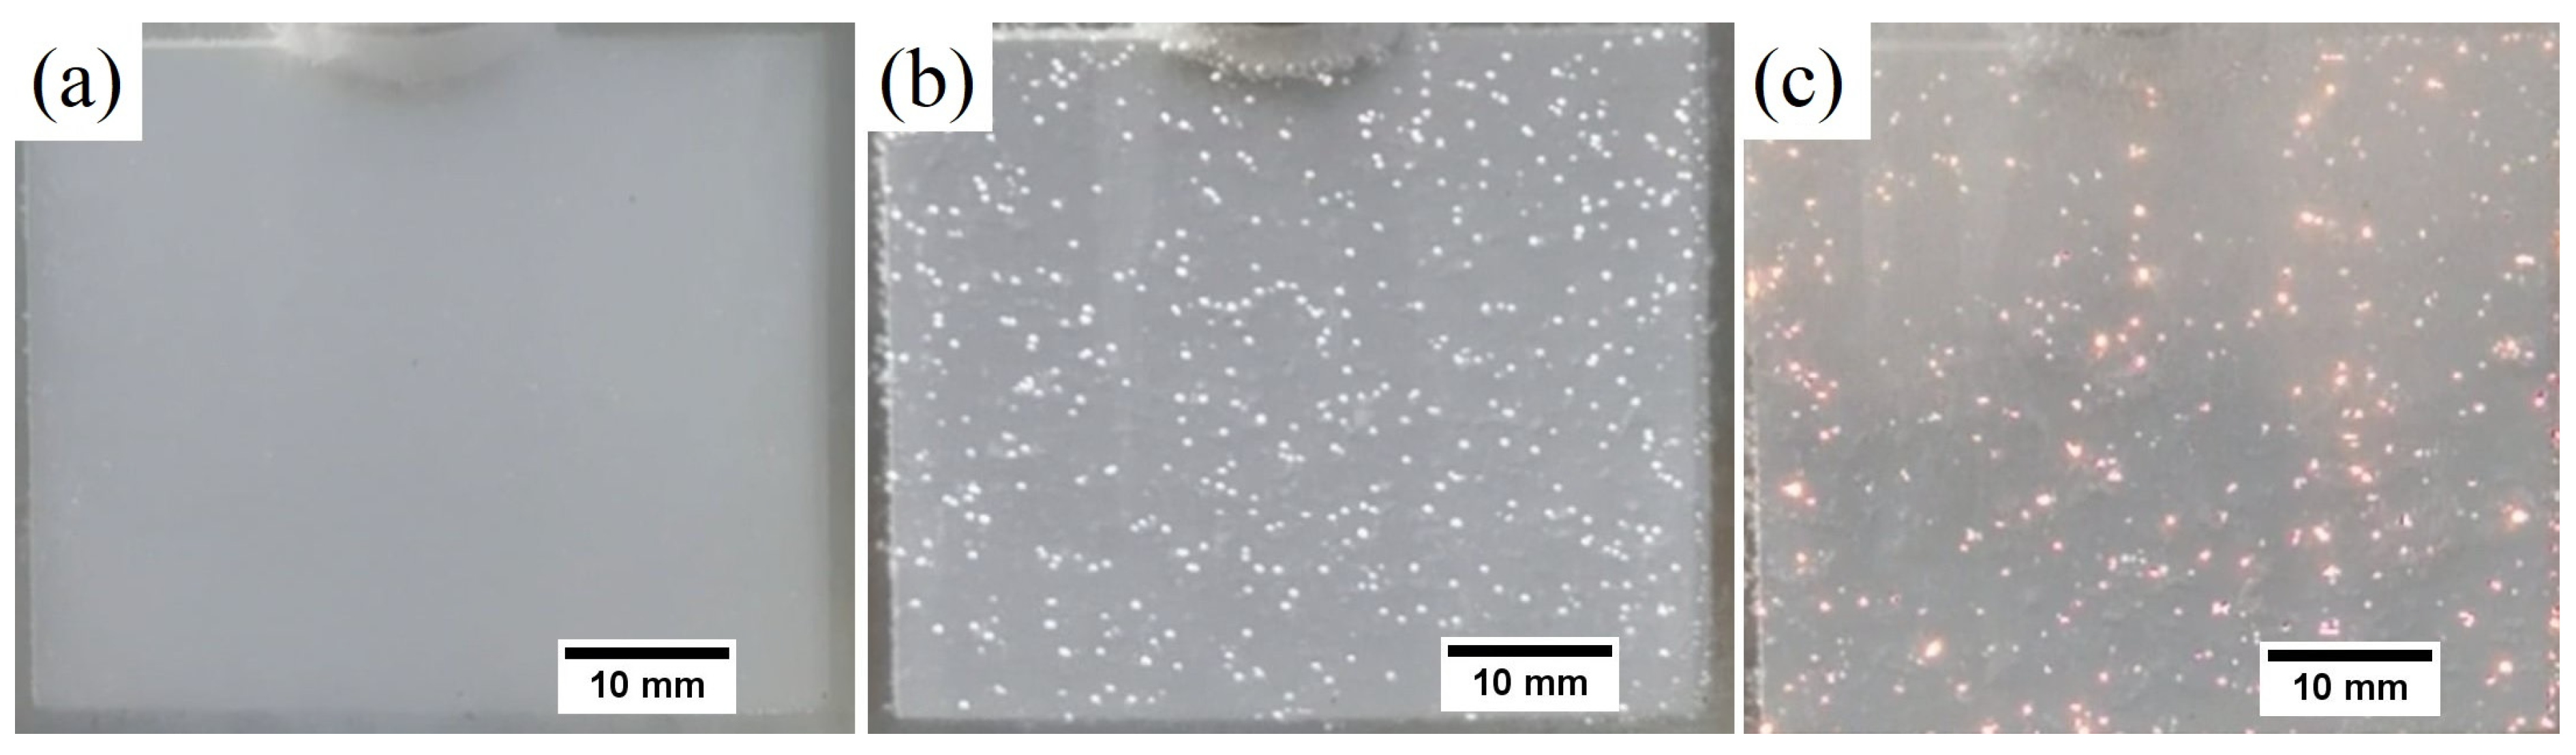
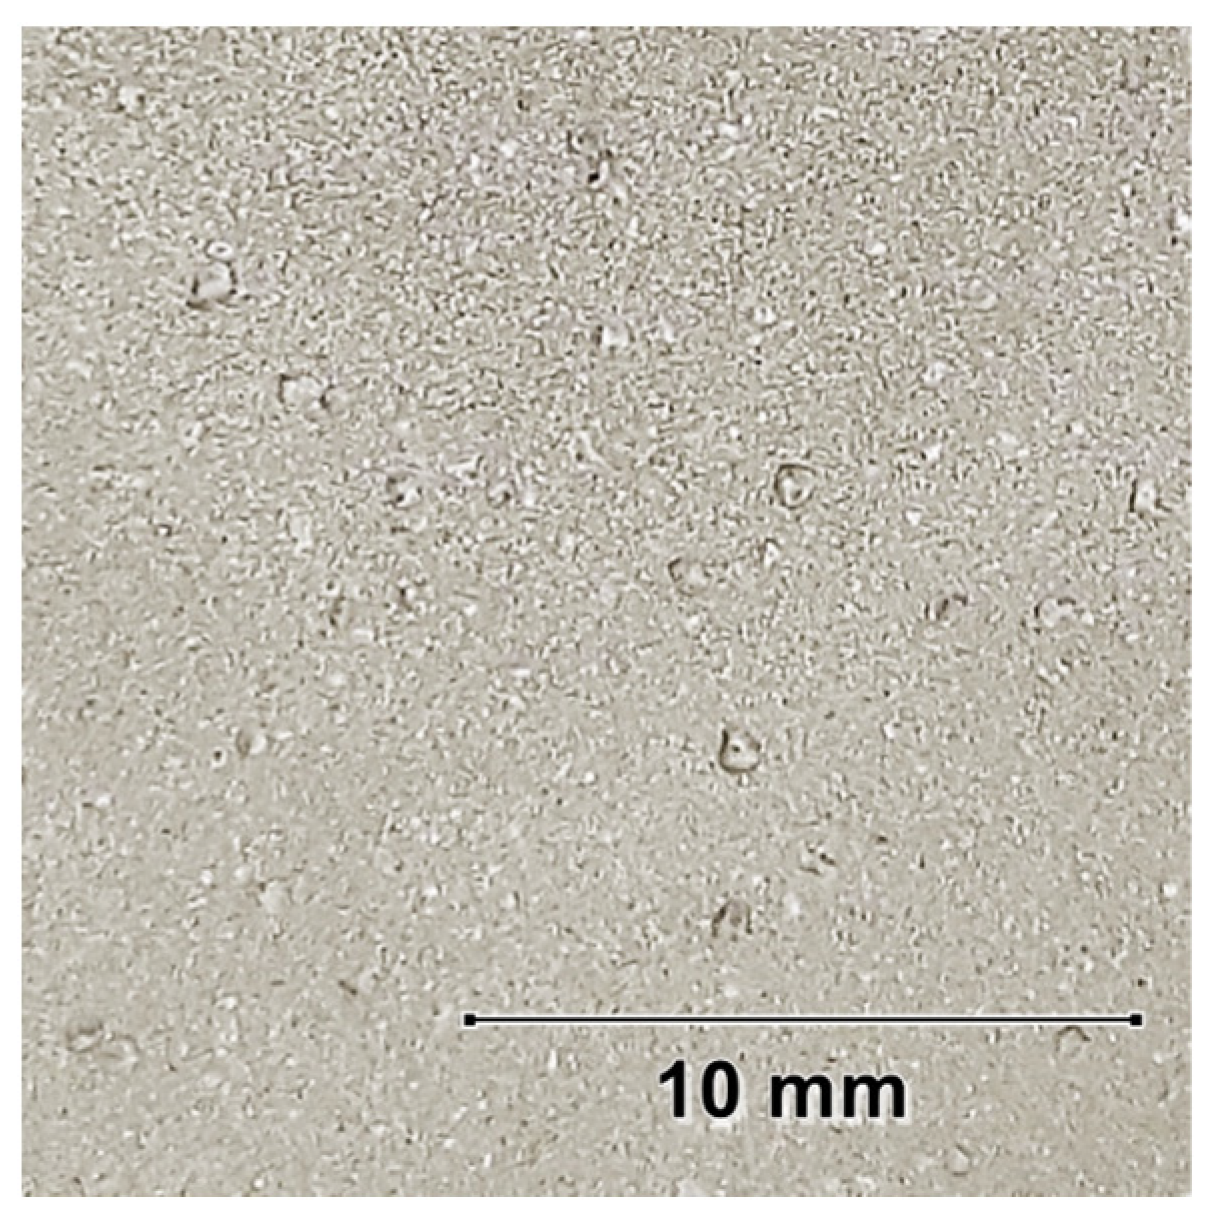
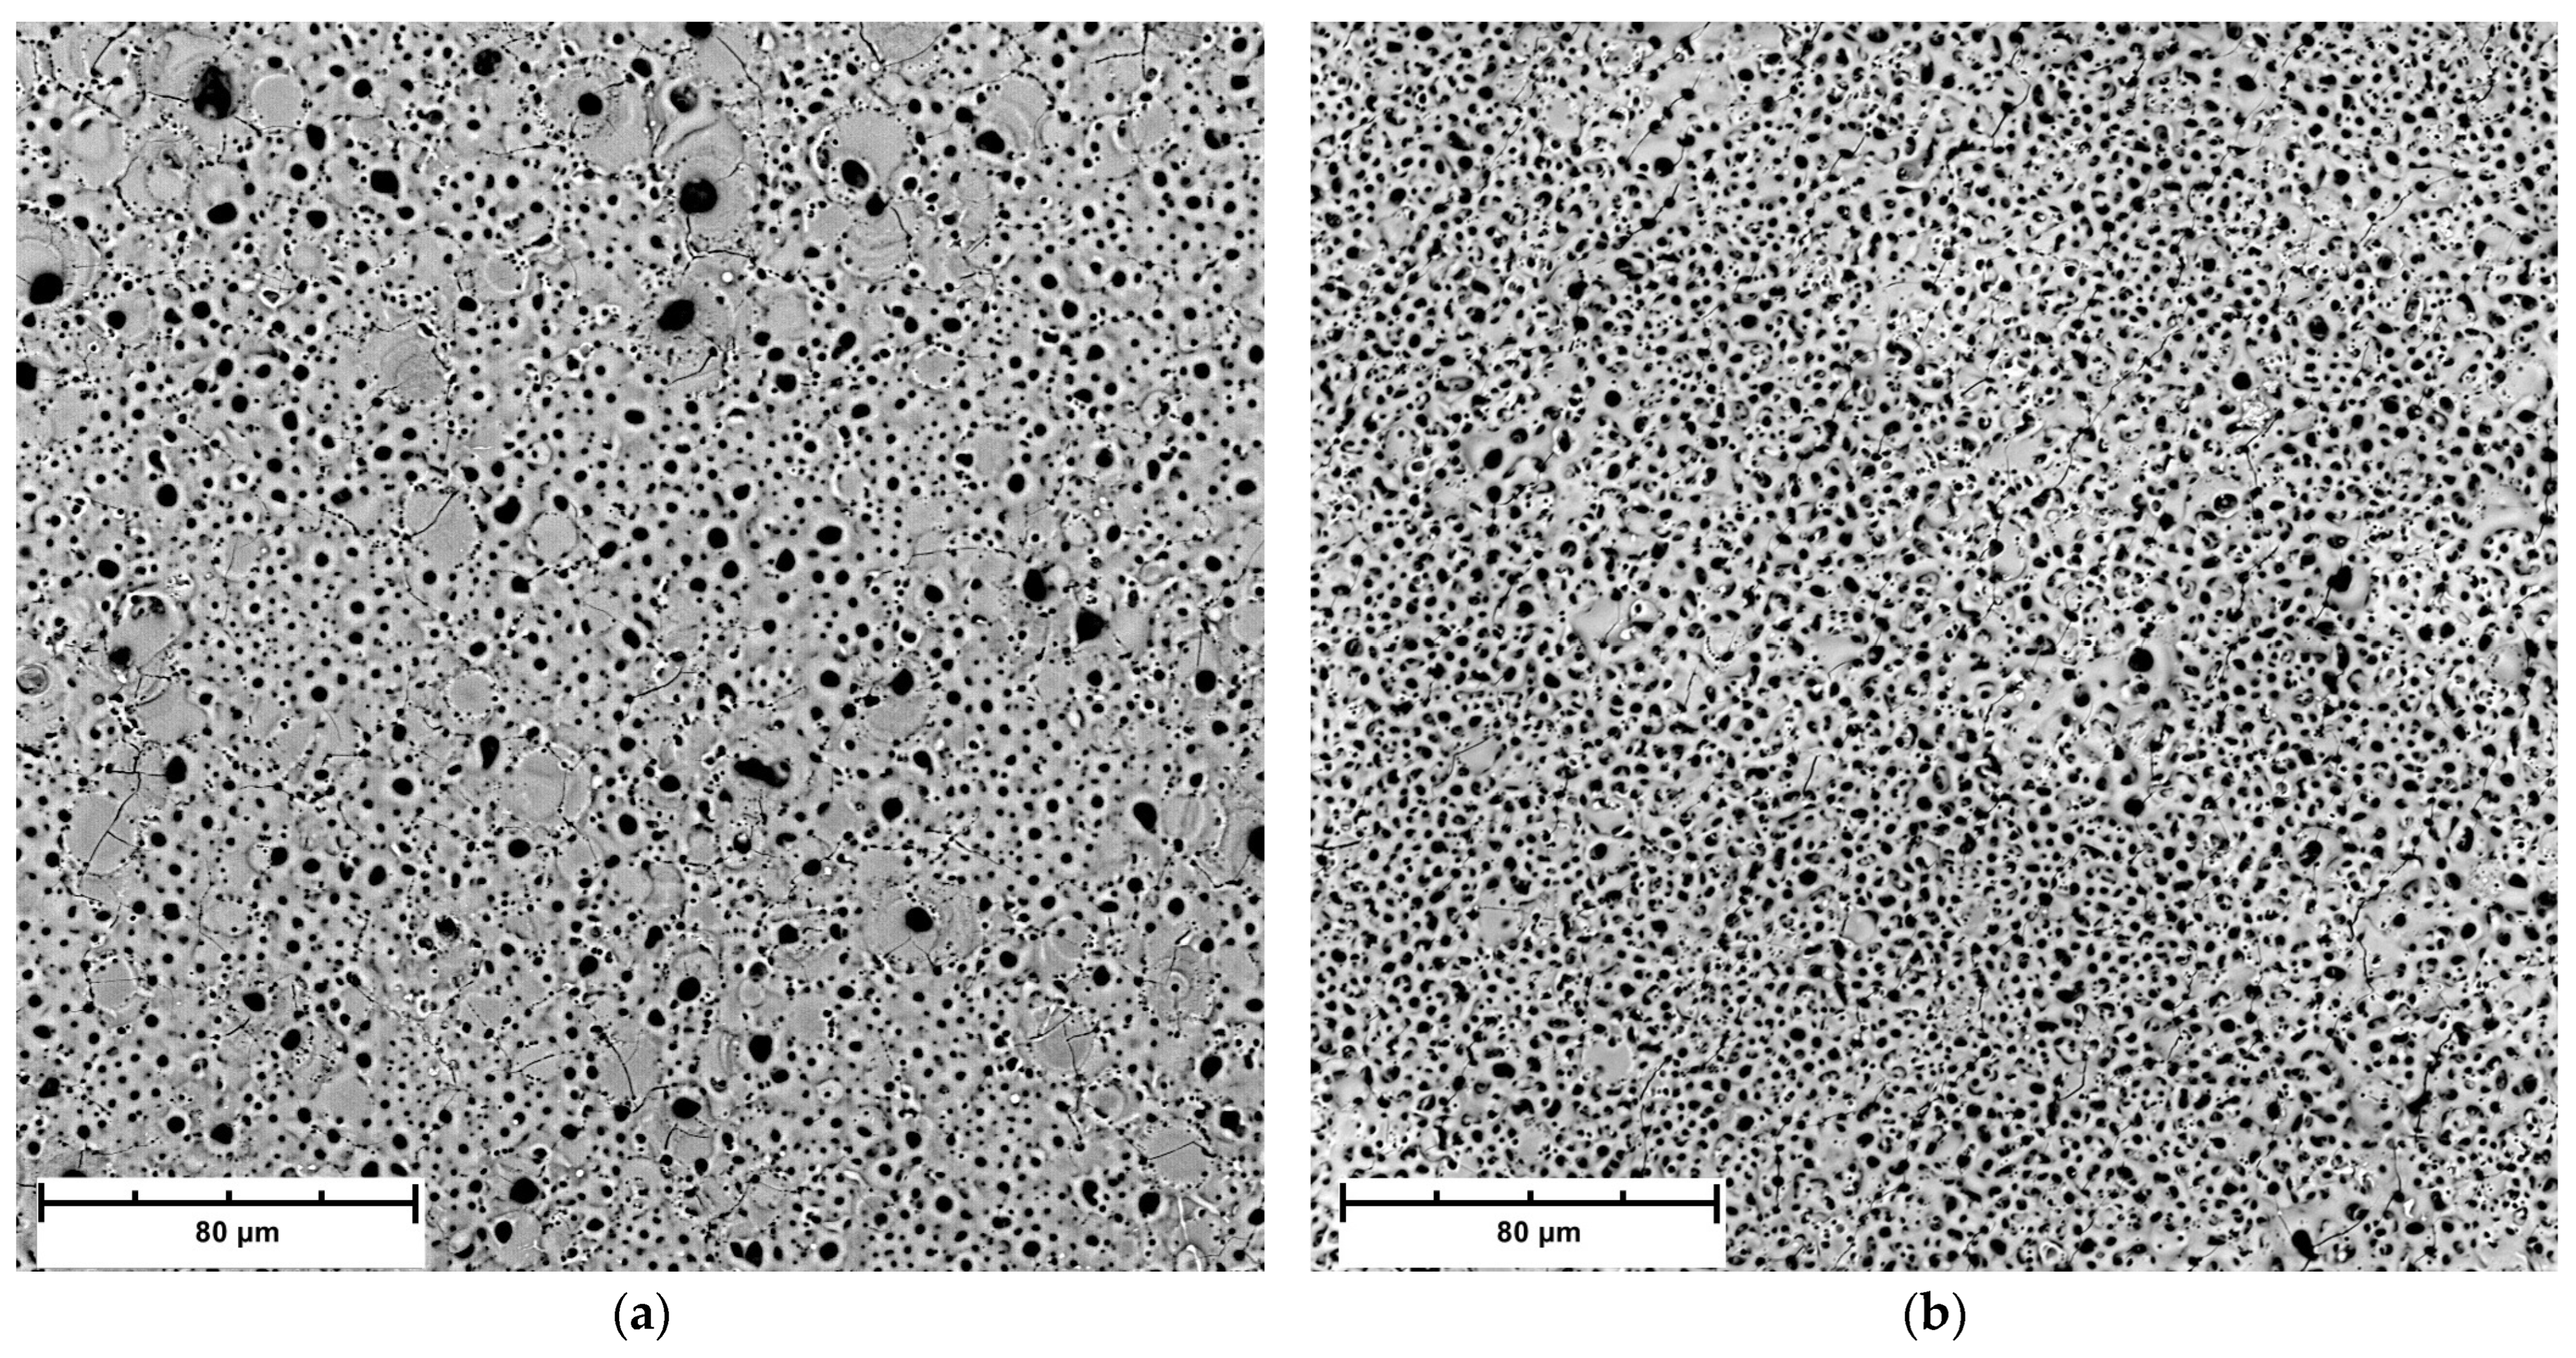
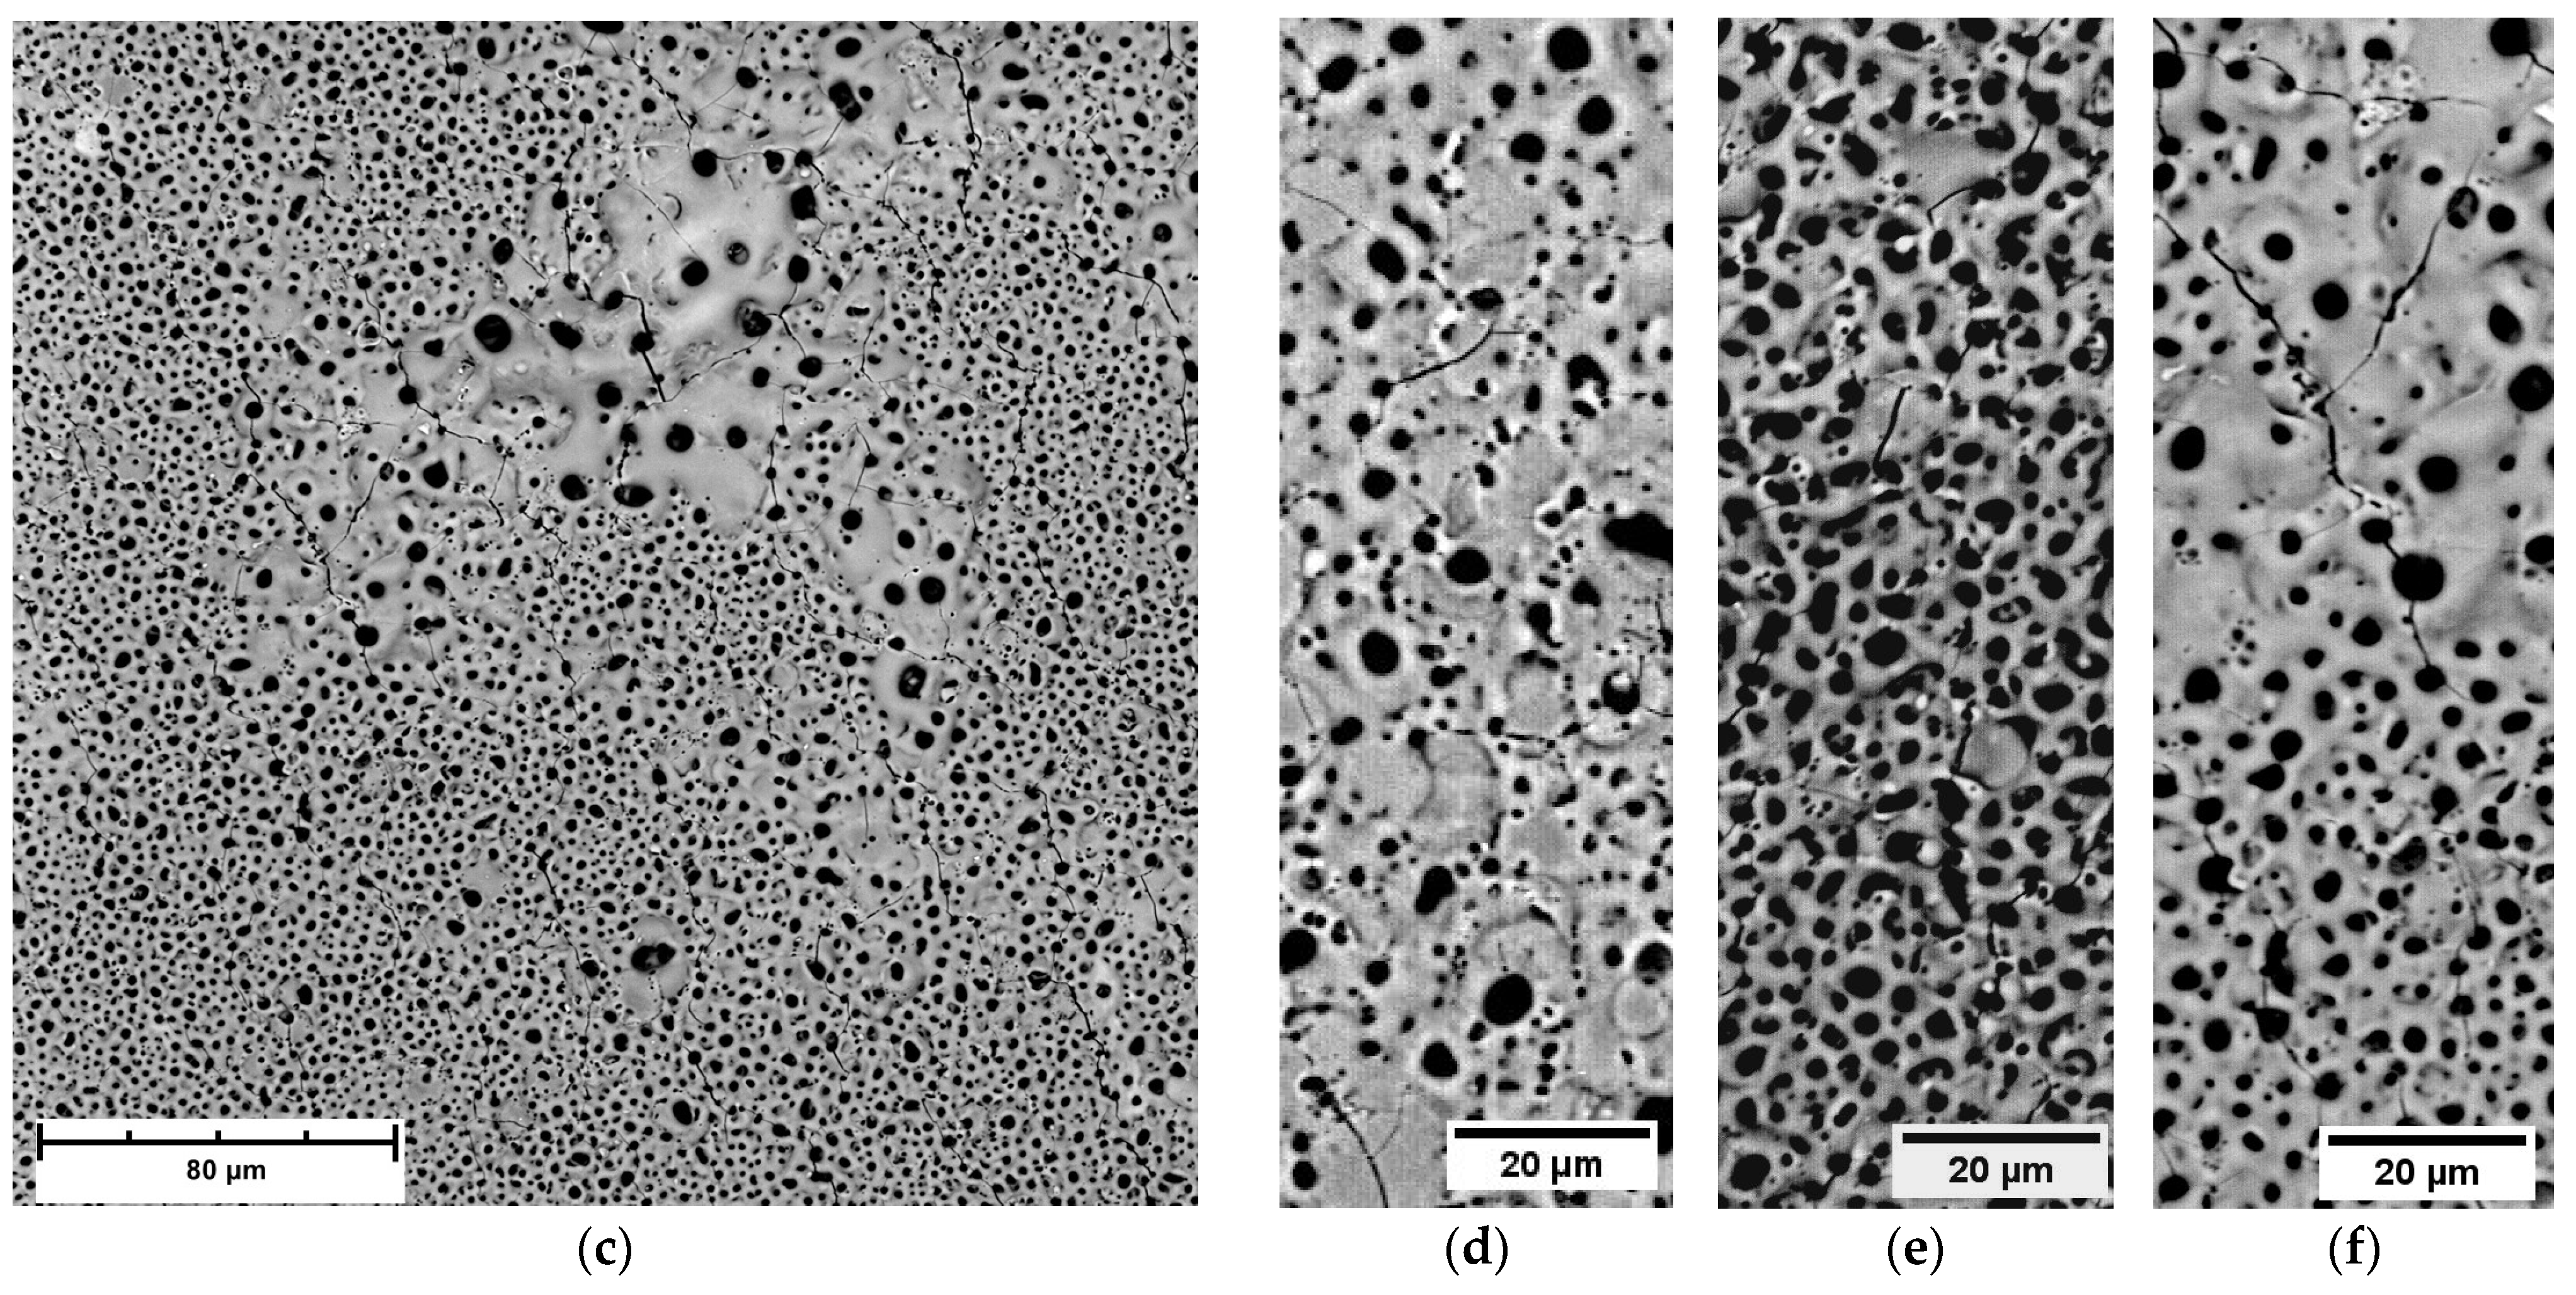
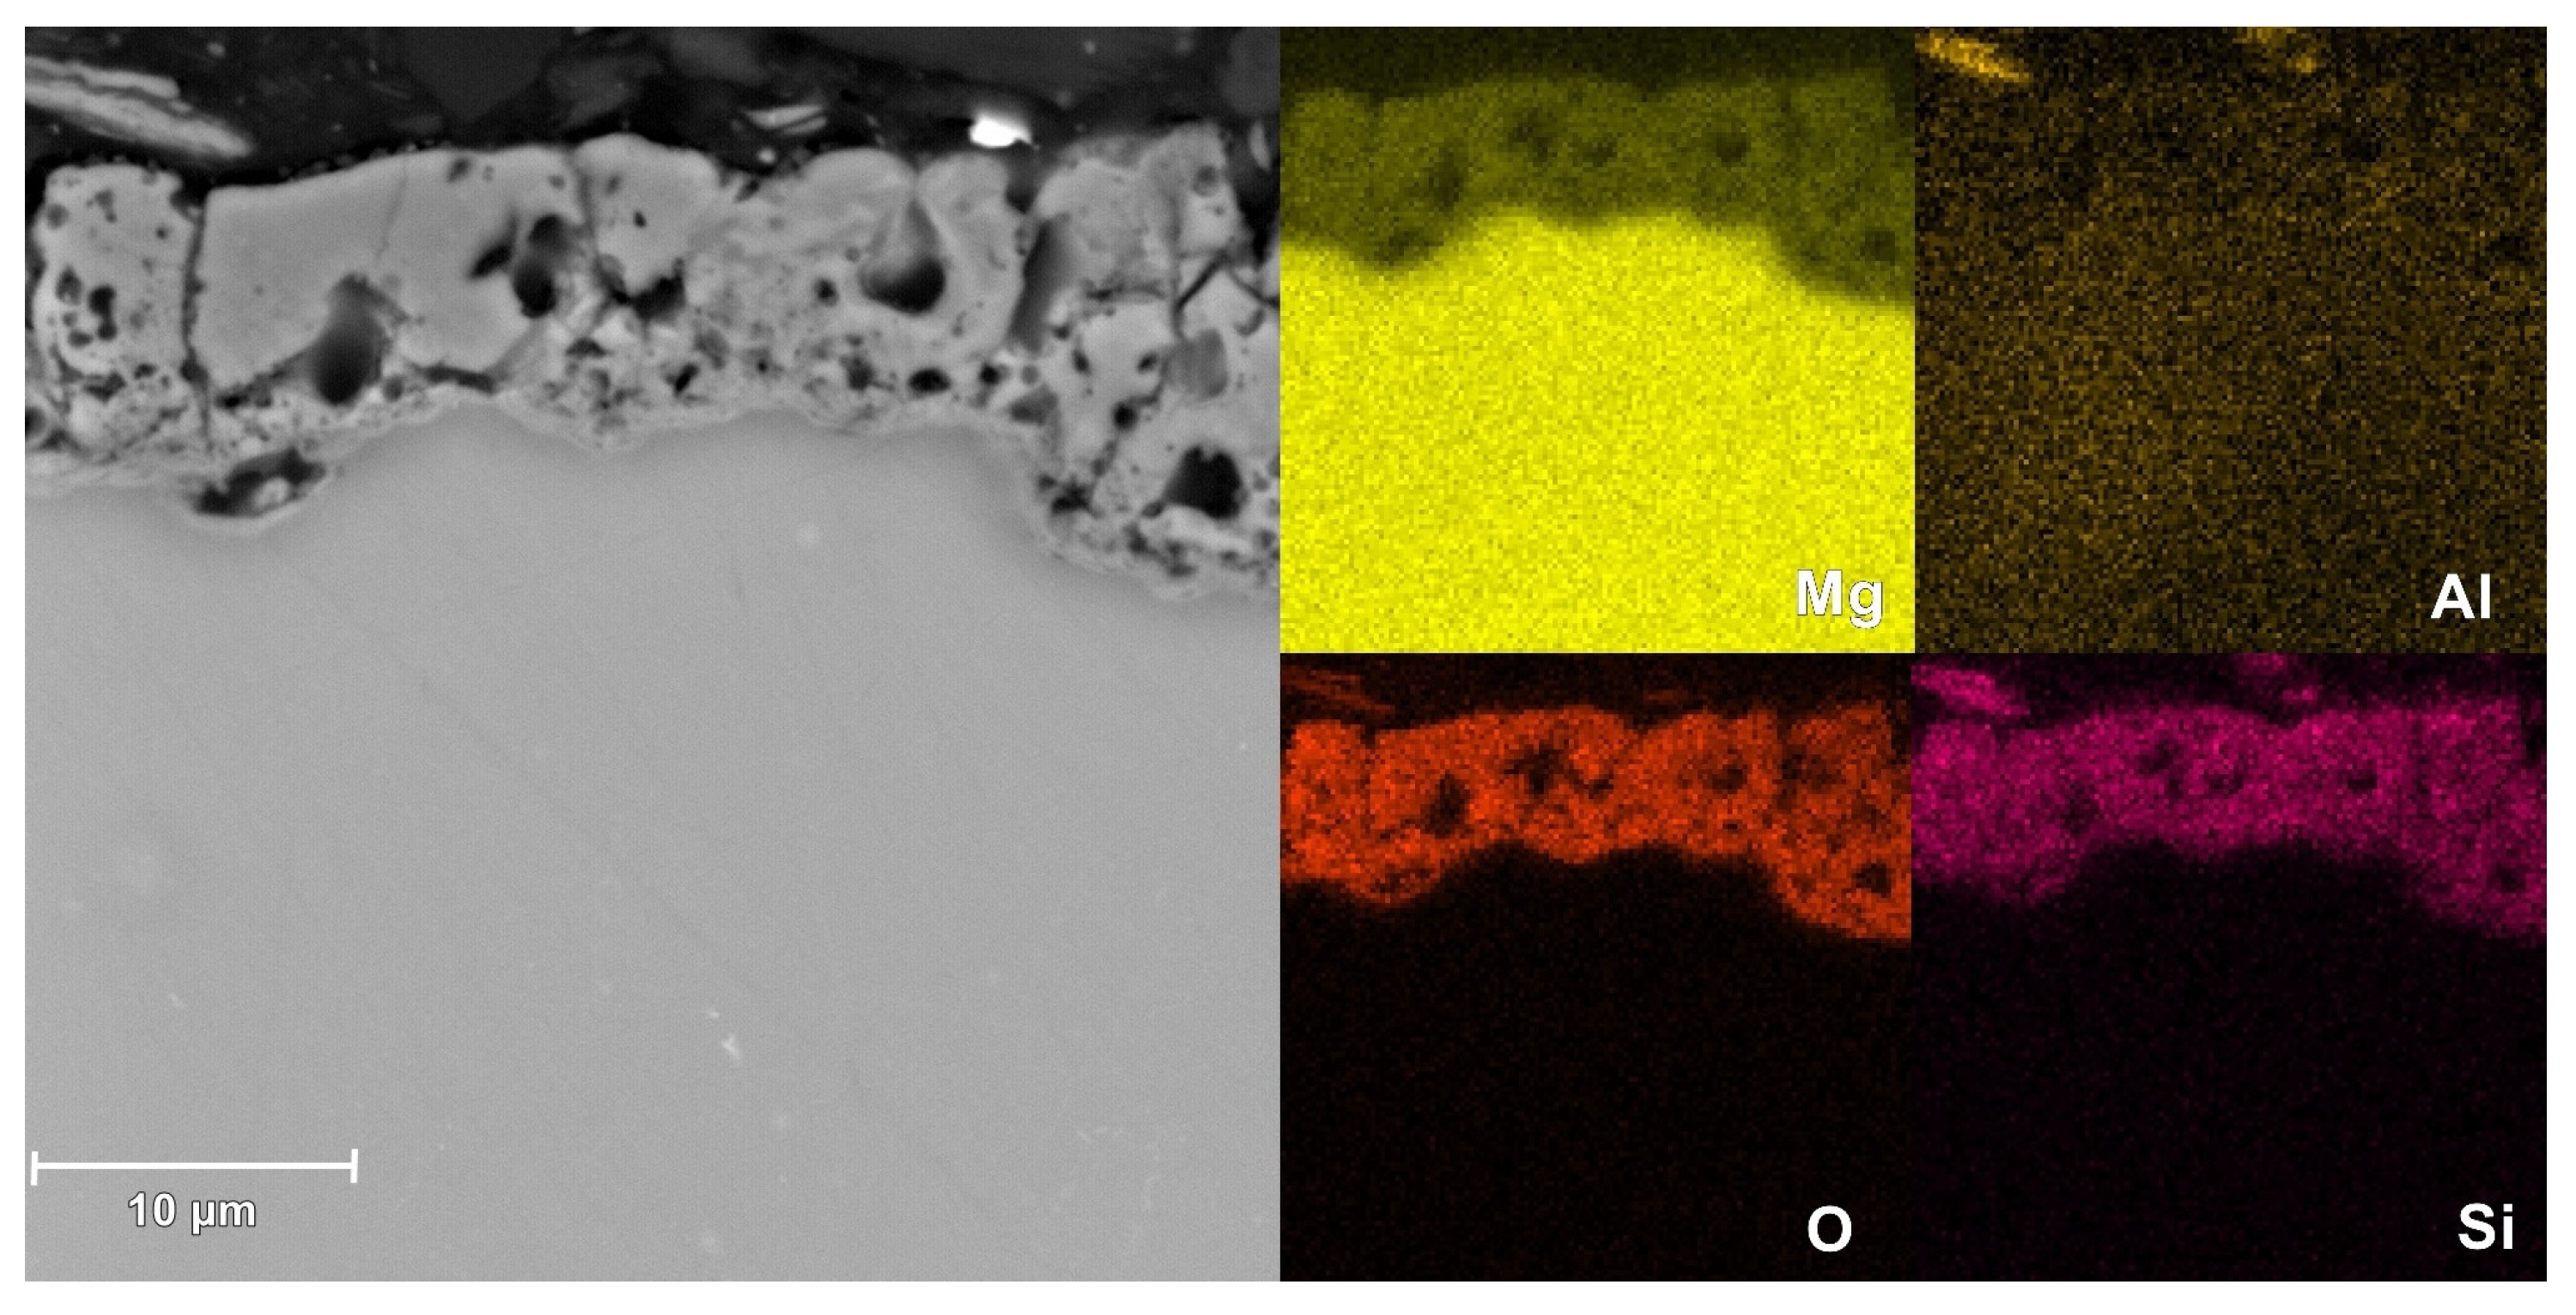
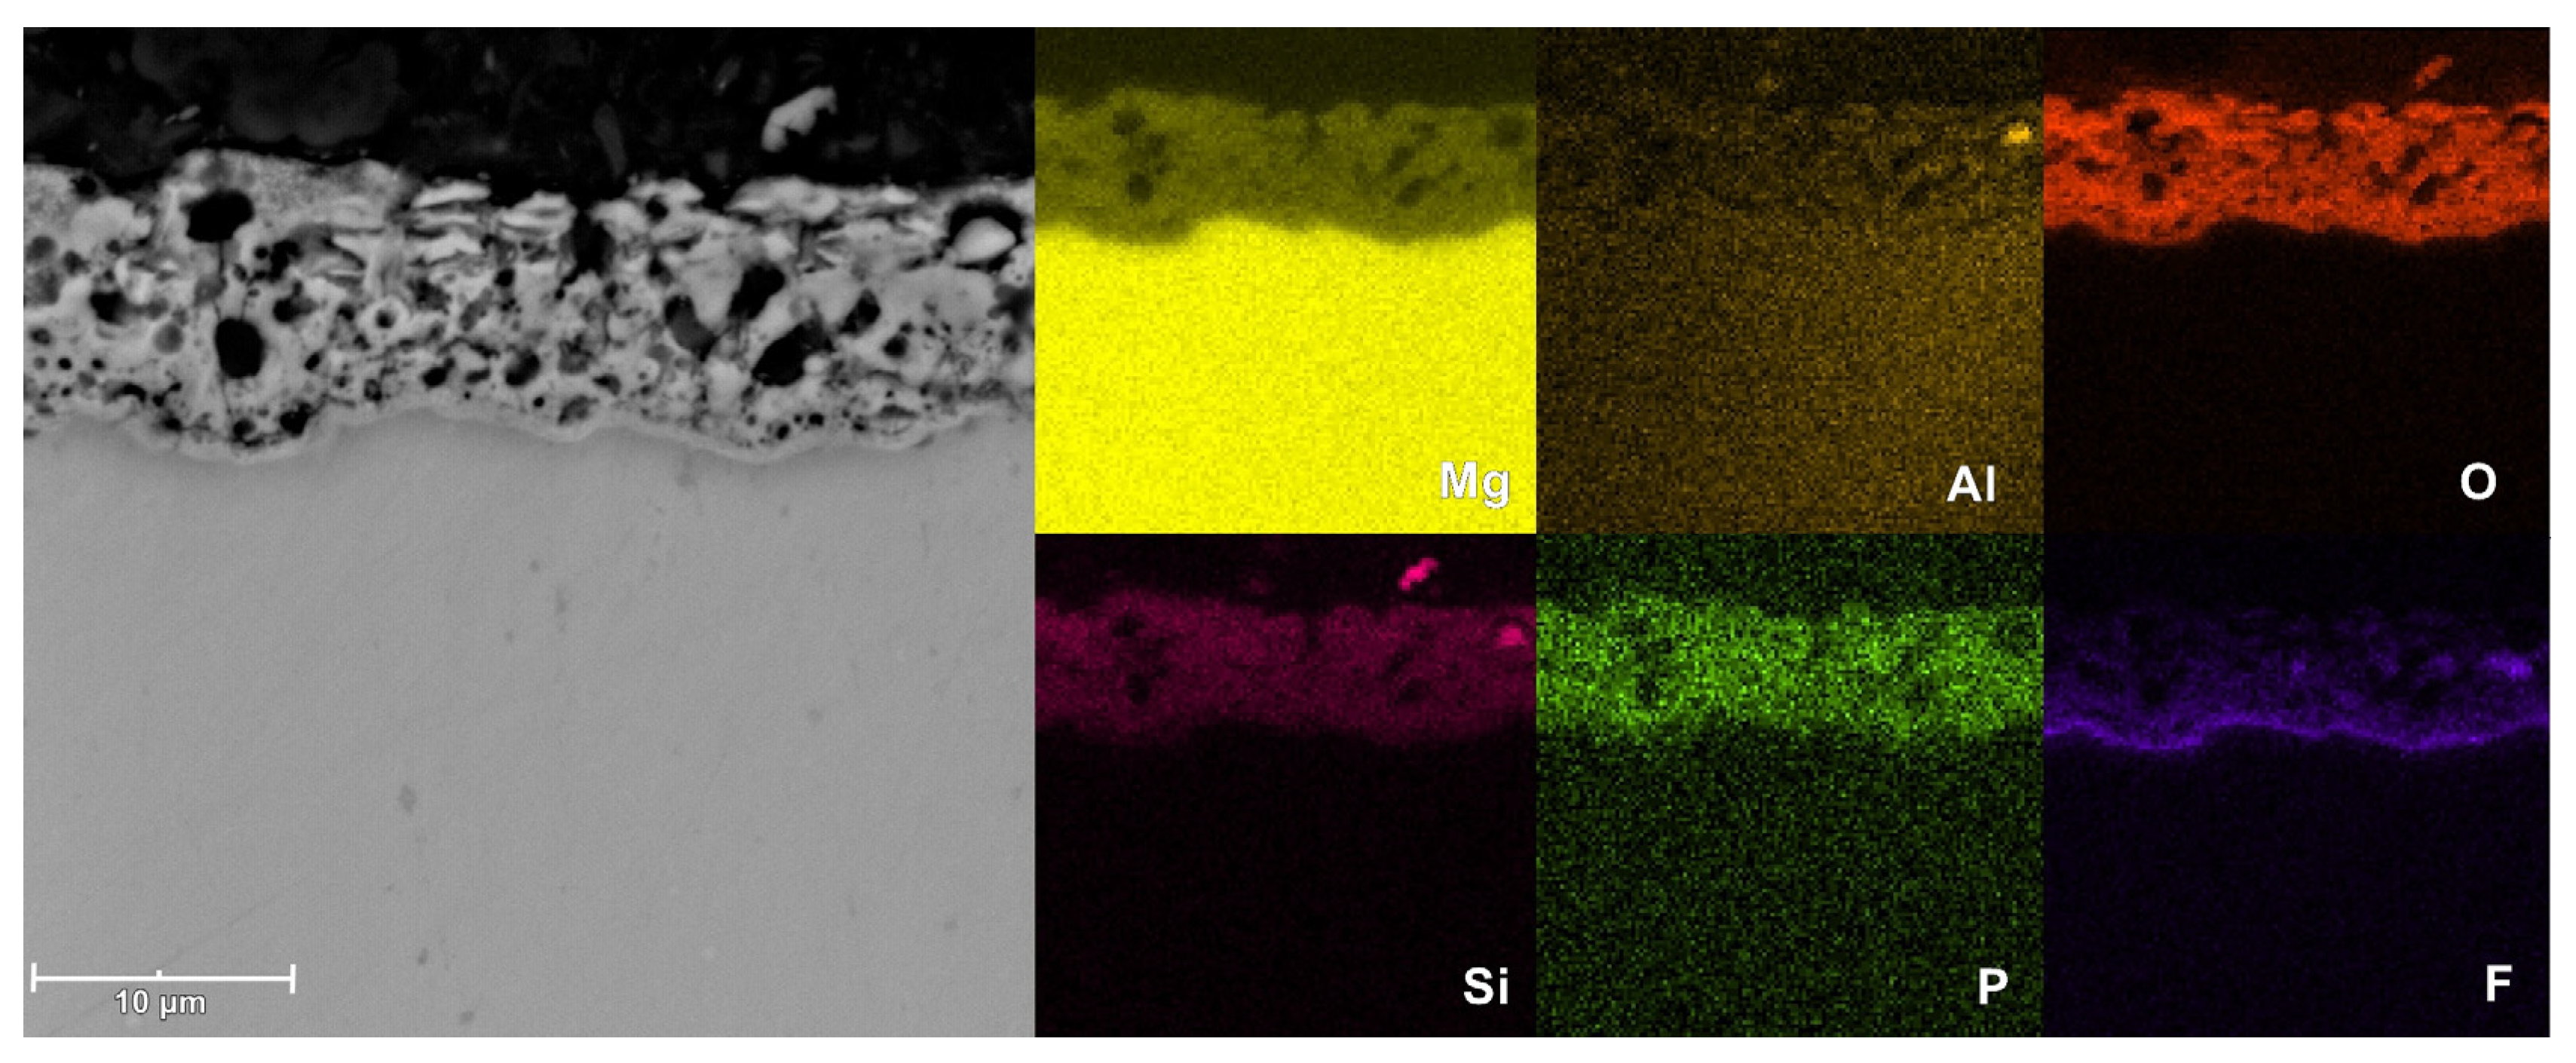
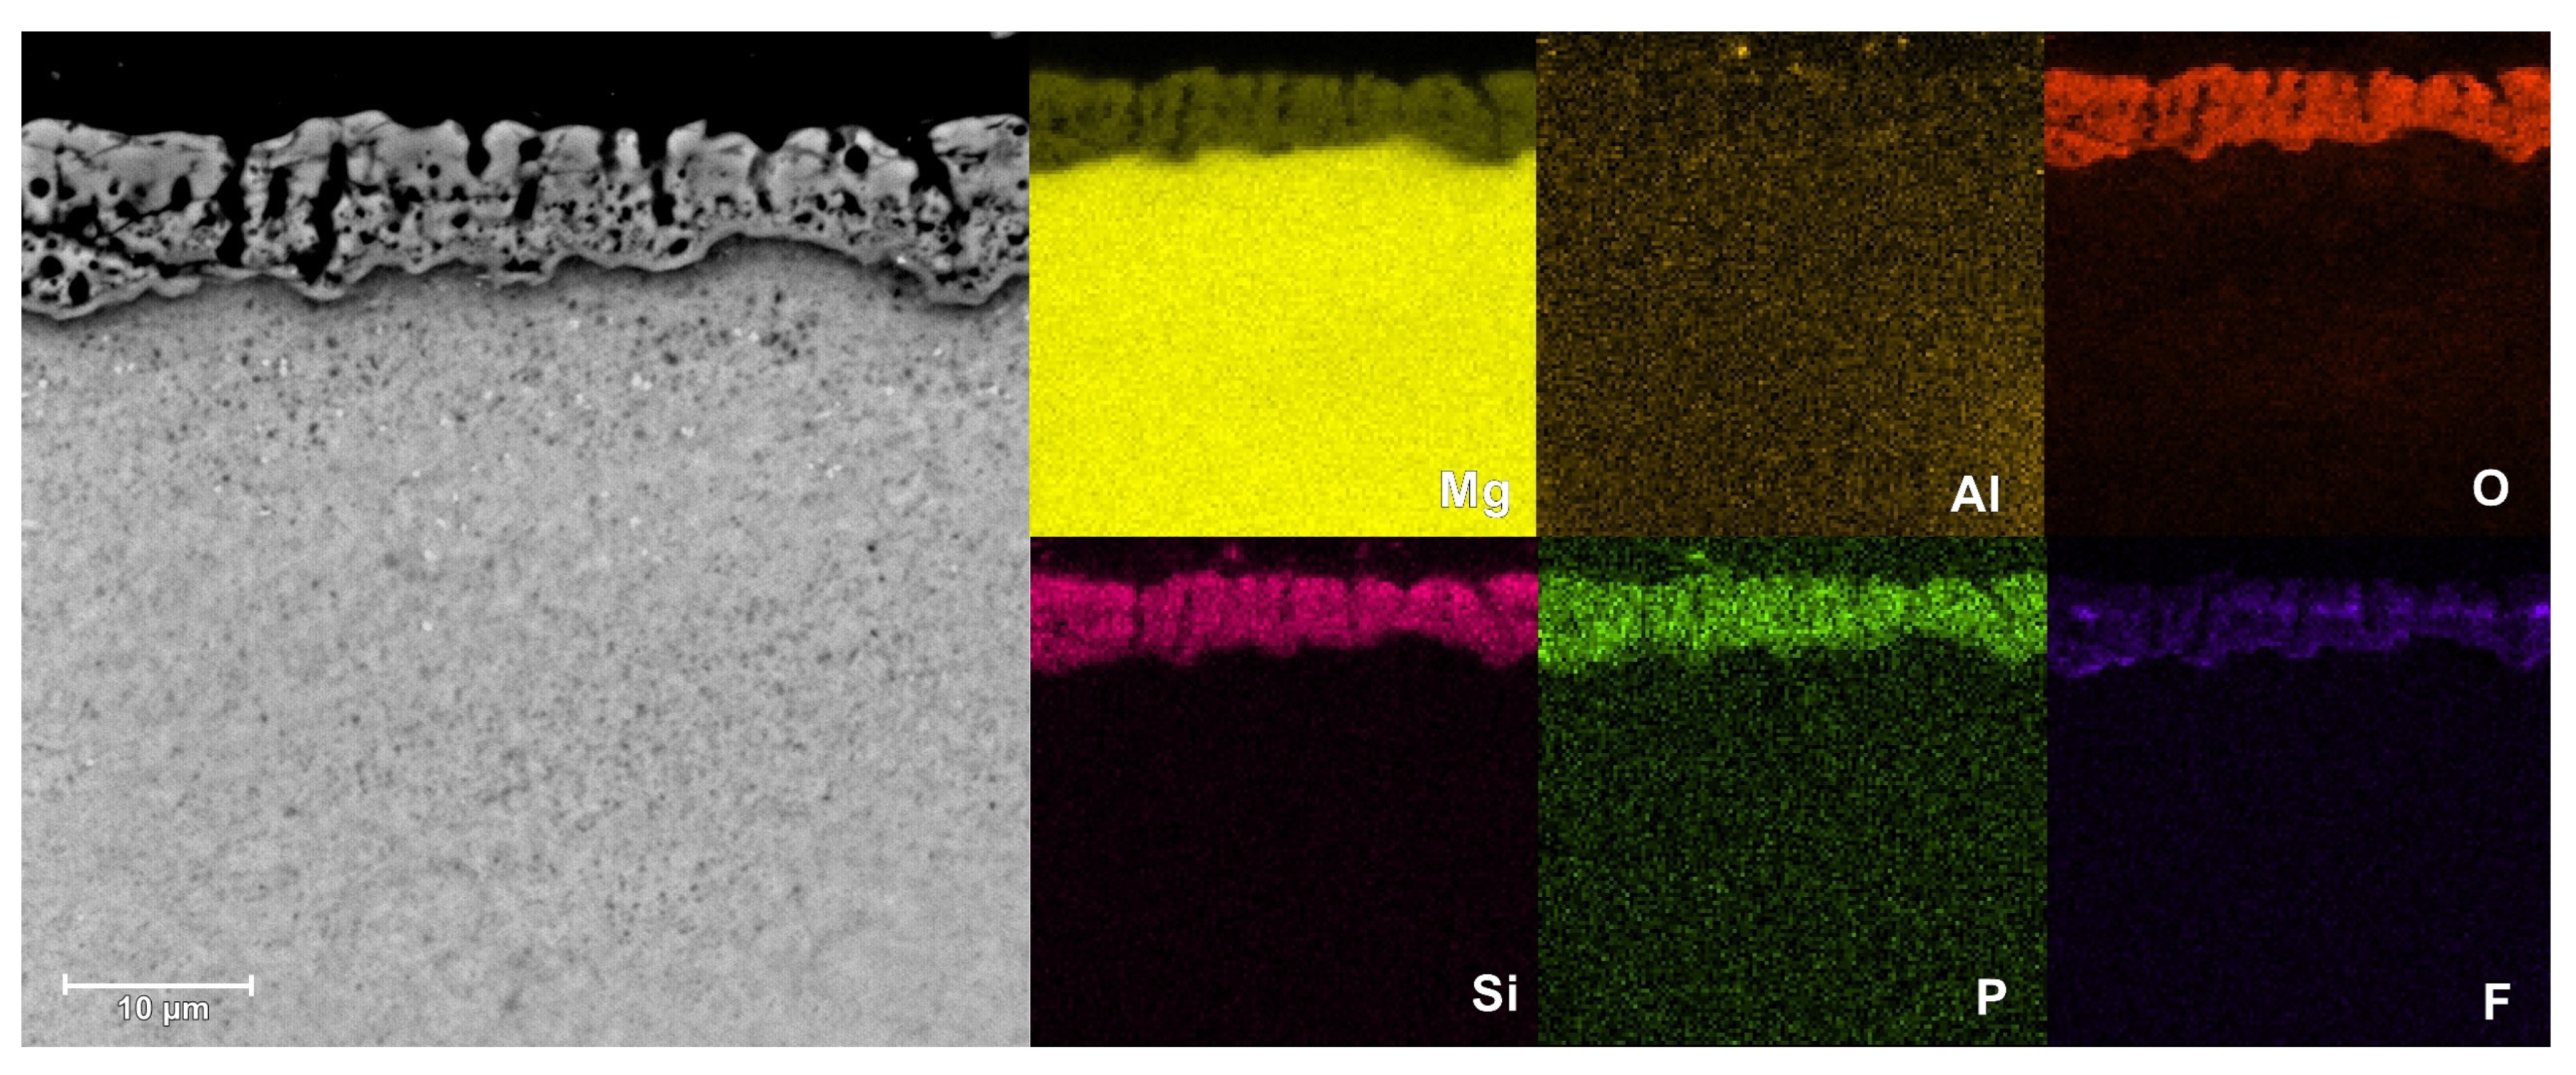
3.4. Morphological and Composition Characteristics of PEO Coatings

The SEM images of the surface microstructure of PEO coatings formed on AM50 alloy in different electrolytes are shown in Figure 9. The cross-sectional morphology and EDS elemental mapping of the coatings are shown in Figure 10, Figure 11 and Figure 12.
For all samples, the surface is rich in pores, which is typical for PEO coatings. It can be seen that in the case of the coating prepared with the addition of 2.5 g/L KPF6, the pores are smaller and distributed more evenly than in the other coatings (no large external pores). However, the morphology of this coating resembles a sponge-like structure, in contrast to the crater-like structures observed in other coatings (Figure 9b,e).
Based on the cross-sectional images, it can be concluded that in all cases the coatings show excellent adhesion to the substrate. The structure of the coatings includes an outer, thick, porous layer and an inner (localized right next to the substrate material), thin, barrier layer. The coating produced in a silicate bath (Base sample) is characterized by lower porosity of the outer layer, compared to that of other coatings. However, in this case the inner layer is thinner and less compact. In the case of the coating prepared with the addition of KPF6 (2.5PF6 sample), the inner layer appears to be the most continuous and without damages. This causes the conversion coating with the addition of KPF6 to have the best anticorrosive properties.
The EDS measurements have shown that the PEO coatings are composed of magnesium, aluminum, oxygen, silicon, and in the case of 2.5PF6 and FPO4 coatings, also phosphorus and fluorine. These elements, with the exception of fluorine, are evenly distributed in the conversion coating. In the case of fluorine, an increase in its content is visible near the magnesium substrate (in the inner layer of the PEO coating).
Using XPS analysis, the chemical composition of the outer and inner layers of the coatings obtained in the PEO process was determined, and the results are listed in Table 8.
The XPS results indicate that the main components of the coatings obtained are Mg from the substrate as well as O and Si, which are components of the basic silicate electrolyte. Small amounts of Al were also found (Al is a component of the AM50 alloy). When the electrolyte contained KPF6 (sample 2.5PF6) or a mixture of NaF + Na3PO4 (sample FPO4), fluorine and phosphorus were also present in the coatings. The 2.5PF6 coating contained more fluorine than the FPO4 coating, while a reverse relation was observed in the case of phosphorus. It should be noted that phosphorus was evenly incorporated into the coating, but in the case of fluorine, its clear enrichment is visible in the inner layer of the PEO coating.
High-resolution XPS analyses of the F 1s and P 2p peaks have been performed to identify chemical compounds formed in the modified PEO coatings, and the results are presented in Figure 13. The specific spectra of F 1s for both coatings (2.5PF6 and FPO4), regardless of the depth (outer/inner layer), have shown one peak at 685.1 ± 0.1 eV, which corresponds to the presence of MgF2 (metal fluoride at 685.0 ± 0.9 eV [57]). The P 2p spectra have also shown only one peak at 133.4 ± 0.2 eV, suggesting the presence of Mg3(PO4)2 {(PO4)3− at 133.2 ± 0.7 eV [57]} in both layers. The results presented exclude the formation of Mg(PF6)2, and the binding energy values for F 1s and P 2p are higher: 687.8 ± 0.2 eV and 136.4 ± 0.8 eV, respectively [57]. This is in contrast to our previous finding that Mg(BF4)2 is present mainly in the inner layer [46]. Using DFT calculation, it has been shown that BF4 and H3O+ form stronger hydrogen bonds than PF6 and H3O+, which suggests that clusters formed by the former pair are more stable [58]. These findings can be considered as a reasonable explanation of the observed discrepancy between BF4 and PF6 behavior in PEO processes.
The compositions of the coatings obtained in the present study are in agreement with reported literature data from studies, in which conventional silicate, phosphate, and fluoride electrolytes were used. For PEO coatings synthetized in alkaline silicate baths, it has been often confirmed that they are composed of MgO and Mg2SiO4 [17,22]. In the case of phosphate baths, the most frequently reported component of coatings is Mg3(PO4)2 [17,24]. In the presence of simple fluoride salts (NaF, KF), the common ingredient of a coating is MgF2 [14,33,34]. In the case of polyfluorine salts, the hydrolysis of the complex anion to a simple fluoride ion (and further reaction with the magnesium cation to form MgF2) and the formation of an oxide or a salt derived from the other element are observed (e.g., ZrF62− to ZrO2 [39], TiF62− to TiO2 [41], SiF62− to Mg2SiO4 [42], and AlF63− to Al2O3 [44]). Therefore, the use of the KPF6 additive in the electrolyte bath does not change the qualitative composition of the bath (compared to the mixture of orthophosphate and fluoride), but has an impact on the morphology and anticorrosive properties of the coatings obtained. The mechanism of this behavior can probably be related to the hydrolysis of the PF6 ion in the PEO process, leading to the formation of fluoride (F) and phosphate (PO43−) ions, as well as monofluorophosphate (PO3F2−), difluorophosphate (PO2F2), and hydrofluoric acid (HF) [56].
Based on data from the literature and the results obtained, the following processes can be proposed, which lead to the formation of coatings on magnesium in an alkaline silicate bath containing KPF6.
Mg0 → Mg2+ + 2e
Mg2+ + 2OH → Mg(OH)2 → MgO + H2O
2Mg2+ + SiO32−+ 2OH → Mg2SiO4 + H2O
PF6 + 8OH → [PO4]3− + 6F + 4H2O
3Mg2+ + 2PO43−→ Mg3(PO4)2
Mg2+ + 2F → MgF2

4. Conclusions

In the presented study, the PEO coatings produced on the AM50 Mg alloy in alkaline silicate baths with the addition of KPF6 have been investigated. The results obtained can be summarized as follows:
  • The anticorrosive properties of the obtained coatings increase when the KPF6 concentration is increased to 2.5 g/L. The addition of larger amounts of KPF6 causes damage to the coating (a large increase in its roughness), probably due to the local formation of HF during the PEO process.
  • The addition of KPF6 allows for better anticorrosive properties of the synthesized coating to be obtained, compared to a mixture of NaF and Na3PO4 with an equimolar content of fluorine and phosphorus.
  • XPS measurements have shown that in coatings obtained in the presence of KPF6, as well as a mixture of NaF and Na3PO4 in the baths, the coating components derived from these additives are the same [MgF2 and Mg3(PO4)2]. Mg(PF6)2 was not present in the formed coatings, which is in contrast to the formation of Mg(BF4)2, when the silicate bath contained NaBF4 [46].
  • The surface morphology of the PEO coatings produced in the KPF6-containing baths was more uniform and showed a sponge-like structure, in contrast to commonly reported crater-like structures. The sponge-like structure is similar to bone structure, and in combination with the presence of phosphates, it can increase the biocompatibility and the possibility of self-healing of this coating.

Author Contributions

Conceptualization, Ł.F.; methodology, Ł.F.; validation, Ł.F. and A.S.; formal analysis, Ł.F., B.K. and A.K.; investigation, Ł.F., B.K. and A.K.; data curation, Ł.F., B.K. and A.K.; writing—original draft preparation, Ł.F.; writing—review & editing, Ł.F. and A.S.; visualization, Ł.F.; supervision, Ł.F. and A.S. All authors have read and agreed to the published version of the manuscript.

Funding

Financial support from Rzeszów University of Technology within PB25.CF.23.001 grant is gratefully acknowledged.

Institutional Review Board Statement

Not applicable.

Informed Consent Statement

Not applicable.

Data Availability Statement

Data available on request from the authors.

Conflicts of Interest

The authors declare no conflict of interest.

References

  1. Loukil, N. Alloying Elements of Magnesium Alloys: A Literature Review. In Magnesium Alloys Structure and Properties; Tański, T., Jarka, P., Eds.; IntechOpen: Rijeka, Croatia, 2021; p. Ch. 9. [Google Scholar]
  2. Song, G.L.; Atrens, A. Corrosion Mechanisms of Magnesium Alloys. Adv. Eng. Mater. 1999, 1, 11–33. [Google Scholar] [CrossRef]
  3. Yang, Y.; Xiong, X.; Chen, J.; Peng, X.; Chen, D.; Pan, F. Research advances of magnesium and magnesium alloys worldwide in 2022. J. Magnes. Alloys 2023, 11, 2611–2654. [Google Scholar] [CrossRef]
  4. Liu, B.; Yang, J.; Zhang, X.; Yang, Q.; Zhang, J.; Li, X. Development and application of magnesium alloy parts for automotive OEMs: A review. J. Magnes. Alloys 2023, 11, 15–47. [Google Scholar] [CrossRef]
  5. Luo, A.A. Applications: Aerospace, automotive and other structural applications of magnesium. In Fundamentals of Magnesium Alloy Metallurgy; Pekguleryuz, M.O., Kainer, K.U., Arslan Kaya, A., Eds.; Woodhead Publishing: Sawston, UK, 2013; pp. 266–316. [Google Scholar]
  6. Gray, J.E.; Luan, B. Protective coatings on magnesium and its alloys—A critical review. J. Alloys Compd. 2002, 336, 88–113. [Google Scholar] [CrossRef]
  7. Istrate, B.; Munteanu, C.; Bălțatu, M.-S.; Cimpoeșu, R.; Ioanid, N. Microstructural and Electrochemical Influence of Zn in MgCaZn Biodegradable Alloys. Materials 2023, 16, 2487. [Google Scholar] [CrossRef] [PubMed]
  8. Salahshoor, M.; Guo, Y. Biodegradable Orthopedic Magnesium-Calcium (MgCa) Alloys, Processing, and Corrosion Performance. Materials 2012, 5, 135–155. [Google Scholar] [CrossRef] [PubMed]
  9. Chalisgaonkar, R. Insight in applications, manufacturing and corrosion behaviour of magnesium and its alloys—A review. Mater. Today Proc. 2020, 26, 1060–1071. [Google Scholar] [CrossRef]
  10. Cui, L.; Liu, Z.; Hu, P.; Shao, J.; Li, X.; Du, C.; Jiang, B. The Corrosion Behavior of AZ91D Magnesium Alloy in Simulated Haze Aqueous Solution. Materials 2018, 11, 970. [Google Scholar] [CrossRef]
  11. Zeng, R.-c.; Zhang, J.; Huang, W.-j.; Dietzel, W.; Kainer, K.U.; Blawert, C.; Ke, W. Review of studies on corrosion of magnesium alloys. Trans. Nonferrous Met. Soc. China 2006, 16, s763–s771. [Google Scholar] [CrossRef]
  12. Liu, Y.; Zhang, Y.; Wang, Y.-L.; Tian, Y.-Q.; Chen, L.-S. Research progress on surface protective coatings of biomedical degradable magnesium alloys. J. Alloys Compd. 2021, 885, 161001. [Google Scholar] [CrossRef]
  13. Predko, P.; Rajnovic, D.; Grilli, M.L.; Postolnyi, B.O.; Zemcenkovs, V.; Rijkuris, G.; Pole, E.; Lisnanskis, M. Promising Methods for Corrosion Protection of Magnesium Alloys in the Case of Mg-Al, Mg-Mn-Ce and Mg-Zn-Zr: A Recent Progress Review. Metals 2021, 11, 1133. [Google Scholar] [CrossRef]
  14. Wierzbicka, E.; Vaghefinazari, B.; Mohedano, M.; Visser, P.; Posner, R.; Blawert, C.; Zheludkevich, M.; Lamaka, S.; Matykina, E.; Arrabal, R. Chromate-Free Corrosion Protection Strategies for Magnesium Alloys—A Review: Part II—PEO and Anodizing. Materials 2022, 15, 8515. [Google Scholar] [CrossRef] [PubMed]
  15. Sampatirao, H.; Radhakrishnapillai, S.; Dondapati, S.; Parfenov, E.; Nagumothu, R. Developments in plasma electrolytic oxidation (PEO) coatings for biodegradable magnesium alloys. Mater. Today Proc. 2021, 46, 1407–1415. [Google Scholar] [CrossRef]
  16. Florczak, Ł.; Nawrat, G.; Kwolek, P.; Sieniawski, J.; Sobkowiak, A. Plasma electrolytic oxidation as a method for protection against corrosion of magnesium and its alloys. Przemysł Chem. 2018, 97, 2145–2153. (In Polish) [Google Scholar] [CrossRef]
  17. Barati Darband, G.; Aliofkhazraei, M.; Hamghalam, P.; Valizade, N. Plasma electrolytic oxidation of magnesium and its alloys: Mechanism, properties and applications. J. Magnes. Alloys 2017, 5, 74–132. [Google Scholar] [CrossRef]
  18. Parfenov, E.V.; Yerokhin, A.; Nevyantseva, R.R.; Gorbatkov, M.V.; Liang, C.J.; Matthews, A. Towards smart electrolytic plasma technologies: An overview of methodological approaches to process modelling. Surf. Coat. Technol. 2015, 269, 2–22. [Google Scholar] [CrossRef]
  19. Walsh, F.C.; Low, C.T.J.; Wood, R.J.K.; Stevens, K.T.; Archer, J.; Poeton, A.R.; Ryder, A. Plasma electrolytic oxidation (PEO) for production of anodised coatings on lightweight metal (Al, Mg, Ti) alloys. Trans. IMF 2009, 87, 122–135. [Google Scholar] [CrossRef]
  20. Yerokhin, A.L.; Nie, X.; Leyland, A.; Matthews, A.; Dowey, S.J. Plasma electrolysis for surface engineering. Surf. Coat. Technol. 1999, 122, 73–93. [Google Scholar] [CrossRef]
  21. Gawel, L.; Nieuzyla, L.; Nawrat, G.; Darowicki, K.; Slepski, P. Impedance monitoring of corrosion degradation of plasma electrolytic oxidation coatings (PEO) on magnesium alloy. J. Alloys Compd. 2017, 722, 406–413. [Google Scholar] [CrossRef]
  22. Duan, H.; Yan, C.; Wang, F. Growth process of plasma electrolytic oxidation films formed on magnesium alloy AZ91D in silicate solution. Electrochim. Acta 2007, 52, 5002–5009. [Google Scholar] [CrossRef]
  23. Anawati, A.; Hidayati, E.; Labibah, H. Characteristics of magnesium phosphate coatings formed on AZ31 Mg alloy by plasma electrolytic oxidation with improved current efficiency. Mater. Sci. Eng. B 2021, 272, 115354. [Google Scholar] [CrossRef]
  24. Arrabal, R.; Matykina, E.; Viejo, F.; Skeldon, P.; Thompson, G.E. Corrosion resistance of WE43 and AZ91D magnesium alloys with phosphate PEO coatings. Corros. Sci. 2008, 50, 1744–1752. [Google Scholar] [CrossRef]
  25. Moga, S.; Malinovschi, V.; Marin, A.; Coaca, E.; Negrea, D.; Craciun, V.; Lungu, M. Mechanical and corrosion-resistant coatings prepared on AZ63 Mg alloy by plasma electrolytic oxidation. Surf. Coat. Technol. 2023, 462, 129464. [Google Scholar] [CrossRef]
  26. Liang, J.; Hu, L.; Hao, J. Characterization of microarc oxidation coatings formed on AM60B magnesium alloy in silicate and phosphate electrolytes. Appl. Surf. Sci. 2007, 253, 4490–4496. [Google Scholar] [CrossRef]
  27. Mori, Y.; Koshi, A.; Liao, J.; Asoh, H.; Ono, S. Characteristics and corrosion resistance of plasma electrolytic oxidation coatings on AZ31B Mg alloy formed in phosphate—Silicate mixture electrolytes. Corros. Sci. 2014, 88, 254–262. [Google Scholar] [CrossRef]
  28. Yu, L.; Cao, J.; Cheng, Y. An improvement of the wear and corrosion resistances of AZ31 magnesium alloy by plasma electrolytic oxidation in a silicate–hexametaphosphate electrolyte with the suspension of SiC nanoparticles. Surf. Coat. Technol. 2015, 276, 266–278. [Google Scholar] [CrossRef]
  29. Sovík, J.; Kajánek, D.; Pastorek, F.; Štrbák, M.; Florková, Z.; Jambor, M.; Hadzima, B. The Effect of Mechanical Pretreatment on the Electrochemical Characteristics of PEO Coatings Prepared on Magnesium Alloy AZ80. Materials 2023, 16, 5650. [Google Scholar] [CrossRef]
  30. Chang, L.; Tian, L.; Liu, W.; Duan, X. Formation of dicalcium phosphate dihydrate on magnesium alloy by micro-arc oxidation coupled with hydrothermal treatment. Corros. Sci. 2013, 72, 118–124. [Google Scholar] [CrossRef]
  31. Rakoch, A.G.; Monakhova, E.P.; Khabibullina, Z.V.; Serdechnova, M.; Blawert, C.; Zheludkevich, M.L.; Gladkova, A.A. Plasma electrolytic oxidation of AZ31 and AZ91 magnesium alloys: Comparison of coatings formation mechanism. J. Magnes. Alloys 2020, 8, 587–600. [Google Scholar] [CrossRef]
  32. Yu, W.; Sun, R.; Guo, Z.; Wang, Z.; He, Y.; Lu, G.; Chen, P.; Chen, K. Novel fluoridated hydroxyapatite/MAO composite coating on AZ31B magnesium alloy for biomedical application. Appl. Surf. Sci. 2019, 464, 708–715. [Google Scholar] [CrossRef]
  33. Lujun, Z.; Hongzhan, L.; Qingmei, M.; Jiangbo, L.; Zhengxian, L. The mechanism for tuning the corrosion resistance and pore density of plasma electrolytic oxidation (PEO) coatings on Mg alloy with fluoride addition. J. Magnes. Alloys 2023, 11, 2823–2832. [Google Scholar] [CrossRef]
  34. Wang, L.; Chen, L.; Yan, Z.; Wang, H.; Peng, J. Effect of potassium fluoride on structure and corrosion resistance of plasma electrolytic oxidation films formed on AZ31 magnesium alloy. J. Alloys Compd. 2009, 480, 469–474. [Google Scholar] [CrossRef]
  35. Liang, J.; Guo, B.; Tian, J.; Liu, H.; Zhou, J.; Xu, T. Effect of potassium fluoride in electrolytic solution on the structure and properties of microarc oxidation coatings on magnesium alloy. Appl. Surf. Sci. 2005, 252, 345–351. [Google Scholar] [CrossRef]
  36. Khiabani, A.B.; Ghanbari, A.; Yarmand, B.; Zamanian, A.; Mozafari, M. Improving corrosion behavior and in vitro bioactivity of plasma electrolytic oxidized AZ91 magnesium alloy using calcium fluoride containing electrolyte. Mater. Lett. 2018, 212, 98–102. [Google Scholar] [CrossRef]
  37. Rehman, Z.U.; Shin, S.H.; Hussain, I.; Koo, B.H. Structure and corrosion properties of the two-step PEO coatings formed on AZ91D Mg alloy in K2ZrF6-based electrolyte solution. Surf. Coat. Technol. 2016, 307, 484–490. [Google Scholar] [CrossRef]
  38. Zhuang, J.J.; Guo, Y.Q.; Xiang, N.; Xiong, Y.; Hu, Q.; Song, R.G. A study on microstructure and corrosion resistance of ZrO2-containing PEO coatings formed on AZ31 Mg alloy in phosphate-based electrolyte. Appl. Surf. Sci. 2015, 357, 1463–1471. [Google Scholar] [CrossRef]
  39. Cui, X.-J.; Liu, C.-H.; Yang, R.-S.; Li, M.-T.; Lin, X.-Z. Self-sealing micro-arc oxidation coating on AZ91D Mg alloy and its formation mechanism. Surf. Coat. Technol. 2015, 269, 228–237. [Google Scholar] [CrossRef]
  40. Yang, W.; Wang, J.; Xu, D.; Li, J.; Chen, T. Characterization and formation mechanism of grey micro-arc oxidation coatings on magnesium alloy. Surf. Coat. Technol. 2015, 283, 281–285. [Google Scholar] [CrossRef]
  41. Tang, M.; Feng, Z.; Li, G.; Zhang, Z.; Zhang, R. High-corrosion resistance of the microarc oxidation coatings on magnesium alloy obtained in potassium fluotitanate electrolytes. Surf. Coat. Technol. 2015, 264, 105–113. [Google Scholar] [CrossRef]
  42. Rehman, Z.U.; Ahn, B.H.; Song, J.I.; Koo, B.H. Effect of Na2SiF6 concentration on the plasma electrolytic oxidation of AZ31B magnesium alloy. Int. J. Surf. Sci. Eng. 2016, 10, 456–467. [Google Scholar] [CrossRef]
  43. Rehman, Z.U.; Heun Koo, B.; Choi, D. Influence of Complex SiF62− Ions on the PEO Coatings Formed on Mg–Al6–Zn1 Alloy for Enhanced Wear and Corrosion Protection. Coatings 2020, 10, 94. [Google Scholar] [CrossRef]
  44. Kaseem, M.; Yang, H.W.; Ko, Y.G. Toward a nearly defect-free coating via high-energy plasma sparks. Sci. Rep. 2017, 7, 2378. [Google Scholar] [CrossRef]
  45. Cai, Q.; Wang, L.; Wei, B.; Liu, Q. Electrochemical performance of microarc oxidation films formed on AZ91D magnesium alloy in silicate and phosphate electrolytes. Surf. Coat. Technol. 2006, 200, 3727–3733. [Google Scholar] [CrossRef]
  46. Florczak, Ł.; Nawrat, G.; Darowicki, K.; Ryl, J.; Sieniawski, J.; Wierzbińska, M.; Raga, K.; Sobkowiak, A. The Effect of Sodium Tetrafluoroborate on the Properties of Conversion Coatings Formed on the AZ91D Magnesium Alloy by Plasma Electrolytic Oxidation. Processes 2022, 10, 2089. [Google Scholar] [CrossRef]
  47. Ponikvar, M.; Žemva, B.; Liebman, J.F. The analytical and descriptive inorganic chemistry of the hydrolysis of hexafluoropnictate ions, PnF6 (Pn = P, As, Sb, Bi). J. Fluor. Chem. 2003, 123, 217–220. [Google Scholar] [CrossRef]
  48. European Standard EN 1753:2019; Magnesium and Magnesium Alloys. Magnesium Alloy Ingots and Castings. European Committee for Standardization: Brussels, Belgium, 2019.
  49. Stern, M.; Geary, A.L. Electrochemical Polarization: I. A Theoretical Analysis of the Shape of Polarization Curves. J. Electrochem. Soc. 1957, 104, 56. [Google Scholar] [CrossRef]
  50. Jangde, A.; Kumar, S.; Blawert, C. Evolution of PEO coatings on AM50 magnesium alloy using phosphate-based electrolyte with and without glycerol and its electrochemical characterization. J. Magnes. Alloys 2020, 8, 692–715. [Google Scholar] [CrossRef]
  51. Toorani, M.; Aliofkhazraei, M.; Sabour Rouhaghdam, A. Microstructural, protective, inhibitory and semiconducting properties of PEO coatings containing CeO2 nanoparticles formed on AZ31 Mg alloy. Surf. Coat. Technol. 2018, 352, 561–580. [Google Scholar] [CrossRef]
  52. Gao, Y.; Yerokhin, A.; Parfenov, E.; Matthews, A. Application of Voltage Pulse Transient Analysis during Plasma Electrolytic Oxidation for Assessment of Characteristics and Corrosion Behaviour of Ca- and P-containing Coatings on Magnesium. Electrochim. Acta 2014, 149, 218–230. [Google Scholar] [CrossRef]
  53. Dong, K.; Song, Y.; Shan, D.; Han, E.-H. Corrosion behavior of a self-sealing pore micro-arc oxidation film on AM60 magnesium alloy. Corros. Sci. 2015, 100, 275–283. [Google Scholar] [CrossRef]
  54. Song, G.; Atrens, A.; John, D.S.; Wu, X.; Nairn, J. The anodic dissolution of magnesium in chloride and sulphate solutions. Corros. Sci. 1997, 39, 1981–2004. [Google Scholar] [CrossRef]
  55. Barnes, P.; Smith, K.; Parrish, R.; Jones, C.; Skinner, P.; Storch, E.; White, Q.; Deng, C.; Karsann, D.; Lau, M.L.; et al. A non-aqueous sodium hexafluorophosphate-based electrolyte degradation study: Formation and mitigation of hydrofluoric acid. J. Power Sources 2020, 447, 227363. [Google Scholar] [CrossRef]
  56. Terborg, L.; Nowak, S.; Passerini, S.; Winter, M.; Karst, U.; Haddad, P.R.; Nesterenko, P.N. Ion chromatographic determination of hydrolysis products of hexafluorophosphate salts in aqueous solution. Anal. Chim. Acta 2012, 714, 121–126. [Google Scholar] [CrossRef]
  57. Biesinger, M.C. X-ray Photoelectron Spectroscopy (XPS) Reference Pages. Available online: http://www.xpsfitting.com (accessed on 31 October 2023).
  58. Giron, R.G.P.; Ferguson, G.S. Tetrafluoroborate and Hexafluorophosphate Ions are not Interchangeable: A Density Functional Theory Comparison of Hydrogen Bonding. ChemistrySelect 2017, 2, 10895–10901. [Google Scholar] [CrossRef]
Figure 1. Voltage-time curves during the PEO process in the electrolyte containing different concentrations of KPF6.
Materials 16 07573 g001
Figure 2. Images of the magnesium alloy surface during the PEO process at its various stages: (a) conventional anodization, (b) spark anodization, and (c) micro-arc oxidation.
Materials 16 07573 g002
Figure 3. Image of the magnesium alloy surface after the PEO process in an electrolyte 4 g/L KPF6.
Materials 16 07573 g003
Figure 4. Average layer thickness (black squares) and surface roughness coefficient, Ra (red triangles) of PEO coatings produced in electrolytes with different concentrations of KPF6.
Materials 16 07573 g004
Figure 5. Potentiodynamic curves of PEO coatings synthesized in electrolytes with different concentrations of KPF6 after 3 h exposure in DHS.
Materials 16 07573 g005
Figure 6. Results of EIS measurements for PEO coatings synthesized in electrolytes with different concentrations of KPF6 after 3 h exposure in DHS: (a) Nyquist plots, (b,c) Bode plots. Dots represent experimental data, and lines are the results of the fitting. (d) Equivalent circuit model used to fit EIS data measurements of PEO coatings.
Materials 16 07573 g006
Figure 7. Potentiodynamic curves of the uncoated AM50 alloy and the PEO coatings synthesized in different electrolytes after 3 h exposure in DHS.
Materials 16 07573 g007
Figure 8. Results of EIS measurements for the uncoated AM50 alloy and PEO coatings synthesized in different electrolytes after 3 h exposure in DHS: (a) Nyquist plots, (b,c) Bode plots. Dots represent experimental data, and lines are the results of the fitting. (d) Equivalent circuit model used to fit EIS data measurements of the uncoated AM50 alloy.
Materials 16 07573 g008
Figure 9. Surface morphology of PEO coatings for different samples: (a,d) Base, (b,e) 2.5PF6, (c,f) FPO4.
Materials 16 07573 g009aMaterials 16 07573 g009b
Figure 10. Microstructure and elemental distribution in the cross-section of the coating for the Base sample, measured by EDS.
Materials 16 07573 g010
Figure 11. Microstructure and elemental distribution in the cross-section of the coating for the 2.5PF6 sample, measured by EDS.
Materials 16 07573 g011
Figure 12. Microstructure and elemental distribution in the cross-section of the coating for the FPO4 sample, measured by EDS.
Materials 16 07573 g012
Figure 13. XPS high-resolution single peak spectra of the F 1s and the P 2p regions for 2.5PF6 and FPO4 PEO coatings.
Materials 16 07573 g013
Table 1. Chemical composition (wt.%) of the AM50 alloy according to EN 1753:2019 [48].
AlMnZnSiFeCuNiMg
4.40–5.50min. 0.1max. 0.02max. 0.1max. 0.005max. 0.010.002balance
Table 2. Time to reach the critical voltage (450 V) and the final voltage of the PEO processes in the electrolytes containing different concentrations of KPF6.
Concentration of KPF6,
g/L
Time to Reach Critical Voltage,
min
Final Voltage,
V
0.08.8455
0.58.3461
1.08.0465
1.57.0466
2.05.9467
2.55.0470
3.09.5453
4.0-346
Table 3. Electrochemical parameters of PEO coatings synthesized in electrolytes containing different concentrations of KPF6, obtained from polarization measurements after 3 h exposure in DHS.
Concentration
of KPF6, g/L
ECORR, VjCORR, µA/cm2RP,kΩ∙cm2
0.0−1.63033.011.04
0.5−1.60623.111.46
1.0−1.5969.353.81
1.5−1.5954.557.88
2.0−1.5933.919.41
2.5−1.5871.7621.09
3.0−1.5552.9413.09
4.0−1.4535.947.25
Table 4. EIS fitting parameters for coatings obtained at different concentrations of KPF6.
Concen. of KPF6,
g/L
RS, Ω·cm2QOL, µFn/cm2nOLROL, Ω·cm2QIL, µFn/cm2nILRIL, kΩ·cm2Cdl, mF/cm2Rct,
kΩ·cm2
L
kH·cm2
RL
kΩ·cm2
Rtotal
kΩ·cm2
Χ2
0155.5---5.7130.8773.2960.4691.53325.50.753.805.12 × 10−4
0.5146.81.0320.90537.94.1890.9173.4760.5161.92753.83.874.802.88 × 10−4
1.0147.90.7840.91342.53.3470.9264.9710.3482.92824.218.647.544.25 × 10−4
1.5135.90.8140.85879.12.0510.9225.7280.1784.361200.721.609.443.31 × 10−4
2.0153.90.8030.87374.21.9740.9226.2220.1804.550233.115.929.842.74 × 10−4
2.5141.10.3920.847218.20.8190.89213.4000.0939.271231.528.5120.615.13 × 10−4
3.0151.10.4250.867129.41.4310.8947.9210.1897.069293.116.9213.043.30 × 10−4
4.0144.91.1150.89664.92.8180.9035.9750.3455.035--11.076.37 × 10−4
Table 5. Composition of electrolytes used in comparative studies of PEO coatings.
SampleComposition of Electrolyte,
g/L
Molar Contents
of Fluorine,
mM/L
Molar Contents
of Phosphorus,
mM/L
BaseNa2SiO3·5H2O: 10--
NaOH: 4
2.5PF6Na2SiO3·5H2O: 1081.513.6
NaOH: 4
KPF6: 2.5
FPO4Na2SiO3·5H2O: 1081.513.6
NaOH: 4
NaF: 3.42
Na3PO4·12H2O: 5.17
Table 6. Electrochemical parameters of the uncoated AM50 alloy and the PEO coatings synthesized in different electrolytes from the polarization measurements after 3 h exposure in DHS.
SampleECORR, VjCORR, µA/cm2RP,kΩ∙cm2
Uncoated AM50−1.607140.100.22
Base−1.63033.011.04
2.5PF6−1.5871.7621.09
FPO4−1.5012.7513.41
Table 7. EIS for the coatings obtained from different electrolytes.
SampleRS, Ω·cm2QOL, µFn/cm2nOLROL, Ω·cm2QIL, µFn/cm2nILRIL, kΩ·cm2Cdl, mF/cm2Rct,
kΩ·cm2
L
kH·cm2
RL
kΩ·cm2
Rtotal
kΩ·cm2
Χ2
Base155.5---5.7130.8773.2960.4691.53325.50.753.805.12 × 10−4
2.5PF6141.10.3920.847218.20.8190.89213.4000.0939.271231.528.5120.615.13 × 10−4
FPO4130.60.8280.89063.72.4110.91010.2700.0165.271--15.605.73 × 10−4
SampleRS,Ω·cm2 QC,µFn/cm2nCRC,kΩ·cm2Cdl,mF/cm2Rct,
kΩ·cm2
L
kH·cm2
RL
kΩ·cm2
Rtotal
kΩ·cm2
Χ2
Uncoated AM50122.9 0.3020.8730.0737.6270.0291.530.1530.0612.50 × 10−4
Table 8. Elemental contents (in atomic percentage) determined by XPS for the coatings obtained in different electrolytes.
SampleLayerElements Content, at.%
MgOSiAlFP
Baseouter49.137.311.22.4--
inner53.837.46.42.5--
2.5PF6outer39.643.010.13.72.61.1
inner39.640.59.13.36.31.1
FPO4outer45.041.37.63.11.71.4
inner38.942.87.43.75.21.9
Disclaimer/Publisher’s Note: The statements, opinions and data contained in all publications are solely those of the individual author(s) and contributor(s) and not of MDPI and/or the editor(s). MDPI and/or the editor(s) disclaim responsibility for any injury to people or property resulting from any ideas, methods, instructions or products referred to in the content.

