An Experimental Study of the Relation between Mode I Fracture Toughness, KIc, and Critical Energy Release Rate, GIc
Abstract
1. Introduction
2. Materials and Methods
3. Results and Analysis
3.1. Fracture Toughness () and Critical Energy-Release Rate ()
3.2. Relation between and
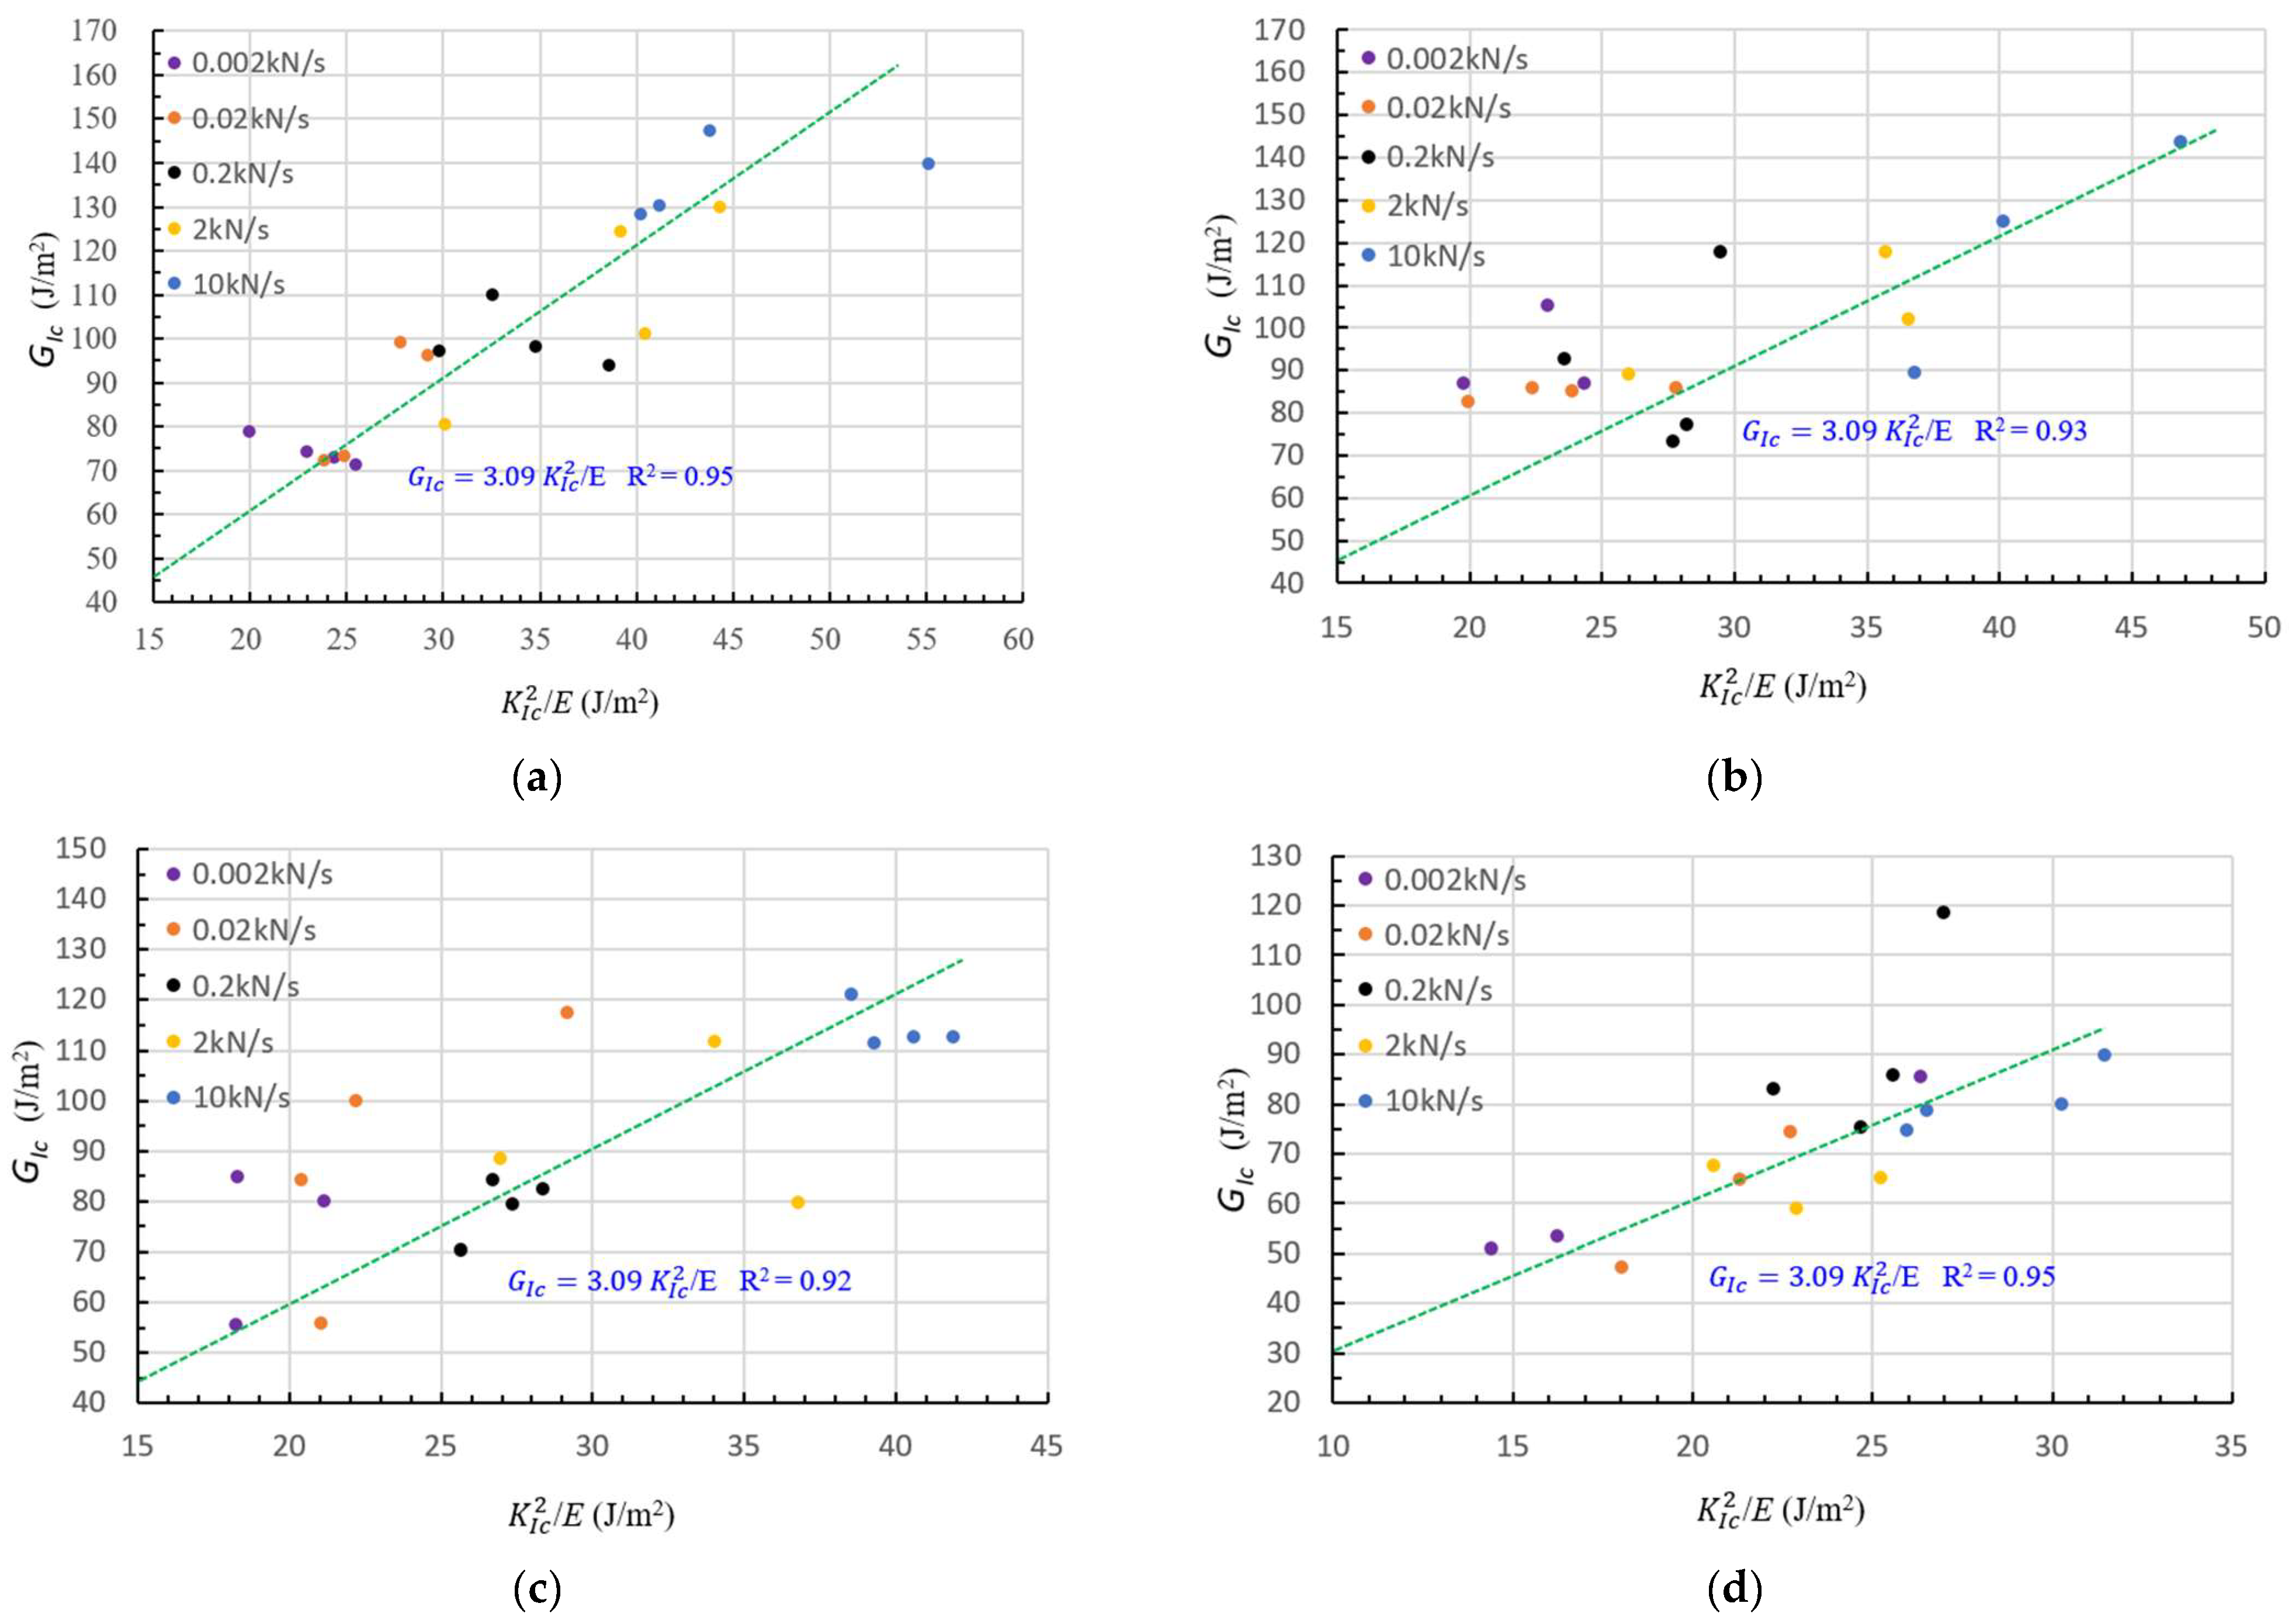
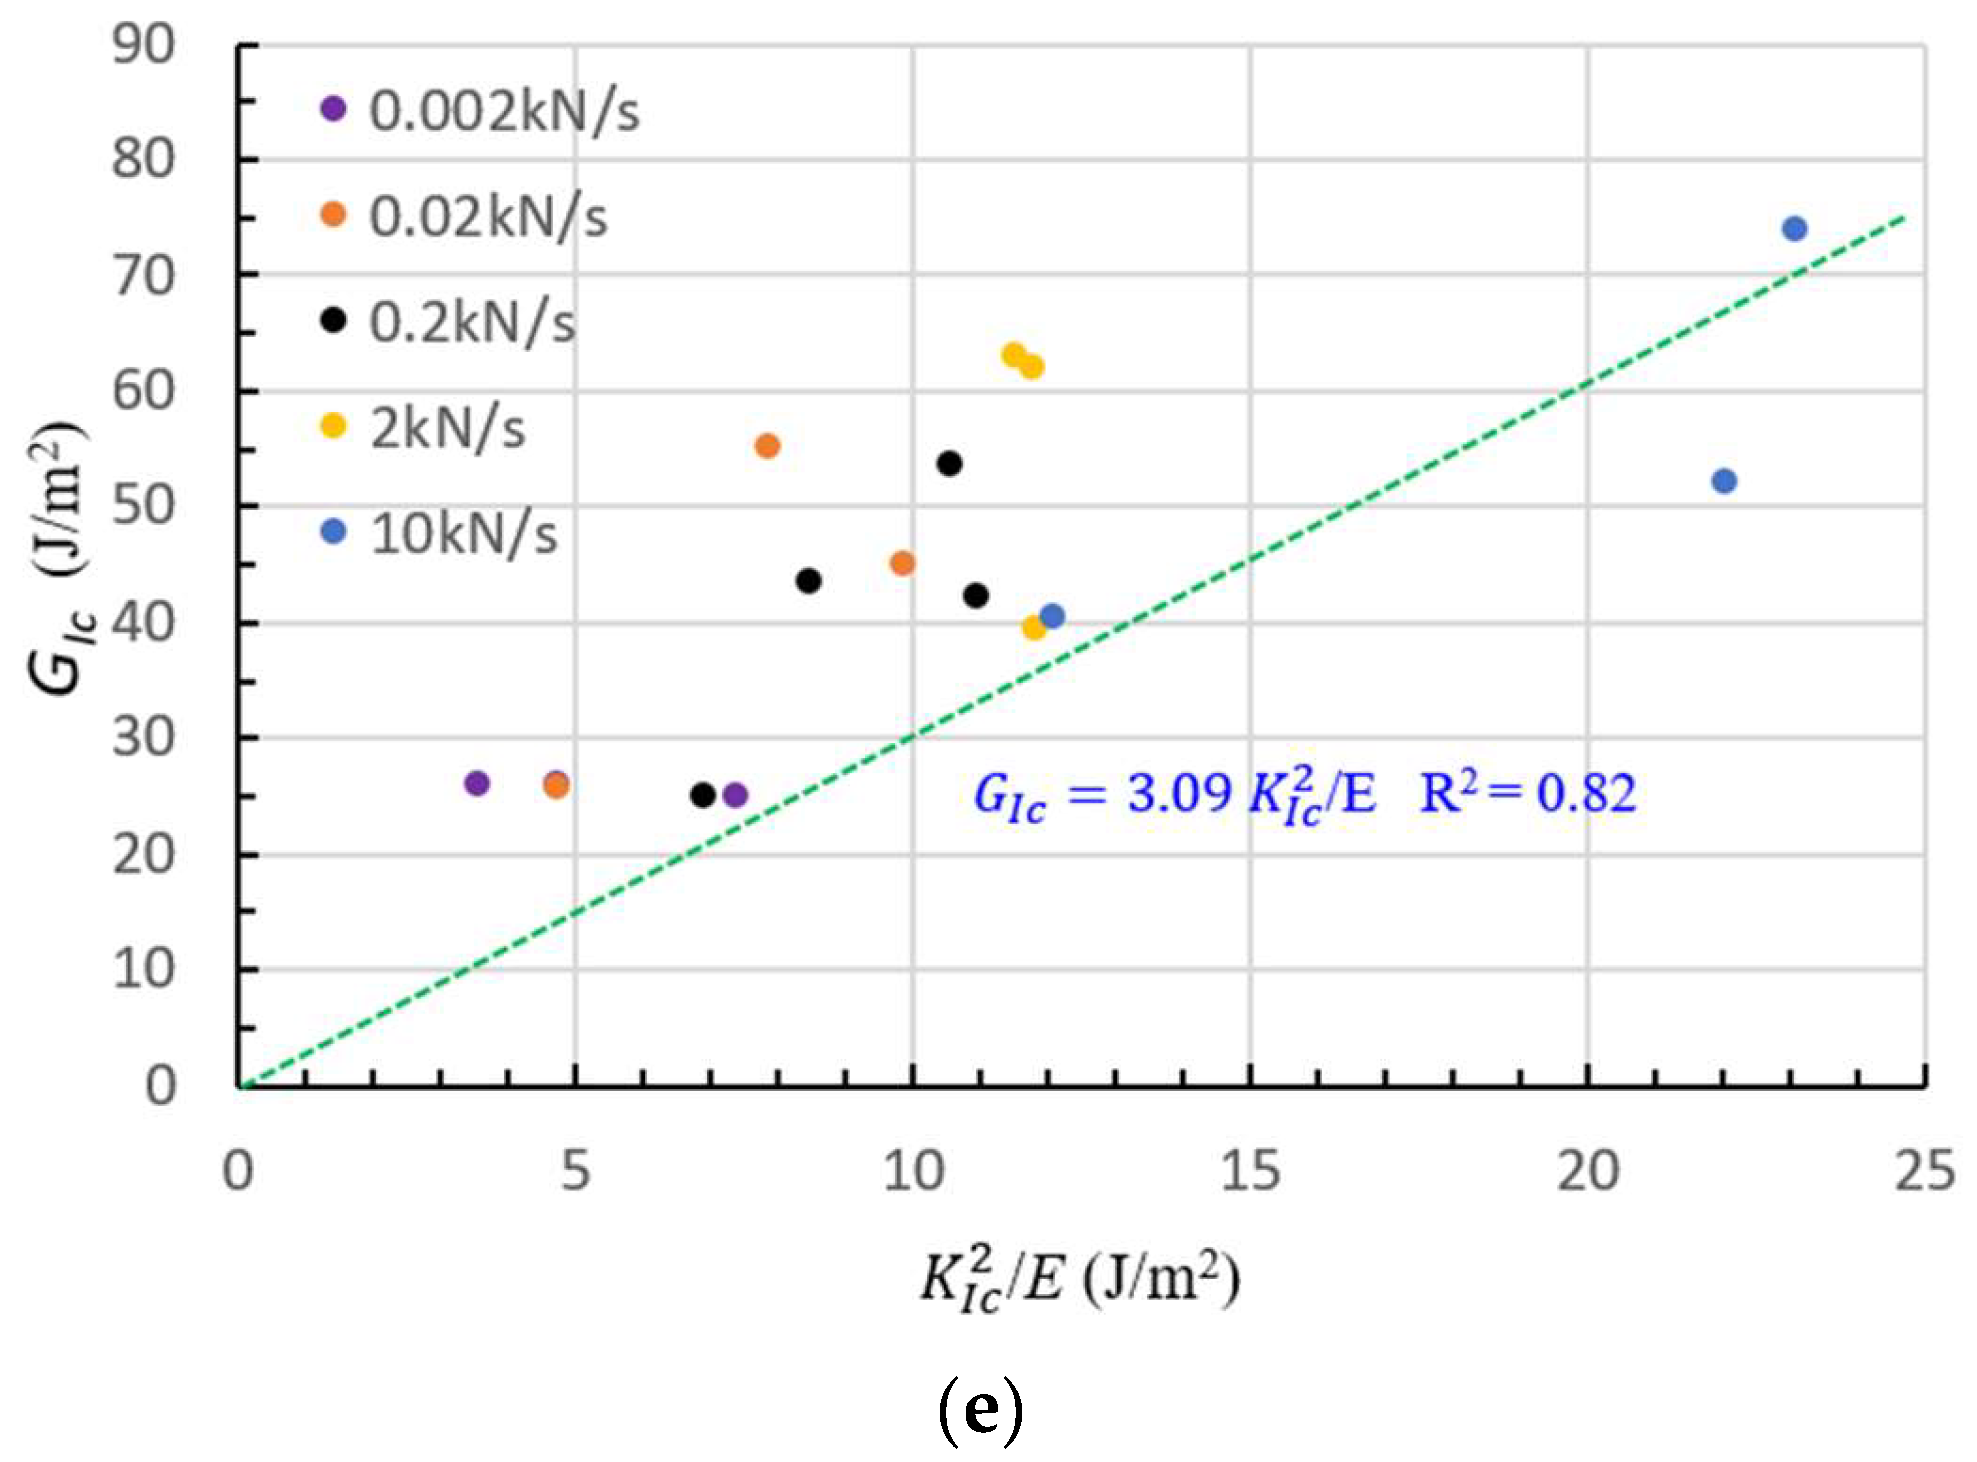
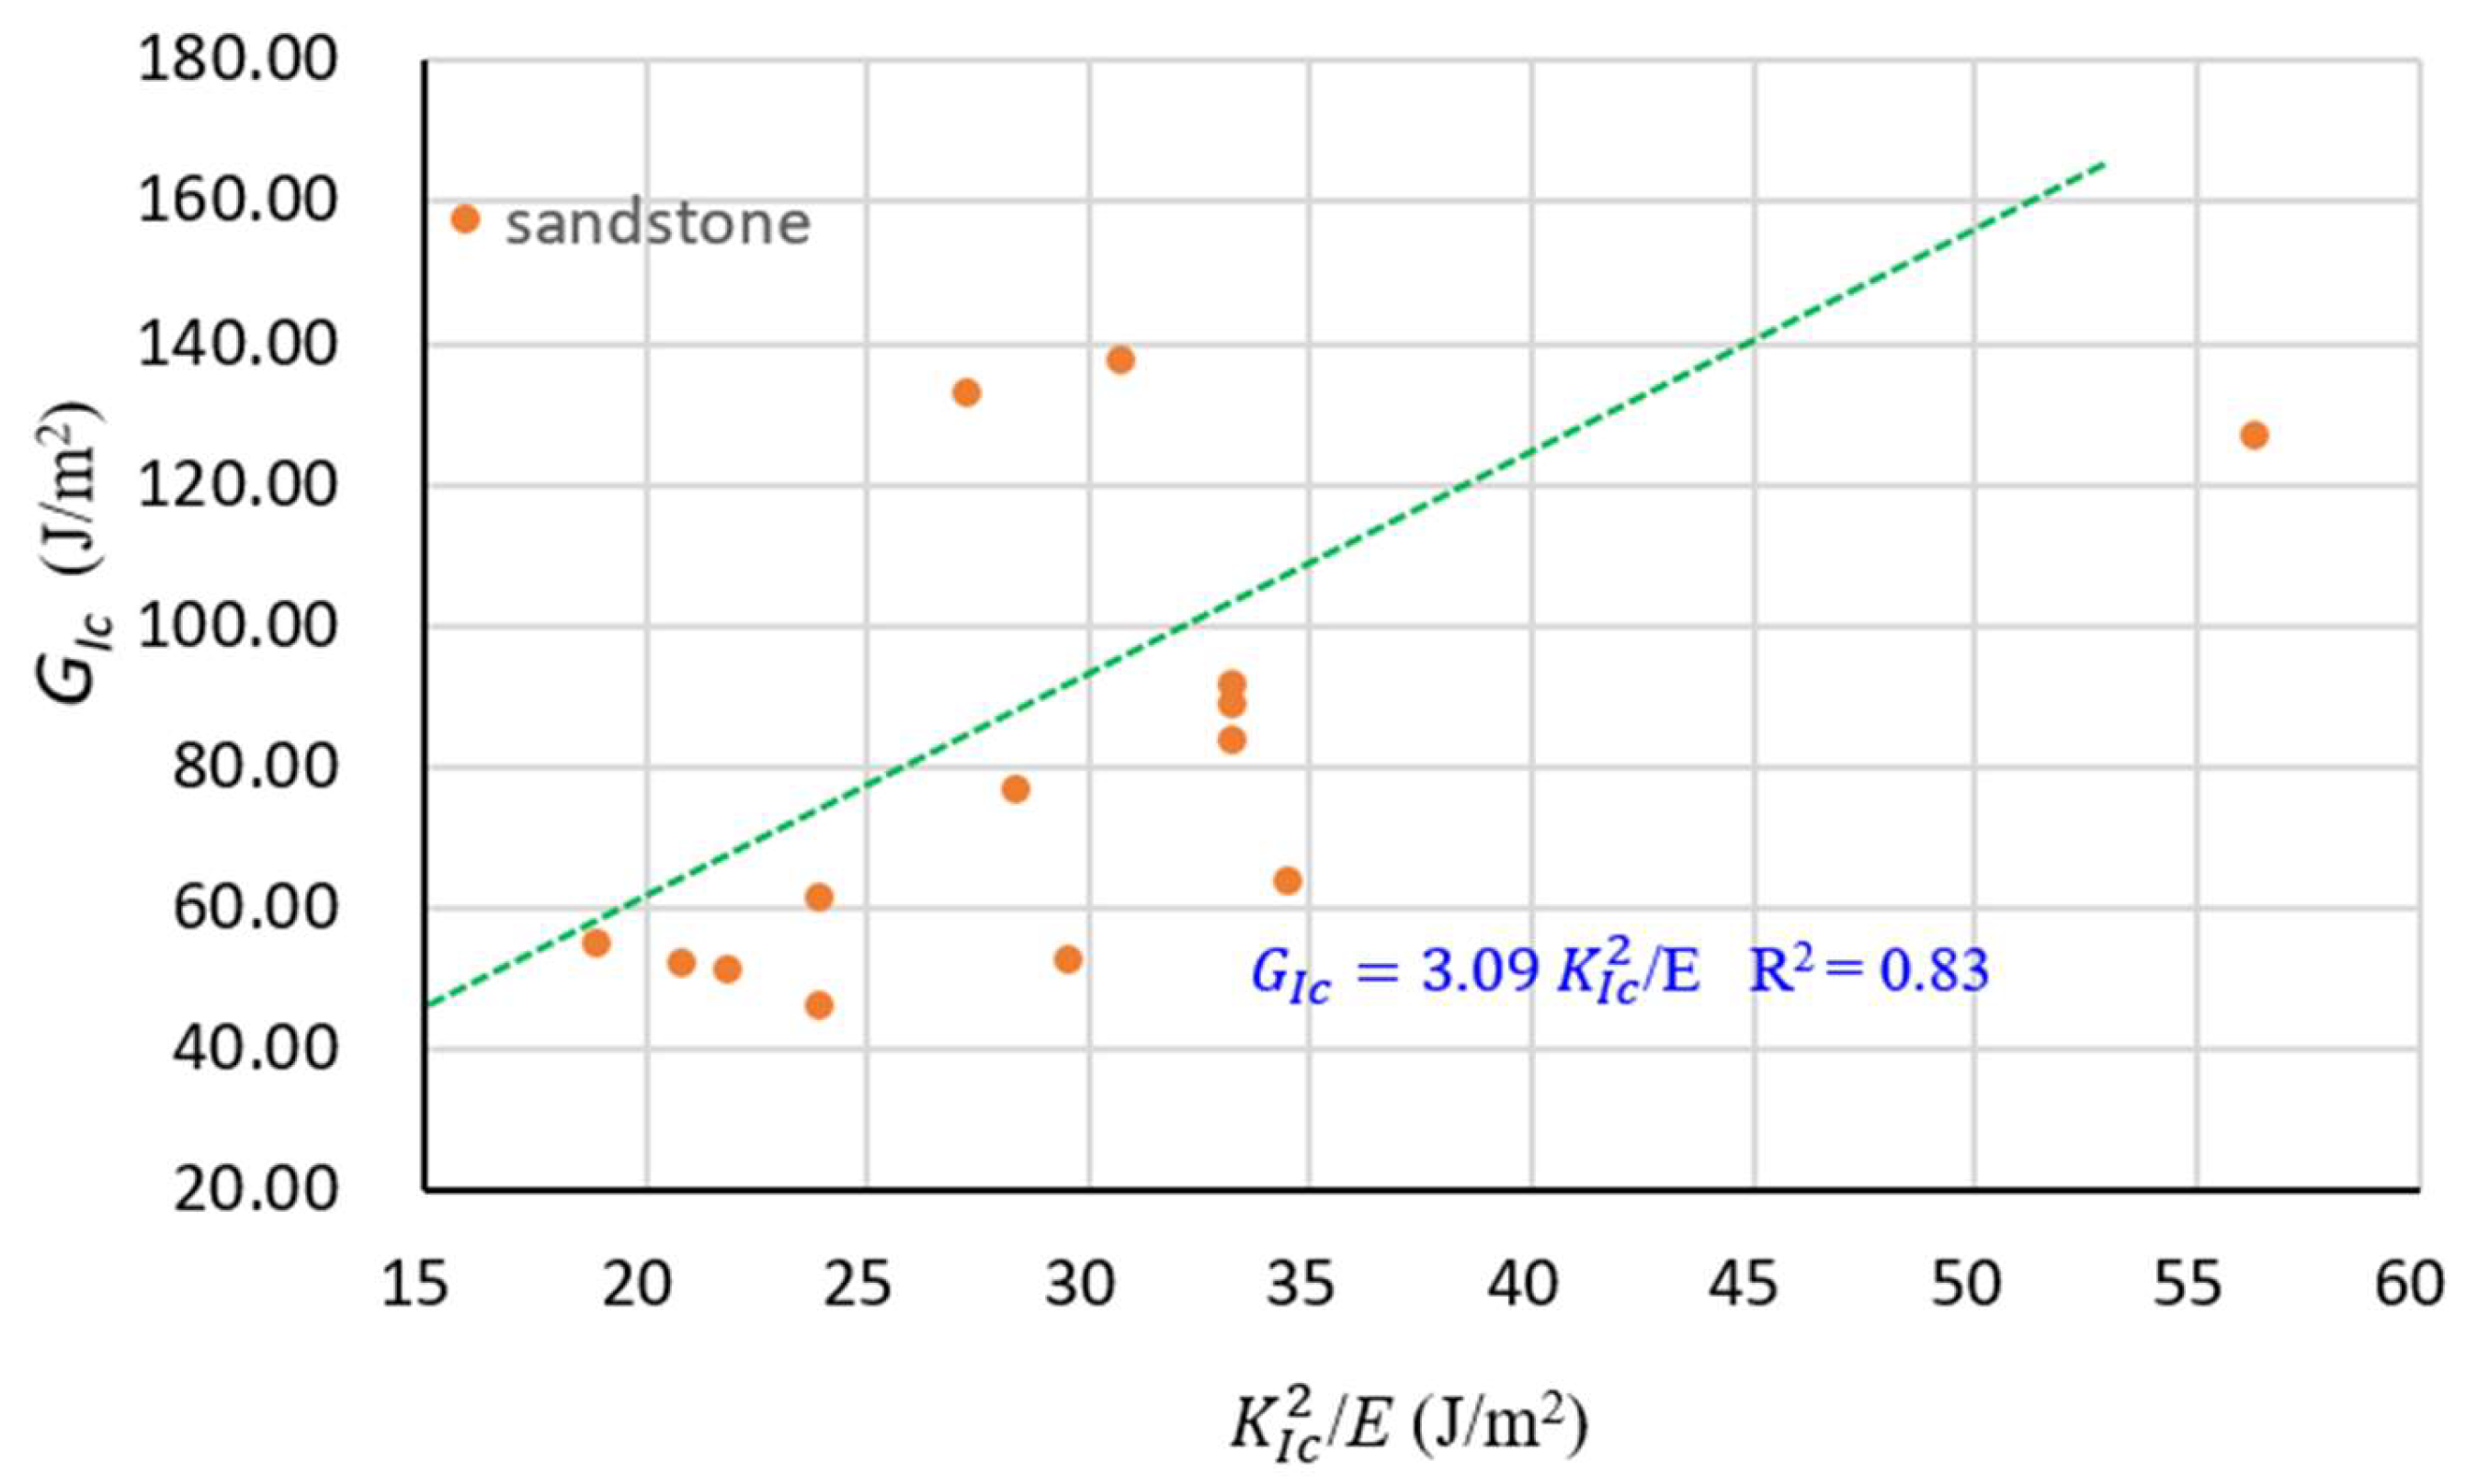
3.3. Effects of Specimen Sizes, Loading Rate and Lithology on the Relation between and
4. Discussion
5. Conclusions
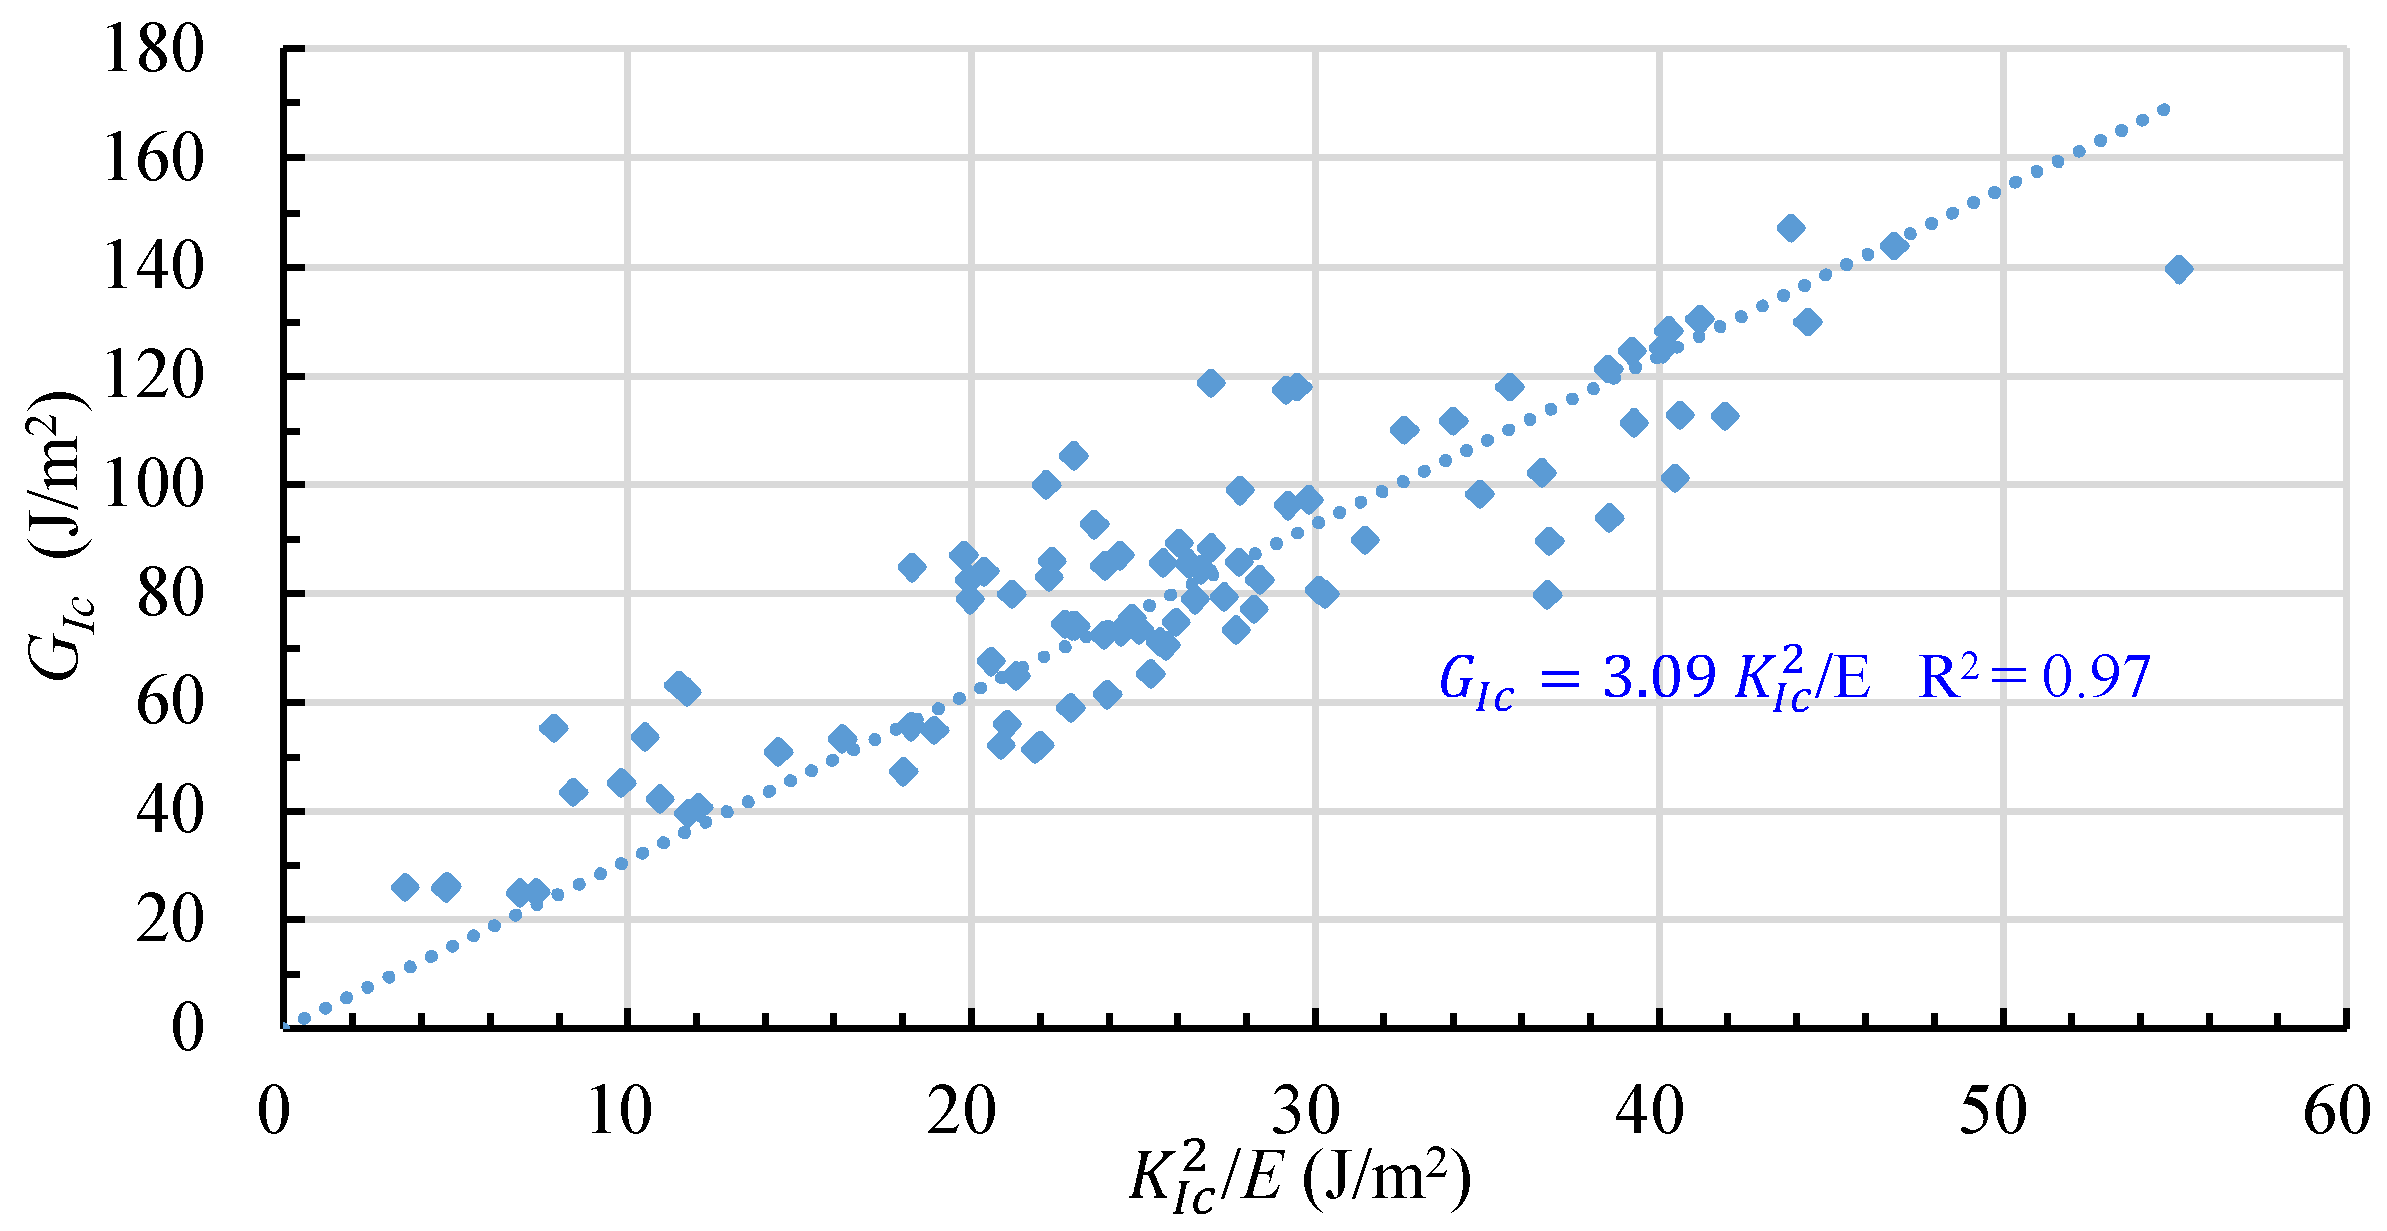
- Fracture toughness and critical energy release rates are experimentally determined for 128 specimens. Based on the determined data of and , a relation between these two fracture parameters is obtained, which is , with an R2 value of 0.97. This coefficient, 3.09, is greater than 1, the coefficient in the linear elastic fracture relation;
- This regression equation coefficient, 3.09, is greater than 1, the coefficient of the linear elastic fracture relation. The two of the reasons for this discrepancy are: (1) the is determined using the nominal crack area rather than the true crack area in this study and (2) the rock fracture is of non-linear-elastic rather than brittle fracture in this study;
- The effect of rock specimen size on the relation between and under static conditions is very small and it can be ignored. Similarly, the effect of loading rate on the relation between and under quasi-static conditions is also neglectable. The lithology does not seem to affect the relation between and under static conditions, but the result is based on only two types of rock.
Author Contributions
Funding
Institutional Review Board Statement
Informed Consent Statement
Data Availability Statement
Acknowledgments
Conflicts of Interest
Nomenclature
| List of Symbols | |
| KIc | Mode I fracture toughness |
| GIc | Critical energy release rate |
| R2 | Coefficient of determination |
| G | Energy release rate |
| KI | Stress intensity factor for mode I |
| NSCB | Notched semi-circular bending |
| CCCD | Center-cracked circular disk |
| Φ | Diameter of specimen |
| R | Radius of specimen |
| t | Thickness of specimen |
| Pmax | Peak loading |
| ν | Poisson’s ratio |
References
- Rice, J.R. A path independent integral and the approximate analysis of strain concentration by notches and cracks. J. Appl. Mech. Trans. ASME 1964, 35, 379–386. [Google Scholar] [CrossRef]
- Anderson, T.L. Fracture Mechanics: Fundamentals and Applications, 4th ed.; CRC Press: Boca Raton, FL, USA, 2017; Volume 76. [Google Scholar]
- Dai, F.; Xia, K.; Zheng, H.; Wang, Y.X. Determination of dynamic rock Mode-I fracture parameters using cracked chevron notched semi-circular bend specimen. Eng. Fract. Mech. 2011, 78, 2633–2644. [Google Scholar] [CrossRef]
- Zhang, Q.B.; Zhao, J. Quasi-static and dynamic fracture behaviour of rock materials: Phenomena and mechanisms. Int. J. Fract. 2014, 189, 1–32. [Google Scholar] [CrossRef]
- Griffith, A.A. The phenomena of rupture and flow in solids. Philos. Trans. R. Soc. Lond. Ser. A 1921, 221, 163–198. [Google Scholar]
- Irwin, G.R. Analysis of Stresses and Strains Near the End of a Crack Traversing a Plate. J. Appl. Mech. 1957, 24, 361–364. [Google Scholar] [CrossRef]
- Westergaard, H.M. Bearing Pressures and Cracks. J. Appl. Mech. 1939, 6, 49–53. [Google Scholar] [CrossRef]
- Shah, S.P.; McGarry, F.J. Griffith Fracture Criterion and Concrete. J. Eng. Mech. Div. 1971, 97, 1663–1676. [Google Scholar] [CrossRef]
- Munz, D. Fracture Mechanics of Ceramics. In Designing with Structural Ceramics; Springer: Dordrecht, The Netherlands, 1991. [Google Scholar] [CrossRef]
- Bažant, Z.P.; Planas, J. Fracture and Size Effect in Concrete and Other Quasibrittle Materials; CRC Press: Boca Raton, FL, USA, 2019. [Google Scholar] [CrossRef]
- Li, L. Time-dependent nonlinear damage behavior of ceramic–matrix composites. In Nonlinear Behavior of Ceramic-Matrix Composites; Woodhead Publishing: Sawston, UK, 2022. [Google Scholar] [CrossRef]
- Dutler, N.; Nejati, M.; Valley, B.; Amann, F.; Molinari, G. On the link between fracture toughness, tensile strength, and fracture process zone in anisotropic rocks. Eng. Fract. Mech. 2018, 201, 56–79. [Google Scholar] [CrossRef]
- Ouchterlony, F. Review of fracture toughness testing of rock. Int. J. Rock Mech. Min. Sci. Geomech. Abstr. 1982, 7, 111. [Google Scholar] [CrossRef]
- Wu, Y.; Yin, T.; Li, Q.; Zhuang, D.; Chen, Y.; Yang, Z. Analytical investigation on the unstable fracture toughness of fine-grained quartz-diorite rock considering the size effect. Eng. Fract. Mech. 2022, 272, 108722. [Google Scholar] [CrossRef]
- Evans, A.; Faber, K. Crack-Growth Resistance of Microcracking Brittle Materials. Am. Ceram. Soc. 1984, 67, 255–260. [Google Scholar] [CrossRef]
- Hoagland, R.G.; Hahn, G.T.; Rosenfield, A.R. Influence of microstructure on fracture propagation in rock. Rock Mech. Rock Eng. 1973, 5, 77–106. [Google Scholar] [CrossRef]
- Boulenouar, A.; Benseddiq, N.; Mazari, M. Strain energy density prediction of crack propagation for 2D linear elastic materials. Theor. Appl. Fract. Mech. 2013, 67–68, 29–37. [Google Scholar] [CrossRef]
- Meschke, G.; Dumstorff, P. Energy-based modeling of cohesive and cohesionless cracks via X-FEM. Comput. Methods Appl. Mech. Eng. 2007, 196, 2338–2357. [Google Scholar] [CrossRef]
- Zhang, T.; Wang, W.; Li, A. The spherical indentation approach for fracture toughness evaluation: A study based on the energy release rate. In Proceedings of the ASME 2018 Pressure Vessels and Piping Conference, Prague, Czech Republic, 15–20 July 2018; American Society of Mechanical Engineers: New York, NY, USA, 2018; Volume 5. [Google Scholar] [CrossRef]
- Bearman, R.; Briggs, C.; Kojovic, T. The applications of rock mechanics parameters to the prediction of comminution behaviour. Miner. Eng. 1997, 10, 255–264. [Google Scholar] [CrossRef]
- Zhang, S.; Wang, L.; Gao, M. Experimental and Numerical Study of the Influence of Prefabricated Crack Width on the Fracture Toughness of NSCB Specimens. Rock Mech. Rock Eng. 2020, 53, 5133–5154. [Google Scholar] [CrossRef]
- Zhang, S.; Wang, H.; Li, X.; Zhang, X.; An, D.; Yu, B. Experimental study on development characteristics and size effect of rock fracture process zone. Eng. Fract. Mech. 2020, 241, 107377. [Google Scholar] [CrossRef]
- Kuruppu, M.D.; Obara, Y.; Ayatollahi, M.R.; Chong, K.P.; Funatsu, T. ISRM-suggested method for determining the mode i static fracture toughness using semi-circular bend specimen. Rock Mech. Rock Eng. 2013, 47, 267–274. [Google Scholar] [CrossRef]
- Ayatollahi, M.R.; Akbardoost, J. Size and Geometry Effects on Rock Fracture Toughness: Mode I Fracture. Rock Mech. Rock Eng. 2013, 47, 677–687. [Google Scholar] [CrossRef]
- Go, C.G.; Swartz, S.E. Energy methods for fracture-toughness determination in concrete. Exp. Mech. 1986, 26, 292–296. [Google Scholar] [CrossRef]
- Irwin, G. Linear fracture mechanics, fracture transition, and fracture control. Eng. Fract. Mech. 1968, 1, 241–257. [Google Scholar] [CrossRef]
- Li, W.; Huang, P.; Chen, Z.; Zheng, X. Testing method of critical energy release rate for interfacial mode II crack. Eng. Fract. Mech. 2021, 248, 107708. [Google Scholar] [CrossRef]
- Ghabezi, P.; Farahani, M. A cohesive model with a multi-stage softening behavior to predict fracture in nano composite joints. Eng. Fract. Mech. 2019, 219, 106611. [Google Scholar] [CrossRef]
- Ghabezi, P.; Farahani, M. Trapezoidal traction–separation laws in mode II fracture in nano-composite and nano-adhesive joints. J. Reinf. Plast. Compos. 2018, 37, 780–794. [Google Scholar] [CrossRef]
- Zhang, Z.X.; Ouchterlony, F. Energy Requirement for Rock Breakage in Laboratory Experiments and Engineering Operations: A Review. Rock Mech. Rock Eng. 2021, 55, 629–667. [Google Scholar] [CrossRef]
- Wang, H.-W.; Wu, Z.-M.; Wang, Y.-J.; Yu, R.C. An analytical method for predicting mode-I crack propagation process and resistance curve of rock and concrete materials. Theor. Appl. Fract. Mech. 2019, 100, 328–341. [Google Scholar] [CrossRef]
- Hu, X.; Duan, K. Size effect and quasi-brittle fracture: The role of FPZ. Int. J. Fract. 2008, 154, 3–14. [Google Scholar] [CrossRef]
- Saucedo-Mora, L.; Yu, R.C.; Ruiz, G. Fully-developed FPZ length in quasi-brittle materials. Int. J. Fract. 2012, 178, 97–112. [Google Scholar] [CrossRef]

| Parameter | Limestone | Sandstone |
|---|---|---|
| Uniaxial compressive strength (MPa) | 178.80 | 58.53 |
| Young’s modulus (GPa) | 70.40 | 8.45 |
| Poisson’s ratio | 0.250 | 0.245 |
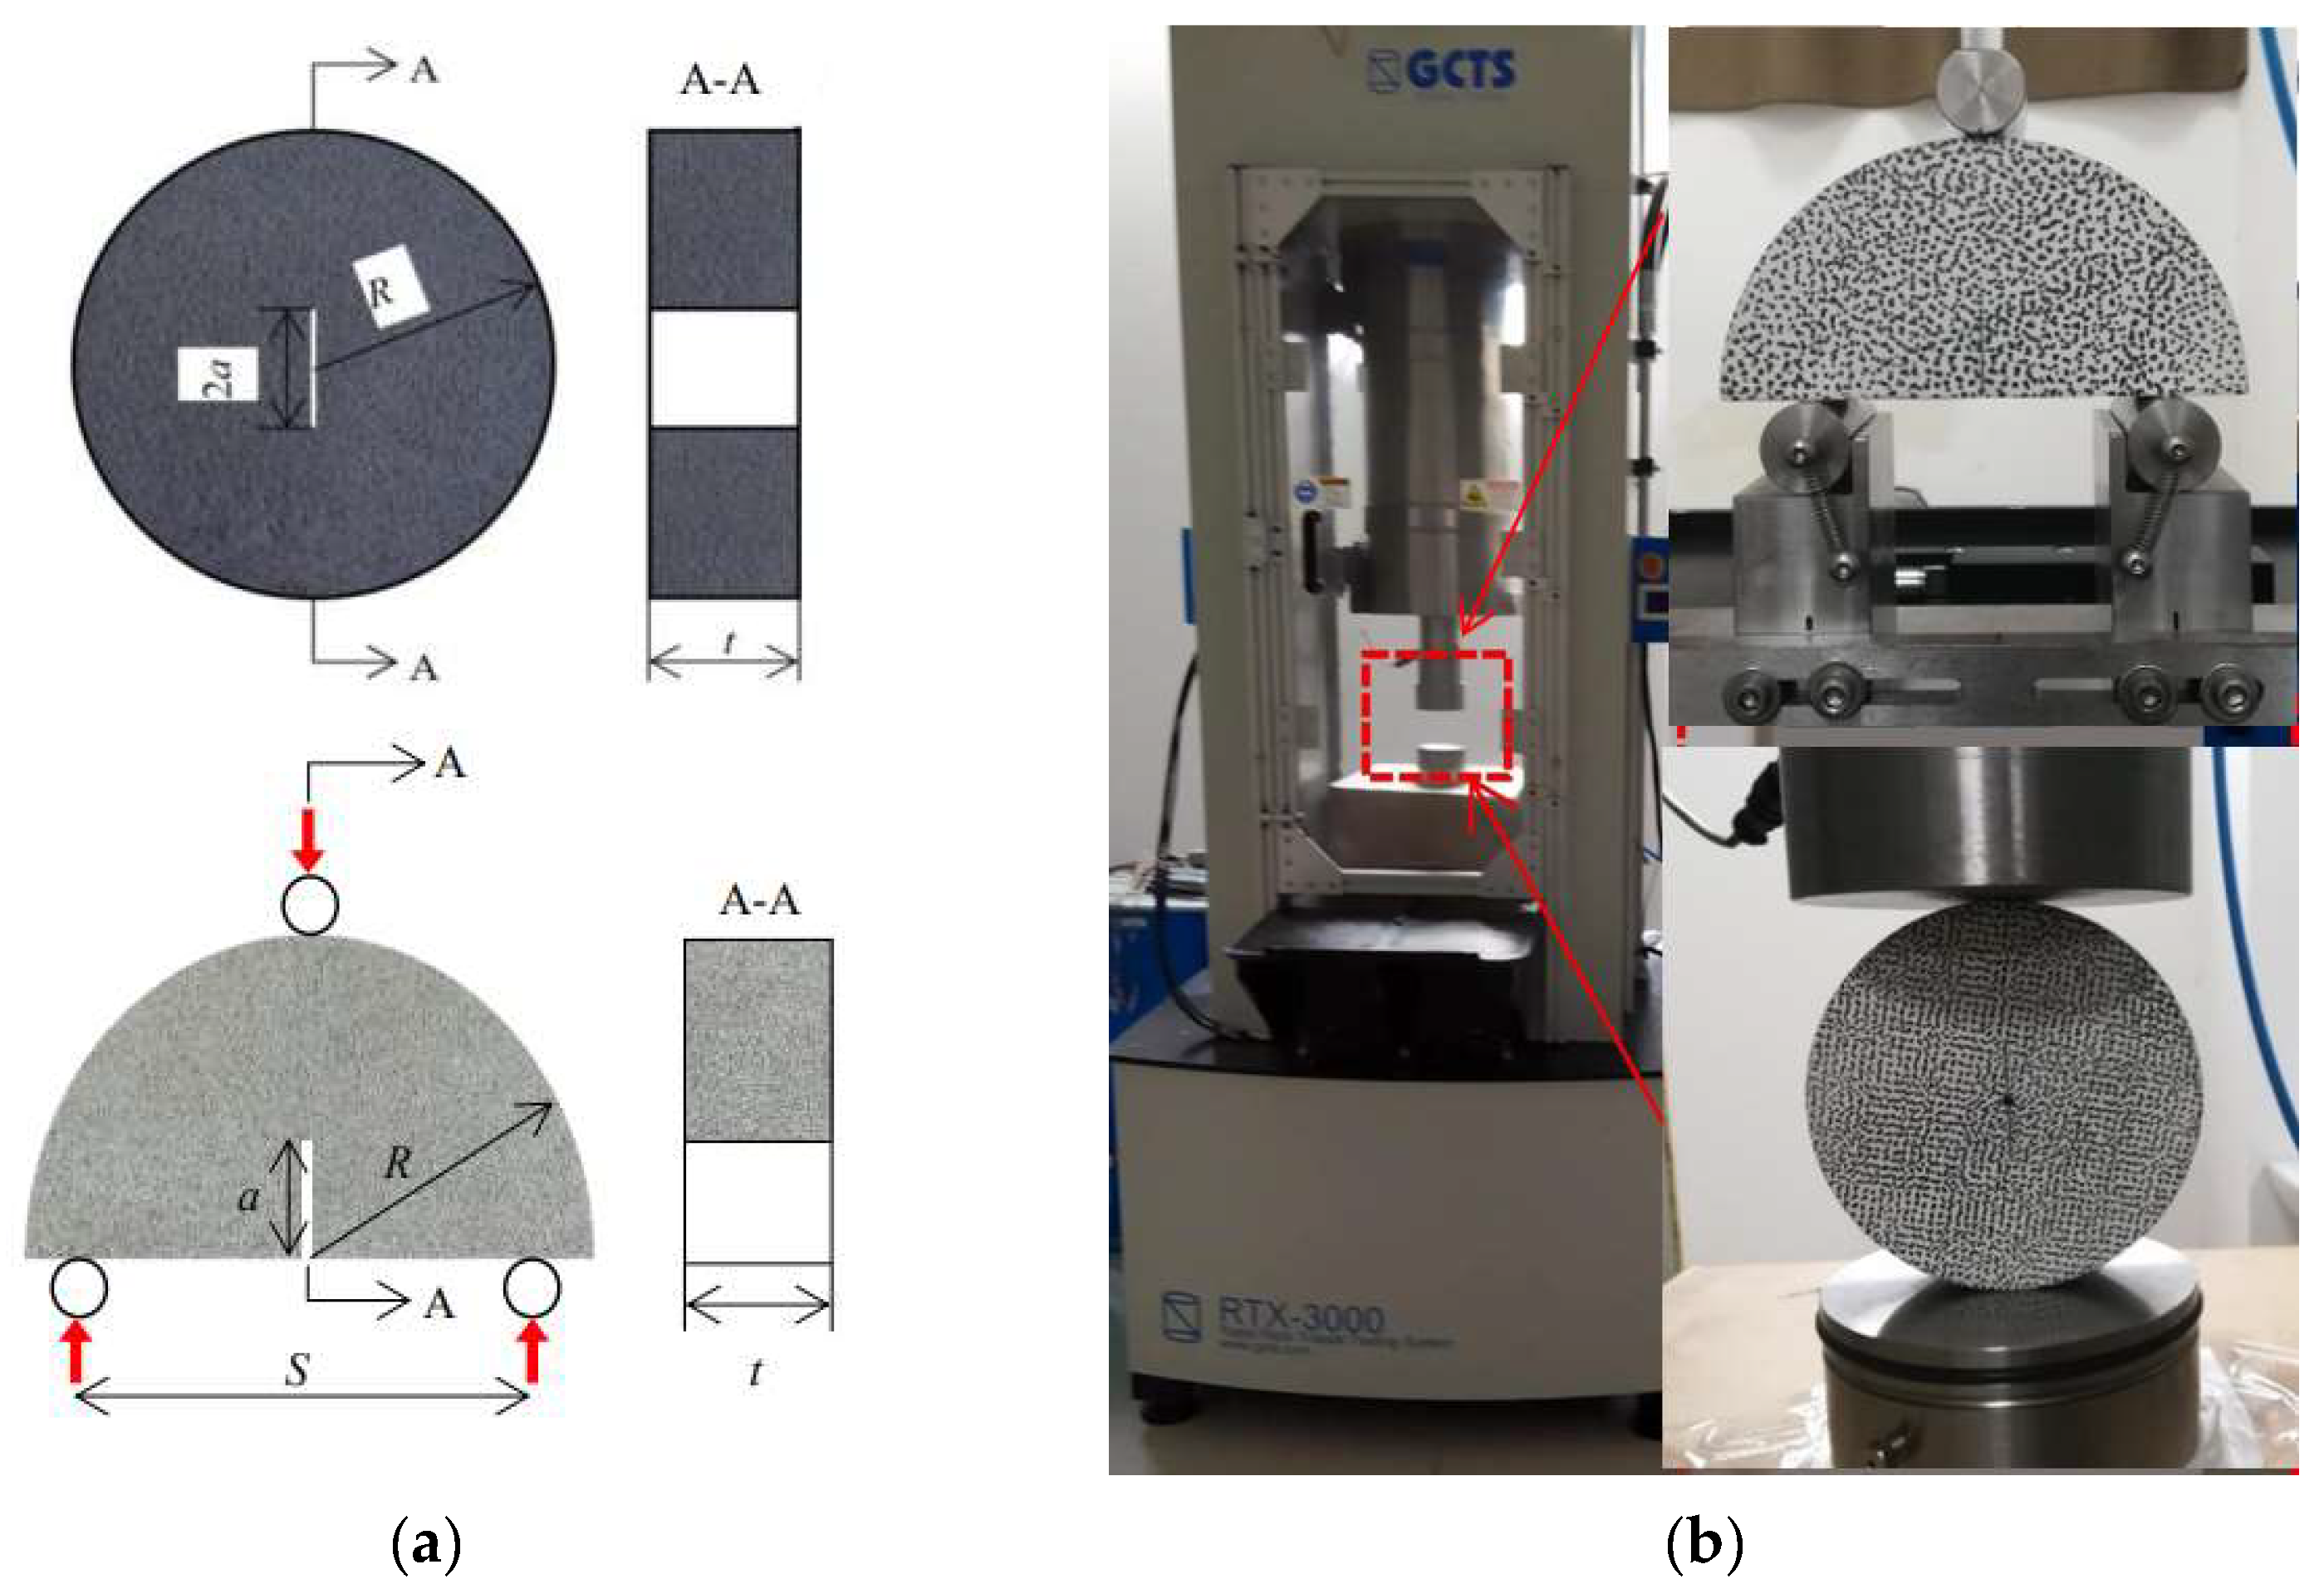
| Rock | Φ/mm | t/mm | Total | Configuration | Specimen No. | Loading Rate |
|---|---|---|---|---|---|---|
| Limestone | 150 | 60 | 20 | NSCB | A1~A20 | 0.002~10 kN/s |
| Limestone | 100 | 40 | 20 | NSCB | B1~B20 | 0.002~10 kN/s |
| Limestone | 75 | 30 | 20 | NSCB | C1~C20 | 0.002~10 kN/s |
| Limestone | 50 | 20 | 20 | NSCB | D1~D20 | 0.002~10 kN/s |
| Limestone | 30 | 12 | 20 | NSCB | E1~E20 | 0.002~10 kN/s |
| Sandstone | 200 | 60 | 4 | NSCB | S200-1~S200-4 | 1.2 mm/s |
| Sandstone | 150 | 45 | 4 | NSCB | S150-1~S150-4 | 1.2 mm/s |
| Sandstone | 100 | 30 | 4 | NSCB | S100-1~S100-4 | 1.2 mm/s |
| Sandstone | 50 | 15 | 4 | NSCB | S50-1~S50-4 | 1.2 mm/s |
| Sandstone | 200 | 60 | 3 | CCCD | C200-1~C200-3 | 1.2 mm/s |
| Sandstone | 150 | 45 | 3 | CCCD | C150-1~C150-3 | 1.2 mm/s |
| Sandstone | 100 | 30 | 3 | CCCD | C100-1~C100-3 | 1.2 mm/s |
| Sandstone | 50 | 15 | 3 | CCCD | C50-1~C50-3 | 1.2 mm/s |
| No. | Pmax (kN) | KIc (MPa·m1/2) | No. | Pmax (kN) | KIc (MPa·m1/2) | No. | Pmax (kN) | KIc (MPa·m1/2) | No. | Pmax (kN) | KIc (MPa·m1/2) |
|---|---|---|---|---|---|---|---|---|---|---|---|
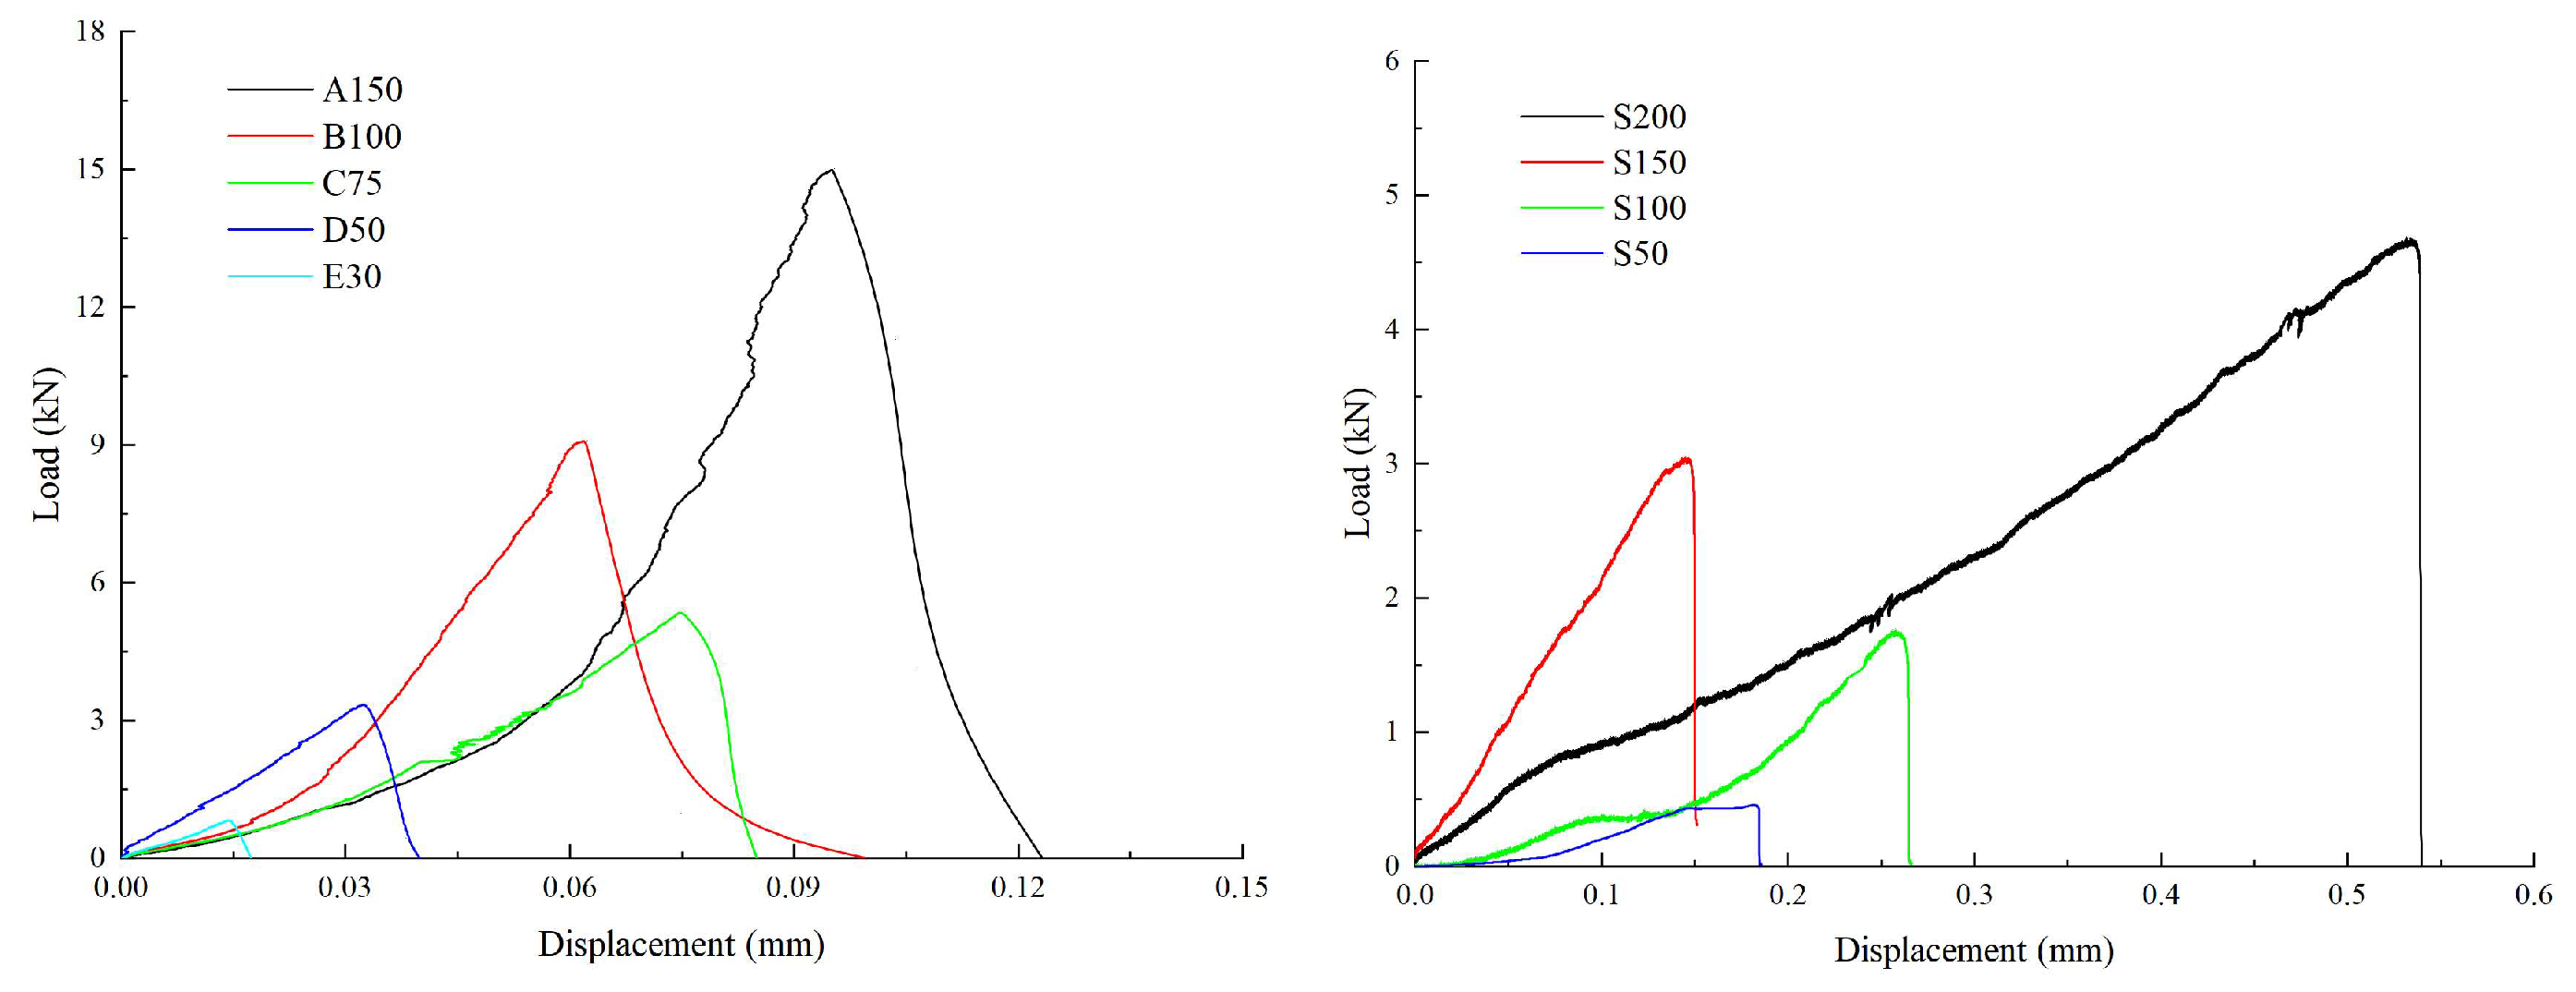
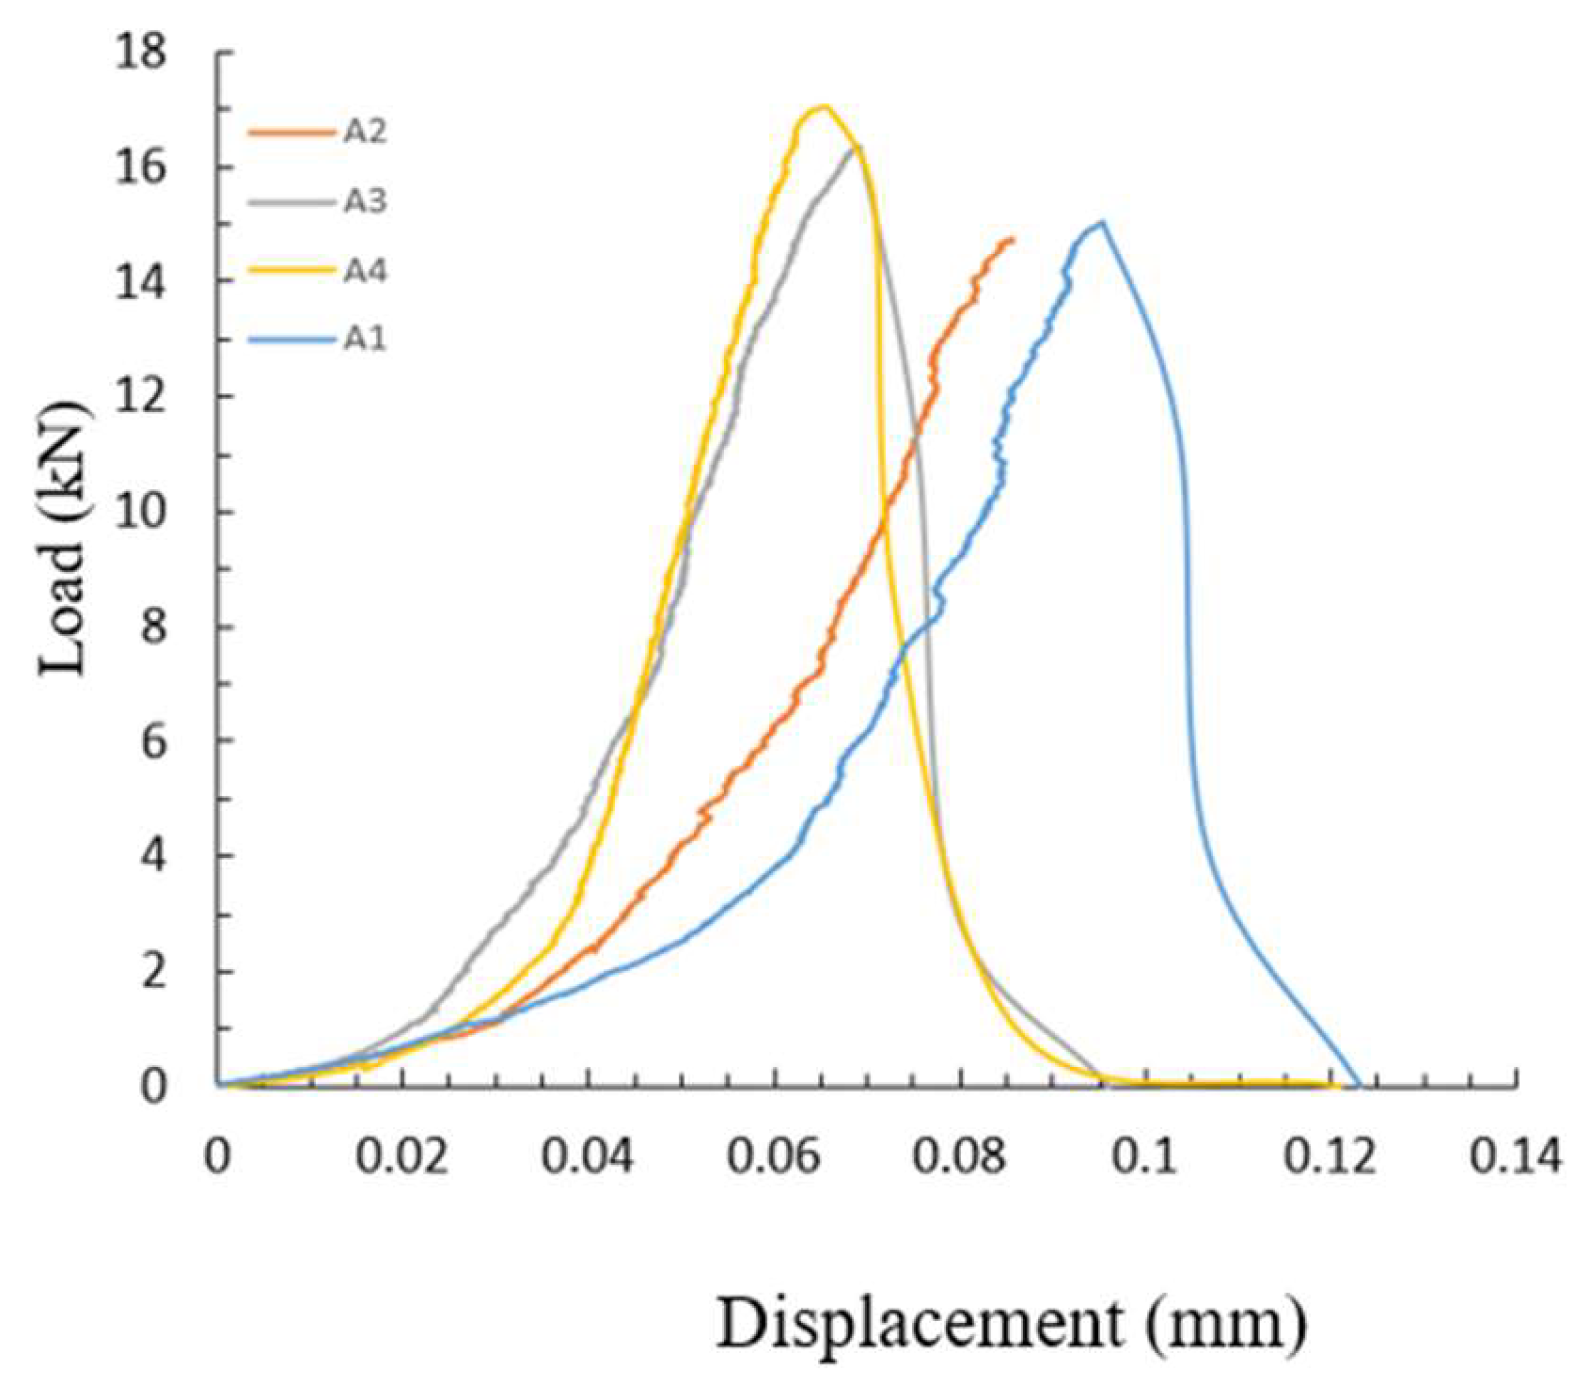
| A1 | 15.016 | 1.186 | B13 | 10.888 | 1.585 | D5 | 2.968 | 1.225 | E17 | 1.074 | 0.922 |
| A2 | 16.318 | 1.271 | B14 | 9.196 | 1.354 | D6 | 3.034 | 1.265 | E18 | 1.588 | 1.274 |
| A3 | 16.340 | 1.310 | B15 | 11.602 | 1.668 | D7 | 2.782 | 1.127 | E19 | 1.344 | 1.045 |
| A4 | 17.014 | 1.340 | B16 | 10.924 | 1.605 | D8 | 2.810 | 1.161 | E20 | 1.462 | 1.245 |
| A5 | 17.912 | 1.400 | B17 | 12.546 | 1.816 | D9 | 3.382 | 1.378 | S50-1 | 0.46 | 0.43 |
| A6 | 18.258 | 1.434 | B18 | 11.502 | 1.681 | D10 | 3.338 | 1.342 | S50-2 | 0.48 | 0.45 |
| A7 | 16.220 | 1.296 | B19 | 10.824 | 1.610 | D11 | 3.060 | 1.252 | S50-3 | 0.53 | 0.42 |
| A8 | 16.826 | 1.324 | B20 | 11.032 | 1.626 | D12 | 3.222 | 1.318 | S50-4 | 0.49 | 0.40 |
| A9 | 18.520 | 1.449 | C1 | 5.354 | 1.183 | D13 | 3.268 | 1.333 | S100-1 | 1.47 | 0.45 |
| A10 | 19.288 | 1.515 | C2 | 5.172 | 1.135 | D14 | 2.900 | 1.204 | S100-2 | 1.75 | 0.53 |
| A11 | 19.866 | 1.565 | C3 | 5.142 | 1.134 | D15 | 3.144 | 1.27 | S100-3 | 1.72 | 0.53 |
| A12 | 21.046 | 1.648 | C4 | 5.550 | 1.221 | D16 | 3.868 | 1.584 | S100-4 | 1.71 | 0.53 |
| A13 | 22.188 | 1.767 | C5 | 5.708 | 1.250 | D17 | 3.588 | 1.488 | S150-1 | 3.08 | 0.50 |
| A14 | 20.930 | 1.662 | C6 | 6.478 | 1.433 | D18 | 3.586 | 1.460 | S150-2 | 3.18 | 0.54 |
| A15 | 18.506 | 1.456 | C7 | 5.464 | 1.198 | D19 | 3.240 | 1.366 | S150-3 | 3.60 | 0.53 |
| A16 | 21.164 | 1.688 | C8 | 5.548 | 1.217 | D20 | 3.240 | 1.352 | S150-4 | 3.00 | 0.49 |
| A17 | 21.422 | 1.684 | C9 | 6.262 | 1.371 | E1 | 0.572 | 0.501 | S200-1 | 4.99 | 0.48 |
| A18 | 22.392 | 1.757 | C10 | 6.302 | 1.388 | E2 | 0.684 | 0.564 | S200-2 | 5.39 | 0.51 |
| A19 | 21.504 | 1.703 | C11 | 6.418 | 1.414 | E3 | 0.826 | 0.720 | S200-3 | 7.06 | 0.69 |
| A20 | 25.032 | 1.970 | C12 | 6.150 | 1.344 | E4 | 0.670 | 0.578 | S200-4 | 6.52 | 0.62 |
| B1 | 9.104 | 1.309 | C13 | 7.312 | 1.609 | E5 | 0.696 | 0.577 | C50-1 | 1.94 | 0.41 |
| B2 | 8.170 | 1.180 | C14 | 6.976 | 1.548 | E6 | 0.894 | 0.744 | C50-2 | 1.96 | 0.29 |
| B3 | 8.798 | 1.272 | C15 | 6.244 | 1.378 | E7 | 0.990 | 0.832 | C50-3 | 1.99 | 0.31 |
| B4 | 7.534 | 1.121 | C16 | 7.542 | 1.662 | E8 | 0.828 | 0.726 | C100-1 | 7.40 | 0.39 |
| B5 | 9.002 | 1.297 | C17 | 7.764 | 1.691 | E9 | 1.008 | 0.861 | C100-2 | 6.93 | 0.36 |
| B6 | 8.202 | 1.185 | C18 | 7.528 | 1.663 | E10 | 0.942 | 0.771 | C100-3 | - | - |
| B7 | 9.332 | 1.255 | C19 | 7.476 | 1.647 | E11 | 0.788 | 0.696 | C150-1 | 14.21 | 0.41 |
| B8 | 9.512 | 1.399 | C20 | 7.736 | 1.718 | E12 | 1.092 | 0.878 | C150-2 | 15.08 | 0.43 |
| B9 | 9.992 | 1.441 | D1 | 2.600 | 1.070 | E13 | 1.088 | 0.910 | C150-3 | 15.79 | 0.45 |
| B10 | 8.990 | 1.289 | D2 | 3.362 | 1.362 | E14 | 1.112 | 0.900 | C200-1 | 24.62 | 0.46 |
| B11 | 9.218 | 1.397 | D3 | 2.572 | 1.050 | E15 | 1.092 | 0.911 | C200-2 | 28.07 | 0.52 |
| B12 | 9.396 | 1.410 | D4 | 2.442 | 1.007 | E16 | 1.196 | 1.039 | C200-3 | 28.46 | 0.53 |
| A Group | B Group | C Group | D Group | E Group | S Group | CCCD | |
|---|---|---|---|---|---|---|---|
| mean (J/m2) | 100.86 | 96.84 | 90.61 | 73.68 | 43.62 | 82.51 | 296.42 |
| max (J/m2) | 147.14 | 143.74 | 121.12 | 118.51 | 73.95 | 137.30 | 433.85 |
| min (J/m2) | 71.10 | 73.31 | 55.54 | 47.22 | 25.00 | 51.27 | 193.43 |
| median (J/m2) | 97.60 | 87.18 | 84.47 | 74.67 | 42.77 | 76.85 | 280.13 |
| mean (MPa·m1/2) | 1.52 | 1.42 | 1.41 | 1.28 | 0.83 | 0.5 | 0.44 |
| max (MPa·m1/2) | 1.97 | 1.82 | 1.72 | 1.49 | 1.25 | 0.69 | 0.53 |
| min (MPa·m1/2) | 1.19 | 1.19 | 1.13 | 1.01 | 0.50 | 0.40 | 0.36 |
| median (MPa·m1/2) | 1.49 | 1.40 | 1.38 | 1.32 | 0.85 | 0.5 | 0.43 |
| No. | (J/m2) | (J/m2) | No. | (J/m2) | (J/m2) | No. | (J/m2) | (J/m2) | No. | (J/m2) | (J/m2) |
|---|---|---|---|---|---|---|---|---|---|---|---|
| A1 | 19.98 | 78.76 | B13 | 35.69 | 117.91 | D5 | 21.32 | 64.74 | E17 | 12.08 | 40.55 |
| A2 | 22.95 | 74.00 | B14 | 26.05 | 89.18 | D6 | 22.73 | 74.36 | E18 | 23.06 | 73.95 |
| A3 | 24.38 | 72.86 | B15 | 39.53 | 161.64 | D7 | 18.04 | 47.22 | E19 | - | - |
| A4 | 25.51 | 71.10 | B16 | 36.60 | 102.05 | D8 | 0.00 | 0.00 | E20 | 22.02 | 52.02 |
| A5 | 27.84 | 98.91 | B17 | 46.85 | 143.74 | D9 | 26.98 | 118.51 | S50-1 | 21.88 | 51.27 |
| A6 | 29.21 | 96.14 | B18 | 40.14 | 124.95 | D10 | 25.59 | 85.63 | S50-2 | 23.96 | 46.18 |
| A7 | 23.86 | 72.18 | B19 | 36.82 | 89.50 | D11 | 22.27 | 82.97 | S50-3 | 20.88 | 52.04 |
| A8 | 24.90 | 73.29 | B20 | 37.56 | 68.36 | D12 | 24.68 | 75.29 | S50-4 | 18.93 | 54.78 |
| A9 | 29.83 | 97.11 | C1 | 19.88 | 104.79 | D13 | 25.24 | 65.10 | S100-1 | 23.96 | 61.36 |
| A10 | 32.61 | 109.97 | C2 | 18.30 | 84.70 | D14 | 20.59 | 67.42 | S100-2 | - | - |
| A11 | 34.80 | 98.09 | C3 | 18.27 | 55.54 | D15 | 22.91 | 58.87 | S100-3 | 33.24 | 91.41 |
| A12 | 38.58 | 93.92 | C4 | 21.18 | 79.89 | D16 | 35.65 | 49.40 | S100-4 | 33.24 | 88.71 |
| A13 | 44.36 | 129.82 | C5 | 22.20 | 99.92 | D17 | 31.46 | 89.73 | S150-1 | 29.59 | 52.43 |
| A14 | 39.24 | 124.42 | C6 | 29.17 | 117.39 | D18 | 30.28 | 79.81 | S150-2 | 34.51 | 63.50 |
| A15 | 30.12 | 80.46 | C7 | 20.39 | 84.07 | D19 | 26.51 | 78.75 | S150-3 | 33.24 | 83.57 |
| A16 | 40.48 | 101.10 | C8 | 21.04 | 55.88 | D20 | 25.97 | 74.67 | S150-4 | 28.41 | 76.85 |
| A17 | 40.29 | 128.21 | C9 | 26.70 | 84.25 | E1 | 3.57 | 25.88 | S200-1 | 27.27 | 132.60 |
| A18 | 43.86 | 147.14 | C10 | 27.37 | 79.27 | E2 | - | - | S200-2 | 30.78 | 137.30 |
| A19 | 41.20 | 130.28 | C11 | 28.40 | 82.43 | E3 | 7.36 | 25.00 | S200-3 | 56.34 | 126.85 |
| A20 | 55.13 | 139.53 | C12 | 25.66 | 70.40 | E4 | 4.75 | 26.11 | S200-4 | - | - |
| B1 | 24.34 | 86.89 | C13 | 36.78 | 79.61 | E5 | 4.73 | 25.72 | C50-1 | 19.89 | 193.43 |
| B2 | 19.78 | 86.93 | C14 | 34.04 | 111.65 | E6 | 7.86 | 55.17 | C50-2 | - | - |
| B3 | 22.99 | 105.17 | C15 | 26.98 | 88.33 | E7 | 9.83 | 45.05 | C50-3 | - | - |
| B4 | - | - | C16 | 39.24 | 76.89 | E8 | - | - | C100-1 | 18.00 | 200.93 |
| B5 | 23.90 | 85.04 | C17 | 40.62 | 112.67 | E9 | 10.53 | 53.51 | C100-2 | 15.34 | 242.54 |
| B6 | 19.95 | 82.48 | C18 | 39.29 | 111.28 | E10 | 8.44 | 43.43 | C100-3 | - | - |
| B7 | 22.38 | 85.88 | C19 | 38.54 | 121.12 | E11 | 6.88 | 24.89 | C150-1 | 19.89 | 280.13 |
| B8 | 27.81 | 85.64 | C20 | 41.93 | 112.51 | E12 | 10.95 | 42.11 | C150-2 | 21.88 | 269.24 |
| B9 | 29.50 | 117.89 | D1 | 16.27 | 53.27 | E13 | 11.76 | 61.92 | C150-3 | 23.96 | 305.30 |
| B10 | 23.60 | 92.65 | D2 | 26.35 | 85.38 | E14 | 11.51 | 63.10 | C200-1 | 25.04 | 396.72 |
| B11 | 27.73 | 73.31 | D3 | - | - | E15 | 11.79 | 39.50 | C200-2 | 32.00 | 433.85 |
| B12 | 28.24 | 77.08 | D4 | 14.41 | 50.84 | E16 | - | - | C200-3 | 33.24 | 345.61 |
Disclaimer/Publisher’s Note: The statements, opinions and data contained in all publications are solely those of the individual author(s) and contributor(s) and not of MDPI and/or the editor(s). MDPI and/or the editor(s) disclaim responsibility for any injury to people or property resulting from any ideas, methods, instructions or products referred to in the content. |
© 2023 by the authors. Licensee MDPI, Basel, Switzerland. This article is an open access article distributed under the terms and conditions of the Creative Commons Attribution (CC BY) license (https://creativecommons.org/licenses/by/4.0/).
Share and Cite
Qiao, Y.; Zhang, Z.-X.; Zhang, S. An Experimental Study of the Relation between Mode I Fracture Toughness, KIc, and Critical Energy Release Rate, GIc. Materials 2023, 16, 1056. https://doi.org/10.3390/ma16031056
Qiao Y, Zhang Z-X, Zhang S. An Experimental Study of the Relation between Mode I Fracture Toughness, KIc, and Critical Energy Release Rate, GIc. Materials. 2023; 16(3):1056. https://doi.org/10.3390/ma16031056
Chicago/Turabian StyleQiao, Yang, Zong-Xian Zhang, and Sheng Zhang. 2023. "An Experimental Study of the Relation between Mode I Fracture Toughness, KIc, and Critical Energy Release Rate, GIc" Materials 16, no. 3: 1056. https://doi.org/10.3390/ma16031056
APA StyleQiao, Y., Zhang, Z.-X., & Zhang, S. (2023). An Experimental Study of the Relation between Mode I Fracture Toughness, KIc, and Critical Energy Release Rate, GIc. Materials, 16(3), 1056. https://doi.org/10.3390/ma16031056


