Article

Phase Transition of High-Surface-Area Glycol–Thermal Synthesized Lanthanum Manganite

School of Chemistry and Physics, Westville Campus, University of KwaZulu-Natal, Durban 4000, South Africa
*
Author to whom correspondence should be addressed.
Materials 2023, 16(3), 1274; https://doi.org/10.3390/ma16031274
Submission received: 19 November 2022 / Revised: 28 December 2022 / Accepted: 28 January 2023 / Published: 2 February 2023

Abstract

:
Cubic and rhombohedral phases of lanthanum manganite were synthesized in a high-pressure reactor. A mixture of La and Mn nitrates with ethylene glycol at a synthesis temperature of 200 °C and a calcination temperature of up to 1000 °C, resulted in a single-phase perovskite, LaMnO3 validated using X-ray diffraction. Significant changes in unit cell volumes from 58 to 353 Å3 were observed associated with structural transformation from the cubic to the rhombohedral phase. This was confirmed using structure calculations and resistivity measurements. Transmission electron microscopy analyses showed small particle sizes of approximately 19, 39, 45, and 90 nm (depending on calcination temperature), no agglomeration, and good crystallinity. The particle characteristics, high purity, and high surface area (up to 33.1 m2/g) of the material owed to the inherent PAAR reactor pressure, are suitable for important technological applications, that include the synthesis of perovskite oxides. Characteristics of the synthesized LaMnO3 at different calcination temperatures are compared, and first-principles calculations suggest a geometric optimization of the cubic and rhombohedral perovskite structures.

1. Introduction

Nanomaterials of perovskite oxide based on the ABO3 system, where the lanthanide occupies the A-site, and an alkaline earth metal or transition metal the B-site, have recently gained popularity and have become a subject of interest for researchers due to the possibility of several applications [1]. For an ideal cubic perovskite structure using the ABO3 chemical formula, twelve and six oxygen atoms are bound to the A-site and B-site cations, respectively. These A- and B-sites can accommodate elements with ionic radii that can fit the perovskite structure allowing for precise development of the mixed oxide material [2]. The coordination of the cation and the anion contributes to the high stability of the perovskite structure and substituting either or both sites can influence the use of perovskite-type oxides in electrocatalysis, thermocatalysis, photocatalysis, and energy storage [3,4]. Detailed understanding of the structure and distribution of defects in the perovskite-type oxide are the basis to elucidate oxygen ion transport in the pure phase material. Among structural defects present in perovskite-type oxides, the Jahn–Teller (JT) effect describes the geometrical distortion of B-site cations in perovskite oxides. In a neutron diffraction study, Alonso et al. [5] studied the evolution of the JT effect in RMnO3 (R = rare earth) powders prepared from citrate precursors. They concluded that the JT distortion mediates the elongation of the axial bonds of the thermally treated perovskite, which further results in the occurrence of different cationic–anionic bond lengths.
Perovskite oxide catalysts used in oxidative catalysis are just as good as widely used metal oxides, such as CeO2 and precious metals, such as Pt and Pd [1]. The application of the ABO3 system in oxidative catalysis showed that their performance is due to the presence of active peroxide species activated by lattice oxygen and considerably reduced activation energy barriers [6]. With a host of alkaline earth metals being employed in the catalytically active B-site of the perovskite group of materials, manganese-based perovskite catalysts have been shown to be efficient, particularly in automotive exhaust catalytic converters, when compared to other mixed oxide systems [7]. The catalytic performance of the Mn-based system is also influenced by the ability of the perovskite to accommodate oxidative non-stoichiometry [8]. Apart from the known underlying principles, such as the partial substitution of the B-site where the Mn cations reside, Mn oxidation states positively contribute to the redox property of the perovskite [9,10]. Furthermore, the nanoscale crystals of Mn-based perovskites often exhibit properties different from their bulk counterparts [11]. This difference was observed in studies comparing the specific surface area of the bulk material with nanoscale Mn perovskite, reported by Kulandaivelu et al. and Zhong et al. [12,13]. They suggested that the decrease in grain size resulting in a larger surface area of the nanoscale perovskite led to a decrease in the phase transition temperature of perovskites. In addition, due to various favourable properties of the Mn perovskite-type oxides, the perovskite material can substitute noble metal catalysts in heterogeneous catalytic reactions [1]. Such perovskite-structured materials can exist in cubic, orthorhombic, and rhombohedral phases [14,15]. The rhombohedral phase, prepared via high thermal treatment, contains excess oxygen caused by cationic vacancies [16,17]. Rodriguez-Carvajal et al. [15] studied the defectiveness of LaMnO3 and concluded that the presence of Mn4+ resulted in the creation of cationic vacancies at the site containing the lanthanum cation, and in the B-site containing the Mn cation. However, Wang et al. [18] showed that different calcination temperatures influenced the crystal phases of the lanthanum–strontium–manganite material prepared to investigate its electrocatalytic behaviour towards the oxygen reduction reaction (ORR). There were attempts to determine which perovskite phase was more active, including the work by Ashok et al. [19], who reported a slight elongation of the B-site and O–anion bond in the cubic structure, which led to favourable oxygen chemisorption that facilitated bifunctionality towards the ORR. In addition, LaMnO3 with a rhombohedral structure showed reasonable performance for use in the catalytic oxidation of CO, the selective oxidation (SELOX) of CO, oxygen reduction reactions (ORR), and oxygen evolution reactions (OER) [9,18].
The lattice structure of LaMnO3 perovskite exists as an ideal cubic Pm-3m space group at room temperature. Due to the appearance of cooperative rotations of the MnO6 oxygen octahedral, the lattice deviates from this ideal structure. A temperature change generally induces LaMnO3 structural phase transition. According to Illiev et al., LaMnO3 heat-treated at 900 °C, showed the orthorhombic Pbnm space group [14]. However, when Qiu et al. and Norby et al. treated LaMnO3 at a temperature > 900 °C, the rhombohedral space group R3 c ¯ was identified [20,21]. The synthesis method and calcination temperature have been shown to influence the perovskite lattice structure.
Various synthesis methods for preparing perovskites with a variety of rare earth elements occupying the A-site have been reported [22,23,24]. The citrate method was used in the preparation of samarium and neodymium compounds which were compared with LaFeO3 for methane combustion. The order of activity towards methane combustion was reported as La > Nd > Sm [3]. Apart from the citrate method, other methods, such as reactive mechanical milling [25], solid-state reactions [26,27], sol–gel [28,29], co-precipitation [30], thin-film deposition [31], single-crystal growth [15], and solution combustion [32] have produced materials with various physicochemical properties. Another method for bulk production of the perovskite materials is using the glycol–thermal technique, which has been applied successfully to obtain different types of metal-oxides, spinels, and perovskite-type oxides [33,34]. This method was effective in the synthesis of a structured manganese spinel via the activation of chloride compounds that favoured the single-phase formation of uniform, nanocrystalline, and non-agglomerated materials [33]. A report by Tomaszewski et al. [35] describes the use of a microwave-assisted glycol–thermal method to prepare different La-based nano-crystalline perovskite oxides.
This study investigates a method of synthesizing perovskites containing La and Mn with controlled grain size with no use of a chelating agent and seeks to determine the relationship between the synthesis procedure and the crystal structure transition, morphology, texture, and particle size. For the first time the glycol–thermal method was used to synthesize high-surface-area LaMnO3 perovskite powders which was calcined from 700 to 1000 °C. The perovskite oxides demonstrated a phase transformation from the cubic Pm-3m to the R 3 ¯ c crystal system in the temperature range of 800–900 °C. Theoretical evaluation of the transition of the LaMnO3 perovskite structure using first-principles calculations was used to support experimental results.

2. Experimental

2.1. Synthesis and Structural Calculations

LaMnO3 perovskite oxides were prepared using the glycol–thermal synthesis method following a procedure reported previously [36]. A solution of lanthanum and manganese was prepared by dissolving lanthanum nitrate (62.6 wt.%) and manganese nitrate (37.4 wt.%) in 500 mL of deionized water. Ammonia was added dropwise to the La/Mn solution to increase and maintain the pH at 9 to facilitate precipitation. The mixture was stirred continuously to allow for complete precipitation. The precipitate was filtered and washed several times with deionized water, until a pH of 7 was obtained. Excess water was further removed with a final wash with ethanol. The precipitated gel was placed in a 600 mL glass liner, to which 200 mL of ethylene glycol was added and vigorously stirred to obtain homogeneity. The vessel was placed in a PARR reactor (Moline, IL, USA), set at a reaction temperature of 200 °C and stirred at 300 rpm for 6 h. The resulting gel was transferred from the glass liner after the reaction came to completion, and washed using deionized water and ethanol to remove any trace of ethylene glycol. The gel was dried using a 200 W IR lamp for 12 h. The resulting solid was finely crushed using a mortar and pestle and finally calcined at 700, 800, 900, and 1000 °C for 6 h to obtain materials denoted as LM 700, LM 800, LM 900, and LM 1000, respectively.

2.2. Density Functional Theory Calculations

Density functional theory (DFT) theoretical calculations were executed using Biovia material studio software 2017 v17.1.0.48, with the CASTEP (Cambridge sequential total energy package) geometry optimization module. The 3D structures of the LaMnO3 cubic and rhombohedral symmetry used for the CASTEP calculations are shown in Figure S1, supplementary information. A plane-wave energy cut-off of 450, 650, and 800 eV and a very close Monkhorst–Pack k-point grid were applied to converge the electron system. LaMnO3 density of states (DOS) and band structure of the cells as a function of energy were compared. Pseudo atomic calculations performed for La (5s2, 5p6, 5d1, and 6s2), Mn (3d5 and 4s2), and O (2s2 and 2p4) converged successfully for all plane-wave energy cut-offs. These sets of parameters were sufficient to produce the total energy convergence, BFGS maximum enthalpy (eV), frequency (cm−1), modulus/stress (GPa), maximum force, and maximum displacement ( ) obtained. In the configuration setup, the “spin polarized” option was chosen, which ensured that spin–orbit interaction in the calculation was obtained.

2.3. Material Characterization

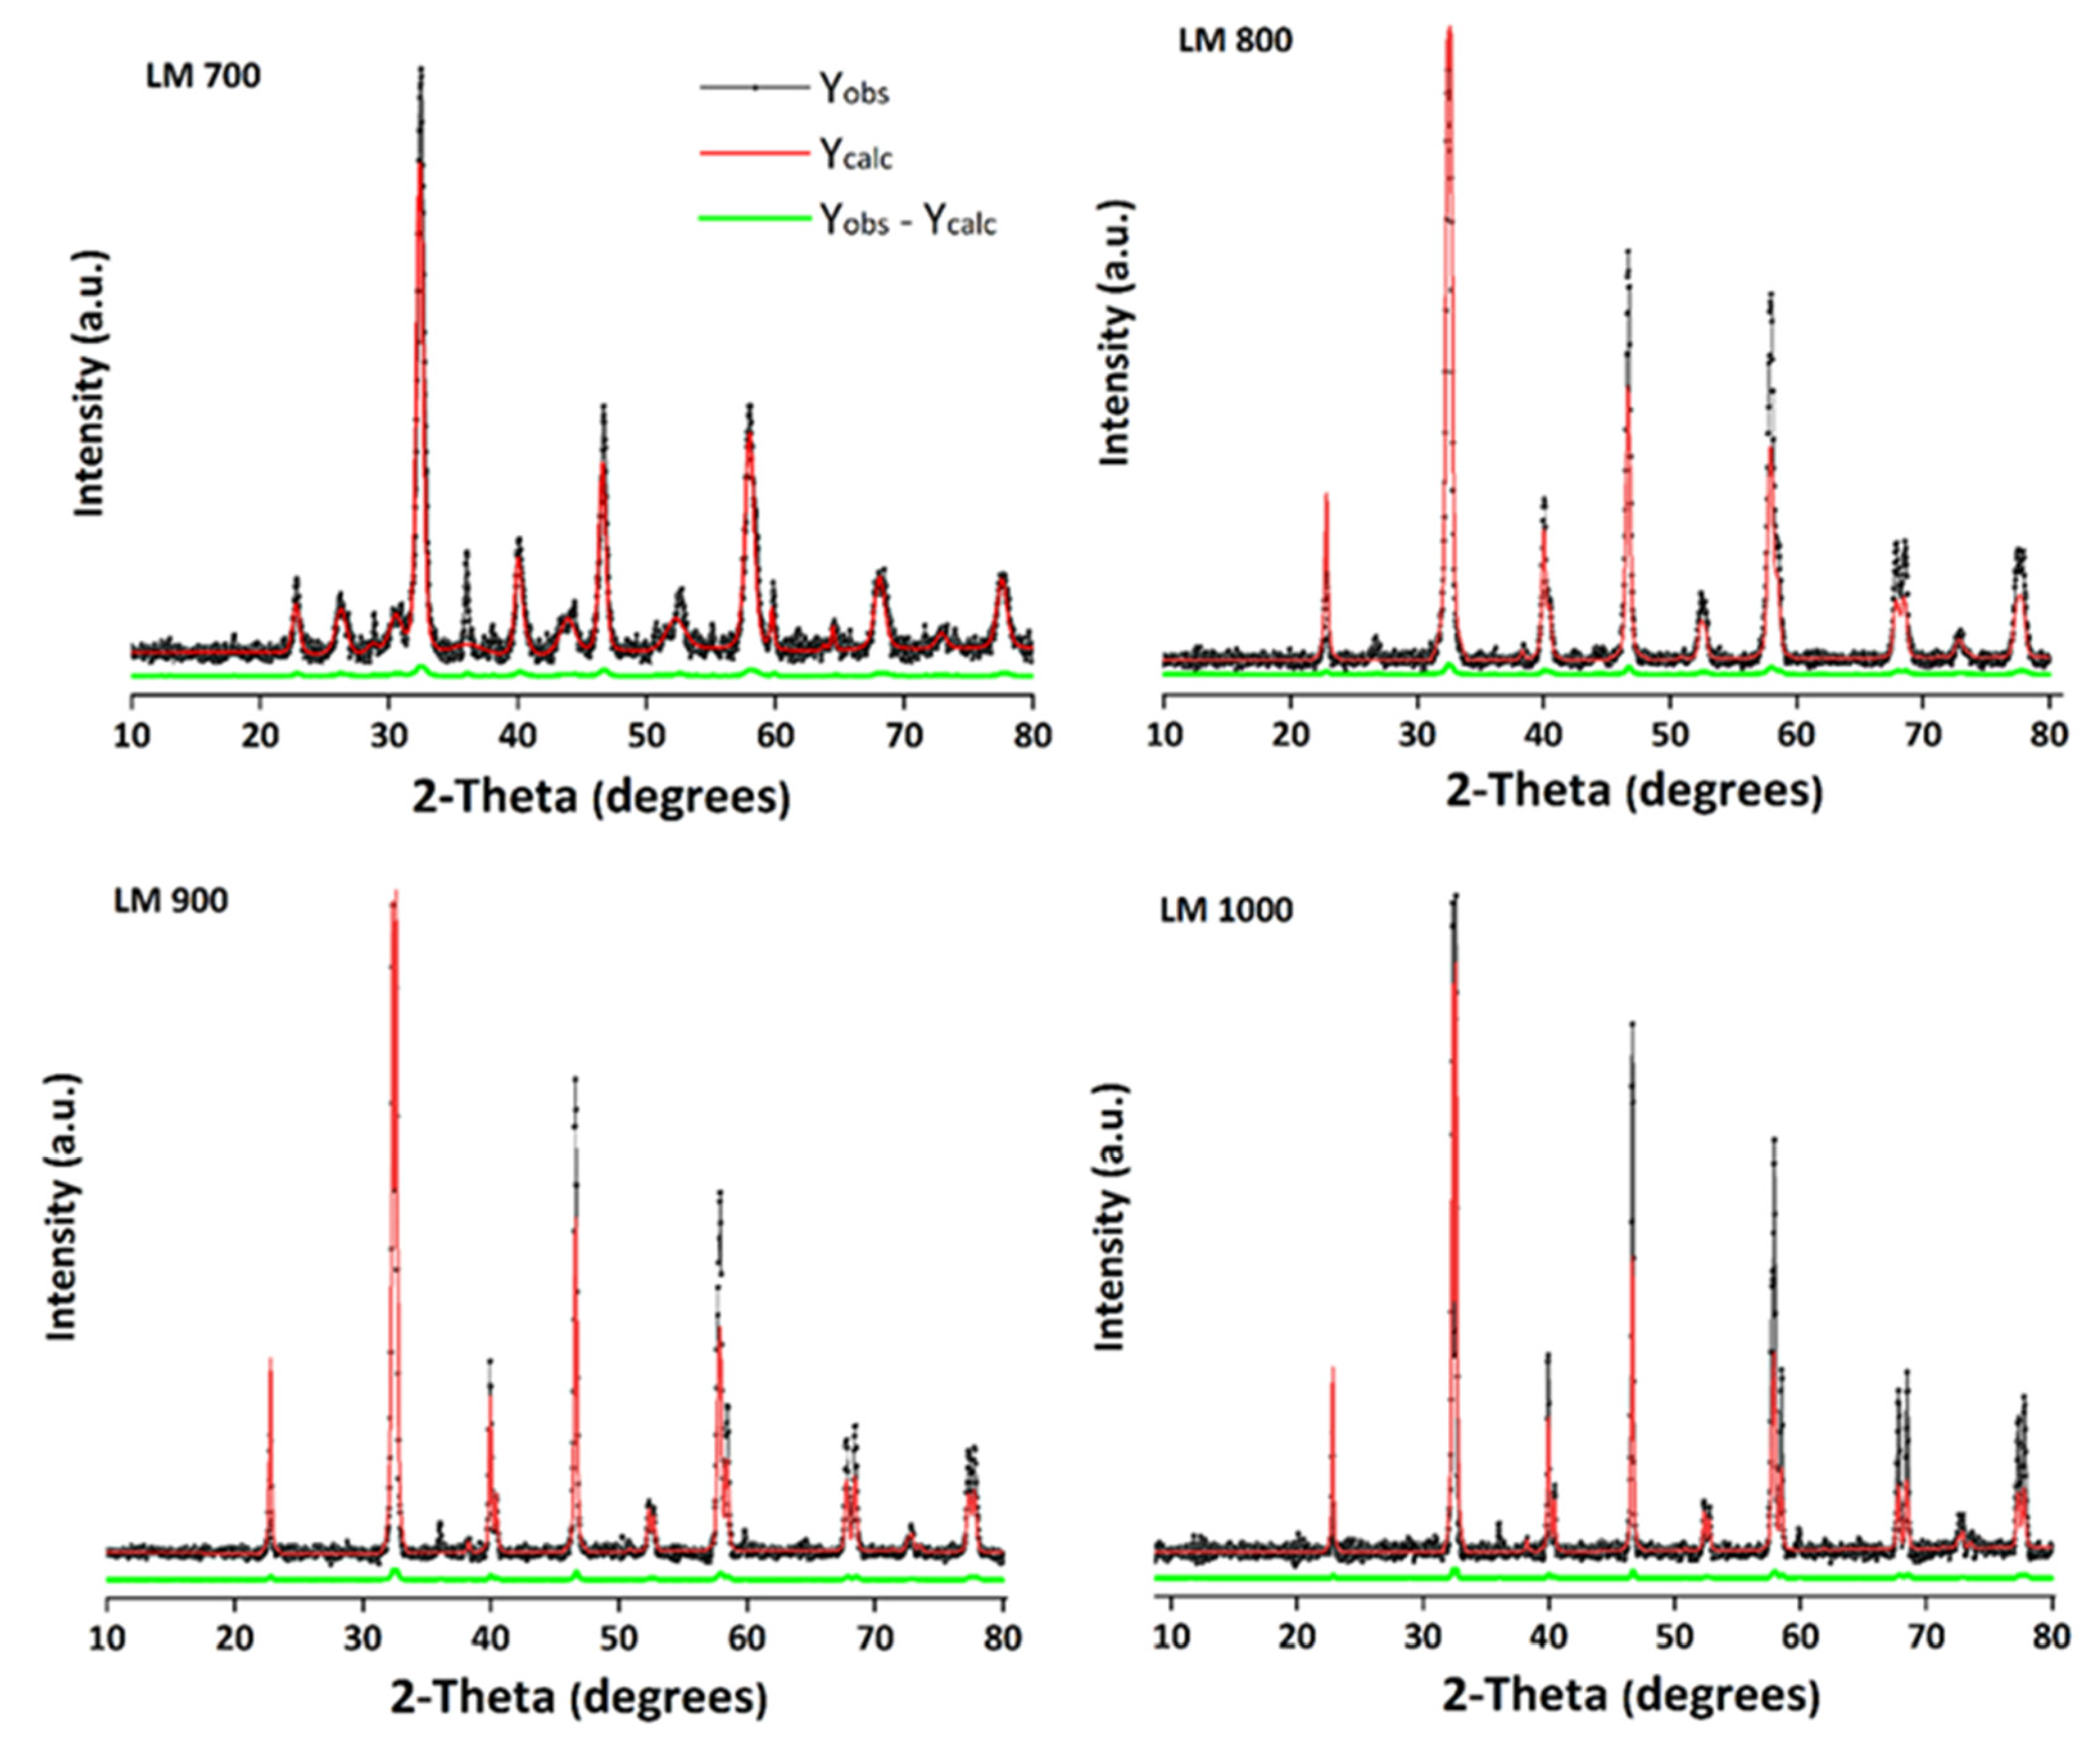
2.3.1. Phase Identification

X-ray diffraction (XRD) of the powders was used to determine the phase transformation during the calcination process, using a BRUKER AXS (Karlsruhe, Germany) multipurpose D8-Advance X-ray diffractometer. Diffraction parameters were a 2θ range of 20 to 90°, with a step size of 0.034°. A Cu–Kα (λ = 1.5406 ) radiation source was used in all experiments. Rietveld refinement analysis of the XRD data was performed to determine the lattice of the perovskite oxide structure.

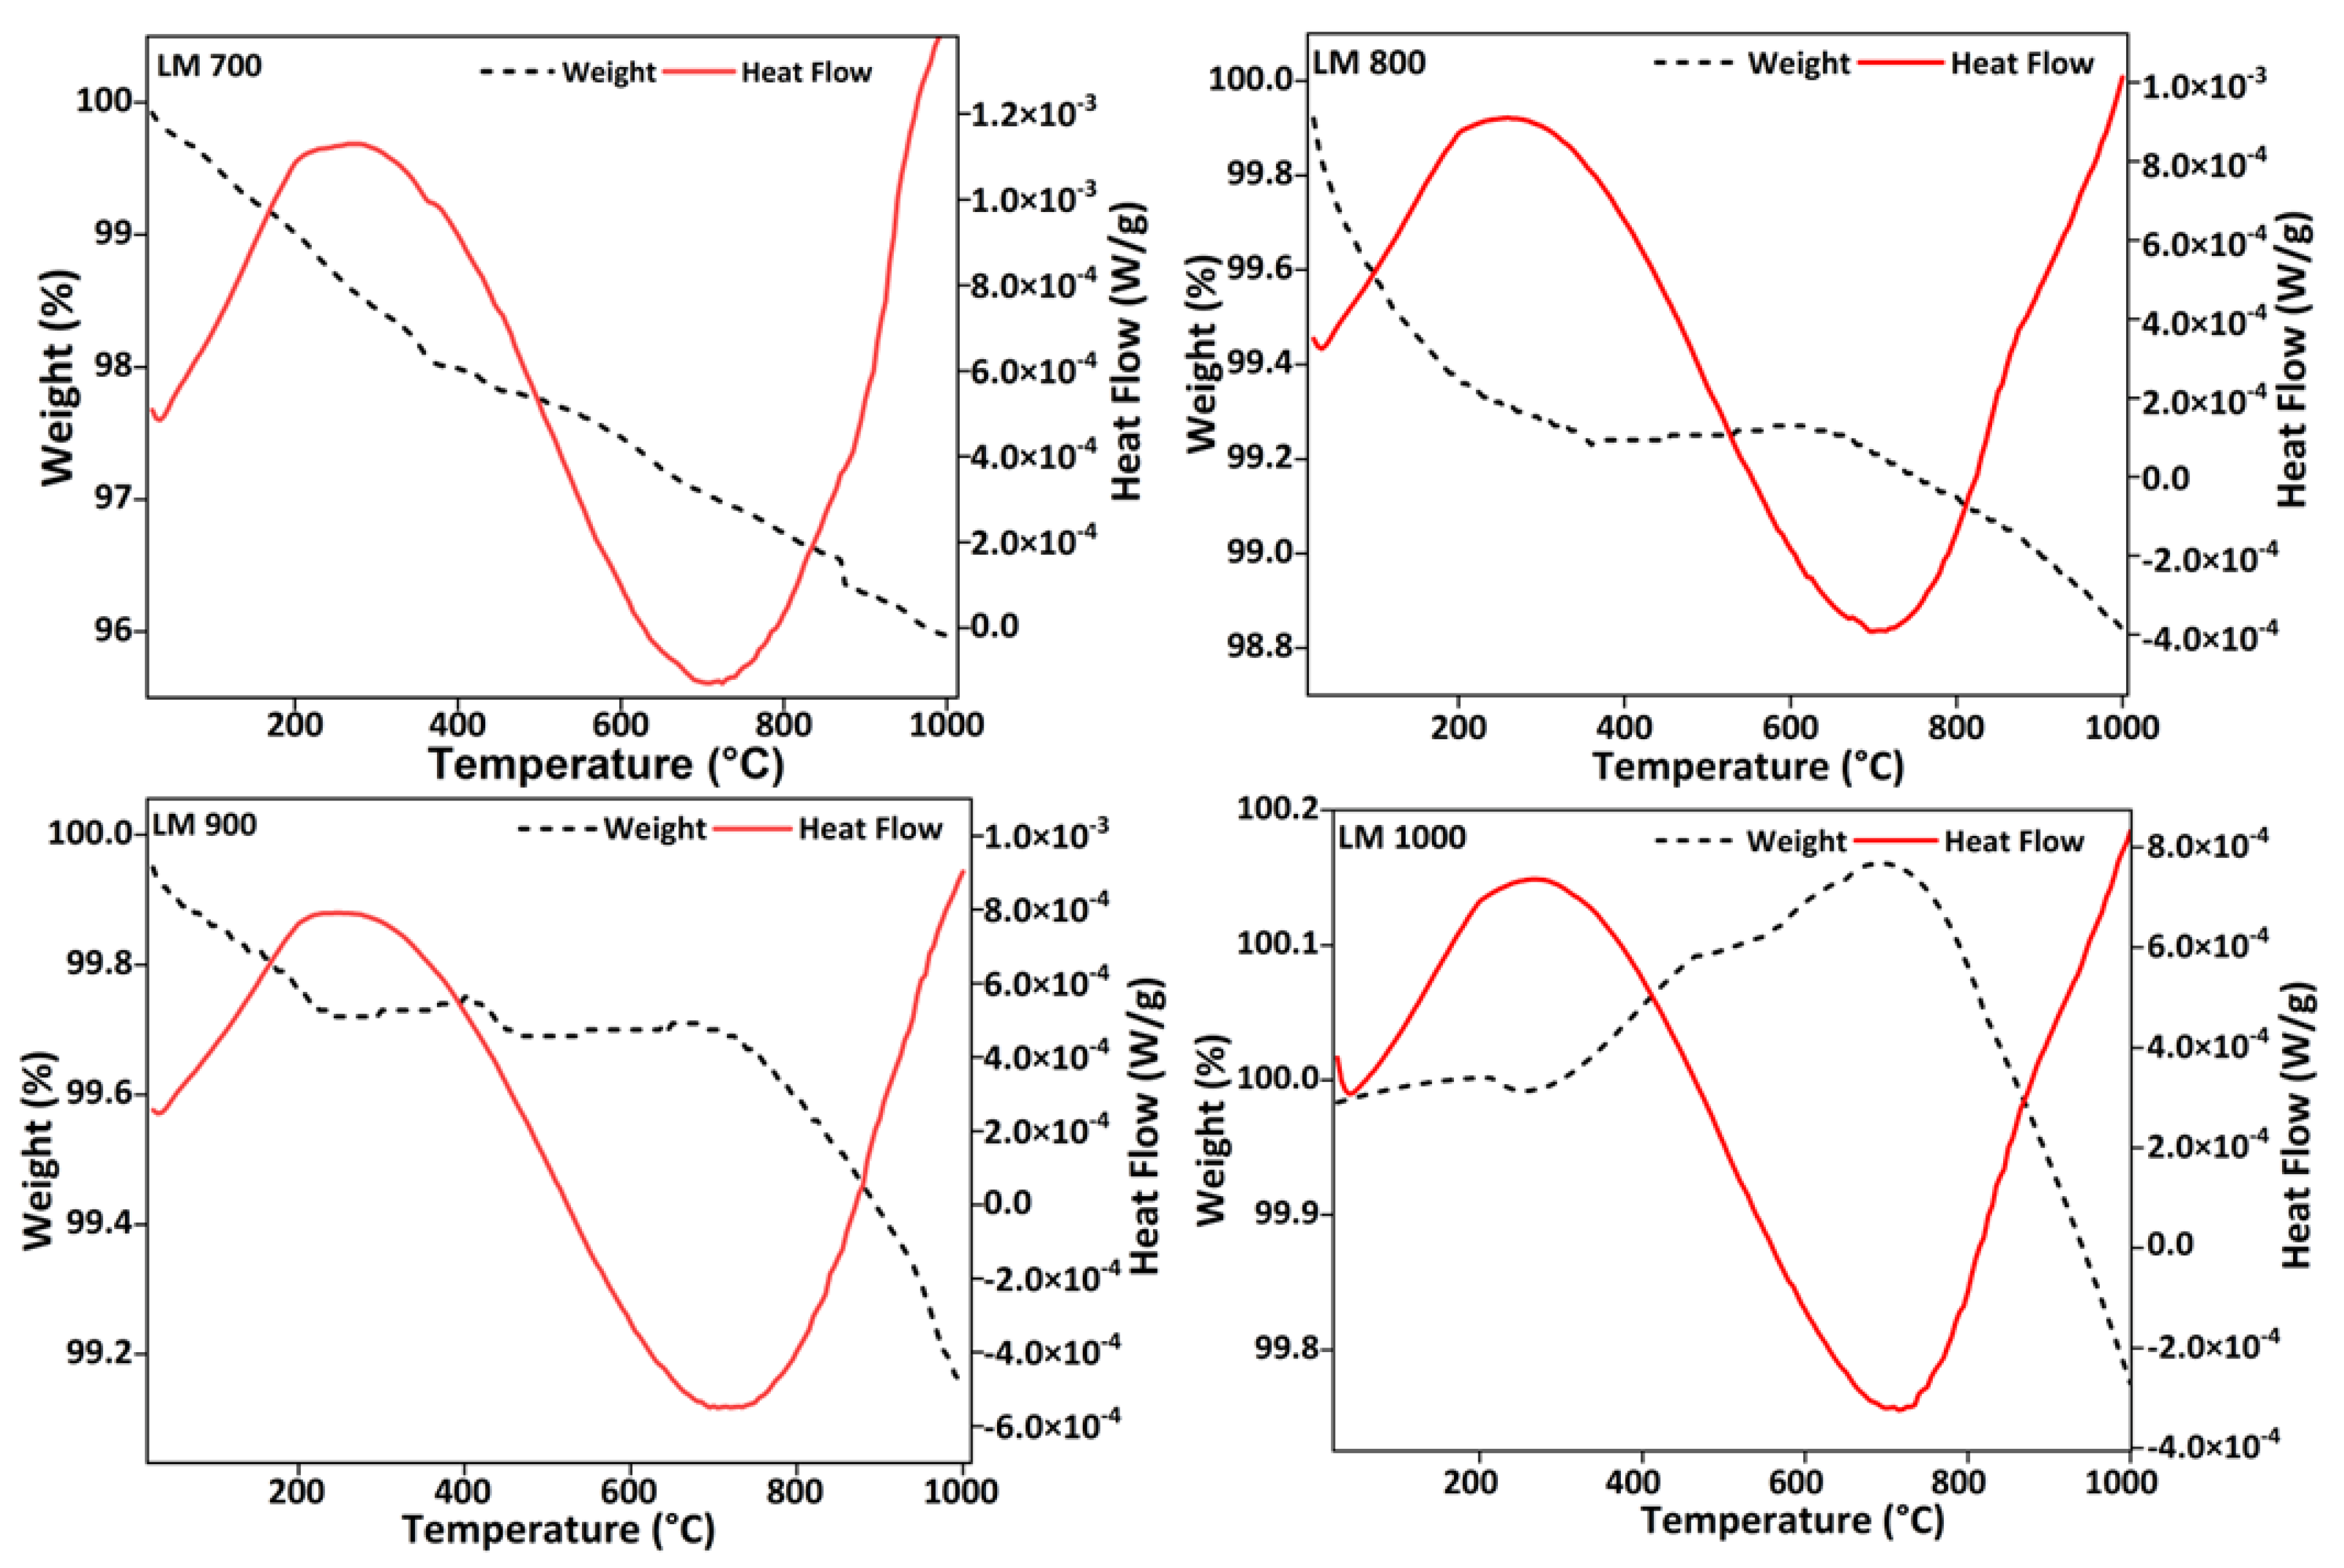
2.3.2. Thermogravimetric Analysis

Thermogravimetric analysis was carried out using a Perkin Elmer (Waltham, MA, USA) simultaneous thermal analysis STA 6000 instrument, using a ramp heating rate of 10 °C/min. The thermogravimetric analysis was performed over a temperature range from 25 to 1000 °C.

2.3.3. Infrared Spectroscopy

To compare the crystalline phases in the samples, Fourier transform infrared (FTIR) spectroscopy data were collected. Infrared spectra of the LaMnO3 materials were recorded using a Perkin Elmer (Waltham, MA, USA) spectrometer in universal attenuated total reflectance (ATR) mode.

2.3.4. Raman Spectroscopy

Raman spectroscopic data were obtained with a Renishaw (New Mills, UK) inVia Raman Spectrometer. The spectra were obtained using an excitation wavelength of 514 nm and the material was scanned between 100 and 3000 cm−1.

2.3.5. BET Surface Area

The BET surface areas of the samples were determined using a Micromeritics (Norcross, GA, USA) TriStar II instrument. The powder samples were dried and degassed by heating gently to 90 °C for 1 h, then at 200 °C under a flow of N2 for 3 h, using a Micromeritics (Norcross, GA, USA) FlowPep 060 instrument, prior to analysis.

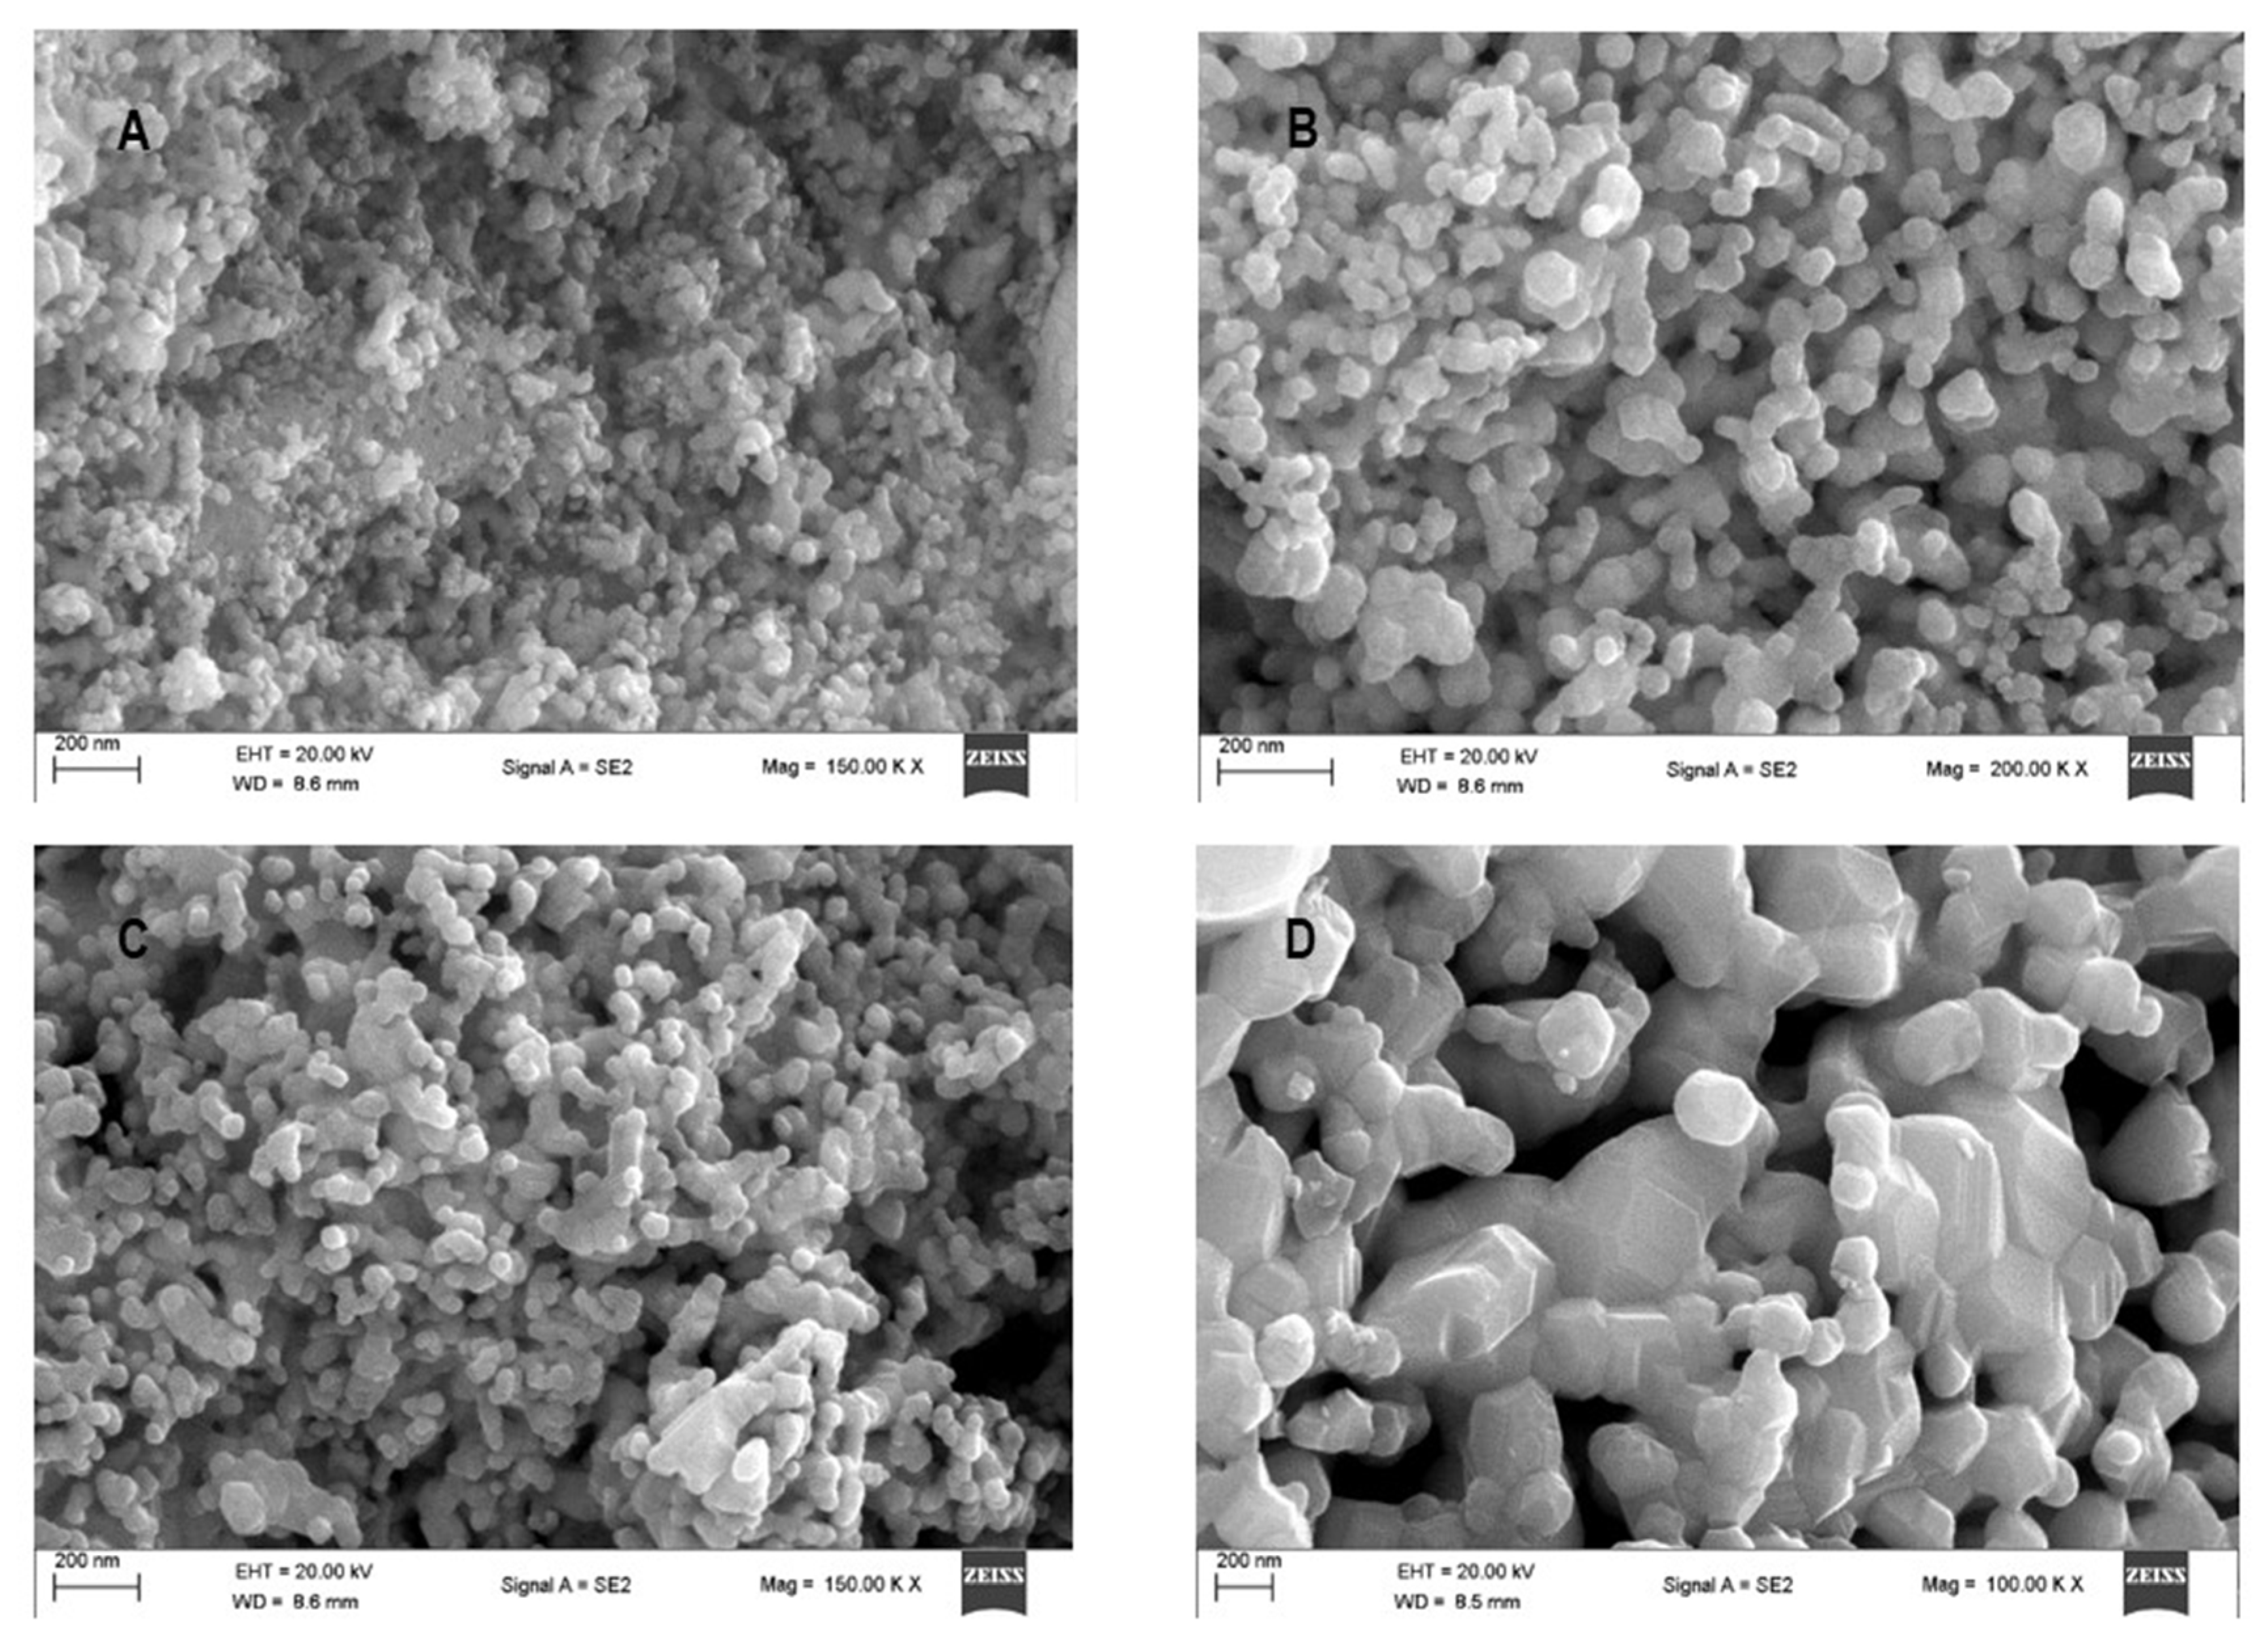
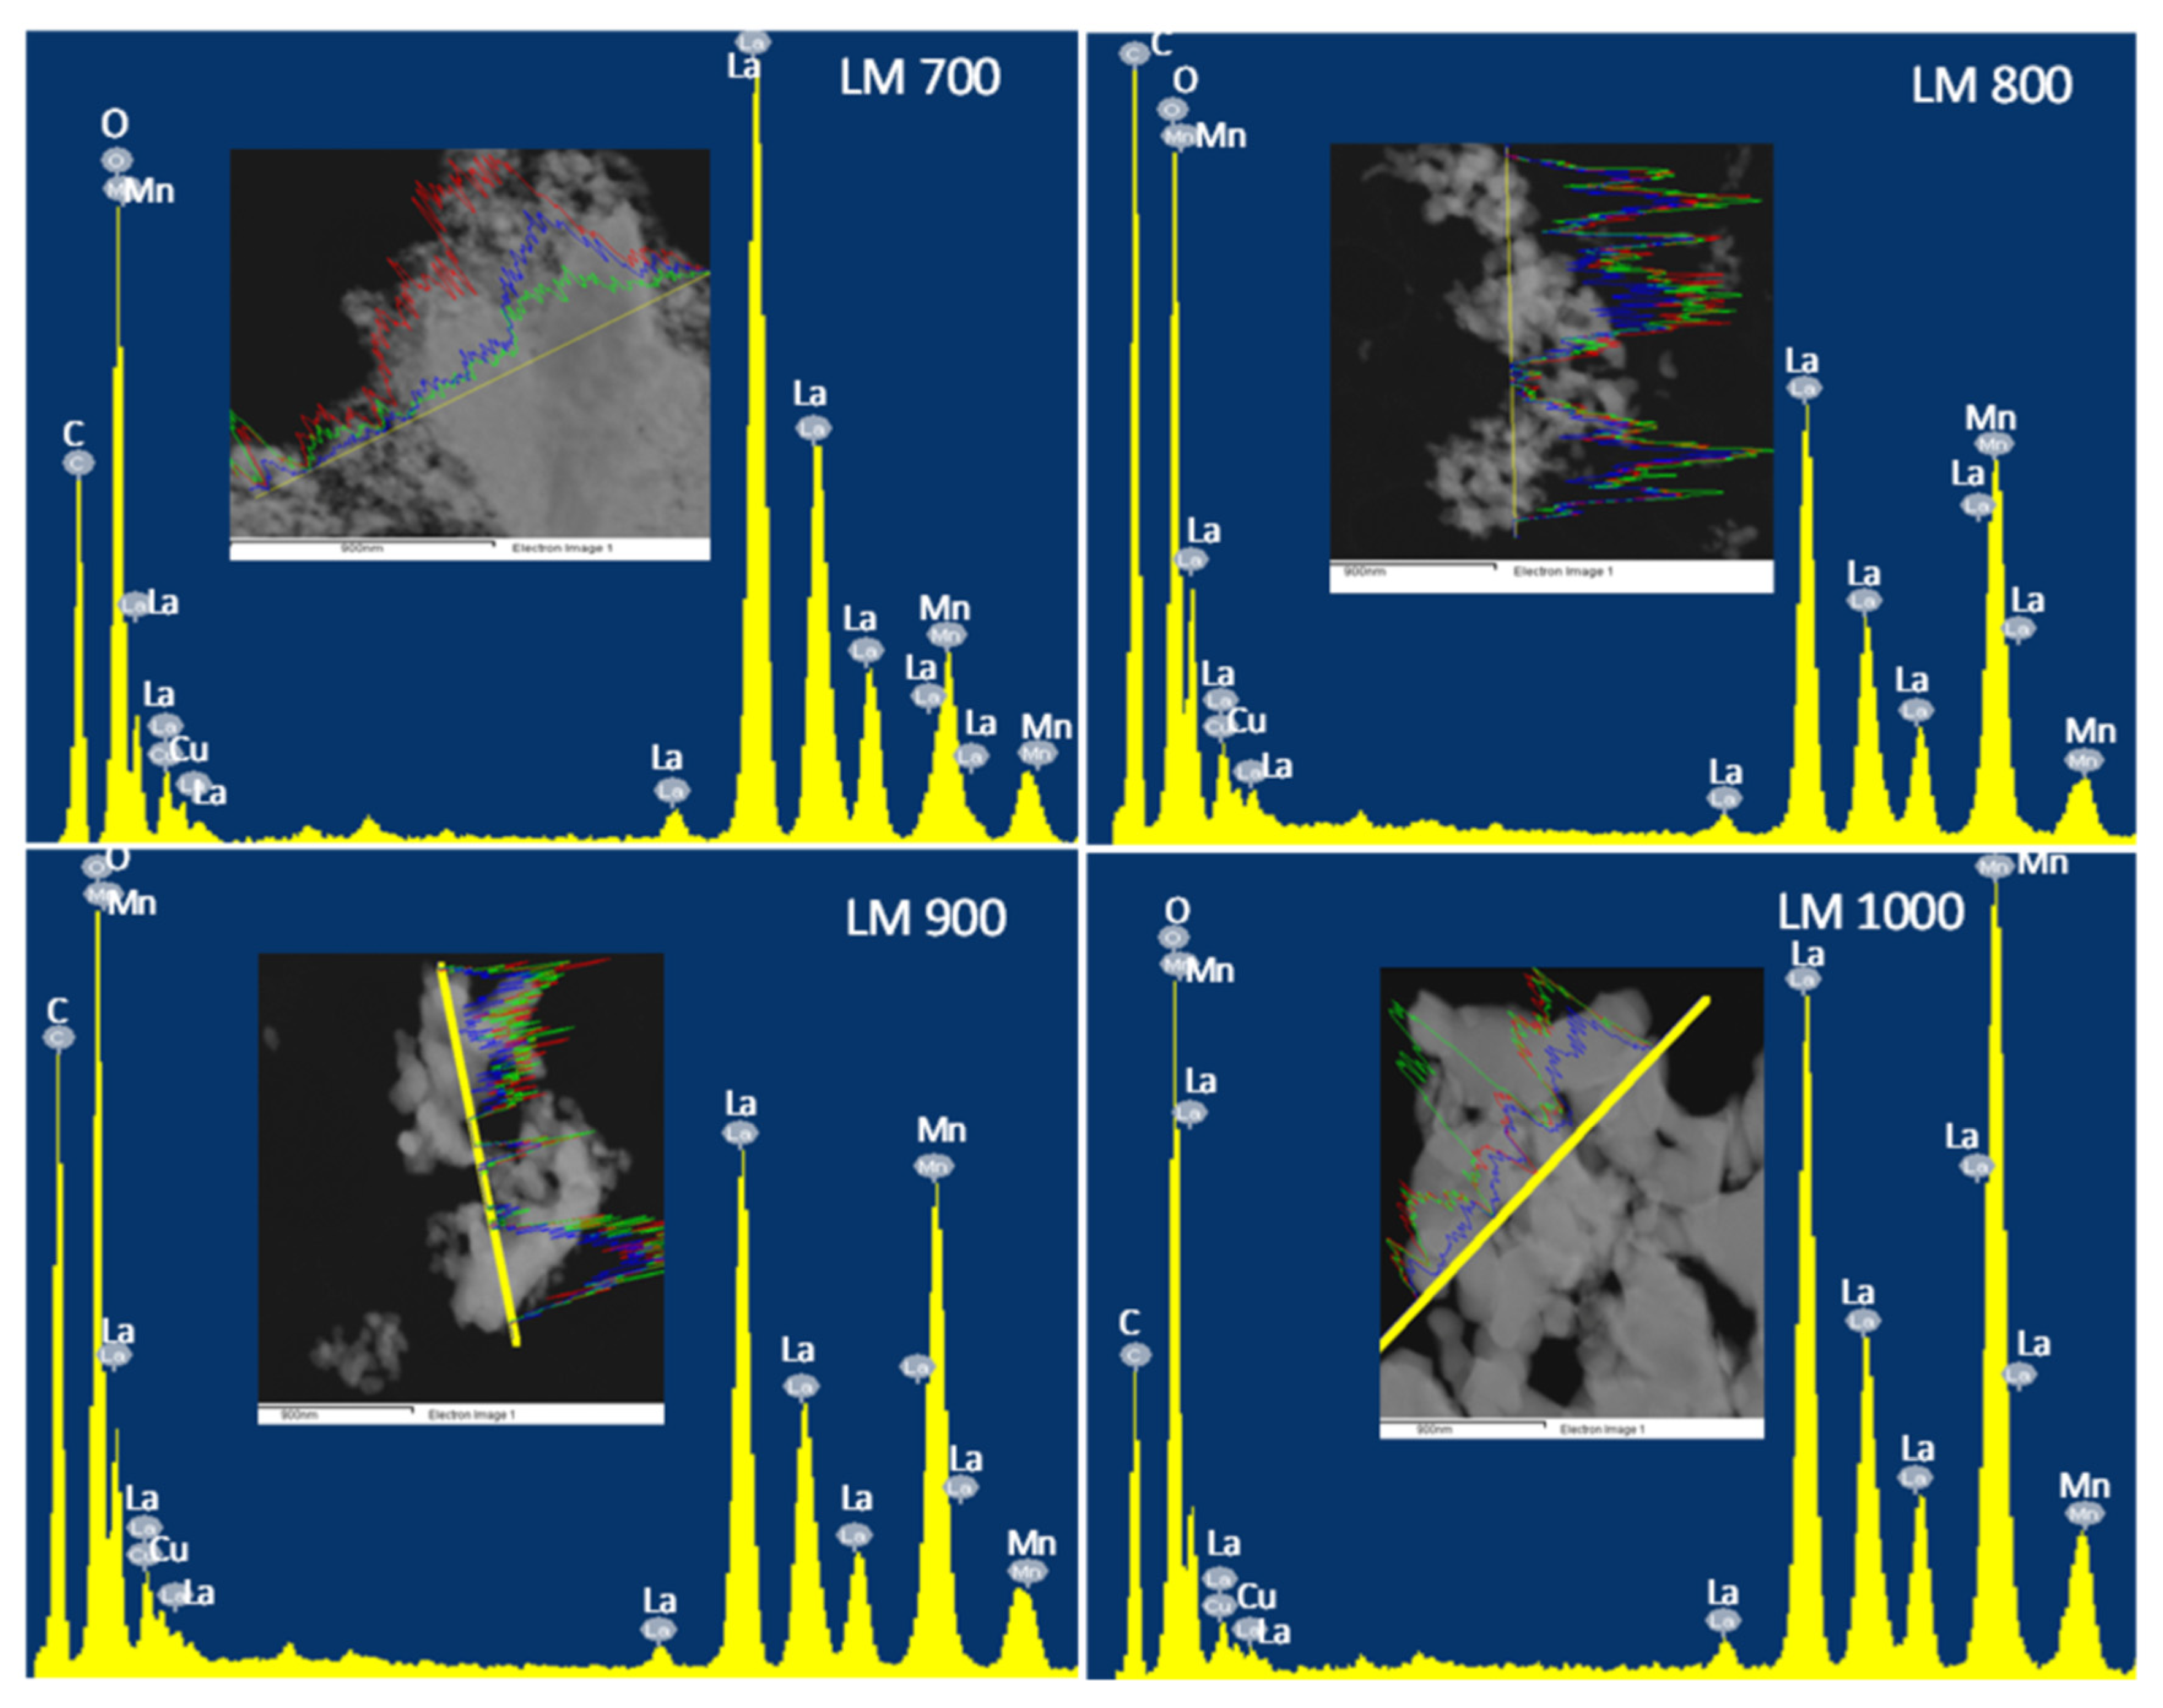
2.3.6. Electron Microscopy

For scanning electron microscopy (SEM), the samples were fixed onto a carbon tape and coated with gold to prevent charging during analysis. SEM and energy-dispersive X-ray spectroscopy (EDX) were conducted on a ZEISS (Oberkhochen, Germany) FEG–SEM Ultra Plus instrument.
Transmission electron microscopy (TEM) and high resolution (HR-TEM) images were obtained using a Jeol (Tokyo, Japan) JEM-1010 electron microscope. Images were analysed using ImageJ software. Approximately 0.2 mg of the sample was placed in ethanol and sonicated for 20 min. The mixture was placed on a copper grid and dried in air. MegaView III Software Imaging captured TEM and HR-TEM images. Furthermore, i-TEM or ImageJ software were used for image analysis including measuring the particle size.

2.3.7. Electrical Measurement

The main focus of this work is the structural transformation of lanthanum manganite perovskite oxides calcined from 700 to 1000 °C. During this work, it became apparent that measurements of the electrical resistivity at room temperature would assist in understanding the various contributions to the structural changes. At room temperature, the bulk resistivity was evaluated using a Keithley (Cleveland, OH, USA) interactive source meter (SMU) instrument (Model 2450) and a collinear four-point probe method (Jandel model) on freshly pelletized samples. The four-point probe spacing was 1 mm.

3. Results and Discussion

3.1. Thermal and Structural Analysis

The comparative thermogravimetric analytical curves for lanthanum manganites, synthesized using a template-free glycol–thermal method and calcined at different temperatures, are presented in Figure 1. Impurity determination in the LaMnO3 powder through TGA conducted at atmospheric pressure showed that some impurity elimination or decomposition took place in the calcined samples. The heat-flow curves show the presence of maxima and minima differential thermal analysis (DTA) exothermic peaks. The maxima were observed at approximately 300 °C and minima at about 700 °C. The total weight loss between 100 and 1000 °C was 3.56 wt.% for the LM 700 powder. The weight loss decreased significantly to 0.74, 0.71, and 0.21 wt.% for the LM 800, LM 900, and LM 1000 samples, respectively. The major weight loss occurred between 100 and 200 °C, corresponding to the loss of physically adsorbed water and ethylene glycol. The second weight loss between 200 and 600 °C corresponds to the loss of the chemically bound hydroxyl groups, whereas the loss of weight above 700 °C is the result of CO2 release from the decomposition of carbonate species. The hydroxyl and the carbonate content decreased with increasing calcination temperature. An increase in mass was observed in the LM 1000 sample. The weight gain from the initial weight to the final weight for temperatures up to 860 °C was 0.22 wt.%. This observation can be an effect of oxygen intake of the sample [37].
Powder XRD patterns for all the samples are shown in Figure 2. The patterns show peaks for lanthanum manganites, Pm-3m, and R 3 ¯ c structures [LaMnO3 (ICSD-01-075-0440, 01-082-1152)], captured with peaks located at 2θ values of 22.90°, 32. 61°, 40.22°, 46.82°, 58.18°, 68.39°, and 77.86°. The crystallinity of the compounds increased with calcination temperature and the XRD patterns are characteristic for La-based perovskites showing clear, sharp, and well-defined reflections. For LM 700, the unidentified impurity peaks at 21, 36, and 60° 2θ were below and above the perovskite reflection line (110), while the major perovskite lines remained unaffected. The cubic LaMnO3 symmetry, resulting from reducing conditions during synthesis, was visible in LM 700 and LM 800. At a thermal treatment of 800 °C, the low intensity impurity peaks present in the LM 700 sample diminished. Peak profile sharpening, due to crystallite size increase and decrease in lattice strain was observed as the calcination temperature increased [38]. The unit cell of the ideal cubic phase observed in LM 700, indicated by comparison of the axes, transformed to a doublet in LM 1000. The unit cell dimensions listed in Table 1 correlate with the data published in a recent experimental and theoretical paper [39]. Prior to the Rietveld refinement analysis of LM 1000, we observed that the initial cell volume of LM 900 decreased by 0.6 Å3, which can be attributed to a minor error that could arise from using unrefined values to calculate cell volume.
Huang et al. [40] emphasized that phase transition of the lanthanum-based perovskite from the orthorhombic phase to the rhombohedral phase can occur through thermal treatment. This was verified using a neutron powder diffraction experiment. Rhombohedral symmetry, observed in the higher 2θ values of the LM 900 and LM 1000 samples was associated with the increase in calcination temperature. The phase change, quantitatively refined as a function of the calcination temperature, carried out using Xpert High score (Figure 3, Table 1) confirmed a minimal increase in the unit cell volume. This account agrees with a report by Wei et al. [41], who observed an increase in unit cell volume directly proportional to the grain sizes. For the Rietveld refinement, to obtain 100% LaMnO3, parameters reported by Norby et al. [20] and Huang et al. [40], such as the atomic coordinates, isotropic temperature factors, B, and population factor (excluding Mn) were adopted. Refinement using the pseudo-Voigt function allowed for thirteen structural and ten profile parameters. Table 1 shows the refinement parameters and data obtained from the refinement. Plots of Y(obs), Y(cal), and Y(obs-cal) are shown in Figure 3.
Single phases from refinement were observed, suggesting that the samples were pure and Mn occupied sites in the perovskite structure. The refinement of the cubic phase indicated no distortion of the unit cell, while the rhombohedral structure showed a possible distortion of the MnO6 octahedron. From evidence in refinement of the LM 700 and LM 800 samples, the 180° Mn-O-Mn angle of the cubic structure deviated from cubic to an irregularly hexagonal structure, thereby lowering the symmetry. As Jahn–Teller distortion leads to lower MnO6 symmetry, the cubic structure easily transforms to a rhombohedral phase. The results obtained from the Williamson–Hall plot and Rietveld refinement (Table 2), which indicated changes in bond lengths, suggested the presence of defects in the perovskites with La vacancies and the presence of Mn3+ and Mn4+.
Raman spectra confirmed the crystallinity and pure phases of the LaMnO3 calcined at different temperatures (Figure 4A). In each individual spectrum, very intense peaks at 648, 653, 658, and 653 cm−1 are associated with the B2g mode and were markedly consistent. However, the line feature that depicts the Ag mode, which is linked to Jahn–Teller distortion, was absent. This is probably due to a quantified single phase present in the materials, shown clearly byXRD analysis.
Infrared spectroscopy was performed to investigate the impurity content and chemical bonding states between the lanthanum-oxygen and manganese-oxygen atoms in LaMnO3 samples that produced different structures at different calcination temperatures (Figure 4B). All absorption peaks observed confirmed the polycrystallinity of the LaMnO3 samples. Visible bands observed around 3500–3600 cm1 and 500–600 cm1 correspond to the bond stretching vibrations of hydroxyl group (VO-H) and the M–O bond (VM-O) stretching vibrational modes, respectively, which suggest the formation of a metal perovskite oxide framework [42,43].

3.2. Textural Properties

Table 3 shows a summary of the textural properties of the LaMnO3 materials, which includes the specific surface area, pore volume, and average pore size. The pore volume and average pore size were obtained from the desorption branch of the respective N2 isotherm using the Barrett–Joyner–Halenda (BJH) method. Surface area, pore volume, and average pore size decreased with an increase in calcination temperature. The surface areas of the LaMnO3 perovskite prepared using the glycol–thermal synthesis route were 33.1, 14.6, 6.6, and 2.2 m2/g for LM 700, LM 800, LM 900, and LM 1000, respectively. Using the sol–gel combustion route, Sui et al. [44] produced LaMnO3 perovskite with a surface area of 5.2 m2/g. The particle size of the powders was determined quantitatively using the expression DBET = 6000/ρ (g/cm3) × surface area (m2/g); the results are shown in Table 2. The calculated particle sizes are consistent with results published by Sui et al. [44].

3.3. Electron Microscopy

Scanning electron microscopy (SEM) images presented in Figure 5 show perovskite particles with shapes resembling cubes in the samples calcined at 700 and 800 ℃, whereas the dominant shapes in the LM 900 and LM 1000 samples are hexagonal. As shown in Figure 5B, increased particle size and agglomeration contributed to the observed closely packed cube-like LaMnO3 particles.
Energy dispersive X-ray analysis (EDX), Figure 6, shows the presence of all the expected elements in the LaMnO3 perovskite. Table 4 gives the respective atomic percentages of the elements in the perovskite samples. In general, EDX results are close to the nominal values, thus confirming the actual composition of the powder samples. The results from electron microscopy images and EDX suggest that the glycol–thermal technique and calcination temperatures influenced the morphology of the LaMnO3 samples. Additionally, the lattice d-spacing was in the range of 0.3–0.4 Å, which shows consistency with the experimental results published by Ortiz-Quiñonez et al. [45].
Figure 7 shows transmission electron microscopy (TEM) images of LaMnO3 samples calcined at 700 and 900 °C. The images of the other samples are in the supplementary information, Figure S2. The micrographs clearly show the cubic and hexagonal structures, smooth surfaces, uniform sizes, low aggregation, and well-distributed nanoparticles. From TEM analysis, particle size-induced phase transition from the cubic to the hexagonal phase could be observed at about 47 nm, with mean values of 18.7, 38.5, 44.7, and 89.6 nm obtained for the samples calcined at 700 °C, 800 °C, 900 °C, and 1000 °C, respectively. The mean particle size showed the growth of the LaMnO3 grains and thus the size-induced phase transition as the calcination temperature increased to 1000 °C. It is interesting that the value of the crystallite size calculated using the Rietveld refinement method was nearly similar to the mean diameter of the particle size calculated using TEM due to the regular shape of the nanoparticles with cubic and hexagonal morphologies, which were observed in the TEM micrograph.
Although most of the reported data for lanthanum manganite shows hexagonal and orthorhombic crystals [15,29,46,47], the TEM images in this study show cubic and rhombohedral crystals with an average lattice spacing of 0.398 nm, corresponding to the (011 and 110) d-spacings of LaMnO3.

3.4. Electrical Resistivity

The room-temperature resistivities of the LaMnO3 samples measured using the four-point probe technique on pelletized samples are shown in Table 5. The values show that the resistivity generally decreased associated with the increased calcination temperature. The change in resistivity was more drastic as the sample phase transformed from the cubic to the rhombohedral structure. The resistivity shows that the LaMnO3 perovskite phase transformation observed structurally can also be associated with significant changes in electronic properties.
Figure 8 shows the cell volume and resistivity of LaMnO3 calcined at different temperatures. The plot shows that as the calcination temperature and cell volume increased, the resistivity decreased.
As the calcination temperature tends to influence resistivity it also affects conductivity. The resistivity at room temperature indicates that ρ decreased from 18.47 MΩ cm at 39 nm to 20.91 K Ω cm for 90 nm due to increased particle size (Table 2). This trend can be attributed to the increasing content of Mn4+ ions which contribute to the holes that are produced in the perovskite compounds [48]. Additionally, increased oxygen and cation vacancies, and reduced porosity and grain boundaries can influence the low resistivity values recorded in the compounds [49].

3.5. Computational Analyses

DFT calculations can provide an interesting guidance to Rietveld refinement. Rietveld refinement experimental data in combination with CASTEP geometric optimization provides a powerful alternative to standard approaches in cases where the information content of the powder diffraction pattern alone is insufficient to distinguish between different structures. The structural properties of ideal cubic (Pm-3m) and rhombohedral (R 3 ¯ c) symmetry of LaMnO3 were studied. In CASTEP calculations, the structural properties of the perovskite structure were verified in relation to the experimental data, where phase transition was observed. After geometric optimization, the space group obtained correlated with one of the twelve possible groups analysed theoretically for double perovskite [26]. The initial and final total volumes of the lattice after structural optimization; bulk DFT lattice lengths a, b, c; total energy; and stress are shown in Table 6 and Table 7.
The band structure calculation was performed after the optimization. A high success level was observed in convergence after a certain number of optimizations using the Broyden–Fletcher–Goldfarb–Shanno (BFGS) algorithm, a second order optimization method. Figure 9 and Figure 10 show the cubic and rhombohedral symmetry band structure and density of states for the spins. The k-points in the desired k-paths followed within the zone boundary along the direction of X → Γ → M → Γ→ P and Γ → A → H → K → Γ→ M→ A→ H for cubic and rhombohedral LaMnO3 structures, respectively. For the spin states, the figures show a continuous behaviour of the DOS through the Fermi level which give a metallic characteristic.
The results from the DFT calculations using the GGA–PBEsol module show evidence of the structural stability that is consistent with other computed data of cubic and rhombohedral lanthanum manganite [50,51]. Additionally, from the decrease in the unit cell volume observed at a higher energy cut-off (eV) for the LaMnO3 R 3 ¯ c symmetry, we can attribute this change to an increase in crystallite size, as also observed in our experimental data [52,53].

4. Conclusions

Lanthanum manganite, LaMnO3, was synthesized using a glycol–thermal synthesis method without the use of a chelating agent. This involved the mixture of La and Mn nitrates which yielded perovskite powder with reduced particle sizes (DTEM = 19, 39, 45, and 90 nm) and high surface areas of 33.1, 14.6, 6.6, and 2.2 m2/g for LM 700, LM 800, LM 900, and LM 1000, respectively. Implementing DFT first-principles calculations, a successful analysis of the physical properties of ideal cubic and rhombohedral structure showed the optimized cell structure of LaMnO3 perovskite. When compared to the theoretical data, the experimental results showed that the unit cell lattice of the synthesized powder transitioned from the cubic phase to a rhombohedral perovskite structure at a higher thermal treatment with minimal unit cell volume shrinking. The lanthanum manganite powder in the cubic phase showed signs of transitioning to the rhombohedral symmetry in the calcination temperature range of 800–900 °C; then consisting of nanometre-sized particles with a highly crystalline structure. The resistivity of the lanthanum manganite perovskites decreased consistently as the calcination temperature increased. At a calcination temperature of 1000 °C, particles agglomerated and grain size tripled. CASTEP calculations confirmed that the initial unit cell volume for the cubic and rhombohedral symmetry differed slightly from the final unit cell volume. The observation of minimal unit cell volume shrinking is consistent in both the experimental and theoretical data.

Supplementary Materials

The following supporting information can be downloaded at: https://www.mdpi.com/article/10.3390/ma16031274/s1, Figure S1: Schematic of the 3D structure of cubic and rhombohedral LaMnO3 used for DFT calculations; Figure S2: TEM images and particle size histograms of LaMnO3 calcined at 800 °C (A) and 1000 °C (B); Table S1: Comparing the cubic and rhombohedral symmetry structural parameters of Rietveld refinement with theoretical calculation.

Author Contributions

Conceptualization, V.O.A., H.B.F., A.S.M., S.S. and T.M; methodology, V.O.A., H.B.F., A.S.M., S.S. and T.M; formal analysis, V.O.A.; investigation., V.O.A.; Resources, V.O.A., T.M., H.B.F.; Writing—original draft, V.O.A.; Writing—review & editing, V.O.A., H.B.F., A.S.M., S.S. and T.M.; Supervision, H.B.F., A.S.M., S.S. and T.M. All authors have read and agreed to the published version of the manuscript.

Funding

This research received no external funding.

Institutional Review Board Statement

Not applicable.

Informed Consent Statement

Not applicable.

Data Availability Statement

Data is contained within the article and the Supplementary Materials.

Acknowledgments

The authors would like to thank the NRF and UKZN.

Conflicts of Interest

The authors declare no conflict of interest.

References

  1. Royer, S.; Duprez, D.; Can, F.; Courtois, X.; Batiot-Dupeyrat, C.; Laassiri, S.; Alamdari, H. Perovskites as Substitutes of Noble Metals for Heterogeneous Catalysis: Dream or Reality. Chem. Rev. 2014, 114, 10292–10368. [Google Scholar] [CrossRef] [PubMed]
  2. Parravano, G. Catalytic Activity of Lanthanum and Strontium Manganite. J. Am. Chem. Soc. 1953, 75, 1497–1498. [Google Scholar] [CrossRef]
  3. Ciambelli, P.; Cimino, S.; De Rossi, S.; Lisi, L.; Minelli, G.; Porta, P.; Russo, G. AFeO3 (A = La, Nd, Sm) and LaFe1−xMgxO3 perovskites as methane combustion and CO oxidation catalysts: Structural, redox and catalytic properties. Appl. Catal. B Environ. 2001, 29, 239–250. [Google Scholar] [CrossRef]
  4. Arandiyan, H.; Mofarah, S.S.; Sorrell, C.C.; Doustkhah, E.; Sajjadi, B.; Hao, D.; Wang, Y.; Sun, H.; Ni, B.J.; Rezaei, M.; et al. Defect engineering of oxide perovskites for catalysis and energy storage: Synthesis of chemistry and materials science. Chem. Soc. Rev. 2021, 50, 10116–10211. [Google Scholar] [CrossRef] [PubMed]
  5. Alonso, J.A.; Martínez-Lope, M.J.; Casais, M.T.; Fernández-Díaz, M.T. Evolution of the Jahn−Teller Distortion of MnO6 Octahedra in RMnO3 Perovskites (R = Pr, Nd, Dy, Tb, Ho, Er, Y): A Neutron Diffraction Study. Inorg. Chem. 2000, 39, 917–923. [Google Scholar] [CrossRef]
  6. Wang, X.; Huang, K.; Yuan, L.; Xi, S.; Yan, W.; Geng, Z.; Cong, Y.; Sun, Y.; Tan, H.; Wu, X.; et al. Activation of Surface Oxygen Sites in a Cobalt-Based Perovskite Model Catalyst for CO Oxidation. J. Phys. Chem. Lett. 2018, 9, 4146–4154. [Google Scholar] [CrossRef] [PubMed]
  7. Najjar, H.; Batis, H. Development of Mn-based perovskite materials: Chemical structure and applications. Catal. Rev. 2016, 58, 371–438. [Google Scholar] [CrossRef]
  8. Tofield, B.C.; Scott, W.R. Oxidative nonstoichiometry in perovskites, an experimental survey; the defect structure of an oxidized lanthanum manganite by powder neutron diffraction. J. Solid State Chem. 1974, 10, 183–194. [Google Scholar] [CrossRef]
  9. Angel, S.; Tapia, J.D.; Gallego, J.; Hagemann, U.; Wiggers, H. Spray-Flame Synthesis of LaMnO3+δ Nanoparticles for Selective CO Oxidation (SELOX). Energy Fuels 2021, 35, 4367–4376. [Google Scholar] [CrossRef]
  10. Valderrama, G.; Kiennemann, A.; de Navarro, C.U.; Goldwasser, M.R. LaNi1−xMnxO3 perovskite-type oxides as catalysts precursors for dry reforming of methane. Appl. Catal. A Gen. 2018, 565, 26–33. [Google Scholar] [CrossRef]
  11. Yamazoe, N.; Teraoka, Y. Oxidation catalysis of perovskites---relationships to bulk structure and composition (valency, defect, etc.). Catal. Today 1990, 8, 175–199. [Google Scholar] [CrossRef]
  12. Kulandaivelu, P.; Sakthipandi, K.; Senthil Kumar, P.; Rajendran, V. Mechanical properties of bulk and nanostructured La0.61Sr0.39MnO3 perovskite manganite materials. J. Phys. Chem. Solids 2013, 74, 205–214. [Google Scholar] [CrossRef]
  13. Zhong, W.; Chen, W.; Ding, W.P.; Zhang, N.; Hu, A.; Du, Y.W.; Yan, Q.J. Synthesis, structure and magnetic entropy change of polycrystalline La1−xKxMnO3+δ. J. Magn. Magn. Mater. 1999, 195, 112–118. [Google Scholar] [CrossRef]
  14. Iliev, M.N.; Abrashev, M.V.; Lee, H.G.; Popov, V.N.; Sun, Y.Y.; Thomsen, C.; Meng, R.L.; Chu, C.W. Raman spectroscopy of orthorhombic perovskite-like YMnO3 and LaMnO3. Phys. Rev. B 1998, 57, 2872–2877. [Google Scholar] [CrossRef]
  15. Rodríguez-Carvajal, J.; Hennion, M.; Moussa, F.; Moudden, A.H.; Pinsard, L.; Revcolevschi, A. Neutron-diffraction study of the Jahn-Teller transition in stoichiometric LaMnO3. Phys. Rev. B 1998, 57, R3189–R3192. [Google Scholar] [CrossRef]
  16. Taboada-Moreno, C.A.; Sánchez-De Jesús, F.; Pedro-García, F.; Cortés-Escobedo, C.A.; Betancourt-Cantera, J.A.; Ramírez-Cardona, M.; Bolarín-Miró, A.M. Large magnetocaloric effect near to room temperature in Sr doped La0.7Ca0.3MnO3. J. Magn. Magn. Mater. 2020, 496, 165887. [Google Scholar] [CrossRef]
  17. Megaw, H.D.; Darlington, C.N.W. Geometrical and structural relations in the rhombohedral perovskites. Acta Crystallogr. Sect. A 1975, 31, 161–173. [Google Scholar] [CrossRef]
  18. Wang, G.; Xu, T.; Wen, S.; Pan, M. Structure-dependent electrocatalytic activity of La1−xSrxMnO3 for oxygen reduction reaction. Sci. China Chem. 2015, 58, 871–878. [Google Scholar] [CrossRef]
  19. Ashok, A.; Kumar, A.; Ponraj, J.; Mansour, S.A.; Tarlochan, F. Enhancing the electrocatalytic properties of LaMnO3 by tuning surface oxygen deficiency through salt assisted combustion synthesis. Catal. Today 2021, 375, 484–493. [Google Scholar] [CrossRef]
  20. Norby, P.; Andersen, I.G.K.; Andersen, E.K.; Andersen, N.H. The crystal structure of lanthanum manganate (III), LaMnO3, at room temperature and at 1273 K under N2. J. Solid State Chem. 1995, 119, 191–196. [Google Scholar] [CrossRef]
  21. Qiu, X.; Proffen, T.; Mitchell, J.F.; Billinge, S.J.L. Orbital Correlations in the Pseudocubic O and Rhombohedral R Phases of LaMnO3. Phys. Rev. Lett. 2005, 94, 177203. [Google Scholar] [CrossRef] [PubMed]
  22. Megarajan, S.K.; Rayalu, S.; Nishibori, M.; Teraoka, Y.; Labhsetwar, N. Effects of Surface and Bulk Silver on PrMnO3+δ Perovskite for CO and Soot Oxidation: Experimental Evidence for the Chemical State of Silver. ACS Catal. 2015, 5, 301–309. [Google Scholar] [CrossRef]
  23. Sardar, K.; Lees, M.R.; Kashtiban, R.J.; Sloan, J.; Walton, R.I. Direct Hydrothermal Synthesis and Physical Properties of Rare-Earth and Yttrium Orthochromite Perovskites. Chem. Mater. 2011, 23, 48–56. [Google Scholar] [CrossRef]
  24. Yuan, X.; Meng, L.; Zheng, C.; Zhao, H. Deep Insight into the Mechanism of Catalytic Combustion of CO and CH4 over SrTi1−xBxO3 (B = Co, Fe, Mn, Ni, and Cu) Perovskite via Flame Spray Pyrolysis. ACS Appl. Mater. Interfaces 2021, 13, 52571–52587. [Google Scholar] [CrossRef] [PubMed]
  25. Kaliaguine, S.; Van Neste, A.; Szabo, V.; Gallot, J.E.; Bassir, M.; Muzychuk, R. Perovskite-type oxides synthesized by reactive grinding: Part I. Preparation and characterization. Appl. Catal. A Gen. 2001, 209, 345–358. [Google Scholar] [CrossRef]
  26. Acharya, S.; Mondal, J.; Ghosh, S.; Roy, S.K.; Chakrabarti, P.K. Multiferroic behavior of lanthanum orthoferrite (LaFeO3). Mater. Lett. 2010, 64, 415–418. [Google Scholar] [CrossRef]
  27. Li, F.; Yu, X.; Chen, L.; Pan, H.; Xin, X. Solid-State Synthesis of LaCoO3 Perovskite Nanocrystals. J. Am. Ceram. Soc. 2002, 85, 2177–2180. [Google Scholar] [CrossRef]
  28. Ansari, A.A.; Ahmad, N.; Alam, M.; Adil, S.F.; Ramay, S.M.; Albadri, A.; Ahmad, A.; Al-Enizi, A.M.; Alrayes, B.F.; Assal, M.E.; et al. Physico-chemical properties and catalytic activity of the sol-gel prepared Ce-ion doped LaMnO3 perovskites. Sci. Rep. 2019, 9, 7747. [Google Scholar] [CrossRef]
  29. Li, Y.; Xue, L.; Fan, L.; Yan, Y. The effect of citric acid to metal nitrates molar ratio on sol–gel combustion synthesis of nanocrystalline LaMnO3 powders. J. Alloys Compd. 2009, 478, 493–497. [Google Scholar] [CrossRef]
  30. Töpfer, J.; Goodenough, J.B. LaMnO3+δ Revisited. J. Solid State Chem. 1997, 130, 117–128. [Google Scholar] [CrossRef]
  31. Nilsen, O.; Rauwel, E.; Fjellvåg, H.; Kjekshus, A. Growth of La1−xCaxMnO3 thin films by atomic layer deposition. J. Mater. Chem. 2007, 17, 1466–1475. [Google Scholar] [CrossRef]
  32. Berger, D.; Matei, C.; Papa, F.; Macovei, D.; Fruth, V.; Deloume, J.P. Pure and doped lanthanum manganites obtained by combustion method. J. Eur. Ceram. Soc. 2007, 27, 4395–4398. [Google Scholar] [CrossRef]
  33. Abdallah, H.M.I.; Moyo, T. Superparamagnetic behavior of MnxNi1−xFe2O4 spinel nanoferrites. J. Magn. Magn. Mater. 2014, 361, 170–174. [Google Scholar] [CrossRef]
  34. Masina, P.; Moyo, T.; Abdallah, H.M.I. Synthesis, structural and magnetic properties of ZnxMg1−xFe2O4 nanoferrites. J. Magn. Magn. Mater. 2015, 381, 41–49. [Google Scholar] [CrossRef]
  35. Tomaszewski, P.E.; Miniajluk, N.; Zawadzki, M.; Trawczyński, J. X-ray study of structural phase transitions in nanocrystalline LaMnO3+δ perovskite. Phase Transit. 2019, 92, 525–536. [Google Scholar] [CrossRef]
  36. Dlamini, W.B.; Msomi, J.Z.; Moyo, T. XRD, Mössbauer and magnetic properties of MgxCo1−xFe2O4 nanoferrites. J. Magn. Magn. Mater. 2015, 373, 78–82. [Google Scholar] [CrossRef]
  37. Zhang, L.; Zhou, Q.; He, Q.; He, T. Double-perovskites A2FeMoO6−δ (A = Ca, Sr, Ba) as anodes for solid oxide fuel cells. J. Power Sources 2010, 195, 6356–6366. [Google Scholar] [CrossRef]
  38. Mefford, J.T.; Hardin, W.G.; Dai, S.; Johnston, K.P.; Stevenson, K.J. Anion charge storage through oxygen intercalation in LaMnO3 perovskite pseudocapacitor electrodes. Nat. Mater. 2014, 13, 726–732. [Google Scholar] [CrossRef]
  39. Hammami, R.; Harrouch Batis, N.; Batis, H.; Minot, C. Cation-deficient lanthanum manganite oxides: Experimental and theoretical studies. Solid State Sci. 2009, 11, 885–893. [Google Scholar] [CrossRef]
  40. Huang, Q.; Santoro, A.; Lynn, J.W.; Erwin, R.W.; Borchers, J.A.; Peng, J.L.; Greene, R.L. Structure and magnetic order in undoped lanthanum manganite. Phys. Rev. B 1997, 55, 14987–14999. [Google Scholar] [CrossRef]
  41. Wei, Z.; Xia, T.; Ma, J.; Feng, W.; Dai, J.; Wang, Q.; Yan, P. Investigation of the lattice expansion for Ni nanoparticles. Mater. Charact. 2007, 58, 1019–1024. [Google Scholar] [CrossRef]
  42. Ponce, S.; Peña, M.A.; Fierro, J.L.G. Surface properties and catalytic performance in methane combustion of Sr-substituted lanthanum manganites. Appl. Catal. B Environ. 2000, 24, 193–205. [Google Scholar] [CrossRef]
  43. Nagabhushana, B.M.; Chakradhar, R.P.S.; Ramesh, K.P.; Shivakumara, C.; Chandrappa, G.T. Combustion synthesis, characterization and metal–insulator transition studies of nanocrystalline La1−xCaxMnO3 (0.0 ≤ x ≤ 0.5). Mater. Chem. Phys. 2007, 102, 47–52. [Google Scholar] [CrossRef]
  44. Sui, Z.-J.; Vradman, L.; Reizner, I.; Landau, M.V.; Herskowitz, M. Effect of preparation method and particle size on LaMnO3 performance in butane oxidation. Catal. Commun. 2011, 12, 1437–1441. [Google Scholar] [CrossRef]
  45. Ortiz-Quiñonez, J.-L.; García-González, L.; Cancino-Gordillo, F.E.; Pal, U. Particle dispersion and lattice distortion induced magnetic behavior of La1−xSrxMnO3 perovskite nanoparticles grown by salt-assisted solid-state synthesis. Mater. Chem. Phys. 2020, 246, 122834. [Google Scholar] [CrossRef]
  46. Symianakis, E.; Malko, D.; Ahmad, E.; Mamede, A.-S.; Paul, J.-F.; Harrison, N.; Kucernak, A. Electrochemical Characterization and Quantified Surface Termination Obtained by Low Energy Ion Scattering and X-ray Photoelectron Spectroscopy of Orthorhombic and Rhombohedral LaMnO3 Powders. J. Phys. Chem. C 2015, 119, 12209–12217. [Google Scholar] [CrossRef]
  47. Tran, T.H.; Bach, T.C.; Pham, N.H.; Nguyen, Q.H.; Sai, C.D.; Nguyen, H.N.; Nguyen, V.T.; Nguyen, T.T.; Ho, K.H.; Doan, Q.K. Phase transition of LaMnO3 nanoparticles prepared by microwave assisted combustion method. Mater. Sci. Semicond. Process. 2019, 89, 121–125. [Google Scholar] [CrossRef]
  48. Mahmood, A.; Warsi, M.F.; Ashiq, M.N.; Sher, M. Improvements in electrical and dielectric properties of substituted multiferroic LaMnO3 based nanostructures synthesized by co-precipitation method. Mater. Res. Bull. 2012, 47, 4197–4202. [Google Scholar] [CrossRef]
  49. Coşkun, M.; Polat, Ö.; Coşkun, F.M.; Durmuş, Z.; Çağlar, M.; Turut, A. Effect of Os doping on electrical properties of YMnO3 multiferroic perovskite-oxide compounds. Mater. Sci. Semicond. Process. 2019, 91, 281–289. [Google Scholar] [CrossRef]
  50. Koriba, I.; Lagoun, B.; Guibadj, A.; Belhadj, S.; Ameur, A.; Cheriet, A. Structural, electronic, magnetic and mechanical properties of three LaMnO3 phases: Theoretical investigations. Comput. Condens. Matter 2021, 29, e00592. [Google Scholar] [CrossRef]
  51. Moreno, L.C.; Valencia, J.S.; Landínez Téllez, D.A.; Arbey Rodríguez, M.J.; Martínez, M.L.; Roa-Rojas, J.; Fajardo, F. Preparation and structural study of LaMnO3 magnetic material. J. Magn. Magn. Mater. 2008, 320, e19–e21. [Google Scholar] [CrossRef]
  52. Iniama, G.; de la Presa, P.; Alonso, J.M.; Multigner, M.; Ita, B.I.; Cortés-Gil, R.; Ruiz-González, M.L.; Hernando, A.; Gonzalez-Calbet, J.M. Unexpected ferromagnetic ordering enhancement with crystallite size growth observed in La0.5Ca0.5MnO3 nanoparticles. J. Appl. Phys. 2014, 116, 113901. [Google Scholar] [CrossRef]
  53. Sarkar, T.; Ghosh, B.; Raychaudhuri, A.K.; Chatterji, T. Crystal structure and physical properties of half-doped manganite nanocrystals of less than 100-nm size. Phys. Rev. B 2008, 77, 235112. [Google Scholar] [CrossRef] [Green Version]
Figure 1. Thermogravimetric profiles of LM 700, LM 800, LM 900, and LM 1000.
Materials 16 01274 g001
Figure 2. X-ray diffraction patterns of LM 700, LM 800, LM 900, and LM 1000.
Materials 16 01274 g002
Figure 3. The Rietveld refinement plots for LM 700, LM 800, LM 900, and LM 1000.
Materials 16 01274 g003
Figure 4. (A) Raman and (B) infrared spectra of the samples.
Materials 16 01274 g004
Figure 5. SEM micrographs of LM 700 (A), LM 800 (B), LM 900 (C), and LM 1000 (D).
Materials 16 01274 g005
Figure 6. EDX plots of LaMnO3 ( La, Mn, and O).
Materials 16 01274 g006
Figure 7. TEM images and particle size histograms of LaMnO3 calcined at (A) 700 °C and (B) 900 °C.
Materials 16 01274 g007
Figure 8. A plot of the cell volume and resistivity of LaMnO3 calcined at different temperatures.
Materials 16 01274 g008
Figure 9. CASTEP GGA–PBE band structure and DOS of cubic perovskite LaMnO3.
Materials 16 01274 g009
Figure 10. CASTEP GGA–PBE band structure and DOS of rhombohedral perovskite LaMnO3.
Materials 16 01274 g010
Table 1. Experimental cell volumes and parameters obtained from Rietveld refinement indicating cubic and rhombohedral phases.
SamplesRefinement
Cell Volume (Å3)Lattice Parameters (Å)
InitialFinalAbc
LM 70058.4158.463.8813.8813.881
LM 80058.4158.533.8833.8833.883
LM 900353.8352.25.5195.51913.353
LM 1000353.2353.05.5245.52413.358
Table 2. Grain and particle size of LaMnO3 samples.
SampleCrystallite Size (nm) W–H PlotRietveld RefinementDBET (nm)DTEM (nm)
Size (nm)Strain (%)Size (nm)Strain (%)
LM 7008.1 12.8 0.10 18.90.525 2819
LM 80010.523 0.10 27.4 0.476 6139
LM 90012.026 0.10 28.4 0.234 14145
LM 100015.2 48 0.02 62.3 0.034 45990
Table 3. N2 adsorption studies.
SamplesSurface Area (m2/g)Pore Volume (cm³/g)Pore Size (Å)
LM 70033.060.2141115.4
LM 80014.600.0441143.7
LM 9006.6350.0077146.4
LM 10002.1950.0058164.0
Table 4. Summary of the elemental compositions detected using EDX.
SampleOMnLa
wt.% at.% wt.% at.% wt.% at.%
LM 70018.1 55.825.2 19.150.8 20.5
LM 80017.9 56.312.911.561.522.6
LM 90018.4 57.317.3 15.355.420.2
LM 100014.9 51.020.0 20.259.5 23.7
Table 5. Sheet resistances and resistivities of samples calcined at different temperatures. (The pellets thicknesses were 0.518 mm, 0.531 mm, 0.516 mm, and 0.538 mm for LM 700, LM 800, LM 900, and LM 1000, respectively. The spacing between probes was 1.00 mm).
SamplesSheet Resistanceρ
(kΩ cm)
LM 70018.64 MΩ437.7
LM 80018.47 MΩ435.3
LM 90020.91 kΩ4.890
LM 10003.665 kΩ0.894
Table 6. Data of theoretical calculations using the CASTEP module with the Pm-3m space group.
Cut-Off (eV)Total Energy (eV)Cell Volume
Å3
Final Energy (eV)BFGS Final Enthalpy
(×103 eV)
BFGS Bulk Modulus (GPa)Lattice Parameters
(Å)
Final Pressure
OMnLa abc
450−428.03−639.99−855.83Initial: 58.41
Final: 61.69
−2821.51−2.8215500Initial: 3.88
Final: 3.95
Initial: 3.88
Final: 3.95
Initial: 3.88
Final: 3.95
0.0892
650−428.09−640.01−855.85Initial: 58.41
Final: 61.72
−2821.69−2.8217500Initial: 3.88
Final: 3.95
Initial: 3.88
Final: 3.95
Initial: 3.88
Final: 3.95
0.0730
800−428.10−640.02−855.85Initial: 58.41
Final: 61.84
−2821.73−2.8217500Initial: 3.95
Final: 3.95
Initial: 3.95
Final: 3.95
Initial: 3.95
Final: 3.95
0.0852
Table 7. Data of theoretical calculations using the CASTEP module with the R 3 ¯ c space group.
Cut-Off (eV)Total Energy (eV)Cell Vol (Å3)Final Energy (eV)BFGS Final Enthalpy
(×104 eV)
BFGS Bulk Modulus (GPa)Lattice Parameters (Å)Final Pressure
OMnLa abc
450−430.67−612.74−967.81Initial: 354.03
Final: 365.05
−17504.76−1.7505179.37Initial: 5.53
Final: 5.55
Initial: 5.53
Final: 5.55
Initial: 13.4
Final: 13.39
−0.0160
650−431.67−612.76−967.82Initial: 354.03
Final: 353.72
−17515.00−1.7515257.74Initial: 5.53
Final: 5.55
Initial: 5.53
Final: 5.55
Initial: 13.4
Final: 13.28
0.0053
800−431.75−612.84−970.07Initial: 354.03
Final: 353.20
−17514.99−1.751576.78Initial: 5.53
Final: 5.54
Initial: 5.53
Final: 5.54
Initial: 13.4
Final: 13.28
0.0614
Disclaimer/Publisher’s Note: The statements, opinions and data contained in all publications are solely those of the individual author(s) and contributor(s) and not of MDPI and/or the editor(s). MDPI and/or the editor(s) disclaim responsibility for any injury to people or property resulting from any ideas, methods, instructions or products referred to in the content.

