
Tet-Regulated Expression and Optical Clearing for In Vivo Visualization of Genetically Encoded Chimeric dCas9/Fluorescent Protein Probes

 ,
, 
Abstract
:1. Introduction
2. Materials and Methods
2.1. Construction of Cas9 Expression Plasmids
2.2. Production of Lentiviral Particles
2.3. Generating Stable Cell Lines with Tet-On Induction of Expression of Chimeras in Cells
2.4. Fluorescence Microscopy and Time-Resolved Fluorescence Microscopy
2.5. Subcutaneous Tumor Xenografts and Induction of Tet-O Expression of Chimeras In Vivo
2.6. Optical Imaging In Vivo
2.7. Optical Clearing with Gadobutrol
2.8. Magnetic Resonance Imaging
2.9. Statistical Analyses
3. Results
3.1. dCasCas9-FP Chimera Expression in Cell Culture
3.2. In Vivo Detection of dCas9-FP Expression
4. Discussion
5. Conclusions
Supplementary Materials
Author Contributions
Funding
Institutional Review Board Statement
Informed Consent Statement
Data Availability Statement
Acknowledgments
Conflicts of Interest
References
- Wiedenheft, B.; Sternberg, S.H.; Doudna, J.A. RNA-guided genetic silencing systems in bacteria and archaea. Nature 2012, 482, 331–338. [Google Scholar] [CrossRef] [PubMed]
- Jinek, M.; Chylinski, K.; Fonfara, I.; Hauer, M.; Doudna, J.A.; Charpentier, E. A programmable dual-RNA-guided DNA endonuclease in adaptive bacterial immunity. Science 2012, 337, 816–821. [Google Scholar] [CrossRef] [PubMed]
- Wright, A.V.; Nunez, J.K.; Doudna, J.A. Biology and Applications of CRISPR Systems: Harnessing Nature’s Toolbox for Genome Engineering. Cell 2016, 125, 385–398. [Google Scholar] [CrossRef] [PubMed] [Green Version]
- Hou, Z.; Zhang, Y.; Propson, N.E.; Howden, S.E.; Chu, L.F.; Sontheimer, E.J.; Thomson, J.A. Efficient genome engineering in human pluripotent stem cells using Cas9 from Neisseria meningitidis. Proc. Natl. Acad. Sci. USA 2013, 110, 15644–15649. [Google Scholar] [CrossRef] [PubMed] [Green Version]
- Hsu, P.D.; Lander, E.S.; Zhang, F. Development and applications of CRISPR-Cas9 for genome engineering. Cell 2014, 157, 1262–1278. [Google Scholar] [CrossRef] [PubMed] [Green Version]
- Mali, P.; Yang, L.; Esvelt, K.M.; Aach, J.; Guell, M.; DiCarlo, J.E.; Norville, J.E.; Church, G.M. RNA-guided human genome engineering via Cas9. Science 2013, 339, 823–826. [Google Scholar] [CrossRef] [Green Version]
- Cong, L.; Ran, F.A.; Cox, D.; Lin, S.; Barretto, R.; Habib, N.; Hsu, P.D.; Wu, X.; Jiang, W.; Marraffini, L.A.; et al. Multiplex genome engineering using CRISPR/Cas systems. Science 2013, 339, 819–823. [Google Scholar] [CrossRef] [Green Version]
- Ma, H.; Naseri, A.; Reyes-Gutierrez, P.; Wolfe, S.A.; Zhang, S.; Pederson, T. Multicolor CRISPR labeling of chromosomal loci in human cells. Proc. Natl. Acad. Sci. USA 2015, 112, 3002–3007. [Google Scholar] [CrossRef] [Green Version]
- Ma, H.; Tu, L.C.; Naseri, A.; Huisman, M.; Zhang, S.; Grunwald, D.; Pederson, T. Multiplexed labeling of genomic loci with dCas9 and engineered sgRNAs using CRISPRainbow. Nat. Biotechnol. 2016, 34, 528–530. [Google Scholar] [CrossRef] [PubMed] [Green Version]
- Anton, T.; Leonhardt, H.; Markaki, Y. Visualization of genomic loci in living cells with a fluorescent CRISPR/Cas9 System. Methods Mol. Biol. 2016, 1411, 407–417. [Google Scholar]
- Knight, S.; Xie, L.; Deng, W.; Guglielmi, B.; Witkowsky, L.B.; Bosanac, L.; Zhang, E.T.; El Beheiry, M.; Masson, J.B.; Dahan, M.; et al. Dynamics of CRISPR-Cas9 genome interrogation in living cells. Science 2015, 350, 823–826. [Google Scholar] [CrossRef] [PubMed]
- Martens, K.J.A.; van Beljouw, S.P.B.; van der Els, S.; Vink, J.N.; Baas, S.; Vogelaar, G.A.; Brouns, S.J.J.; van Baarlen, P.; Kleerebezem, M.; Hohlbein, J. Visualisation of dCas9 target search in vivo using an open-microscopy framework. Nat. Commun. 2019, 10, 3552. [Google Scholar] [CrossRef] [PubMed] [Green Version]
- Das, A.T.; Tenenbaum, L.; Berkhout, B. Tet-On systems for doxycycline-inducible gene expression. Curr. Gene Ther. 2016, 16, 156–167. [Google Scholar] [CrossRef] [PubMed] [Green Version]
- Kafri, T.; van Praag, H.; Gage, F.H.; Verma, I.M. Lentiviral Vectors: Regulated Gene Expression. Mol. Ther. 2000, 1, 516–521. [Google Scholar] [CrossRef]
- Sandhu, G.S.; Solorio, L.; Broome, A.M.; Salem, N.; Kolthammer, J.; Shah, T.; Flask, C.; Duerk, J.L. Whole animal imaging. Wiley Interdiscip. Rev. Syst. Biol. Med. 2010, 2, 398–421. [Google Scholar] [CrossRef] [Green Version]
- Serkova, N.J.; Glunde, K.; Haney, C.R.; Farhoud, M.; De Lille, A.; Redente, E.F.; Simberg, D.; Westerly, D.C.; Griffin, L.; Mason, R.P. Preclinical Applications of Multi-Platform Imaging in Animal Models of Cancer. Cancer Res. 2021, 81, 1189–1200. [Google Scholar] [CrossRef]
- Bajar, B.T.; Wang, E.S.; Zhang, S.; Lin, M.Z.; Chu, J. A Guide to Fluorescent Protein FRET-Pairs. Sensors 2016, 16, 1488. [Google Scholar] [CrossRef]
- Datta, R.; Heaster, T.M.; Sharick, J.T.; Gillette, A.A.; Skala, M.C. Fluorescence lifetime imaging microscopy: Fundamentals and advances in instrumentation, analysis, and applications. J. Biomed. Opt. 2020, 25, 071203. [Google Scholar] [CrossRef]
- Zherdeva, V.; Kazachkina, N.I.; Shcheslavskiy, V.; Savitsky, A.P. Long-term fluorescence lifetime imaging of a genetically encoded sensor for caspase-3 activity in mouse tumor xenografts. J. Biomed. Opt. 2018, 23, 035002. [Google Scholar]
- Poudel, C.H.; Kaminski, C.F. Supercontinuum radiation in fluorescence microscopy and biomedical imaging applications. J. Opt. Soc. Am. B 2019, 36, A139–A153. [Google Scholar] [CrossRef] [Green Version]
- Ntziachristos, V.; Schellenberger, E.A.; Ripoll, J.; Yessayan, D.; Graves, E.; Bogdanov, A., Jr.; Josephson, L.; Weissleder, R. Visualization of antitumor treatment by means of fluorescence molecular tomography with an annexin V–Cy5.5 conjugate. Proc. Natl. Acad. Sci. USA 2004, 101, 12294–12299. [Google Scholar] [CrossRef] [PubMed] [Green Version]
- Kazachkina, N.I.; Zherdeva, V.V.; Saydasheva, A.N.; Meerovich, I.G.; Tuchin, V.V.; Savitsky, A.P.; Bogdanov, A.A., Jr. Topical gadobutrol application causes fluorescence intensity change in RFP-expressing tumor-bearing mice. J. Biomed. Phot. and Engin. 2021, 7, 020301. [Google Scholar] [CrossRef]
- Lou, J.; Scipioni, L.; Wright, B.K.; Bartolec, T.K.; Zhang, J.; Masamsetti, V.P.; Gaus, K.; Gratton, E.; Cesare, A.J.; Hinde, E. Phasor histone FLIM-FRET microscopy quantifies spatiotemporal rearrangement of chromatin architecture during the DNA damage response. Proc. Natl. Acad. Sci. USA 2019, 116, 7323–7332. [Google Scholar] [CrossRef] [PubMed] [Green Version]
- Tuchin, V. Tissue Optics: Light Scattering Methods and Instruments for Medical Diagnostics, 3rd ed.; SPIE Press: Bellingham, WA, USA, 2015; Volume PM254. [Google Scholar]
- Tuchina, D.K.; Meerovich, I.G.; Sindeeva, O.A.; Zherdeva, V.V.; Savitsky, A.P.; Bogdanov, A.A., Jr.; Tuchin, V.V. Magnetic resonance contrast agents in optical clearing: Prospects for multimodal tissue imaging. J. Biophotonics 2020, 13, e201960249. [Google Scholar] [CrossRef]
- Kazachkina, N.I.; Zherdeva, V.V.; Meerovich, I.G.; Saydasheva, A.N.; Solovyev, I.D.; Tuchina, D.K.; Savitsky, A.P.; Tuchin, V.V.; Bogdanov, A.A., Jr. MR and fluorescence imaging of gadobutrol-induced optical clearing of red fluorescent protein signal in an in vivo cancer model. NMR Biomed. 2022, 35, e4708. [Google Scholar] [CrossRef]
- Esvelt, K.; Mali, P.; Braff, J.; Moosburner, M.; Yaung, S.J.; Church, G.M. Orthogonal Cas9 proteins for RNA-guided gene regulation and editing. Nat. Methods 2013, 10, 1116–1121. [Google Scholar] [CrossRef] [Green Version]
- Tiscornia, G.; Singer, O.; Verma, I.M. Production and Purification of Lentiviral Vectors. Nat. Protoc. 2006, 1, 241–245. [Google Scholar] [CrossRef]
- Becker, W. Advanced Time-Correlated Single Photon Counting Applications; Springer: Berlin/Heidelberg, Germany, 2015; 401p. [Google Scholar]
- Kapur, J.; Sahoo, P.; Wong, A. A new method for gray-level picture thresholding using the entropy of the histogram. Graph Models Image Process 1985, 29, 273–285. [Google Scholar] [CrossRef]
- Kistner, A.; Gossen, M.; Zimmermann, F.; Jerecic, J.; Ullmer, C.; Lübbert, H.; Bujard, H. Doxycycline-mediated quantitative and tissue-specific control of gene expression in transgenic mice. Proc. Natl. Acad. Sci. USA 1996, 93, 10933–10938. [Google Scholar] [CrossRef] [Green Version]
- Wu, X.; Mao, S.; Ying, Y.; Krueger, C.J.; Chen, A.K. Progress and challenges for live-cell imaging of genomic loci using CRISPR-based platforms. Genom. Proteom. Bioinform. 2019, 17, 119–128. [Google Scholar] [CrossRef]
- Lee, C.M.; Cradick, T.J.; Bao, G. The Neisseria meningitidis CRISPR-Cas9 system enables specific genome editing in mammalian cells. Mol. Ther. 2016, 24, 645–654. [Google Scholar] [CrossRef] [PubMed] [Green Version]
- Hu, J.H.; Miller, S.M.; Geurts, M.H.; Tang, W.; Chen, L.; Sun, N.; Zeina, C.M.; Gao, X.; Rees, H.A.; Lin, Z.; et al. Evolved Cas9 variants with broad PAM compatibility and high DNA specificity. Nature 2018, 556, 57–63. [Google Scholar] [CrossRef] [PubMed]
- Lu, J.; Wu, T.; Zhang, B.; Liu, S.; Song, W.; Qiao, J.; Ruan, H. Types of nuclear localization signals and mechanisms of protein import into the nucleus. Cell Commun. Signal 2021, 19, 60. [Google Scholar] [CrossRef]
- Costantini, L.; Baloban, M.; Markwardt, M.; Rizzo, M.A.; Guo, F.; Verkhusha, V.V.; Snapp, E.L. A palette of fluorescent proteins optimized for diverse cellular environments. Nat. Commun. 2015, 6, 7670. [Google Scholar] [CrossRef] [PubMed] [Green Version]
- Potekhina, E.S.; Bass, D.Y.; Kelmanson, I.V.; Fetisova, E.S.; Ivanenko, A.V.; Belousov, V.V.; Bilan, D.S. Drug Screening with Genetically Encoded Fluorescent Sensors: Today and Tomorrow. Int. J. Mol. Sci. 2021, 22, 148. [Google Scholar] [CrossRef]
- Gratton, E. Applied physics. Deeper tissue imaging with total detection. Science 2011, 331, 1016–1017. [Google Scholar] [CrossRef]
 ) or SpdCas9-EGFP (
 ) A549 cells, as well asthe fraction of total fluorescence in cell nuclei after the induction (
 ,
,  ); (C) the dependence of red FI of cell nuclei (
 ) due to expression of NmdCas9-mCherryand the fraction of total FI of the cell nuclei (
 ) after theinduction of chimera expression by Dox.
) or SpdCas9-EGFP () A549 cells, as well asthe fraction of total fluorescence in cell nuclei after the induction (, ); (C) the dependence of red FI of cell nuclei () due to expression of NmdCas9-mCherryand the fraction of total FI of the cell nuclei () after theinduction of chimera expression by Dox.
) after theinduction of chimera expression by Dox.
) or SpdCas9-EGFP () A549 cells, as well asthe fraction of total fluorescence in cell nuclei after the induction (, ); (C) the dependence of red FI of cell nuclei () due to expression of NmdCas9-mCherryand the fraction of total FI of the cell nuclei () after theinduction of chimera expression by Dox.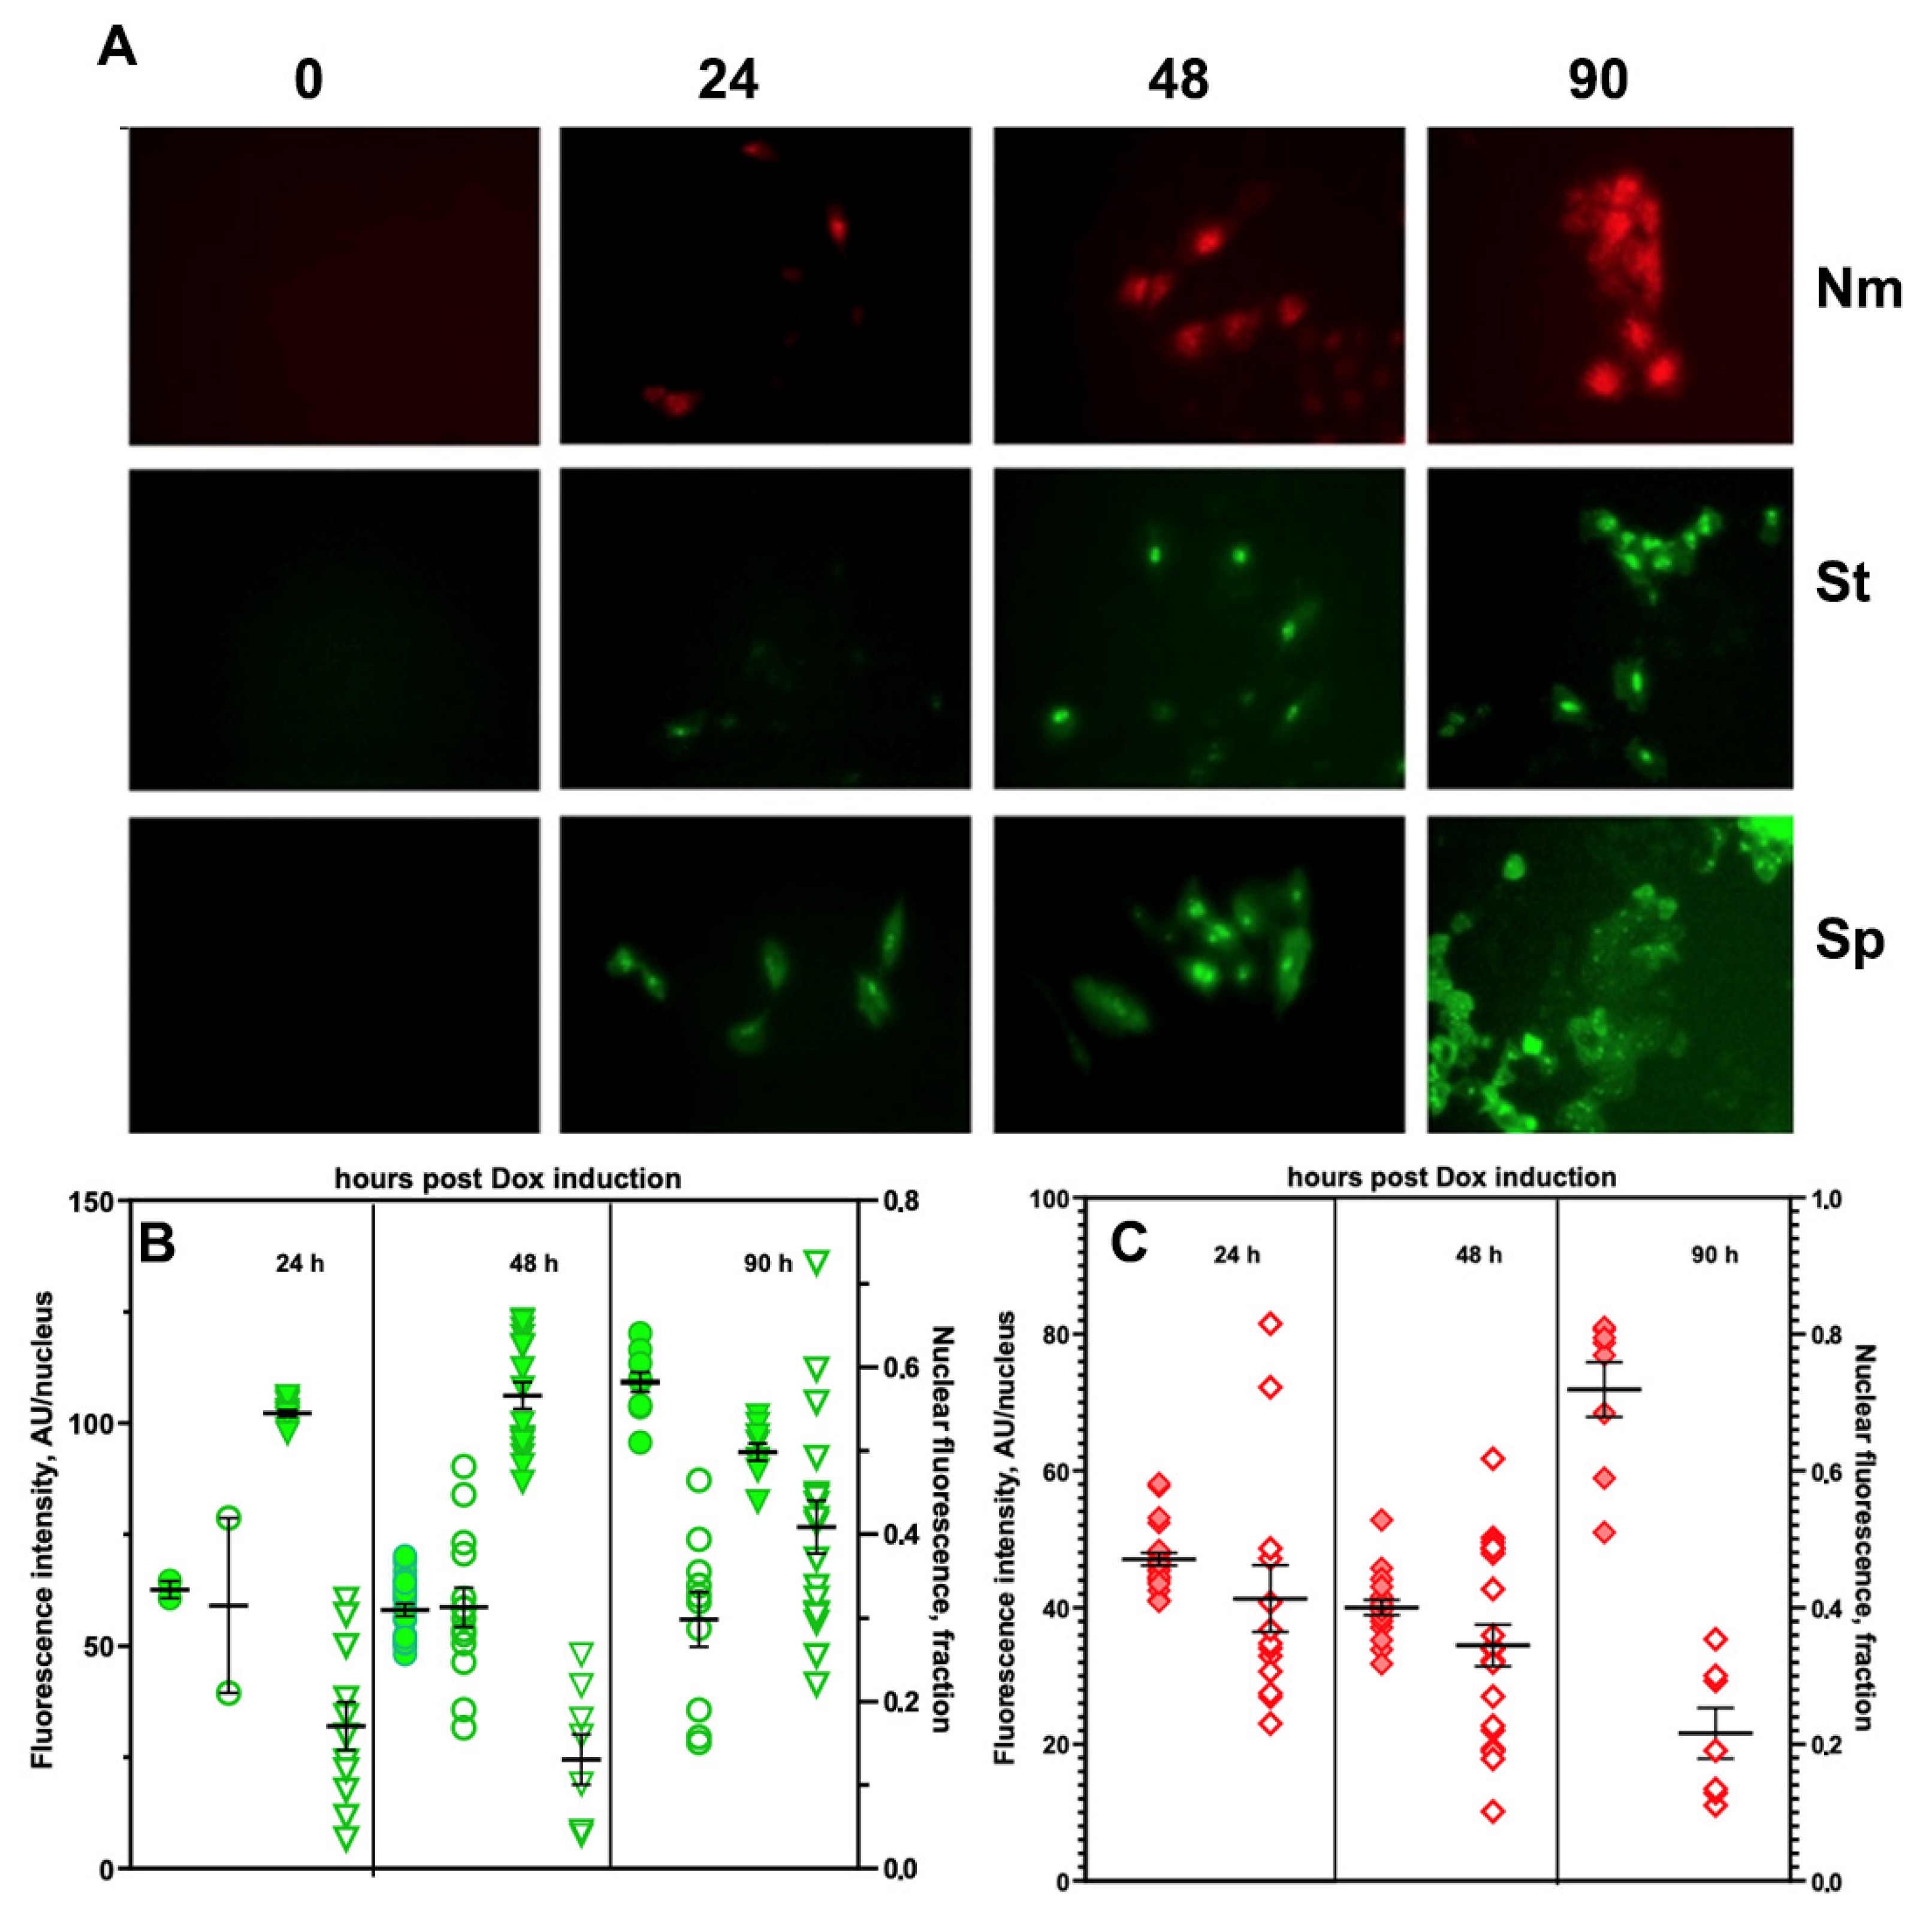
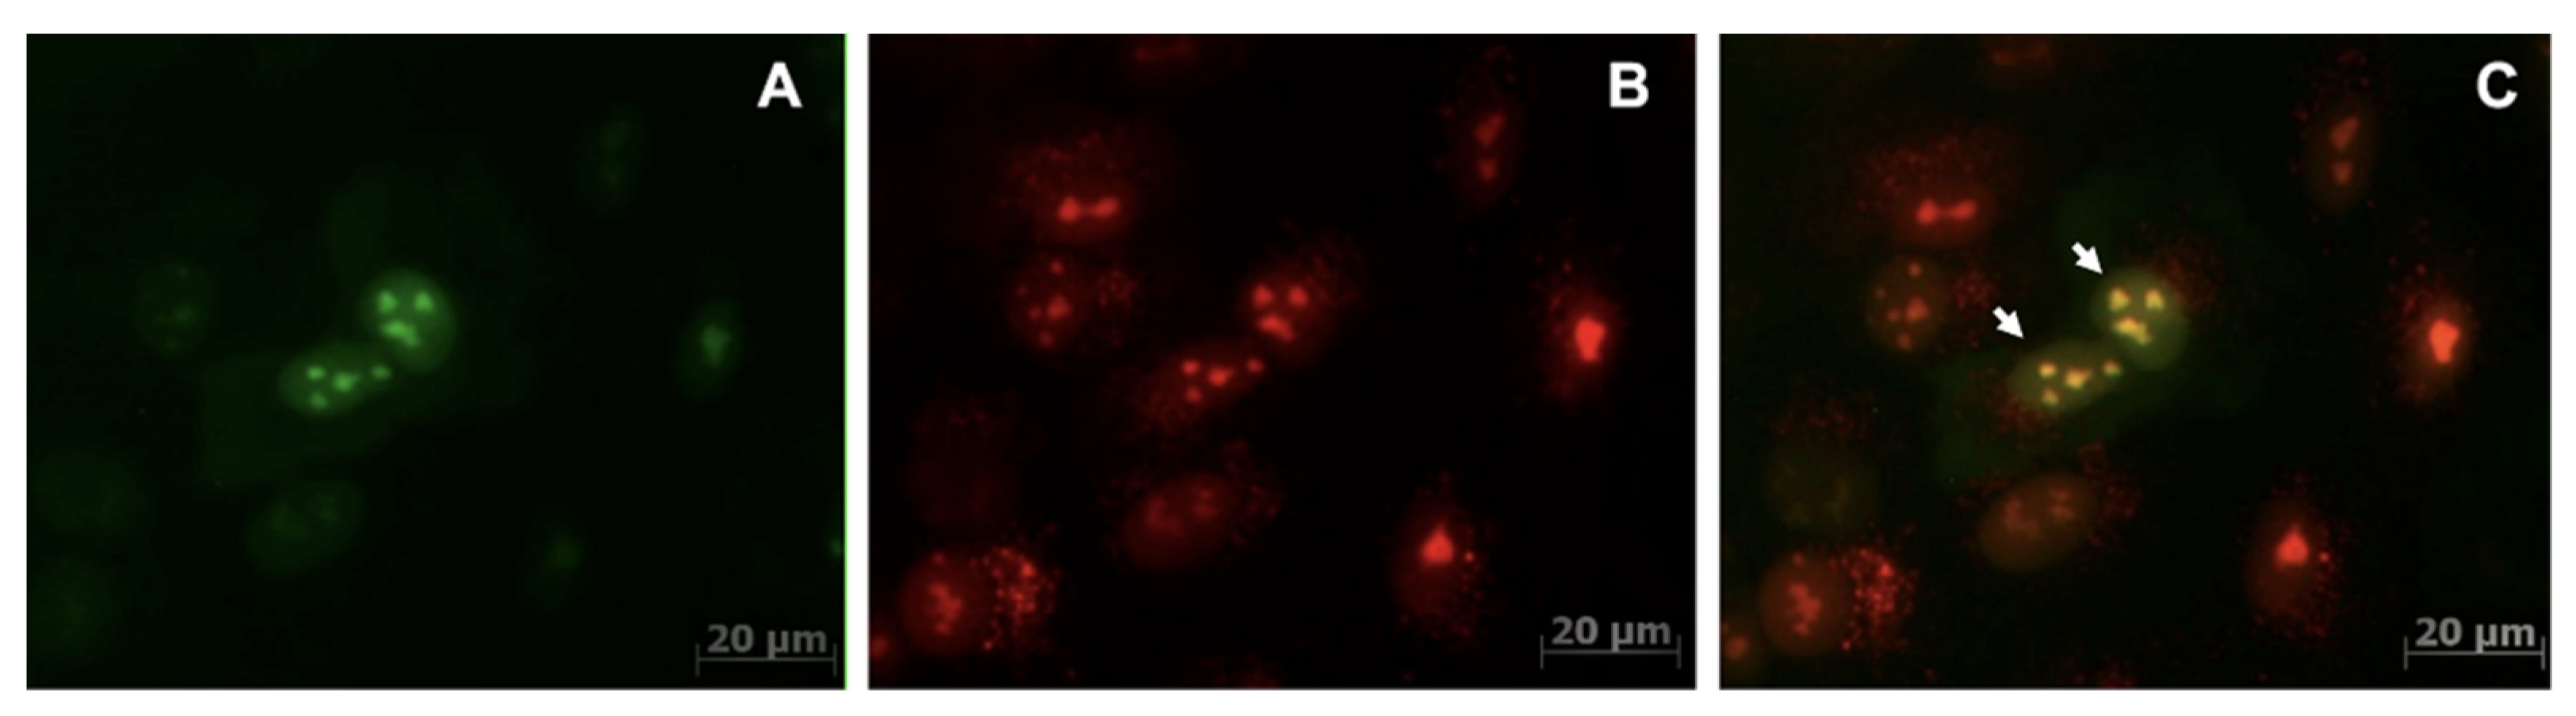
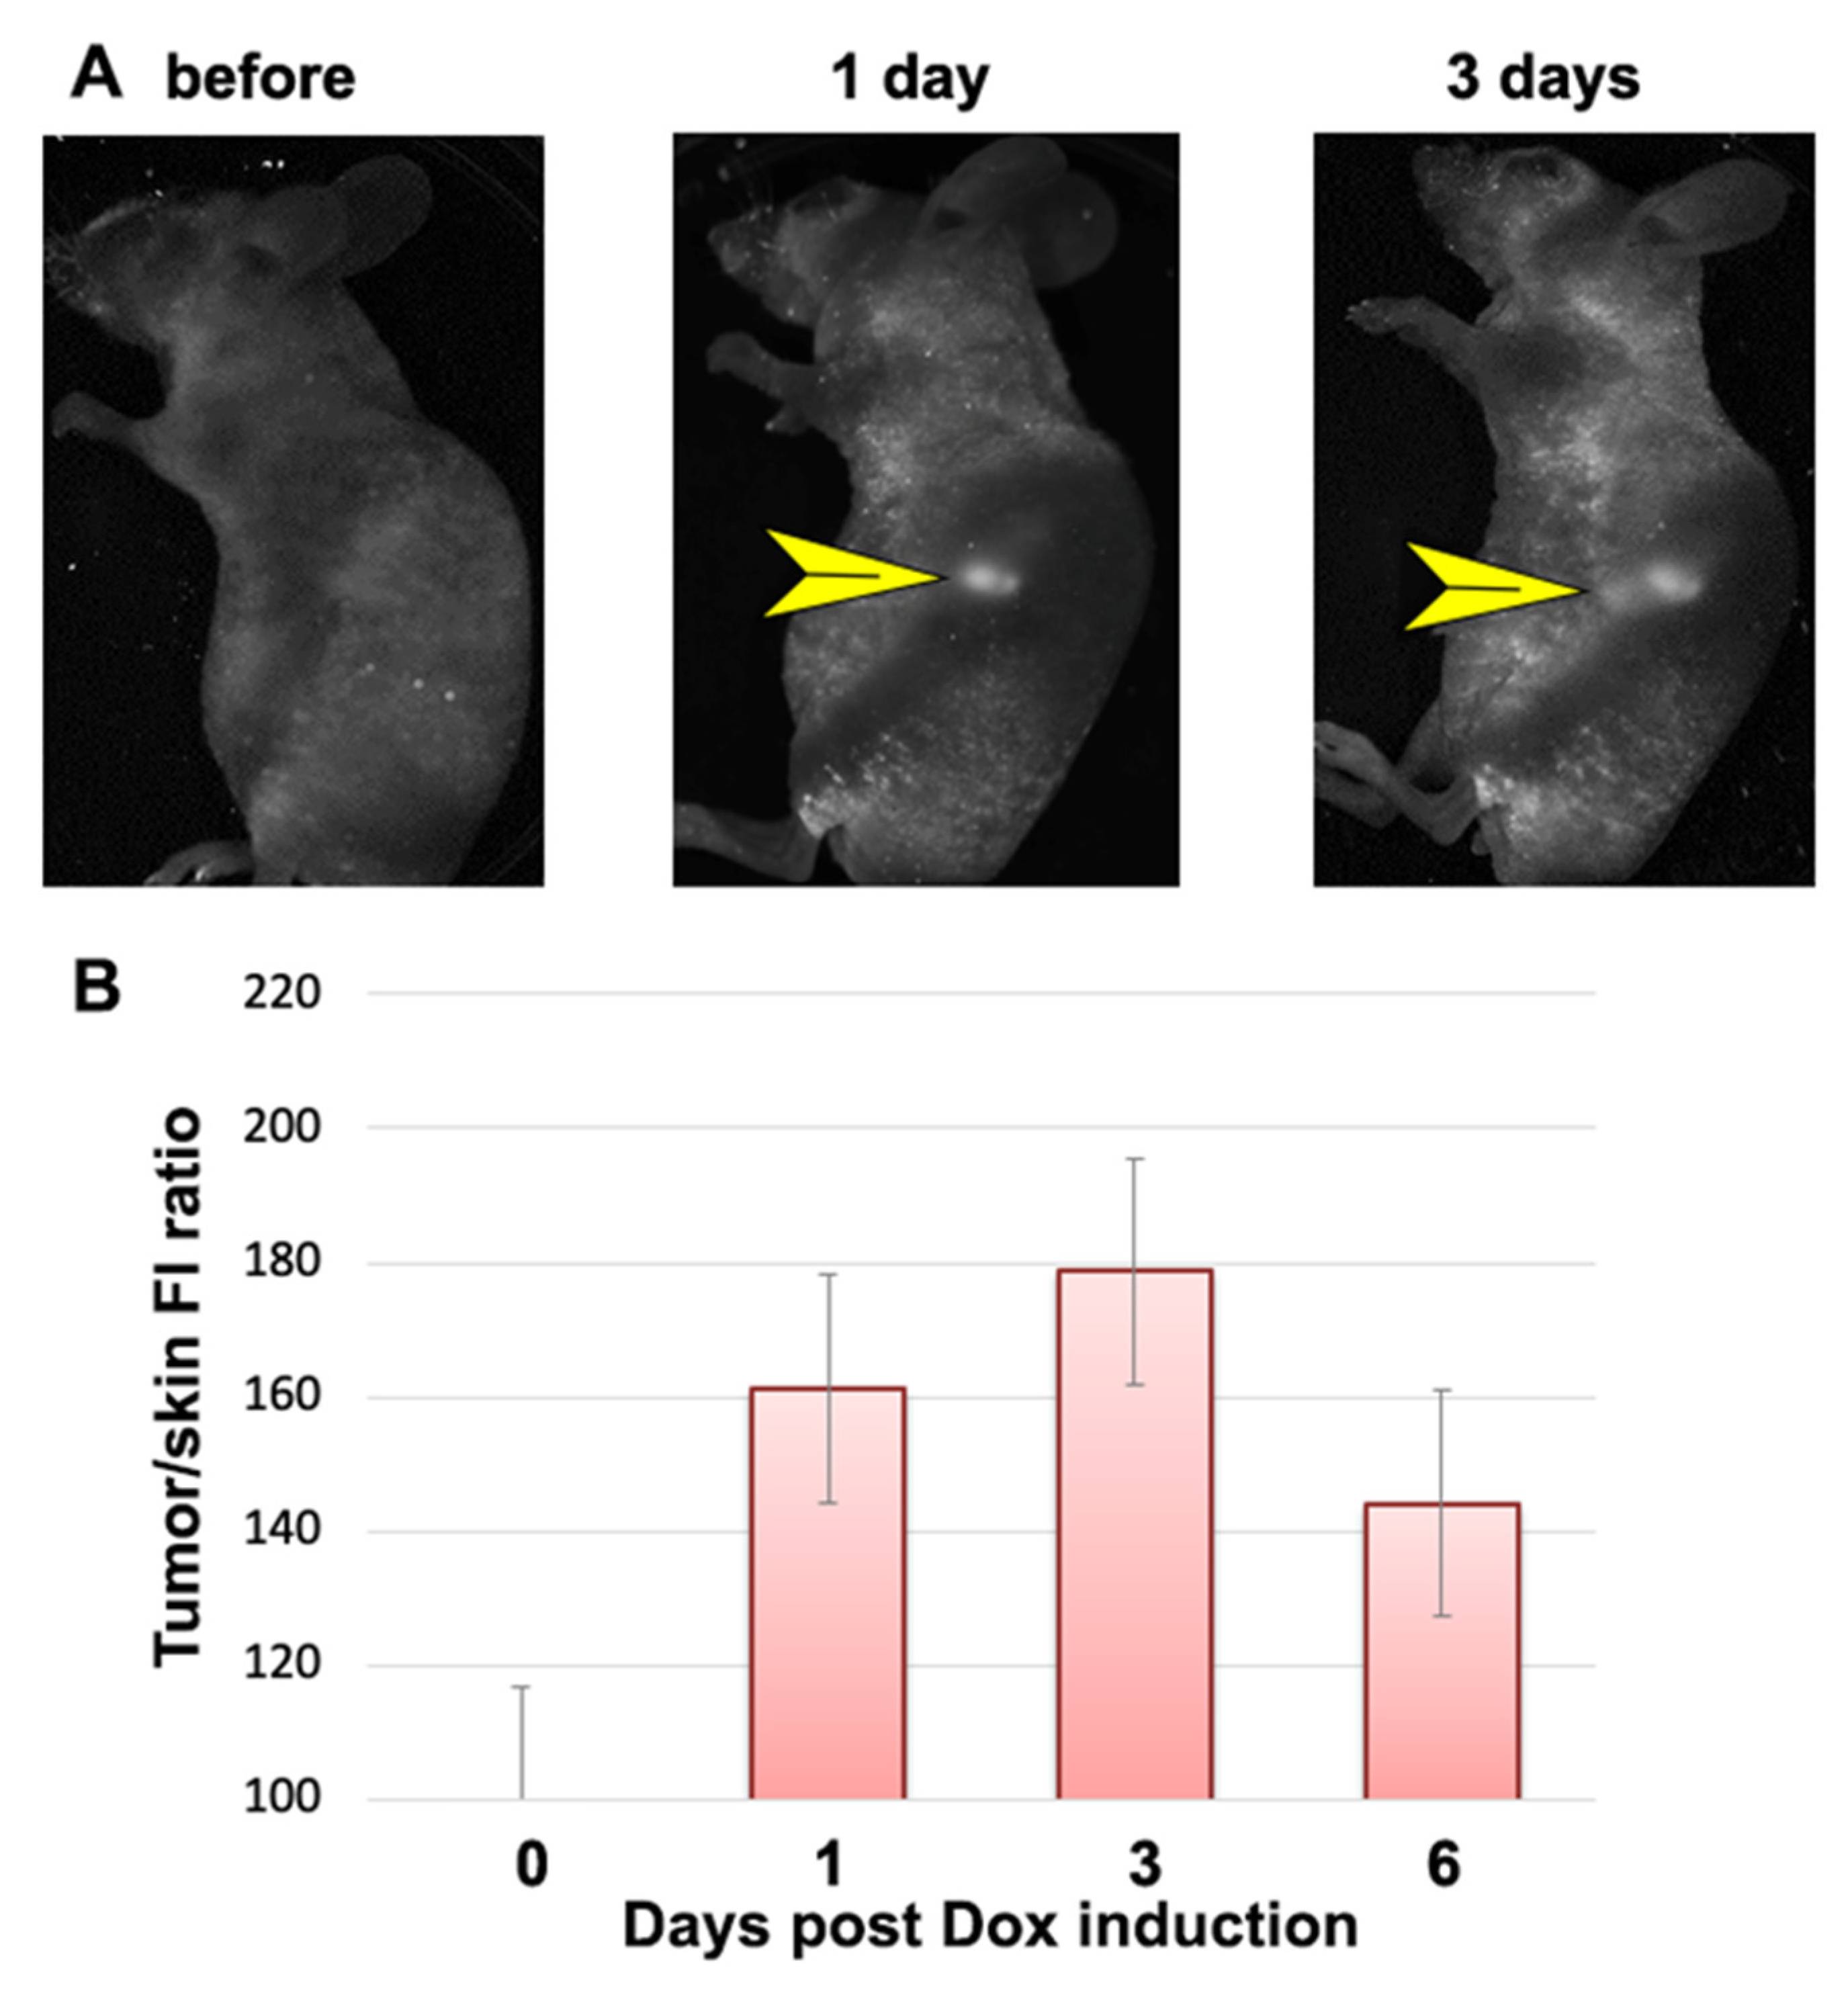
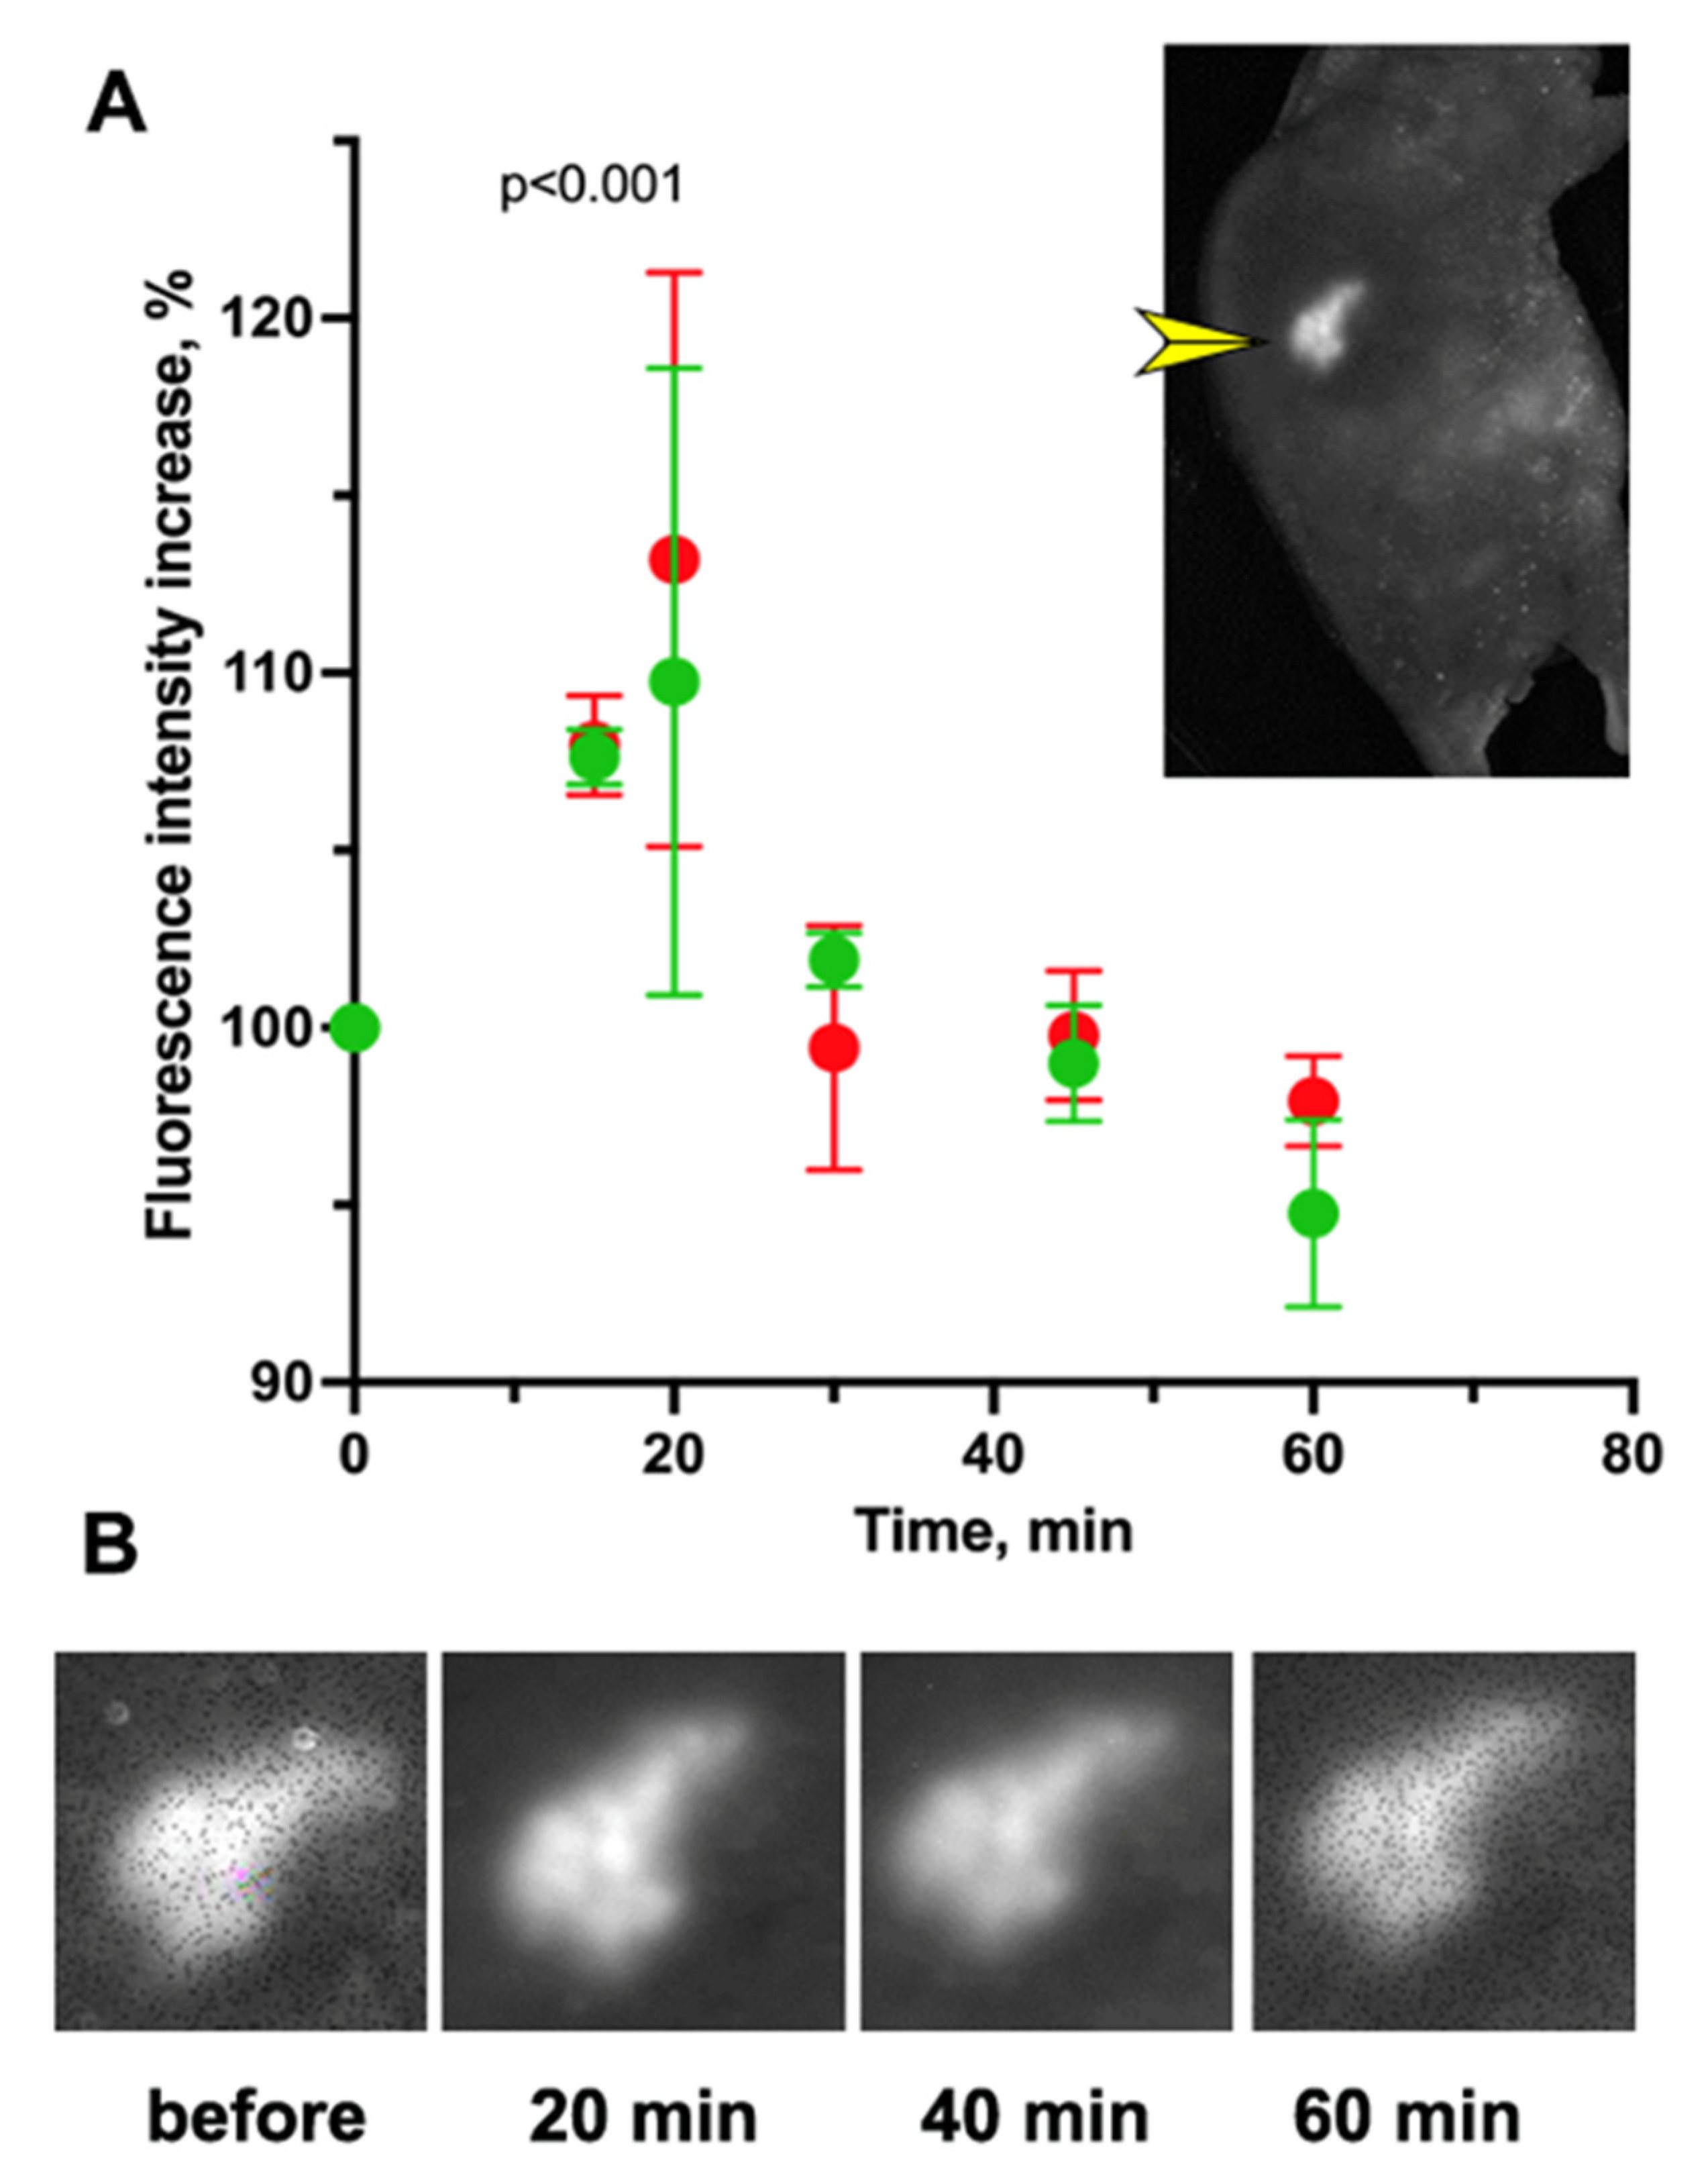
 ) and NmdCas9-mCherry (
 ) as well as in FRET-mode (
 ). Data are shown as mean ± SD (n = 2–3 measurements in n = 3 animals), p < 0.001(Wilcoxon–Mann–Whitney test, n = 6 data points).
) and NmdCas9-mCherry () as well as in FRET-mode (). Data are shown as mean ± SD (n = 2–3 measurements in n = 3 animals), p < 0.001(Wilcoxon–Mann–Whitney test, n = 6 data points).
). Data are shown as mean ± SD (n = 2–3 measurements in n = 3 animals), p < 0.001(Wilcoxon–Mann–Whitney test, n = 6 data points).
) and NmdCas9-mCherry () as well as in FRET-mode (). Data are shown as mean ± SD (n = 2–3 measurements in n = 3 animals), p < 0.001(Wilcoxon–Mann–Whitney test, n = 6 data points).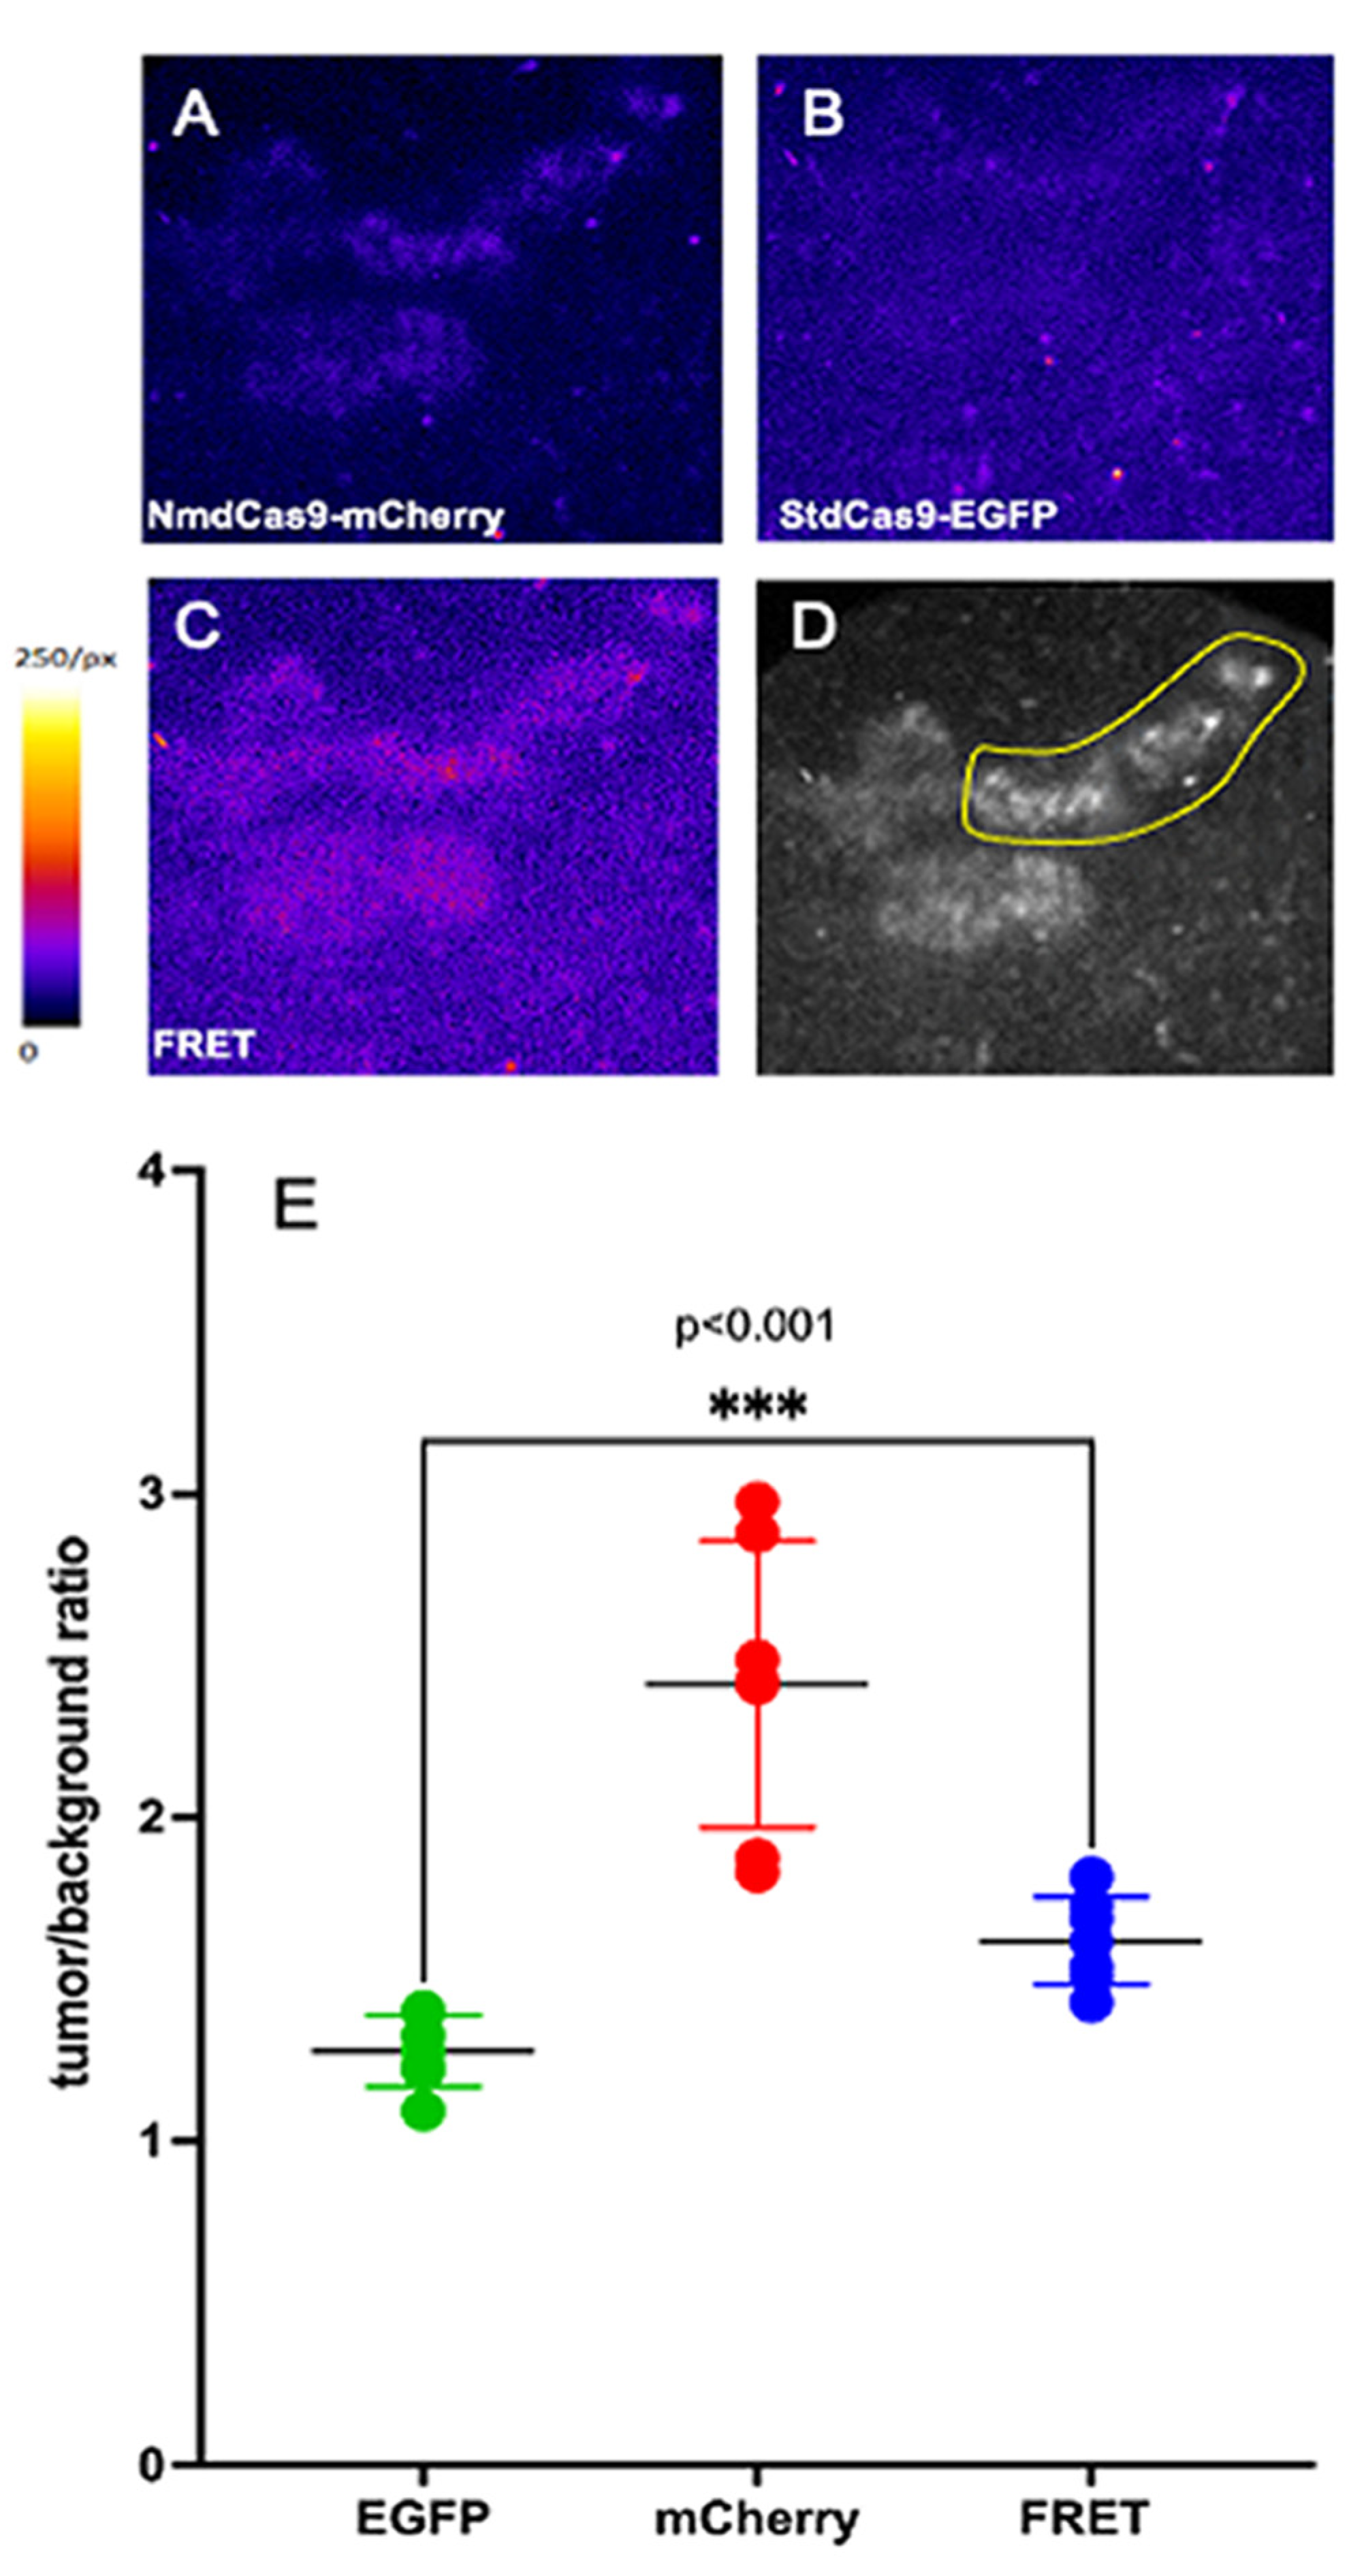

Disclaimer/Publisher’s Note: The statements, opinions and data contained in all publications are solely those of the individual author(s) and contributor(s) and not of MDPI and/or the editor(s). MDPI and/or the editor(s) disclaim responsibility for any injury to people or property resulting from any ideas, methods, instructions or products referred to in the content. |
© 2023 by the authors. Licensee MDPI, Basel, Switzerland. This article is an open access article distributed under the terms and conditions of the Creative Commons Attribution (CC BY) license (https://creativecommons.org/licenses/by/4.0/).
Share and Cite
Maloshenok, L.; Abushinova, G.; Kazachkina, N.; Bogdanov, A., Jr.; Zherdeva, V. Tet-Regulated Expression and Optical Clearing for In Vivo Visualization of Genetically Encoded Chimeric dCas9/Fluorescent Protein Probes. Materials 2023, 16, 940. https://doi.org/10.3390/ma16030940
Maloshenok L, Abushinova G, Kazachkina N, Bogdanov A Jr., Zherdeva V. Tet-Regulated Expression and Optical Clearing for In Vivo Visualization of Genetically Encoded Chimeric dCas9/Fluorescent Protein Probes. Materials. 2023; 16(3):940. https://doi.org/10.3390/ma16030940
Chicago/Turabian StyleMaloshenok, Liliya, Gerel Abushinova, Natalia Kazachkina, Alexei Bogdanov, Jr., and Victoria Zherdeva. 2023. "Tet-Regulated Expression and Optical Clearing for In Vivo Visualization of Genetically Encoded Chimeric dCas9/Fluorescent Protein Probes" Materials 16, no. 3: 940. https://doi.org/10.3390/ma16030940