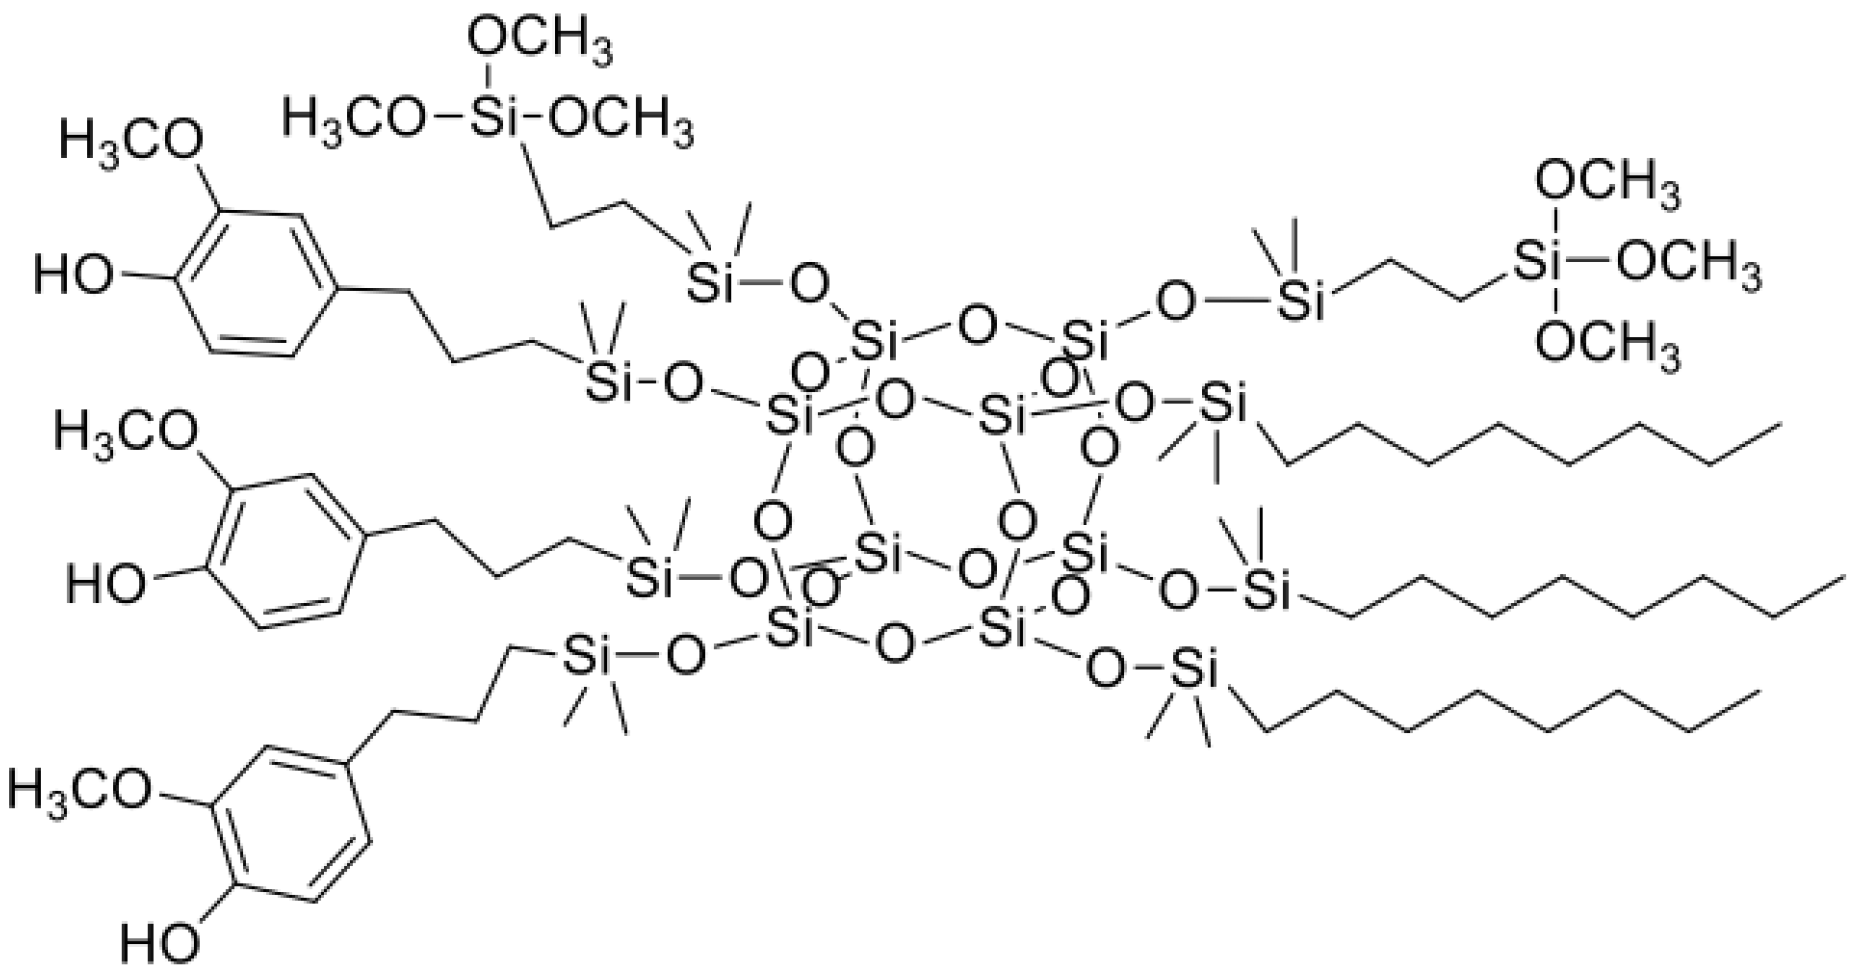
3.1. Characterization of Organosilicon Modifiers
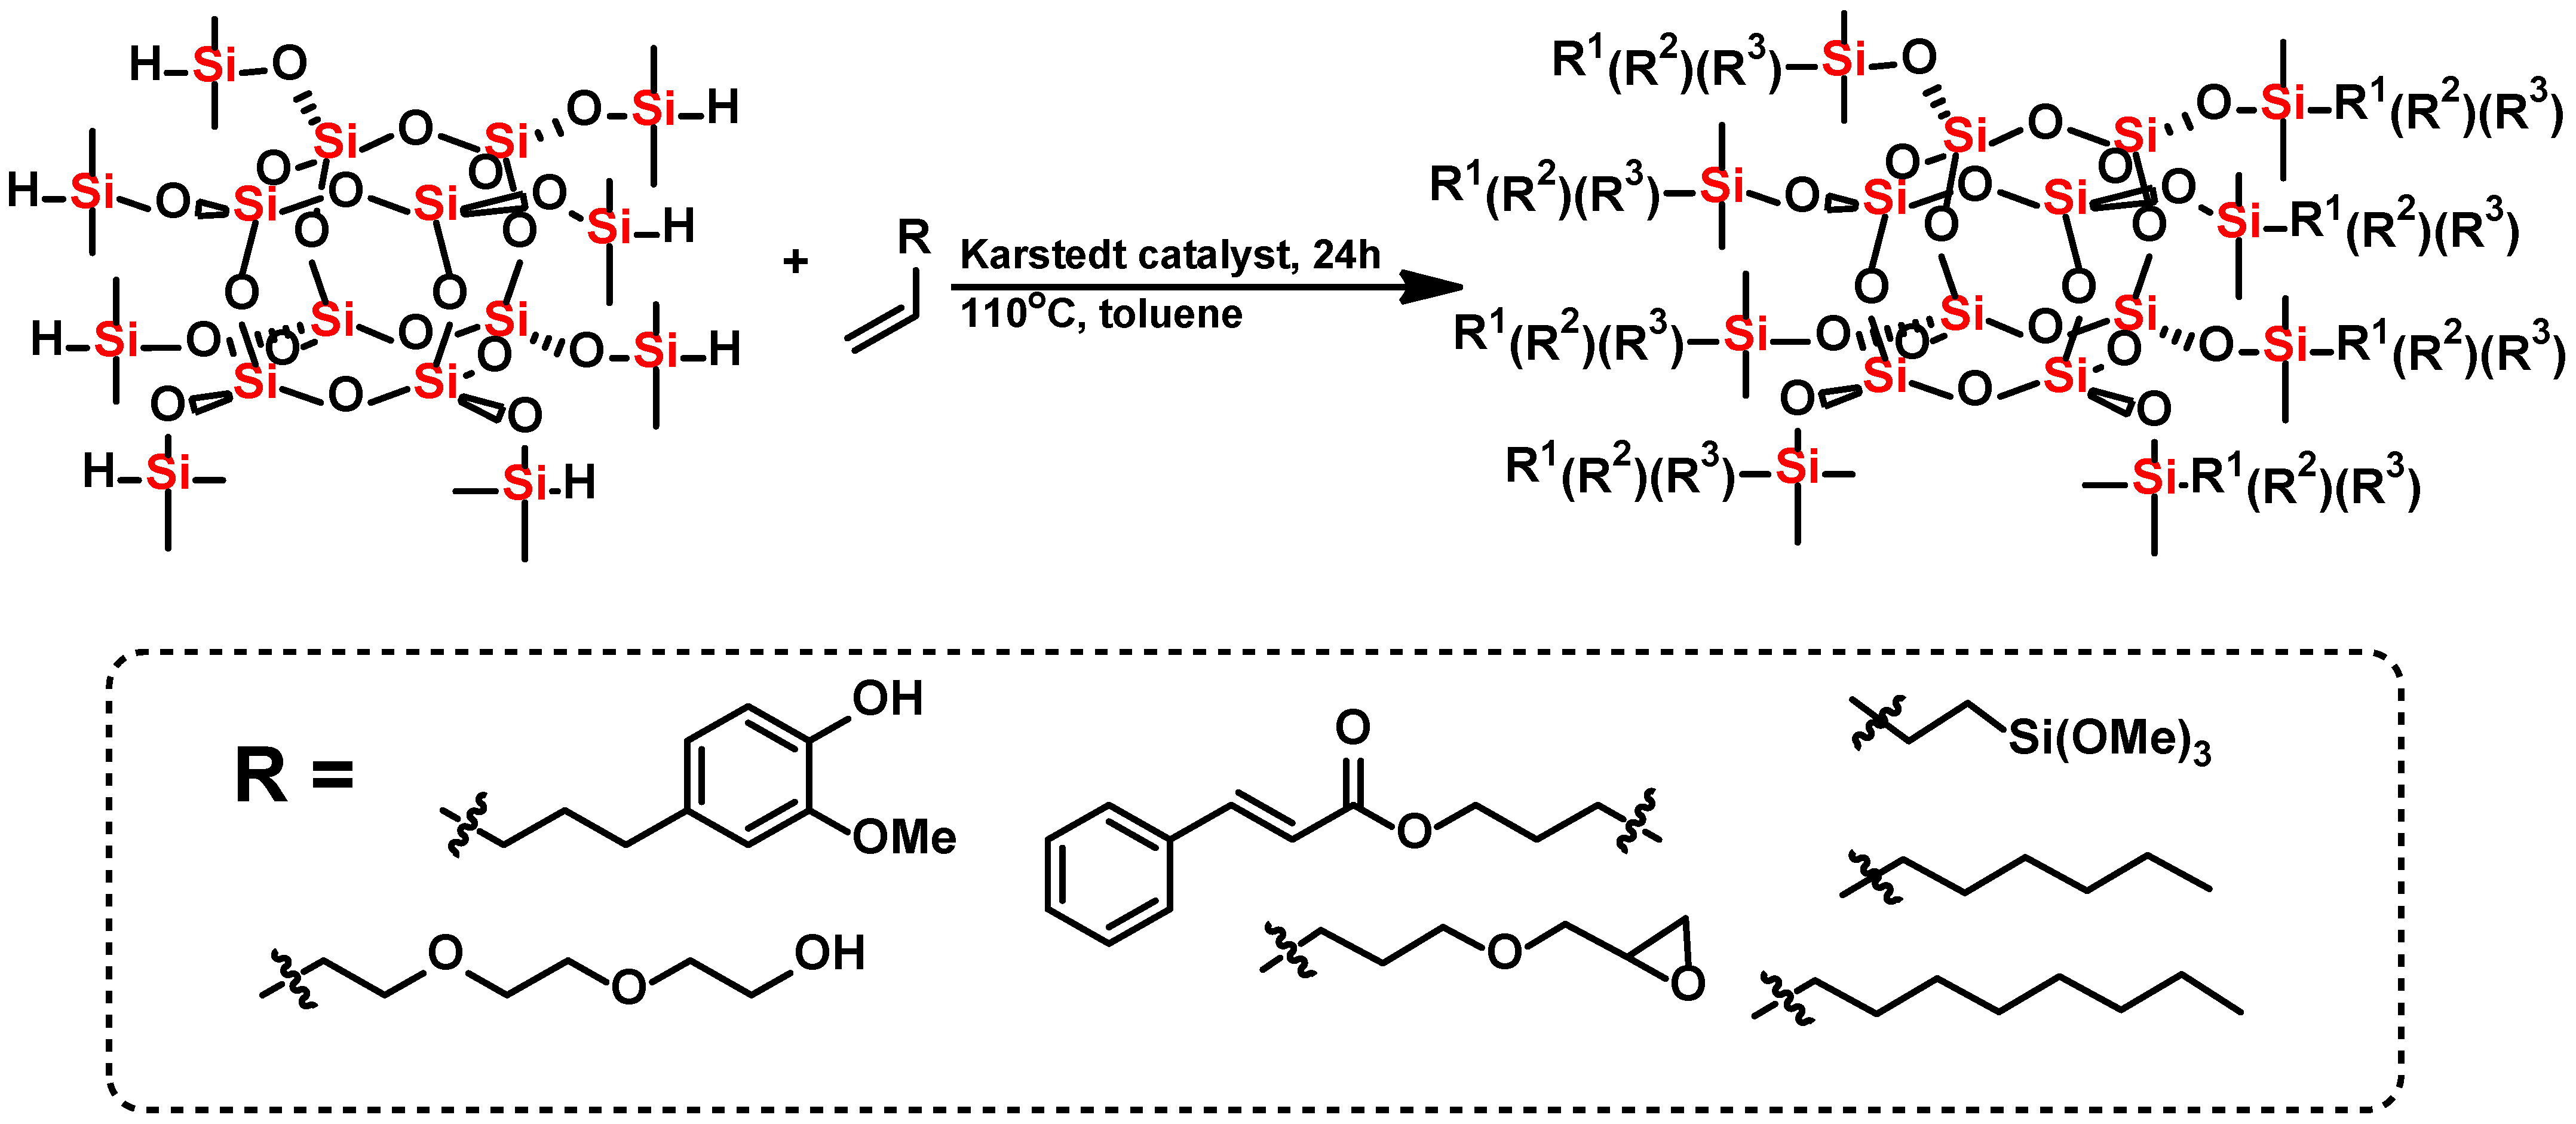
All organosilicon derivatives were obtained by the hydrosilylation reaction of octahydrospherosilicate and commercially available olefins with groups containing unsaturated bonds capable of absorbing UV radiation, as well as non-polar hydrophobic groups and polar groups such as oxirane group, trimethoxysilyl, or diethylene glycol ether. In addition, the trimethoxysilyl group was used to create weak chemical bonds between alkoxyl groups of SSQ and the hydroxyl groups located on the surface of titanium dioxide. Different derivatives containing three types of functional groups in the octaspherosilicate cage were synthesized. Their chemical structures are presented in
Figure 1,
Figure 2,
Figure 3 and
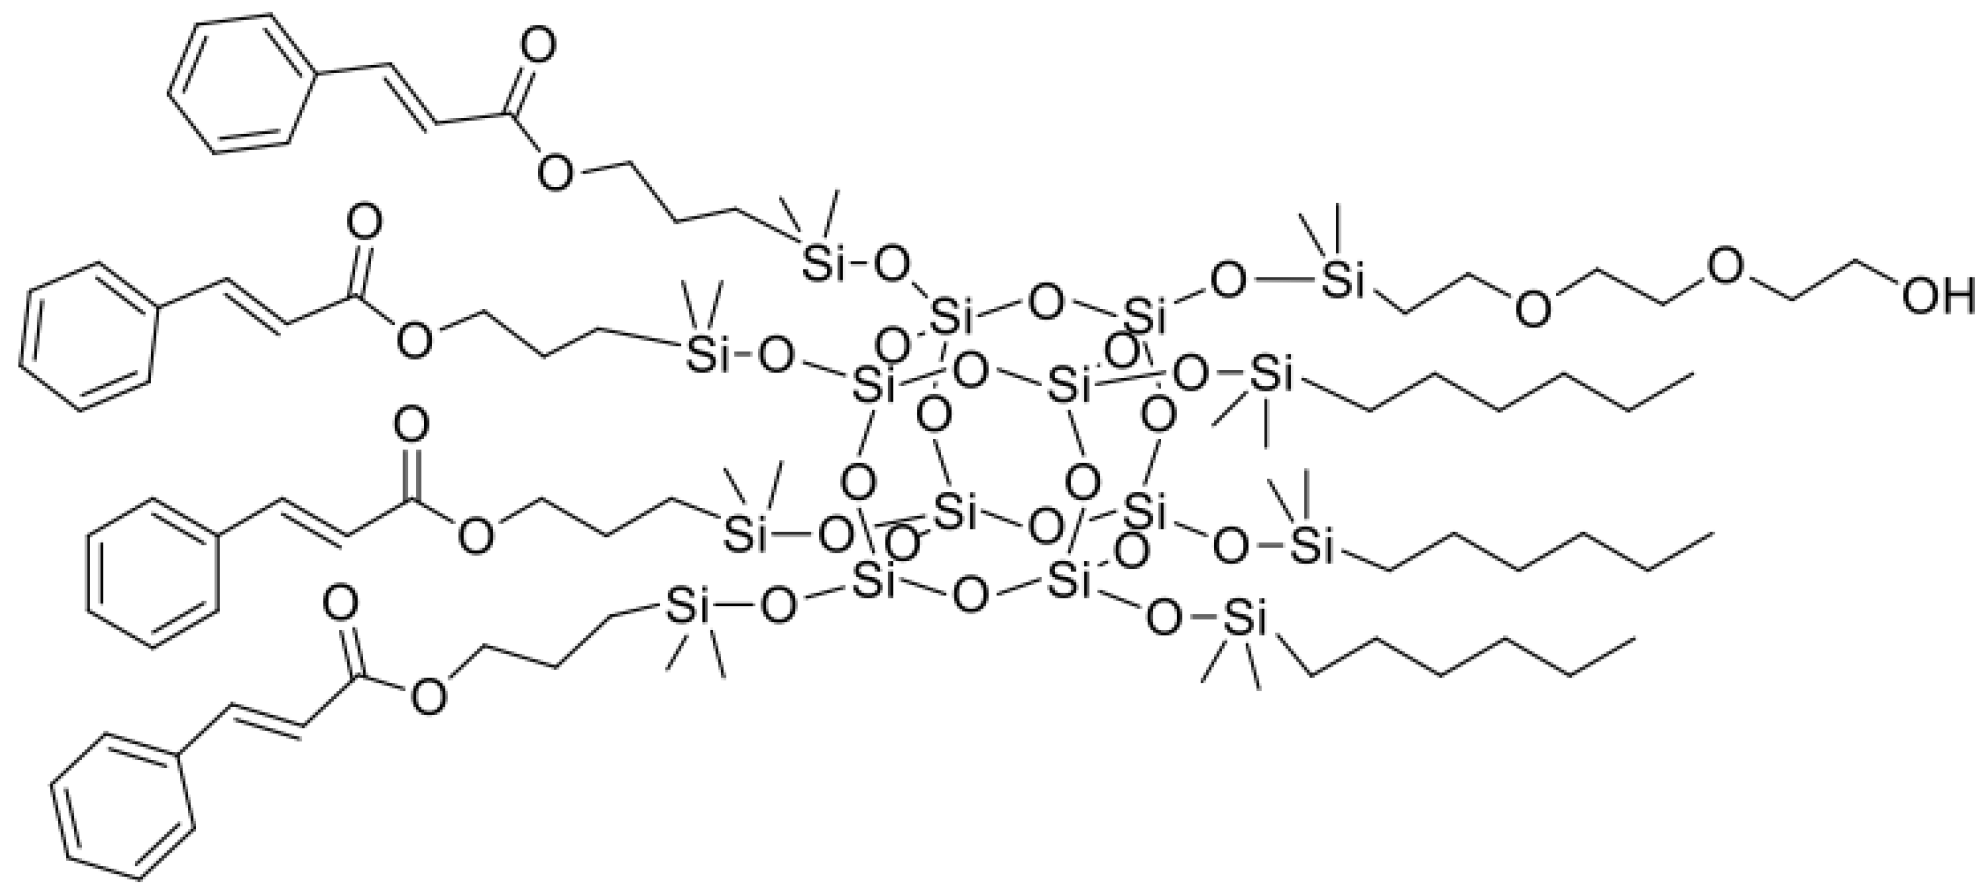
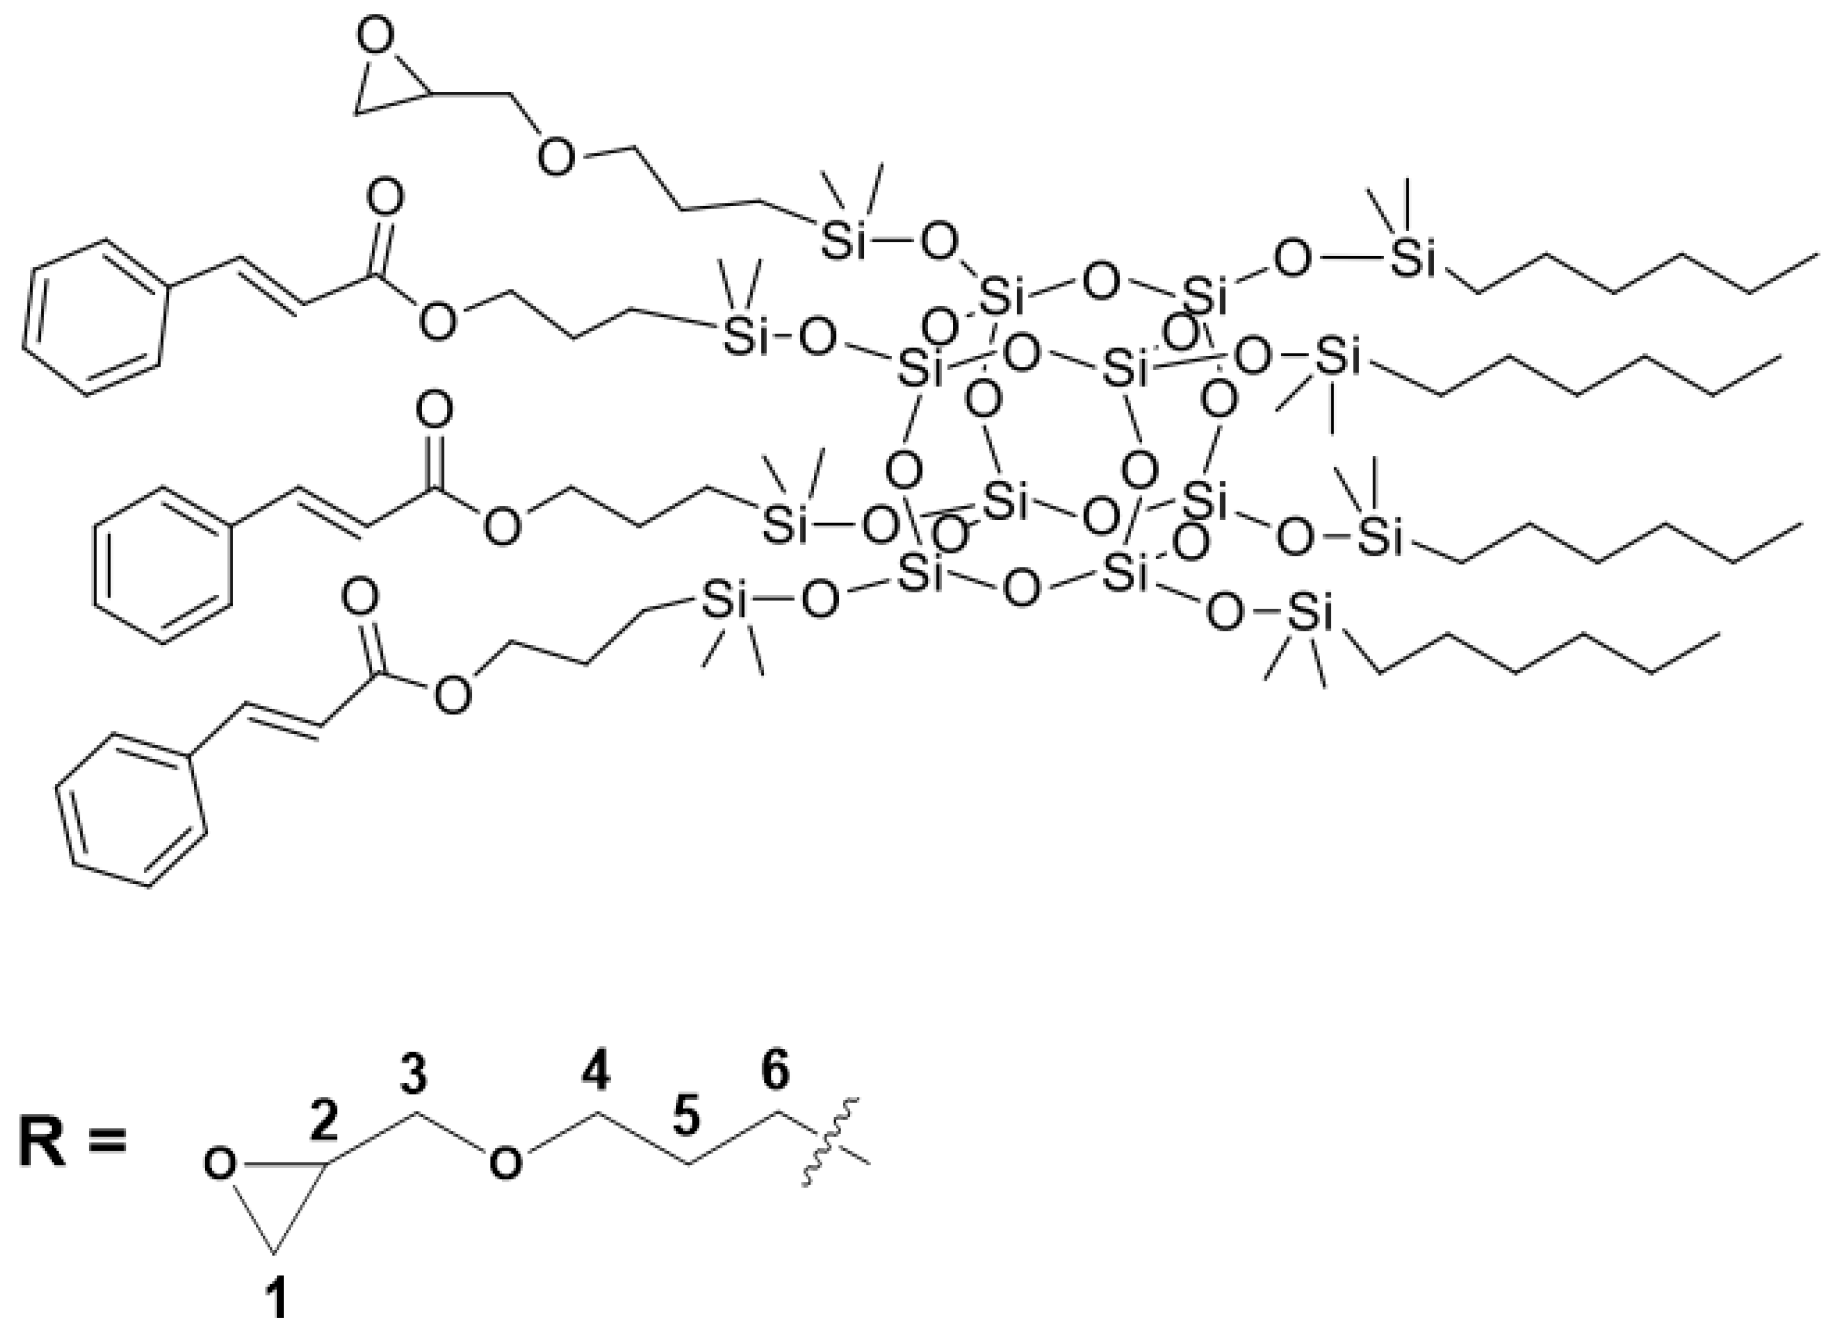
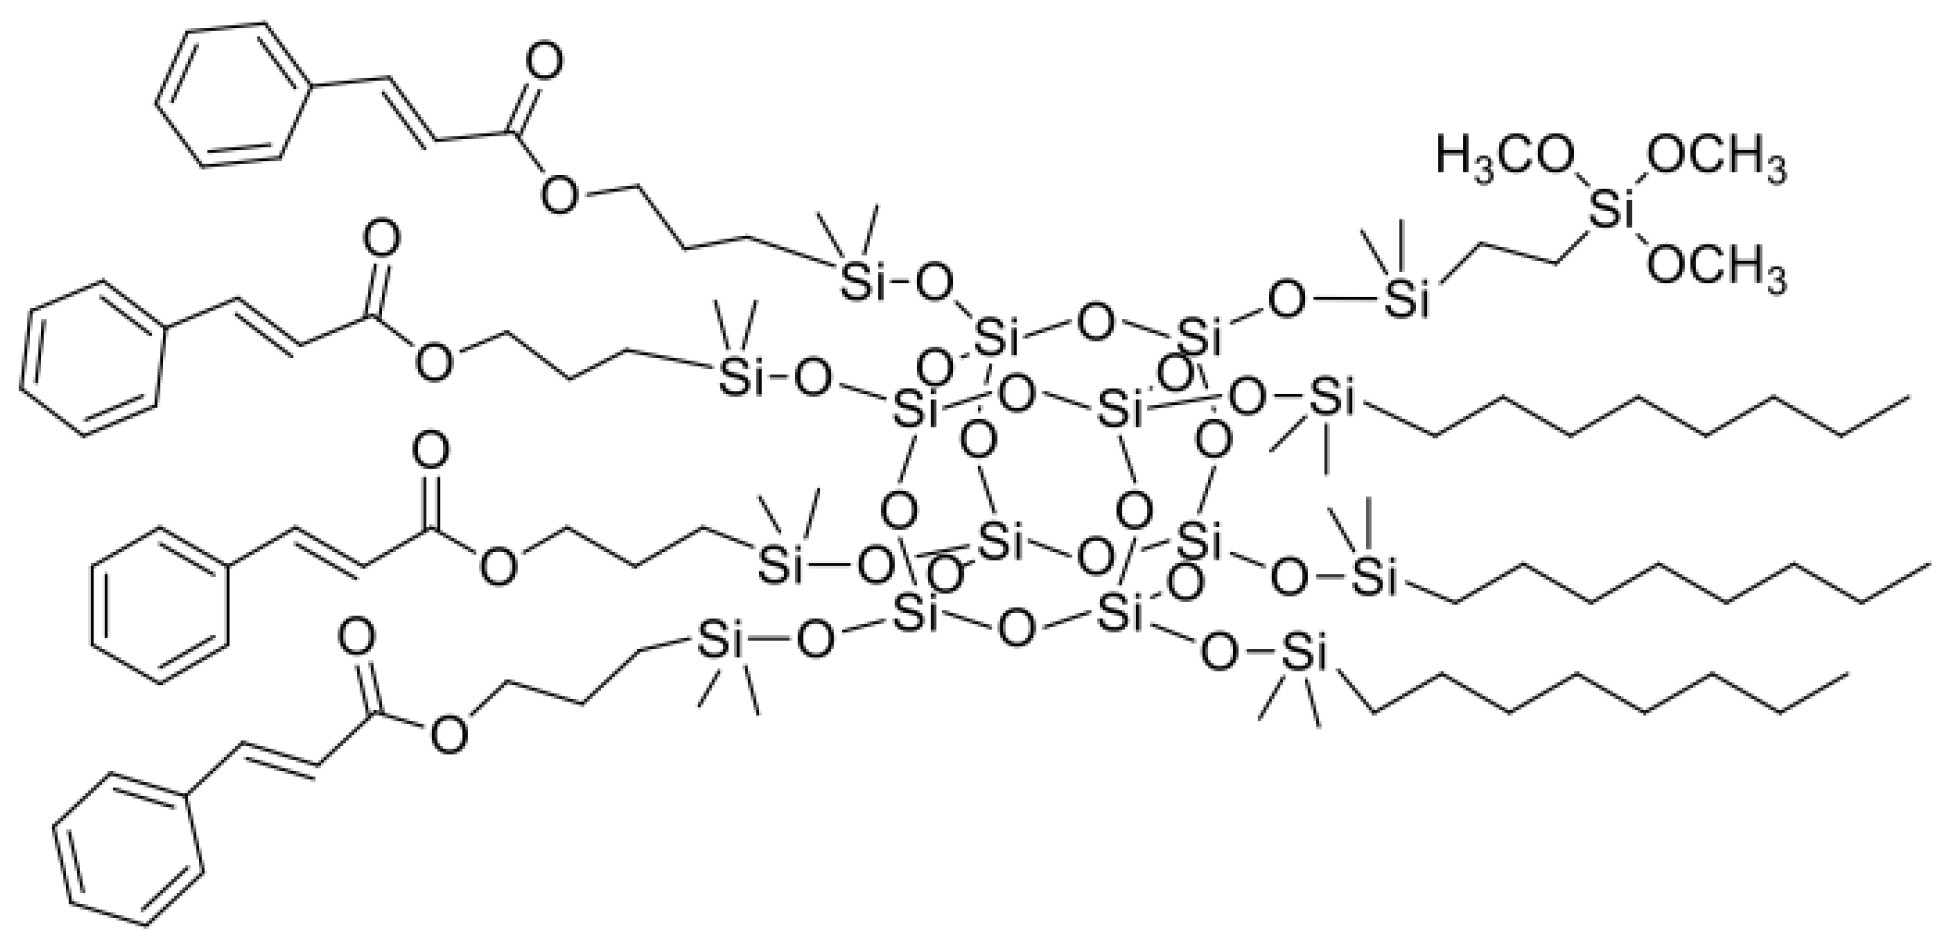
Figure 4. All compounds were obtained with high yield (>95%) and full conversion (>99%), which confirms the efficiency of the hydrosilylation reaction in obtaining functionalized organosilicon compounds. The conversion of the substrates and the purity of the products were determined by
1H NMR spectroscopy.
1H NMR (600 MHz, CDCl3) δ (ppm): 7.70 (m, 4H, CH=CH-Ph), 7.54–7.39 (m, 20 H, Ph), 6.48 (m, 4 H, CH=CH-Ph), 4.20 (m, CH2- CH2- CH2-O), 4.02–3.63 (m, 10H, O-CH2- CH2-O) 2.96, 2.65,1.78 (m, CH2- CH2- CH2-O), 1.34–1.30 (m, 24 H, CH2-(CH2)4-CH3), 1.06–0.97 (m, 2H, Si-CH2-CH2-O) 0.90 (m, CH2-CH3), 0.68 (m, Si-CH2-CH2-CH2) 0.63 (m, CH2-(CH2)4-CH3), 0.47 (m, Si-CH2 backbiting product) 0.21–0.16 (m, 48H, SiMe2).
13C NMR (151 MHz, CDCl3) δ (ppm): 167.08 (C=O), 144.71 (Ph-CH=CH), 137.94, 134.58, 130.31, 129.14, 128.97, 128.33, 125.41, 118.36 (Ph-CH=CH), 67.02, 65.32 (O-CH2), 33.12, 31.70, 23.01, 22.72, 22.53, 21.57, 17.76, 14.27, 13.77, −0.20, −1.30 (SiMe2).
29Si NMR (119 MHz, CDCl3) δ (ppm): 13.15 (SiMe2), −109.01 (core).
1H NMR (600 MHz, CDCl3) δ (ppm): 7.70 (m, 3H, CH=CH-Ph), 7.53–7.39 (m, 15 H, Ph), 6.45 (m, 3 H, CH=CH-Ph) 4.19 (m, CH2- CH2- CH2-O), 3.68 (m, 1 H position 3), 3.45 (m, 2 H, position 4), 3.40 (m, 1 H, position 3), 3.15 (m, 1 H, position 2), 2.79 (m, 1 H, position 1), 2.61 (m, 1 H, position 1), 1.78 (m, CH2- CH2- CH2-O), 1.67 (m, 2 H, position 5), 1.34–1.30 (m, 32H, CH2-(CH2)4-CH3), 0.90 (m, 12H CH2-CH3), 0.69 (m, Si-CH2-CH2-CH2), 0.62(m, Si-CH2-CH2-), 0.46 (m, Si-CH2 backbiting product), 0.21–0.15 (m, 48H, SiMe2).
13C NMR (151 MHz, CDCl3) δ (ppm): 167.09(C=O), 145.97, 144.70 (Ph-CH=CH), 137.96, 134.60, 130.31, 129.15, 128.98, 128.34, 125.42, 118.37 (Ph-CH=CH), 74.21, 71.54, (glycidoxy group) 67.05 (O-CH2), 50.94 (OMe), 44.45, 33.14, 31.71, 23.03, 22.73, 22.54, 21.58, 17.76, 14.27, 13.79, −0.28, −0.37 (SiMe2).
29Si NMR (119 MHz, CDCl3) δ(ppm): 12.93 (SiMe2), −109.02 (core).
1H NMR (600 MHz, CDCl3) δ (ppm): 7.73 (m, 4 H, CH=CH-Ph), 7.53–7.39 (m, 20 H, Ph), 6.48 (m, 3 H, CH=CH-Ph), 4.19 (m, CH2- CH2- CH2-O), 3.59 (m, 9 H, Si-O-CH3), 1.78 (m, CH2- CH2- CH2-O), 1.28 (m, 36 H, CH2-(CH2)6-CH3), 0.90 (m, 9H CH2-CH3), 0.70 (m, Si-CH2-CH2-CH2-O) 0.62 (m, Si-CH2-CH2), 0.46 (m, Si-CH2 backbiting product), 0.21–0.16 (m, 48 H, SiMe2).
13C NMR (151 MHz, CDCl3) δ (ppm): 167.09(C=O), 145.98, 145.18, 144.70 (Ph-CH=CH), 137.97, 134.60, 132.42, 130.31, 128.98, 128.17, 125.42, 118.38 (Ph-CH=CH), 67.04, 65.33 (O-CH2), 50.67 (Si-(OMe)3), 33.56, 32.07, 29.45, 22.81, 22.54, 21.58, 17.78, 14.25, 13.77, 8.61, 0.43, −0.20, −0.39, −0.98 (SiMe2).
29Si NMR (119 MHz, CDCl3) δ (ppm):13.25 (SiMe2), −41.72 (Si(OMe)3, −108.99 (core).
1H NMR (600 MHz, CDCl3) δ (ppm): 6.82–6.67 (m, 9 H, CH2-Ph), 5.50 (s, 3 H, O-H), 3.87 (m, 9 H, Ph-O-CH3), 3.58 (m, 18 H, Si-O-CH3), 2.56 (m, 6 H, CH2-Ph), 1.64 (m, 6 H, CH2-CH2-Ph), 1.28 (m, 36 H, Si-CH2-(CH2)6-CH3) 0.89 (m, 9 H, Si-CH2-(CH2)6-CH3), 0.63 (m, 20 H, Si-CH2) 0.14 (m, 48 H, SiMe2)
13C NMR (151 MHz, CDCl3) δ (ppm): 146.20, 143.49, 137.77, 134.39, 128.95, 128.14, 125.22, 120.92, 114.05, 110.92, 55.73 (Ph-O-CH3), 50.48 (Si-(OMe)3), 39.12, 33.38, 31.89, 29.27, 25.17, 22.90, 22.62, 21.38, 17.60, 17.30, 14.05, 8.40, 0.22, −0.40, −0.42, −1.20 (SiMe2).
29Si NMR (119 MHz, CDCl3) δ (ppm): 12.84 (SiMe2), −41.59 (Si(OMe)3, −108.89 (core).
The UV spectra of spherosilicates were recorded and are depicted in
Figure 5. SSQ1, SSQ2, and SSQ3 exhibit maximum absorbance at 271 nm, which can be attributed to π,π* transition with a molar absorption coefficient in the range of (6–8) × 10
4 M
−1 cm
−1. The absorption band corresponds to conjugated double bonds and the aromatic ring of allyl cinnamate [
27].
In turn, the absorption spectrum of SSQ4 can be attributed to a single electronic transition with an oscillation structure band with λ
max around 281 nm and molar absorption coefficient 1.1 × 10
4 M
−1 cm
−1 (π,π* transition). Similar results were obtained by Foudah et al. [
28]. The absorption band at λ
max at 281 nm corresponded to to the condensed benzene ring system of eugenol [
29].
The density and refractive index were tested for the chemical compounds obtained (
Table 3). The density value for all tested silsesquioxanes ranges from 1.093 to 1.112 g/mL, which is consistent with the data described by Joshi and Bhattacharyya [
30]. Most of the volume is occupied by the functional organic groups, which are located outside the core. Typically, 5% of the volume is taken by the core [
30].
3.2. Characterization of Modified Titanium Dioxide
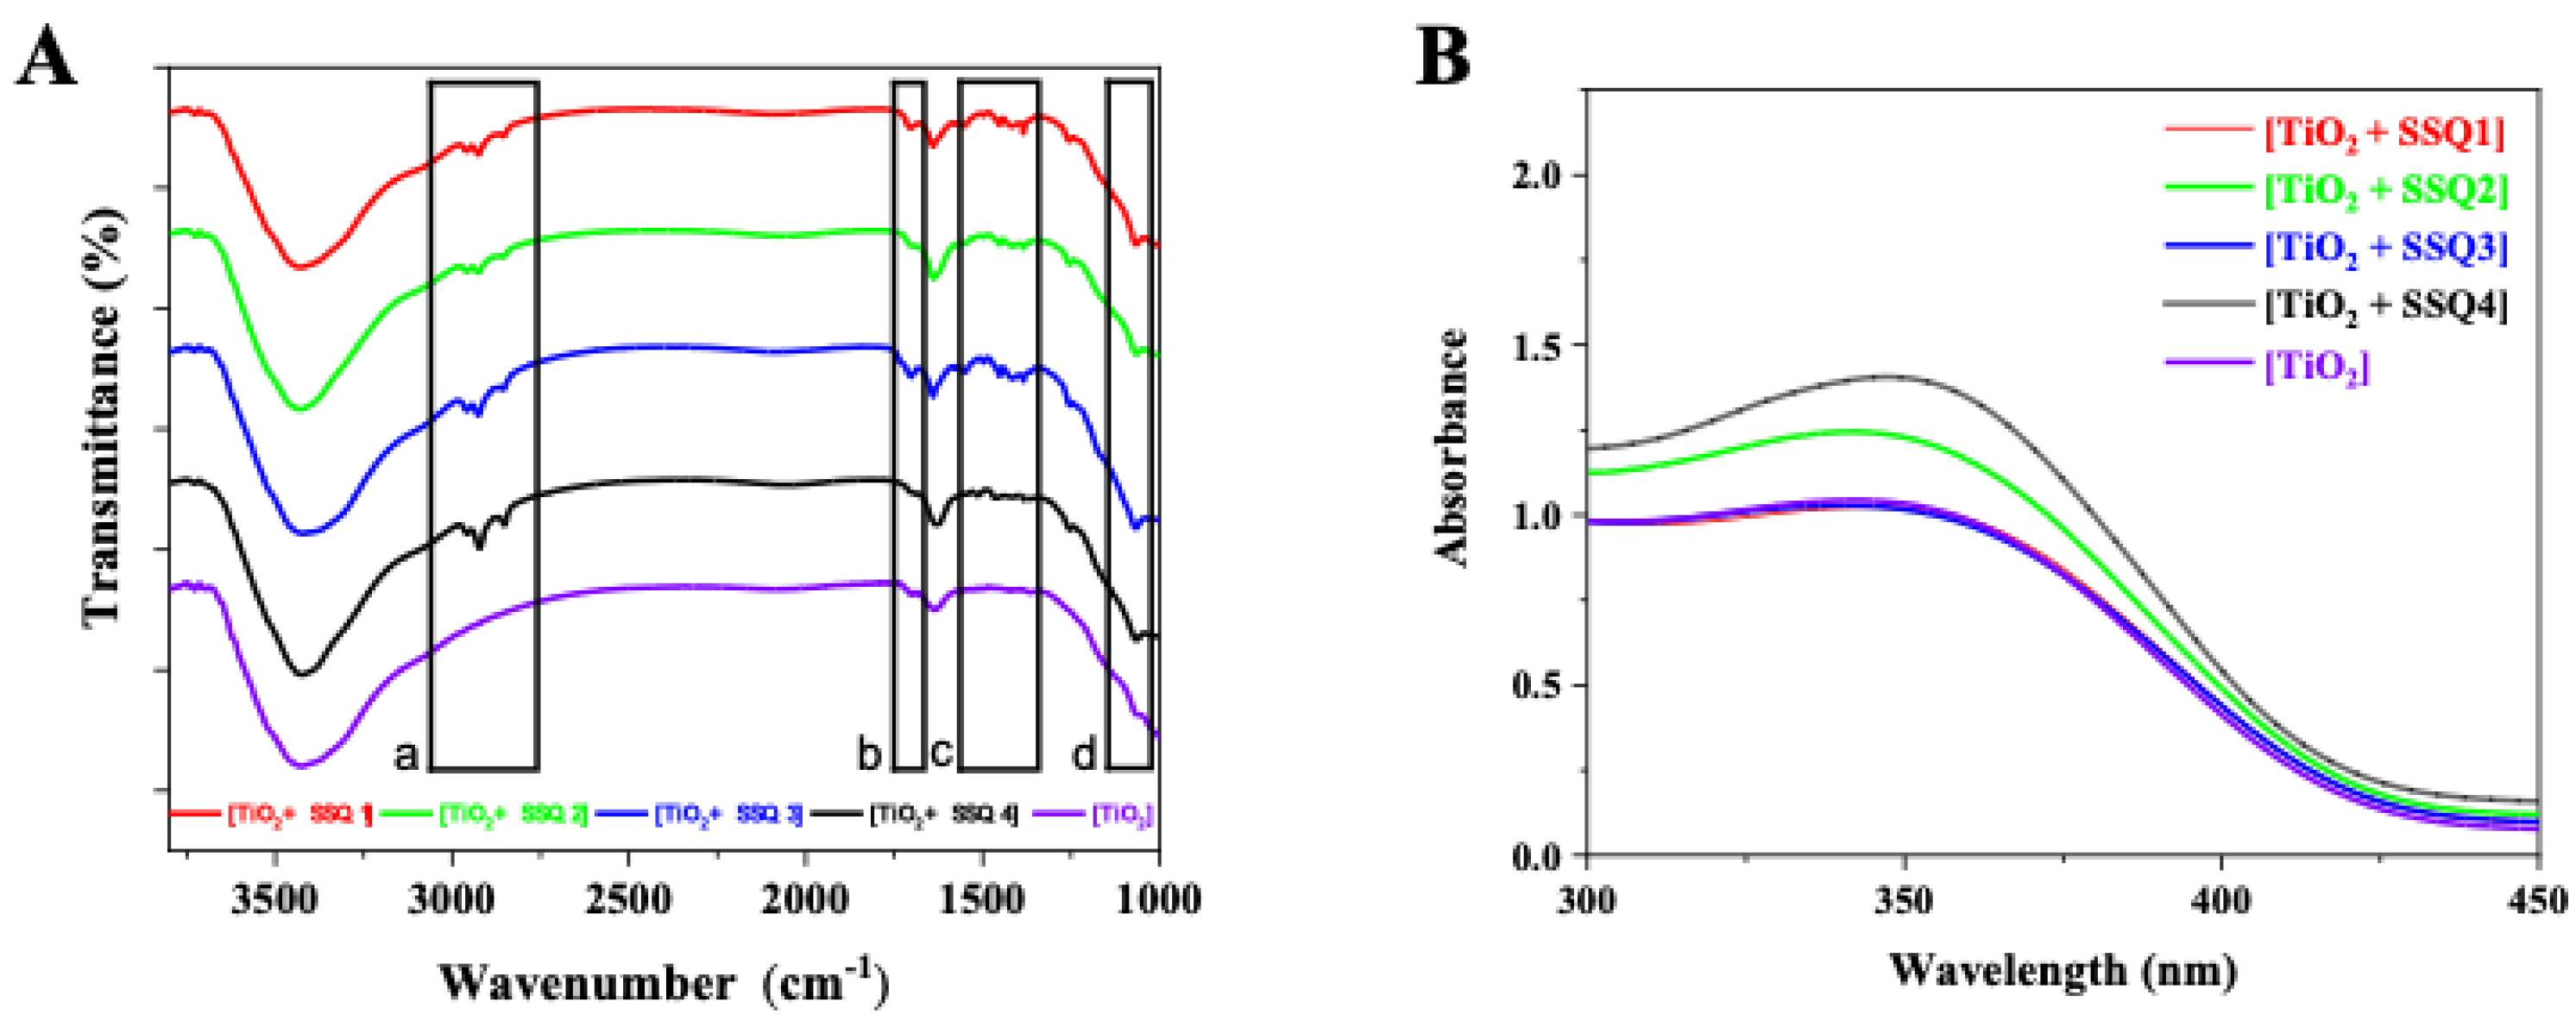
In the FT-IR spectra of the modified titanium dioxides, in addition to the bands characteristic of TiO
2, new signals from the bonds present in the modifiers appeared (
Figure 6). All modified systems showed additional bands in the range of 3000–2700 cm
−1 (a) and 1550–1450 cm
−1 (c) characteristic of unsaturated aliphatic chains, originating from the cinnamate and eugenol groups, as well as signals present in the range of 1100–1000 cm
−1 (d) indicating presence of C-O-C ether bonds. In addition, in the range of 1750–1650 cm
−1 (b), there is a signal coming from the stretching vibrations of ketone groups contained in allyl cinnamate used in modifiers SSQ1–SSQ3. The presence of additional signals in the FT-IR spectrum confirmed the modification of the TiO
2 surface.
In
Figure 6B, the UV-Vis spectra of nonmodified and modified titanium dioxide is presented. All materials absorb light at a wavelength below 400 nm. Similar spectra of pure TiO
2 were recorded by Zhao et al. [
31]. The results proved that all new materials exhibit strong absorption in the ultraviolet region. The modification of titanium dioxide did not shift the absorption maximum to higher wavelengths.
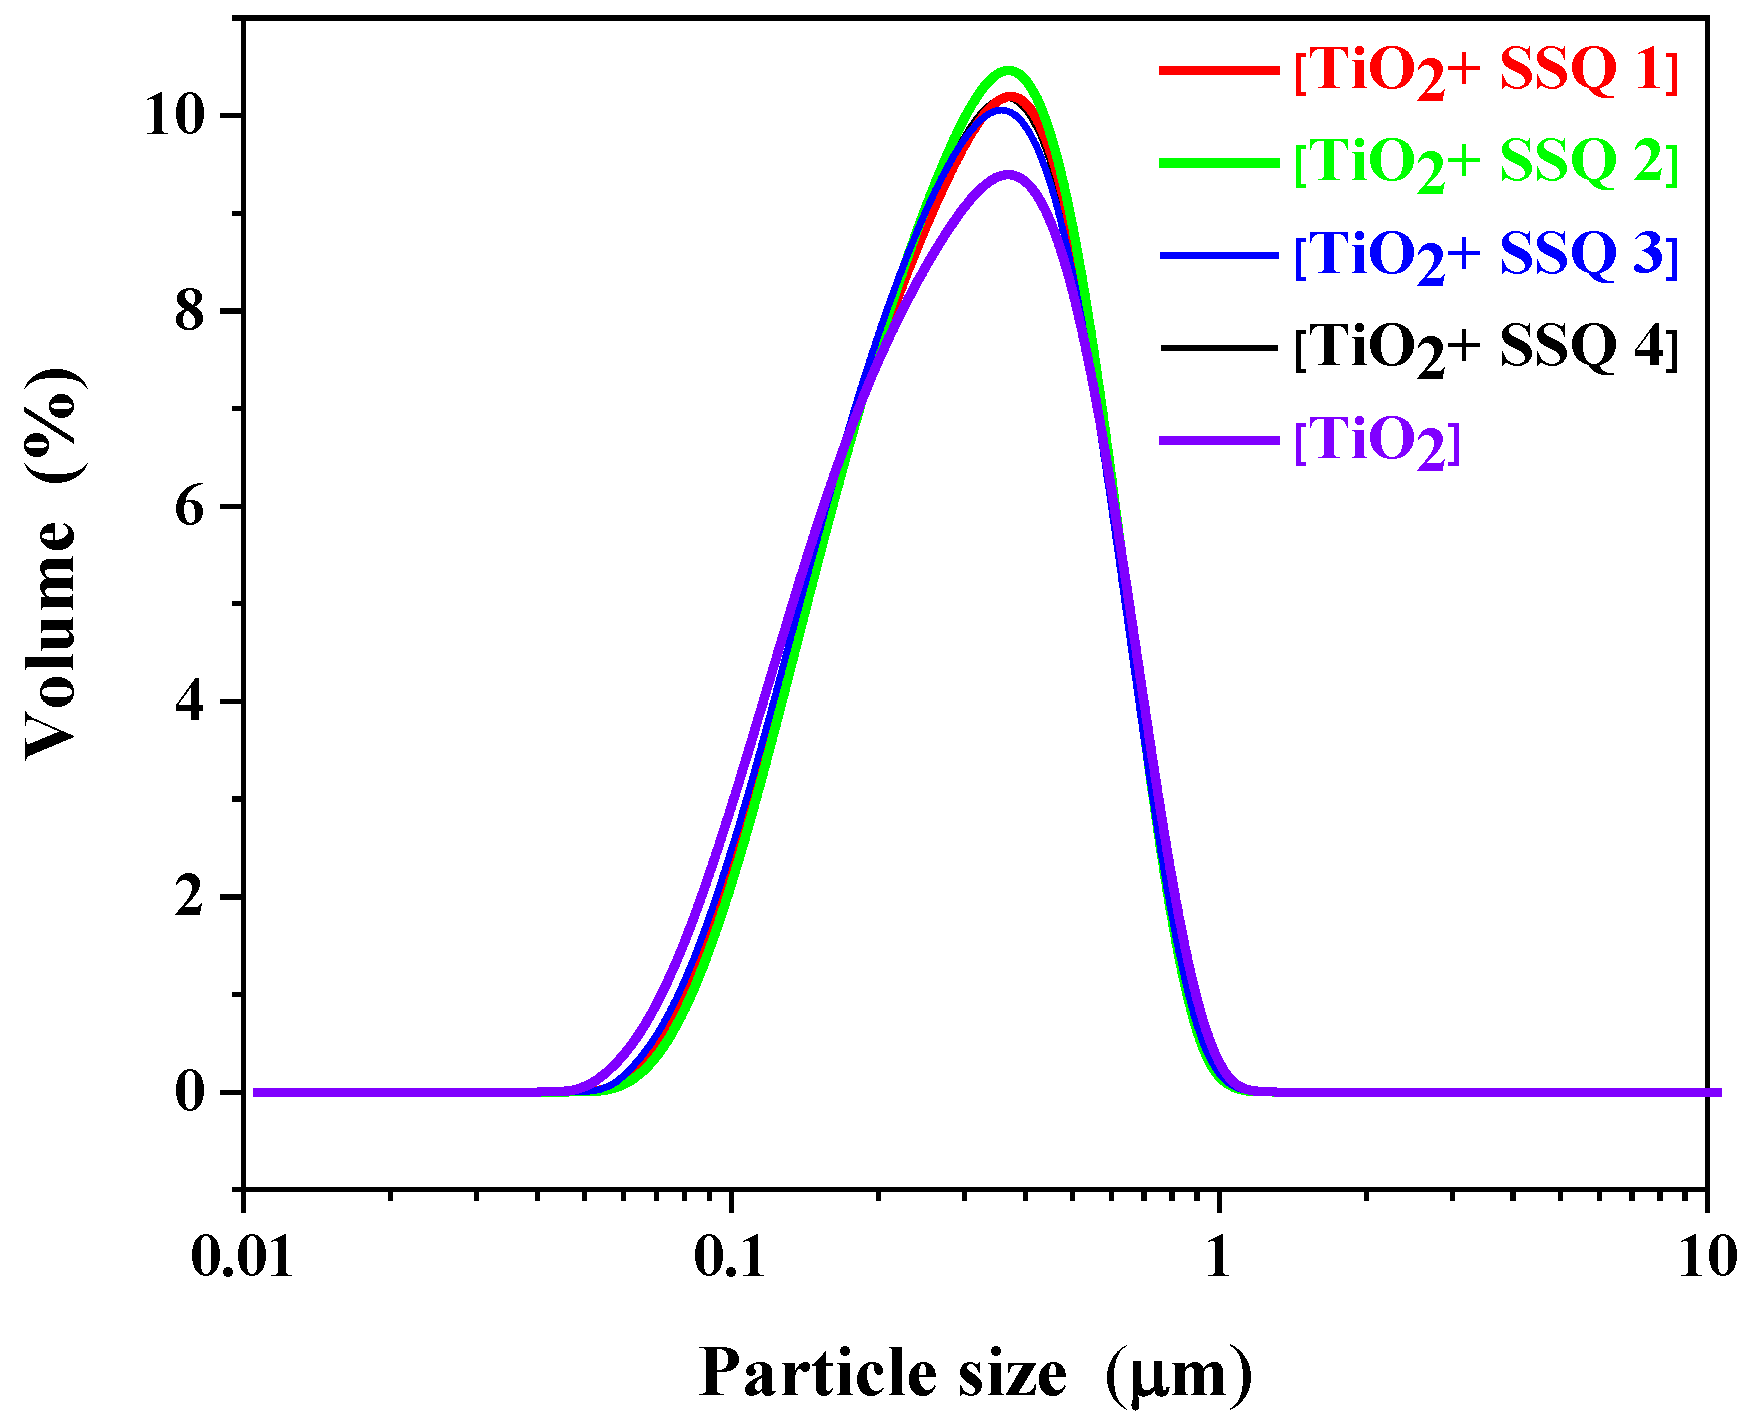
The influence of modifying titanium dioxide with spherosilicates on particle size distribution was also tested. A monomodal particle size distribution between 0.04 and 1.00 μm for titanium dioxide was observed (
Figure 7). These results are in accordance with data recorded by Song et al. [
32]. For all modified materials a monomodal particle size, distribution was also detected, and no significant changes compared to pure titanium dioxide were observed.
Table 4 presents the data in the form of d (0.1), d (0.5), and d (0.9). The obtained results indicated no meaningful effect of the applied modifiers on the variation in the particle size distribution compared to TiO
2.
Table 4 also shows the results of zeta potential of samples obtained. It was proved that the nonmodified TiO
2 suspension had a positive zeta potential value. These results are in accordance with data recorded by Ridley et al. [
33] and Halimi et al. [
34]. The modification of titanium dioxide with SSQs changed the surface charge from positive to negative. It should be highlighted that all suspensions can be considered as stable. Based on the literature data, the dispersion with the ζ potential value higher than ±25 mV is less prone to change their particle size [
35].
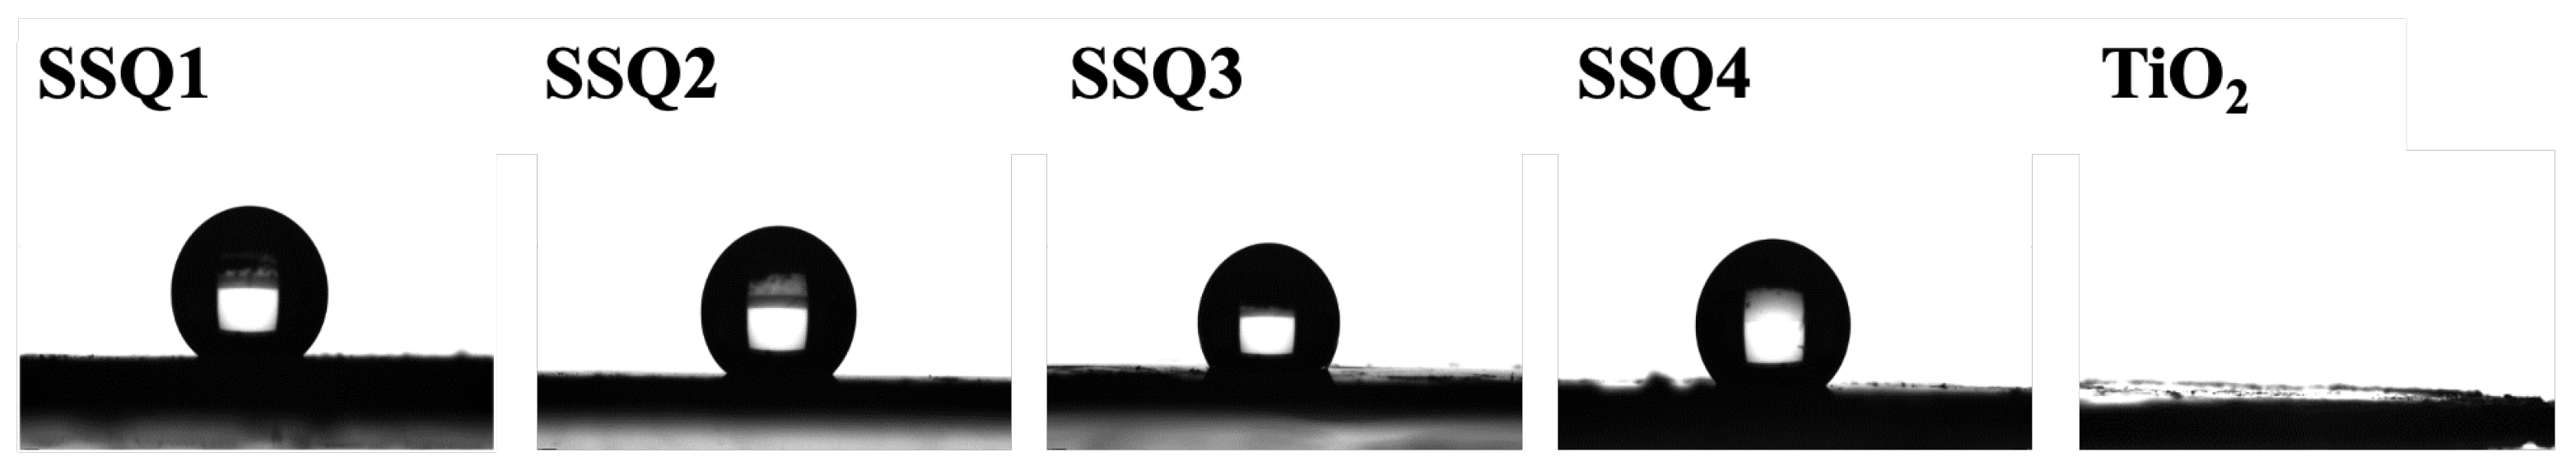
In order to determine the hydrophilic–hydrophobic nature of the TiO2 pigment, water contact angle analysis (WCA) was performed. The study was carried out for unmodified TiO2 as a reference sample, as well as for TiO2 with the addition of SSQ1, SSQ2, SSQ3, and SSQ4 derivatives. For the laboratory test, samples in the form of pellets (load 120 MPa for 3 min.) were prepared. The TiO2 surface has a strongly polar, superhydrophilic character; therefore, the dosed drop was completely absorbed by the tested material (
Figure 8). A similar effect was observed in our previous work [
22]. Modification of the TiO2 surface with organosilicon compounds containing non-polar alkyl groups, i.e., hexyl and octyl groups, and polar groups, e.g., AGE, VTMOS, or DGME changed the character of the surface.
Table 5 presents the values of contact angles for individual derivatives, and in
Figure 8, the results are depicted as images of water droplets during sessile drop analysis. The smallest affinity to water molecules was reported for the SSQ2 sample in which the share of allyl groups is the highest. Other derivatives also showed a strongly hydrophobic character, and the WCA values are in the range of 130–142°.
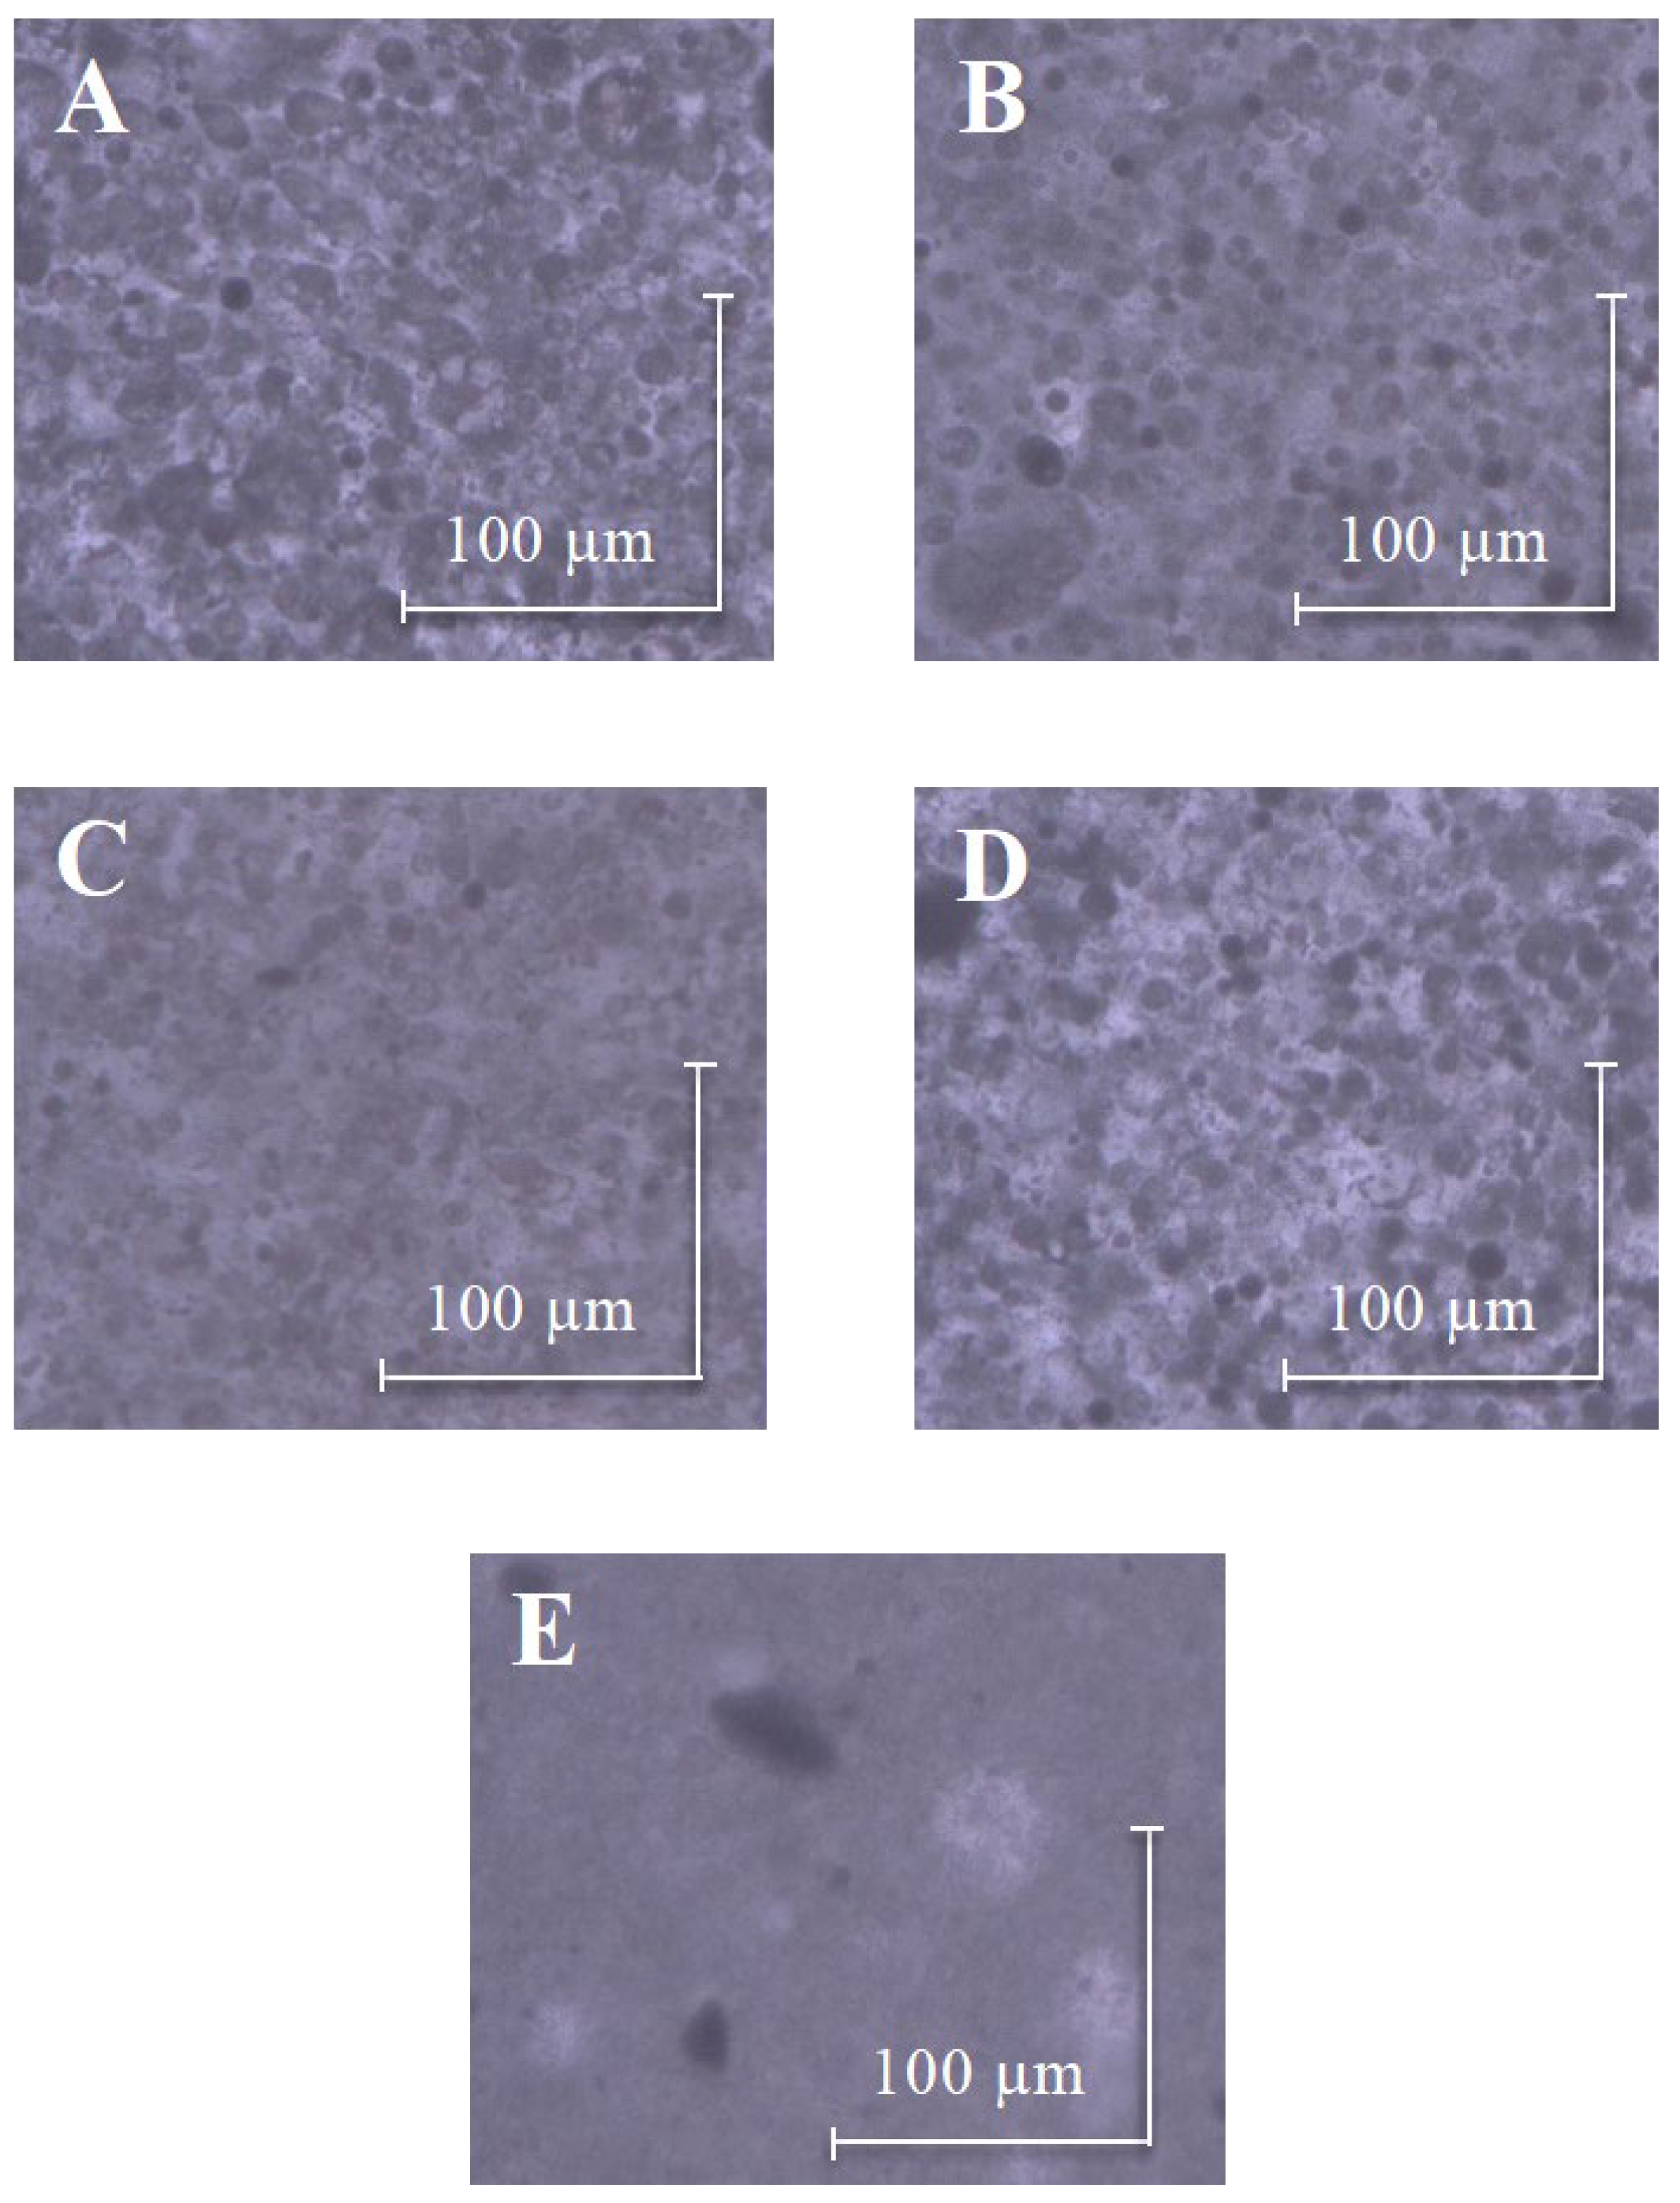
The effect of modifiers on the dispersibility of titanium dioxide in emulsions was studied by an optical microscope. In
Figure 9A–D, presenting the emulsions with modified TiO
2, much smaller droplets were observed compared to formulations containing nonmodified titanium dioxide. In the image of the emulsion with TiO
2 (
Figure 5E), large clusters of undispersed titanium dioxide were detected. Based on the obtained images, it can be concluded that the addition of spherosilicates modifiers improved the dispersion of titanium(IV) oxide in emulsions.
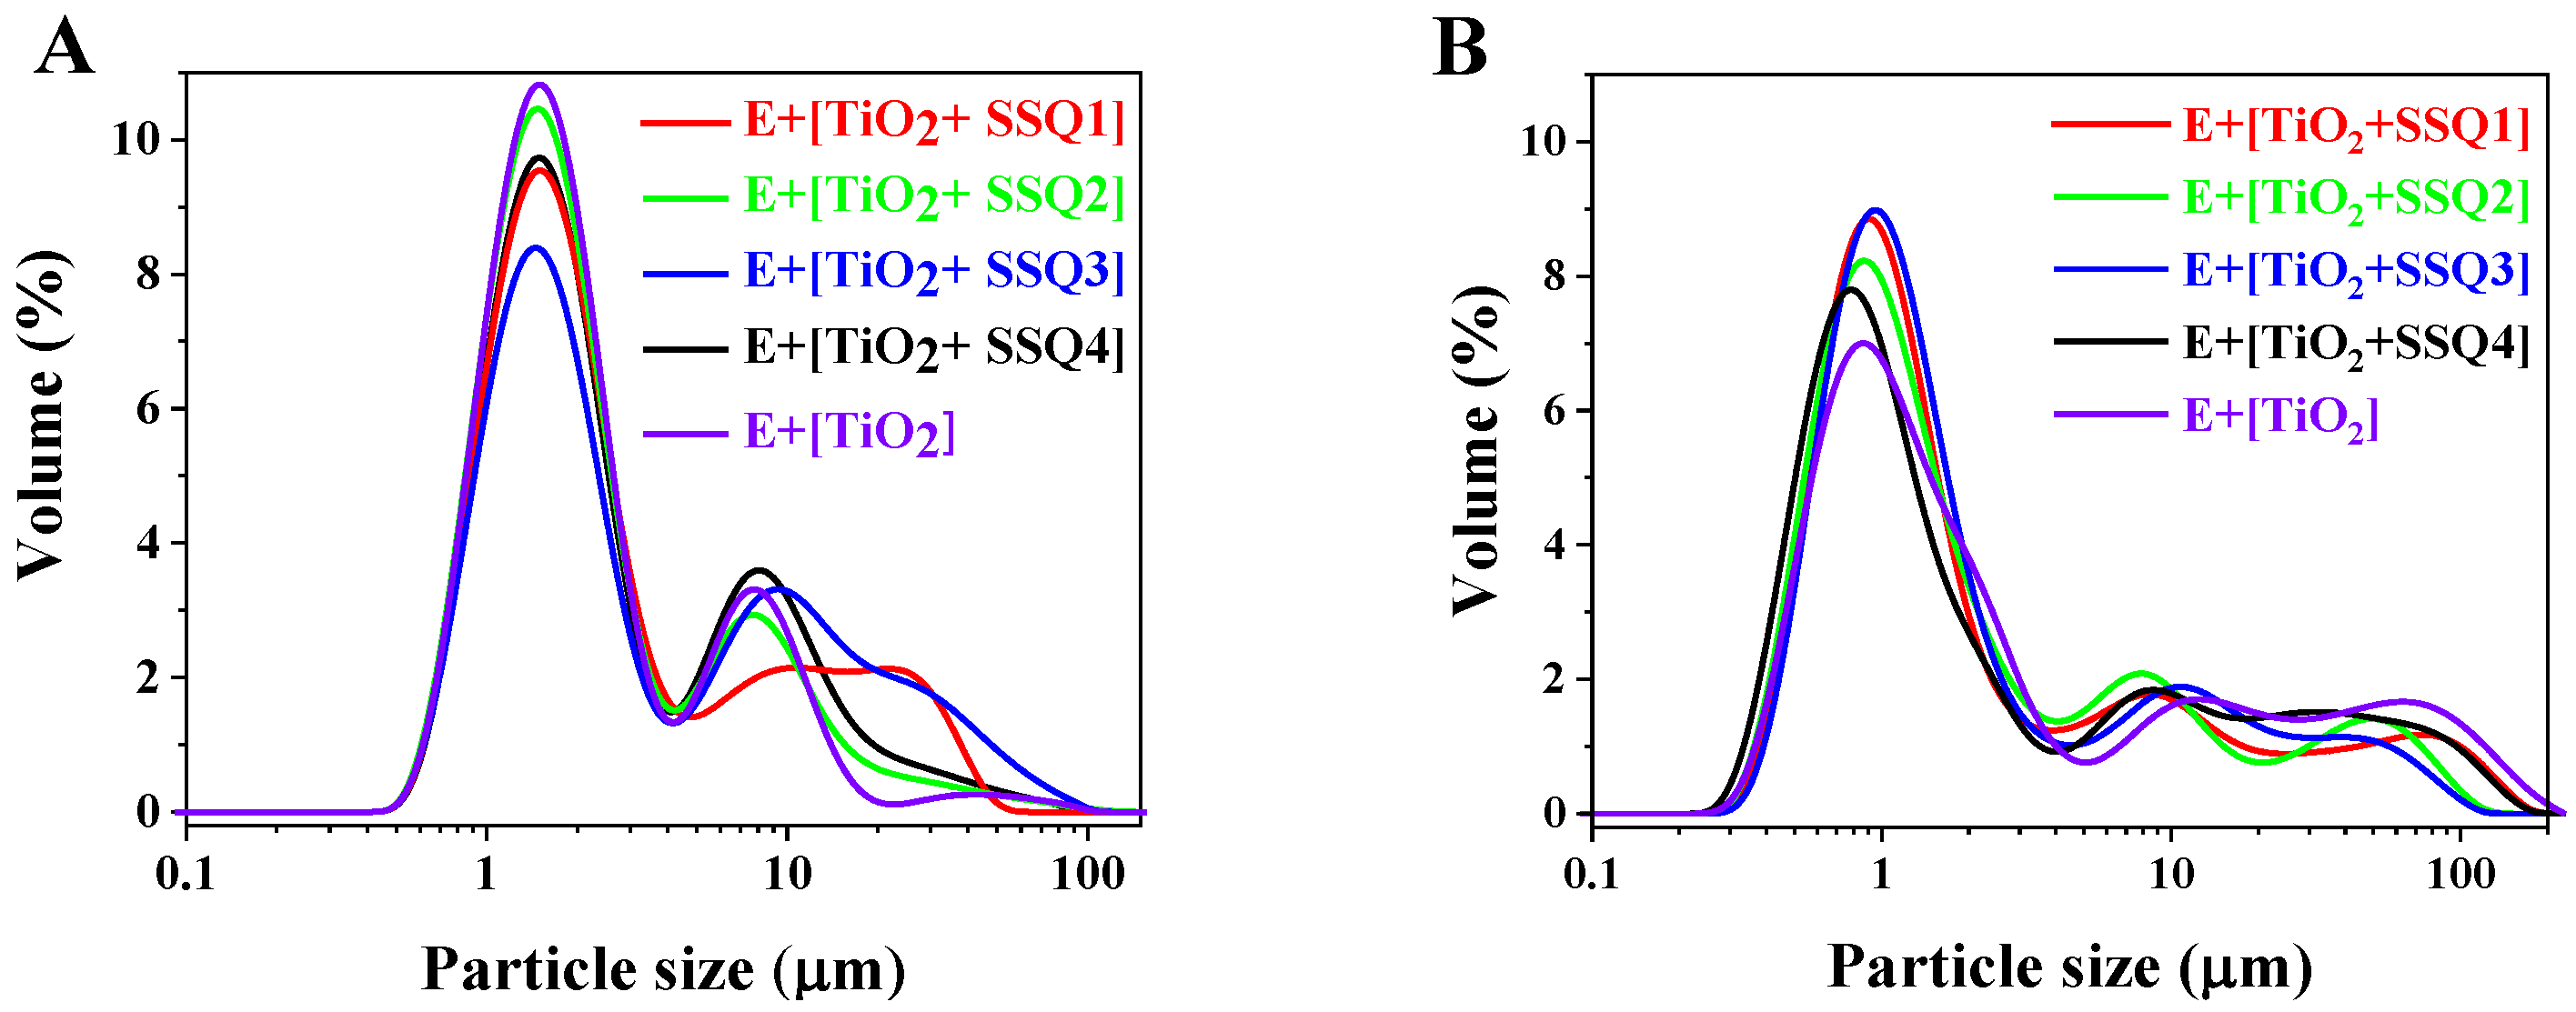
It should be mentioned that particle size distribution might have an impact on the emulsions’ stability [
36]. Therefore, all formulations were subjected to laser diffraction analyses. The results directly after the emulsions’ preparation are presented in
Figure 10A. For all colloidal systems containing modified TiO
2, the bimodal particle size distribution was detected. The predominant peak was identified in the range of 0.7 to 8 μm. In turn, the emulsion with pure titanium dioxide had trimodal particle size distribution. It was observed in
Figure 10B that after 3 months of the emulsions’ storage, the volume fraction of predominant peak decreased, and the particle distribution shifted towards a larger size.
Based on the results presented in
Table 6, it could be concluded that the highest changes in particle size distribution after 3 months were observed for emulsions containing nonmodified titanium dioxide.
Next, the stability of emulsions containing modified and nonmodified titanium dioxide was assessed by multiple light scattering. This method enables to detect any changes occurring in the sample without its dilution. Furthermore, it allows to shorten the aging and development processes of new formulations [
37]. The changes in backscattering profiles were only considered because the samples were non-transparent and, therefore, the transmission signals were imperceptible. The sample is considered as stable when the curves overlap over time. In turn, for unstable emulsions, the changes in backscattering profiles will be detected. Two types of destabilization phenomena can be identified by multiple light scattering such as migration or particle size variation [
38]. When the particles move from the bottom to the top, the creaming process occurs in the samples. In turn, when the movement of particles from the top to the bottom is observed, the sedimentation process takes place. On the other hand, when the variation in particle size occurred known as flocculation, the changes were visible in the backscattering profiles along the whole height of the samples [
39].
Figure 11A–E presents the intensity of backscattered light versus sample height. The data were collected at a certain period for 31 days. The red color represents the first measurement and the blue one, the latest one. It was observed that the level of backscattering intensities for all emulsions obtained was similar and did not change significantly within 31 days. The backscattering profiles overlap over time. Only variations were observed at the top of the sample where the meniscus lowered down slightly, most likely due to an incomplete alignment. There were no significant changes in the stability over 31 days. According to Mengual et al., samples are considered as unstable when the variation of backscattering intensity exceeds 10%.
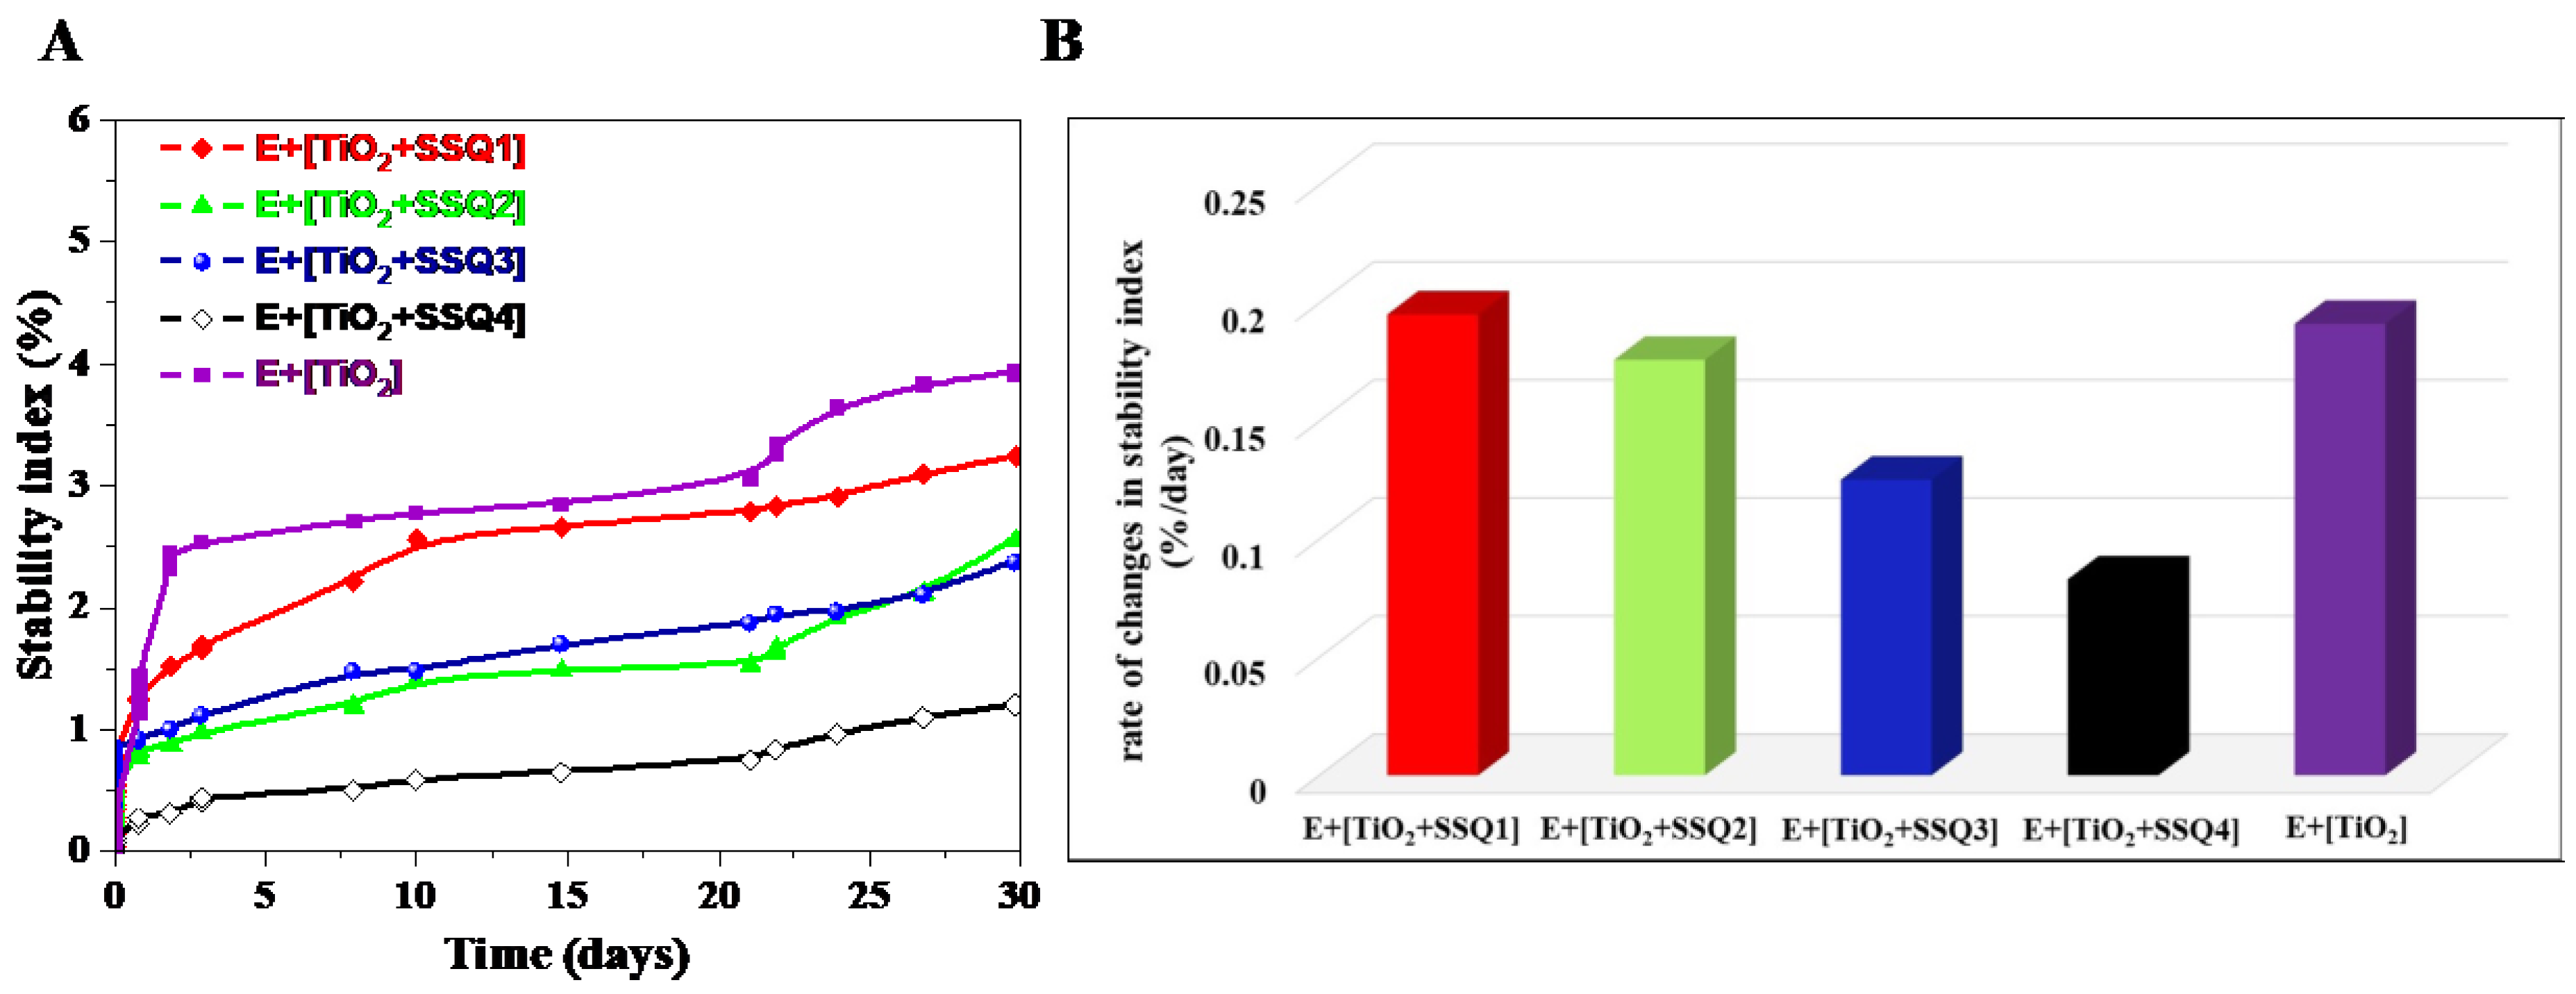
In order to better visualize the changes occurring in samples, the stability index was determined (
Figure 12A). This parameter takes into consideration all the variations in size and concentration occurring in each sample [
40]. It enables to compare the samples and select the most stable one. The lower value of the stability index is the more stable emulsion [
41,
42]. The value of stability index after 31 days of measurements decreased in the following order: E+[TiO
2] (3.9%) > E+[TiO
2+SSQ1] (3.1%) > E+[TiO
2+SSQ2] (2.5%) > E+{TiO
2+SSQ3] (2.4%) > E+[TiO
2+SSQ4] (1%). Furthermore, based on the curves obtained, the rate of changes in the stability index was also determined (
Figure 12B). It can be seen that the slowest variations in the stability index were observed for E+[TiO
2+SSQ4]. Taking the above into consideration, it can be stated that emulsions containing TiO
2 modified with the compound SSQ4 are the most stable. These results proved that the functionalization of titanium oxide increased the emulsion’s stability compared to pure titanium oxide.
This might be caused by the different nature of obtained materials that changed significantly after modification with spherosilicates derivatives (negative zeta potential) in relation with nonmodified TiO
2 (positive zeta potential,
Table 4). The results of zeta potential value may have influence on the stability of emulsions. It was observed that the highest value of zeta potential was observed for TiO
2+SSQ4 and, thus, the emulsion containing this material was the most stable. As it was presented in
Figure 9, the improvement of dispersibility of titanium dioxide by functionalization with selected spherosilicates had an influence on better stabilization of emulsions containing novel materials compared to sample E+[TiO
2]
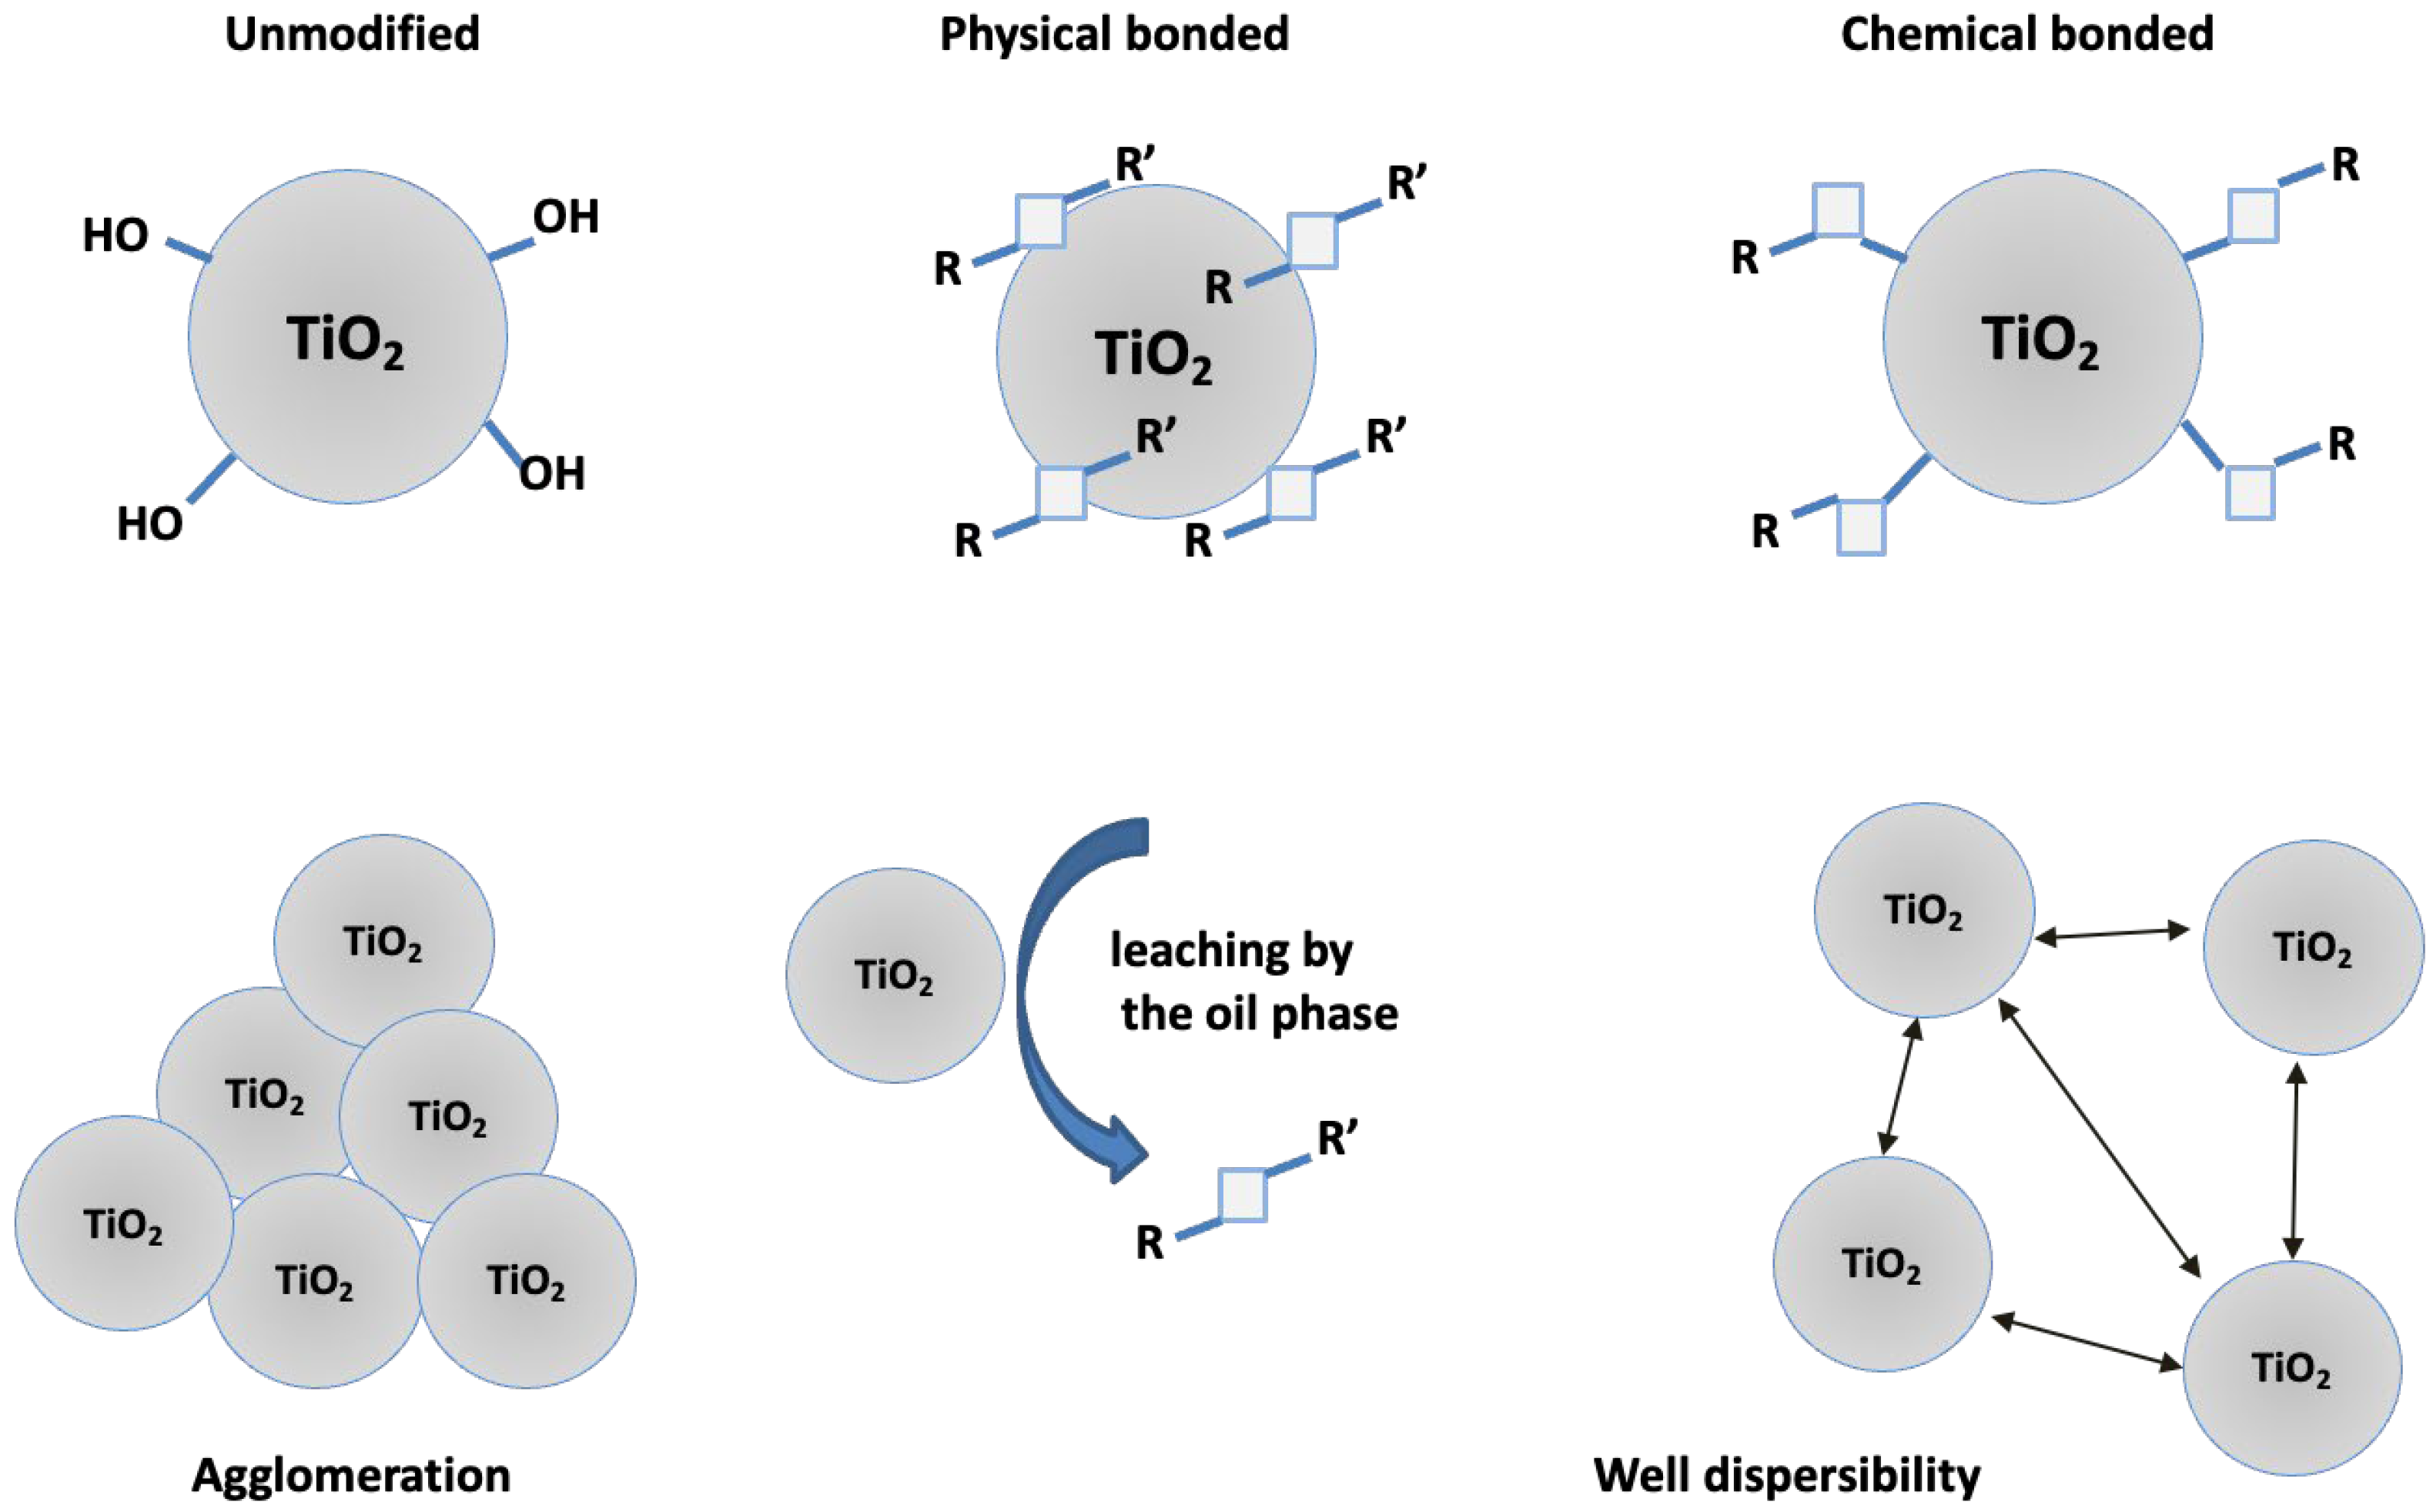
The demonstrated changes in the stability of the emulsion systems are related with two key factors such as the hydrophobic/hydrophilic properties of the modifiers and the covalent bond formed between the modifier and the hydroxyl surface of TiO
2 via trimethoxysilyl groups in SSQ3 & SSQ4. The stability of emulsions containing modifiers that are not bound covalently to titanium dioxide such as SSQ1 and SSQ2 may be disturbed by the diffusion of the modifiers from the surface of TiO
2 to the oil phase (
Figure 13). SSQ1 and SSQ2 do not have in their structure the functional groups capable of forming covalent bonds. In turn, SSQ3 and SSQ4 are composed of a trimethoxysilyl group, which, during the deposition process, is hydrolyzed and condensed with hydroxyl groups located on the TiO
2 surface [
43].


