
Size Effect on the Post-Necking Behaviour of Dual-Phase 800 Steel: Modelling and Experiment


Abstract
:1. Introduction
2. Numerical Setup
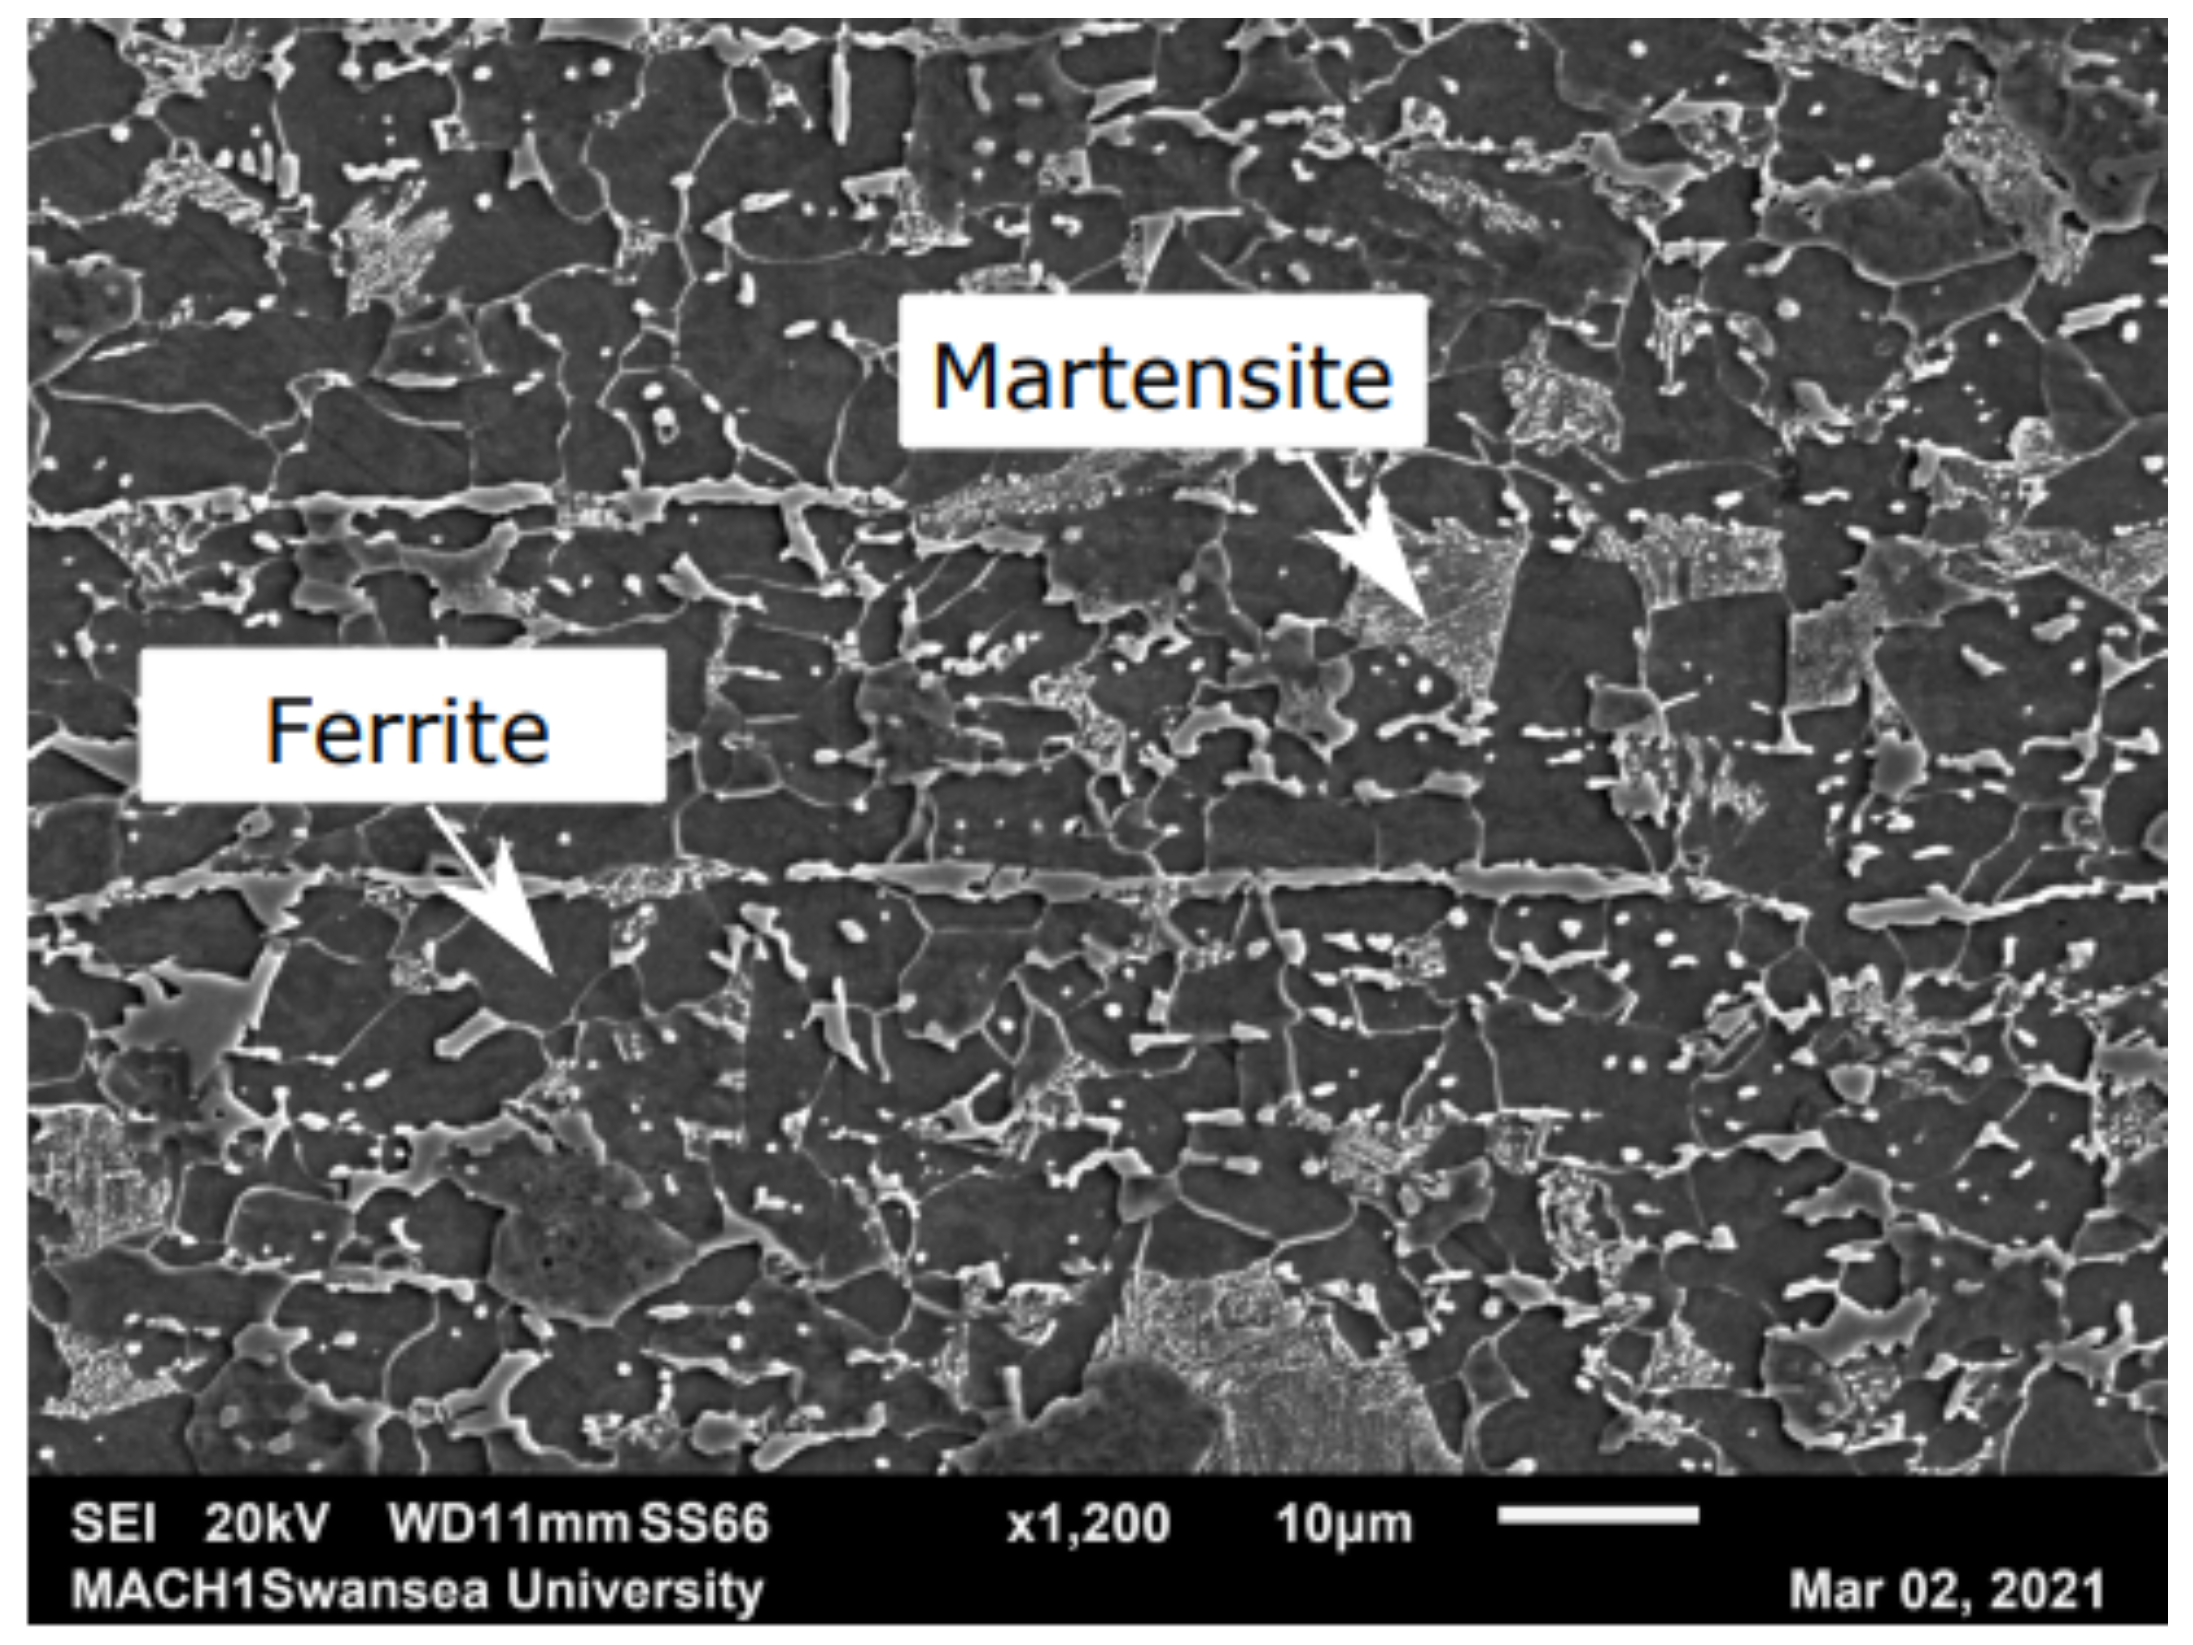
2.1. Materials
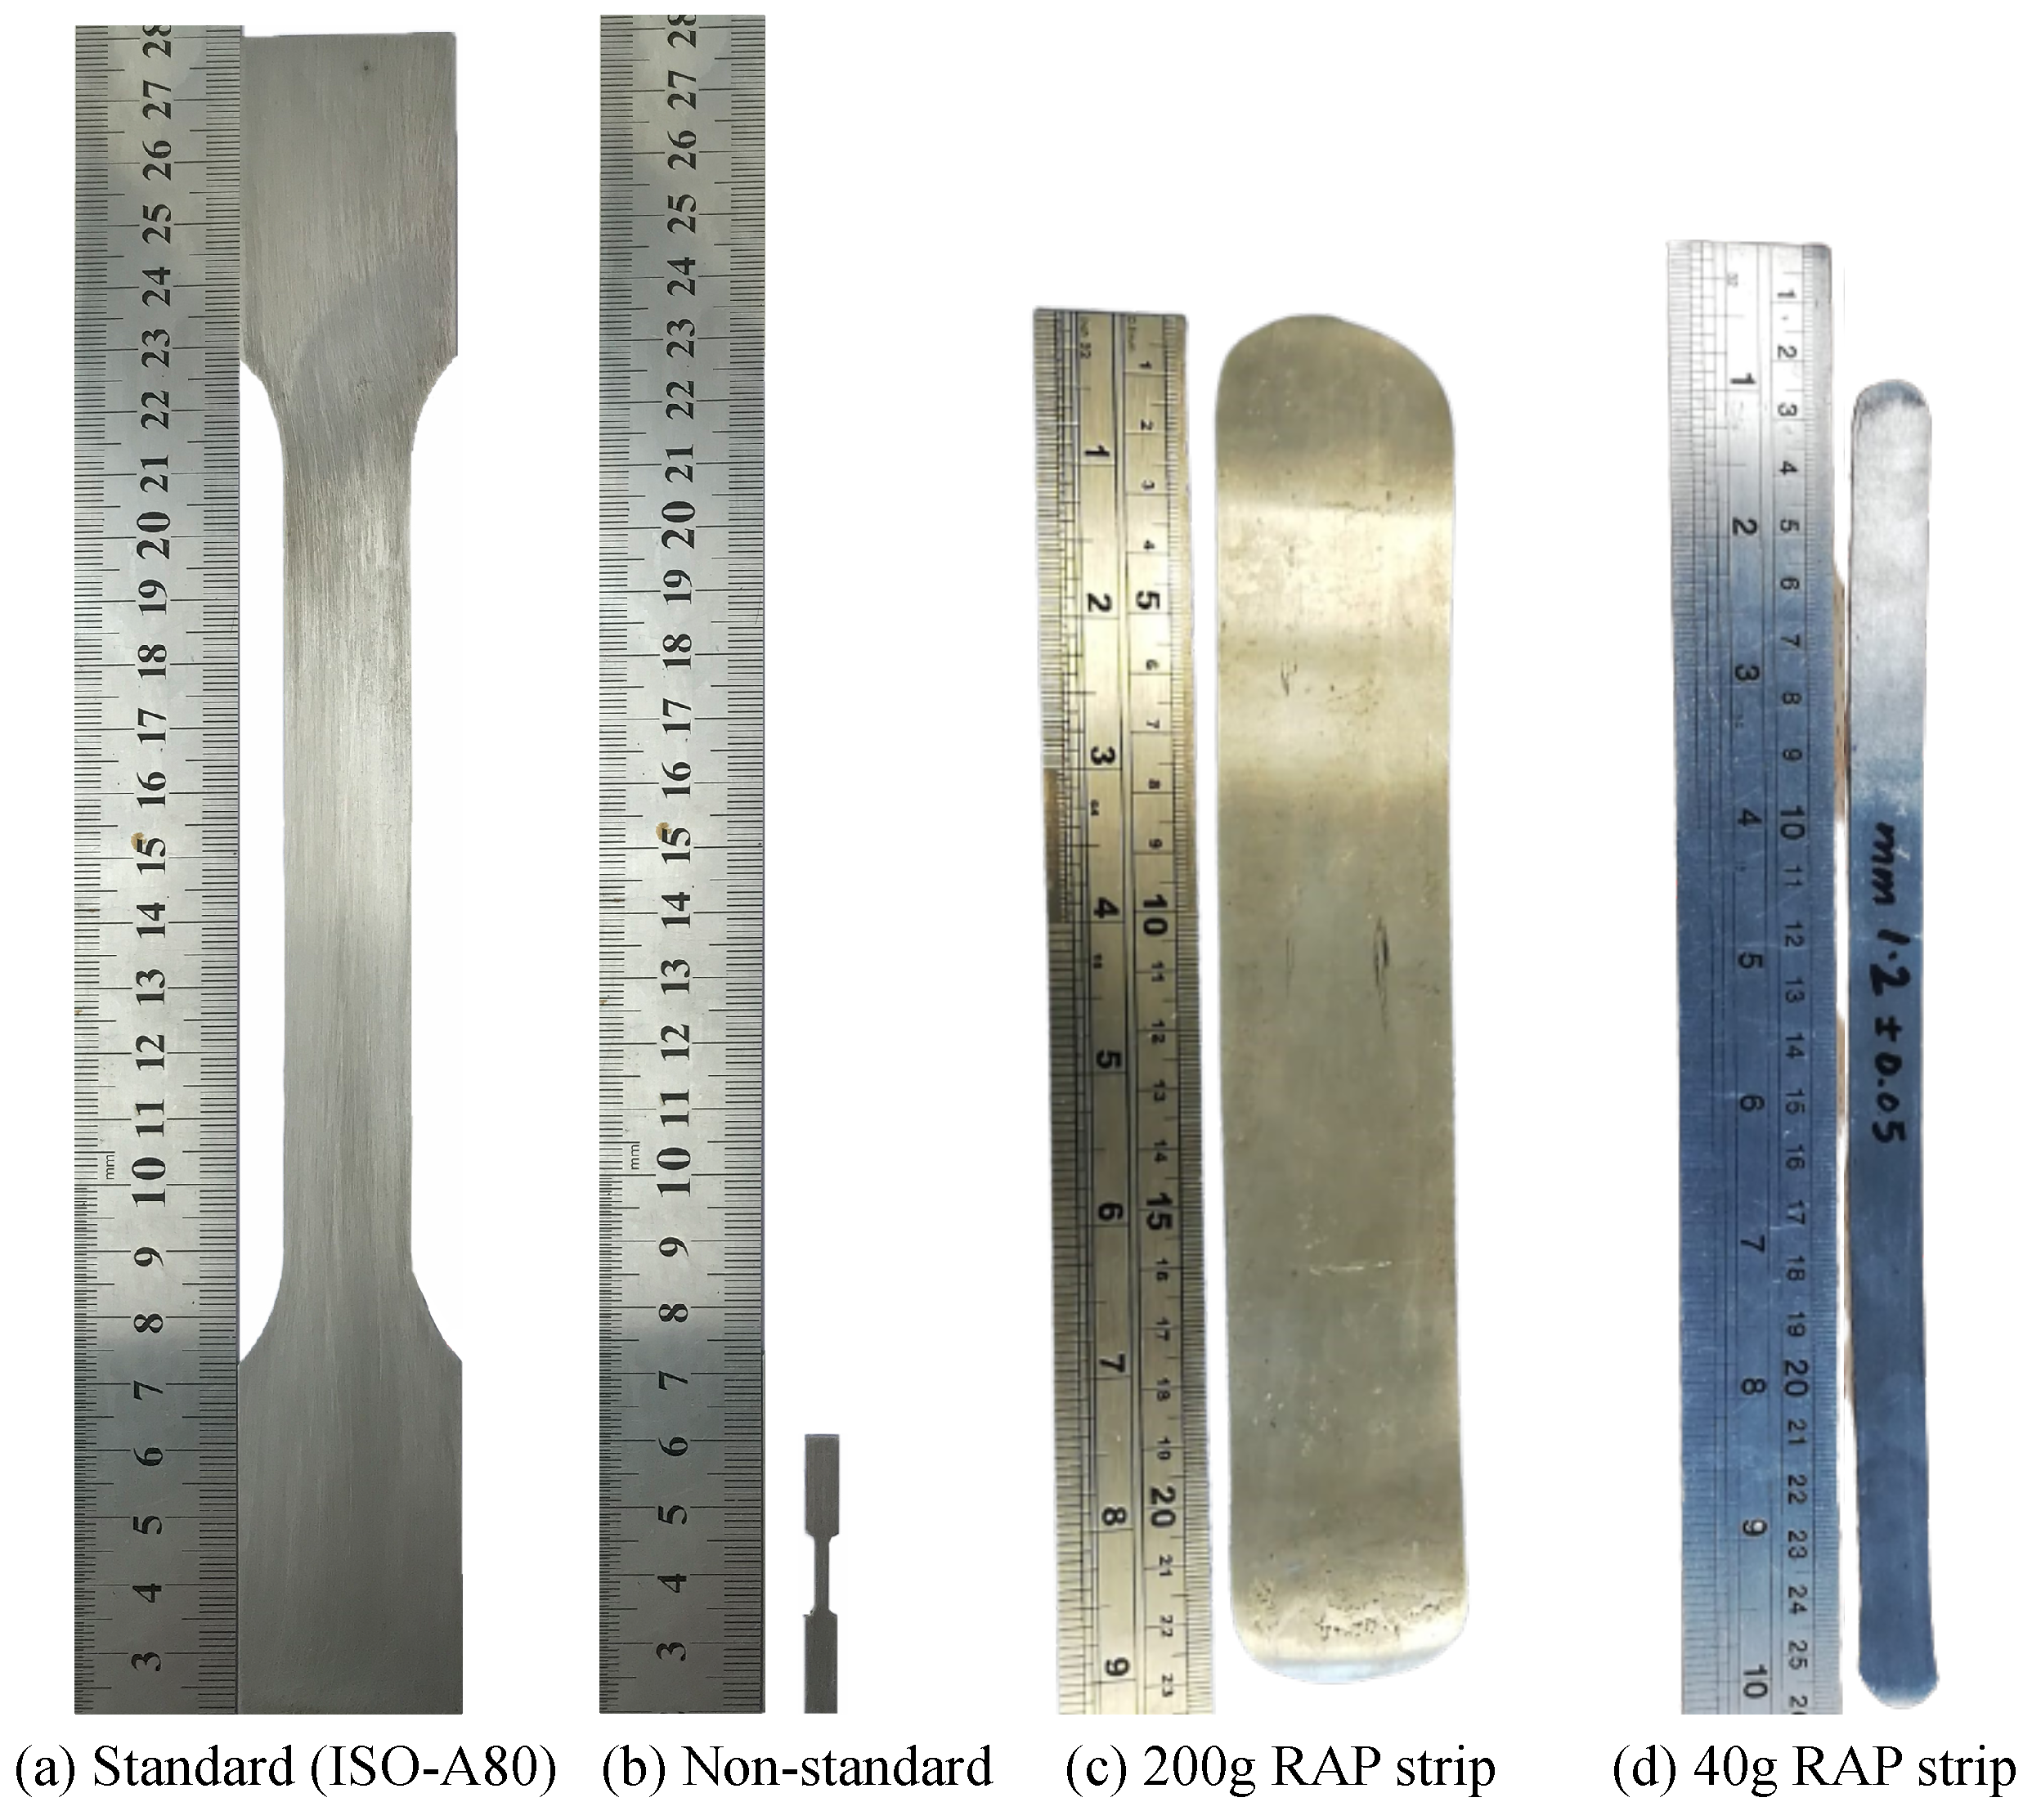
2.2. Geometries
2.3. Numerical Setup
3. Experiment Setup
4. Results and Discussion
4.1. Experimental Results
4.2. Modelling Results
4.2.1. DP800 Damage Model Calibration
4.2.2. AR Effect: Necking and Fracture Strains
4.2.3. AR Effect: Stress Triaxiality Evolution
4.2.4. AR Effect: Necking Modes
4.2.5. Fracture Angle
5. Conclusions and Future Work
- 1.
- The variation in the R-value with the orientation to the loading direction followed a similar trend as in previous studies: for all standard tensile bars. Although there was some variation between the different specimen sizes, no clear trend was observed, and the differences were minimal. This is likely due to slight differences in the microstructure as a result of different thermomechanical processing.
- 2.
- A good correlation could be found between the predicted and experimentally observed UTS and total elongation; however, the drop in stress during the post-necking period was difficult to capture. This is likely due to the progressive failure of the material, which is not well captured by the model.
- 3.
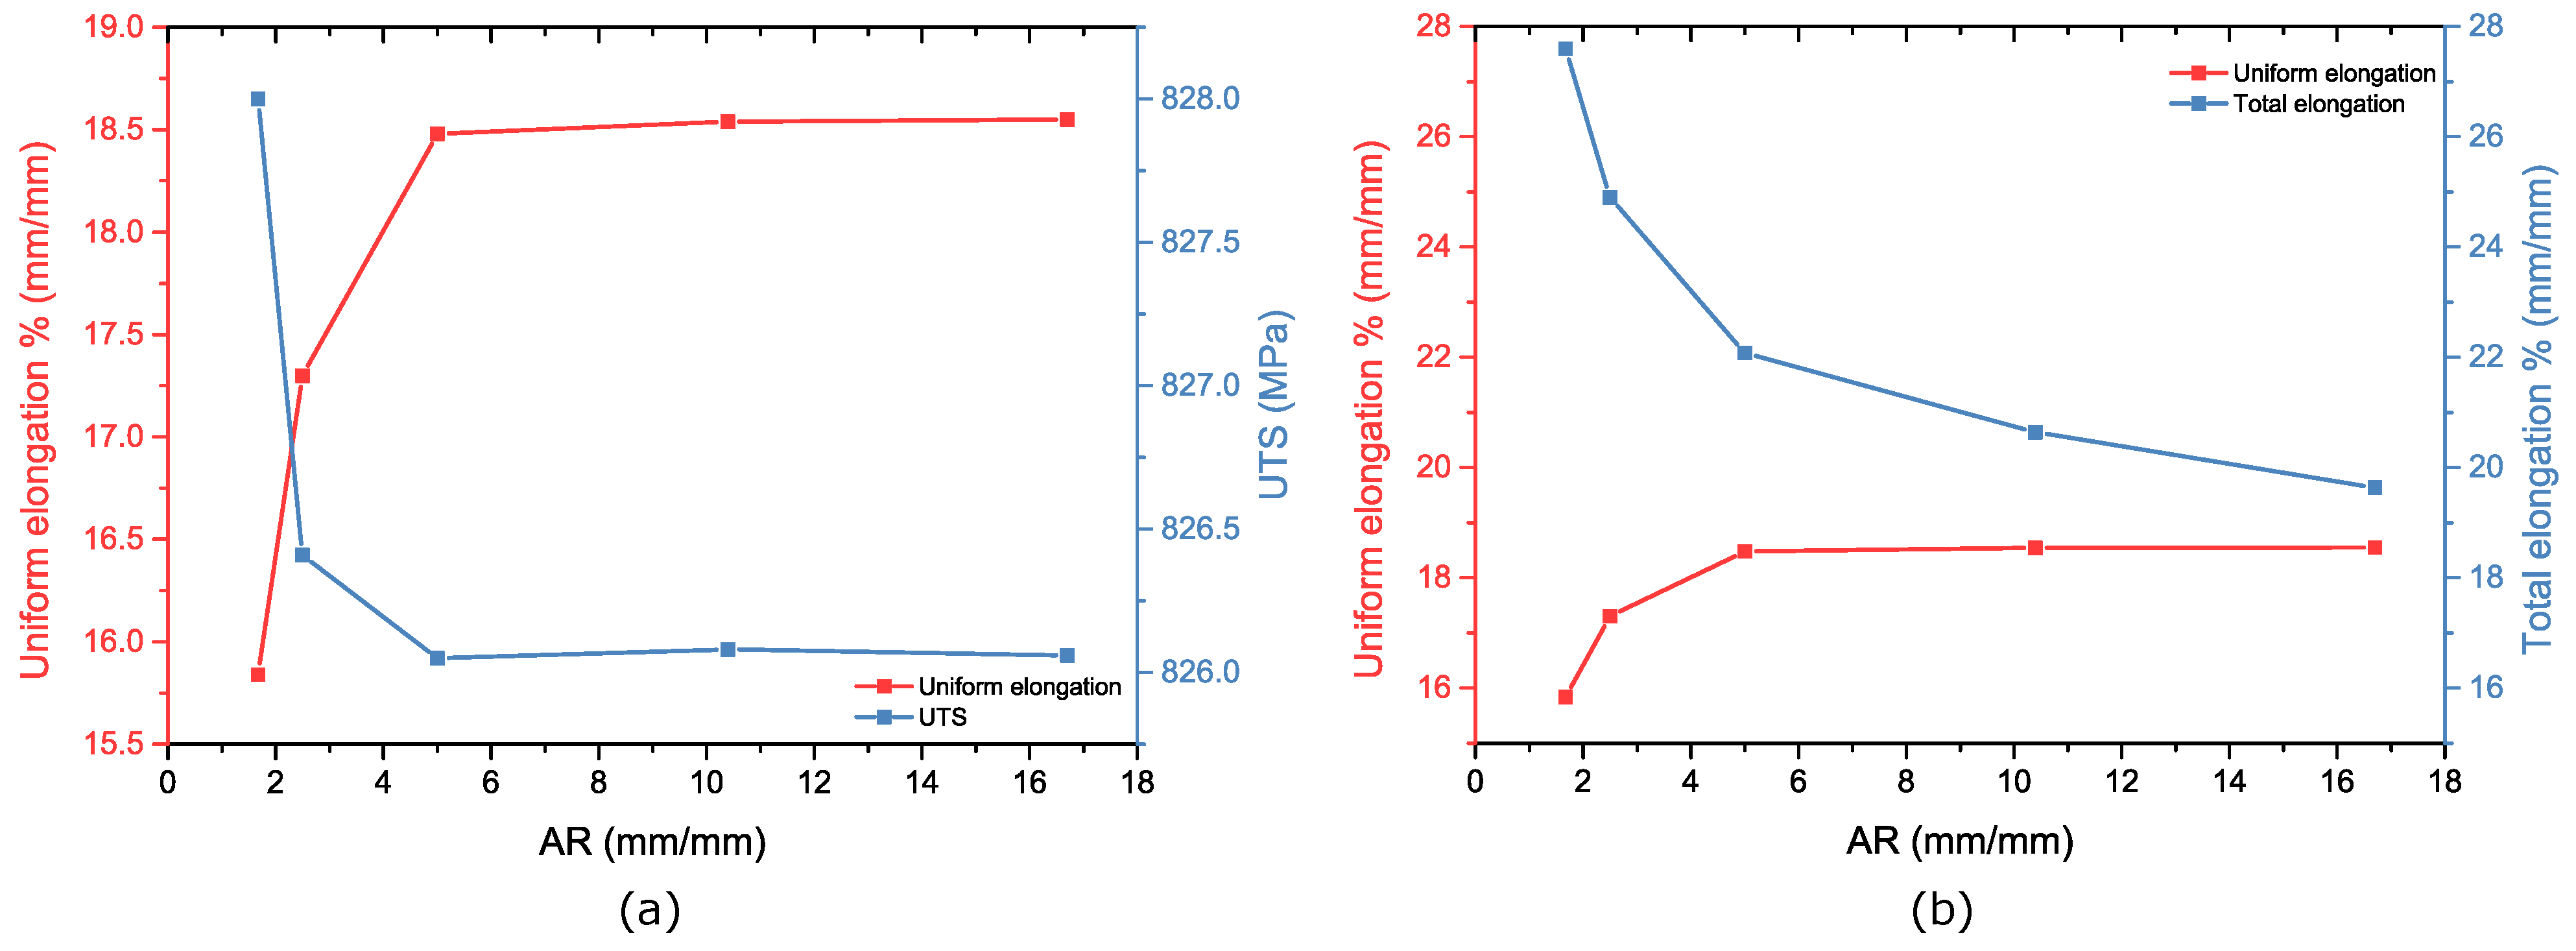
- The stress triaxiality at the notch increased earliest for the specimens with the lowest AR. The triaxiality increased later for the specimens with a larger aspect ratio (the ratio of parallel width to thickness, AR) value, but this triaxiality then increased more rapidly. This is due to the higher constraint of strain in the width direction for larger ARs, which results in a higher hydrostatic stress and, hence, a higher triaxiality.
- 4.
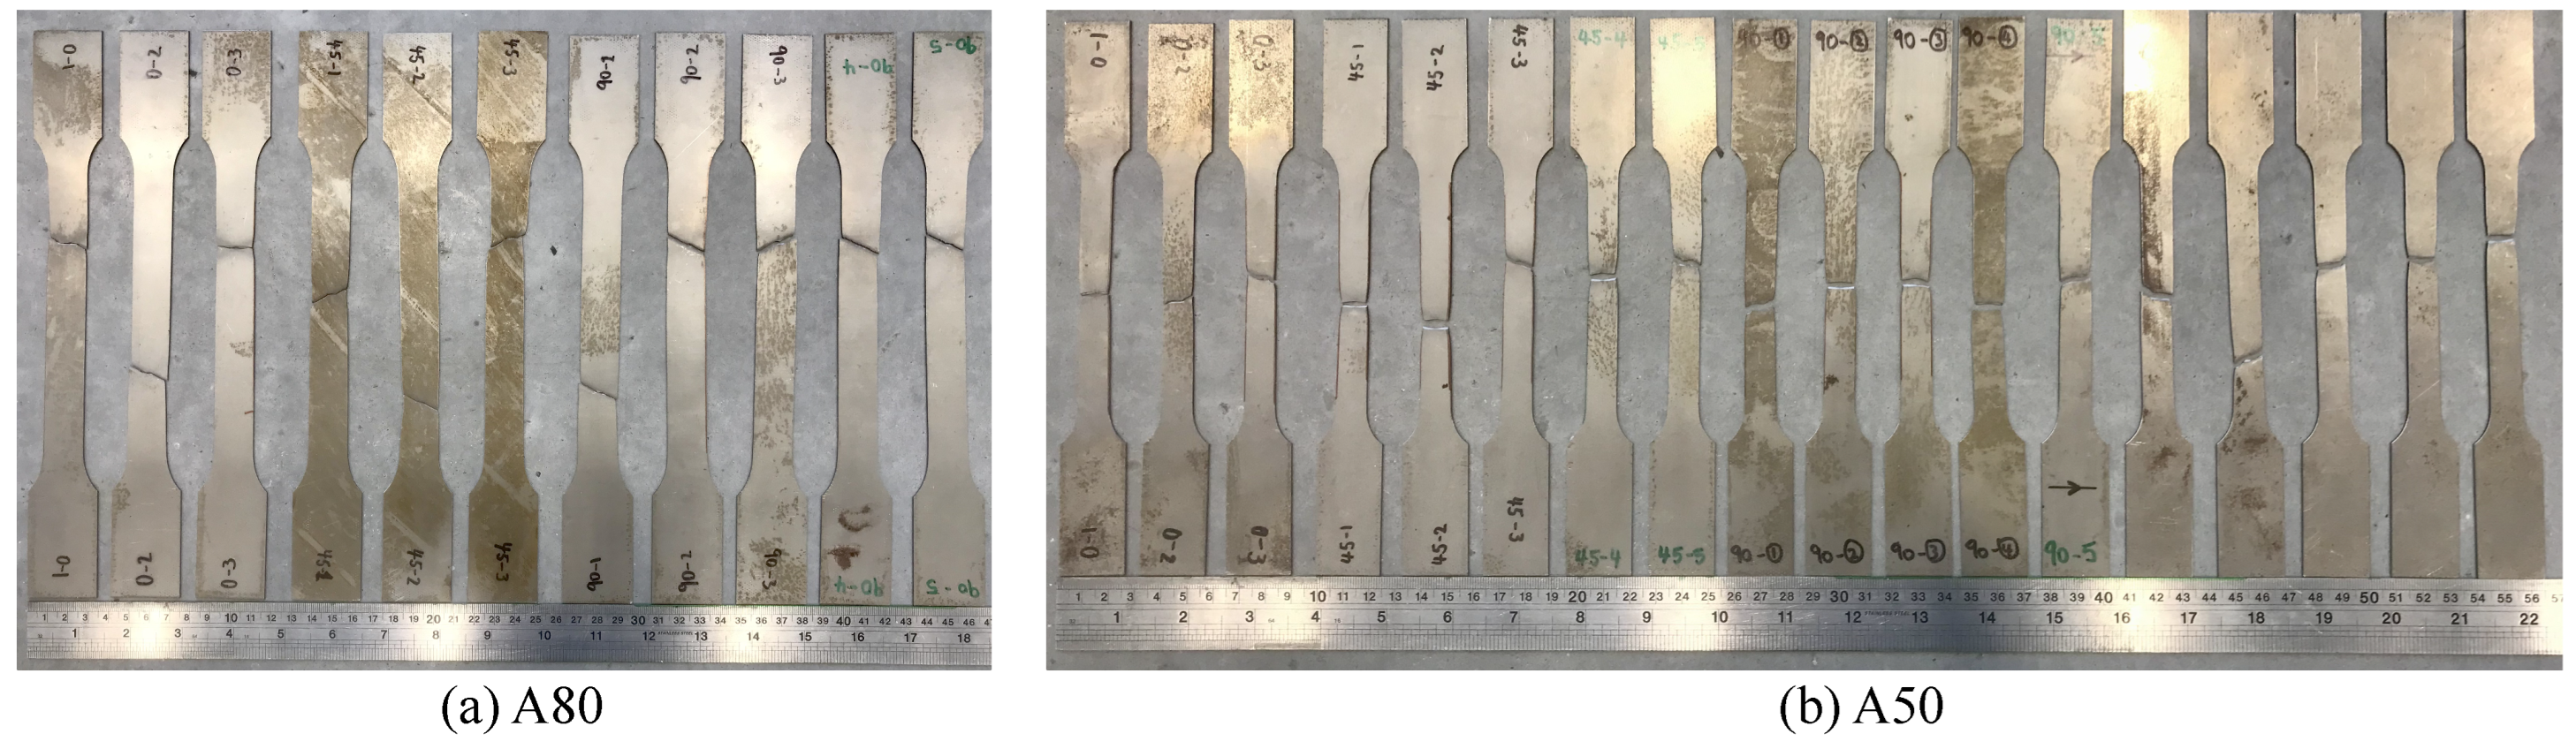
- The fracture angle and dominant necking modes are dependent on the AR. The standard A80 test piece exhibited a fracture angle of (localised necking dominant), whereas smaller specimens with a low AR exhibited fractures perpendicular to the loading direction (diffused necking dominant).
Author Contributions
Funding
Institutional Review Board Statement
Informed Consent Statement
Data Availability Statement
Acknowledgments
Conflicts of Interest
References
- Lesch, C.; Kwiaton, N.; Klose, F.B. Advanced High Strength Steels (AHSS) for Automotive Applications-Tailored Properties by Smart Microstructure Adjustment. Steel Res. Int. 2017, 88, 1700210. [Google Scholar] [CrossRef]
- Yu, X. Optimisation of the Microstructure and Mechanical Properties of DP800 Strip Steel. Master’s Thesis, Swansea University, Swansea, UK, 2005. [Google Scholar]
- Hong, S.C.; Lee, K.S. Influence o f deformation induced ferrite transformation on grain refinement of dual phase steel. Mater. Sci. Eng. Struct. Mater. Microstruct. Process. 2002, 323, 148–159. [Google Scholar]
- Bollo, B.; Jarmai, K. Vehicle and Automotive Engineering, Proceedings of the JK2016, Miskolc, Hungary; Springer International Publishing AG: Cham, Switzerland, 2017; pp. 407–423. [Google Scholar]
- Tasan, C.C.; Diehl, M.; Yan, D.; Bechtold, M.; Roters, F.; Schemmann, L.; Zheng, C.; Peranio, N.; Ponge, D.; Koyama, M.; et al. An Overview of Dual-Phase Steels: Advances in Microstructure-Oriented Processing and Micromechanically Guided Design. Annu. Rev. Mater. Res. 2015, 45, 391–431. [Google Scholar]
- Farrugia, D.; Brown, S.; Lavery, N.P.; Cameron, P.; Davis, C. Rapid Alloy Prototyping for a range of strip related advanced steel grades. Procedia Manuf. 2020, 50, 784–790. [Google Scholar]
- BSI British Standards. Metallic Materials—Tensile Testing Part 1: Method of Test at Ambient Temperature; BSI British Standards: London, UK, 2009. [Google Scholar]
- Zhang, L.; Harrison, W.; Yar, M.A.; Brown, S.G.R.; Lavery, N.P. The development of miniature tensile specimens with non-standard aspect and slimness ratios for rapid alloy prototyping processes. J. Mater. Res. Technol. 2021, 15, 1830–1843. [Google Scholar]
- Kohyama, A.; Hamada, K.; Matsui, H. Specimen size effects on tensile properties of neutron irradiated steels. J. Nucl. Mater. 1991, 417, 417–420. [Google Scholar]
- Tvergaard, V. Necking in tensile bars with rectangular cross-section. Comput. Methods Appl. Mech. Eng. 1993, 103, 273–290. [Google Scholar]
- McClintock, F.A.; Zheng, Z.M. Ductile fracture before localized necking in a strip under tension. Int. J. Fract. 1993, 64, 191–200. [Google Scholar]
- Mikkelsen, L.P. Post-necking behaviour modelled by a gradient dependent plasticity theory. Int. J. Solids Struct. 1997, 34, 4531–4546. [Google Scholar]
- Mikkelsen, L.P. Necking in rectangular tensile bars approximated by a 2-D gradient dependent plasticity model. Eur. J. Mech. A/Solids 1999, 18, 805–818. [Google Scholar]
- Kwame, J.S.; Yakushina, E.; Blackwell, P. Examining Failure Behaviour of Commercially Pure Titanium During Tensile Deformation and Hole Expansion Test. J. Mater. Appl. 2020, 9, 32–37. [Google Scholar]
- ASTM International. Standard Test Methods for Tension Testing of Metallic Materials; ASTM International: West Conshohocken, PA, USA, 2013. [Google Scholar]
- Appuhamy, J.M.R.S.; Ohga, M.; Kaita, T.; Fujii, K.; Dissanayake, P.B.R. Development of Analytical Method for Predicting Residual Mechanical Properties of Corroded Steel Plates. Int. J. Corros. 2011, 2011, 385083. [Google Scholar] [CrossRef]
- Johnson, G.R.; Cook, W.H. A constitutive model and data for metals subjected to large strains, high strain rates and high temperatures. In Proceedings of the 7th International Symposium on Ballistics, The Hague, The Netherlands, 19–21 April 1983; pp. 541–547. [Google Scholar]
- Cadoni, E.; Singh, N.; Forni, D.; Singha, M.K.; Gupta, N.K. Strain rate effects on the mechanical behavior of two Dual Phase steels in tension. Eur. Phys. J. Spec. Top. 2016, 225, 409–421. [Google Scholar] [CrossRef]
- Hill, R. A theory of the yielding and plastic flow flow of anisotropic metals. Proceedings of the Royal Society of London. Ser. A Math. Phys. Sci. 1948, 1033, 281–297. [Google Scholar]
- Dassault Systemes Simulia Corp, Abaqus/CAE User’s Manual; Dassault Systemes Simulia Corp: Providence, RI, USA, 2014.
- Hillerborg, A.; Modeer, M.; Petersson, P.E. Analysis of crack formation and crack growth in concrete by means of fracture mechanics and finite elements. Cem. Concr. Res. 1976, 6, 773–781. [Google Scholar] [CrossRef]
- Thamburaja, P.; Sarah, K.; Srinivasa, A.; Reddy, N. Fracture of viscoelastic materials: FEM implementation of a non-local & rate form-based finite-deformation constitutive theory. Comput. Methods Appl. Mech. Eng. 2019, 354, 871–903. [Google Scholar]
- Sarah, K.; Thamburaja, P.; Srinivasa, A.; Reddy, N. Numerical simulations of damage and fracture in viscoelastic solids using a nonlocal fracture criterion. Mech. Adv. Mater. Struct. 2020, 27, 1085–1097. [Google Scholar]
- Rege, K.; Lemu, H.G. A review of fatigue crack propagation modelling techniques using FEM and XFEM. First Conference of Computational Methods in Offshore Technology (COTech2017). In IOP Conference Series: Materials Science and Engineering; IOP Publishing: Bristol, UK, 2017; Volume 276, p. 012027. [Google Scholar] [CrossRef]
- Walp, M.S. Impact Dependent Properties of Advanced and Ultra High Strength Steels. SAE Trans. 2007, 116, 30–43. [Google Scholar]
- Cardoso, M.C.; Moreira, L.P. Forming Limit Analysis of DP600-800 Steels. Int. J. Mater. Metall. Eng. 2019, 9, 1123–1130. [Google Scholar]
- Cardoso, M.C.; de Pereira, A.M.; da Sliva, F.R.F.; Moreira, L.P. Experimental Analysis of Forming Limits and Thickness Strains of DP600-800 Steels. Appl. Mech. Mater. 2016, 835, 230–235. [Google Scholar]
- Beres, G.; Tisza, M. The Effect of Tensile Strength on the Formability Parameters of Dual Phase Steels. Veh. Automot. Eng. Proc. JK 2016, 2016, 197–204. [Google Scholar]
- Zaman, S.B.; Barlat, F.; Kim, J. Deformation-induced anisotropy of uniaxially prestrained steel sheets. Int. J. Solids Struct. 2018, 134, 20–29. [Google Scholar] [CrossRef]
- Kim, H.; Barlat, F.; Lee, Y.; Zaman, S.B.; Lee, C.S.; Jeong, Y. A crystal plasticity model for describing the anisotropic hardening behavior of steel sheets during strain-path changes. Int. J. Plast. 2018, 111, 85–106. [Google Scholar] [CrossRef]
- Almeida, C.O.L.; Lima, L.H.L.; dos Pereira, M.S. Springback comparison between DP600 and DP800 steel grades. Mater. Res. Express 2020, 7, 016598. [Google Scholar]
- Unlu, A.; Aksen, T.A.; Esener, E.; Firat, M. Predictive modeling based on angular variations of yield stress ratios and lankford parameters for DP800 steel. In Proceedings of the 10th International Automotive Technologies Congress, OTEKON 2020, Virtual, 6–7 September 2021. [Google Scholar]
- Tasan, C.C.; Yan, D.; Zambaldi, C.; Shanthraj, P.; Roters, F.; Raabe, D. Integrated experimental–simulation analysis of stress and strain partitioning in multiphase alloys. Acta Mater. 2014, 81, 386–400. [Google Scholar] [CrossRef]
- Oliver, D.A. Proposed new criteria of ductility from a new law connecting the percentage elongation with size of test-piece. Proc. Inst. Mech. Eng. 1928, 115, 827–864. [Google Scholar]
- Pham, Q.; Oh, S.; Kim, Y. An efficient method to estimate the post-necking behavior of sheet metals. Int. J. Adv. Manuf. Technol. 2018, 98, 2563–2578. [Google Scholar]
- Li, C.; E, D.; Yi, N. Analysis on fracture initiation and fracture angle in ductile sheet metal under uniaxial tension by experiments and finite element simulations. J. Mater. Res. 2016, 31, 3991–3999. [Google Scholar] [CrossRef]
- Hill, R. The Mathematical Theory of Plasticity; Oxford University Press: Oxford, UK, 1950. [Google Scholar]


| C | Si | Mn | P | S | Ni | Cu | Cr |
|---|---|---|---|---|---|---|---|
| 0.136 | 0.249 | 1.77 | 0.011 | 0.0027 | 0.018 | 0.024 | 0.558 |
| R | (−2)/ | K | No. of Sample | |||||||||
|---|---|---|---|---|---|---|---|---|---|---|---|---|
| (mm) | (mm) | (mm) | (mm) | (n/a) | (n/a) | (n/a) | (n/a) | (mm) | (n/a) | (n/a) | (n/a) | |
| A80 | 260 | 120 | 80 | 20 | 25 | 0.67 | 4 | 1 | 1.2 | 16.33 | 16.7 | 6 |
| A50 | 200 | 75 | 50 | 12.5 | 15 | 0.67 | 4 | 1 | 1.2 | 12.91 | 10.4 | 6 |
| ASTM25 | 76 | 32 | 25 | 6 | 6 | 0.78 | 4.17 | 0.8 | 1.2 | 9.32 | 5 | 6 |
| Mini1 | 60 | 12.5 | 10 | 3 | 3 | 0.8 | 3.33 | 0.65 | 1.2 | 5.27 | 2.5 | 6 |
| Mini2 | 41 | 9 | 5 | 1.5 | 2 | 0.56 | 2.5 | 1 | 1.2 | 3.23 | 1.67 | 6 |
| Mesh 1 | Mesh 2 | Mesh 3 | Mesh 4 | Increasing Ratio | |
|---|---|---|---|---|---|
| No. div. of PW (-) | 11 | 21 | 41 | 81 | ∼2 |
| No. div. of GL (-) | 31 | 61 | 121 | 241 | ∼2 |
| No. div. of THK (-) | 3 | 5 | 9 | 17 | ∼2 |
| Total element. No. (-) | 1023 | 6405 | 44,649 | 331,857 | - |
| Total node. No. (-) | 1536 | 8184 | 51,240 | 357,192 | - |
| Error of necking strain (-) | 1.87 × 10 | 1.07 × 10 | 8.02 × 10 | 0 | - |
| Error of stress at necking strain (-) | 4.22 × 10 | 3.15 × 10 | 2.73 × 10 | 0 | - |
| PW | dx | GL | dy | THK | dz | |
|---|---|---|---|---|---|---|
| (mm) | (mm) | (mm) | (mm) | (mm) | (mm) | |
| A80 | 20 | 0.488 | 80 | 0.661 | 1.2 | 0.133 |
| A50 | 12.5 | 0.305 | 50 | 0.413 | 1.2 | 0.133 |
| ASTM25 | 6 | 0.146 | 25 | 0.207 | 1.2 | 0.133 |
| Mini1 | 3 | 0.073 | 10 | 0.083 | 1.2 | 0.133 |
| Mini2 | 2 | 0.049 | 5 | 0.041 | 1.2 | 0.133 |
| Lead Author | Ref | Dimension | THK (mm) | r0 | r45 | r90 |
|---|---|---|---|---|---|---|
| Walp | [25] | ISO-A80 | 1.5 | 0.63 | - | - |
| Cardoso | [26] | ∼ISO-A50 | 1.2 | 0.579 | 1.077 | 0.696 |
| Cardoso | [27] | ∼ISO-A50 | 1.2 | 0.516 | 1.237 | 0.711 |
| Beres | [28] | Nakajima | 1 | 0.65 | 0.77 | 0.72 |
| Zaman | [29] | Gauge length 42 cm | 1 | 0.7 | 0.97 | 0.82 |
| Kim | [30] | Gauge length 42 cm | 1 | 0.7 | 0.97 | 0.82 |
| Almeida | [31] | ∼ASTM25 | - | 0.955 | 0.978 | 0.897 |
| Unlu | [32] | - | - | 0.71 | 0.88 | 0.83 |
| Current work | - | ISO-A80 | 1.2 | 0.74 | 1.32 | 1.01 |
| Current work | - | ISO-A50 | 1.2 | 0.75 | 1.14 | 1.03 |
| Current work | - | ASTM25 | 1.2 | 0.97 | 1.23 | 0.93 |
| Mean | Exp. Bounds | Mean Discrepancy | Bounds Discrepancy | Mean | Exp. Bounds | Mean Discrepancy | Bounds Discrepancy | |||
|---|---|---|---|---|---|---|---|---|---|---|
| (n/a, %) | (n/a, %) | (n/a, %) | (n/a, %) | (n/a, %) | (n/a, %) | (n/a, %) | (n/a, %) | (n/a, %) | (n/a, %) | |
| A80 | 18.78 | 14.4 | UB: 15.5 | 23.3 | UB: 17.47 | 19.33 | 19.7 | UB: 19.8 | 1.94 | UB: 0.51 |
| LB: 13.6 | LB: 27.58 | LB: 17.6 | LB: 10.66 | |||||||
| A50 | 18.72 | 14.5 | UB: 14.7 | 22.5 | UB: 21.47 | 19.68 | 20.5 | UB: 20.7 | 4.17 | UB: 0.98 |
| LB: 13.9 | LB: 25.75 | LB: 17.0 | LB: 17.07 | |||||||
| ASTM25 | 18.72 | 15.1 | UB: 15.9 | 19.3 | UB: 15.05 | 20.72 | 22.7 | UB: 23.4 | 9.56 | UB: 12.93 |
| LB: 14.1 | LB: 24.68 | LB: 21.3 | LB: 2.8 | |||||||
| Mini1 | 17.4 | 15.3 | UB: 15.9 | 12.1 | UB:10.92 | 26.9 | 25.8 | UB: 26.5 | 4.09 | UB: 2.71 |
| LB: 14.9 | LB: 14.37 | LB: 22.4 | LB: 13.18 | |||||||
| Mini2 | 15.72 | 13.8 | UB: 14.1 | 12.2 | UB: 10.31 | 34.68 | 27.4 | UB: 30.5 | 20.99 | UB: 12.05 |
| LB: 12.5 | LB: 20.48 | LB: 25.4 | LB: 29.35 |
Disclaimer/Publisher’s Note: The statements, opinions and data contained in all publications are solely those of the individual author(s) and contributor(s) and not of MDPI and/or the editor(s). MDPI and/or the editor(s) disclaim responsibility for any injury to people or property resulting from any ideas, methods, instructions or products referred to in the content. |
© 2023 by the authors. Licensee MDPI, Basel, Switzerland. This article is an open access article distributed under the terms and conditions of the Creative Commons Attribution (CC BY) license (https://creativecommons.org/licenses/by/4.0/).
Share and Cite
Zhang, L.; Harrison, W.; Mehraban, S.; Brown, S.G.R.; Lavery, N.P. Size Effect on the Post-Necking Behaviour of Dual-Phase 800 Steel: Modelling and Experiment. Materials 2023, 16, 1458. https://doi.org/10.3390/ma16041458
Zhang L, Harrison W, Mehraban S, Brown SGR, Lavery NP. Size Effect on the Post-Necking Behaviour of Dual-Phase 800 Steel: Modelling and Experiment. Materials. 2023; 16(4):1458. https://doi.org/10.3390/ma16041458
Chicago/Turabian StyleZhang, Lintao, Will Harrison, Shahin Mehraban, Stephen G. R. Brown, and Nicholas P. Lavery. 2023. "Size Effect on the Post-Necking Behaviour of Dual-Phase 800 Steel: Modelling and Experiment" Materials 16, no. 4: 1458. https://doi.org/10.3390/ma16041458
APA StyleZhang, L., Harrison, W., Mehraban, S., Brown, S. G. R., & Lavery, N. P. (2023). Size Effect on the Post-Necking Behaviour of Dual-Phase 800 Steel: Modelling and Experiment. Materials, 16(4), 1458. https://doi.org/10.3390/ma16041458