
A Contrast Analysis of Deformation Characteristics and Critical Dynamic Stress of Natural and Fiber-Binder Reinforced Subgrade Filler after Different Freeze-Thaw Cycles

Abstract
:1. Introduction
2. Laboratory Test
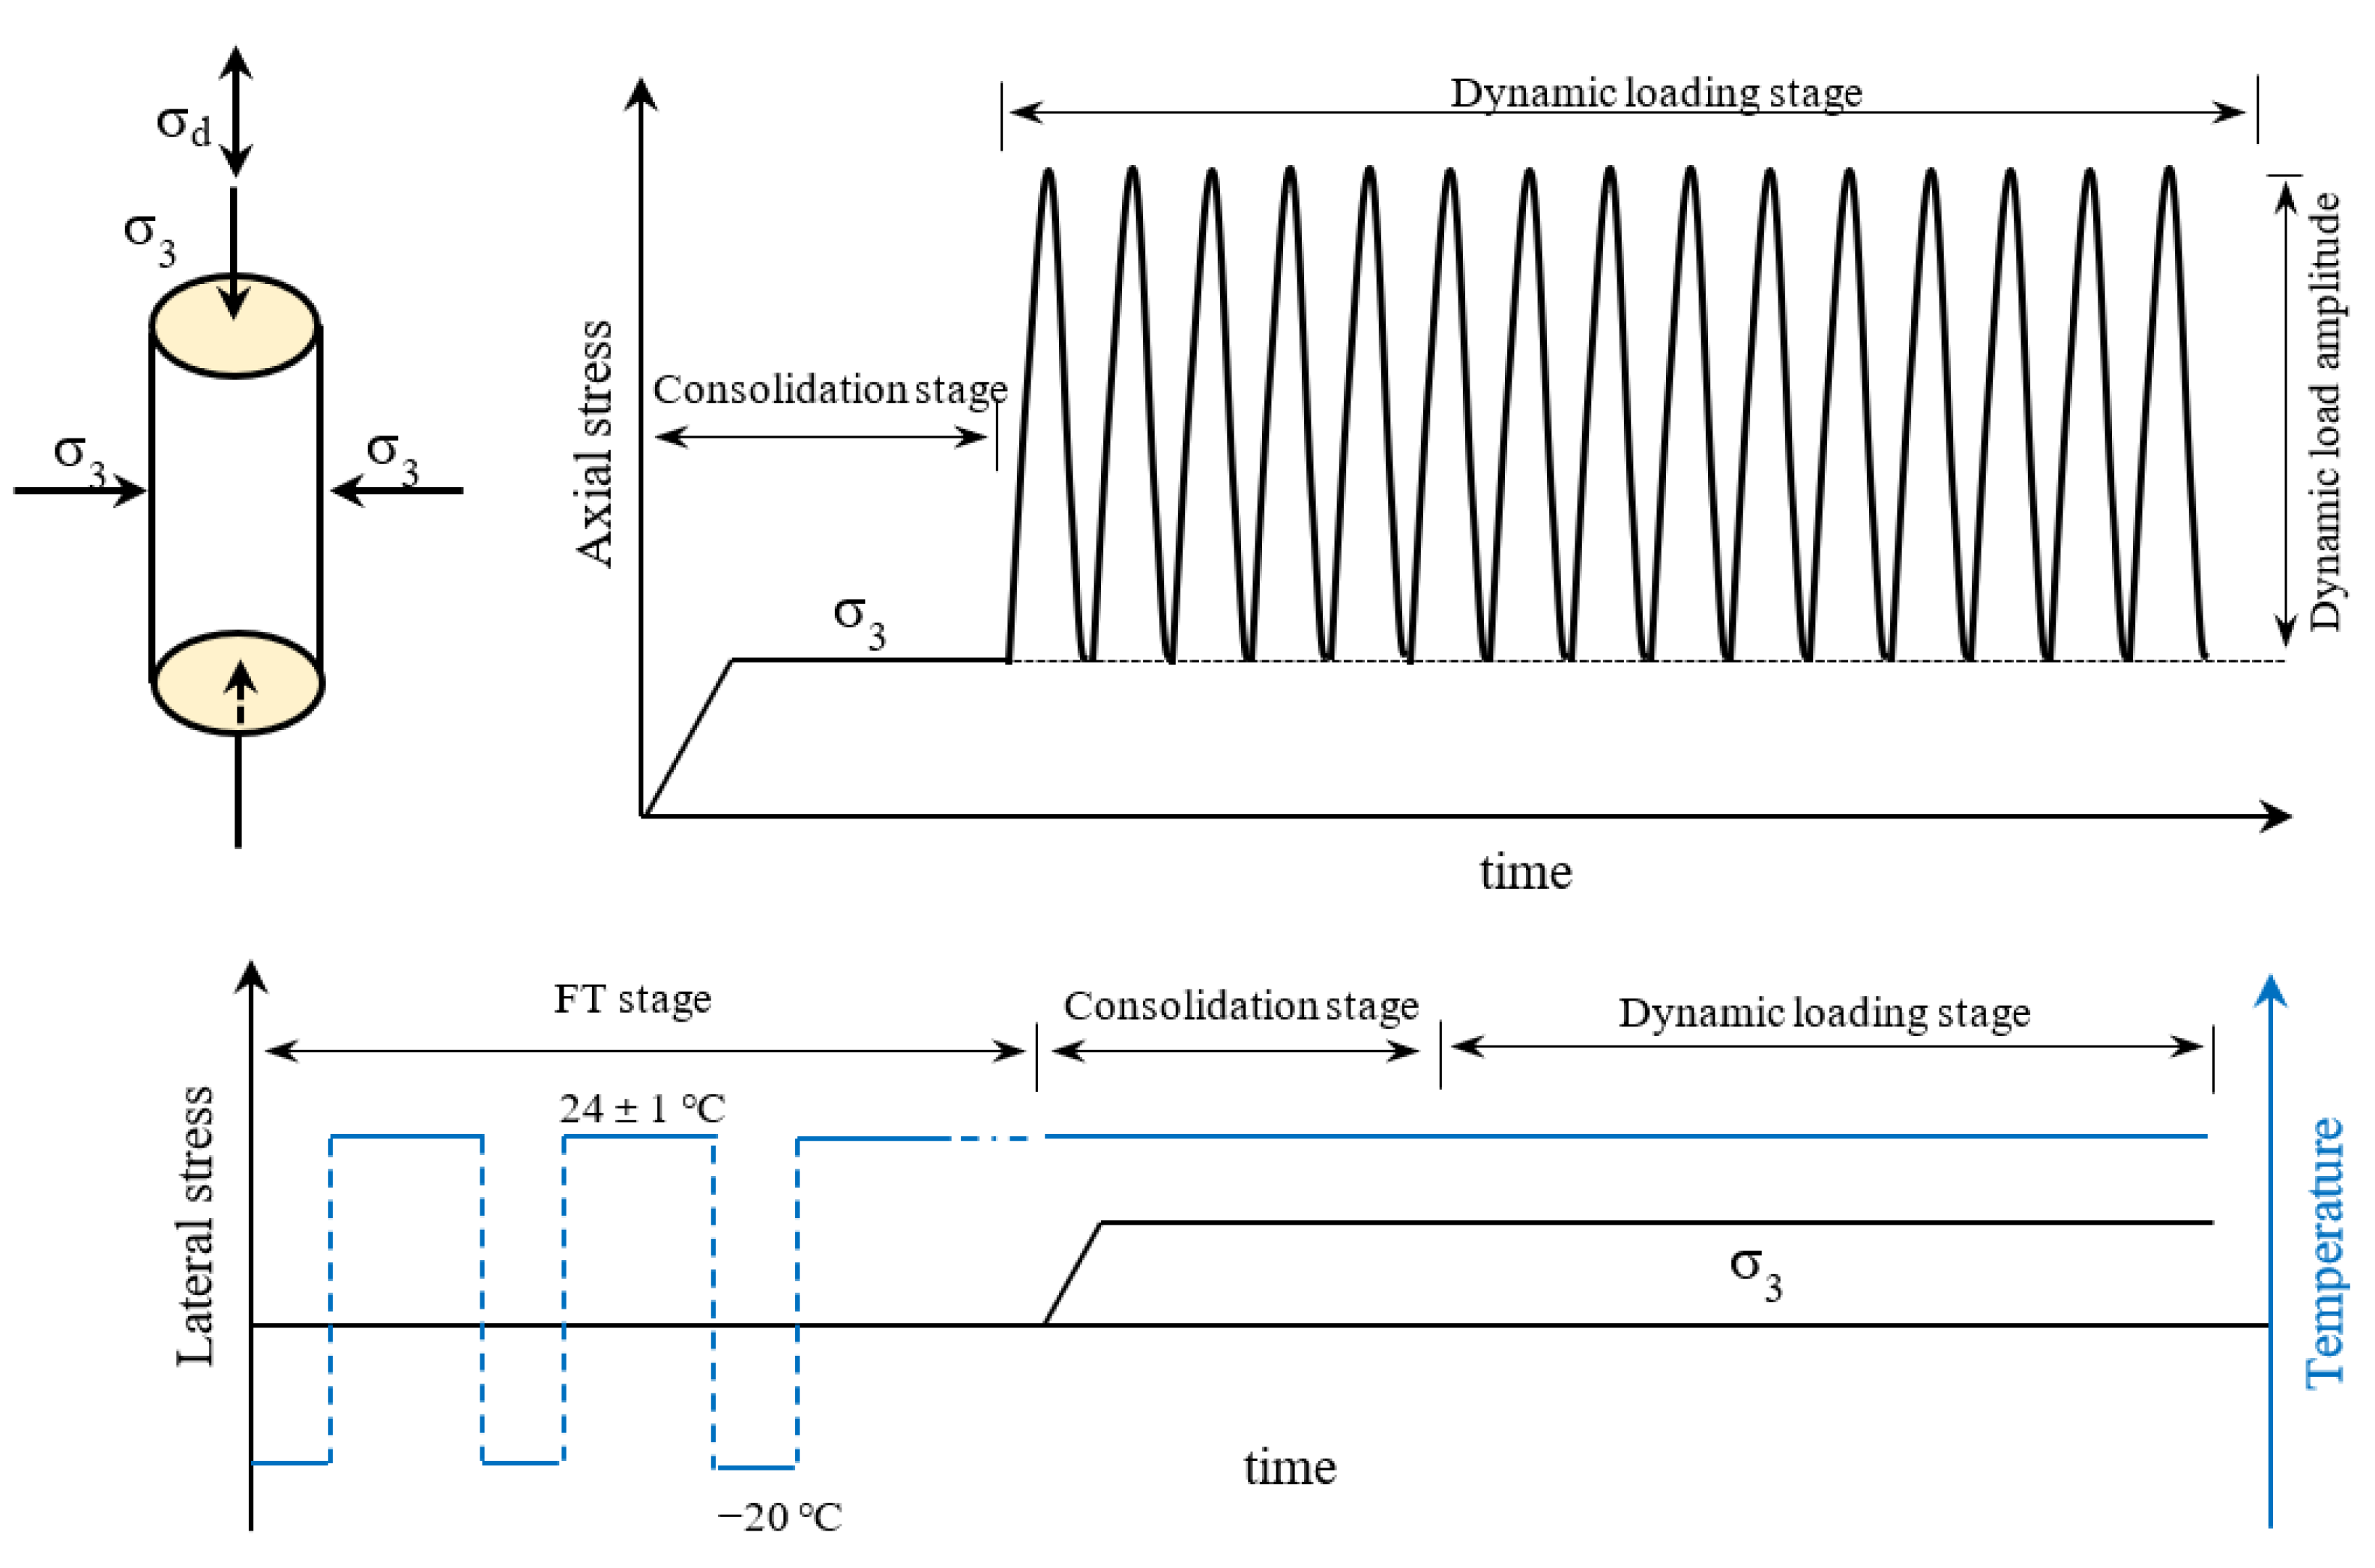
2.1. Test Apparatus
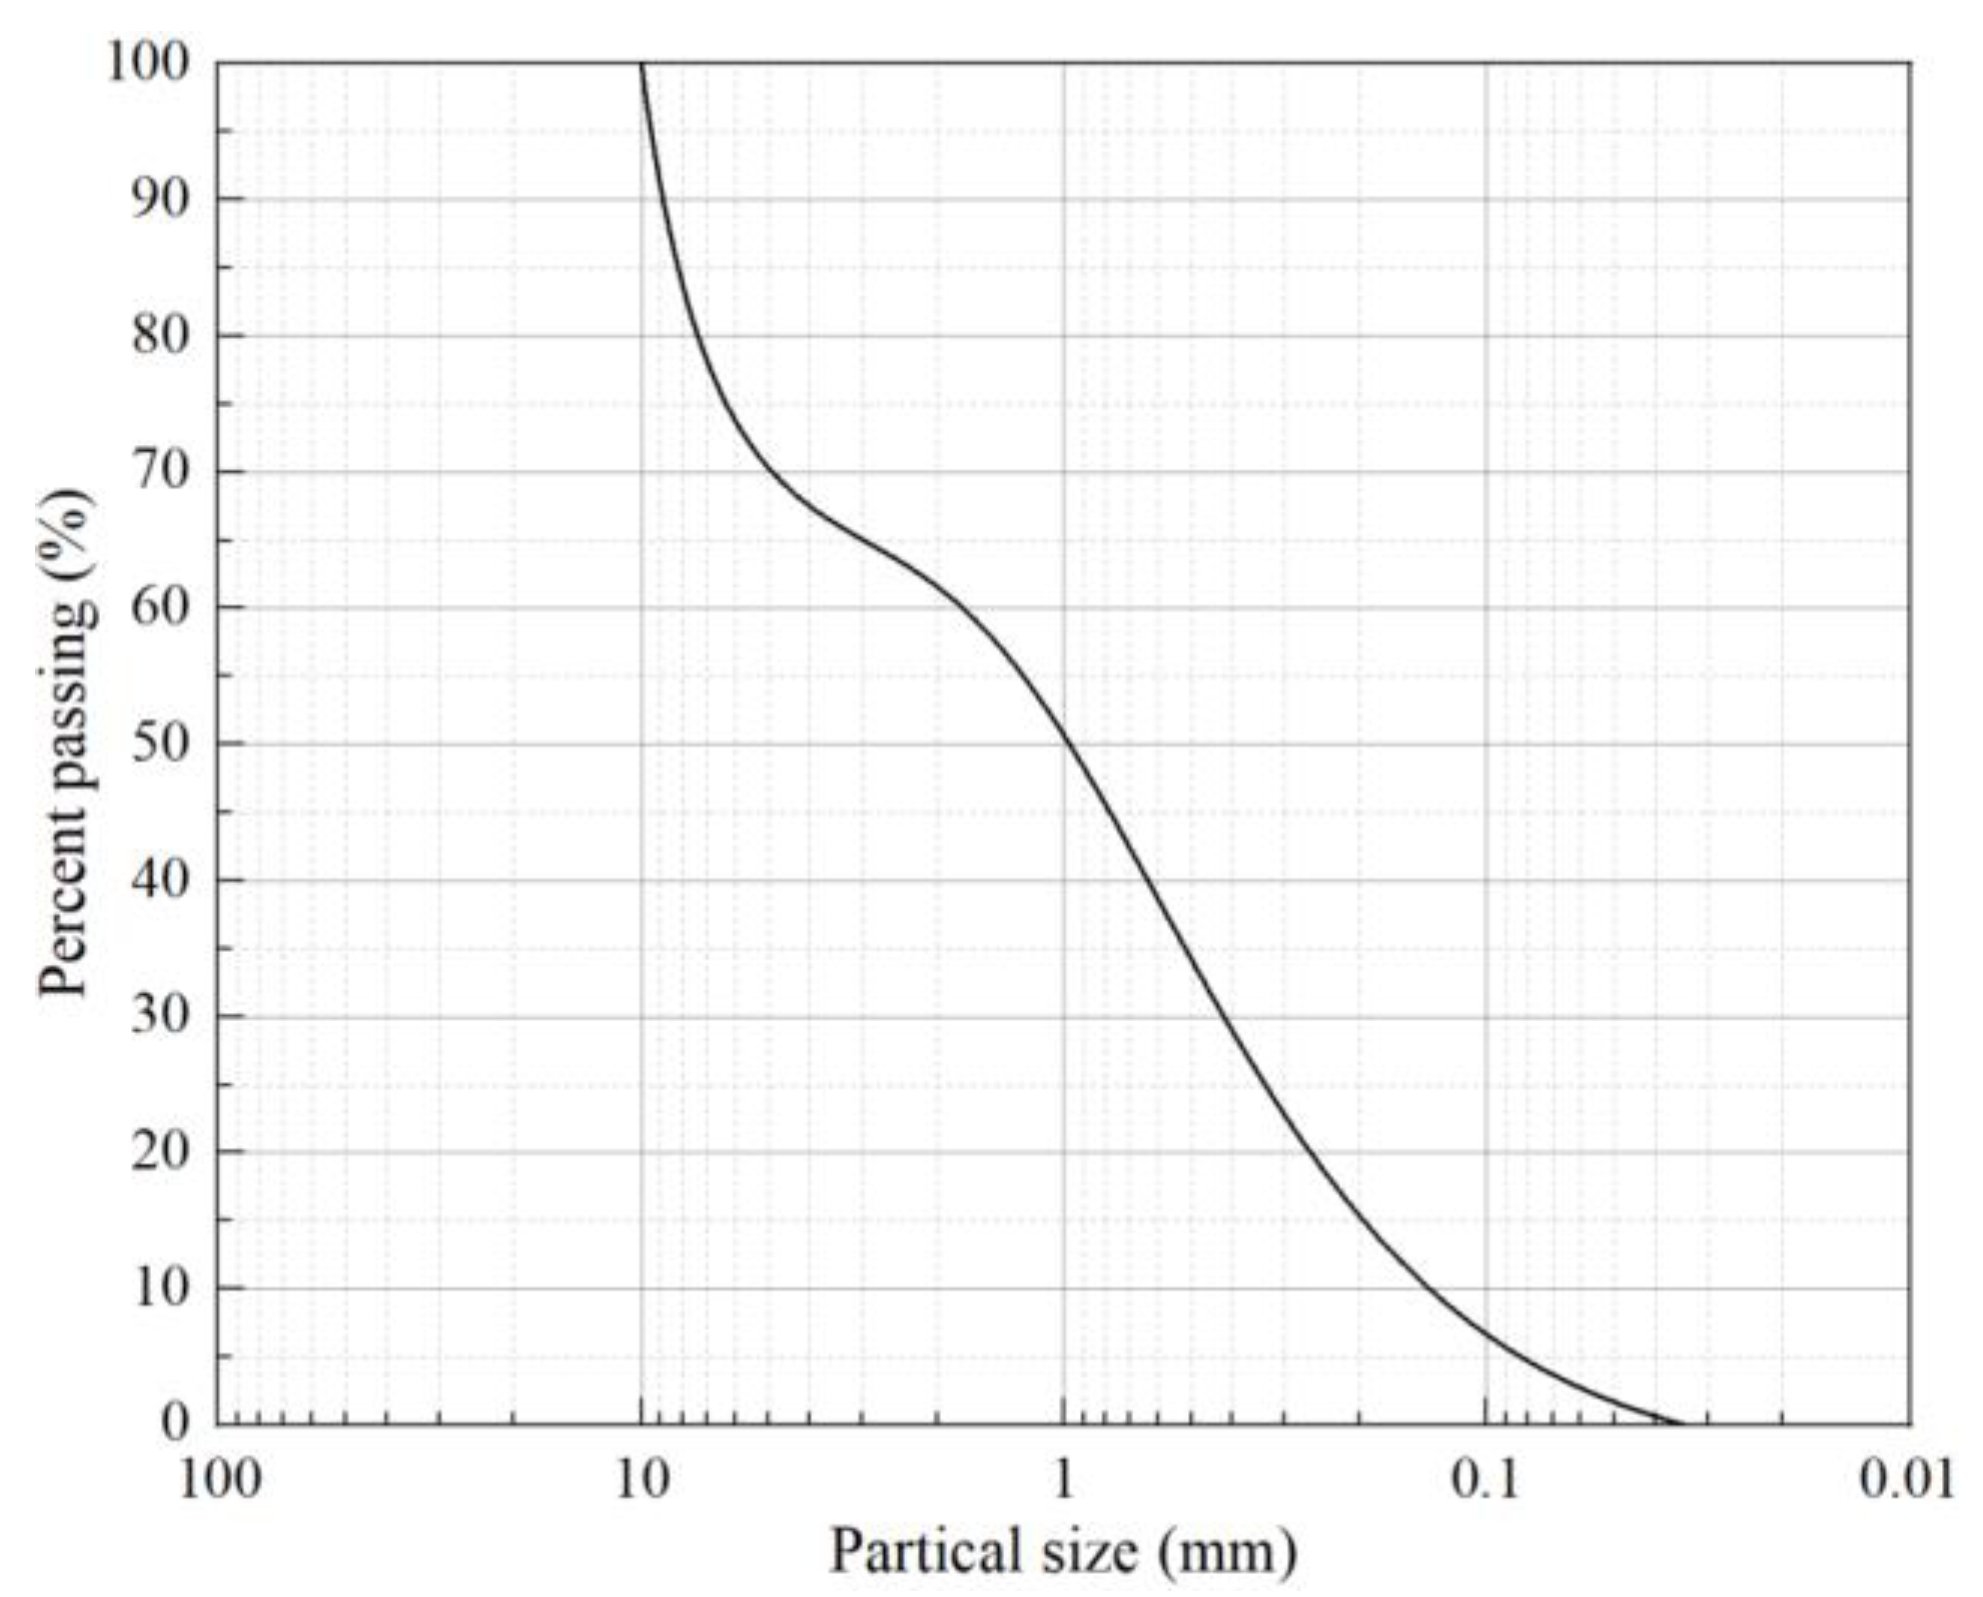
2.2. Test Materials and Specimens
2.3. Freeze–Thaw Cycle and Loading Process
2.4. Test Program
3. Results and Discussion
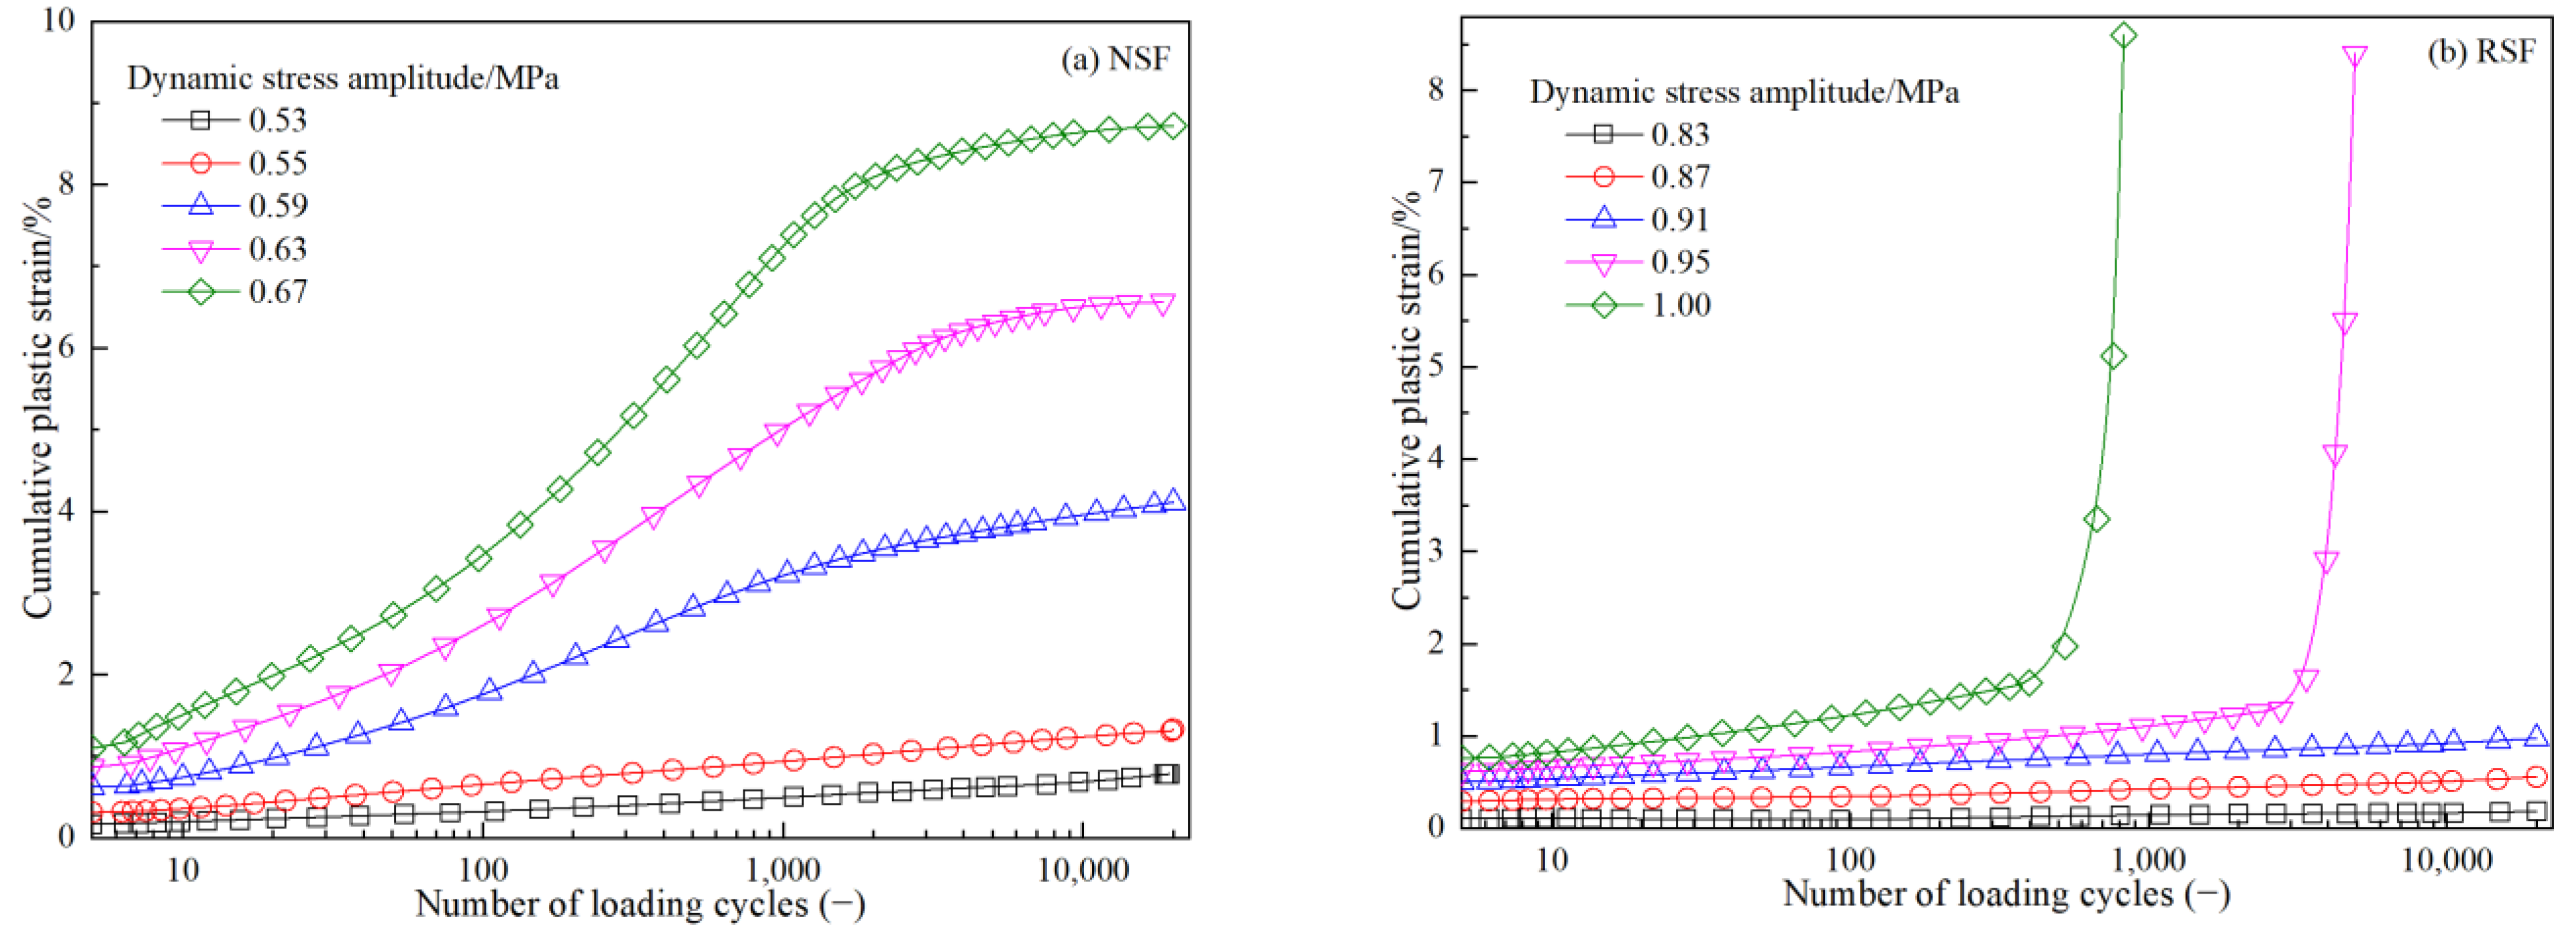
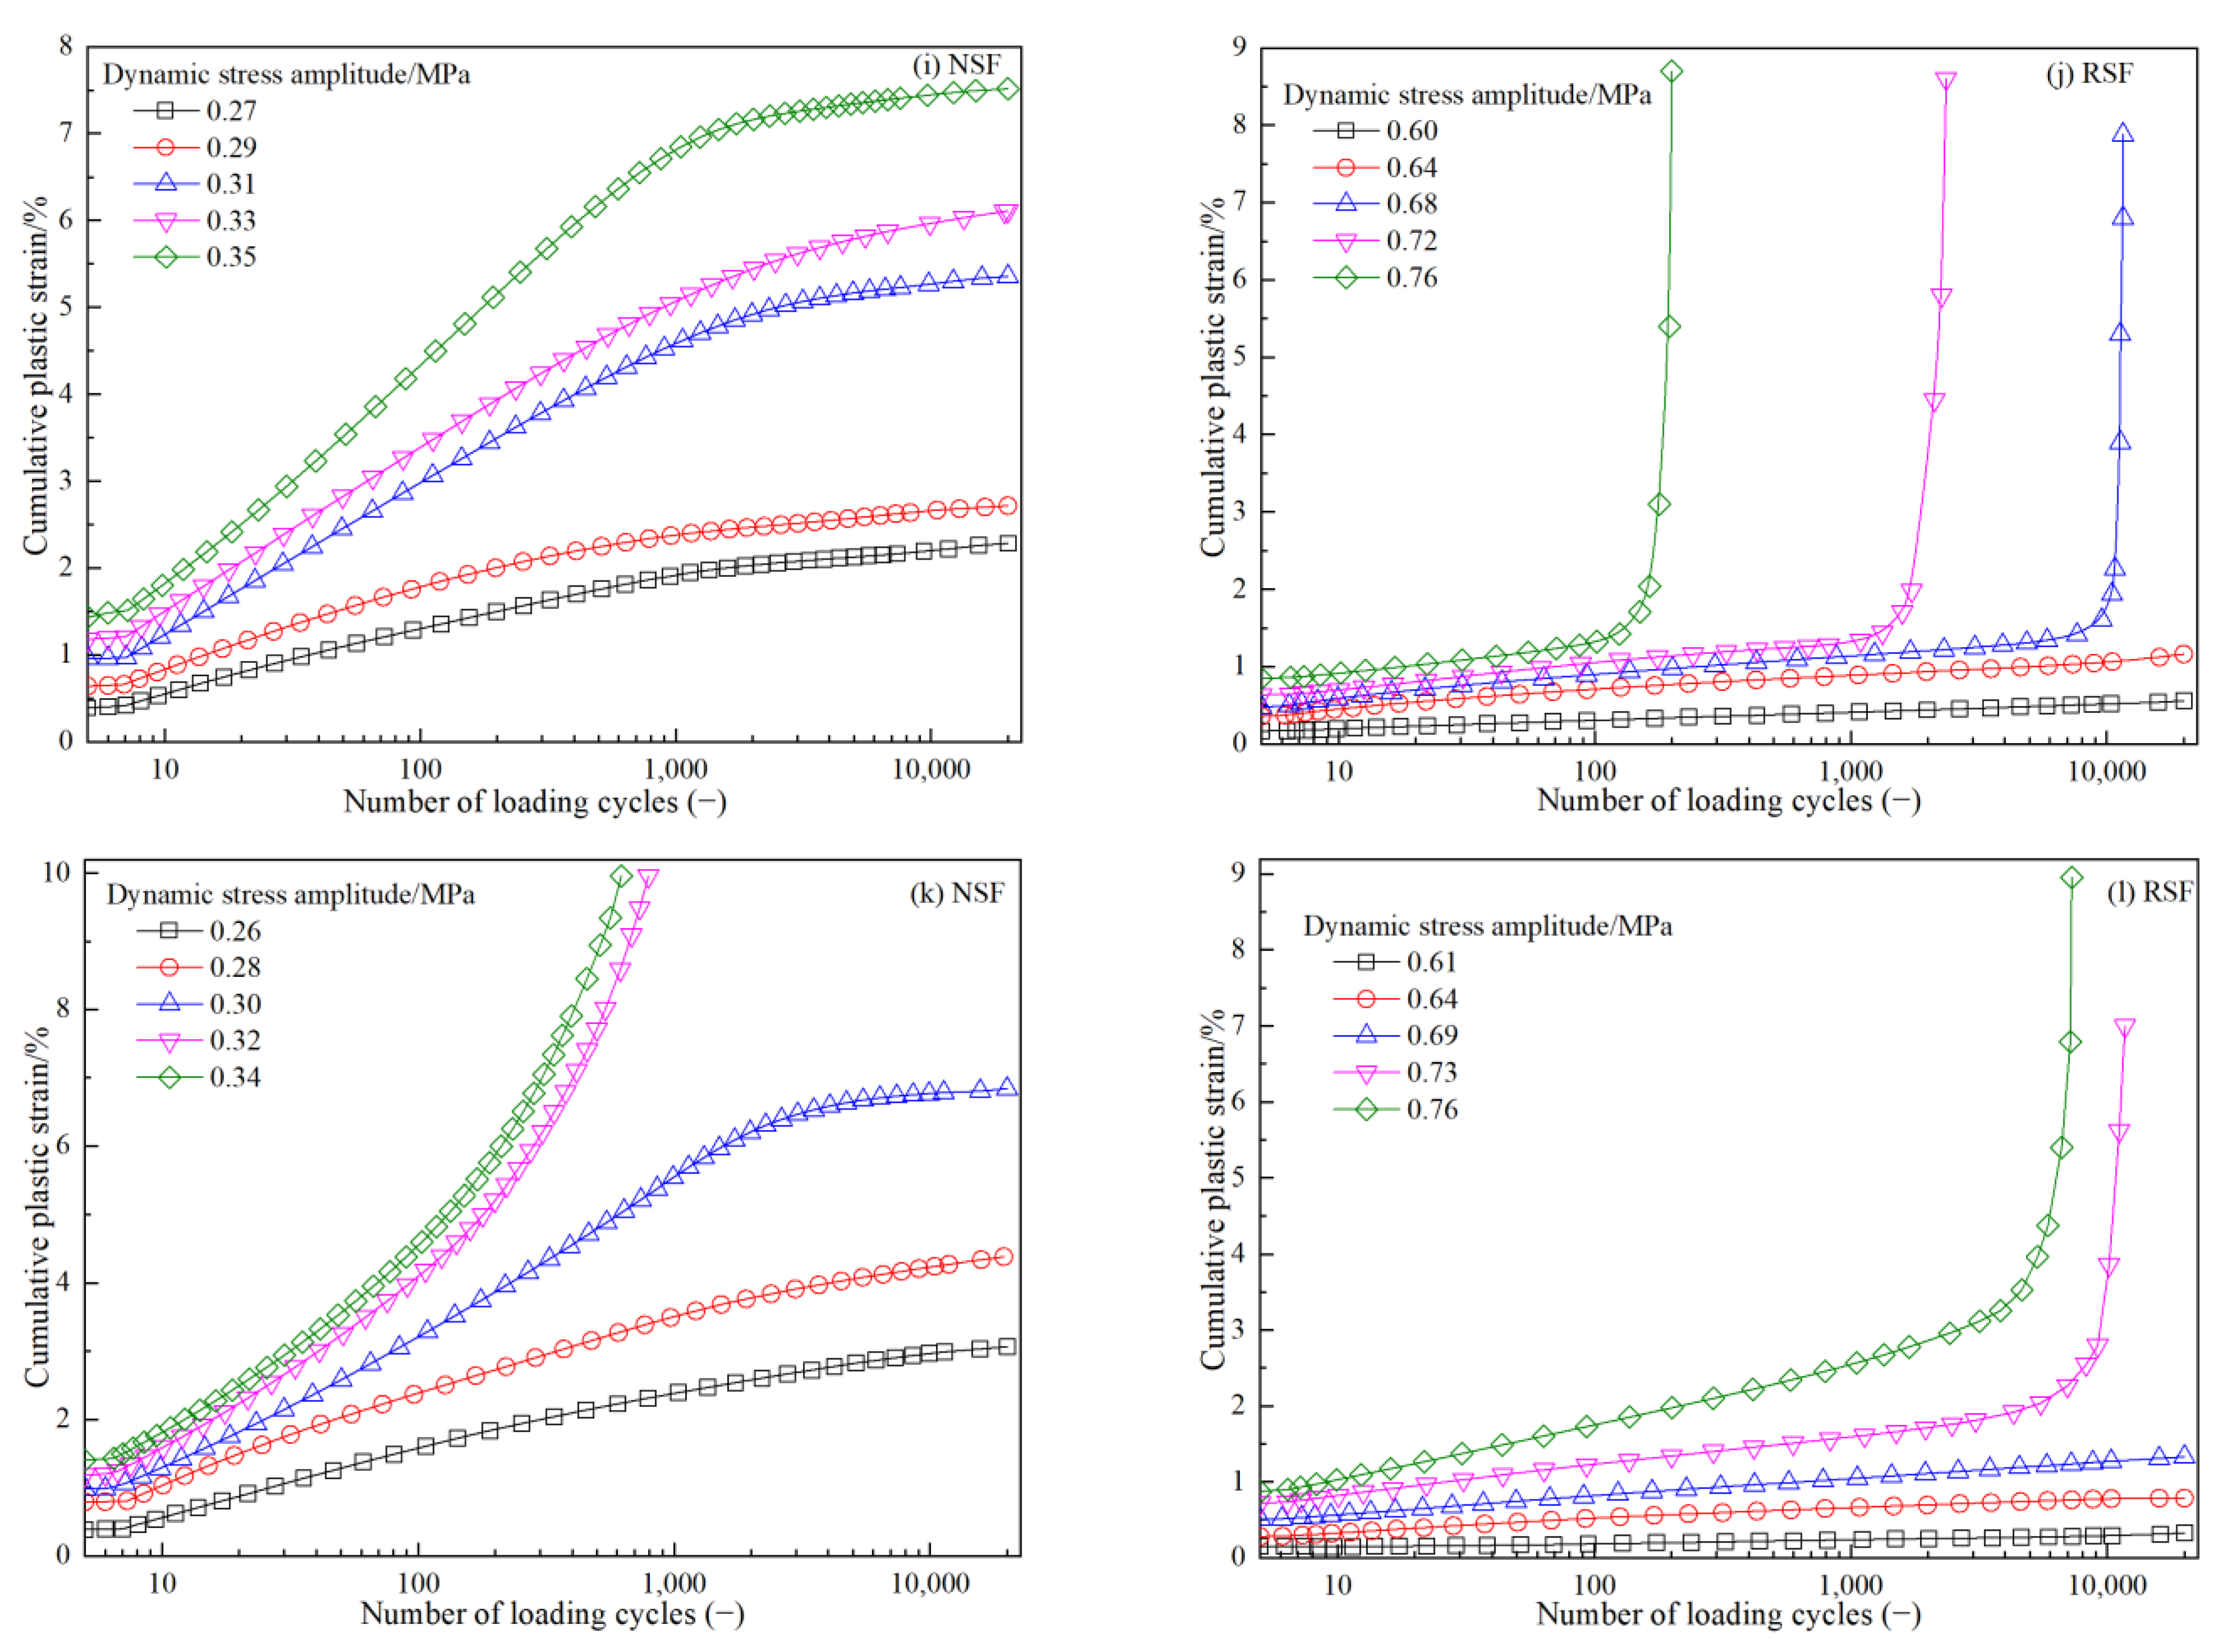
3.1. Freeze–Thaw Cycle’s Influence
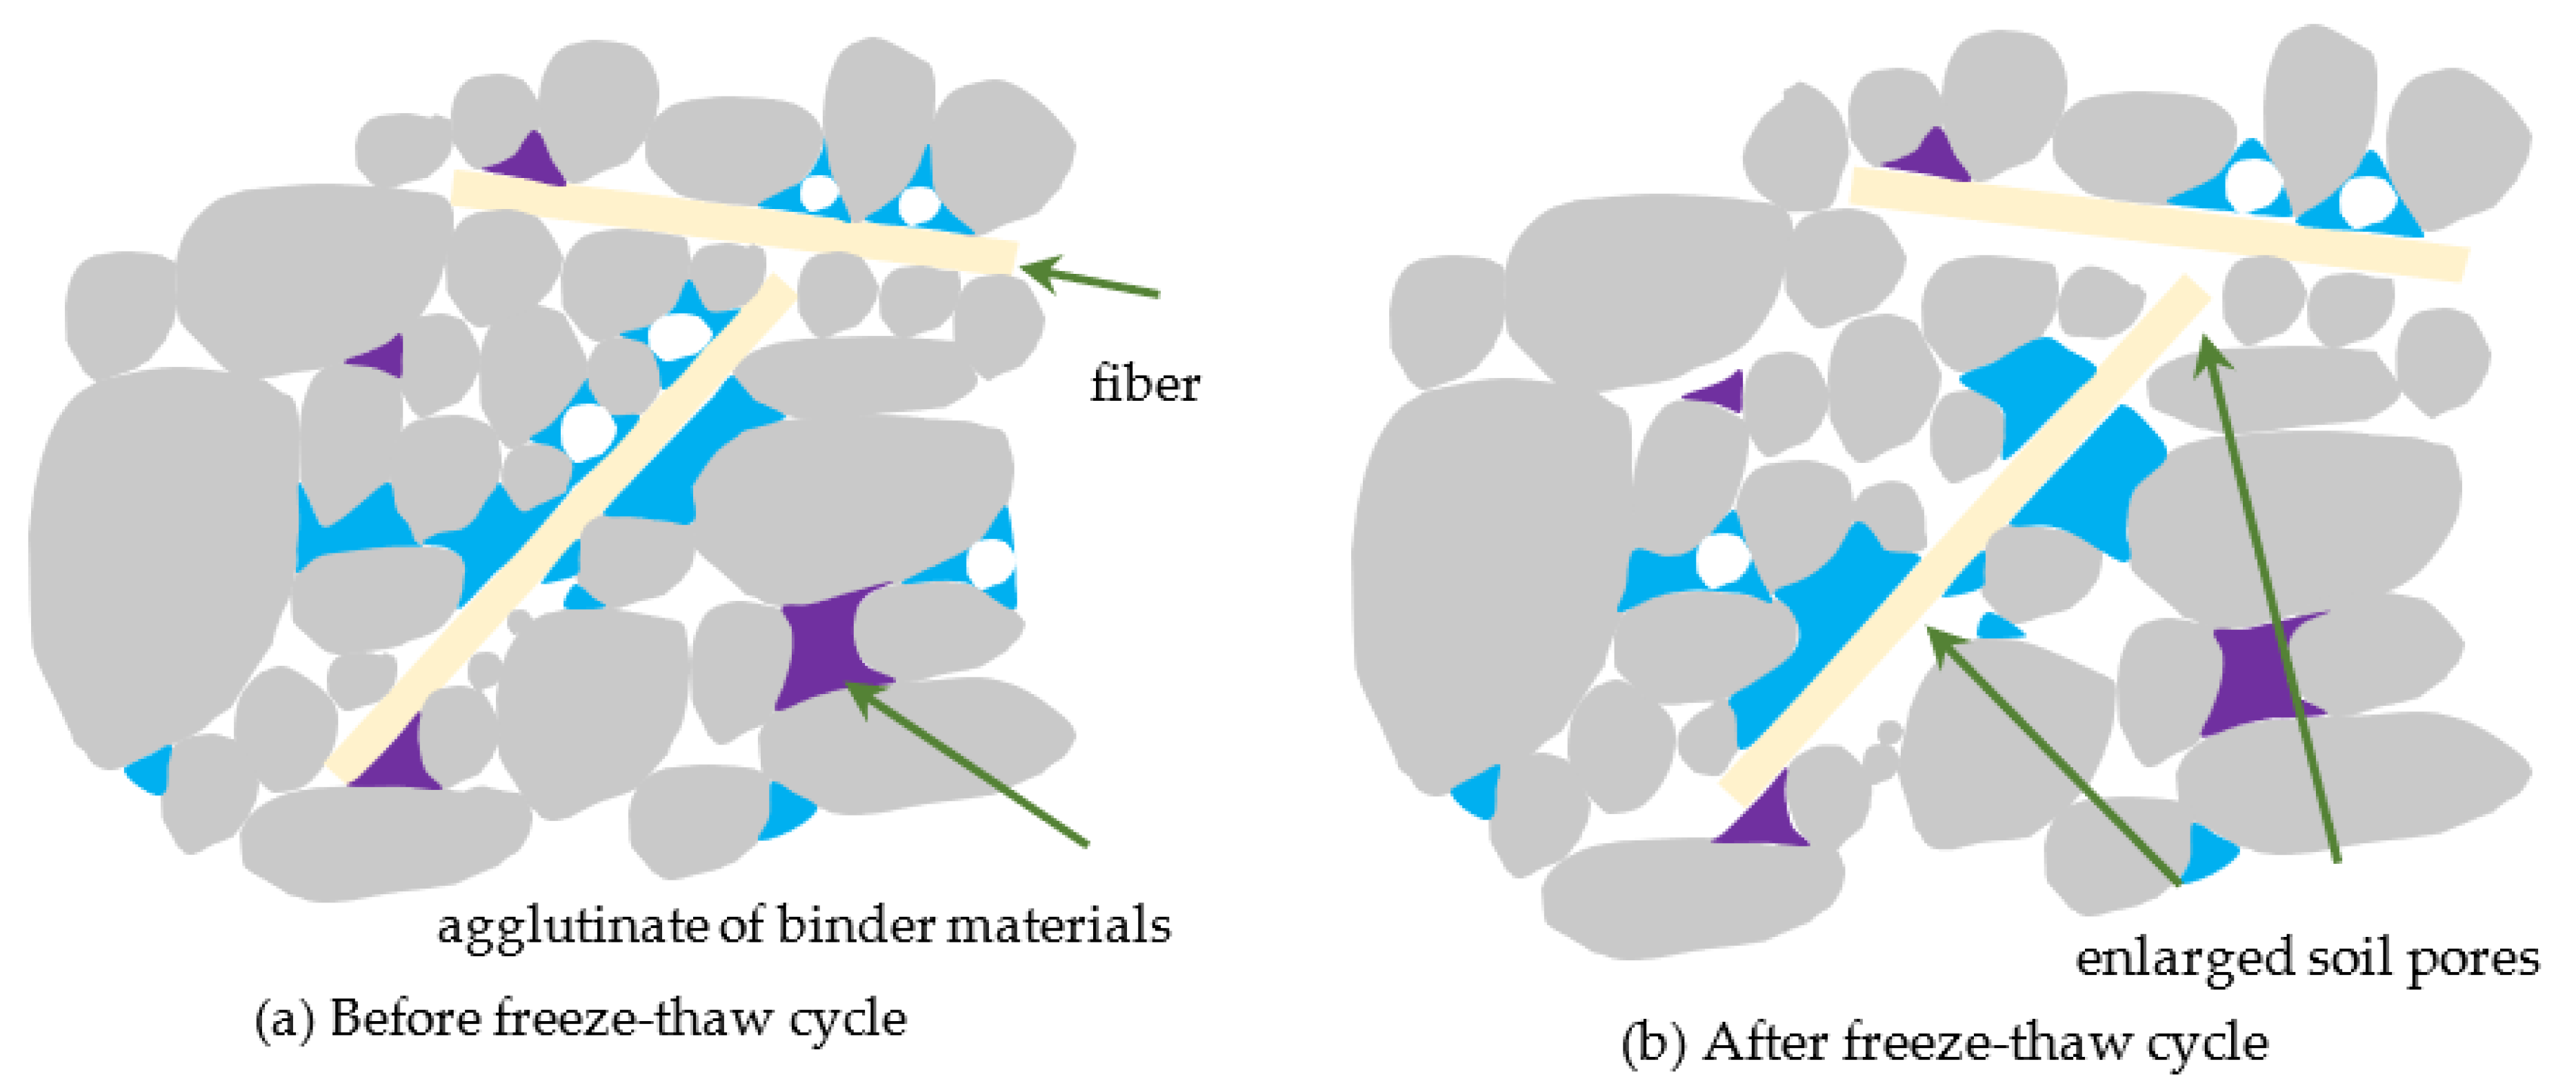
3.2. Interfacial Mechanical Interaction
4. Critical Dynamic Stress
5. Conclusions
- (1)
- At various dynamic stress levels, the relationships between CPS and the vibration number of the NSF and RSF show three states: stable, critical, and failure. However, the NSF specimens show plastic failure, and the curve of CPS with vibration number is mostly “s”-shaped before failure, while the curve is “s”-shape or hyperbolic after reaching the failure standard. The RSF specimens show brittle failure, and the curve of CPS with vibration number is approximately linear before failure, while the curve is approximately exponential after failure with a strain turning point.
- (2)
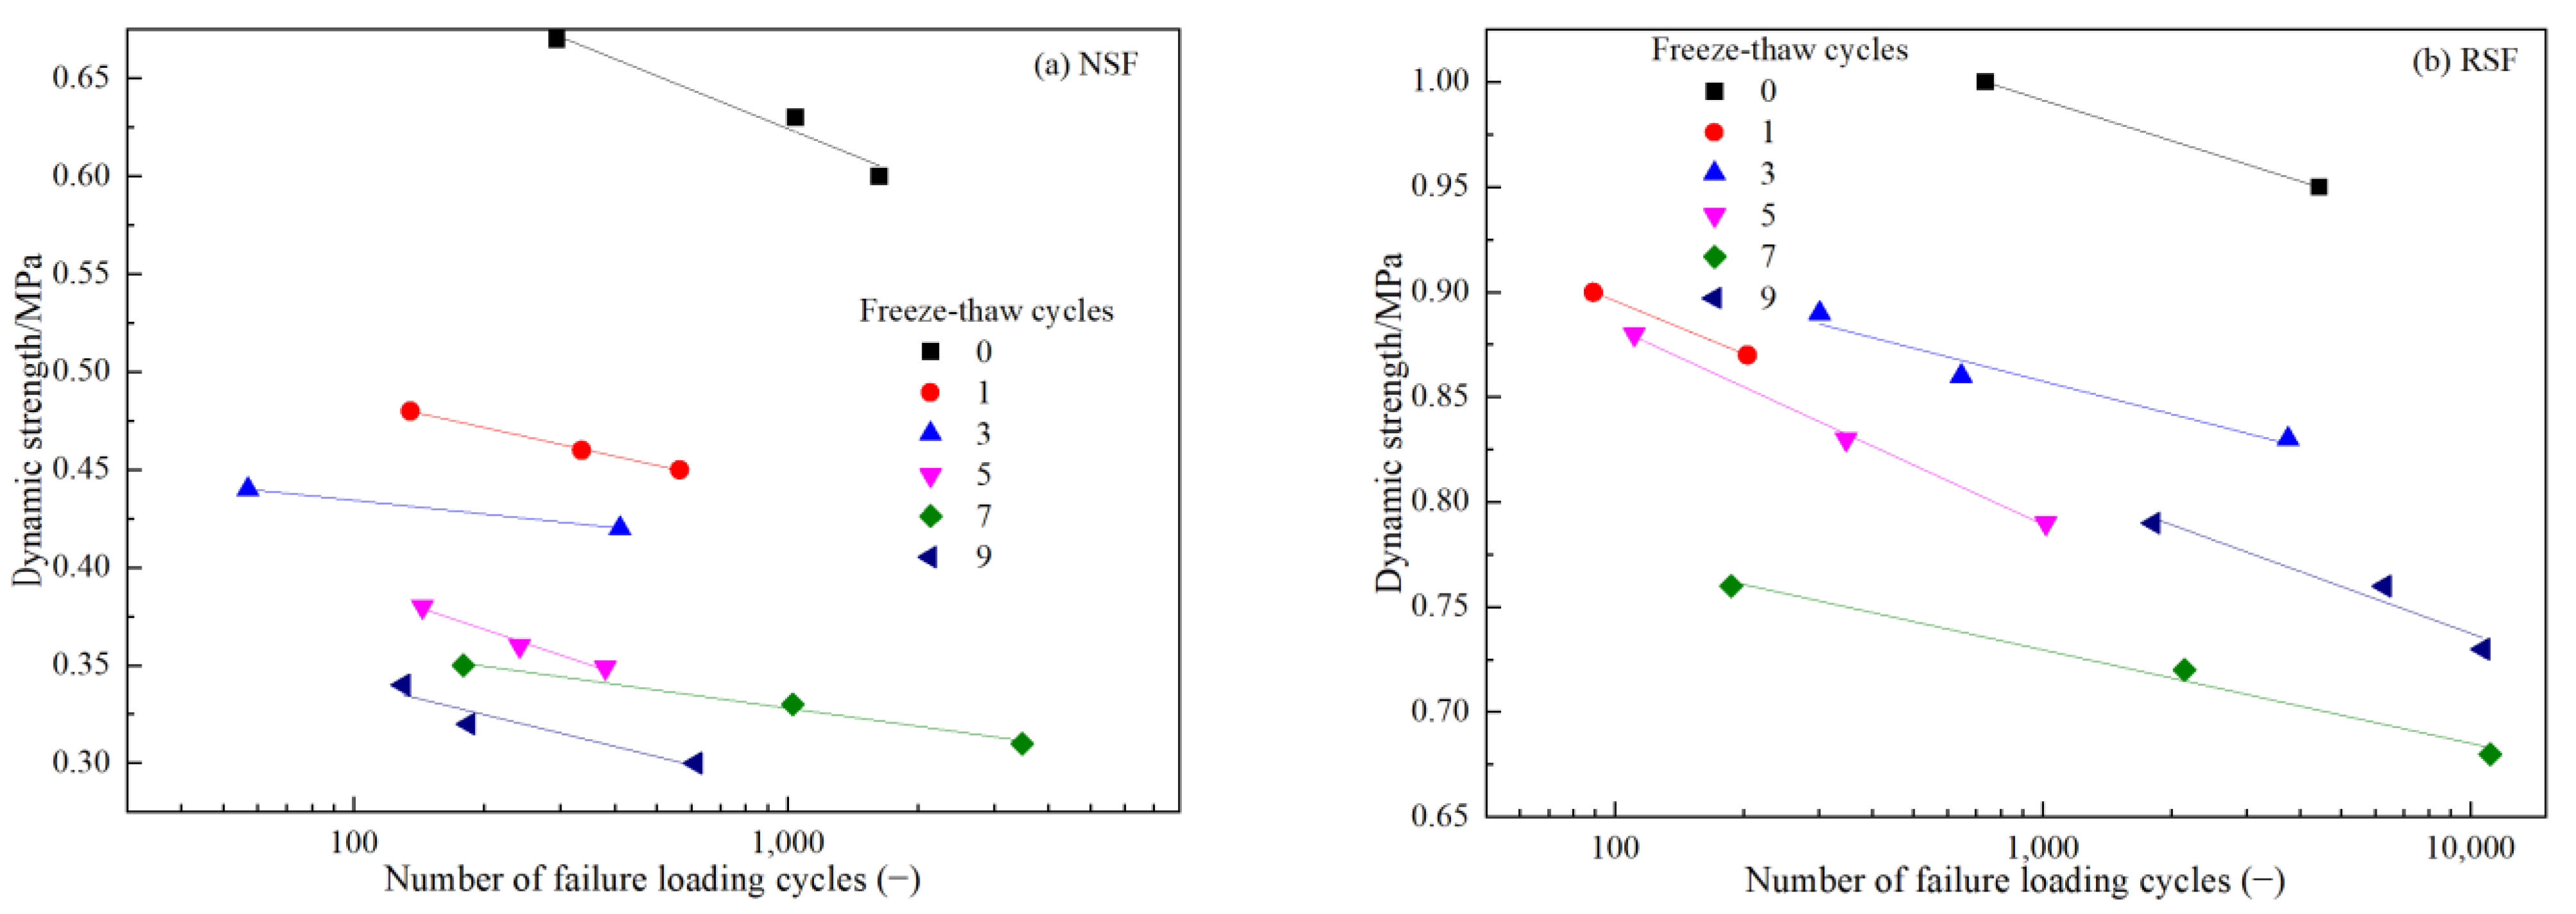
- Under FT cycle conditions, the anti-CPS performance of the NSF with no FT cycles is the strongest. With the increase in FT cycles, the dynamic stress level required for NSF specimen failure decreases continuously. After three FT cycles, the anti-cumulative deformation ability of the NSF decreases by approximately 32%. There is little difference between the anti-cumulative deformation ability of the NSF after seven and nine FT cycles, respectively.
- (3)
- Compared with the NSF, after zero, one, three, five, seven, and nine FT cycles, the fiber-binder RSF specimens’ dynamic stress levels increase approximately 1.52, 1.89, 1.98, 2.32, 2.2, and 2.45 times, respectively, before they reach failure states. These findings demonstrate that the fiber-binder reinforcing technique could significantly increase the NSF’s CPS resistance under the coupling action of FT cycle and dynamic load.
- (4)
- Similarly to that of the NSF, after one FT cycle, the dynamic strength attenuation of the RSF sample is the largest. The difference is that the dynamic strength of the RSF would recover after three and nine FT cycles.
Author Contributions
Funding
Institutional Review Board Statement
Informed Consent Statement
Data Availability Statement
Conflicts of Interest
References
- Nie, R.; Sun, B.; Leng, W.; Li, Y.; Ruan, B. Resilient modulus of coarse-grained subgrade soil for heavy-haul railway: An experimental study. Soil Dyn. Earthq. Eng. 2021, 150, 106959. [Google Scholar] [CrossRef]
- Li, Y.; Ling, X.Z.; Su, L.; An, L.; Li, P.; Zhao, Y. Tensile strength of fiber reinforced soil under freeze-thaw condition. Cold Reg. Sci. Technol. 2018, 146, 53–59. [Google Scholar] [CrossRef]
- Ling, X.Z.; Zhang, F.; Li, Q.L.; An LSWang, J.H. Dynamic shear modulus and damping ratio of frozen compacted sand subjected to freeze-thaw cycle under multi-stage cyclic loading. Soil Dyn. Earthq. Eng. 2015, 76, 111–121. [Google Scholar] [CrossRef]
- Liu, J.K.; Chang, D.; Yu, Q.M. Influence of freeze-thaw cycles on mechanical properties of a silty sand. Eng. Geol. 2016, 210, 23–32. [Google Scholar] [CrossRef]
- Zhou, Z.W.; Ma, W.; Zhang, S.J.; Mu, Y.H.; Li, G.Y. Effect of freeze-thaw cycles in mechanical behaviors of frozen loess. Cold Reg. Sci. Technol. 2018, 146, 9–18. [Google Scholar] [CrossRef]
- Liu, X.Q.; Liu, J.K.; Tian, Y.H.; Chang, D.; Hu, T.F. Influence of the freeze-thaw effect on the Duncan-Chang model parameter for lean clay. Transp. Geotech. 2019, 21, 100273. [Google Scholar] [CrossRef]
- Wang, J.H.; Zhang, F.; Yang, Z.H. Anisotropy in small-strain shear modulus of permafrost at rising temperatures. Cold Reg. Sci. Technol. 2019, 160, 1–12. [Google Scholar] [CrossRef]
- Xu, X.T.; Zhang, W.D.; Fan, C.X.; Lai, Y.; Wu, J. Effect of freeze-thaw cycles on the accumulative deformation of frozen clay under cyclic loading conditions: Experimental evidence and theoretical model. Road Mater. Pavement Des. 2019, 22, 1–17. [Google Scholar] [CrossRef]
- Rao, Y.Z.; Liu, J.K.; Chang, D.; Kravhenko, E. Effects of microencapsulated phase change material characteristics on the thermal performance and mechanical behaviour of silty clay. Transp. Geotech. 2021, 29, 100584. [Google Scholar] [CrossRef]
- Tai, B.W.; Wu, Q.B.; Yue, Z.R.; Xu, H.B. Ground temperature and deformation characteristics of anti-freeze-thaw embankments in permafrost and seasonal frozen ground regions of China. Cold Reg. Sci. Technol. 2021, 189, 103331. [Google Scholar] [CrossRef]
- Tian, Y.H.; Yang, Z.H.; Liu, Y.Y.; Cai, X.P.; Shen, Y.P. Long-term thermal stability and settlement of heat pipe-protected highway embankment in warm permafrost regions. Eng. Geol. 2021, 292, 106269. [Google Scholar] [CrossRef]
- Wang, J.H.; Zhang, F.; Yang, Z.H.; Yang, P. Experimental investigation on the mechanical properties of thawed deep permafrost from the Kuparuk River Delta of the North Slope of Alaska. Cold Reg. Sci. Technol. 2022, 195, 103482. [Google Scholar] [CrossRef]
- Santoni, R.L.; Webster, S.L. Airfields and roads construction using fiber stabilization of sands. J. Transp. Eng. 2001, 127, 96–104. [Google Scholar] [CrossRef]
- Patel, S.K.; Singh, B. Strength and deformation behavior of fiber-reinforced cohesive soil under varying moisture and compaction states. Geotech. Geol. Eng. 2017, 35, 1767–1781. [Google Scholar] [CrossRef]
- Ahmad, F.; Bateni, F.; Azmi, M. Performance evaluation of silty sand reinforced with fibers. Geotext. Geomembr. 2010, 28, 93–99. [Google Scholar] [CrossRef]
- Jiang, H.; Cai, Y.; Liu, J. Engineering properties of soils reinforced by short discrete polypropylene fiber. J. Mater. Civ. Eng. 2010, 22, 1315–1322. [Google Scholar] [CrossRef]
- Ibraim, E.; Diambra, A.; Russell, A.R.; Muir Wood, D. Assessment of laboratory sample preparation for fiber reinforced sands. Geotext. Geomembr. 2012, 34, 69–79. [Google Scholar] [CrossRef]
- Li, C.; Zornberg, J.G. Mobilization of reinforcement forces in fiber-reinforced soil. J. Geotech. Geoenviron. Eng. 2013, 139, 107–115. [Google Scholar] [CrossRef]
- Shao, W.; Cetin, B.; Li, Y.D.; Li, J.P.; Li, L. Experimental investigation of mechanical properties of sands reinforced with discrete randomly distributed fiber. Geotech. Geol. Eng. 2014, 32, 901–910. [Google Scholar] [CrossRef]
- Tang, C.S.; Wang, D.Y.; Cui, Y.J.; Shi, B. Tensile strength of fiber-reinforced soil. J. Mater. Civ. Eng. 2016, 28, 04016031. [Google Scholar] [CrossRef]
- Tang, C.S.; Li, J.; Wang, D.Y.; Shi, B. Investigation on the interfacial mechanical behavior of wave-shaped fiber reinforced soil by pullout test. Geotext. Geomembr. 2016, 44, 872–883. [Google Scholar] [CrossRef]
- Tingle, J.S.; Santoni, R.L.; Webster, S.L. Full-scale field tests of discrete fiber-reinforced sand. J. Transp. Eng. 2002, 128, 9–16. [Google Scholar] [CrossRef]
- Hu, J.; Zhang, L.; Wei, H.; Du, J. Experimental study of the compressive strength of chemically reinforced organic-sandy soil. Geomech. Eng. 2018, 16, 247–255. [Google Scholar]
- Cai, Y.; Xu, L.; Liu, W.; Shang, Y.; Su, N.; Feng, D. Field Test Study on the dynamic response of the cement-improved expansive soil subgrade of a heavy-haul railway. Soil Dyn. Earthq. Eng. 2020, 128, 105878. [Google Scholar] [CrossRef]
- Yang, Z.; Liu, X.; Zhang, L.; Niu, F.; Ling, X.; Li, G.; Shi, W. Dynamic behavior of geosynthetic-reinforced expansive soil under freeze-thaw cycles. Adv. Civ. Eng. 2021, 2021, 5526854. [Google Scholar] [CrossRef]
- Wang, W.; Li, J.; Hu, J. Triaxial mechanical properties and micro-mechanism of calcareous sand modified by nano-clay and cement. Geofluids 2021, 2021, 6639602. [Google Scholar]
- Zhang, J.; Deng, A.; Jaksa, M. Enhancing mechanical behavior of micaceous soil with jute fibers and lime additives. J. Rock Mech. Geotech. Eng. 2021, 13, 1093–1100. [Google Scholar] [CrossRef]
- Shirmohammadi, S.; Ghaffarpour Jahromi, S.; Payan, M.; Senetakis, K. Effect of lime stabilization and partial clinoptilolite zeolite replacement on the behavior of a silt-sized low-plasticity soil subjected to freezing-thawing cycles. Coatings 2021, 11, 994. [Google Scholar] [CrossRef]
- Ghazavi, M.; Roustaie, M. The influence of freeze-thaw cycles on the unconfined compressive strength of fiber-reinforced clay. Cold Reg. Sci. Technol. 2010, 61, 125–131. [Google Scholar] [CrossRef]
- Gullu, H.; Hazirbaba, K. Unconfined compressive strength and post-freeze-thaw behavior of fine-grained soils treated with geofiber and synthetic fluid. Cold Reg. Sci. Technol. 2010, 62, 142–150. [Google Scholar] [CrossRef]
- Roustaei, M.; Eslami, A.; Ghazavi, M. Effects of freeze-thaw cycles on a fiber reinforced fine grained soil in relation to geotechnical parameters. Cold Reg. Sci. Technol. 2015, 120, 127–137. [Google Scholar] [CrossRef]
- Ahmadi, S.; Ghasemzadeh, H.; Changizi, F. Effects of A low-carbon emission additive on mechanical properties of fine-grained soil under freeze-thaw cycles. J. Clean. Prod. 2021, 304, 127157. [Google Scholar] [CrossRef]
- Güllü, H.; Khudir, A. Effect of freeze–thaw cycles on unconfined compressive strength of fine-grained soil treated with jute fiber, steel fiber and lime. Cold Reg. Sci. Technol. 2014, 106, 55–65. [Google Scholar] [CrossRef]
- Jiang, P.; Chen, W.; Wang, W.S.; Yang, J.; Wang, H.; Li, N.; Wang, W. Flexural behavior evaluation and energy dissipation mechanisms of modified iron tailings powder incorporating cement and fibers subjected to freeze-thaw cycles. J. Clean. Prod. 2022, 351, 131527. [Google Scholar] [CrossRef]
- Zhao, Y.Y.; Yang, Y.; Ling, X.Z.; Gong, W.; Li, G.; Su, L. Dynamic behavior of natural sand soils and fiber reinforced soils in heavy-haul railway embankment under multistage cyclic loading. Transp. Geotech. 2021, 28, 100507. [Google Scholar] [CrossRef]
- Zhao, Y.Y.; Wang, J.H.; Su, L.; Ling, X.Z.; Zhang, Y.Q. Influence of a binder material on the mechanical properties and model parameters of a subgrade filler. Arab. J. Geosci. 2022, 15, 60. [Google Scholar] [CrossRef]
- Wang, J.H.; Li, Y.; Yang, P.; Ling, X.; Zhao, Y.; Su, L. Experimental investigation on dynamic characteristics of fiber-binder modified sub-grade filler after freezing-thawing under cyclic loading. Transp. Geotech. 2023, 39, 100936. [Google Scholar] [CrossRef]
- Zhao, Y.Y.; Ling, X.Z.; Gong, W.M.; Li, P.; Li, G.; Wang, L. Mechanical properties of fiber-reinforced soil under triaxial compression and parameter determination based on the Duncan-Chang model. Appl. Sci. 2020, 10, 9043. [Google Scholar] [CrossRef]
- Zhao, Y.Y.; Yang, Y.; Ling, X.Z.; Li, G.Y.; Gong, W.M. Mechanical behaviors of natural sand soils and modified soils in heavy-haul railway embankment. Adv. Civ. Eng. 2020, 2020, 8843164. [Google Scholar] [CrossRef]
- Tang, Y.; Li, J. Experimental study on dynamic cumulative axial-strain performance of freezing-thawing saturated sandy silt. Cold Reg. Sci. Technol. 2018, 155, 100–107. [Google Scholar] [CrossRef]
- Jing, R.; Zhang, F.; Feng, D.; Liu, X.; Scarpas, A. Dynamic shear modulus and damping ratio of compacted silty clay subjected to freeze-thaw cycles. J. Mater. Civ. Eng. 2019, 31, 04019244. [Google Scholar] [CrossRef]
- Li, Q.L.; Ling, X.Z.; Sheng, D.C. Elasto-plastic behaviour of frozen soil subjected to long-term low-level repeated loading, part I: Experimental investigation. Cold Reg. Sci. Technol. 2016, 125, 138–151. [Google Scholar] [CrossRef]
- Wang, J.H.; Ling, X.Z.; Li, Q.L.; Zhang, F.; Li, Y. Accumulated permanent strain and critical dynamic stress of frozen silty clay under cyclic loading. Cold Reg. Sci. Technol. 2018, 153, 130–143. [Google Scholar] [CrossRef]
- Xu, X.T.; Li, Q.L.; Xu, G.F. Investigation on the behavior of frozen silty clay subjected to monotonic and cyclic triaxial loading. Acta Geotech. 2020, 15, 1289–1302. [Google Scholar] [CrossRef]
- Zhou, Z.W.; Ma, W.; Li, G.Y.; Shen, M.D. A novel evaluation method for accumulative plastic deformation of granular materials subjected to cyclic loading: Taking frozen subgrade soil as an example. Cold Reg. Sci. Technol. 2020, 179, 103152. [Google Scholar] [CrossRef]
- Wichtmann, T.; Niemunis, A.; Triantafyllidis, T. Strain accumulation in sand due to cyclic loading: Drained triaxial tests. Soil Dyn. Earthq. Eng. 2005, 25, 967–979. [Google Scholar] [CrossRef]
- Karg, C.; Haegeman, W. Elasto-plastic long-term behavior of granular soils: Experimental investigation. Soil Dyn. Earthq. Eng. 2009, 29, 155–172. [Google Scholar] [CrossRef]
- Li, Z. Study on the Vertical Loading Transmission through the Track Structure and the Characteristics of Subgrade Dynamic Stress; China Academy of Railway Sciences: Beijing, China, 2000. (In Chinese) [Google Scholar]
- Nie, R.; Mei, H.; Leng, W.; Ruan, B.; Li, Y.; Chen, X. Characterization of permanent deformation of fine-grained subgrade soil under intermittent loading. Soil Dyn. Earthq. Eng. 2020, 139, 106395. [Google Scholar] [CrossRef]
- Wang, K.; Zhuang, Y. Characterizing the permanent deformation Response-Behavior of subgrade material under cyclic loading based on the shakedown theory. Constr. Build. Mater. 2021, 311, 125325. [Google Scholar] [CrossRef]
- Lei, H.; Song, Y.; Qi, Z.; Liu, J.; Liu, X. Accumulative plastic strain behaviors and microscopic structural characters of artificially freeze-thaw soft clay under dynamic cyclic loading. Cold Reg. Sci. Technol. 2019, 168, 102895. [Google Scholar] [CrossRef]
- Li, Z.; Liu, L.; Yan, S.; Zhang, M.; Xia, J.; Xie, Y. Effect of freeze-thaw cycles on mechanical and porosity properties of recycled construction waste mixtures. Constr. Build. Mater. 2019, 210, 347–363. [Google Scholar] [CrossRef]
- Kravchenko, E.; Liu, J.K.; Krainiukov, A.; Chang, D. Dynamic behavior of clay modified with polypropylene fiber under freeze-thaw cycles. Transp. Geotech. 2019, 21, 100282. [Google Scholar] [CrossRef]
- Wang, T.; Liu, Y.; Yan, H.; Xu, L. An experimental study on the mechanical properties of silty soils under repeated freeze–thaw cycles. Cold Reg. Sci. Technol. 2015, 112, 51–65. [Google Scholar] [CrossRef]
- Tao, Z.; Zhang, Y.; Chen, X.; Gu, X. Effects of freeze-thaw cycles on the mechanical properties of cement-fiber composite treated silty clay. Constr. Build. Mater. 2022, 316, 125867. [Google Scholar] [CrossRef]
- Luo, Y.; Qu, D.; Wang, G.; Li, X.; Zhang, G. Degradation model of the dynamic mechanical properties and damage failure law of sandstone under freeze-thaw action. Soil Dyn. Earthq. Eng. 2020, 132, 106094. [Google Scholar] [CrossRef]


| Type | Density /g·cm−3 | Diameter/µm | Melting Point /℃ | Ignition Point /℃ | Elongation at Break /% | Elasticity Modulus /GPa | Tensile Strength /MPa |
|---|---|---|---|---|---|---|---|
| Fascicular monofilament | 0.91 | 31 | 165~170 | 590 | 30 | ≥3.5 | ≥350 |
| Composition | Silicate | Aluminate | Tetracalcium Aluminoferrite | Sulfate | Silicon Dioxide | Sulfur Aluminate |
|---|---|---|---|---|---|---|
| Content | 14% | 36% | 21% | 9% | 3% | 17% |
| Test No. | Moisture Content/% | Confining Pressure/kPa | Freeze–Thaw Cycles |
|---|---|---|---|
| DU01 | 8.2 | 100 | 0 |
| DU02 | 1 | ||
| DU03 | 3 | ||
| DU04 | 5 | ||
| DU05 | 7 | ||
| DU06 | 9 |
| Test No. | Fiber Length/mm | Fiber Content/% | Addition of Binder Material/% | Freeze–Thaw Cycles |
|---|---|---|---|---|
| DM01 | 12 | 0.3 | 7 | 0 |
| DM02 | 1 | |||
| DM03 | 3 | |||
| DM04 | 5 | |||
| DM05 | 7 | |||
| DM06 | 9 |
Disclaimer/Publisher’s Note: The statements, opinions and data contained in all publications are solely those of the individual author(s) and contributor(s) and not of MDPI and/or the editor(s). MDPI and/or the editor(s) disclaim responsibility for any injury to people or property resulting from any ideas, methods, instructions or products referred to in the content. |
© 2023 by the authors. Licensee MDPI, Basel, Switzerland. This article is an open access article distributed under the terms and conditions of the Creative Commons Attribution (CC BY) license (https://creativecommons.org/licenses/by/4.0/).
Share and Cite
Wang, J.; Li, Y.; Ling, X.; Yang, P.; Zhao, Y. A Contrast Analysis of Deformation Characteristics and Critical Dynamic Stress of Natural and Fiber-Binder Reinforced Subgrade Filler after Different Freeze-Thaw Cycles. Materials 2023, 16, 1520. https://doi.org/10.3390/ma16041520
Wang J, Li Y, Ling X, Yang P, Zhao Y. A Contrast Analysis of Deformation Characteristics and Critical Dynamic Stress of Natural and Fiber-Binder Reinforced Subgrade Filler after Different Freeze-Thaw Cycles. Materials. 2023; 16(4):1520. https://doi.org/10.3390/ma16041520
Chicago/Turabian StyleWang, Jiahui, Yan Li, Xianzhang Ling, Ping Yang, and Yingying Zhao. 2023. "A Contrast Analysis of Deformation Characteristics and Critical Dynamic Stress of Natural and Fiber-Binder Reinforced Subgrade Filler after Different Freeze-Thaw Cycles" Materials 16, no. 4: 1520. https://doi.org/10.3390/ma16041520