

Synergistic Effect and Mechanism of Nano-C-S-H Seed and Calcium Sulfoaluminate Cement on the Early Mechanical Properties of Portland Cement
Abstract
:1. Introduction
2. Materials and Methods
2.1. Materials
2.2. Cement Paste Specimens
2.3. Methods
2.3.1. Compressive Strength
2.3.2. Hydration Heat
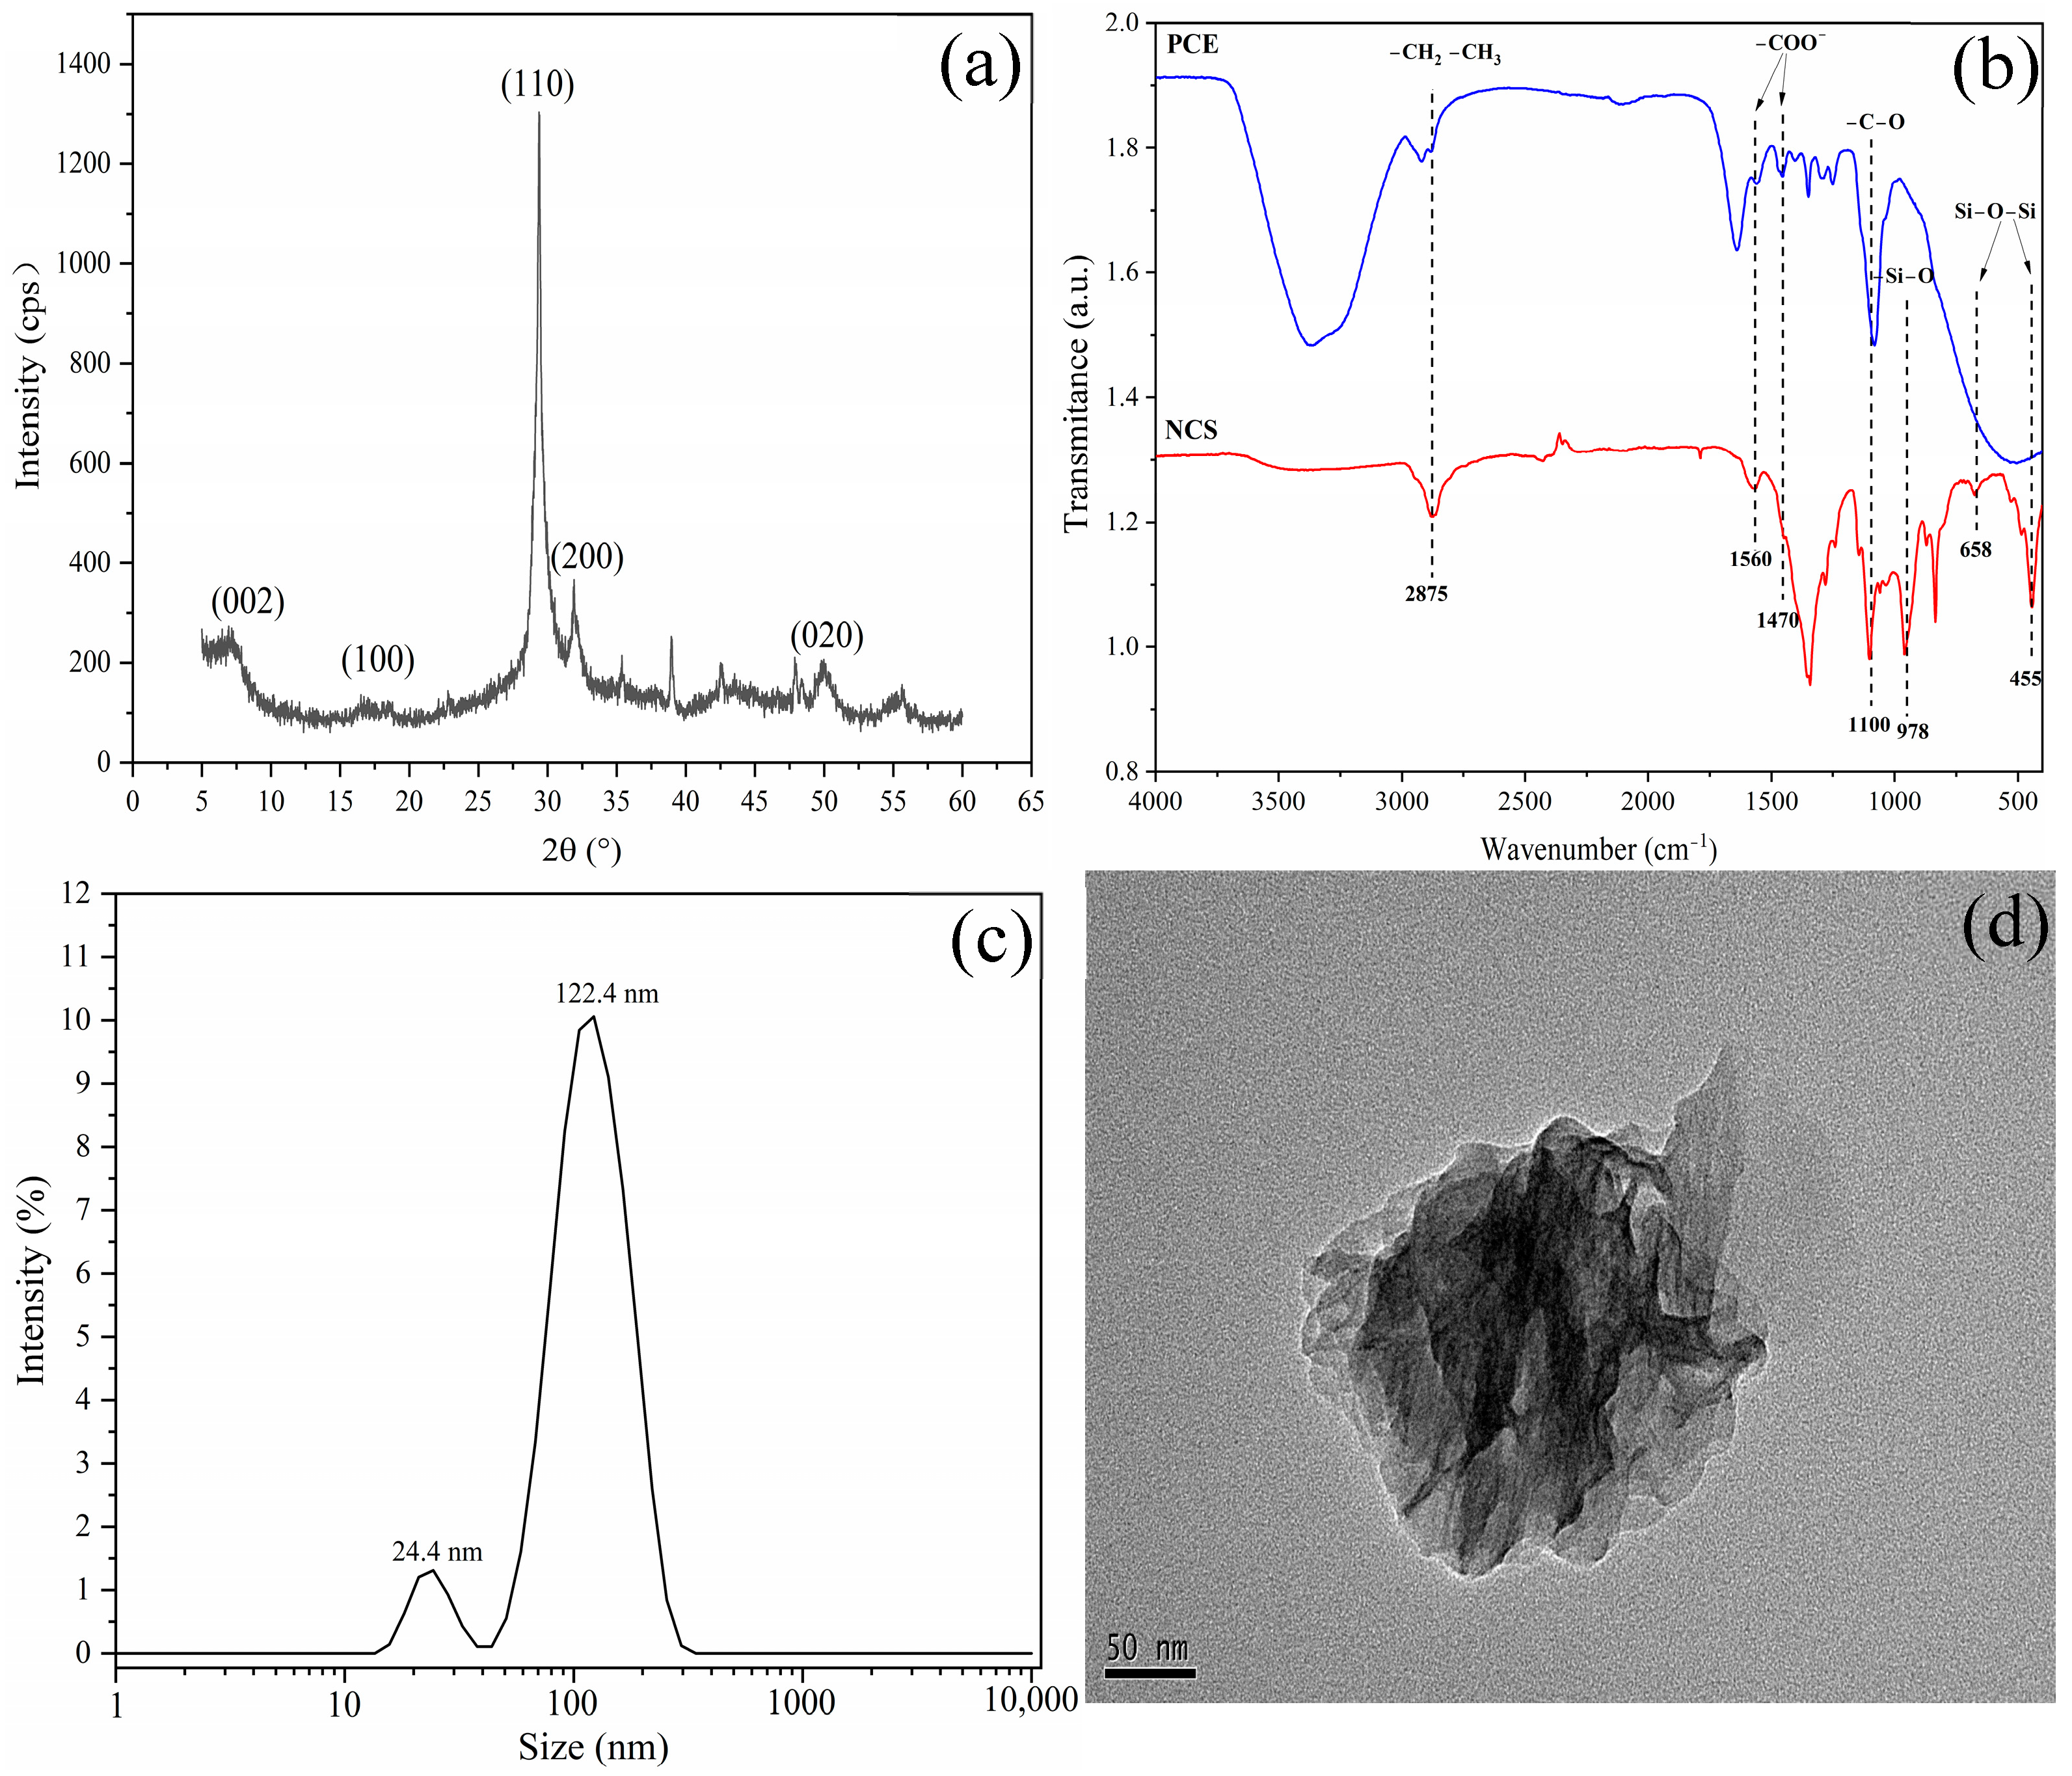
2.3.3. XRD Analysis
2.3.4. TGA Analysis
2.3.5. MIP Analysis
2.3.6. SEM Analysis
3. Results and Discussion
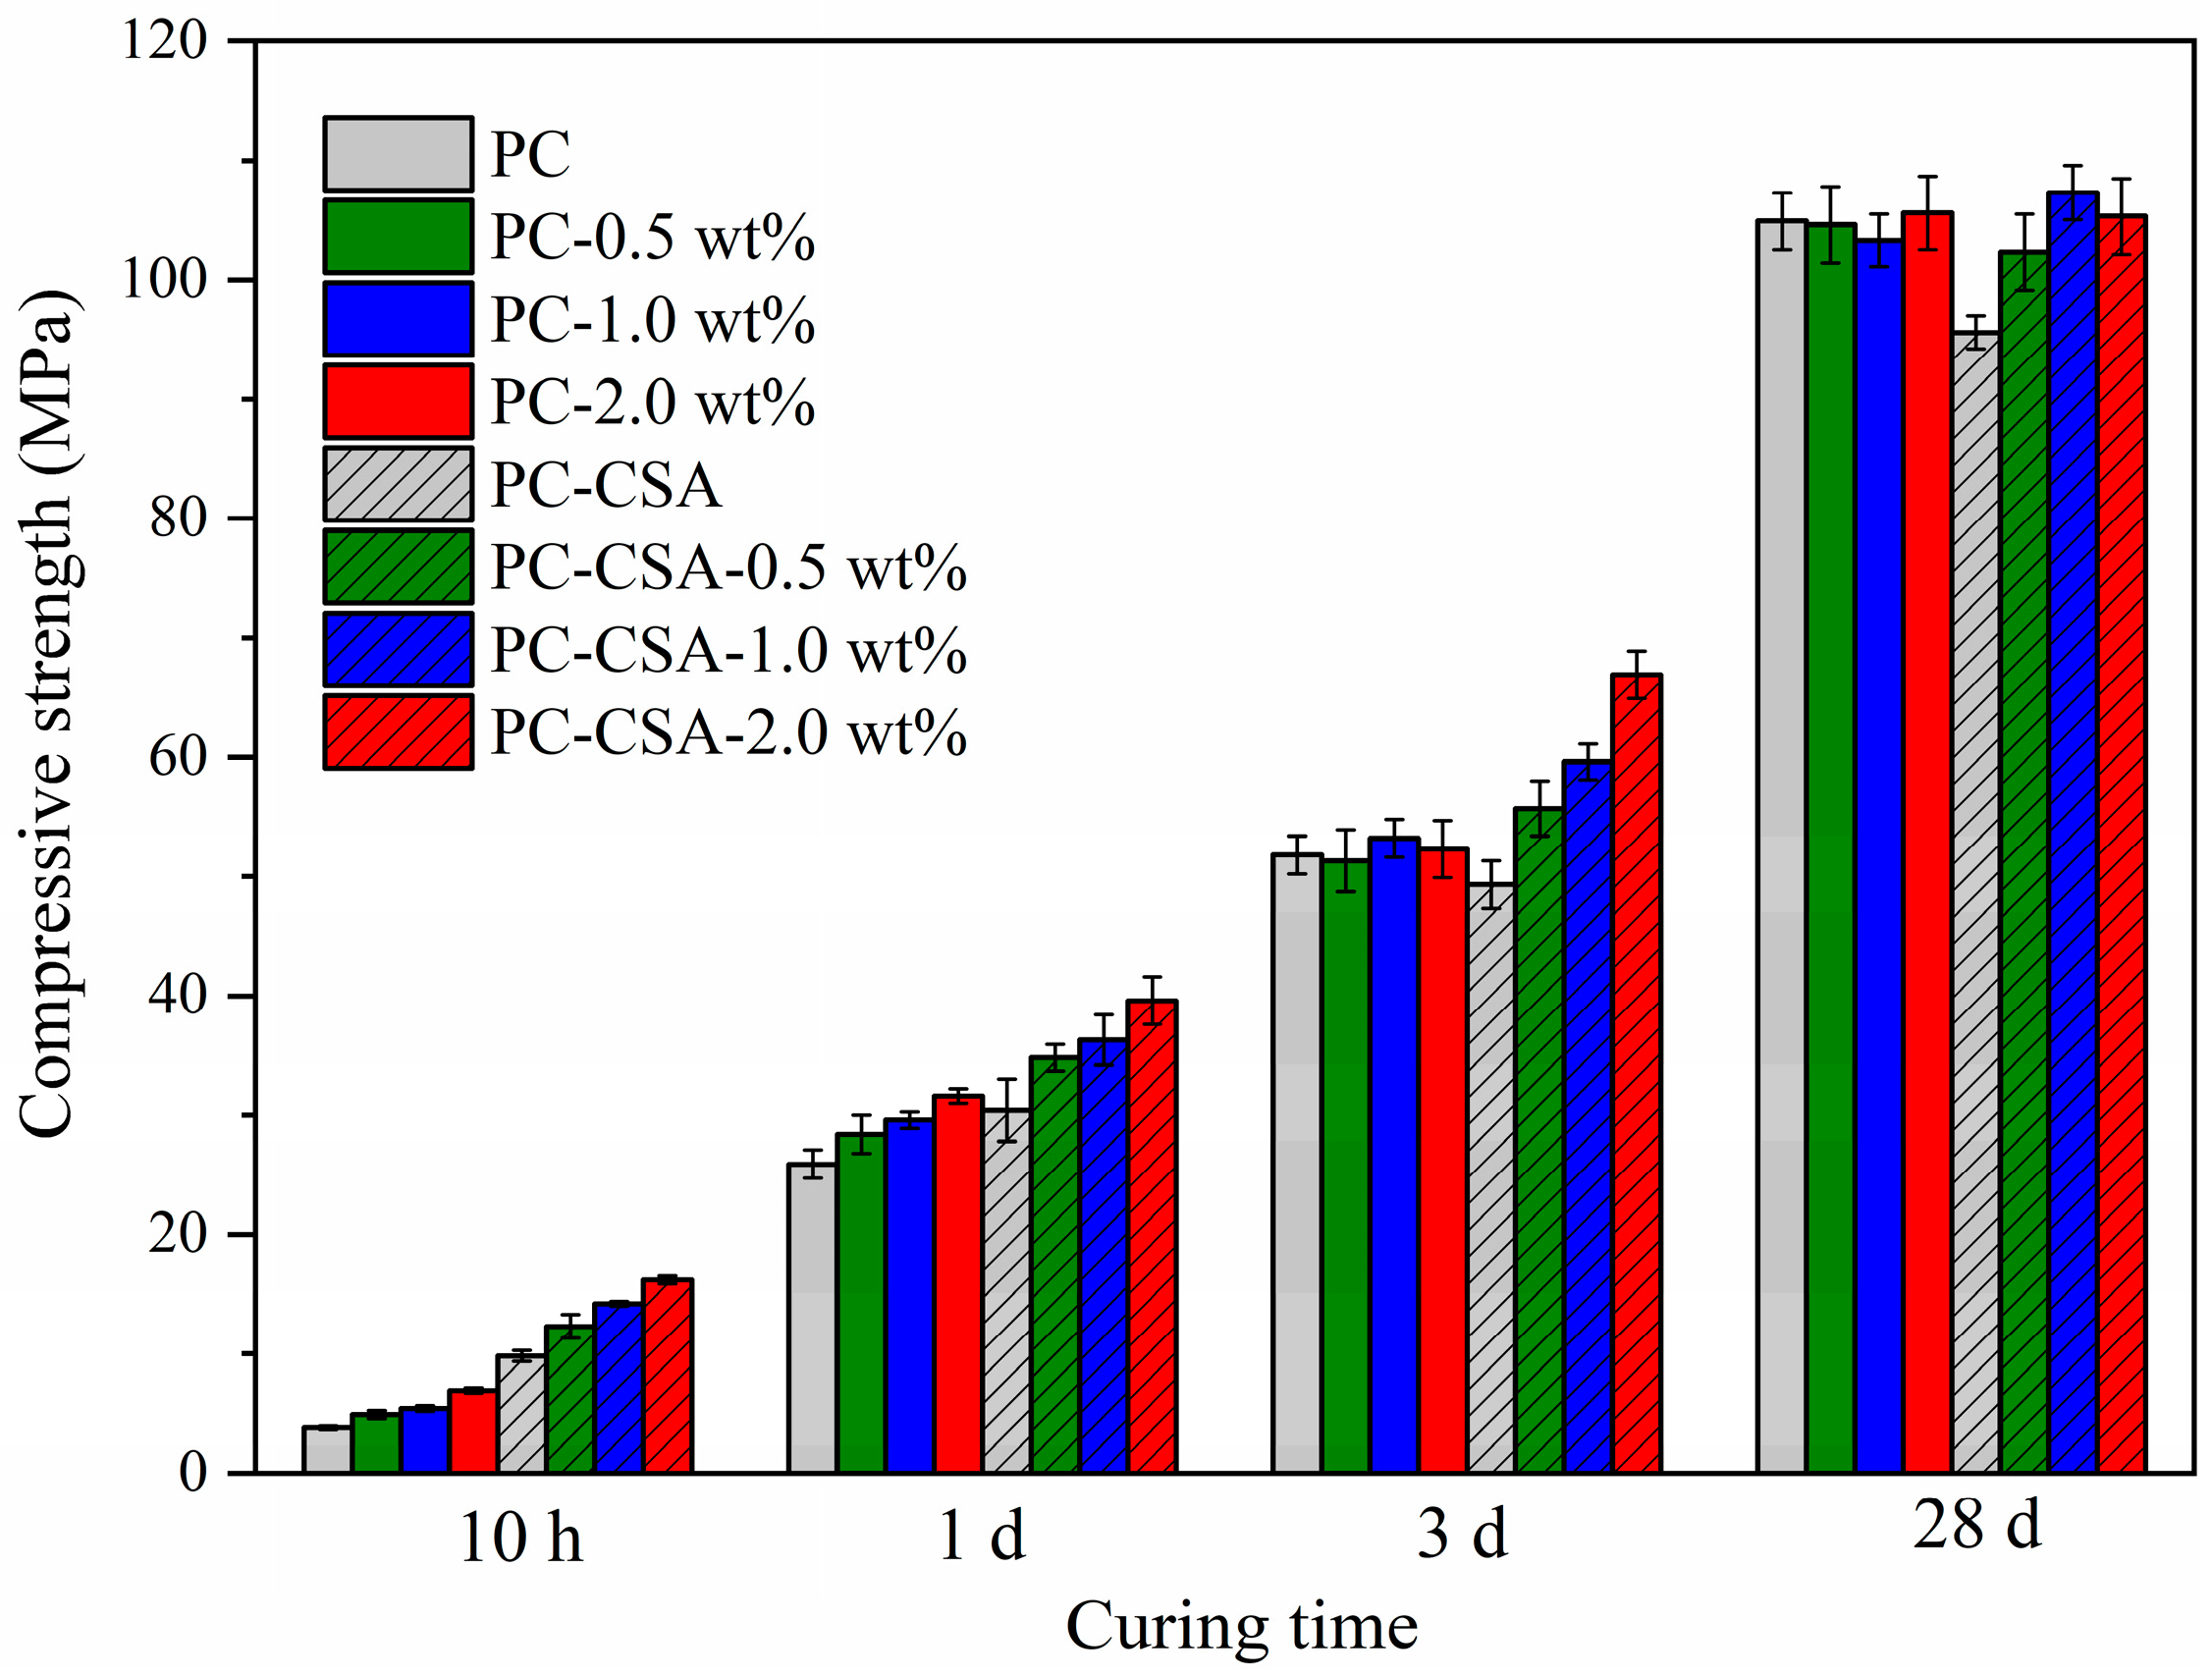
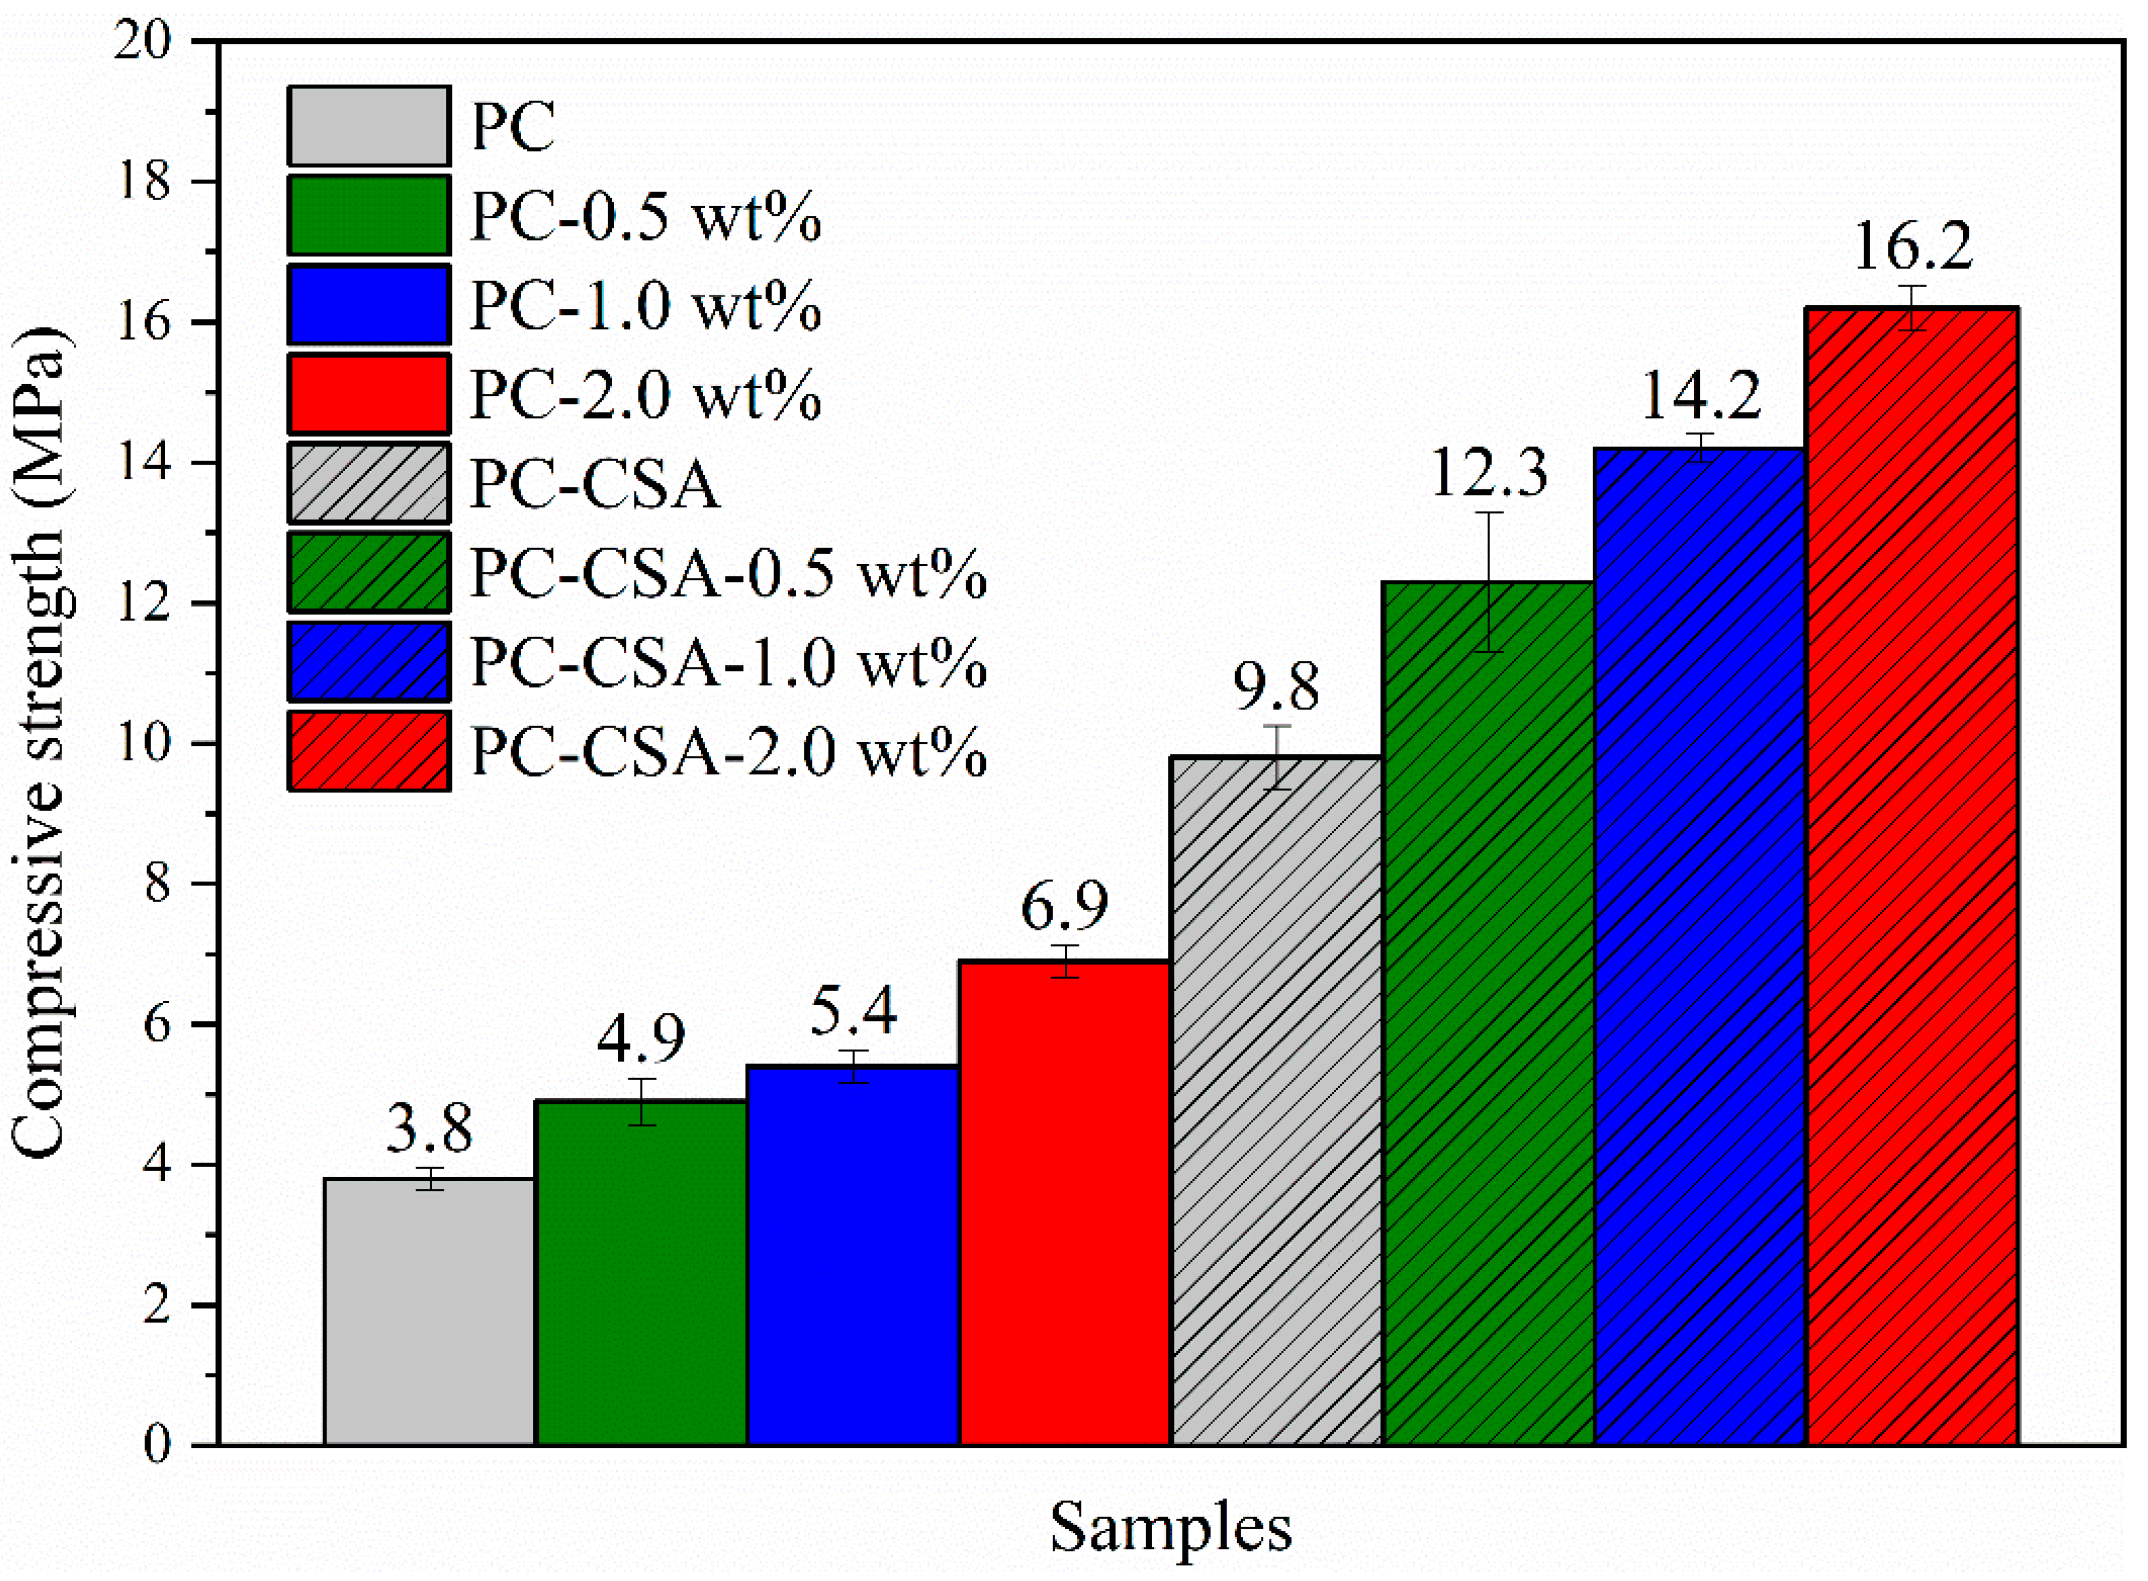
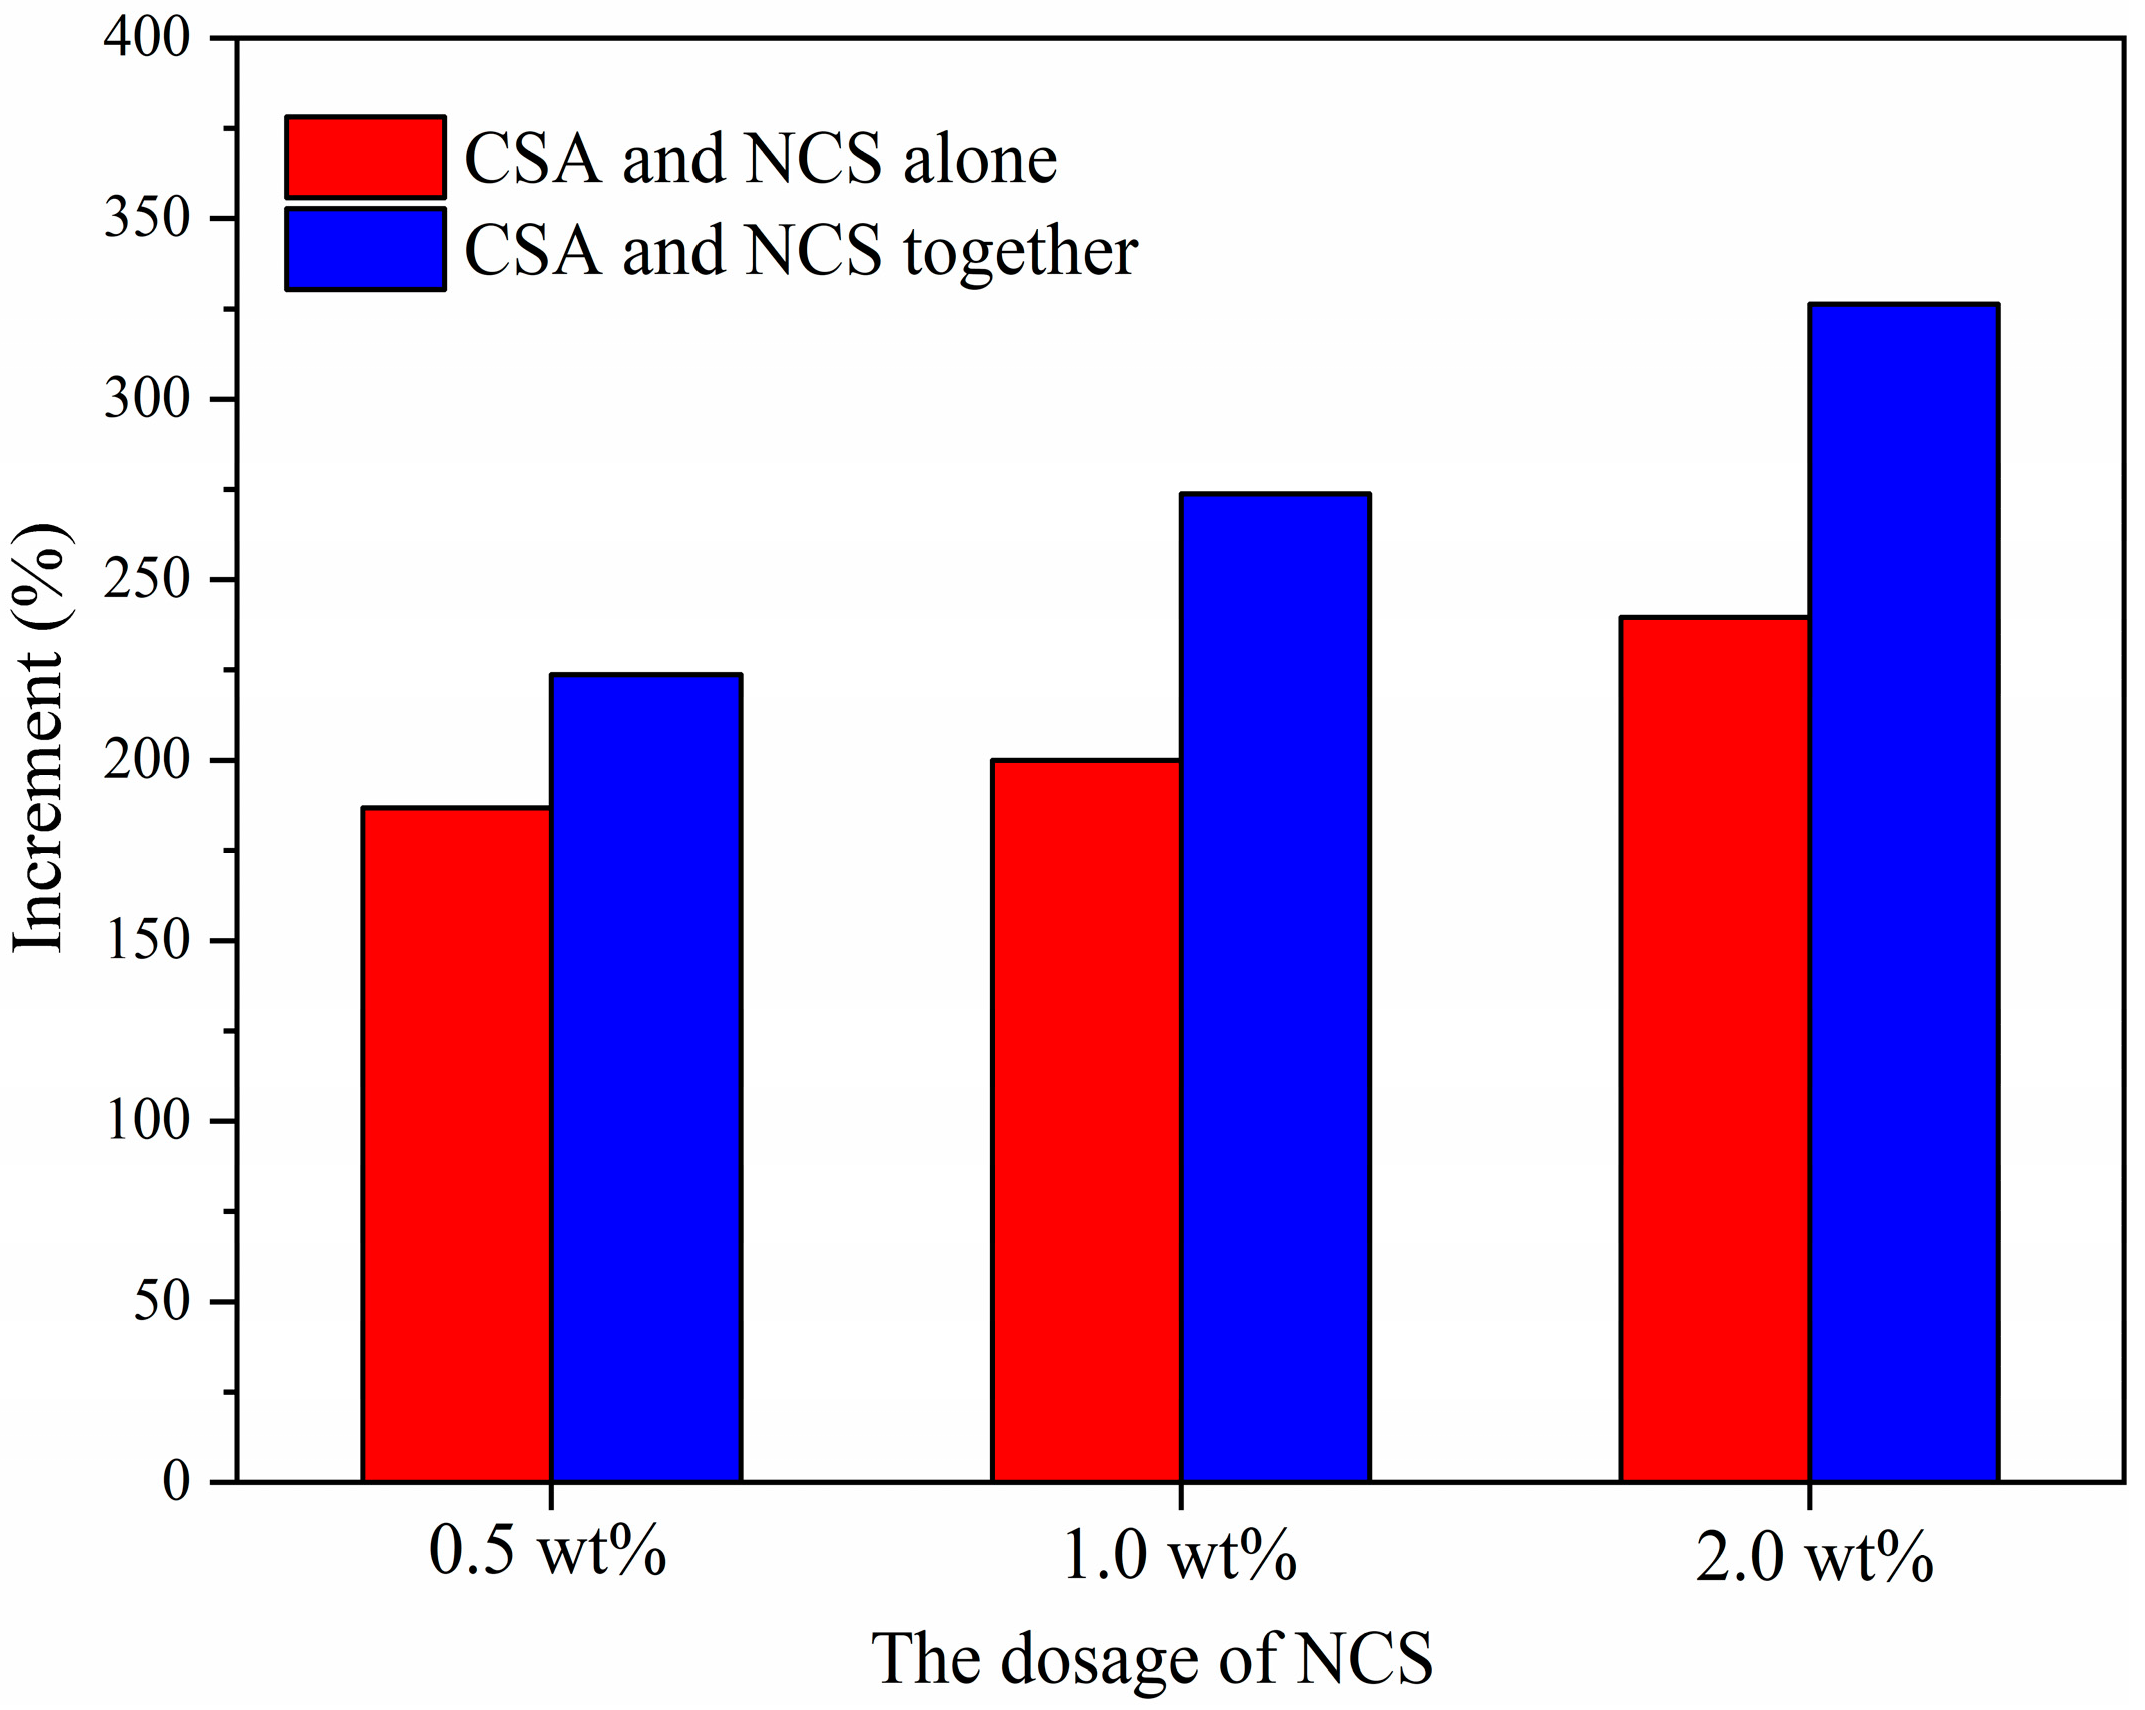
3.1. Compressive Strength
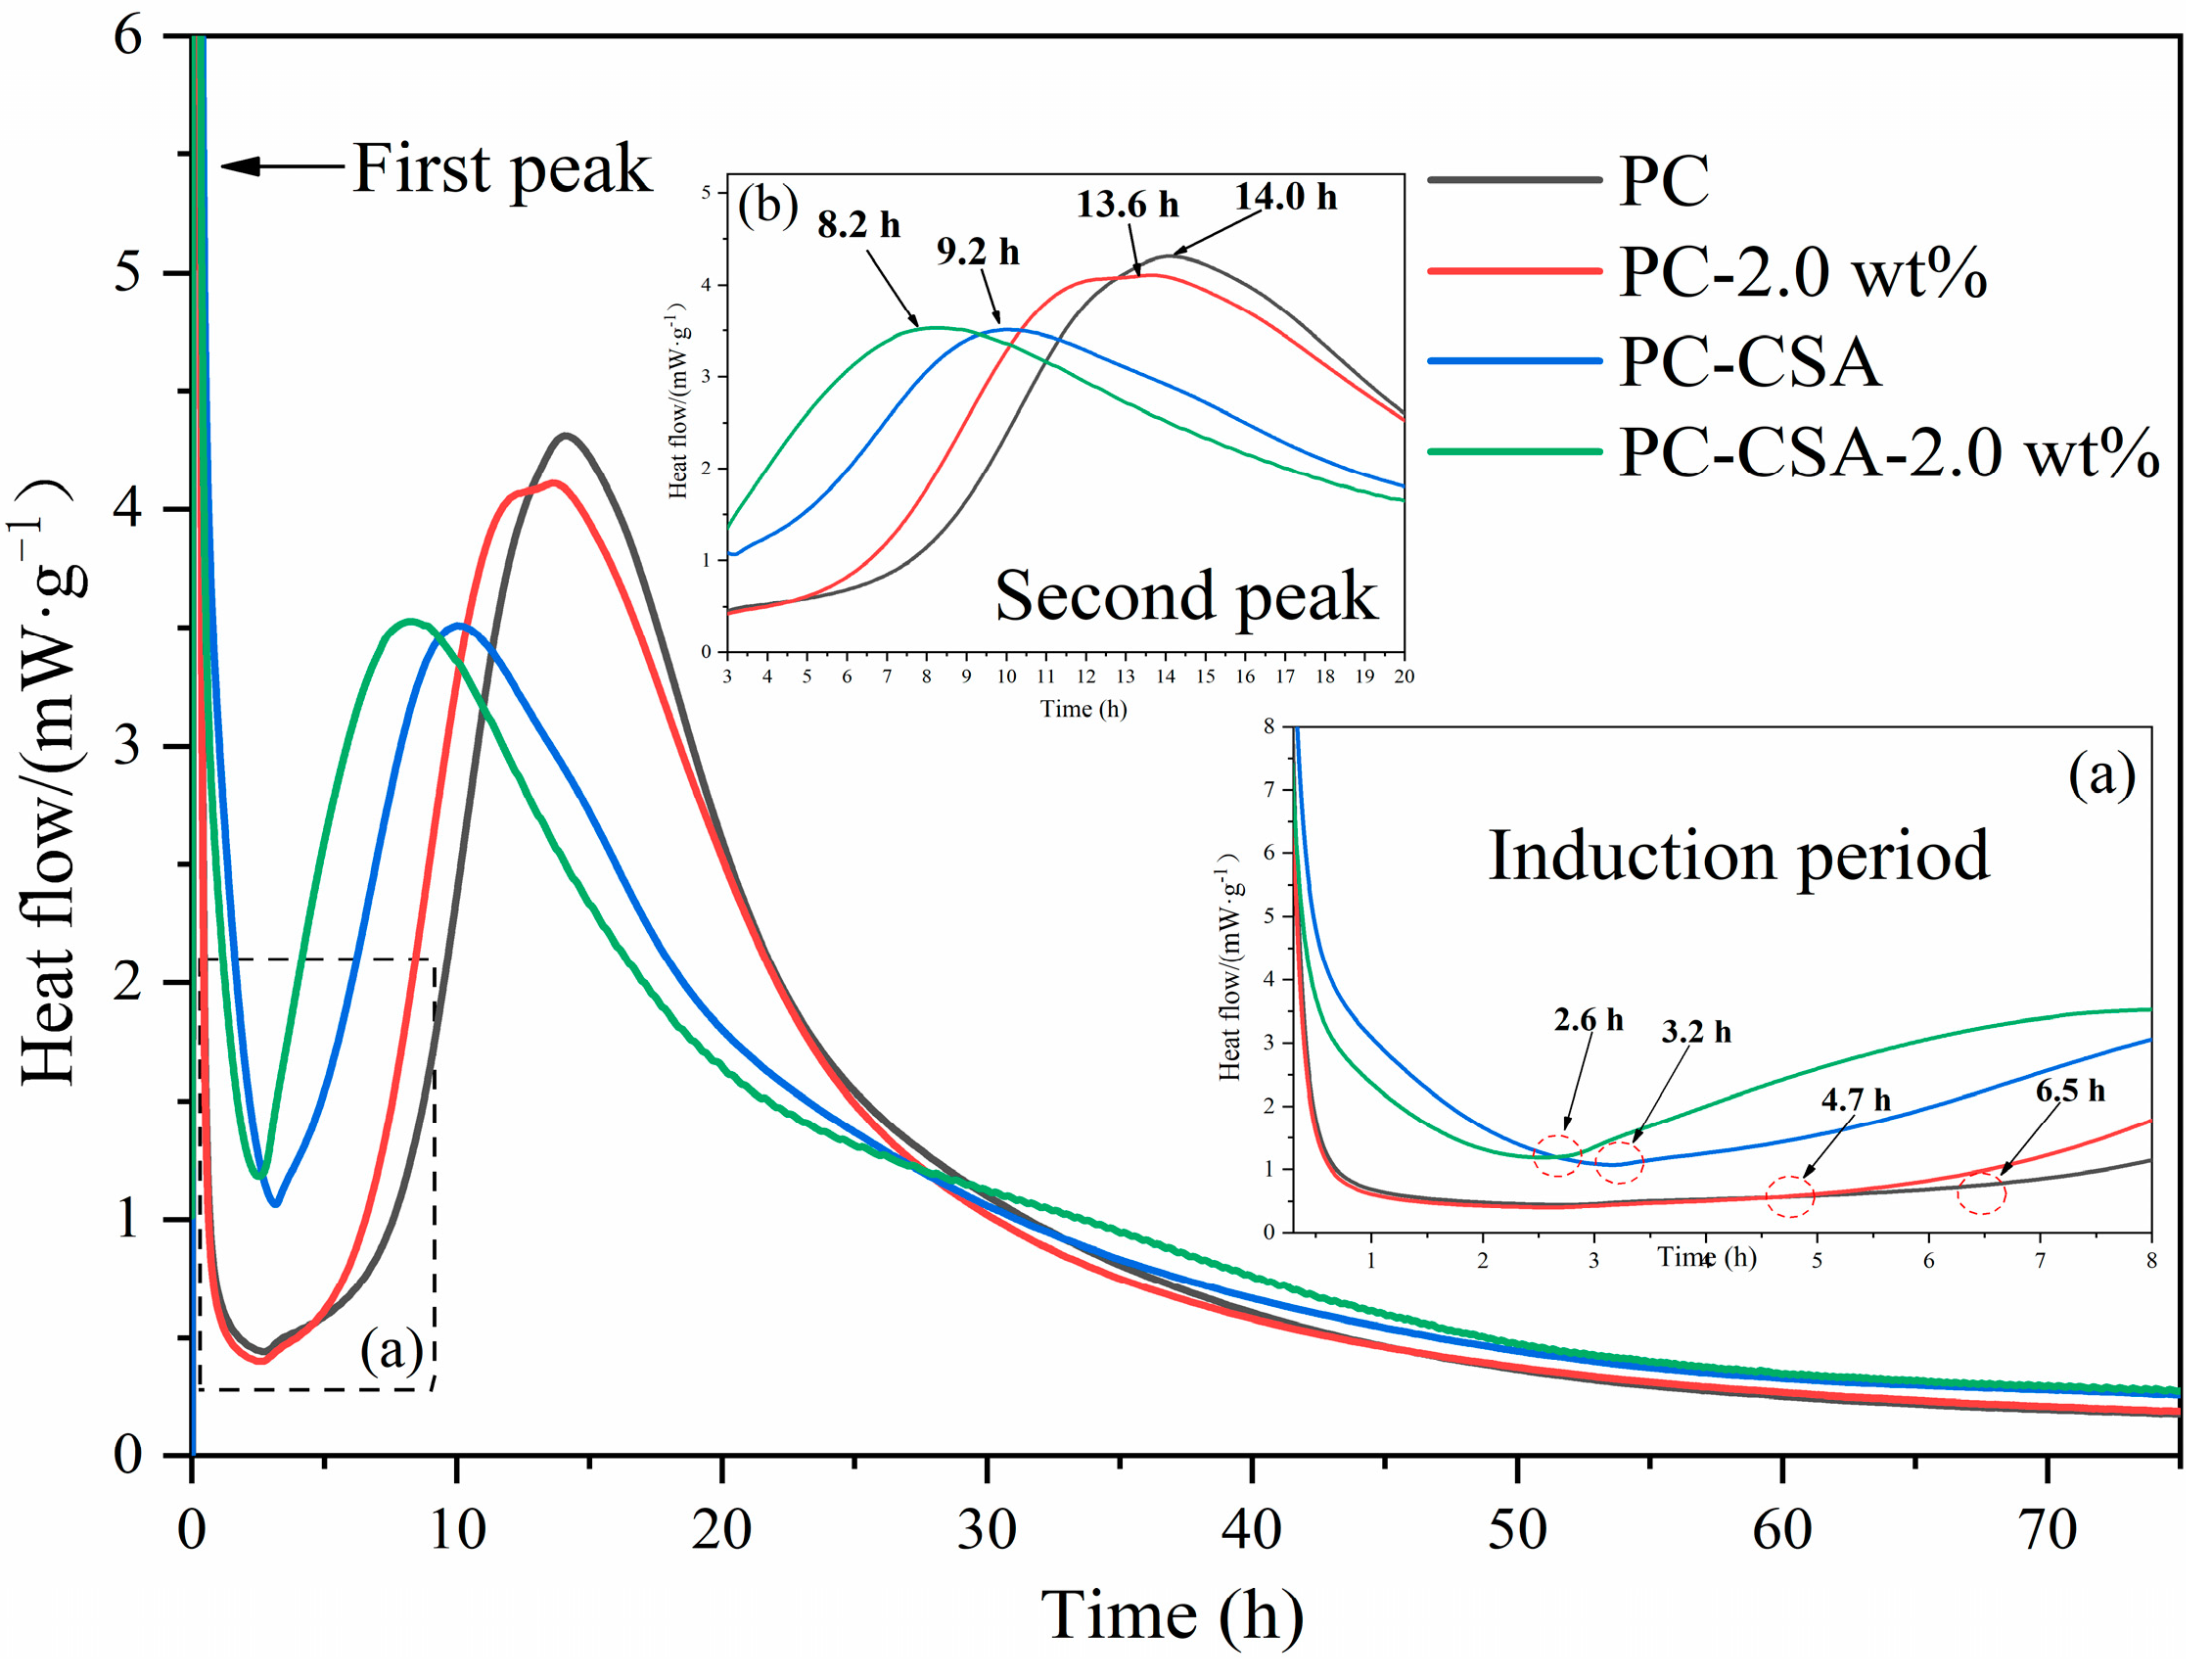
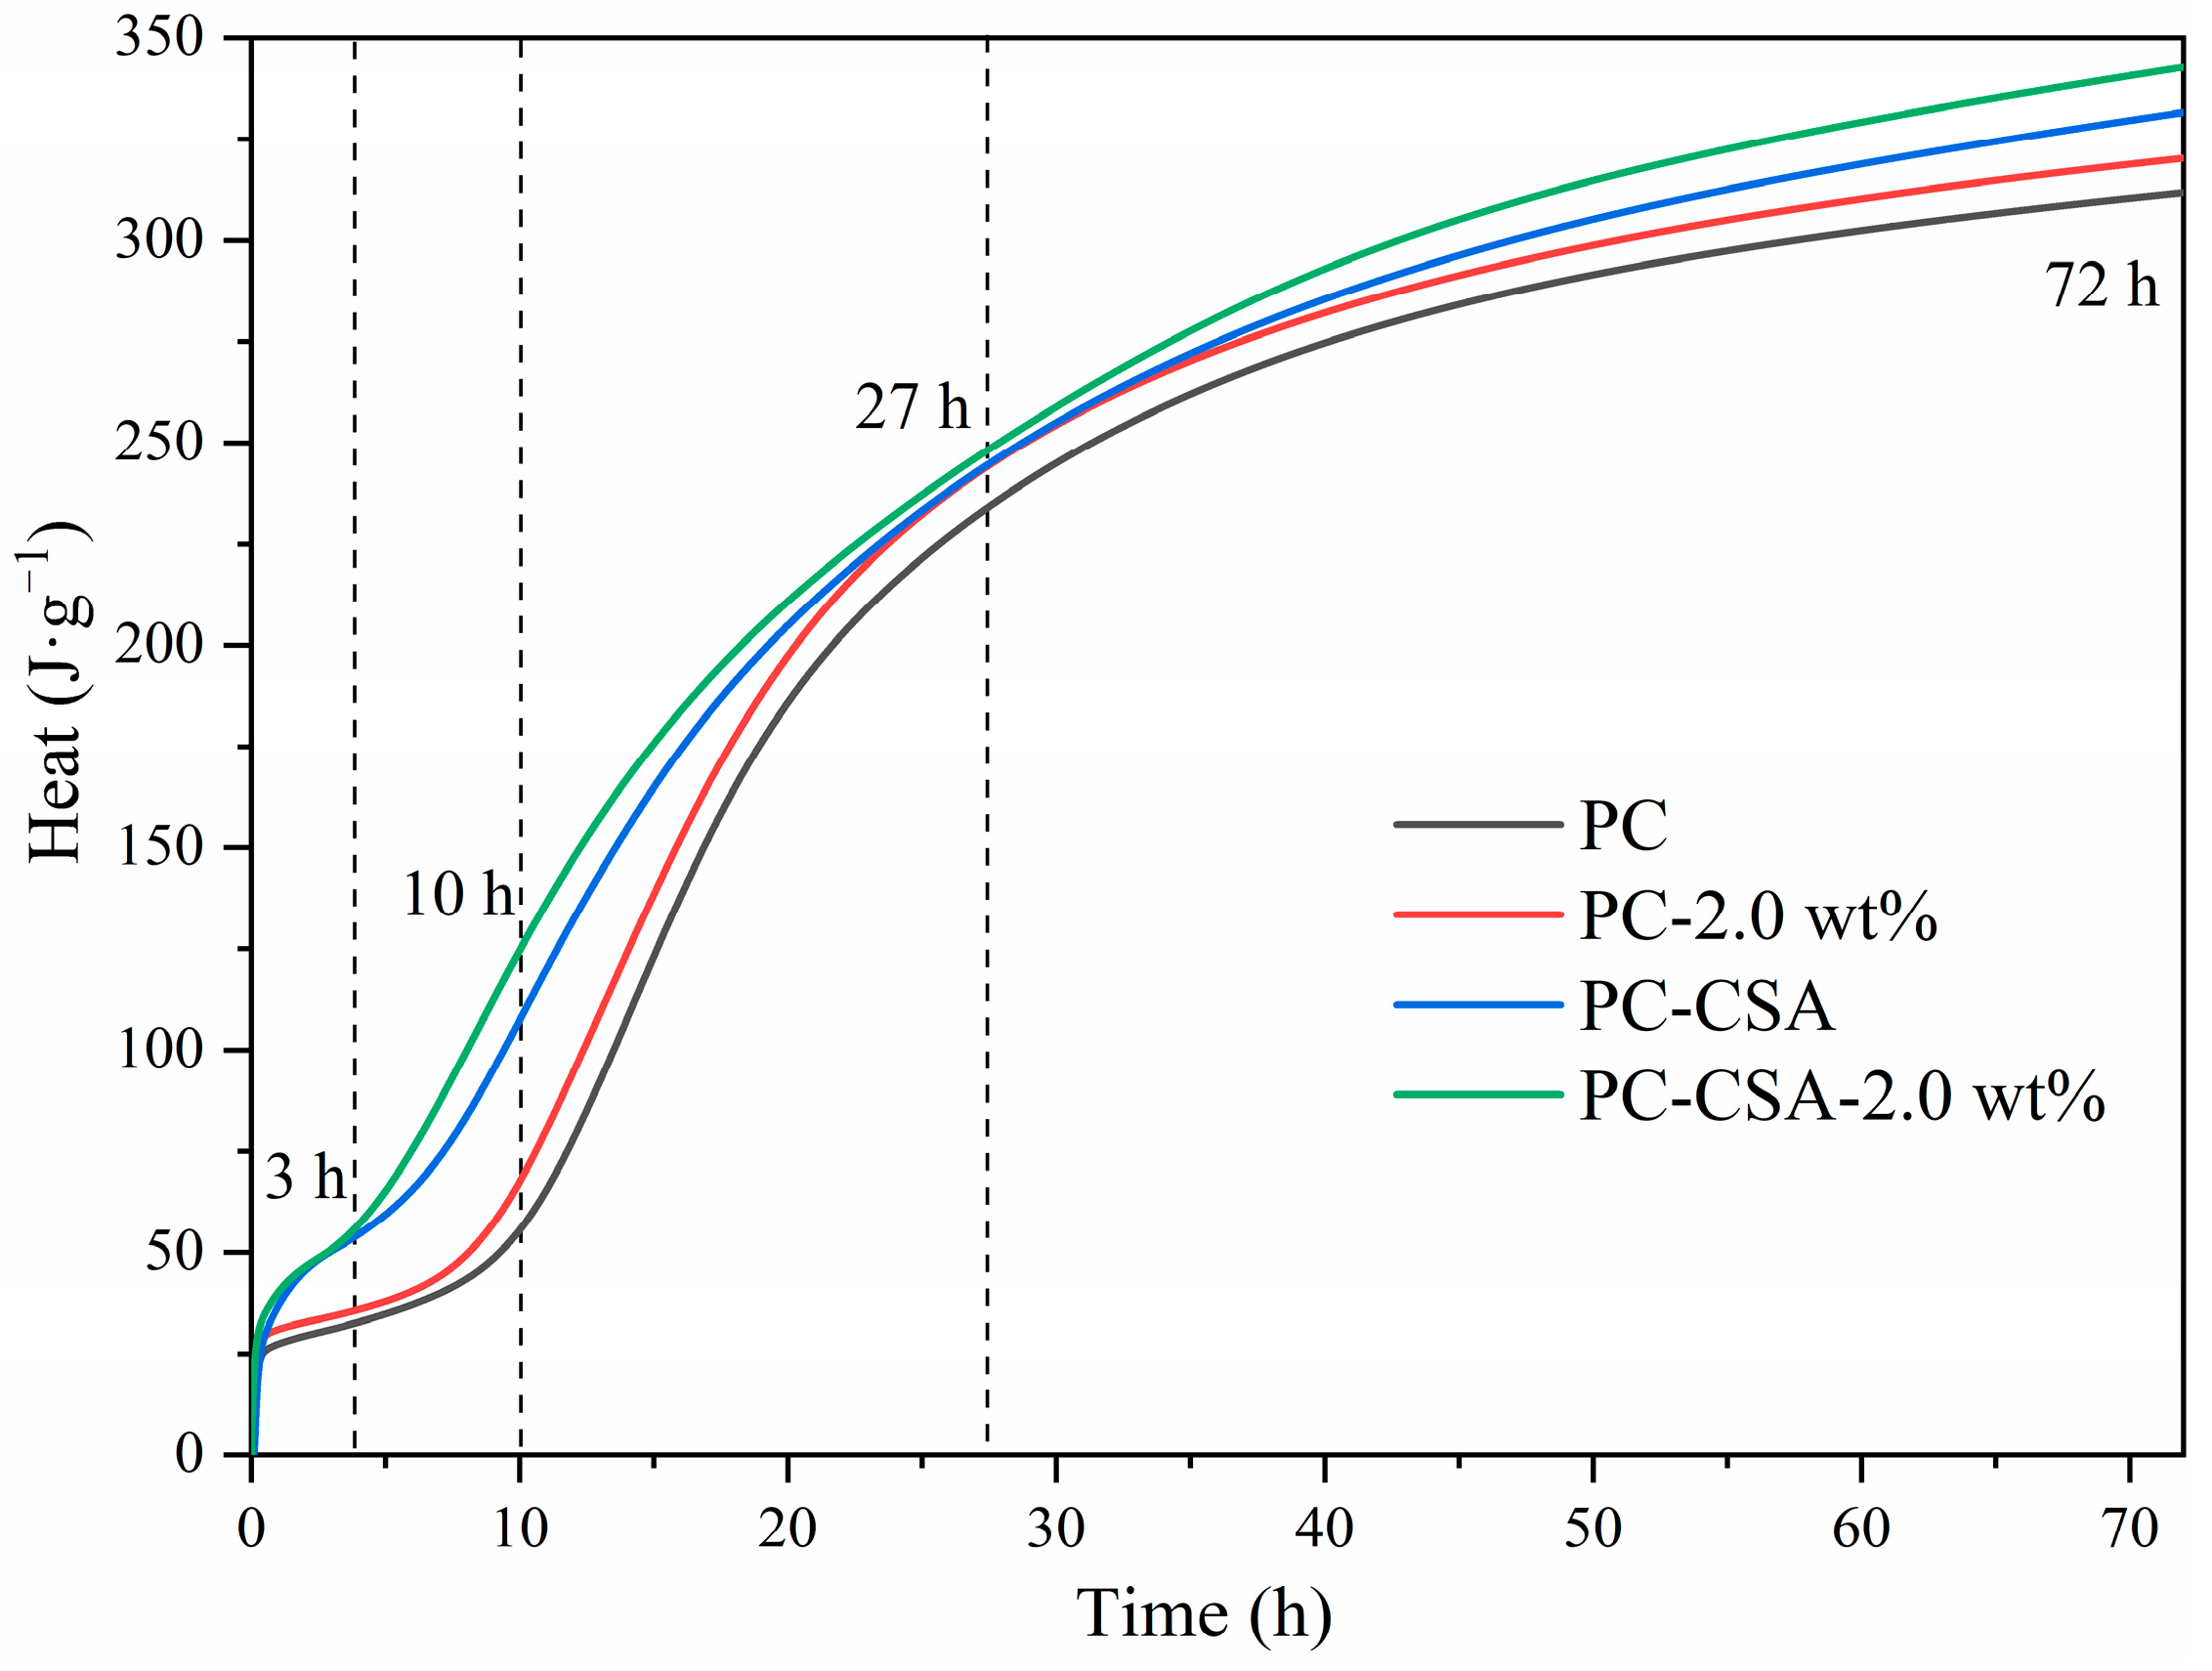
3.2. Hydration Kinetics
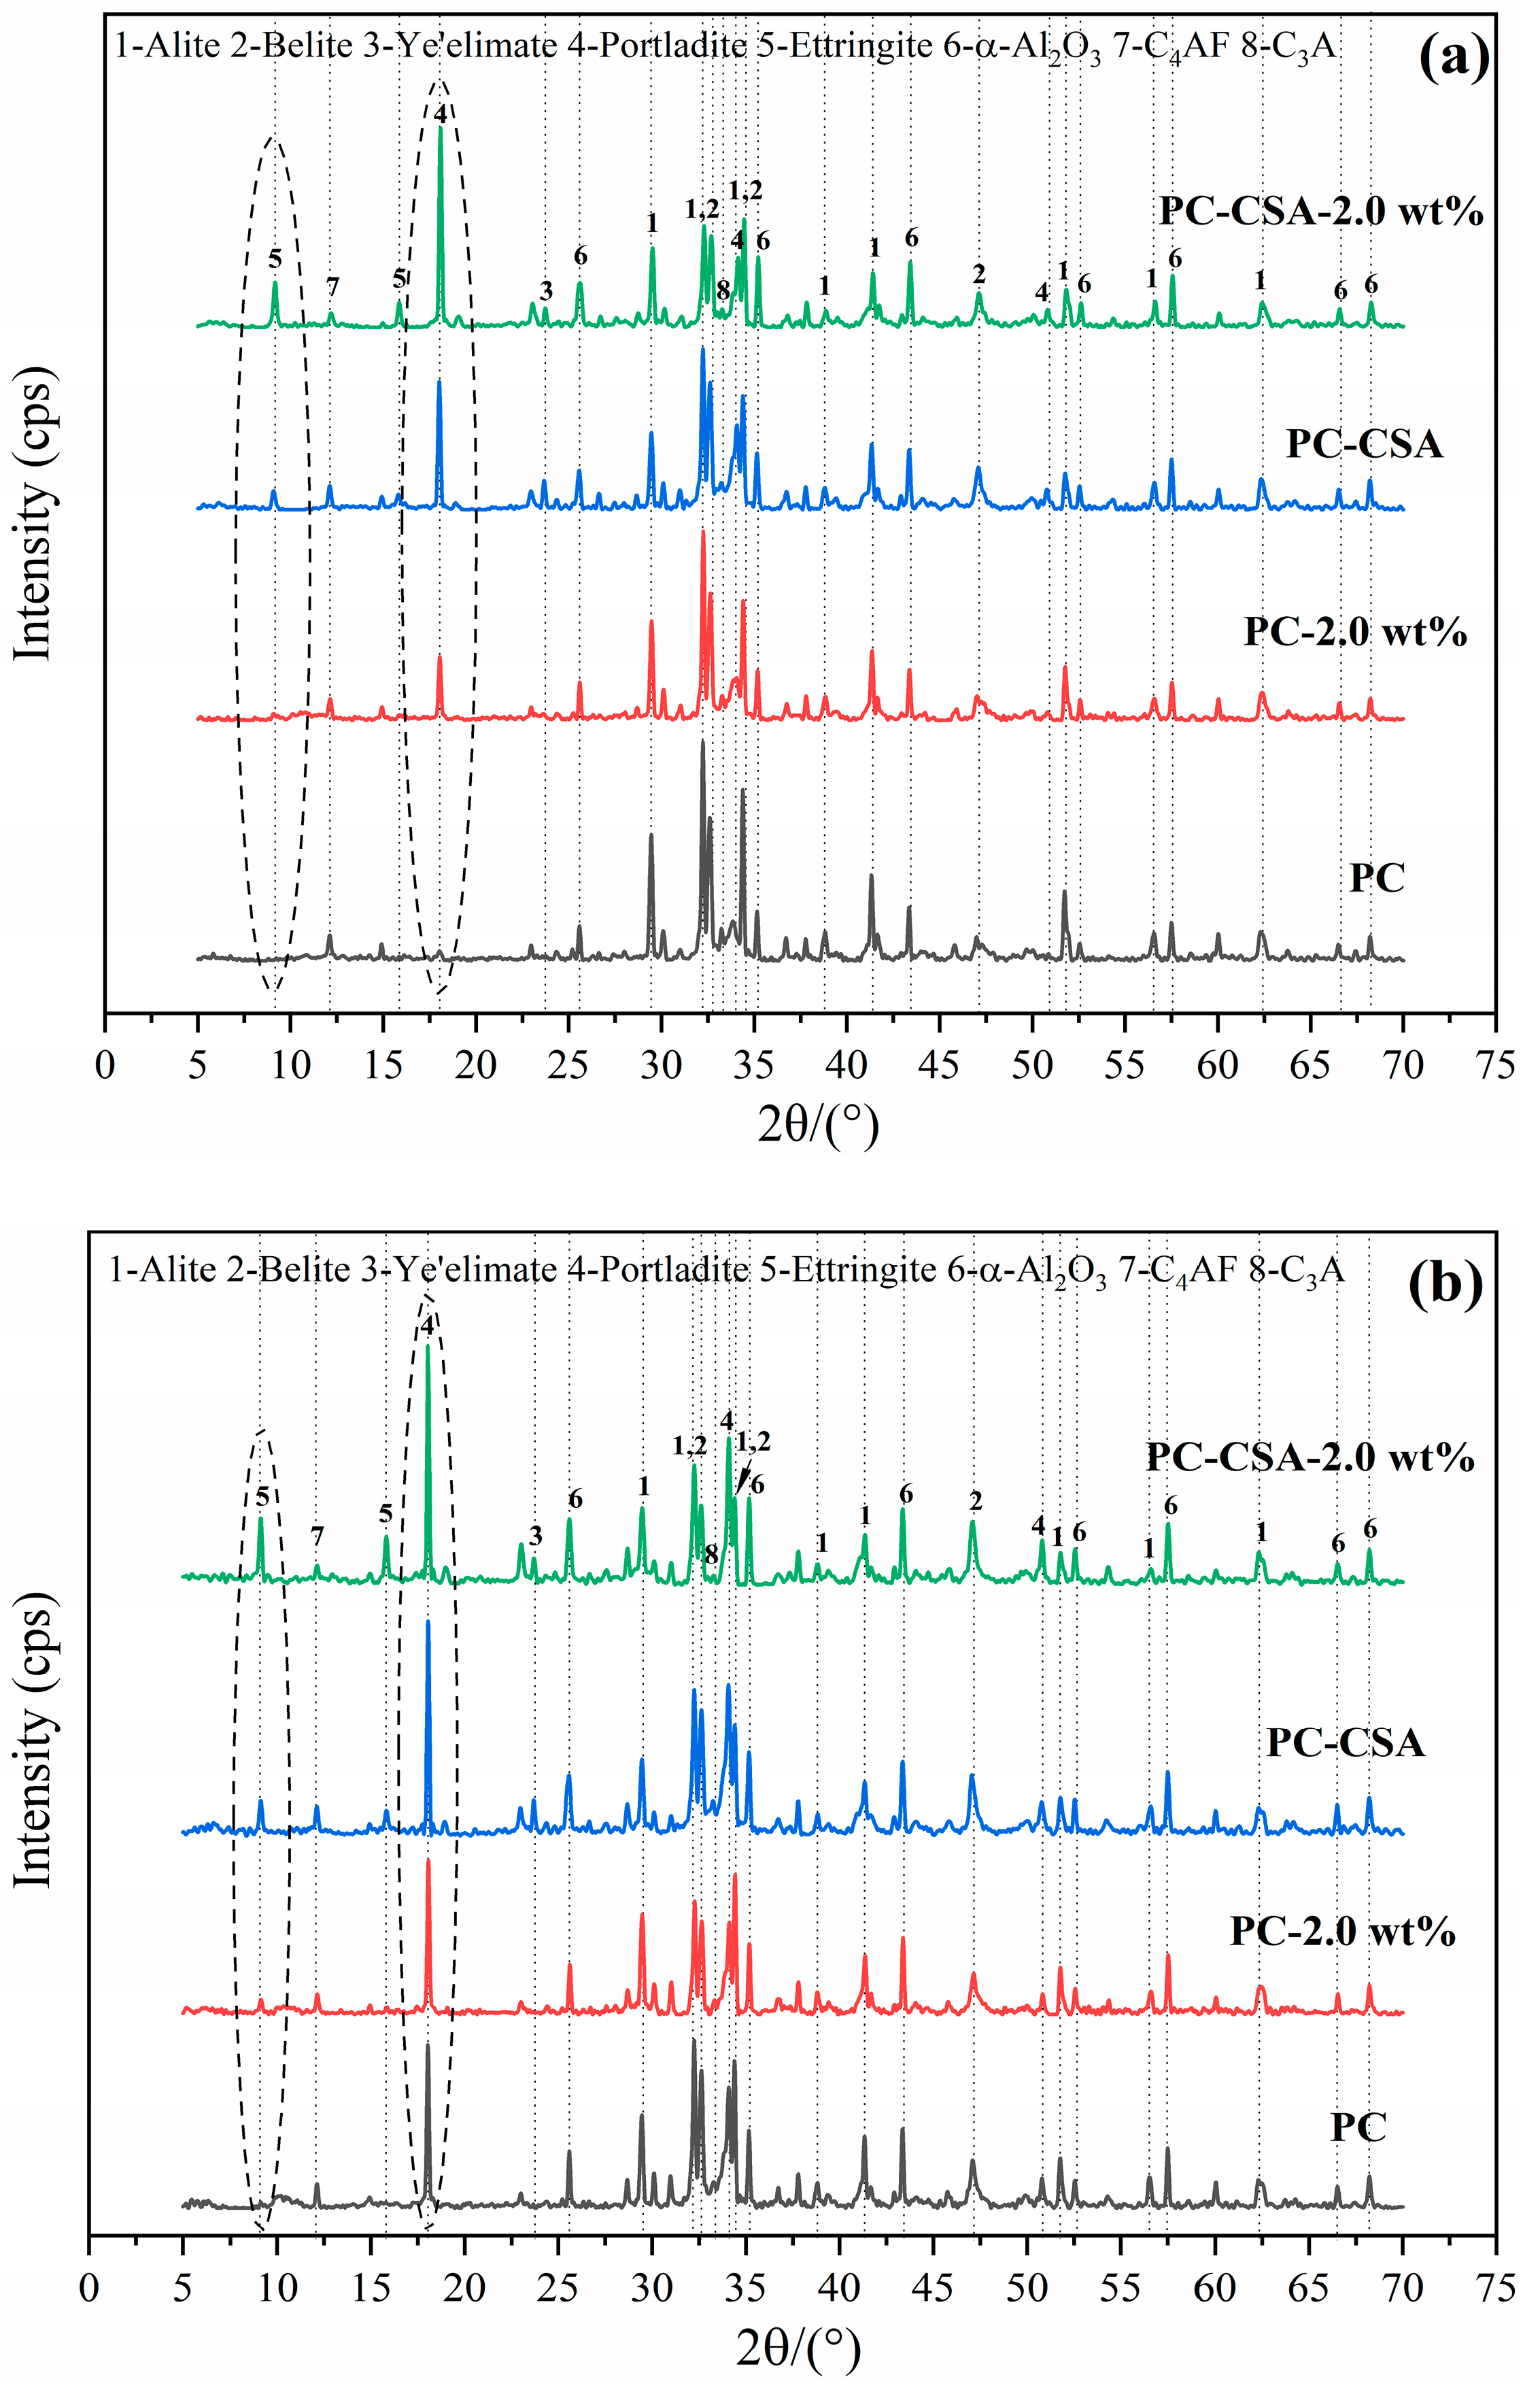
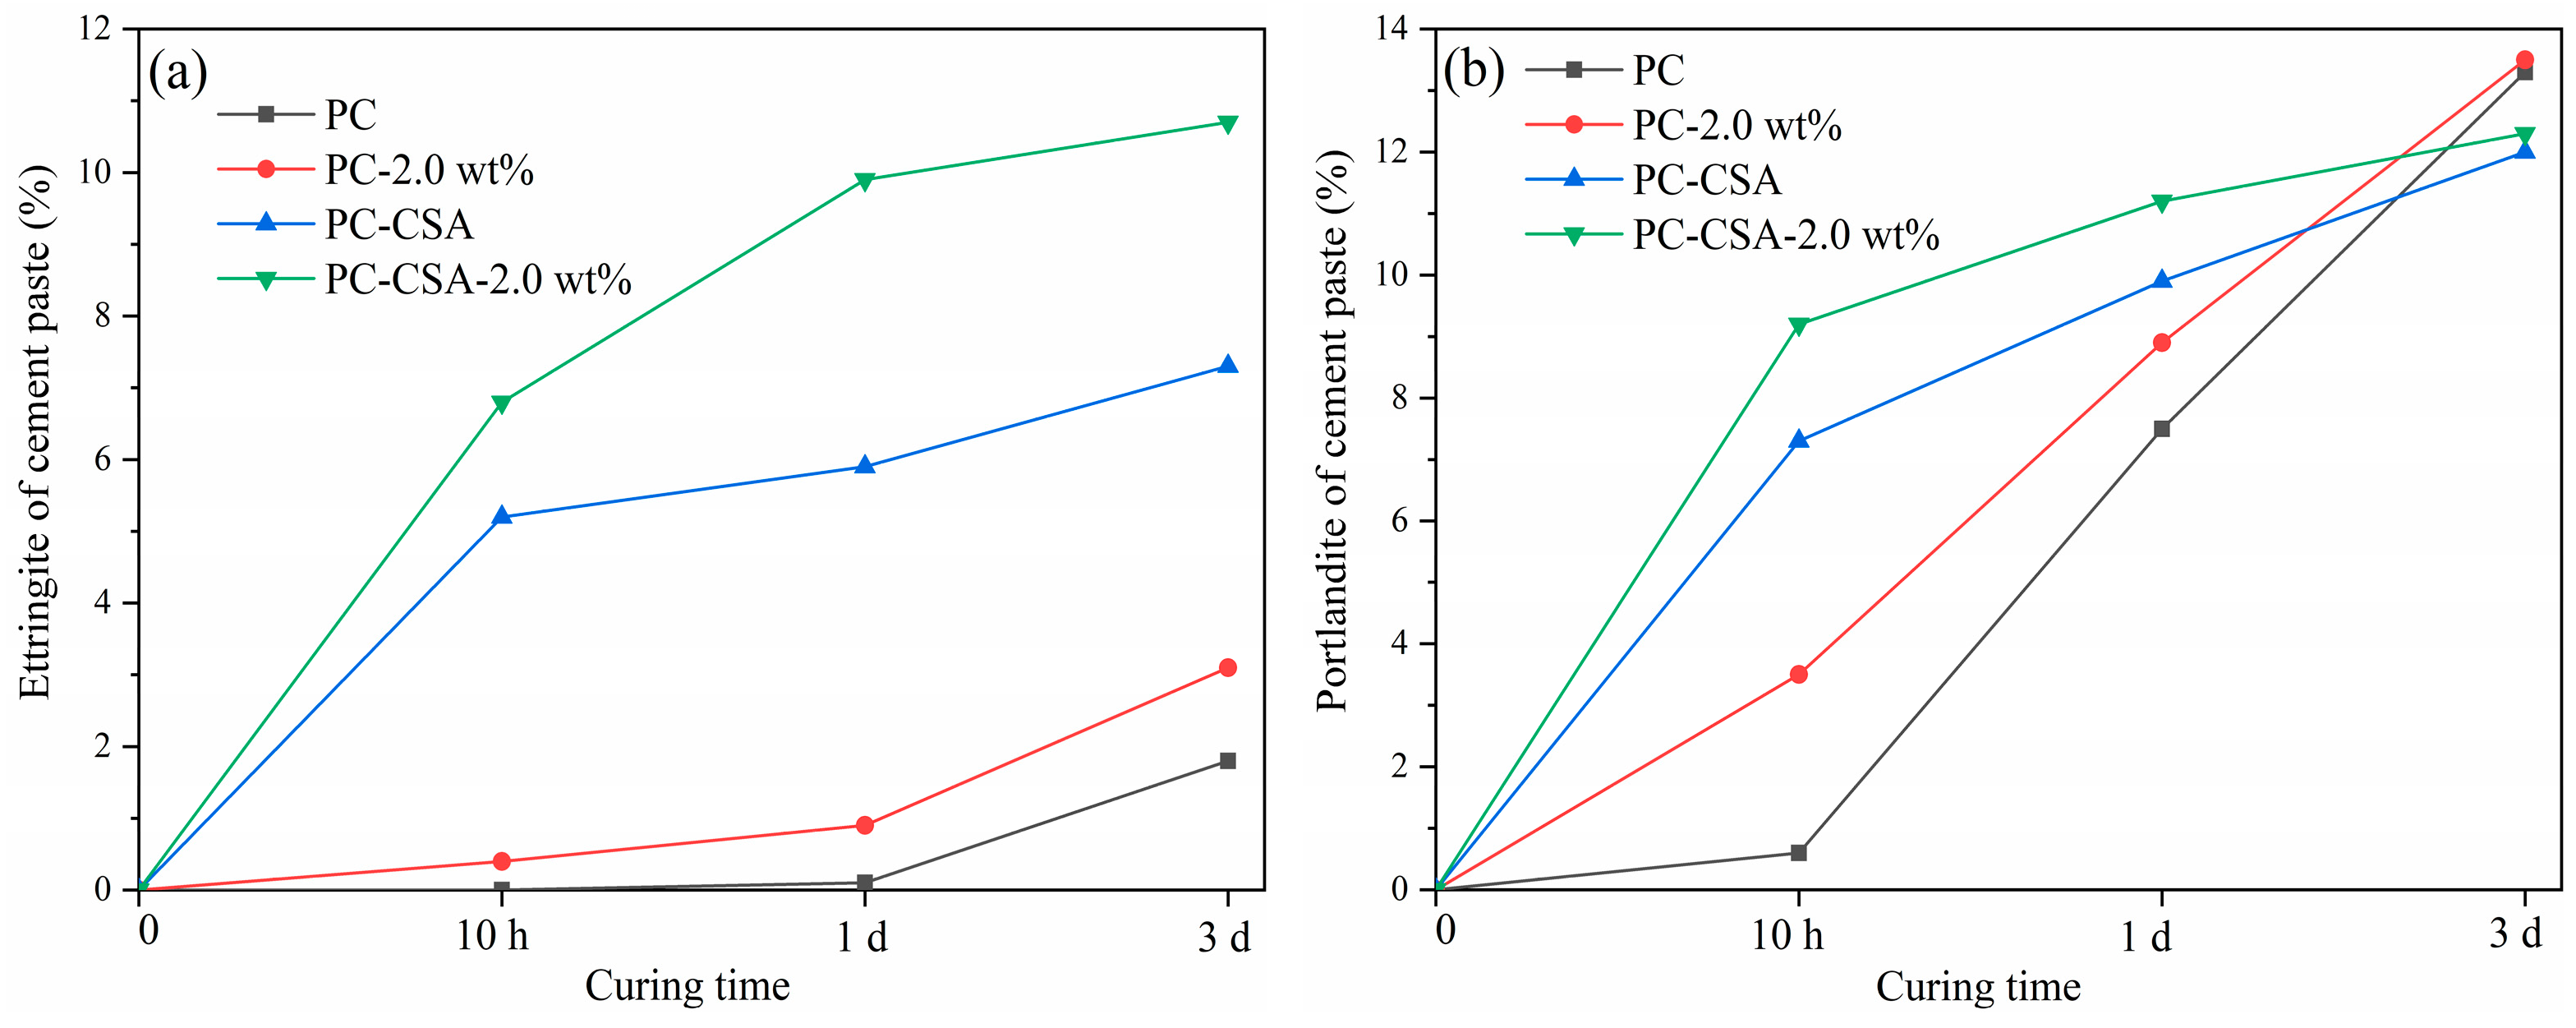
3.3. XRD Analysis
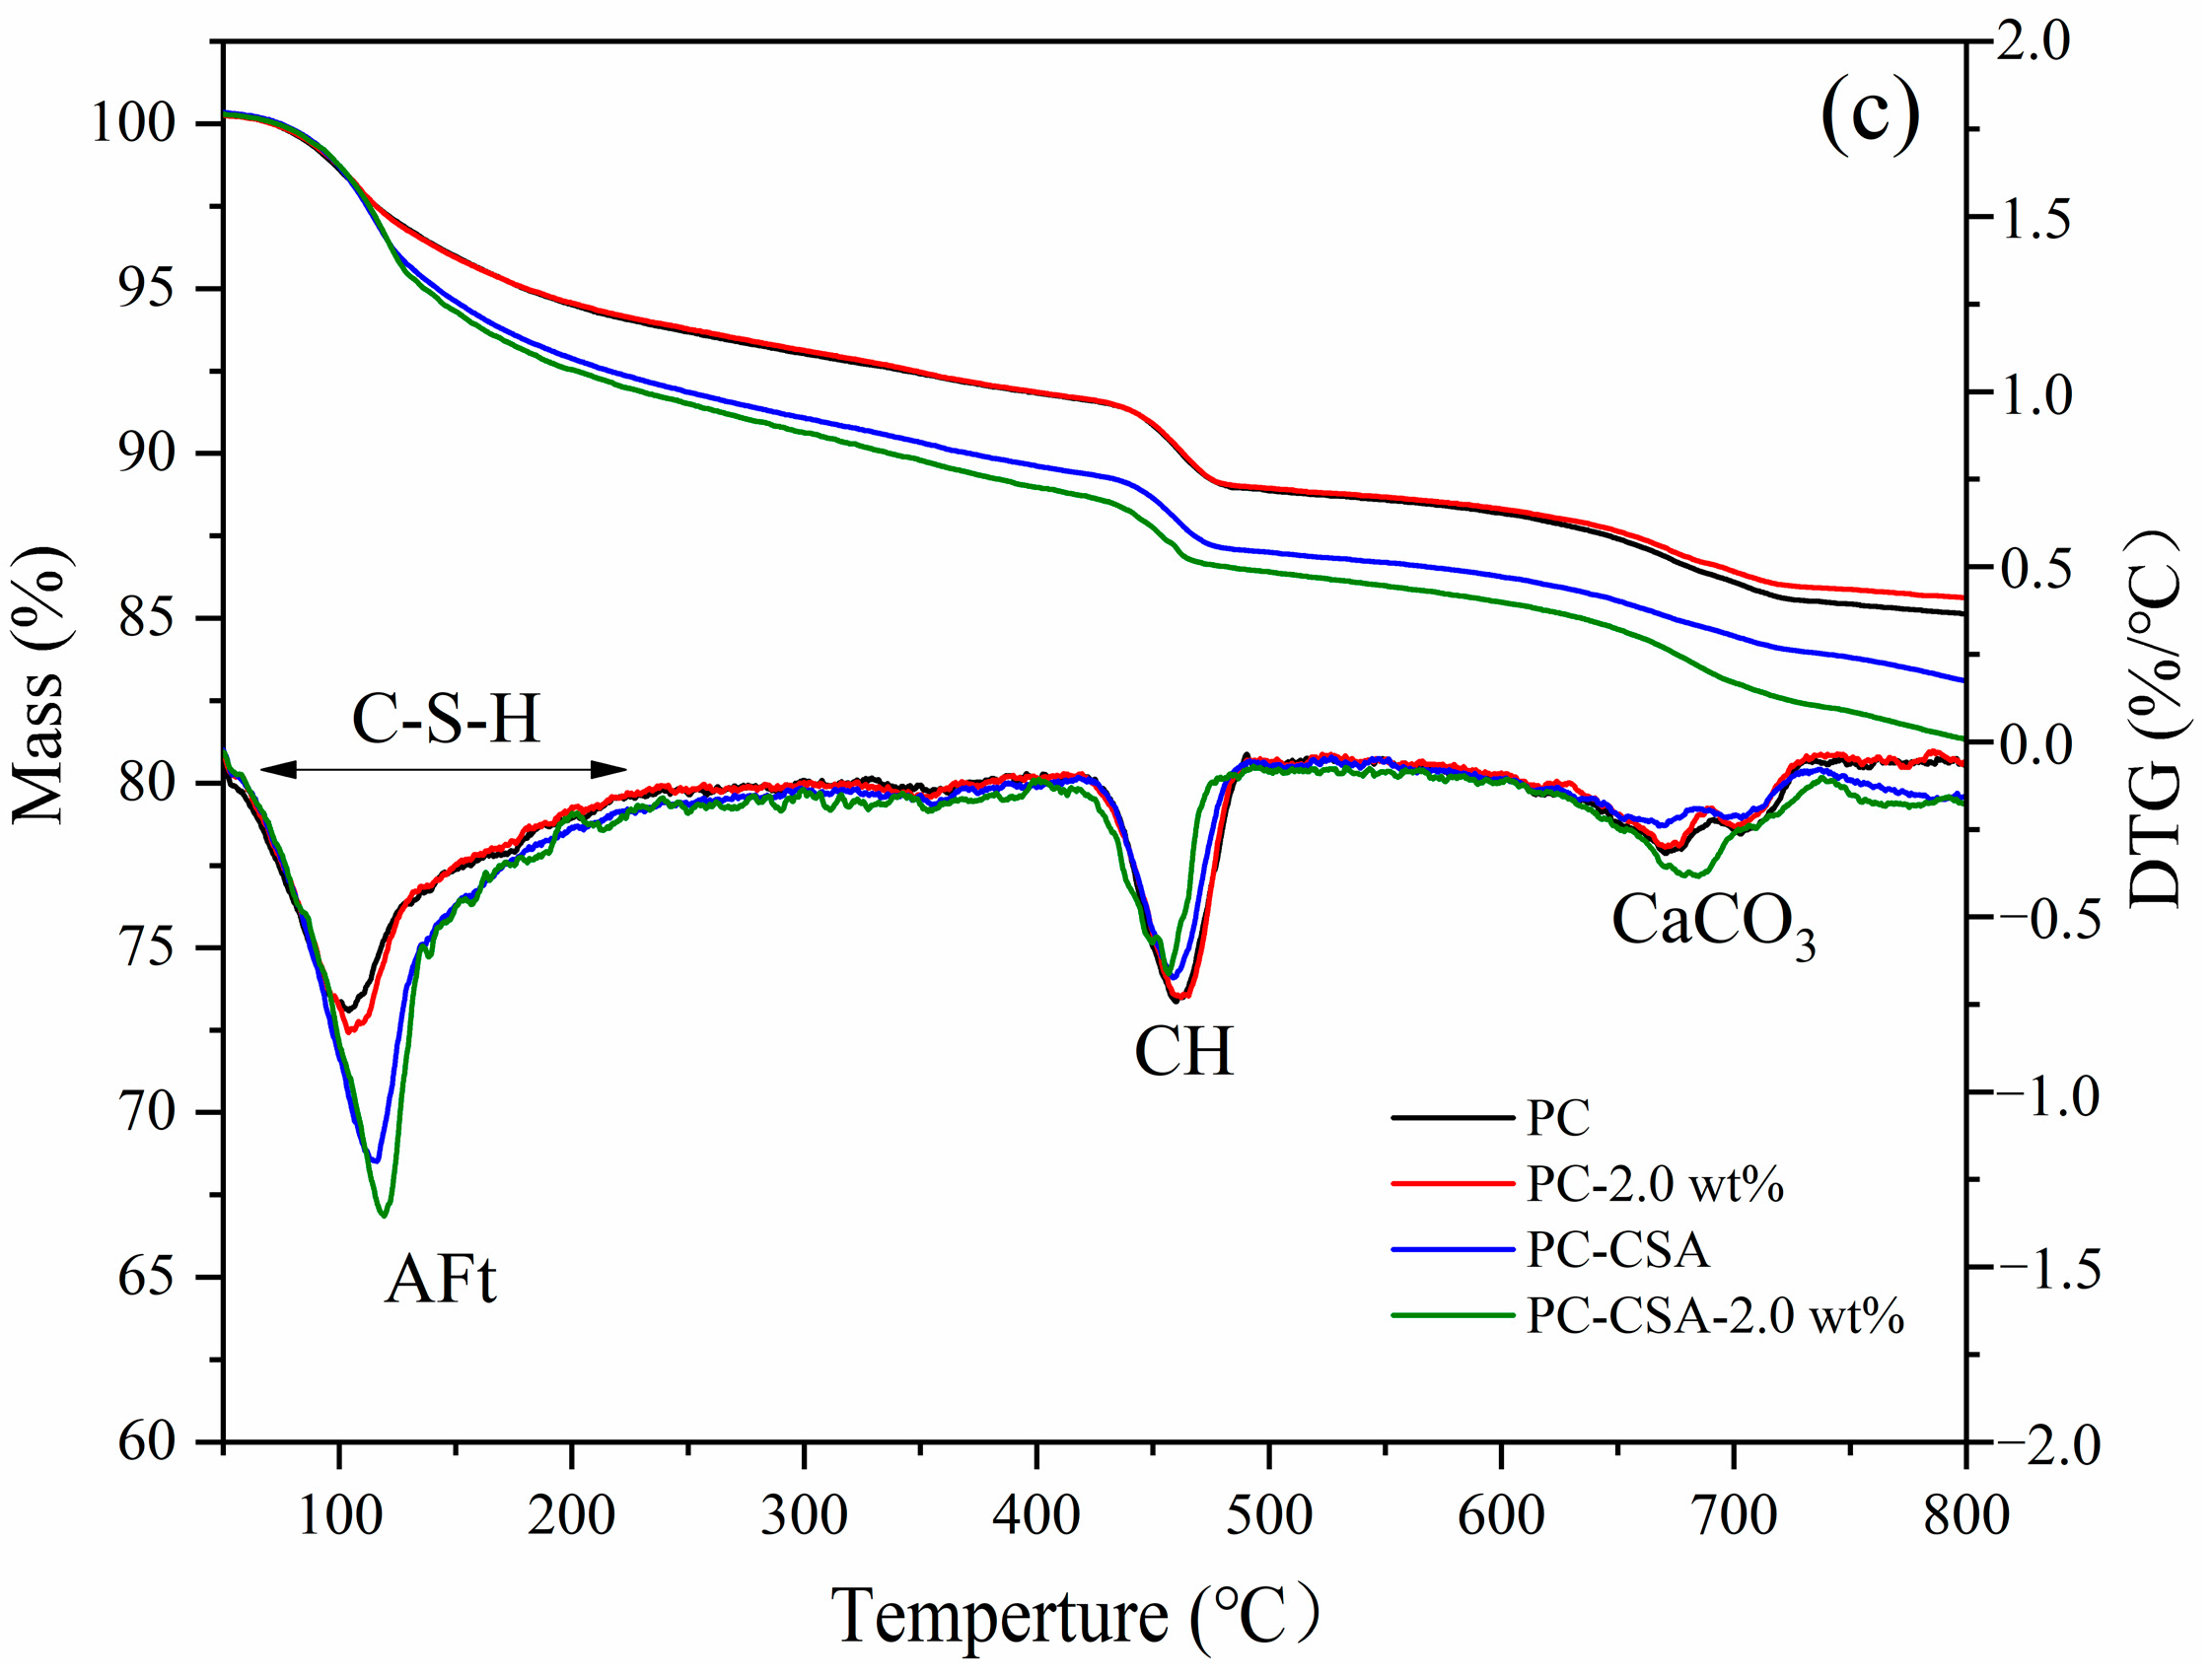
3.4. TGA Analysis
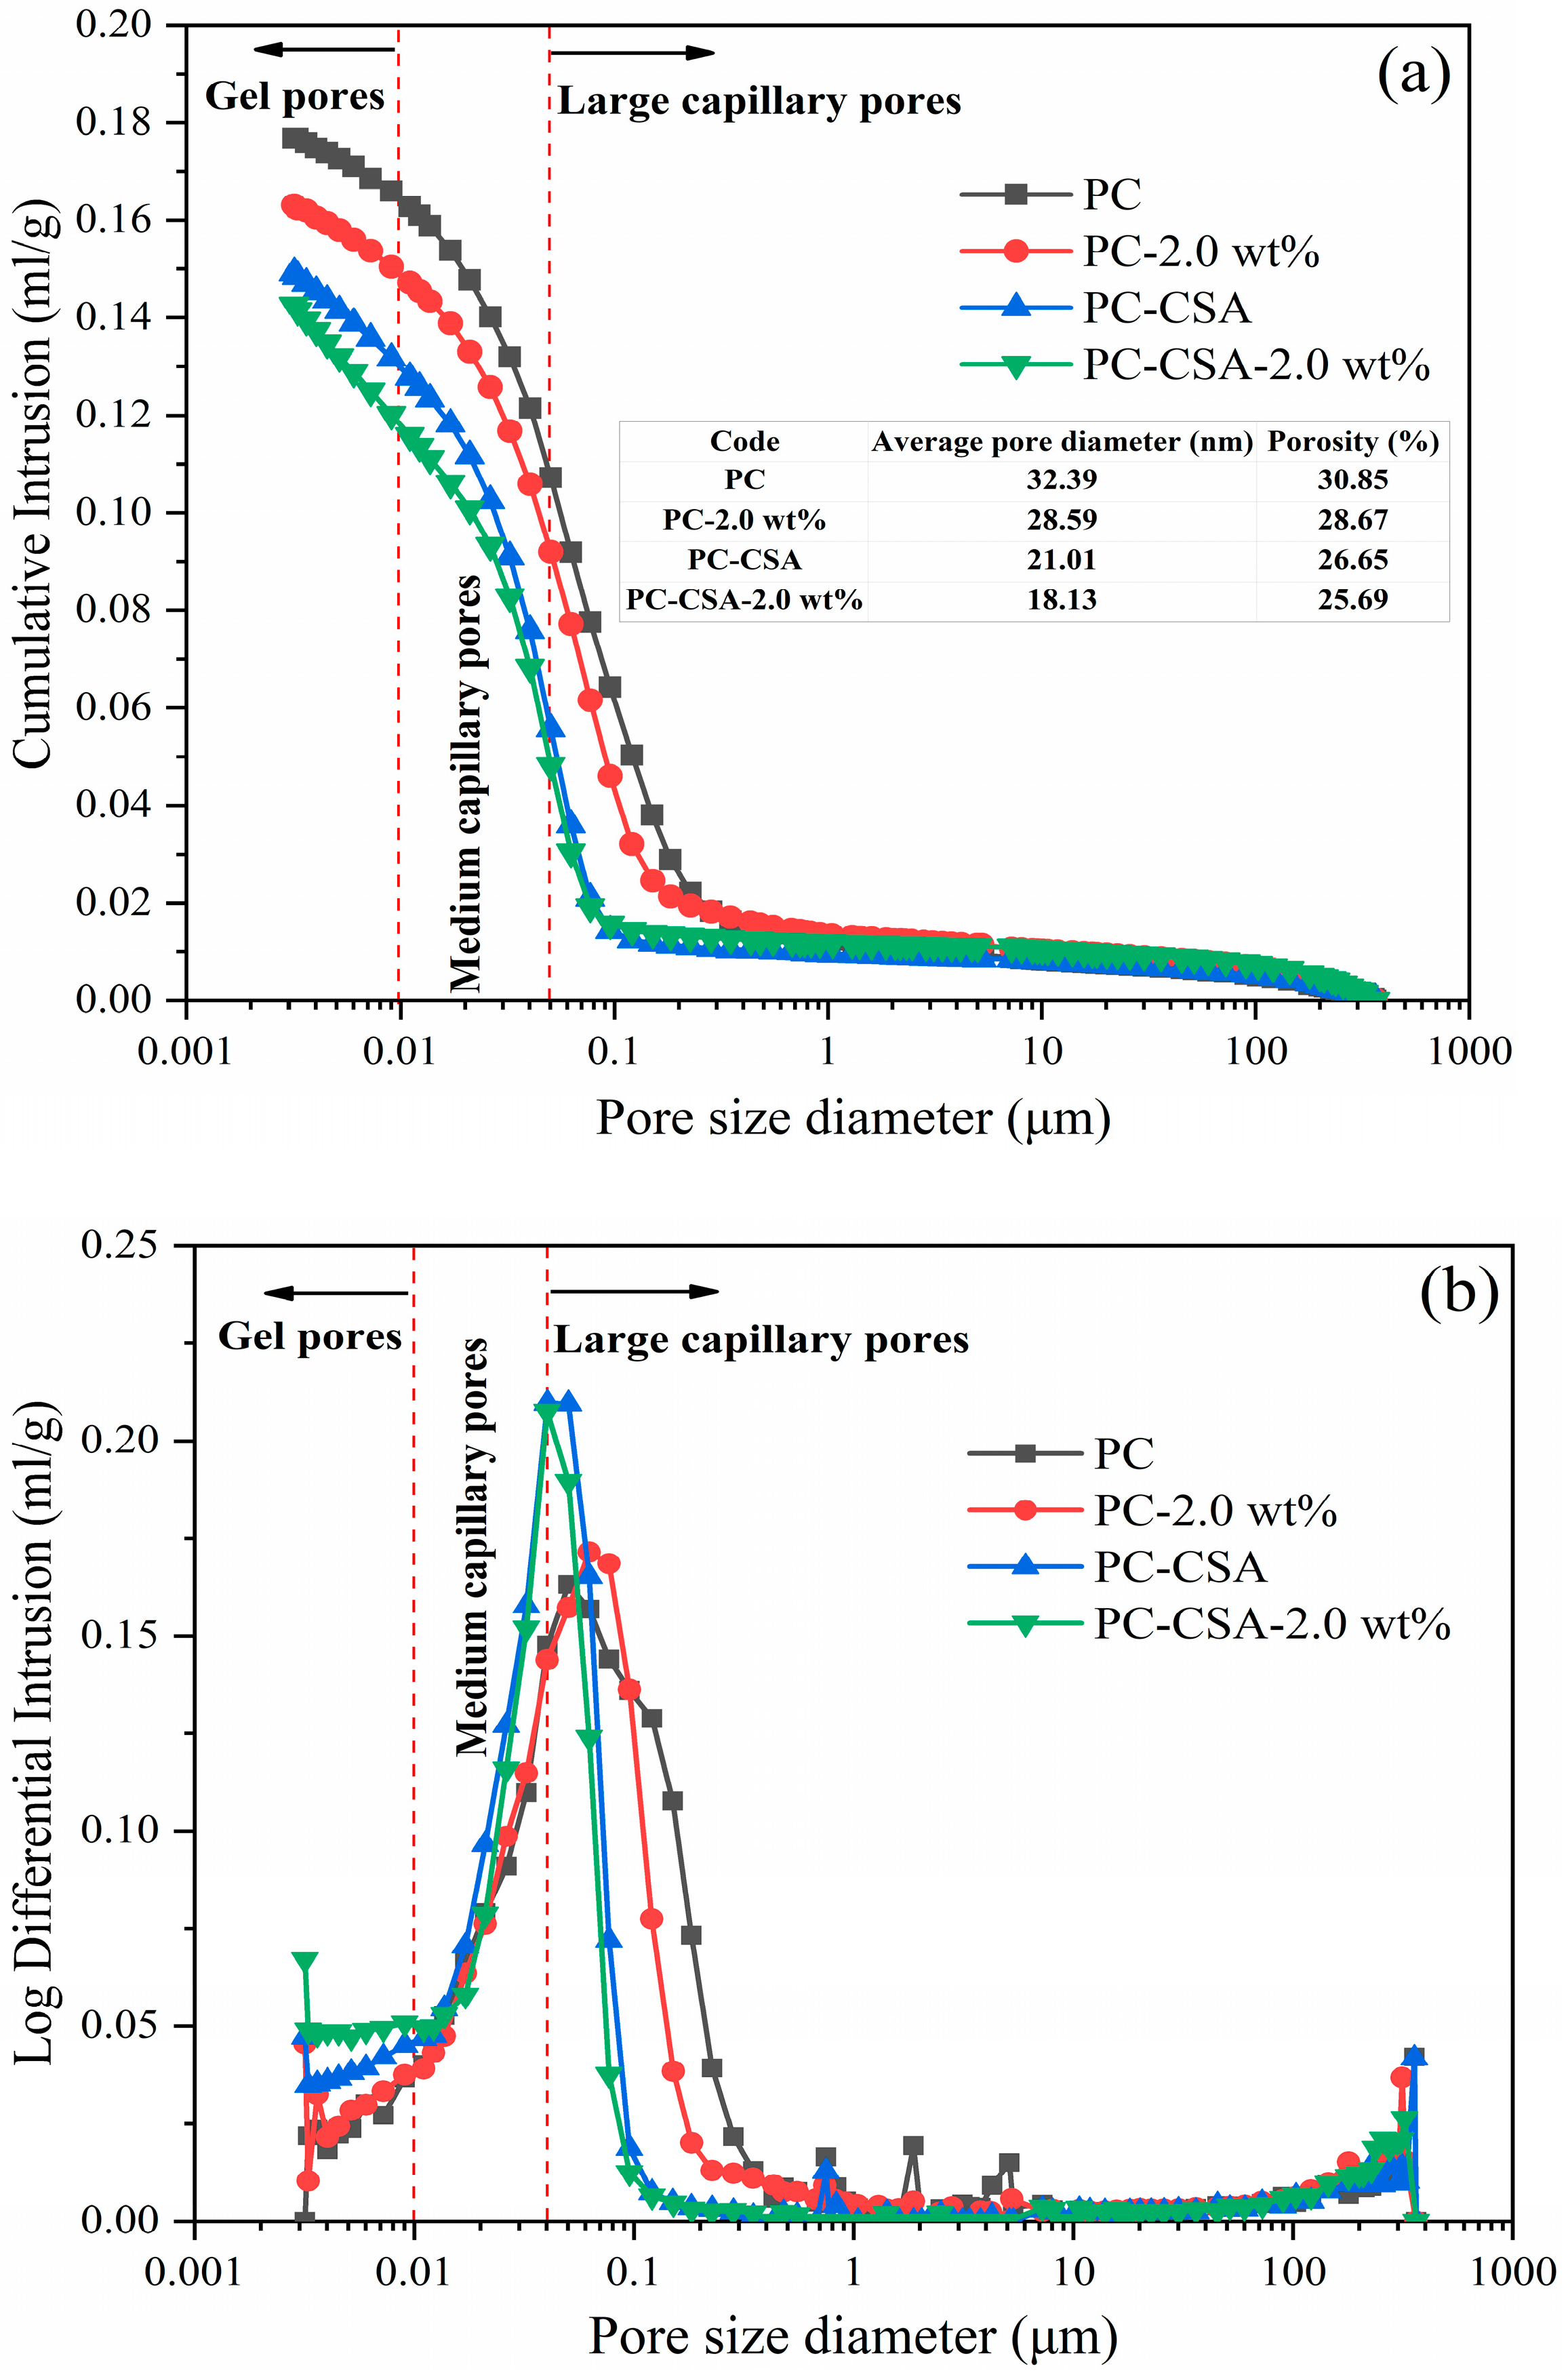
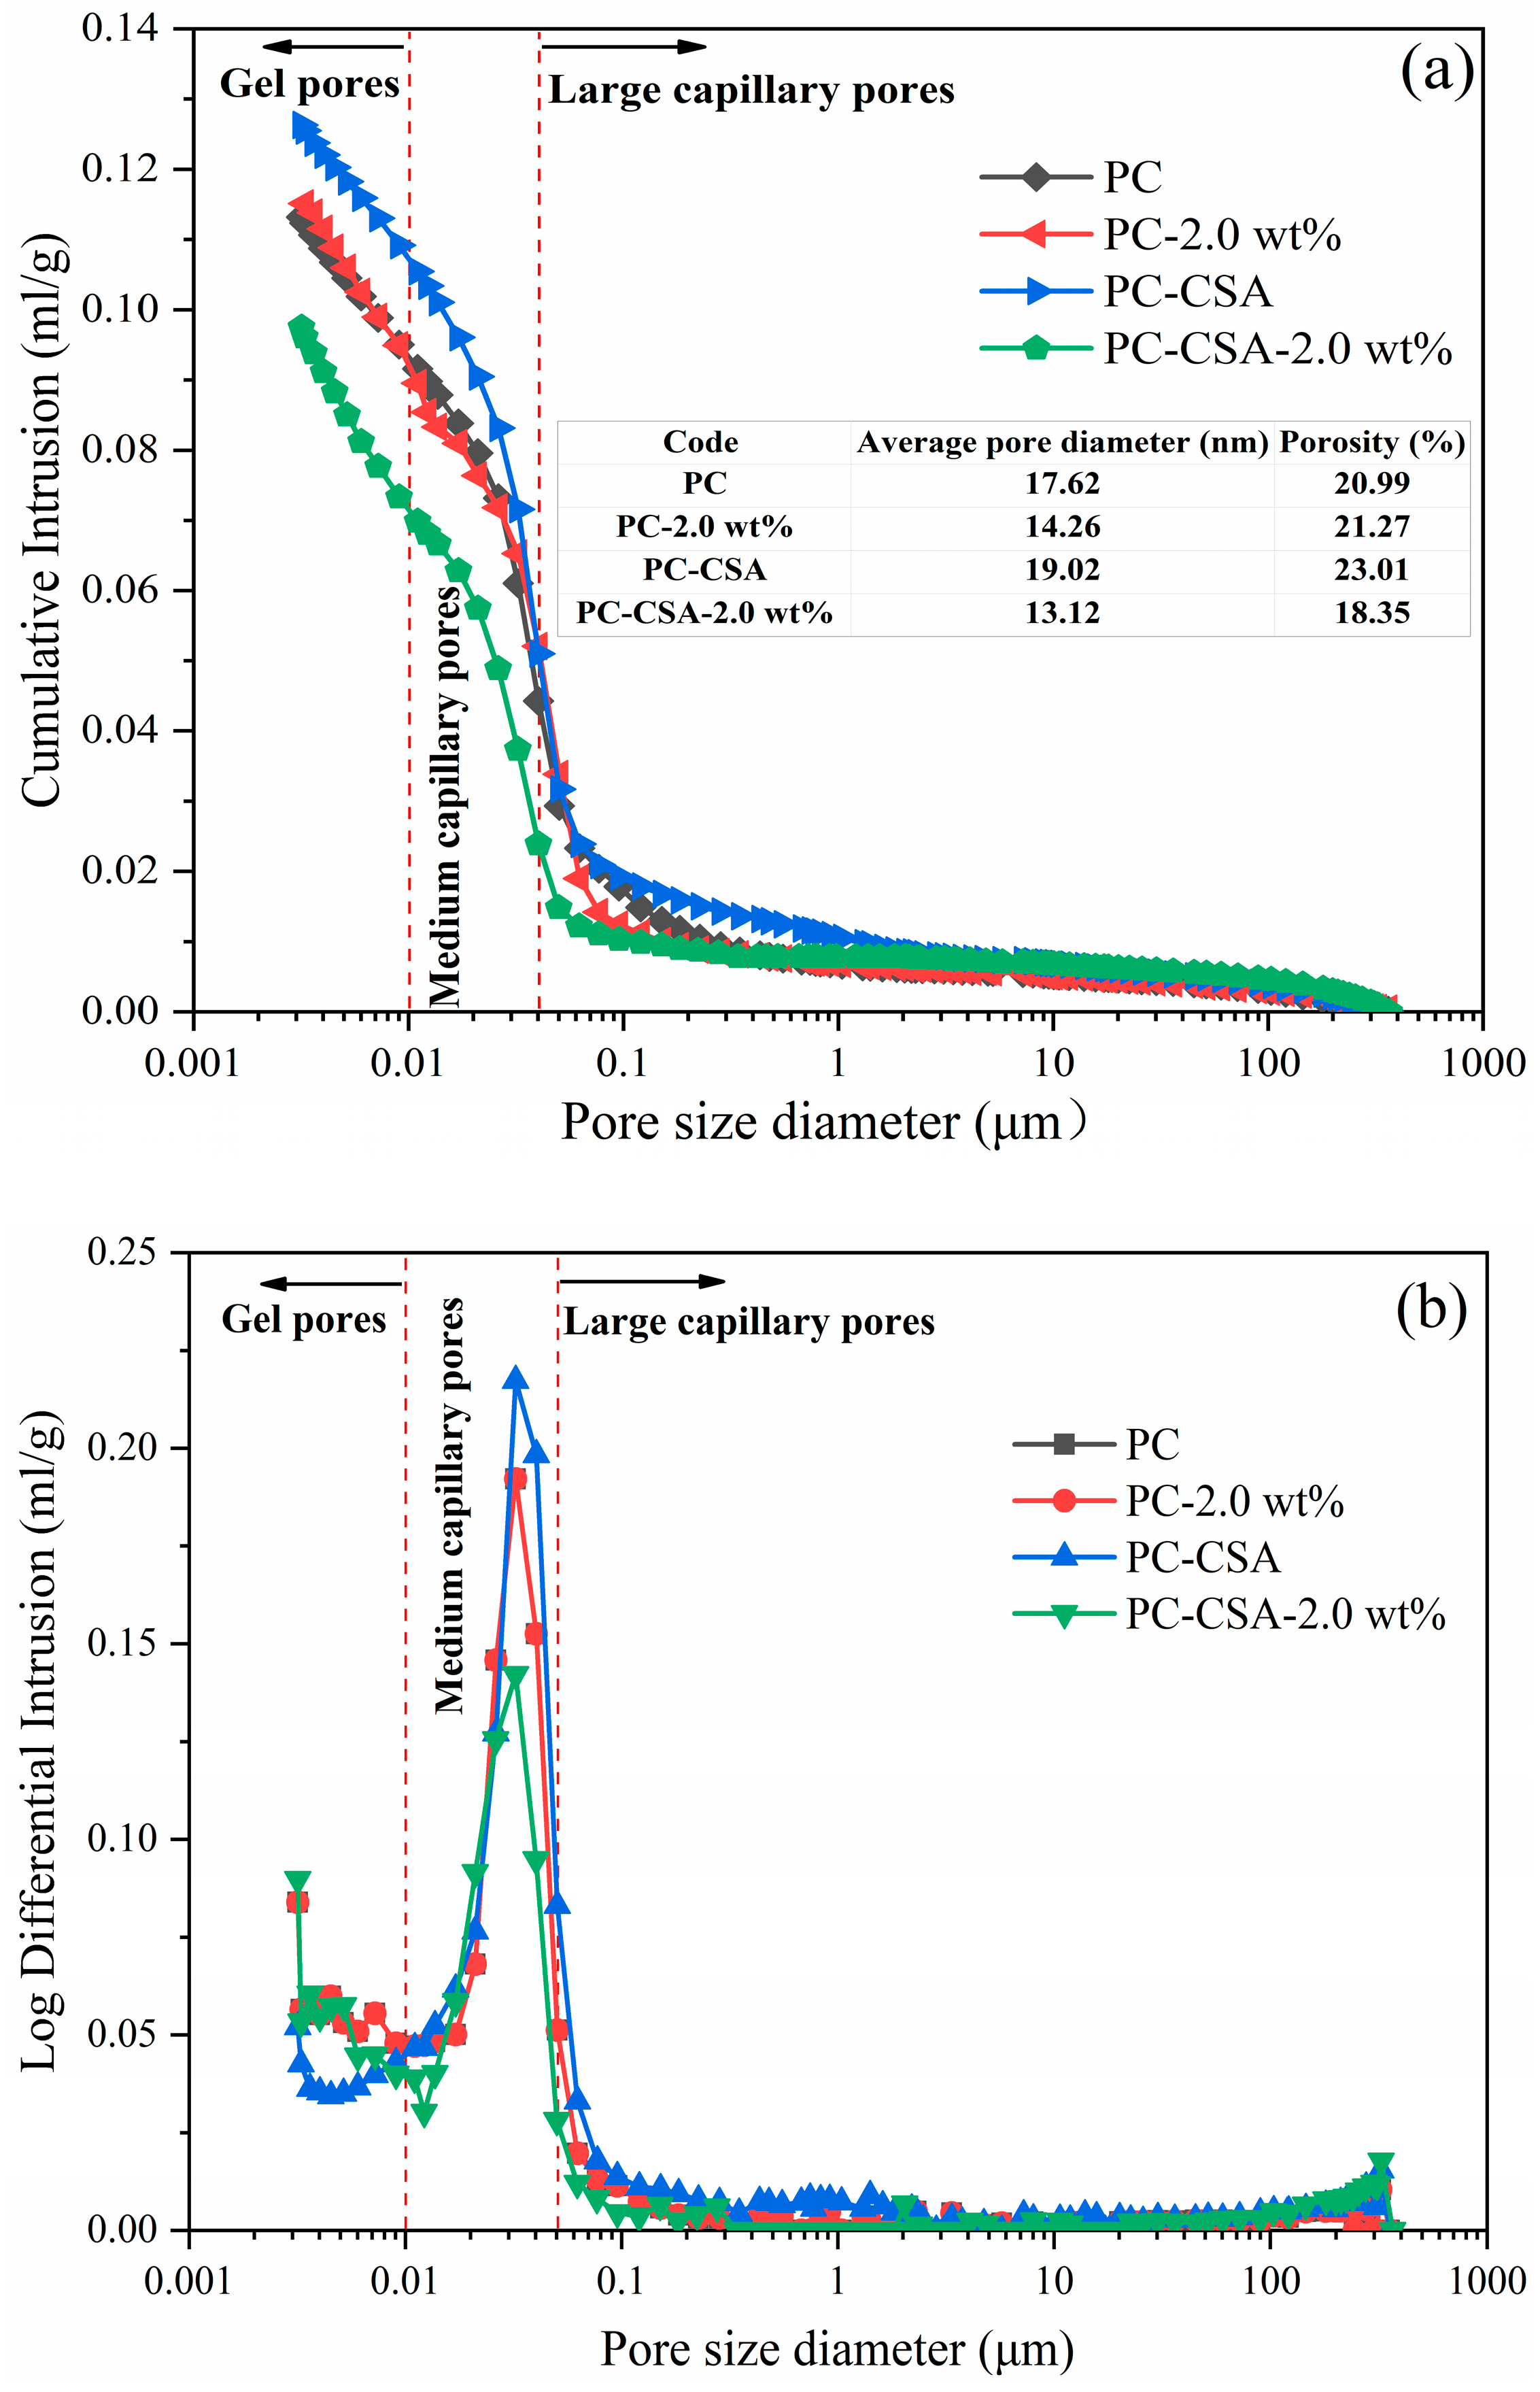
3.5. Pore Structure Analysis
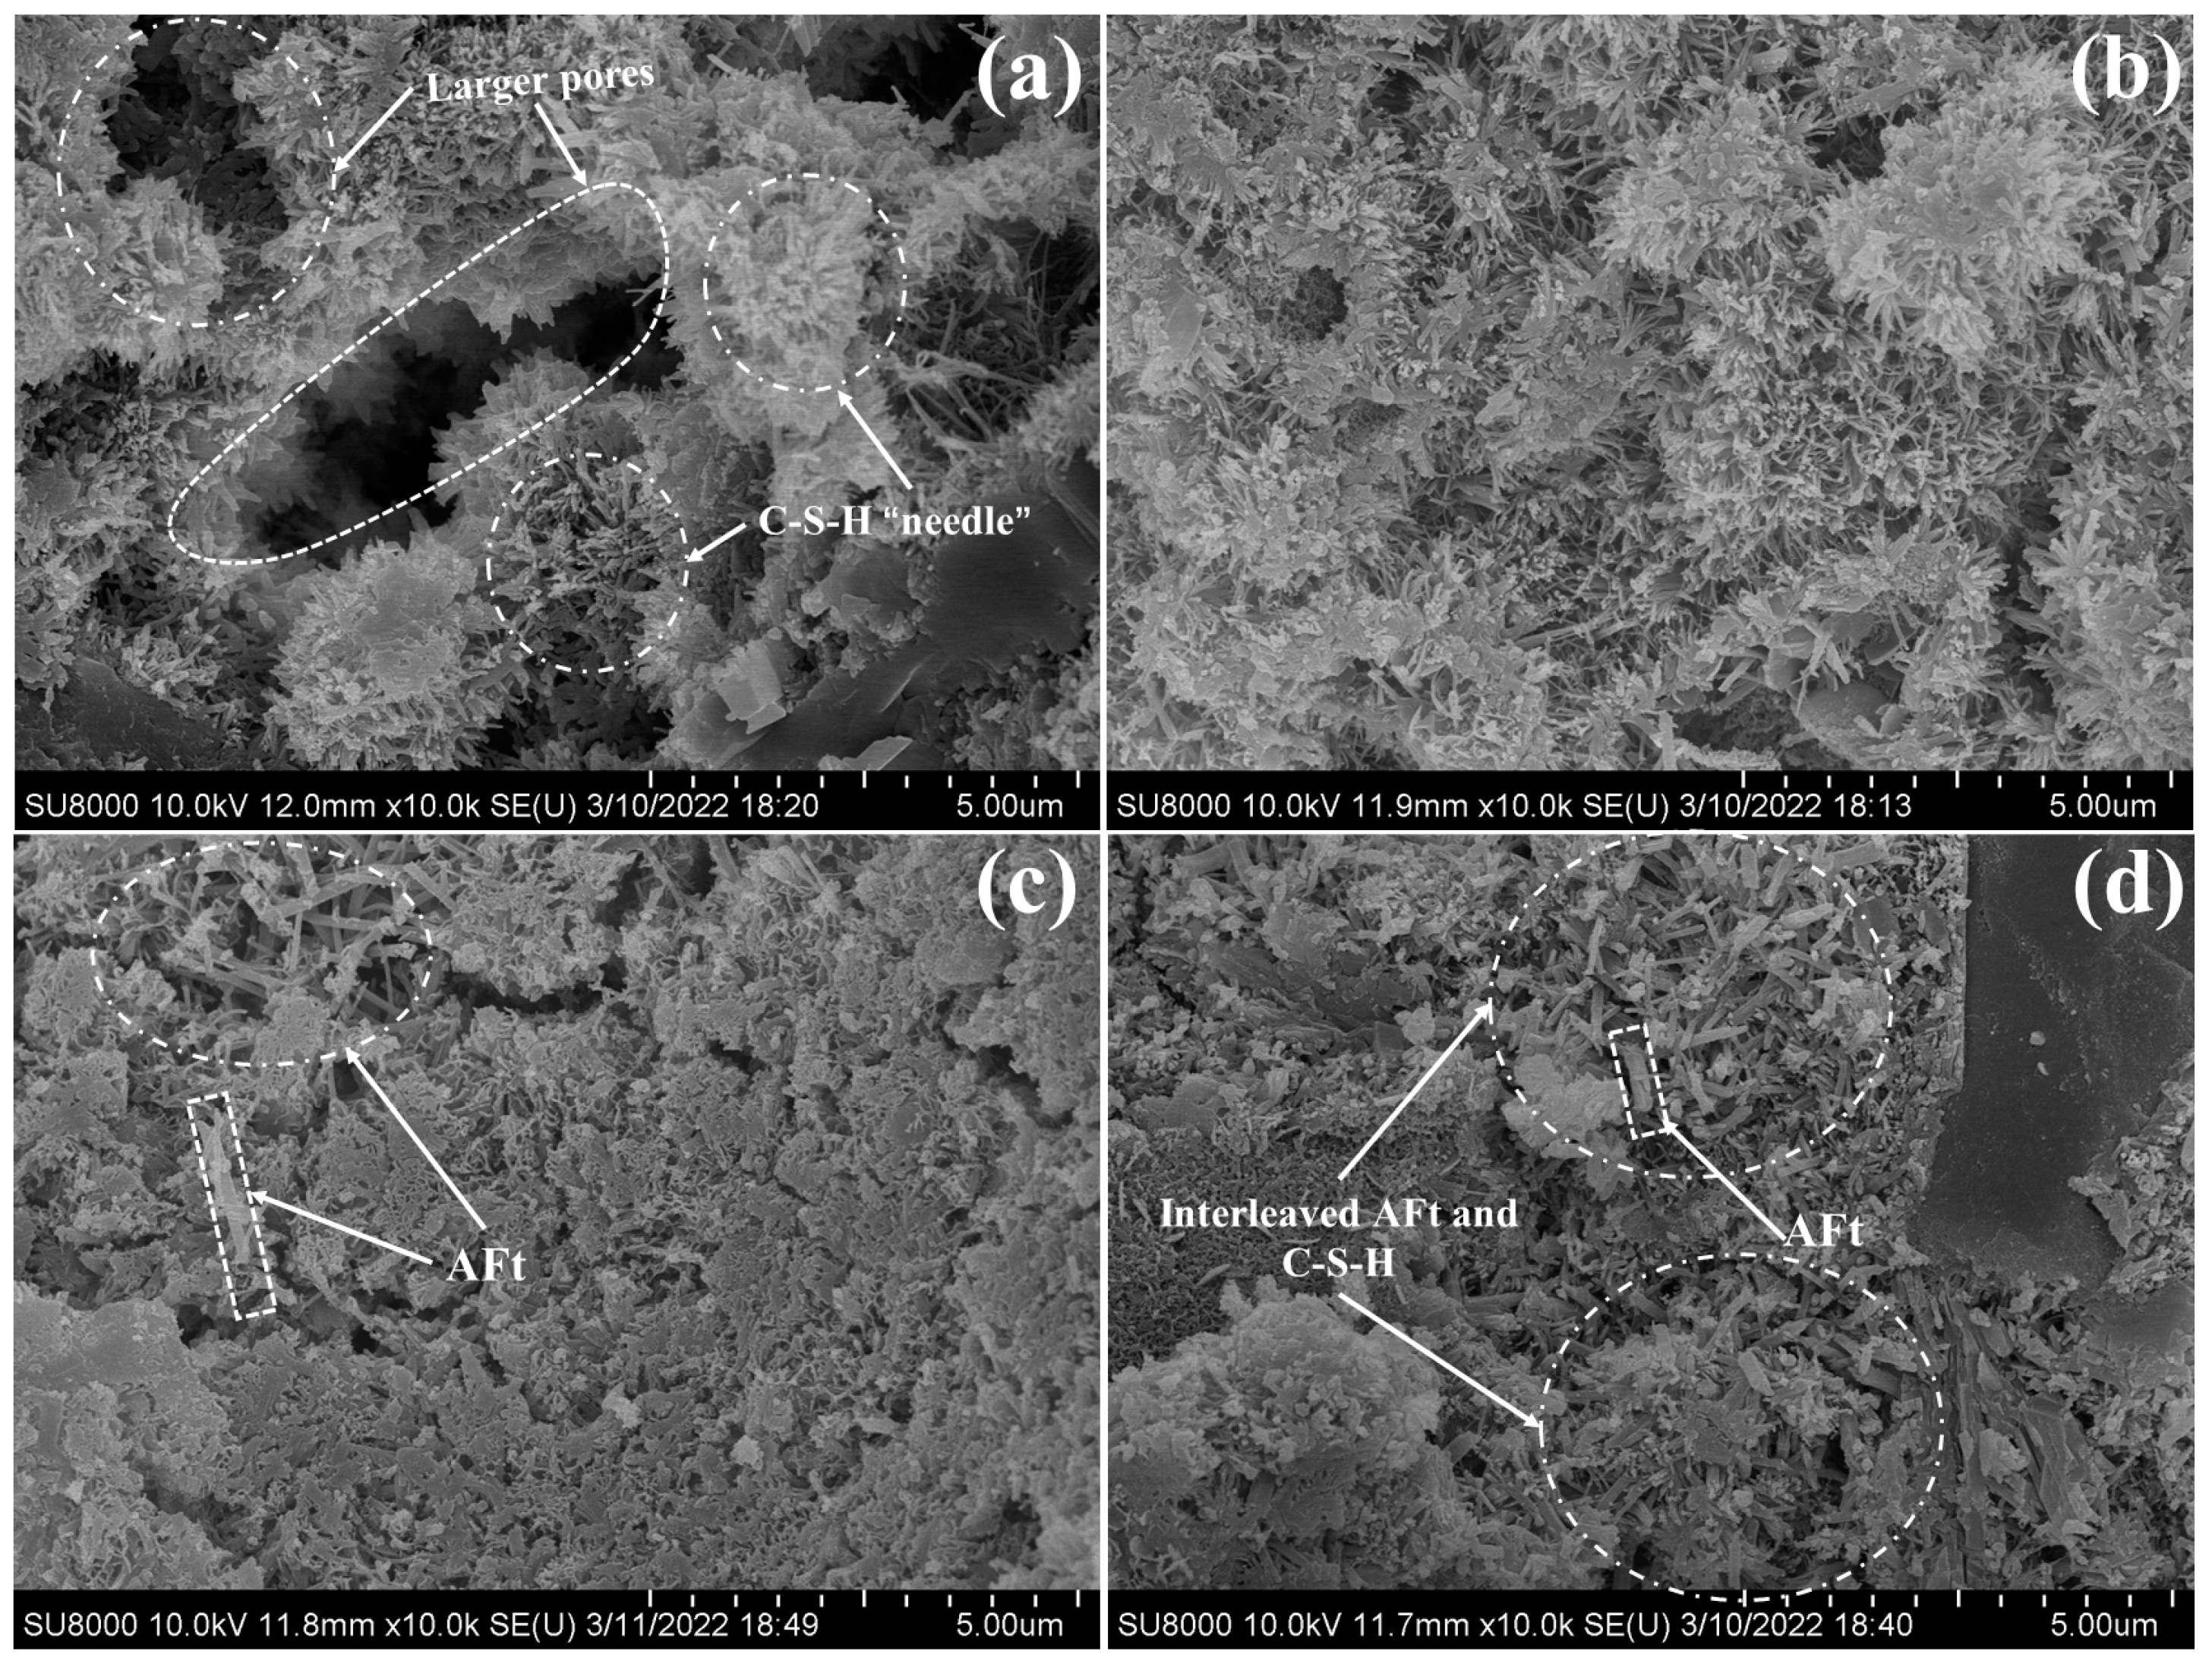
3.6. SEM Analysis
3.7. Discussion
4. Conclusions
- (1)
- CSA and NCS performed a significant synergistic effect in promoting the early compressive strength of PC paste. When CSA (replace 5% of PC) and NCS (2.0 wt%) were co-added to PC, the compressive strength of cement pastes at 10 h, 1 d, and 3 h increased by 326.3%, 52.9%, and 29.2%, respectively. In comparison with the alone addition of CSA or NCS, a higher strength enhancement was obtained by the addition of them in common.
- (2)
- According to the hydration heat, XRD, and TGA measurements, the addition of CSA and NCS in common accelerated the hydration heat flow and cumulative heat of PC within 72 h, promoting the continuous generation of ettringite and C-S-H gel.
- (3)
- The MIP and SEM test showed that the addition of CSA and NCS significantly reduced the porosity in the cement pastes cured at 10 h and 3 d curing times, improving the compactness of the cement matrix.
- (4)
- The synergistic early strength enhancement of CSA and NCS was related to multiple reasons. During the initial hydration of PC-CSA-2.0 wt%, the fast precipitation of ettringite and C-S-H gel contributed to the quick formation of early compressive strength and provided a high alkali environment. With the hydration prolonged, the high concentration of CH was beneficial to the continuously generated ettringite. In addition, the NCS also performed the micro-filling effect in the PC-CSA system, which reduced the porosity of hardening cement paste and was beneficial to the strength, continuing the increment.
Author Contributions
Funding
Institutional Review Board Statement
Informed Consent Statement
Data Availability Statement
Conflicts of Interest
References
- Du, Q.; Pang, Q.; Bao, T.; Guo, X.; Deng, Y. Critical factors influencing carbon emissions of prefabricated building supply chains in China. J. Clean. Prod. 2021, 280, 124398. [Google Scholar] [CrossRef]
- Yuan, M.; Li, Z.; Li, X.; Li, L.; Zhang, S.; Luo, X. How to promote the sustainable development of prefabricated residential buildings in China: A tripartite evolutionary game analysis. J. Clean. Prod. 2022, 349, 131423. [Google Scholar] [CrossRef]
- Liu, B.; Xie, Y.; Li, J. Influence of steam curing on the compressive strength of concrete containing supplementary cementing materials. Cem. Concr. Res. 2005, 35, 994–998. [Google Scholar] [CrossRef]
- Ahmad, M.R.; Chen, B.; Haque, M.A.; Oderji, S.Y. Multiproperty characterization of cleaner and energy-efficient vegetal concrete based on one-part geopolymer binder. J. Clean Prod. 2020, 253, 119916. [Google Scholar] [CrossRef]
- Ba, M.; Qian, C.; Guo, X.; Han, X. Effects of steam curing on strength and porous structure of concrete with low water/binder ratio. Constr. Build. Mater. 2011, 25, 123–128. [Google Scholar] [CrossRef]
- Xu, Z.; Li, W.; Sun, J.; Hu, Y.; Xu, K.; Ma, S.; Shen, X. Research on cement hydration and hardening with different alkanolamines. Constr. Build. Mater. 2017, 141, 296–306. [Google Scholar] [CrossRef]
- Aggoun, S.; Cheikh-Zouaoui, M.; Chikh, N.; Duval, R. Effect of some admixtures on the setting time and strength evolution of cement pastes at early ages. Constr. Build. Mater. 2008, 22, 106–110. [Google Scholar] [CrossRef]
- Riding, K.; Silva, D.A.; Scrivener, K. Early age strength enhancement of blended cement systems by CaCl2 and diethanol-isopropanolamine. Cem. Concr. Res. 2010, 40, 935–946. [Google Scholar] [CrossRef]
- Hoang, K.; Justnes, H.; Geiker, M. Early age strength increase of fly ash blended cement by a ternary hardening accelerating admixture. Cem. Concr. Res. 2016, 81, 59–69. [Google Scholar] [CrossRef]
- Zhang, Y.; Kong, X.; Lu, Z.; Lu, Z.; Zhang, Q.; Dong, B.; Feng, X. Influence of triethanolamine on the hydration product of portlandite in cement paste and the mechanism. Cem. Concr. Res. 2016, 87, 64–76. [Google Scholar]
- Vehmas, T.; Kronlof, A.; Cwirzen, A. Calcium chloride acceleration in ordinary Portland cement. Mag. Concre. Res. 2018, 70, 856–863. [Google Scholar] [CrossRef]
- Park, H.G.; Sung, S.K.; Park, C.G.; Won, J.P. Influence of a C12A7 mineral-based accelerator on the strength and durability of shotcrete. Cement Concr. Res. 2008, 38, 379–385. [Google Scholar] [CrossRef]
- Liu, X.; Ma, B.; Tan, H.; Gu, B.; Zhang, T.; Chen, P.; Li, H.; Mei, J. Effect of aluminum sulfate on the hydration of Portland cement, tricalcium silicate and tricalcium aluminate. Constr. Build. Mater. 2020, 232, 117179. [Google Scholar] [CrossRef]
- Glasser, F.P.; Zhang, L. High-performance cement matrices based on calcium sulfoaluminate—Belite compositions. Cem. Concr. Res. 2001, 21, 1881–1886. [Google Scholar] [CrossRef]
- Telesca, A.; Marroccoli, M.; Pace, M.L.; Tomasulo, M.; Valenti, G.L.; Monteiro, P.J.M. A hydration study of various calcium sulfoaluminate cements. Cem. Concr. Compos. 2014, 53, 224–232. [Google Scholar] [CrossRef]
- Hargis, C.W.; Kirchheim, A.P.; Monteiro, P.J.M.; Gartner, E.M. Early age hydration of calcium sulfoaluminate (synthetic ye’elimite, C4A3) in the presence of gypsum and varying amounts of calcium hydroxide. Cem. Concr. Res. 2013, 48, 105–115. [Google Scholar] [CrossRef]
- Sharp, J.; Yang, R. Calcium sulphoaluminate cements—Low-energy cements, special cements or what. Adv. Cem. Res. 1999, 11, 3–13. [Google Scholar] [CrossRef]
- Zajac, M.; Skocek, J.; Bullerjahn, F.; Haha, M. Effect of retarders on the early hydration of calcium-sulpho-aluminate (CSA) type cements. Cem. Concr. Res. 2016, 84, 62–75. [Google Scholar] [CrossRef]
- Su, T.; Kong, X.; Tian, H.; Wang, D. Effects of comb-like PCE and linear copolymers on workability and early hydration of a calcium sulfoaluminate belite cement. Cem. Concr. Res. 2019, 123, 105801. [Google Scholar] [CrossRef]
- Winnefeld, F.; Lothenbach, B. Hydration of calcium sulfoaluminate cements—Experimental findings and thermodynamic modelling. Cem. Concr. Res. 2010, 40, 1239–1247. [Google Scholar] [CrossRef]
- Zhang, L.; Su, M.; Wang, Y. Development of the use of sulfo- and ferroaluminate cements in China. Adv. Cem. Res. 1999, 11, 15–21. [Google Scholar] [CrossRef]
- Li, G.; Zhang, J.; Song, Z.; Shi, C.; Zhang, A. Improvement of workability and early strength of calcium sulphoaluminate cement at various temperature by chemical admixtures. Constr. Build. Mater. 2018, 160, 427–439. [Google Scholar] [CrossRef]
- Péra, J.; Ambroise, J. New applications of calcium sulfoaluminate cement. Cem. Concr. Res. 2004, 34, 671–676. [Google Scholar] [CrossRef]
- Ramanathan, S.; Halee, B.; Suraneni, P. Effect of calcium sulfoaluminate cement prehydration on hydration and strength. Cem. Concr. Compos. 2020, 112, 103694. [Google Scholar] [CrossRef]
- Zhang, G.; Yang, Y.; Yang, H.; Li, H. Calcium sulphoaluminate cement used as mineral accelerator to improve the property of Portland cement at sub-zero temperature. Cem. Concr. Compos. 2020, 106, 103452. [Google Scholar] [CrossRef]
- Coumes, C.C.D.; Courtois, S.; Peysson, S.; Ambroise, J.; Pera, J. Calcium sulfoaluminate cement blended with OPC: A potential binder to encapsulate low-level radioactive slurries of complex chemistry. Cement Concr. Res. 2009, 39, 740–747. [Google Scholar] [CrossRef]
- Zhang, J.; Li, G.; Ye, W.; Chang, Y.; Liu, Q.; Song, Z. Effects of ordinary Portland cement on the early properties and hydration of calcium sulfoaluminate cement. Constr. Build. Mater. 2018, 186, 1144–1153. [Google Scholar] [CrossRef]
- Trauchessec, R.; Mechling, J.-M.; Lecomte, A.; Roux, A.; Le, B. Rolland, Hydration of ordinary Portland cement and calcium sulfoaluminate cement blends. Cem. Concr. Comp. 2015, 56, 106–114. [Google Scholar] [CrossRef]
- Zhang, J.; Ye, C.; Tan, H.; Liu, X. Potential application of Portland cement-sulfoaluminate cement system in precast concrete cured under ambient temperature. Constr. Build. Mater. 2020, 251, 118869. [Google Scholar] [CrossRef]
- Pelletier, L.; Winnefeld, F.; Lothenbach, B. The ternary system Portland cement–calcium sulphoaluminate clinker—Anhydrite: Hydration mechanism and mortar properties. Cem. Concr. Comp. 2010, 32, 497–507. [Google Scholar] [CrossRef]
- Saoût, G.L.; Lothenbach, B.; Hori, A.; Higuchi, T.; Winnfeld, F. Hydration of Portland cement with additions of calcium sulfoaluminates. Cement Concr. Res. 2013, 43, 81–94. [Google Scholar] [CrossRef]
- Kuzel, H.J. Initial hydration reactions and mechanisms of delayed ettringite formation in Portland cements. Cem. Concr. Compos. 1996, 18, 195–203. [Google Scholar] [CrossRef]
- Zhang, G.; Wang, S.; Qiu, D.; Wang, B.; Wu, X.; Wu, M. Investigation on the performance of hydroxyethyl methyl cellulose modified cement mortars with Portland cement-calcium sulfoaluminate cement binders. Constr. Build. Mater. 2021, 283, 122721. [Google Scholar] [CrossRef]
- Liang, G.; Ni, D.; Li, H.; Dong, B.; Yang, Z. Synergistic effect of EVA, TEA and C-S-Hs-PCE on the hydration process and mechanical properties of Portland cement paste at early age. Constr. Build. Mater. 2021, 272, 121891. [Google Scholar] [CrossRef]
- Wyrzykowski, M.; Assmann, A.; Hesse, C.; Lura, P. Microstructure development and autogenous shrinkage of mortars with C-S-H seeding and internal curing. Cem. Concr. Res. 2020, 129, 105967. [Google Scholar] [CrossRef]
- Nicoleau, L. Accelerated growth of calcium silicate hydrates: Experiments and simulations. Cem. Concr. Res. 2011, 41, 1339–1348. [Google Scholar] [CrossRef]
- Li, H.; Xue, Z.; Liang, G.; Wu, K.; Dong, B.; Wang, W. Effect of C-S-Hs-PCE and sodium sulfate on the hydration kinetics and mechanical properties of cement pastes. Constr. Build. Mater. 2021, 266, 121096. [Google Scholar] [CrossRef]
- Wang, F.; Kong, X.; Jiang, L.; Wang, D. The acceleration mechanism of nano-C-S-H particles on OPC hydration. Constr. Build. Mater. 2020, 249, 118734. [Google Scholar] [CrossRef]
- Zhang, J.; Wang, Z.; Yao, Y.; Tang, R.; Li, S.; Liu, X.; Sun, D. The effect and mechanism of C–S–H-PCE nanocomposites on the early strength of mortar under different water-to-cement ratio. J. Build. Eng. 2021, 44, 103360. [Google Scholar] [CrossRef]
- Land, G.; Stephan, D. The effect of synthesis conditions on the efficiency of C-S-H seeds to accelerate cement hydration. Cem. Concr. Compos. 2018, 87, 73–78. [Google Scholar] [CrossRef]
- Bost, P.; Reginer, M.; Horgnies, M. Comparison of the accelerating effect of various additions on the early hydration of Portland cement. Constr. Build. Mater. 2016, 113, 290–296. [Google Scholar] [CrossRef]
- Kanchanason, V.; Plank, J. Effect of calcium silicate hydrate—Polycarboxylate ether (C-S-H–PCE) nanocomposite as accelerating admixture on early strength enhancement of slag and calcined clay blended cements. Cem. Concr. Res. 2019, 119, 44–50. [Google Scholar] [CrossRef]
- Kanchanason, V.; Plank, J. Effectiveness of a calcium silicate hydrate–Polycarboxylate ether(C-S-H–PCE) nanocomposite on early strength development of fly ash cement. Constr. Build. Mater. 2018, 169, 20–27. [Google Scholar] [CrossRef]
- John, E.; Matschei, T.; Stephan, D. Nucleation seeding with calcium silicate hydrate—A review. Cem. Concr. Res. 2018, 113, 74–85. [Google Scholar] [CrossRef]
- Alizadeh, R.; Raki, L.; Makar, J.M.; Beaudoin, J.J.; Moudrakovski, I. Hydration of tricalcium silicate in the presence of synthetic calcium-silicate-hydrate. J. Mater. Chem. 2009, 19, 1–19. [Google Scholar] [CrossRef]
- Richardson, I. Tobermorite/jennite- and tobermorite/calcium hydroxide-based models for the structure of CSH: Applicability to hardened pastes of tricalcium silicate, β-dicalcium silicate, Portland cement, and blends of Portland cement with blast-furnace slag, metakaolin, or silica fume. Cem. Concr. Res. 2004, 34, 1733–1777. [Google Scholar]
- Pedrosa, H.C.; Reales, O.M.; Reis, V.D.; Paiva, M.D.; Fairbarin, E.M.R. Hydration of Portland cement accelerated by C-S-H seeds at different temperatures. Cem. Concr. Res. 2020, 129, 105978. [Google Scholar] [CrossRef]
- Scrivener, K.L.; Juilland, P.; Monteiro, P.J.M. Advances in understanding hydration of Portland cement. Cem. Concr. Res. 2015, 78, 38–56. [Google Scholar] [CrossRef]
- Scrivener, K.L.; Ouzia, A.; Juilland, P.; Mohamed, A.K. Advances in understanding cement hydration mechanisms. Cem. Concr. Res. 2019, 124, 105823. [Google Scholar] [CrossRef]
- Bullard, J.W.; Jennings, H.M.; Livingaston, R.A.; Nonat, A.; Scherer, G.W.; Schweitzer, J.S.; Scrivener, K.L.; Thomas, J.J. Mechanisms of cement hydration. Cem. Concr. Res. 2011, 41, 1208–1223. [Google Scholar] [CrossRef]
- Bellmann, F.; Sowoidnich, T.; Ludwig, H.-M.; Damidot, D. Dissolution rates during the early hydration of tricalcium silicate. Cem. Concr. Res. 2015, 72, 108–116. [Google Scholar] [CrossRef]
- Nicoleau, L.; Nonat, A. A new view on the kinetics of tricalcium silicate hydration. Cem. Concr. Res. 2016, 86, 1–11. [Google Scholar] [CrossRef]
- Bazzoni, A.; Ma, S.; Wang, Q.; Shen, X.; Cantoni, M.; Scrivener, K.L. The effect of magnesium and zinc ions on the hydration kinetics of C3S. J. Am. Ceram. Soc. 2014, 97, 3684–3693. [Google Scholar] [CrossRef]
- Qin, L.; Gao, X.; Zhang, A. Potential application of Portland cement-calcium sulfoaluminate cement blends to avoid early age frost damage, Construct. Build. Mater. 2018, 190, 363–372. [Google Scholar] [CrossRef]
- Tang, S.W.; Zhu, H.G.; Li, Z.J.; Chen, E.; Shao, H.Y. Hydration stage identification and phase transformation of calcium sulfoaluminate cement at early age, Construct. Build. Mater. 2015, 75, 11–18. [Google Scholar] [CrossRef]
- Shaikh, F.U.A.; Supit, S.W.M. Chloride induced corrosion durability of high volume fly ash concretes containing nano particles. Constr. Build. Mater. 2015, 99, 208–225. [Google Scholar] [CrossRef]
- Cui, K.; Lau, D.; Zhang, Y.; Chang, J. Mechanical properties and mechanism of nano-CaCO3 enhanced sulphoaluminate cement-based reactive powder concrete. Construct. Build. Mater. 2021, 309, 125099. [Google Scholar] [CrossRef]
- Cuberos, A.J.; De La Torre, A.G.; Alvarez-Pinazo, G.; Martín-Sedeño, M.C.; Schollbach, K.; Pöllmann, H.; Aranda, M.A. Active iron-rich belite sulfoaluminate cements: Clinkering and hydration. Environ. Sci. Technol. 2010, 44, 6855–6862. [Google Scholar] [CrossRef]
- Morsli, K.; Angeles, G.; Zahir, M.; Aranda, M.A. Mineralogical phase analysis of alkali and sulfate bearing belite rich laboratory clinkers. Cem. Concr. Res. 2007, 7, 639–646. [Google Scholar] [CrossRef]
- Benarchid, M.Y.; Diouri, A.; Boukhari, A.; Aride, J.; Elkhadiri, I. Hydration of iron–phosphorus doped dicalcium silicate phase. Mater. Chem. Phys. 2005, 94, 190–194. [Google Scholar] [CrossRef]
- Izadifar, M.; Ukrainczyk, N.; Salah Uddin, K.M.; Middendorf, B.; Koenders, E. Dissolution of Portlandite in PureWater: Part 2 Atomistic Kinetic Monte Carlo (KMC) Approach. Materials 2022, 15, 1442. [Google Scholar] [CrossRef] [PubMed]
- Wang, F.; Kong, X.; Wang, D.; Wang, Q. The effects of nano-C-S-H with different polymer stabilizers on early cement hydration. J. Am. Ceram. Soc. 2019, 102, 5103–5116. [Google Scholar] [CrossRef]
- Khudyakova, T.M.; Kolesnikov, A.S.; Zhakipbaev, B.E.; Kenzhibaeva, G.S.; Kutzhanova, A.N.; Iztleuov, G.M.; Zhanikulov, N.N.; Kolesnikova, O.G.; Mynbaeva, E. Optimization of Raw Material Mixes in Studying Mixed Cements and Their Physicomechnical Properties. Refract Ind Ceram. 2019, 60, 76–81. [Google Scholar] [CrossRef]
- Kolesnikova, O.; Syrlybekkyzy, S.; Fediuk, R.; Yerzhanov, A.; Nadirov, R.; Utelbayeva, A.; Agabekova, A.; Latypova, M.; Chepelyan, L.; Volokitina, I.; et al. Thermodynamic Simulation of Environmental and Population Protection by Utilization of Technogenic Tailings of Enrichment. Materials 2022, 15, 6980. [Google Scholar] [CrossRef]
- Zou, F.B.; Hu, L.; Wang, F.Z.; Ruan, Y.X.; Hu, S.G. Enhancement of early-age strength of the high content fly ash blended cement paste by sodium sulfate and C-S-H seeds towards a greener binder. J. Clen. Pro. 2020, 244, 118566. [Google Scholar] [CrossRef]
- Izadifar, M.; Ukrainczyk, N.; Salah Uddin, K.M.; Middendorf, B.; Koenders, E. Dissolution of β-C2S Cement Clinker: Part 2 Atomistic Kinetic Monte Carlo (KMC) Upscaling Approach. Materials 2022, 15, 6716. [Google Scholar] [CrossRef]


| Code | CaO | SiO2 | Al2O3 | Fe2O3 | MgO | SO3 | TiO2 | Na2O | K2O | LOI |
|---|---|---|---|---|---|---|---|---|---|---|
| PC clinker | 65.74 | 19.64 | 3.68 | 4.18 | 2.28 | 1.27 | 0.18 | 0.32 | 0.88 | 1.33 |
| CSA clinker | 42.68 | 5.25 | 34.58 | 2.71 | 1.67 | 10.14 | 1.86 | - | 0.4 | 0.41 |
| Anhydrite | 43.53 | 0.5 | 0.1 | 0.2 | - | 55.16 | - | - | - | 0.32 |
| Mineral | PC Clinker | CSA Clinker |
|---|---|---|
| C3S | 57.23 | - |
| C2S | 20.11 | 15.75 |
| C3A | 6.26 | - |
| C4AF | 10.83 | 5.23 |
| C4A3 | - | 68.91 |
| C12A7 | - | 2.56 |
| other | 5.57 | 7.55 |
| Code | PC Clinker (% Mass) | CSA Clinker (% Mass) | Anhydrite (% Mass) | NCS (wt%) |
|---|---|---|---|---|
| PC | 95 | 0 | 5 | 0 |
| PC-0.5 wt% | 95 | 0 | 5 | 0.5 |
| PC-1.0 wt% | 95 | 0 | 5 | 1.0 |
| PC-2.0 wt% | 95 | 0 | 5 | 2.0 |
| PC-CSA | 90 | 5 | 5 | 0 |
| PC-CSA-0.5 wt% | 90 | 5 | 5 | 0.5 |
| PC-CSA-1.0 wt% | 90 | 5 | 5 | 1.0 |
| PC-CSA-2.0 wt% | 90 | 5 | 5 | 2.0 |
| Code | PC (g) | CSA (g) | Anhydrite (g) | Water (g) | NCS Suspensions (g) |
|---|---|---|---|---|---|
| PC | 285 | 0 | 15 | 90.0 | 0 |
| PC-0.5 wt% | 285 | 0 | 15 | 76.5 | 15 |
| PC-1.0 wt% | 285 | 0 | 15 | 63.0 | 30 |
| PC-2.0 wt% | 285 | 0 | 15 | 36.0 | 60 |
| PC-CSA | 270 | 15 | 15 | 90.0 | 0 |
| PC-CSA-0.5 wt% | 270 | 15 | 15 | 76.5 | 15 |
| PC-CSA-1.0 wt% | 270 | 15 | 15 | 63.0 | 30 |
| PC-CSA-2.0 wt% | 270 | 15 | 15 | 36.0 | 60 |
| Code | PC(g) | CSA(g) | Anhydrite (g) | Water (g) | NCS Suspensions (g) |
|---|---|---|---|---|---|
| PC | 2.85 | 0 | 0.15 | 0.90 | 0 |
| PC-2.0 wt% | 2.85 | 0 | 0.15 | 0.36 | 0.6 |
| PC-CSA | 2.70 | 0.15 | 0.15 | 0.90 | 0.3 |
| PC-CSA-2.0 wt% | 2.70 | 0.15 | 0.15 | 0.36 | 0.6 |
| Code | The Corresponding Compressive Strength Increase (%) | |||
|---|---|---|---|---|
| 10 h | 1 d | 3 d | 28 d | |
| PC-0.5 wt% | 28.9 | 9.7 | −0.9 | −0.3 |
| PC-1.0 wt% | 42.1 | 14.9 | 2.7 | −1.5 |
| PC-2.0 wt% | 81.6 | 22.0 | 0.9 | 0.7 |
| PC-CSA | 157.9 | 14.4 | −4.8 | −8.8 |
| PC-CSA-0.5 wt% | 223.7 | 34.4 | 7.5 | −2.4 |
| PC-CSA-1.0 wt% | 273.7 | 40.2 | 15.1 | 2.2 |
| PC-CSA-2.0 wt% | 326.7 | 52.9 | 29.2 | 0.4 |
| Binder | Generation of BW | Generation of CH | ||||
|---|---|---|---|---|---|---|
| 10 h | 1 d | 3 d | 10 h | 1 d | 3 d | |
| PC | 3.89 | 9.11 | 13.24 | 1.35 | 7.44 | 13.75 |
| PC-2.0 wt% | 5.69 | 9.15 | 13.07 | 3.43 | 7.05 | 13.47 |
| PC-CSA | 9.95 | 12.79 | 15.74 | 7.25 | 10.28 | 12.42 |
| PC-CSA-2.0 wt% | 12.36 | 15.22 | 17.62 | 7.44 | 10.55 | 12.23 |
Disclaimer/Publisher’s Note: The statements, opinions and data contained in all publications are solely those of the individual author(s) and contributor(s) and not of MDPI and/or the editor(s). MDPI and/or the editor(s) disclaim responsibility for any injury to people or property resulting from any ideas, methods, instructions or products referred to in the content. |
© 2023 by the authors. Licensee MDPI, Basel, Switzerland. This article is an open access article distributed under the terms and conditions of the Creative Commons Attribution (CC BY) license (https://creativecommons.org/licenses/by/4.0/).
Share and Cite
Tang, R.; Sun, D.; Wang, Z.; Wang, Z.; Cui, S.; Ma, W.; Lan, M. Synergistic Effect and Mechanism of Nano-C-S-H Seed and Calcium Sulfoaluminate Cement on the Early Mechanical Properties of Portland Cement. Materials 2023, 16, 1575. https://doi.org/10.3390/ma16041575
Tang R, Sun D, Wang Z, Wang Z, Cui S, Ma W, Lan M. Synergistic Effect and Mechanism of Nano-C-S-H Seed and Calcium Sulfoaluminate Cement on the Early Mechanical Properties of Portland Cement. Materials. 2023; 16(4):1575. https://doi.org/10.3390/ma16041575
Chicago/Turabian StyleTang, Ruifeng, Dawei Sun, Zhaojia Wang, Ziming Wang, Suping Cui, Wenxu Ma, and Mingzhang Lan. 2023. "Synergistic Effect and Mechanism of Nano-C-S-H Seed and Calcium Sulfoaluminate Cement on the Early Mechanical Properties of Portland Cement" Materials 16, no. 4: 1575. https://doi.org/10.3390/ma16041575