Abstract
The spectroscopic properties of Eu3+-doped Bi12SiO20 (BSO) were investigated and compared with that of Eu3+-doped Bi12GeO20 (BGO). The emission properties and the absorption spectra have been measured at 10 K as well as at 300 K (room temperature). Luminescence was detected due to the direct excitation of the 5D0 level of Eu3+, as well as through the excitation of the 5D1 level. The Judd–Ofelt theoretical framework was used to compute the radiative lifetimes (τ) and the omega parameters (Ωλ). The electric dipole transition probabilities, asymmetry ratios (R), along with the branching ratios (β) were also determined based on the obtained experimental data. The strongest detected luminescence belongs to the 5D0 → 7F0 transition observed at 578 nm, similar to the BGO sillenite. Reasons for the major presence of the 5D0 → 7F0 emission, theoretically forbidden by the Judd–Ofelt Theory, were investigated and compared with that of the BGO sillenite. Obtained results showed that the strong 5D0 → 7F0 line is also present in Eu:BSO, indicating that this is a feature of the entire sillenite family and not just Eu:BGO.
1. Introduction
The Bi12SiO20 (BSO) and Bi12GeO20 (BGO) crystals are both members of the sillenite family of materials, which possesses a cubic cell symmetry and belong to the space group I23 (number 197). The lattice constant equals 10.1455 Å for BGO and 10.104 Å for BSO, with cell volumes equal to 1044.288244 Å3 and 1031.5 Å3 for BGO and BSO, respectively, as reported in the literature [1,2]. Both BGO and BSO crystals in their undoped form are well-researched materials, (the first experiments were performed over 55 years ago on BGO in 1967 by Abrams S.C. et al. [3]) with many practical applications [1,2,3,4,5,6,7,8,9,10,11,12,13,14], such as Pockels cells and sensors [1,3], phase-conjugated spatial-time light modulators [6], or holographic memory storage [13,14,15,16]. Over the last few years, doping of sillenites with transition-metal ions (e.g., Fe, Co, Cr or Cu) has been researched quite intensively with the goal of increasing the usefulness of BSO and BGO for holographic storage applications [17,18,19,20,21,22,23,24]. In 2020, BGO crystals doped with Eu3+ were successfully grown, which exhibited a strong luminescence in the yellow–red range of spectrum and could potentially be used as a laser material [25].
In principle, the luminescence process happens as follows: When the excitation radiation is being absorbed by a material, an electron moves from the ground state to a higher lying (upper) state. As the electron then returns from the upper state to the ground state, it emits a photon, which yields in turn observable luminescence in the host material. The trivalent europium ion (Eu3+) can be used in the investigations of various properties of dielectric materials (as a spectroscopic probe) due to the fact that the 5D0 energy level (which is a higher lying state, from which luminescence primarily occurs) and the 7F0 ground state of trivalent europium are of a nondegenerate nature, which results in a single observable line for transitions between those levels in the spectrum. This can be seen in the partial energy diagram for trivalent europium in Figure 1, where upward arrows signify excitation energy, while downward arrows symbolize emission. The other unique feature of Eu3+ is that the intensity of the 5D0 → 7F1 transition is independent of the environment (due to being of a magnetic dipole origin), which means it can be used as a reference to other transitions during analysis of the emission spectra [26].
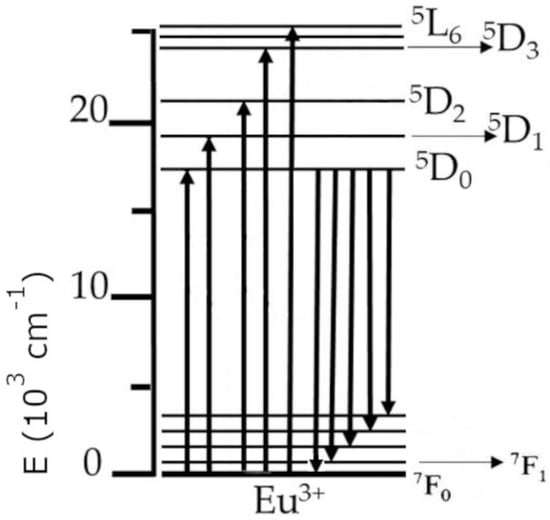
Figure 1.
The partial energy diagram of the trivalent europium ion.
During the study of Bi12GeO20 samples doped with europium, a very narrow and strong 7F0 emission line from the 5D0 level was observed [25]. As typically this line is very weak in most materials, additional study was warranted to see if this property is unique only to the Eu3+:Bi12GeO20 (Eu:BGO) or if it is a feature of the entire sillenite family when doped with europium. In light of the very interesting results of the Eu:BGO investigation [25], we have applied the Judd–Ofelt theory [26,27] in order to analyze the Eu3+:Bi12SiO20 (Eu:BSO) crystal system excited states dynamics and photoluminescence, in order to compare the Eu3+-doped BGO and Eu3+-doped BSO members of the sillenite family, to better understand the unique emission characteristics of Eu3+ in the I23 crystal system, and to further evaluate the potential benefits of doping sillenites with rare earths.
As only in the case of trivalent europium, the doubly reduced matrix elements are not equal to zero for only one parameter (U2) per a given transition, which allows the calculation of the Judd–Ofelt intensity parameters (Ω2,4,6) in a relatively simple manner, by using only the emission spectrum, which is impossible for any of the other rare-earth ions. The Judd–Ofelt parameters permit the calculations of other crucially important factors, such as the probabilities of the emission transitions, which is significant, for example, during the evaluation of a material as a possible candidate for lasing [26,27].
2. Materials and Methods
2.1. Crystal Growth
BSO melts congruently at 895 °C, therefore, it can be directly grown from melts of stoichiometric composition (Bi2O3:SiO2 in molar ratio equal to 6:1) [28]. In our investigations, we carried out single crystal growth of BSO:Eu by means of the Kyropoulos method [29]. Good-quality pure BSO single crystals grown in the past [28] by means of the Chochralski technique [28,30] were used as a raw material. The BSO single crystals grown with the use of 99.99% Bi2O3 and SiO2 were transparent and did not have any imperfections that could be seen during visual inspection. They were crushed and molten with a Eu2O3 powder of 99.99% purity. 1 at. % of Eu substituting Bi ions was used. The Kyropoulos technique, due to properly established temperature gradients in a two-zone resistance furnace controlled with 2704 Eurotherm regulators/programmers, allowed the growth of seeded bulk single crystals in the volume of the melt. No pulling was used, the rotation rate was equal to 6 rpm, and the furnace temperature was lowered at a rate of 0.02 K/h. The crystallization was carried out with the use of a BSO seed oriented in a [110] crystallographic direction. After reaching approximately 30 mm in the cross-section, the as-grown BSO:Eu single crystal was pulled out of the melt and cooled to room temperature at the rate of 6 K/h.
Relatively low temperature gradients allowed the growth of BSO:Eu single crystals confined with crystallographic faces, as shown in Figure 2, where the bottom and side faces of as-grown [110] BSO:Eu single crystal are shown. Two-fold symmetry can be clearly seen. The crystal was transparent except for a narrow core in the central part of the as-grown crystal near the bottom face. The formation of the core was caused by constitutional supercooling due to a lowering of the temperature gradient on the crystal bottom ((110) surface) propagating into the volume of melt. The experimental XRD powder diffraction pattern along with the Rietveld refinement plot and refined structure of the Bi12SiO20:Eu3+ unit cell is shown for reference in Figure A1, and matches undoped sillenite reference data (per Crystallography Open Database entry ID 1533225).
Figure 2.
Bottom and side faces of the [110] BSO:Eu single crystal, as grown.
2.2. Samples Characterization
Emission measurements were carried out using a spectrophotometer manufactured by Photon Technology International (Photon Technology International, Edison NJ, USA). Emission spectra were measured with a double set monochromator (model: SP-2500i Manufacturer: Teledyne Princeton Instruments, Acton, MA, USA), which was followed by a photomultiplier tube (PMT) and a photon counting system (model: SR-400 Manufacturer: Stanford Research Systems, Sunnyvale, CA, USA). The samples were also excited by a pulsed tunable optical parametric oscillator (operating at a 10 ns pulse width, with a repetition rate of 10 Hz. Made by: Continuum (now part of Amplitude Laser company, Amplitude Laser Inc., Milpitas, CA, USA)) which was pumped by a frequency-tripled Nd: YAG pulse laser (model: Continuum Surelite II, also manufactured by Amplitude Laser Inc., Milpitas, CA, USA). For room temperature studies, the samples were excited with a optically pumped semiconductor laser (OPSL) (Verdi G8 made by Coherent Inc., Santa Clara, CA, USA ) operating at 532 nm in a CW mode. The absorption spectrum was measured at room temperature (300 K) using a spectrophotometer (make and model: Lambda 950 manufactured by Perkin–Elmer, Llantrisant, UK). Fluorescence dynamics profiles were recorded with a multi-channel analyzer (model: SR-430 Manufacturer: Stanford Research Systems, Sunnyvale, CA, USA ) controlled with a PC. The sample was cooled using a closed-cycle He optical cryostat system (Displex ARS CSW-202, made by Advanced Research Systems, Macungie, PA, USA) which permitted the temperature to be adjusted from 300 K to 10 K.
3. Results and Discussion
The emission and absorption spectra were measured at 10 K and 300 K with the aid of the cryostat equipment. The BSO crystal, similar to the BGO crystal, exhibits strong absorption in the short-wavelength region of the visible spectrum. The exact location of the 5D0 ← 7F0 level of Eu3+ for BSO has been determined from the 10 K absorption spectrum to be 17279 cm−1 (578.72 nm), while for BGO it was previously determined to be 17277 cm−1 (578.8 nm) [25]. Only one maximum for the 5D0 ← 7F0 line has been detected in both Eu3+-doped BSO and BGO. The line spectral widths are comparable in both BGO and BSO. The comparison between emission and absorption lines in BSO is shown below in Figure 3. (absorption line in red, emission line in blue). The FWHM is equal to 0.12 nm in BSO.
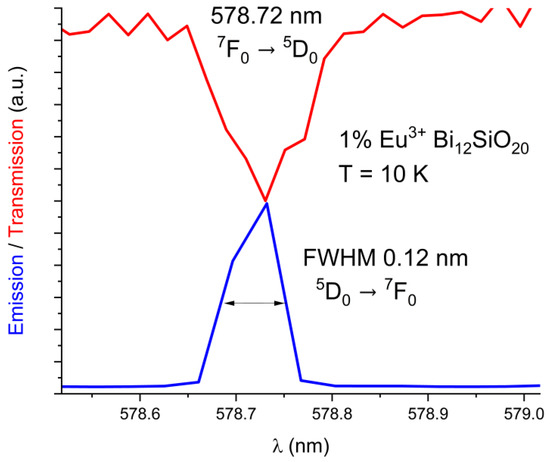
Figure 3.
Low-temperature (10 K) absorption line 7F0 → 5D0 overlaid with the 5D0 → 7F0 emission line in BSO.
Emission spectra of the BSO sample were recorded at 10 K and at 300 K. To compare the spectra of BSO and of BGO correctly, all the emission spectra were normalized with regards to their maximum emission intensity, scaled to the range from 0 to 1. The emission spectra of Eu3+ from the 5D0 level for BSO (this work) and BGO [25] recorded at room temperature are shown in Figure 4a,b below, where all transitions except a very rarely observed 5D0 → 7F6 and 5D0 → 7F5 transition are presented. During the investigations of the Eu3+-doped BGO samples [25], it was discovered that, while shorter-wavelength visible light is strongly absorbed by the host matrix, thus preventing efficient direct excitation of europium, there exist two alternatives: indirect through UV excitation of Bi3+ at 365 nm and thus activation of Eu3+ through energy transfer; or through the direct Eu3+ excitation at a wavelength of 532 nm (5D0 excitation through the 5D1 level from the 7F1 state), which is very efficient at room temperature because the 7F1 state can be thermally populated at room temperature due to its very close proximity to the 7F0 ground state [31,32]. The same transitions are visible when exciting Eu3+ directly or via energy transfer from Bi3+. Direct europium excitation via 532 nm yields an emission of a higher intensity relative to the energy transfer method.
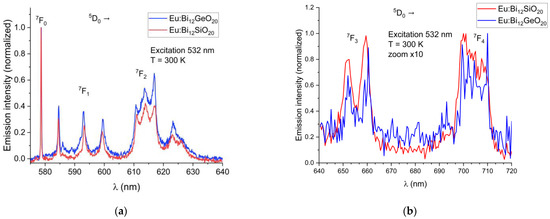
Figure 4.
(a) Partial emission spectra of Eu3+ showing the 5D0 → 7F0,1,2 transitions in BSO and BGO at T = 300 K; (b) Partial emission spectra of Eu3+ showing the 5D0 → 7F3 and 5D0 → 7F4 transitions in BSO and BGO at T = 300 K (scaled for better visibility).
In both BSO and BGO, the 5D0 → 7F0 transition is very narrow and is the strongest of all observed transitions under the 532 nm excitation at room temperature, with the 5D0 → 7F1 and 5D0 → 7F2 having a higher intensity in BGO than in BSO (as can be seen in Figure 4a). The 7F1 levels are triply split in both BGO and BSO at 300 K and at 10 K, which confirms the same crystal symmetry in both specimens, as expected, with the 7F1 and 7F2 peaks shifted by about 0.1 nm in BSO with respect to BGO when measured at room temperature. Since the 7F1 level becomes thermally depopulated at very low temperatures, this prevents the use of the 532 nm excitation wavelength for the low-temperature studies at 10 K; less efficient excitation via the wavelength of 465 nm is therefore used instead, since it was experimentally proven that both BGO [25] and BSO exhibit luminescence under that excitation wavelength at 10 K, albeit with a lesser intensity than when excited at room temperature. Weak 5D1 emissions were observed in the range of 586 nm to 592 nm because of the 5D1 level excitation. Low-temperature (10 K) emission spectra showing the major 5D0 → 7F0,1,2 transitions in BSO and BGO, along with weak emissions from the 5D1 level are shown in Figure 5. The 7F0 emission line is not split in both BSO and BGO, indicating that the europium ion occupies only a single site in both cases.
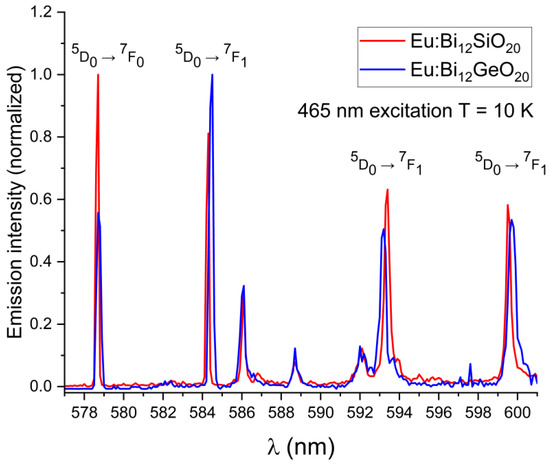
Figure 5.
Low-temperature emission spectra (at T = 10 K) showing the wavelength shift for the primary 5D0 → 7F0,1 transitions of Eu3+ in BSO with regards to BGO; weak lines from the 5D1 level in the range 586 nm to 592 nm are also visible.
The wavelength shift of the Eu3+ emission peaks in BSO with respect to BGO is more pronounced at low temperatures (the 7F1 peak at 584.3 nm is blue-shifted by 0.2 nm, the 7F1 peak at 593.4 nm is red-shifted by 0.2 nm, and the 7F1 peak at 599.5 nm is blue-shifted by 0.2 nm). While the 5D0 → 7F0 emission peaks were of equal intensity at room temperature, at low temperature under the 465 nm excitation, the peak remains strongest in BSO, while in BGO, the peak intensity decreases significantly (albeit with no noticeable shift in position with respect to the same peak in BSO when measured at low temperature), and the 5D0 → 7F1 line is dominant instead. This indicates that nonradiative and thermal processes have a significant impact on the emission characteristics of trivalent europium in both sillenites. In order to verify the origin of the weak emission lines seen in Figure 5, partial emission spectrum were taken under 525 nm excitation to exclude any possible emissions from higher states, permitting only the emissions from the 5D0,1 levels to occur. Next, the excitation wavelength was changed to 578 nm to permit only emissions from the 5D0 level to occur. The partial spectrum with the 5D0,1 lines shown in detail is presented in Figure 6a, while in Figure 6b, only the triple 7F1 lines resulting from direct 5D0 excitation are shown. While the weak lines in the range 586 nm to 592 nm are present in the emission spectrum taken under the 525 nm excitation, they are absent from the spectrum where only the 5D0 was excited directly, thus confirming that the weak lines in question are present due to the emission from the 5D1 level.

Figure 6.
(a) Partial low-temperature (10 K) emission spectrum of Eu3+ in BSO showing combined 5D0 and weak 5D1 emission lines under 525 nm excitation. (b) Emission from the 5D0 level to the 7F1 state, under resonant 5D0 level excitation at 578 nm, showing no lines present in 586 nm to 592 nm range.
The luminescent decay of the 5D0 level was also measured at T = 10 K. The decay time is equal to 371 μs for BSO, while for BGO it is equal to 387 μs [25], as can be seen in Figure 7a below. Additionally, the calculated theoretical radiative luminescence decay times both for BGO and BSO are significantly longer than experimentally measured, which can be attributed to the presence of a very intense 5D0 → 7F0 line, the contribution of which is not accounted for by the classical Judd–Ofelt theory [27,33,34], as discussed later in this article.
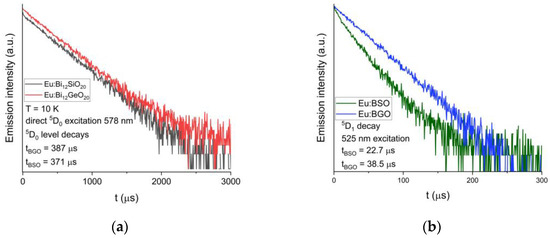
Figure 7.
(a) Comparison of the decay curves for the 5D0 level of trivalent europium in BSO and BGO; recorded at T = 10 K. (b) Comparison of the decay curves for the 5D1 level of trivalent europium in BSO and BGO; recorded at T = 10 K.
Luminescent decays of the 5D1 level under the 525 nm excitation were also compared between BGO and BSO, and similarly to the 5D0 level, the 5D1 level lifetime measured in BSO (equal to 23 μs) is shorter than that of BGO (equal to 39 μs [25]).
The luminescence of a material can also be presented as a set of coordinates within the CIE color coordinate system, which is commonly used as a framework referencing how a human eye perceives color [35]. Below in Figure 8, the emission profile of europium-doped BSO is represented on a CIE 1976 chromaticity diagram. Similar to the Eu:BGO samples, due to the high intensity of the 5D0 → 7F0 transition and moderately intense 5D0 → 7F1 transition, the spectrum is of yellow-orange tint, as opposed to the typical deep-red found in Eu3+-doped materials where 5D0 → 7F2 transition dominates.
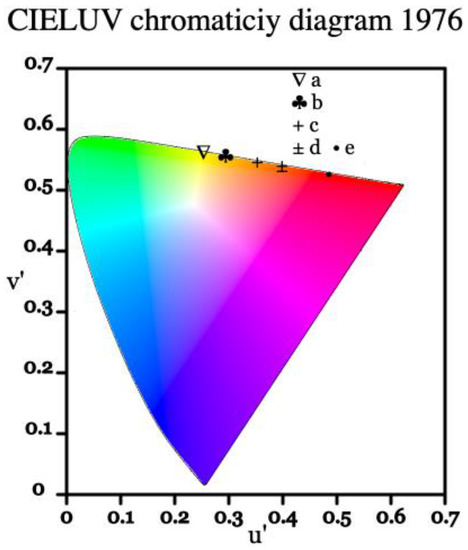
Figure 8.
CIE 1976 representation of significant emission lines from the 5D0 level in Eu:BSO, where points from a to e represent significant peaks. Point a represents the 5D0 → 7F0 transition, points b to d represent the 5D0 → 7F1 transition, and point e represents the 5D0 → 7F2 transition.
The Judd–Ofelt theory [27,33,34] is a recognized method for comparison and analysis of the spectroscopic properties of trivalent rare-earth ions (also known as lanthanides) in dielectric hosts. For most of those elements, calculations are based upon the tabulated reduced matrix elements (U2) and measurements of integrated absorption cross sections. By using the convention and symbols based upon the formulas derived by K. Binnemans in [26], the dipole strength (in units of Debye2), based upon the integrated peak areas of the absorption spectra, can be expressed as:
where denotes the mean wavenumber of the transition (in cm−1), C is the mol dopant concentration, d symbolizes the optical path length, and is the fractional thermal population at temperature T of level A (from which the absorption process starts). Furthermore, the calculated dipole strength can be obtained by using the below formula:
where 2J + 1 denotes the degeneracy of the ground state, e2 is the value of elementary charge, and 1036 is the factor to convert from the D2 into esu × cm. are the squared reduced matrix elements (which were tabulated and made widely available through the works of Carnall et al. [36,37]). The term accounts for the correction of the effect in the dielectric medium, where n denotes its refractive index. As the Judd–Ofelt calculations are often completed using the oscillator strength parameter, oscillator strength f and the dipole strength D can be converted by using the following formula:
It is significant to remark at this point that the trivalent europium ion has most of the reduced matrix elements (U2) equal to 0. The only values greater than zero are for: ║U2║2 element, which corresponds to the 5D0 →7F2 transition; as well as for ║U4║2 and║U6║2 elements, which correspond to the 5D0 → 7F4, and 5D0 → 7F6 transitions, respectively. Therefore, it is feasible to calculate the values of the Ωλ parameters for europium-doped materials based upon the integrated areas of the emission spectrum. As the 5D0 → 7F1 transition is independent of the host environment (due to its magnetic-dipole character), it can therefore be treated as a reference for other transitions originating from the 5D0 excited state. Based upon the formulas published by Binnemans K. [26], the reference value for the 5D0 → 7F1 transition (Aref) may be calculated as follows:
where AMD,0 denotes the spontaneous emission probability for the 5D0 → 7F1 magnetic dipole transition in vacuo (equal to 14.65 s−1 [26]), and n denotes the refractive index of the host material. It is therefore possible to derive the Judd–Ofelt omega parameters (Ωλ) from the ratio of the integrated intensity of the 5D0 → 7FJ (where J = 2, 4 or 6) transitions (denoted as in the below equation) to the ratio of the integrated intensities of the 5D0 → 7F1 transition (marked as in the below equation) by using the formula [26]:
where the symbolizes the averaged wavenumber of the 5D0 → 7F1 transition and symbolizes the average wavenumber of the 5D0 → 7F2,4,6 transitions. The averaged wavenumber can be calculated as follows:
As the 5D0 → 7F6 transition is observed very rarely, it is often just possible to derive the and Judd–Ofelt parameters but not the . Given that the 5D0 → 7F1 transition has a magnetic-dipole character, its dipole strength can therefore be expressed as DMD = 9.6 * 10−6 Debye2, and upon further assumption that the DMD is equal to 0 for other transitions, then for transitions 7F2,4,6 from the 5D0 level, the DED factor is calculated as follows:
Additionally, for the 5D0 → 7F0,3,5 transitions, both DMD and DED values are assumed to be 0 [26]. Considering all of the above, it is therefore possible to derive the radiation transition probabilities for all of the excited states by using the calculated parameters of the Judd–Ofelt theory by using the following equation [26]:
where the average wavenumber of the transition (in units of cm−1) is denoted by , 2J + 1 denotes the degeneracy of the initial state, and h symbolizes the Planck constant. Therefore, the radiative branching ratios βR( from level J to J′ can now be derived by using the values from the formula above [26] since:
Through the application of the standard least-squares method, the root mean square (RMS) deviation can be defined as shown below:
where N is the number of transitions used in the fitting procedure and 3 is the number of the parameters being fitted (. It is therefore possible at this point to fit iteratively the parameters. Additionally worth mentioning is the asymmetry parameter R, which is defined as the ratio between the integral intensities of the 5D0 → 7F2 and 5D0 → 7F1 transition bands and can be calculated from the emission spectrum recorded at room temperature (300 K). It can be formally written as R = I(5D0 → 7F2)/I(5D0 → 7F1) and can indicate the trivalent europium ion symmetry. Specifically, the further from a centrosymmetric geometry the luminescent center is located, the larger is the expected the value of the R parameter [26,38].
The R parameter equals 2.347 for the 1% Eu3+-doped BGO sample [25], and 2.619 for BSO, also doped 1% Eu3+. The slight differences in the R values between similarly doped sillenites can be accounted for by the fact that the ionic radius of Si is less than that of Ge, which affects the length of the atomic bonds in the primary structure of the sillenite, therefore influencing the internal stability [21]. To a lesser degree, there may be slight variations in the exact amount of europium dopant in each sample.
The Judd–Ofelt parameters and branching and asymmetric ratios were calculated for BSO based upon the recorded emission spectra. The parameters for BGO are sourced from [25]. The spontaneous emission probabilities, radiative lifetimes, and fluorescence branching ratios of BSO and BGO using the derived parameters are shown for comparison in Table 1.

Table 1.
The spontaneous emission probabilities (A), radiative lifetimes (τ), fluorescence branching ratios (β), and asymmetry ratios (R) of BSO and BGO calculated using the obtained Judd–Ofelt parameters ().
Obtained theoretical radiative lifetimes are both, in the case of BSO and BGO, significantly longer than experimentally measured values, which indicates that not all of the processes that are occurring are being taken effectively into account by the classical Judd–Ofelt theory [27] (including thermal and other complex processes such as spin–orbit interaction or J–J mixing [26,39,40], which can have a significant impact on the emission characteristics of Eu3+ [26,41,42]). The comparison of the Judd–Ofelt parameters between europium-doped BSO and other trivalent europium-doped hosts is shown in Table 2 below. As mentioned above, the Judd–Ofelt parameter Ω2 can generally be used to represent the strength of the covalency and the site symmetry of europium [26,38,43]. The value of Ω2 in the BSO sample is larger than that of europium-doped hosts: Bi12GeO20,YAl3(BO3)4, Ba2GdV3O11, LaF3 and YAlO3. This trend further validates the stipulation that the values of, and relations between, the derived Judd–Ofelt omega parameters are strongly host-dependent, and thus can be used as a general indicator of the host symmetry, as stated in [25].
Table 2.
The comparison of the Judd–Ofelt parameters between different europium-doped hosts.
Additionally, based upon the results obtained from the emission spectra of trivalent europium in BSO, the energy level positions for the primary emissions from the 5D0 level were determined and are presented in Table 3 below.
Table 3.
Partial energy structure of Eu3+ determined from observed emission transitions from the 5D0 state for BSO and BGO hosts.
The obtained results show a lot of similarities among Eu3+-doped BSO and Eu3+-doped BGO materials with respect to the emission spectrum, including the presence of a very strong 5D0 → 7F0 emission line. The difference between calculated Judd–Ofelt parameters for the materials under investigation is quite small—less than 1 for both Ω2 and Ω4 parameters. The observable luminescent decay times are also similar—differing by less than 20 μs. The RJJ parameter, indicative of the degree of J–J mixing [39,40] which can be defined formally as RJJ = I(5D0 → 7F0)/I(5D0 → 7F1), is in the case of BSO, equal to 0.1052, whereas in case of BGO, it is 0.2962 [25]. Therefore, in light of the obtained results, it is reasonable to assume that the stipulations with regard to J–J mixing, spin–orbit interaction, [26,39,40,51] the Wybourne–Downer mechanism [52], and the breakdown of the closure approximation in the Judd–Ofelt theory [53] stipulated in the case of the 5D0 → 7F0 emission line in BGO [25] also hold true in case of europium-doped BSO. It would be an interesting future study to check whether other sillenite family members such as Bi12TiO20 (BTO) would show similar results. It would also be scientifically beneficial to investigate deeper the nonradiative and thermal-related interactions and their influence on the Eu3+ ion in the scope of the family of sillenites.
4. Conclusions
The spectroscopic properties of trivalent europium-doped Bi12SiO20 (BSO) sillenite bulk crystals were investigated. The emission properties as well as the absorption spectra have been measured at 300 K and at 10 K. Luminescence from the 5D0 level was observed both at room temperature (300 K) as well as at 10 K. The Judd–Ofelt omega parameters as well as the radiative lifetimes were successfully derived based upon the Judd–Ofelt theory. [27,33,34] Electric dipole transition probabilities and branching ratios were also determined based upon obtained experimental measurements. Similarities and differences between europium-doped BGO and BSO were discussed and potential further areas for scientific investigation have been outlined.
Author Contributions
Conceptualization, M.K. (Marcin Kowalczyk), M.K. (Marcin Kaczkan) and M.M. (Michał Malinowski); Methodology, M.K. (Marcin Kowalczyk), M.K. (Marcin Kaczkan) and M.M.; Validation, M.K. (Marcin Kowalczyk) and M.K. (Marcin Kaczkan); Investigation, M.K. (Marcin Kowalczyk) and M.K. (Marcin Kaczkan); Resources, A.M.; Writing—original draft preparation, M.K. (Marcin Kowalczyk); Writing—review and editing, M.K. (Marcin Kowalczyk), M.K. (Marcin Kaczkan), A.M. and M.M. All authors have read and agreed to the published version of the manuscript.
Funding
No external funding was provided for this research. The APC was funded by Warsaw University of Technology.
Institutional Review Board Statement
Not applicable.
Informed Consent Statement
Not applicable.
Data Availability Statement
Data can be provided upon a reasonable request.
Acknowledgments
The authors would like to thank Maciej J. Chrunik, Military University of Technology, Warsaw for performing the XRD measurements.
Conflicts of Interest
The authors declare no conflict of interest.
Appendix A

Figure A1.
Experimental XRD powder diffraction pattern along with Rietveld refinement plot and refined structure of Bi12SiO20:Eu3+ unit cell.
Figure A1.
Experimental XRD powder diffraction pattern along with Rietveld refinement plot and refined structure of Bi12SiO20:Eu3+ unit cell.

References
- Malinovskiy, V.K.; Gudaev, O.A.; Gusev, V.A.; Demenko, S.I. Photoinduced Phenomena in Sillenite Crystals; Nauka: Novosibirsk, Russia, 1990. [Google Scholar]
- Neov, S.; Marinova, V.; Reehuis, M.; Sonntag, R. Neutron-Diffraction Study of Bi12MO20 Single Crystals with Sillenite Structure (M = Si, Si0.995Mn0.005, Bi0.53Mn0.47). Appl. Phys. A Mater. Sci. Process 2002, 74, s1016–s1018. [Google Scholar] [CrossRef]
- Abrahams, A.C.; Jamieson, P.B.; Bernstein, J.L. Crystal Structure of Piezoelectric Bismuth Germanium Oxide Bi 12GeO20. Chem. Phys. 1967, 44, 4034–4041. [Google Scholar] [CrossRef]
- Owechko, Y.; Tanguay, A.R. Effects of Operating Mode on Electrooptic Spatial Light Modulator Resolution and Sensitivity. Opt. Lett. 1982, 7, 587. [Google Scholar] [CrossRef] [PubMed]
- Bayvel, P.; McCall, M.; Wright, R.V. Continuous Method for Measuring the Electro-Optic Coefficient in Bi12SiO20 and Bi12GeO20. Opt. Lett. 1988, 13, 27. [Google Scholar] [CrossRef]
- Casasent, D.; Caimi, F.; Khomenko, A. Test and Evaluation of the Soviet Prom and Priz Spatial Light Modulators. Appl. Opt. 1981, 20, 4215. [Google Scholar] [CrossRef]
- Garrett, M.H. Properties of Photorefractive Nonstoichiometric Bismuth Silicon Oxide, BiSiO1.5X+ 2. J. Opt. Soc. Am. B 1991, 8, 78–87. [Google Scholar] [CrossRef]
- Romashko, R.V.; Grachev, A.I.; Kulchin, Y.N.; Kamshilin, A.A. Fast Photogalvanic Response of a Bi12SiO20 Crystal. Opt. Express 2010, 18, 27142. [Google Scholar] [CrossRef]
- Avanesyan, V.T.; Piskovatskova, I.V. Photodielectric Effect in Bi12SiO20 Sillenite Crystals. Semiconductors 2020, 54, 19–21. [Google Scholar] [CrossRef]
- Eftimov, T.; Dyankov, G.; Kolev, P.; Vladev, V.; Kolaklieva, L. A Polarimetric Fiber Optic Current Sensor Based on Bi12SiO20 Crystal Fluorescence. Opt. Mater. 2022, 133, 112837. [Google Scholar] [CrossRef]
- Diankov, G.L.; Tassev, V.L.; Gospodinov, M. Fiber Optic Magnetic Field Sensor Head Based on BSO Crystal. In Proceedings of the Ninth International School on Quantum Electronics: Lasers—Physics and Applications, Varna, Bulgaria, 16–20 September 1996; Atanasov, P.A., Ed.; SPIE: Bellingham, WA, USA, 1996; Volume 3052, pp. 390–393. [Google Scholar]
- Petricevic, S.J.; Mihailovic, P.; Radunovic, J. A Miniature Pockels Cell with Novel Electrode Geometry. Sensors 2009, 9, 5298–5307. [Google Scholar] [CrossRef]
- Huignard, J.P.; Micheron, F. High-Sensitivity Read-Write Volume Holographic Storage in BSO and BGO Crystals. Appl. Phys. Lett. 1976, 29, 591. [Google Scholar] [CrossRef]
- Peltier, M.; Micheron, F. Volume Hologram Recording and Charge Transfer Process in Bi12SiO20 and Bi12GeO20. J. Appl. Phys. 1977, 48, 3683. [Google Scholar] [CrossRef]
- Hou, S.L.; Lauer, R.B.; Aldrich, R.E. Transport Processes of Photoinduced Carriers in Bi12SiO20. J. Appl. Phys. 1973, 44, 2652–2658. [Google Scholar] [CrossRef]
- Douglas, G.G.; Zitter, R.N. Transport Processes of Photoinduced Carriers in Bismuth Germanium Oxide (Bi12GeO20). J. Appl. Phys. 1968, 39, 2133–2135. [Google Scholar] [CrossRef]
- Briat, B.; Borowiec, M.T.; Rjeily, H.B.; Ramaz, F.; Hamri, A.; Szymczak, H. Combined Optical/Mcd/Odmr Investigations of Photochromism in Doubly-Doped Bi12GeO20. Radiat. Eff. Defects Solids 2002, 157, 989–993. [Google Scholar] [CrossRef]
- Tassev, V.; Gospodinov, M.; Veleva, M. Optical Activity of BSO Crystals Doped with Cr, Mn and Cu. Opt. Mater. 1999, 13, 249–253. [Google Scholar] [CrossRef]
- Wood, A.W.; Hunt, C.A.; Martin, J.J. The Low-Temperature Photochromic and Photorefractive Response of Bismuth Germanium Oxide Doped with Molybdenum. J Appl. Phys. 2007, 101, 1–7. [Google Scholar] [CrossRef]
- Stepanova, I.V.; Gorashchenko, N.G.; Subbotin, K.A.; Smirnov, V.A. Determination of the Charge State of Chromium in Cr:Bi12GeO20 Single Crystals by Spectral Luminescence Methods. Opt. Spectrosc. Engl. Transl. Opt. I Spektrosk. 2009, 107, 335–338. [Google Scholar] [CrossRef]
- Lu, J.; Dai, Y.; Zhu, Y.; Huang, B. Density Functional Characterization of Pure and Alkaline Earth Metal-Doped Bi12GeO20, Bi12SiO20, and Bi12TiO20 Photocatalysts. Chem. Cat. Chem. 2011, 3, 378–385. [Google Scholar] [CrossRef]
- Marinova, V.; Lin, S.H.; Hsu, K.Y. Photorefractive Properties Enhancement of Doped Bismuth Sillenite Crystals. Opt. Mem. Neural Netw. Inf. Opt. 2011, 20, 7–22. [Google Scholar] [CrossRef]
- Marinova, V.; Liu, R.C.; Lin, S.H.; Hsu, K.Y. Real-Time Holography in Ruthenium-Doped Bismuth Sillenite Crystals at 1064 Nm. Opt. Lett. 2011, 36, 1981. [Google Scholar] [CrossRef] [PubMed]
- Marinova, V.; Liu, R.C.; Lin, S.H.; Hsu, K.Y. Quasi-Nonvolatile Storage in Ru-Doped Bi12SiO20 Crystals by Two-Wavelength Holography. Opt. Express 2012, 20, 19628. [Google Scholar] [CrossRef] [PubMed]
- Kowalczyk, M.; Ramazanova, T.F.; Grigoryeva, V.D.; Shlegel, V.N.; Kaczkan, M.; Fetliński, B.; Malinowski, M. Optical Investigation of Eu3+ Doped Bi12GeO20 (BGO) Crystals. Crystals 2020, 10, 285. [Google Scholar] [CrossRef]
- Binnemans, K. Interpretation of Europium(III) Spectra. Coord. Chem. Rev. 2015, 295, 1–45. [Google Scholar] [CrossRef]
- Hehlen, M.P.; Brik, M.G.; Krämer, K.W. 50th Anniversary of the Judd-Ofelt Theory: An Experimentalist’s View of the Formalism and Its Application. J. Lumin 2013, 136, 221–239. [Google Scholar] [CrossRef]
- Majchrowski, A.; Borowiec, M.T.; Zmija, J.; Szymczak, H.; Zaleski, M. Influence of Some Dopants on Optical Properties of Bi12GeO20 and Bi12SiO20 Single Crystals Grown by the Czochralski Technique. In Proceedings of the Nonlinear Optics of Liquid and Photorefractive Crystals, Ai-Danil, Ukraine, 23–30 October 1995; Klimusheva, G.V., Iljin, A.G., Eds.; SPIE: Bellingham, WA, USA, 1996; Volume 2795, pp. 253–256. [Google Scholar]
- Bliss, D.F. Evolution and Application of the Kyropoulos Crystal Growth Method. In 50 Years Progress in Crystal Growth; Elsevier: Amsterdam, The Netherlands, 2004; p. 29. [Google Scholar]
- Tanguay, A.R.; Mroczkowski, S.; Barker, R.C. The Czochralski Growth of Optical Quality Bismuth Silicon Oxide (Bi12SiO20). J. Cryst. Growth 1977, 42, 431–434. [Google Scholar] [CrossRef]
- Blois, L.; Carneiro Neto, A.N.; Malta, O.L.; Brito, H.F. The Role of the Eu3+ 7F1 Level in the Direct Sensitization of the 5D0 Emitting Level through Intramolecular Energy Transfer. J. Lumin 2022, 247, 118862. [Google Scholar] [CrossRef]
- Malta, O.L. Mechanisms of Non-Radiative Energy Transfer Involving Lanthanide Ions Revisited. J. Non Cryst. Solids 2008, 354, 4770–4776. [Google Scholar] [CrossRef]
- Ofelt, G.S. Intensities of Crystal Spectra of Rare-Earth Ions. J. Chem. Phys 1962, 37, 511–520. [Google Scholar] [CrossRef]
- Judd, B.R. Optical Absorption Intensities of Rare-Earth Ions. Phys. Rev. 1962, 127, 750–761. [Google Scholar] [CrossRef]
- Ćirić, A.; Stojadinović, S.; Dramićanin, M.D. Approximate Prediction of the CIE Coordinates of Lanthanide-Doped Materials from the Judd-Ofelt Intensity Parameters. J. Lumin 2019, 213, 395–400. [Google Scholar] [CrossRef]
- Carnall, W.T.; Fields, P.R.; Rajnak, K. Electronic Energy Levels of the Trivalent Lanthanide Aquo Ions. IV. Eu3+. J. Chem. Phys 1968, 49, 4424–4442. [Google Scholar] [CrossRef]
- Carnall, W.T.; Crosswhite, H.; Crosswhite, H.M. Energy Level Structure and Transition Probabilities in the Spectra of the Trivalent Lanthanides in LaF3; Argonne National Lab. (ANL): Argonne, IL, USA, 1978. [Google Scholar]
- Kolesnikov, I.E.; Povolotskiy, A.V.; Mamonova, D.V.; Kolesnikov, E.Y.; Kurochkin, A.V.; Lähderanta, E.; Mikhailov, M.D. Asymmetry Ratio as a Parameter of Eu3+ Local Environment in Phosphors. J. Rare Earths 2018, 36, 474–481. [Google Scholar] [CrossRef]
- Chen, X.Y.; Liu, G.K. The Standard and Anomalous Crystal-Field Spectra of Eu3+. J. Solid State Chem. 2005, 178, 419–428. [Google Scholar] [CrossRef]
- Smentek, L.; Kȩdziorski, A. Electric Dipole Transitions; Old Problems in a New Light. J. Alloys Compd. 2009, 488, 586–590. [Google Scholar] [CrossRef]
- Sabbatini, N.; de Cola, L.; Vallarino, L.M.; Blasse, G. Radiative and Nonradiative Transitions in the Europium(III) Hexaaza Macrocyclic Complex [Eu(C22H26N6)(CH3COO)](CH3COO)Cl.2H2O. J. Phys. Chem 1987, 91, 4681–4685. [Google Scholar] [CrossRef]
- Loureno, S.A.; Dantas, N.O.; Serqueira, E.O.; Ayta, W.E.F.; Andrade, A.A.; Filadelpho, M.C.; Sampaio, J.A.; Bell, M.J.V.; Pereira-Da-Silva, M.A. Eu3+ Photoluminescence Enhancement Due to Thermal Energy Transfer in Eu2O3-Doped SiO2B2O3PbO2 Glasses System. J. Lumin 2011, 131, 850–855. [Google Scholar] [CrossRef]
- Li, N.; Xue, Y.; Wang, D.; Liu, B.; Guo, C.; Song, Q.; Xu, X.; Liu, J.; Li, D.; Xu, J.; et al. Spectroscopic Properties of Eu:Bi4Ge3O12 Single Crystal Grown by the Micro-Pulling-down Method. J. Lumin 2019, 208, 208–212. [Google Scholar] [CrossRef]
- Loiko, P.A.; Dashkevich, V.I.; Bagaev, S.N.; Orlovich, V.A.; Mateos, X.; Serres, J.M.; Vilejshikova, E.V.; Yasukevich, A.S.; Yumashev, K.v.; Kuleshov, N.v.; et al. Judd-Ofelt Analysis of Spectroscopic Properties of Eu3+:KLu(WO4)2 Crystal. J. Lumin 2015, 168, 102–108. [Google Scholar] [CrossRef]
- Loiko, P.A.; Dashkevich, V.I.; Bagaev, S.N.; Orlovich, V.A.; Yasukevich, A.S.; Yumashev, K.v.; Kuleshov, N.V.; Dunina, E.B.; Kornienko, A.A.; Vatnik, S.M.; et al. Spectroscopic and Photoluminescence Characterization of Eu3+-Doped Monoclinic KY(WO4)2 crystal. J. Lumin 2014, 153, 221–226. [Google Scholar] [CrossRef]
- ben Amar, N.; Koubaa, T.; Hassairi, M.A.; Kbaïli, I.; Dammak, M. Optical Spectroscopy of Eu3+ Ions Doped in YAl3(BO3)4 Crystal. J. Lumin 2015, 160, 95–100. [Google Scholar] [CrossRef]
- Dalal, J.; Dalal, M.; Devi, S.; Dhankhar, P.; Hooda, A.; Khatkar, A.; Taxak, V.B.; Khatkar, S.P. Structural and Judd-Ofelt Intensity Parameters of a down-Converting Ba2GdV3O11:Eu3+ Nanophosphors. Mater. Chem. Phys 2020, 243, 122631. [Google Scholar] [CrossRef]
- Xie, J.; Cheng, L.; Tang, H.; Yu, X.; Wang, Y.; Wang, C.; Mi, X.; Liu, Q.; Zhang, X. Synthesis and Photoluminescence Properties of NaBi(WO4)2:Eu3+ Red-Emitting Phosphor for NUV-Based WLEDs. J. Lumin 2020, 219, 116841. [Google Scholar] [CrossRef]
- Liu, Y.; Luo, W.; Li, R.; Liu, G.; Antonio, M.R.; Chen, X. Optical Spectroscopy of Eu3+ Doped ZnO Nanocrystals. J. Phys. Chem. C 2008, 112, 686–694. [Google Scholar] [CrossRef]
- Liu, L.; Chen, X. Energy Levels, Fluorescence Lifetime and Judd-Ofelt Parameters of Eu3+ in Gd2O3 Nanocrystals. Nanotechnology 2007, 18, 255704. [Google Scholar] [CrossRef]
- Souza, A.S.; Oliveira, Y.A.R.; Couto dos Santos, M.A. Enhanced Approach to the Eu3+ Ion 5D0→7F0 Transition Intensity. Opt. Mater. 2013, 35, 1633–1635. [Google Scholar] [CrossRef]
- Burdick, G.W.; Downer, M.C.; Sardar, D.K. A New Contribution to Spin-Forbidden Rare Earth Optical Transition Intensities: Analysis of All Trivalent Lanthanides. J. Chem. Phys 1989, 91, 1511–1520. [Google Scholar] [CrossRef]
- Tanaka, M.; Nishimura, G.; Kushida, T. Contribution of J Mixing to the 5D0 − 7F0 Transition of Eu3+ Ions in Several Host Matrices. Phys. Rev. B 1994, 49, 16917–16925. [Google Scholar] [CrossRef]


Disclaimer/Publisher’s Note: The statements, opinions and data contained in all publications are solely those of the individual author(s) and contributor(s) and not of MDPI and/or the editor(s). MDPI and/or the editor(s) disclaim responsibility for any injury to people or property resulting from any ideas, methods, instructions or products referred to in the content. |
© 2023 by the authors. Licensee MDPI, Basel, Switzerland. This article is an open access article distributed under the terms and conditions of the Creative Commons Attribution (CC BY) license (https://creativecommons.org/licenses/by/4.0/).