Article

Can Differently Stabilized Silver Nanoparticles Modify Calcium Phosphate Precipitation?

by
Suzana Inkret
1,
Marija Ćurlin
2,
Kristina Smokrović
3,
Nikolina Kalčec
4,
Nikolina Peranić
4,
Nadica Maltar-Strmečki
3,
Darija Domazet Jurašin
1 and
Maja Dutour Sikirić
1,*
1
Laboratory for Biocolloids and Surface Chemistry, Division of Physical Chemistry, Ruđer Bošković Institute, Bijenička c. 54, 10000 Zagreb, Croatia
2
School of Medicine, Catholic University of Croatia, 10000 Zagreb, Croatia
3
Laboratory for Electron Spin Spectroscopy, Division of Physical Chemistry, Ruđer Bošković Institute, Bijenička c. 54, 10000 Zagreb, Croatia
4
Institute for Medical Research and Occupational Health, Ksaverska cesta 2, 10000 Zagreb, Croatia
*
Author to whom correspondence should be addressed.
Materials 2023, 16(5), 1764; https://doi.org/10.3390/ma16051764
Submission received: 24 January 2023 / Revised: 17 February 2023 / Accepted: 19 February 2023 / Published: 21 February 2023
(This article belongs to the Section Materials Chemistry)

Abstract

:
Calcium phosphates (CaPs) composites with silver nanoparticles (AgNPs) attract attention as a possible alternative to conventional approaches to combating orthopedic implant-associated infections. Although precipitation of calcium phosphates at room temperatures was pointed out as an advantageous method for the preparation of various CaP-based biomaterials, to the best of our knowledge, no such study exists for the preparation of CaPs/AgNP composites. Motivated by this lack of data in this study we investigated the influence of AgNPs stabilized with citrate (cit-AgNPs), poly(vinylpyrrolidone) (PVP-AgNPs), and sodium bis(2-ethylhexyl) sulfosuccinate (AOT-AgNPs) in the concentration range 5–25 mg dm−3 on the precipitation of CaPs. The first solid phase to precipitate in the investigated precipitation system was amorphous calcium phosphate (ACP). The effect of AgNPs on ACP stability was significant only in the presence of the highest concentration of AOT-AgNPs. However, in all precipitation systems containing AgNPs, the morphology of ACP was affected, as gel-like precipitates formed in addition to the typical chain-like aggregates of spherical particles. The exact effect depended on the type of AgNPs. After 60 min of reaction time, a mixture of calcium-deficient hydroxyapatite (CaDHA) and a smaller amount of octacalcium phosphate (OCP) formed. PXRD and EPR data point out that the amount of formed OCP decreases with increasing AgNPs concentration. The obtained results showed that AgNPs can modify the precipitation of CaPs and that CaPs properties can be fine-tuned by the choice of stabilizing agent. Furthermore, it was shown that precipitation can be used as a simple and fast method for CaP/AgNPs composites preparation which is of special interest for biomaterials preparation.

1. Introduction

Calcium phosphates (CaPs), sparingly soluble salts of phosphoric acid, are of particular interest because of their role in biomineralization and various industrial processes [1]. Importance is further enhanced by the fact that they are found in pathological deposits and on an industrial scale [1,2]. CaPs occur in nature as compounds that differ in Ca/P molar ratio, solubility, and pH range in which they are stable. Of the 12 known non-substituted CaPs, the most abundant are amorphous calcium phosphate (ACP), octacalcium phosphate [OCP, Ca8(HPO4)2(PO4)4·5H2O], calcium hydrogenphosphate dihydrate [DCPD, CaHPO4·2H2O], calcium deficient apatite [CaDHA, Ca10−x(HPO4)x(PO4)6−x(OH)2−x, 0 < x < 1], β-tricalcium phosphate [β-TCP, Ca3(PO4)2] and hydroxyapatite [HAP, Ca10(PO4)6(OH)2] [3].
The interactions of the nascent CaPs with various types of additives are fundamental to their formation in organisms and are also exploited in the production of materials with well-defined properties [4,5]. In biomineralization, the additives precisely control the nucleation sites, crystal structure, composition, morphology, and orientation of the forming crystals [6,7]. As a result, materials with exceptional properties are formed, that are often unsurpassed by any man-made material [8,9,10].
This motivated the study of the influence of different types of additives on the formation and transformation of CaPs. As a result, the general principles of the CaPs interactions with additives are known, although the studies were conducted under different experimental conditions [4,5,11]. However, this approach has not yet been fully exploited for the rational design of advanced materials [5]. In recent years, various nanomaterials (NMs) have attracted attention as additives in the preparation of CaP-based biomaterials. Two main purposes of using NMs are to improve the mechanical properties of CaPs [12] and/or improve biological properties [13,14], for example, by using nanomaterials with antimicrobial properties. In this sense, silver nanoparticle AgNPs are of particular interest, as silver exhibits a broad spectrum of antimicrobial activity [15]. Silver is unlikely to cause bacterial resistance [16], although there is also evidence to the contrary [17]. This motivated development of silver ion-substituted calcium phosphates [18]. As it was shown that a limited amount of silver can be incorporated in this way [19] and that antimicrobial activity can be increased by using silver nanoparticles (AgNPs) [20], recently attention was turned to the incorporation of AgNPs in CaP-based coatings [21,22], scaffolds [23,24] and dental composites [25,26], as well as to the development of CaP/AgNPs composites. Various methods have been used for the preparation of CaP/AgNPs composites: spray pyrolysis [27,28], pulsed laser irradiation [29], pulsed laser deposition [30], adsorption of AgNPs on pre-prepared CaPs [31,32], mixing AgNPs and biphasic calcium phosphate suspensions [33], sequential treatment of AgNPs with solutions containing calcium or phosphate ions [34], co-precipitation of AgNPs and CaPs [35,36,37], precipitation at elevated temperatures [38].
The preparation of biomaterials by precipitation at low temperatures is considered an economically and environmentally friendly synthetic route [39,40]. Moreover, the activity of biologically active molecules can be easily preserved in this way, and the coating of complex shapes is possible. However, to the best of our knowledge, the precipitation of CaPs at low temperatures in the presence of AgNPs has not yet been studied. From the fundamental point of view, such a procedure could provide an additional possibility to control the process by using differently stabilized AgNPs.
To fill this void, in this study we investigated the precipitation of calcium phosphate in the presence of AgNPs stabilized with citrate (cit-AgNPs), poly(vinylpyrrolidone) (PVP-AgNPs), and sodium bis(2-ethylhexyl) sulfosuccinate (AOT-AgNPs). A precipitation system was chosen in which the formation of the precipitate proceeds through an amorphous precursor to be able to determine the effects on the formation and properties of amorphous (ACP) and crystalline CaPs. The results obtained indicate that subtle differences in the properties of the formed CaPs were caused by differently stabilized AgNPs. They also confirm that precipitation at room temperature can be used as a simple and rapid method for the preparation of CaP/AgNPs composites.

2. Materials and Methods

2.1. Materials

The following analytical grade chemicals were used: silver nitrate (AgNO3), sodium citrate dihydrate (C6H5Na3O7·2H2O, cit), poly(vinylpyrrolidone) ((C6H9NO)x, PVP) with average molecular weight Mr = 40,000 g mol−1, sodium bis(2-ethylhexyl) sulfosuccinate (C20H37NaO7S, AOT), glucose (C6H12O6), ammonium (NH3), calcium chloride dihydrate (CaCl2 × 2H2O), sodium hydrogenphosphate (Na2HPO4), sodium hydroxide (NaOH), hydrochloric acid (HCl). All chemicals were purchased from Sigma Aldrich, Darmstadt, Germany. Ultrapure water (UPW, conductivity 0.5 μS cm−1, Hydrolab HLP 10 UV, Straszyn, Poland) was used for all experiments.

2.2. Synthesis of Silver Nanoparticles

2.2.1. Citrate-Coated Silver Nanoparticles

Cit-AgNPs were synthesized according to the modified method described previously [41,42]. Briefly, 2.2 mL of a 90 × 10−3 mol dm−3 solution of silver nitrate was added to 195 mL of ultrapure water. The solution was brought to boiling under rapid stirring and reflux. Immediately after boiling, 2.27 mL of a 1% (w/v) sodium citrate dihydrate solution was rapidly added to the reaction mixture. The reaction mixture was stirred continuously at 90 °C for about 15 min. After the color changed from colorless to yellow, the reaction mixture was kept under rapid stirring for 3 h. The freshly prepared cit-AgNPs suspension was washed twice with ultrapure water by centrifugation at 15,790× g for 20 min. The purified cit-AgNPs were resuspended in ultrapure water and stored in the dark at 4 °C until use.

2.2.2. AOT and PVP Coated AgNPs

AOT-AgNPs and PVP-AgNPs were prepared according to the modified method of Vinković Vrček et al. [43,44], using glucose instead of NaBH4 as a reducing agent. The syntheses of AOT-AgNPs and PVP-AgNPs were performed at room temperature and 40 °C, respectively. To the aqueous solution of stabilizing agent (193 mL of 5 × 10⁻³ mol dm−3 AOT or 192.7 mL of 0.3 % PVP) at the appropriate temperature, 2.22 mL of a 90 × 10−3 mol dm−3 AgNO3 solution was added with stirring. Next, 0.133 mL of a 35 % NH3 solution was added, followed by the addition of 4 mL of 0.5 mol dm−3 glucose solution at a rate of approximately 1 drop/s. Finally, 0.6 mL of 1 mol dm−3 NaOH was added. The obtained suspensions were kept at synthesis temperature for another 30 min under stirring. The purified AgNPs were obtained and stored for further use as described for cit-AgNPs.

2.3. Precipitation System

The cationic (CaCl2) and anionic reactant (Na2HPO4) stock solutions were prepared by dissolving the required amount of analytical-grade chemicals in ultra-pure water. Before the preparation of stock solutions, chemicals were dried overnight in a desiccator over silica gel. Subsequently, the pH of the Na2HPO4 stock solution was adjusted to 7.4 with HCl.
The anionic and cationic reactant solutions were prepared by diluting the corresponding stock solutions to the concentration c = 8 · 10−3 mol dm−3. The required amount of AgNPs suspension was added to the anionic reactant solution during the dilution of the stock solution. If necessary, the pH of the anionic reactant solution was readjusted.
The precipitation systems were prepared by rapidly mixing 200 cm3 of anionic and cationic reactant solutions, resulting in the initial reactant concentrations c(CaCl2) = c(Na2HPO4) = 4 · 10−3 mol dm−3 and c(AgNPs) = 5, 10, and 25 mg dm−3 at pH = 7.4. Precipitation experiments were performed in a double-walled vessel at 25 ± 0.1 °C without additional stirring. The reaction vessel was kept in the dark.
The progress of precipitation was followed by monitoring the pH (913 pH meter, Metrohm, Herisau, Switzerland) of the precipitation system. Based on the pH vs. time curves, the formed precipitates were filtered at aging times corresponding to the formation of amorphous and crystalline phases. The precipitates were filtered through a 0.45 μm membrane filter, washed thoroughly with ultrapure water, and once with ethanol. Subsequently, they were dried in a nitrogen stream and stored in the dark in a desiccator until further analysis.
Saturation indices, defined as the logarithm of the ratio of ion activity product and solubility constant of each solid phase, were calculated from the initial total concentrations of the reactants using VMINTEQ 3.1 (available at http://vminteq.lwr.kth.se/download/ (accessed on 21 April 2021).

2.4. Characterization Methods

2.4.1. Powder X-ray Diffraction

Powder X-ray Diffraction (PXRD) patterns of the precipitates were obtained on a Panalytical Aeris Research Edition (Malvern Pananalytical, Malvern, Worcestershire, UK) in Bragg–Brentano geometry using CuKα radiation. Patterns were recorded in an angular scan range of 5° to 70° 2θ with a step size of 0.02° 2θ and a scan rate of 1° min−1.

2.4.2. Fourier Transform Infrared Spectroscopy

Fourier Transform Infrared (FTIR) spectra of the precipitates were obtained by an FTIR spectrometer equipped with an attenuated total reflection module (Tensor I, Bruker, Ettlingen, Germany). The spectra were recorded in the range from 4000−450 cm−1 with a resolution of 1 cm−1 and are average of 16 scans.
The first- and second-order differentiated FTIR spectra in the 1200–450 cm−1 range were obtained following the procedure described by Uskoković [45] using a manual differentiation routine in Origin Pro 2021b.

2.4.3. Atomic Absorption Spectroscopy

To determine the silver concentration in the AgNPs suspensions, the samples were dissolved in 10% (v/v) HNO3. Silver concentrations were determined using a graphite furnace atomic absorption spectrometer (GFAAS) (Perkin Elmer AAnalyst 600, Perkin Elmer, Shelton, CT, USA) with Zeeman background correction. A silver standard solution (1000 mg dm−3 in 5% HNO3), purchased from Merck (Darmstadt, Germany), was used for calibration.

2.4.4. UV-Vis Spectroscopy

The UV-Vis spectra of the aqueous AgNPs suspensions were obtained by Carry 60 UV-Vis spectrophotometer (Agilent, Santa Clara, CA, USA). The presence of a surface plasmon resonance peak was used to confirm the formation of AgNPs.

2.4.5. Dynamic and Electrophoretic Light Scattering

The size distribution and zeta potential of AgNPs in an anionic reactant solution were determined by dynamic (DLS) and electrophoretic light scattering (ELS) using a photon correlation spectrophotometer with a 532 nm “green” laser (Zetasizer Nano ZS, Malvern Instruments, Worcestershire, UK). For the DLS measurements, the intensity of the scattered light was detected at an angle of 173°. To avoid overestimation due to the scattering of larger particles, the hydrodynamic diameter (dh) was determined as the value of the peak maximum of the size volume distribution function. The zeta potential (ζ) was calculated from the measured electrophoretic mobility using Henry’s equation and the Smoluchowski approximation. To determine the size distribution, each sample was measured six times, while for determining zeta potential the samples were measured three times. Representative data are shown. Data processing was performed using Zetasizer Software 8.02 (Malvern Instrument, Worcestershire, UK). All measurements were conducted at 25.0 ± 0.1 °C.

2.4.6. Thermogravimetric Analysis

Thermogravimetric analysis (TGA) of the precipitates obtained after 1 h of reaction time was carried out on an STA 449 F5 Jupiter thermal analyzer (Netzsch, Bayern, Germany) and Mettler TG 50 thermobalance (Mettler Toledo Corp., Zürich, Switzerland) equipped with a TC 10 TA processor. The measurements were performed in the stream of air and at a heating rate of 10 K min−1.

2.4.7. Electron Paramagnetic Spectroscopy (EPR)

Electron paramagnetic resonance (EPR) measurements were performed using the Bruker Magnettech ESR5000 benchtop EPR spectrometer operating at X-band frequencies with a resonant microwave frequency of 9.4 GHz. The magnetic field was modulated at 100 kHz with a peak-to-peak amplitude of 0.1 mT. The temperature was controlled using a variable temperature controller for liquid nitrogen (TCH04). Manganese, Mn2+ in ZnS, (Bruker module E8000137) was used as a field standard to control and calibrate the magnetic field axis. All measurements were performed at room temperature. No EPR signal was detected in the empty EPR tube or the non-irradiated samples. To create paramagnetic centers, all samples were irradiated in the presence of air at room temperature with gamma rays from the panoramic Co-60 irradiator of the Laboratory of Radiation Chemistry and Dosimetry at the Ruđer Bošković Institute [46]. The total dose was 25 kGy, which is considered the ‘gold standard’ for the sterilization of food, medical devices, and other healthcare products [47,48]. Radiation-induced free radicals have been used as molecular probes for further EPR analysis of samples.

2.4.8. Transmission Electron Microscopy (TEM)

Transmission electron microscopy images of AgNPs and amorphous precipitates were acquired using a JEOL JEM 1010 transmission electron microscope (JEOL, Tokio, Japan) operated at 80 kV. A drop of the suspension was placed on the copper grid covered with the hollow Formvar membrane. The excess solution was removed with filter paper and the remaining precipitate was washed three times with a drop of UPW. The samples were dried in the stream of nitrogen and stored in the dark in a desiccator until analysis.
Primary size distributions of AgNPs and spherical ACP particles were determined using Image J 1.48 v image analysis software (freely available at http://imagej.nih.gov/ij/ (accessed on21 April 2021). The size of at least 30 particles was measured for each sample.

2.4.9. Scanning Electron Microscopy (SEM)

For imagining crystalline precipitate field emission scanning electron microscope (FE-SEM; JEOL JSM-7000 F microscope, JEOL, Tokyo, Japan) was used. For SEM analysis a small amount of dried precipitate was placed on a sample holder covered with carbon adhesive. The excess precipitate was removed with a light stream of nitrogen.

3. Results and Discussion

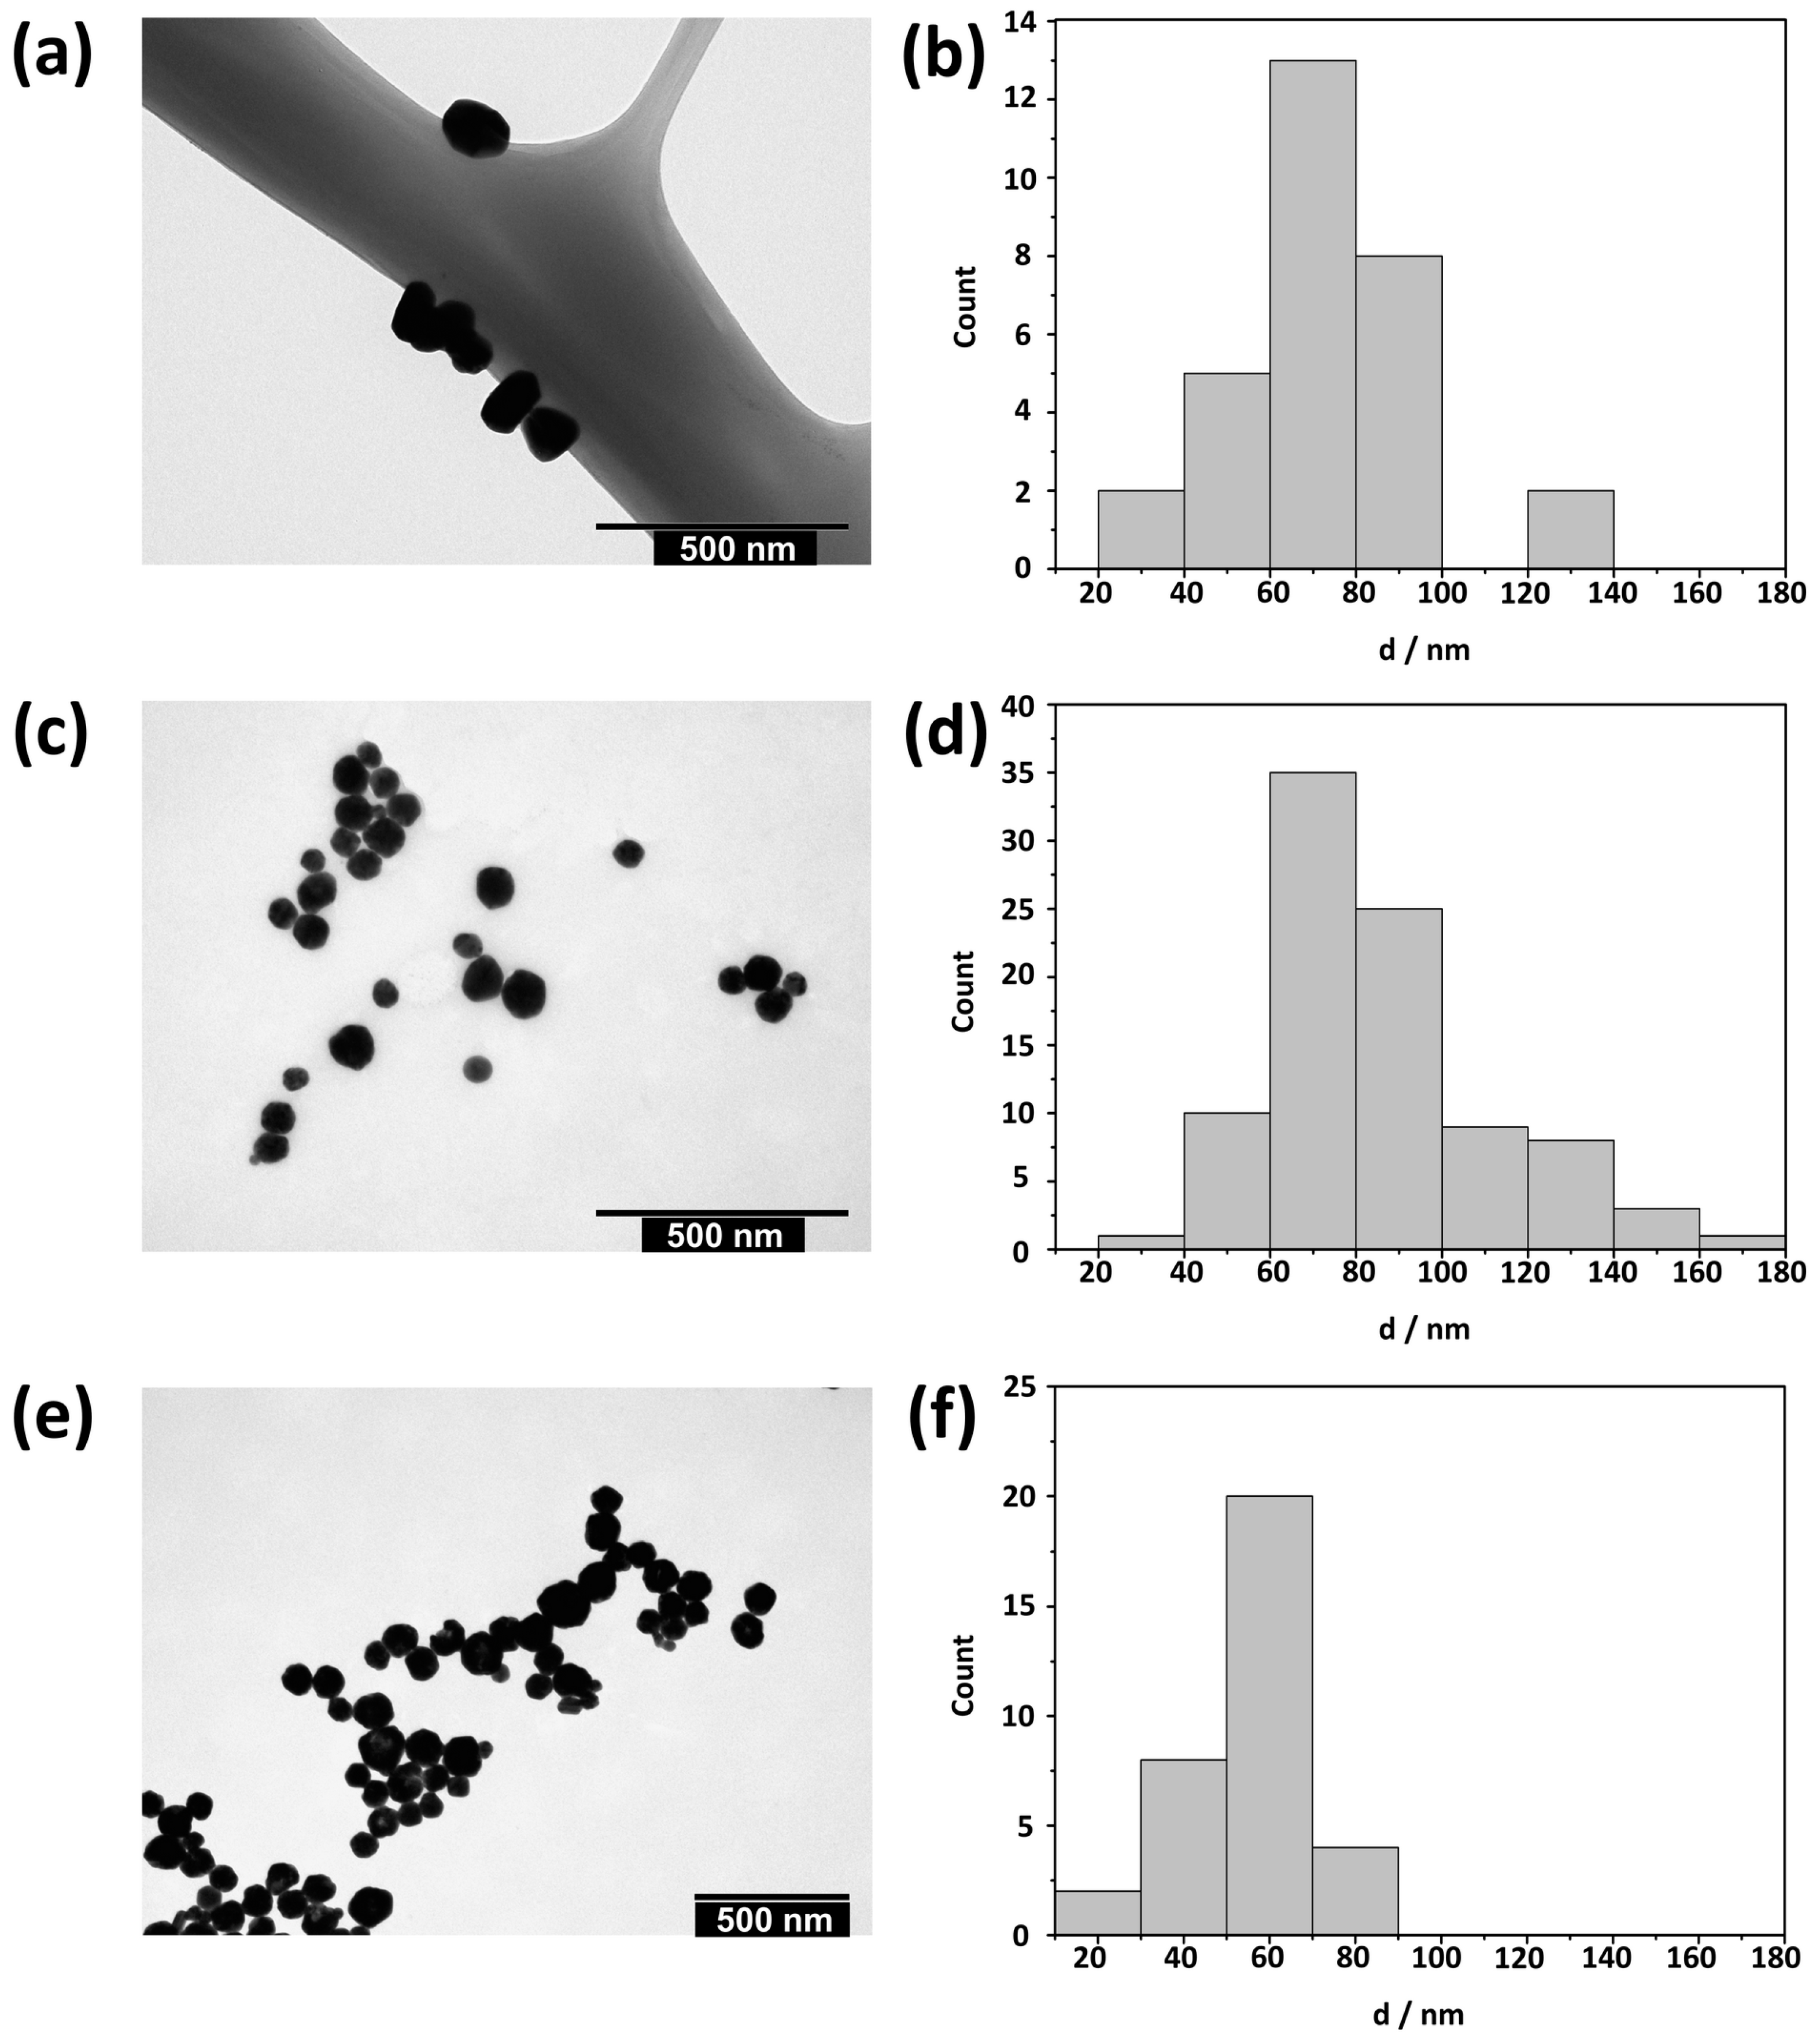
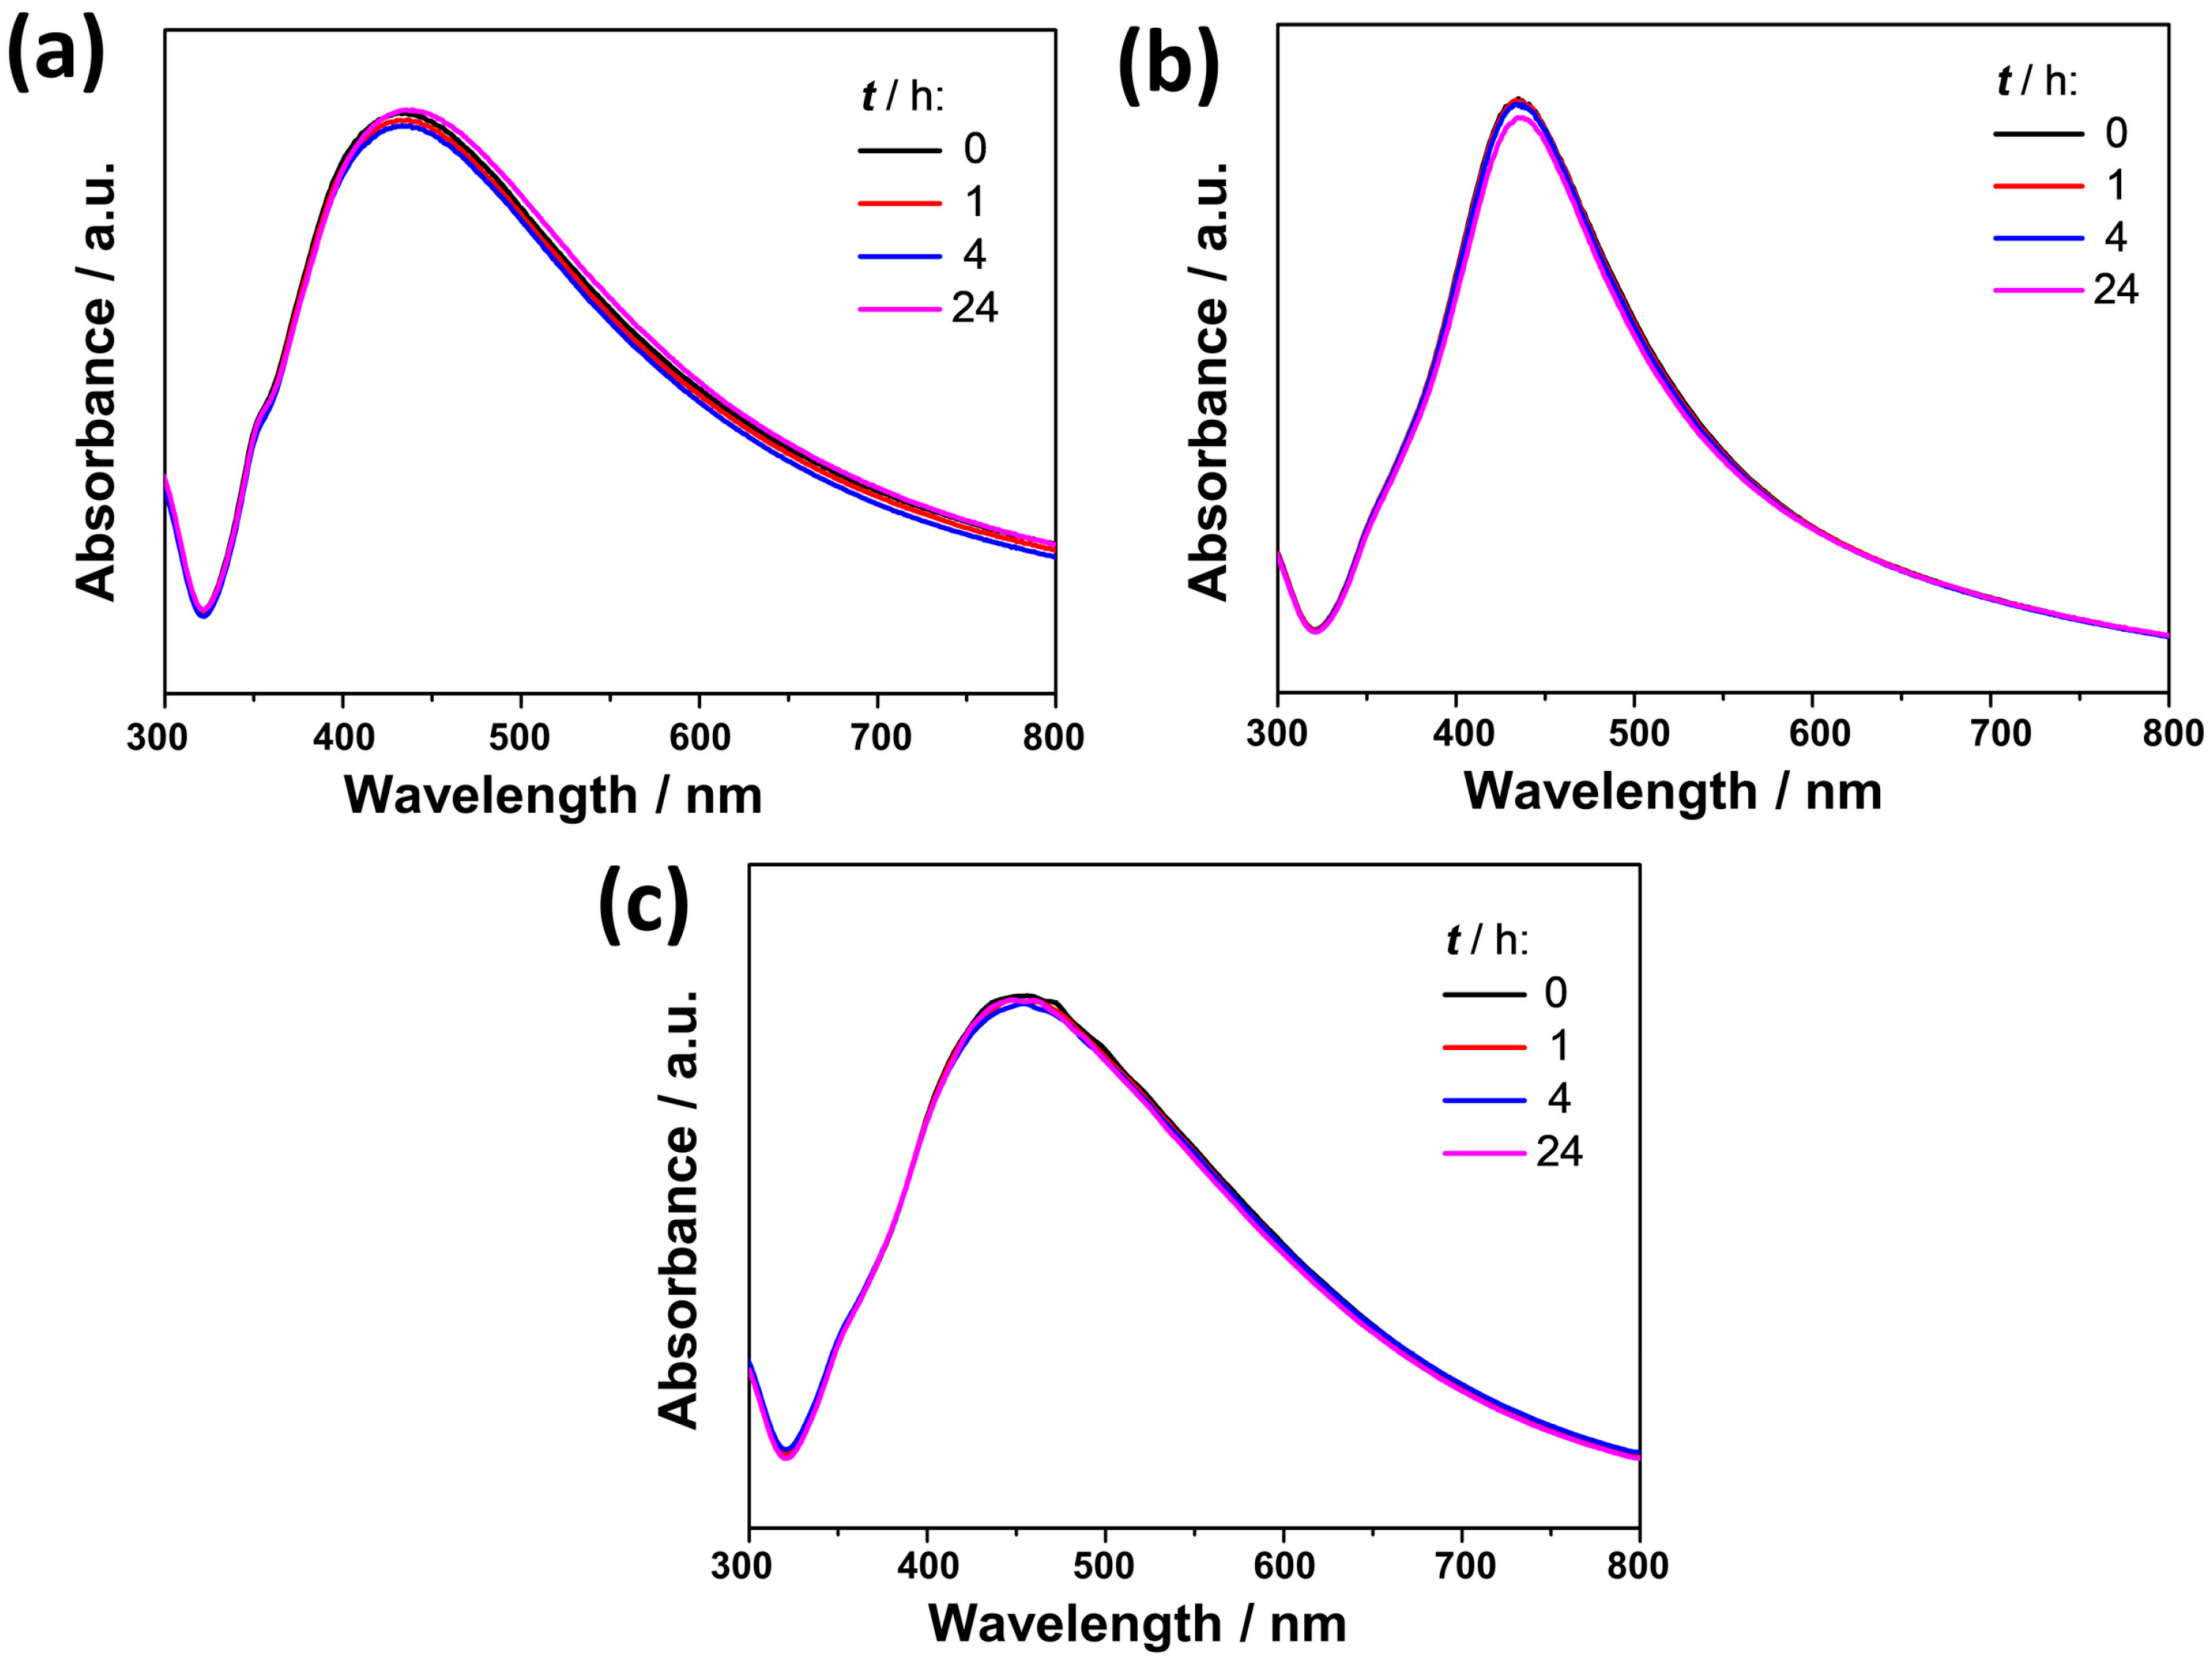
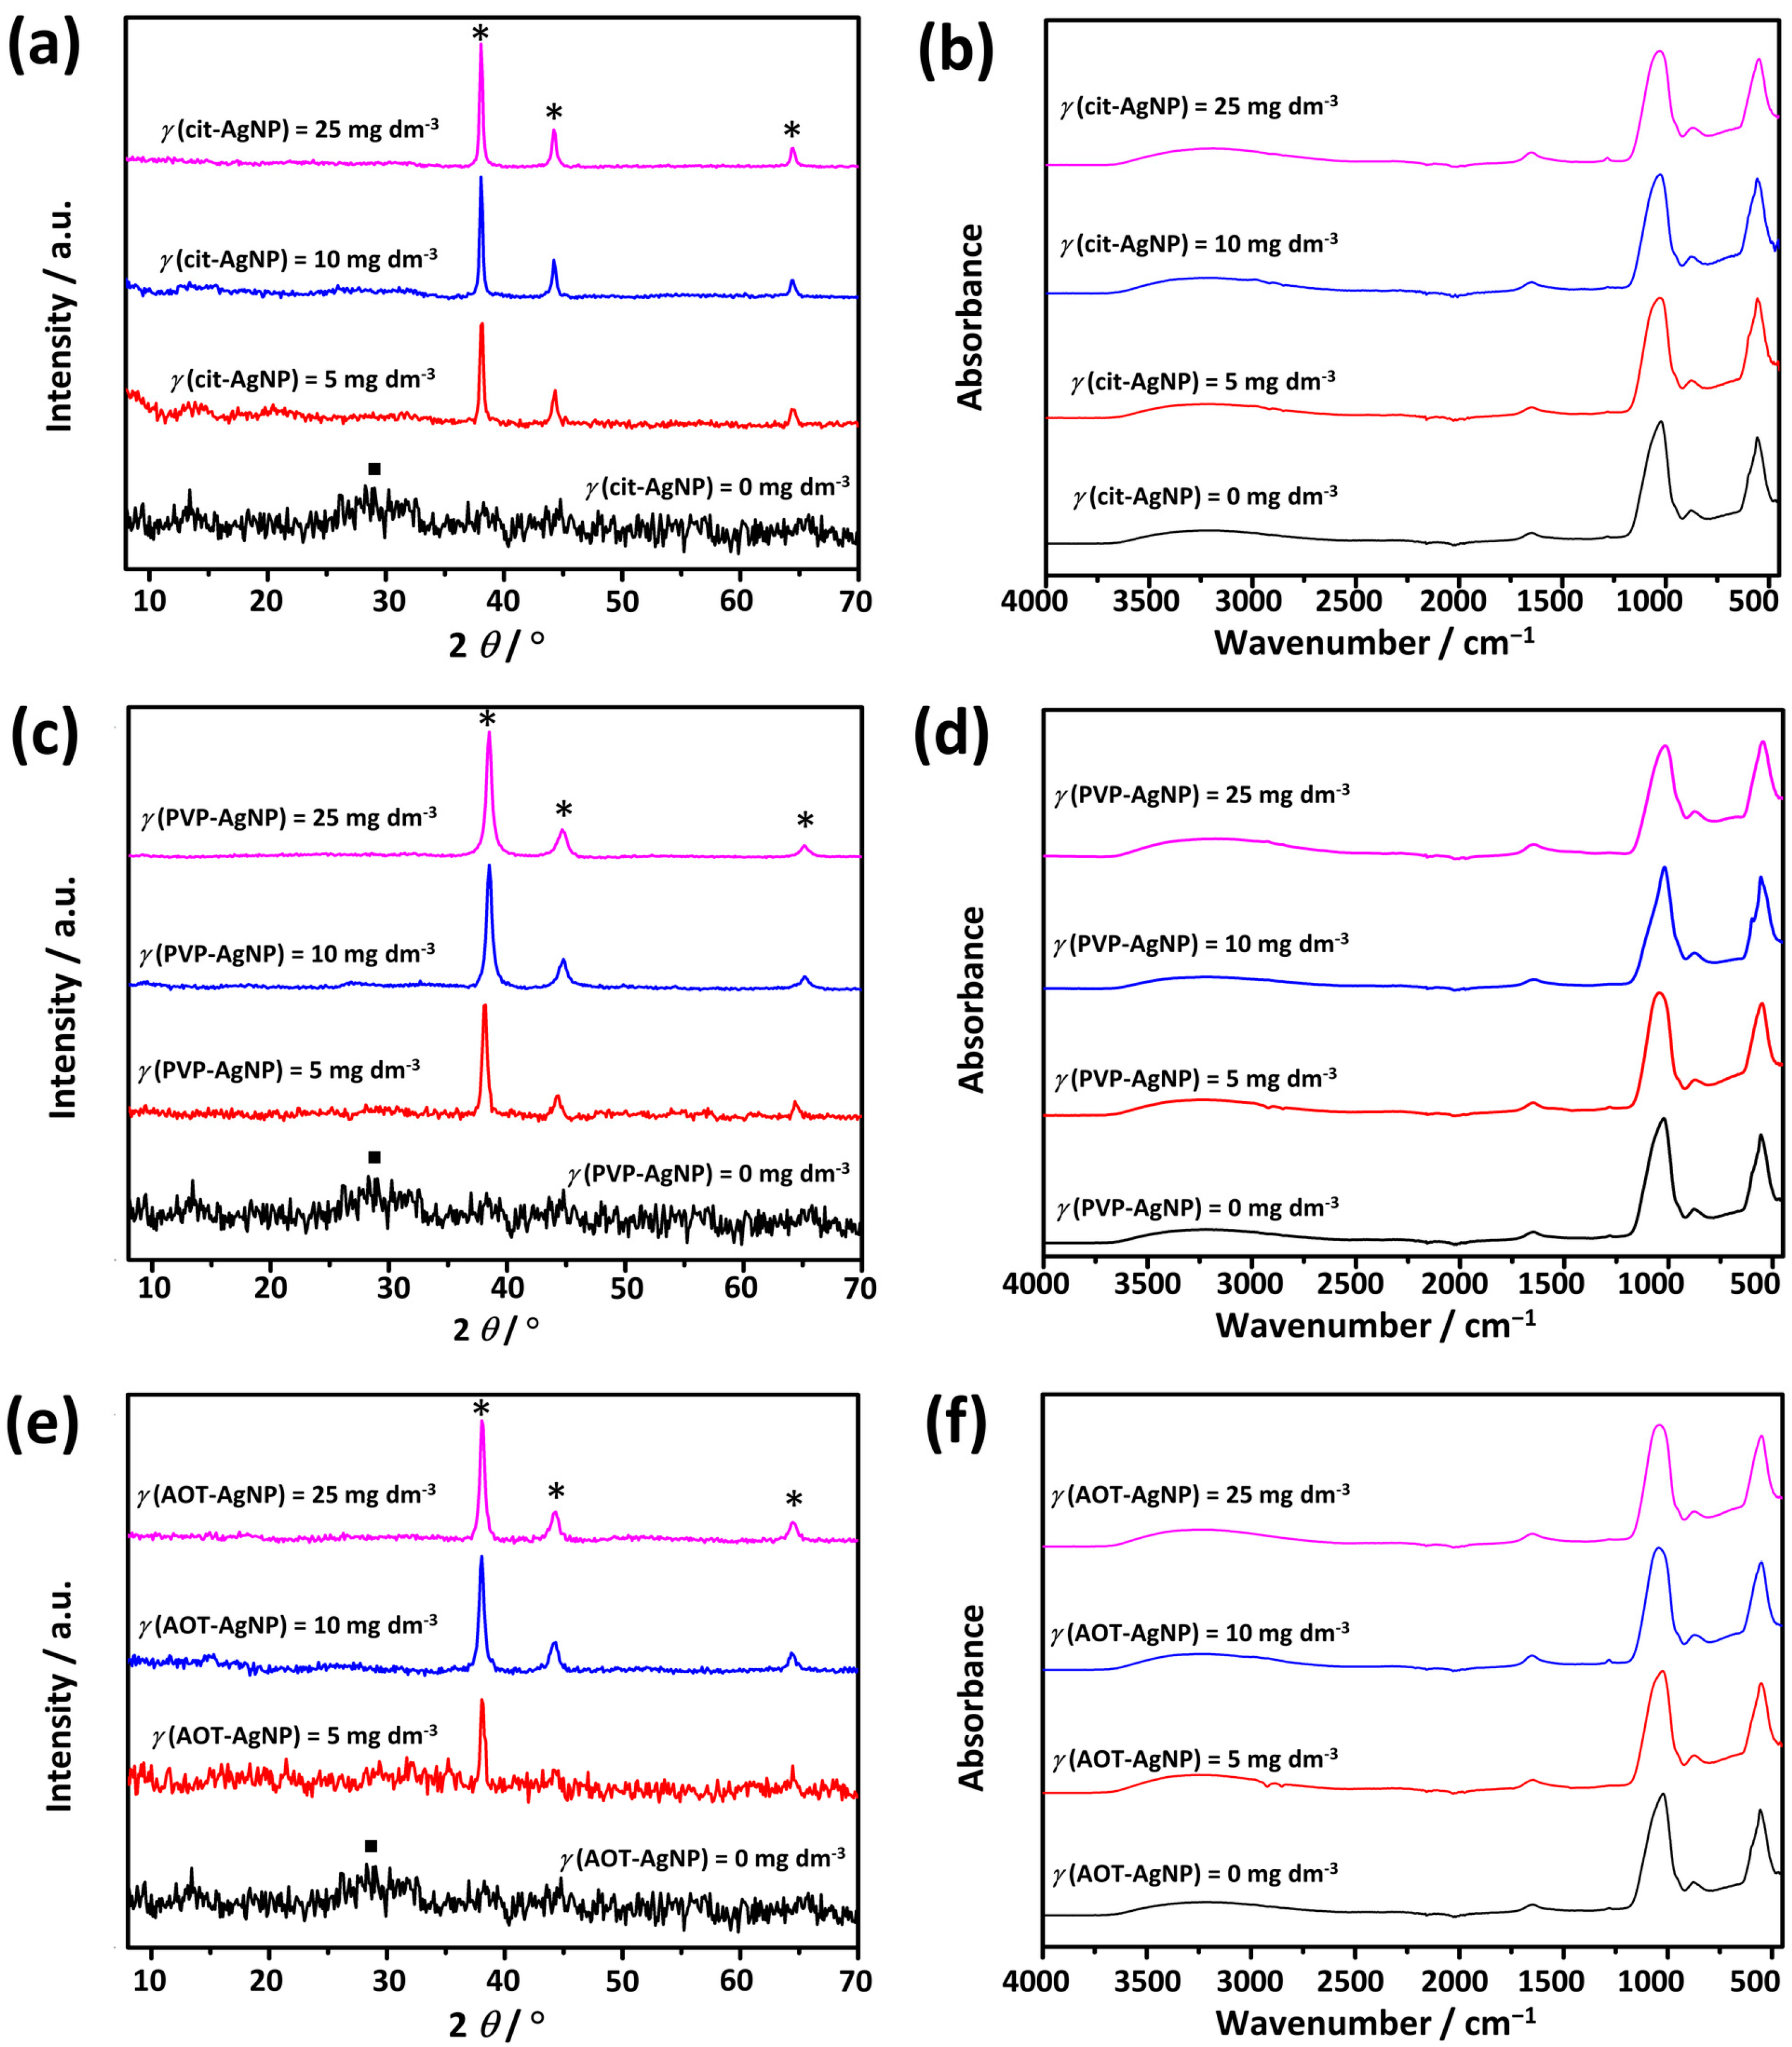
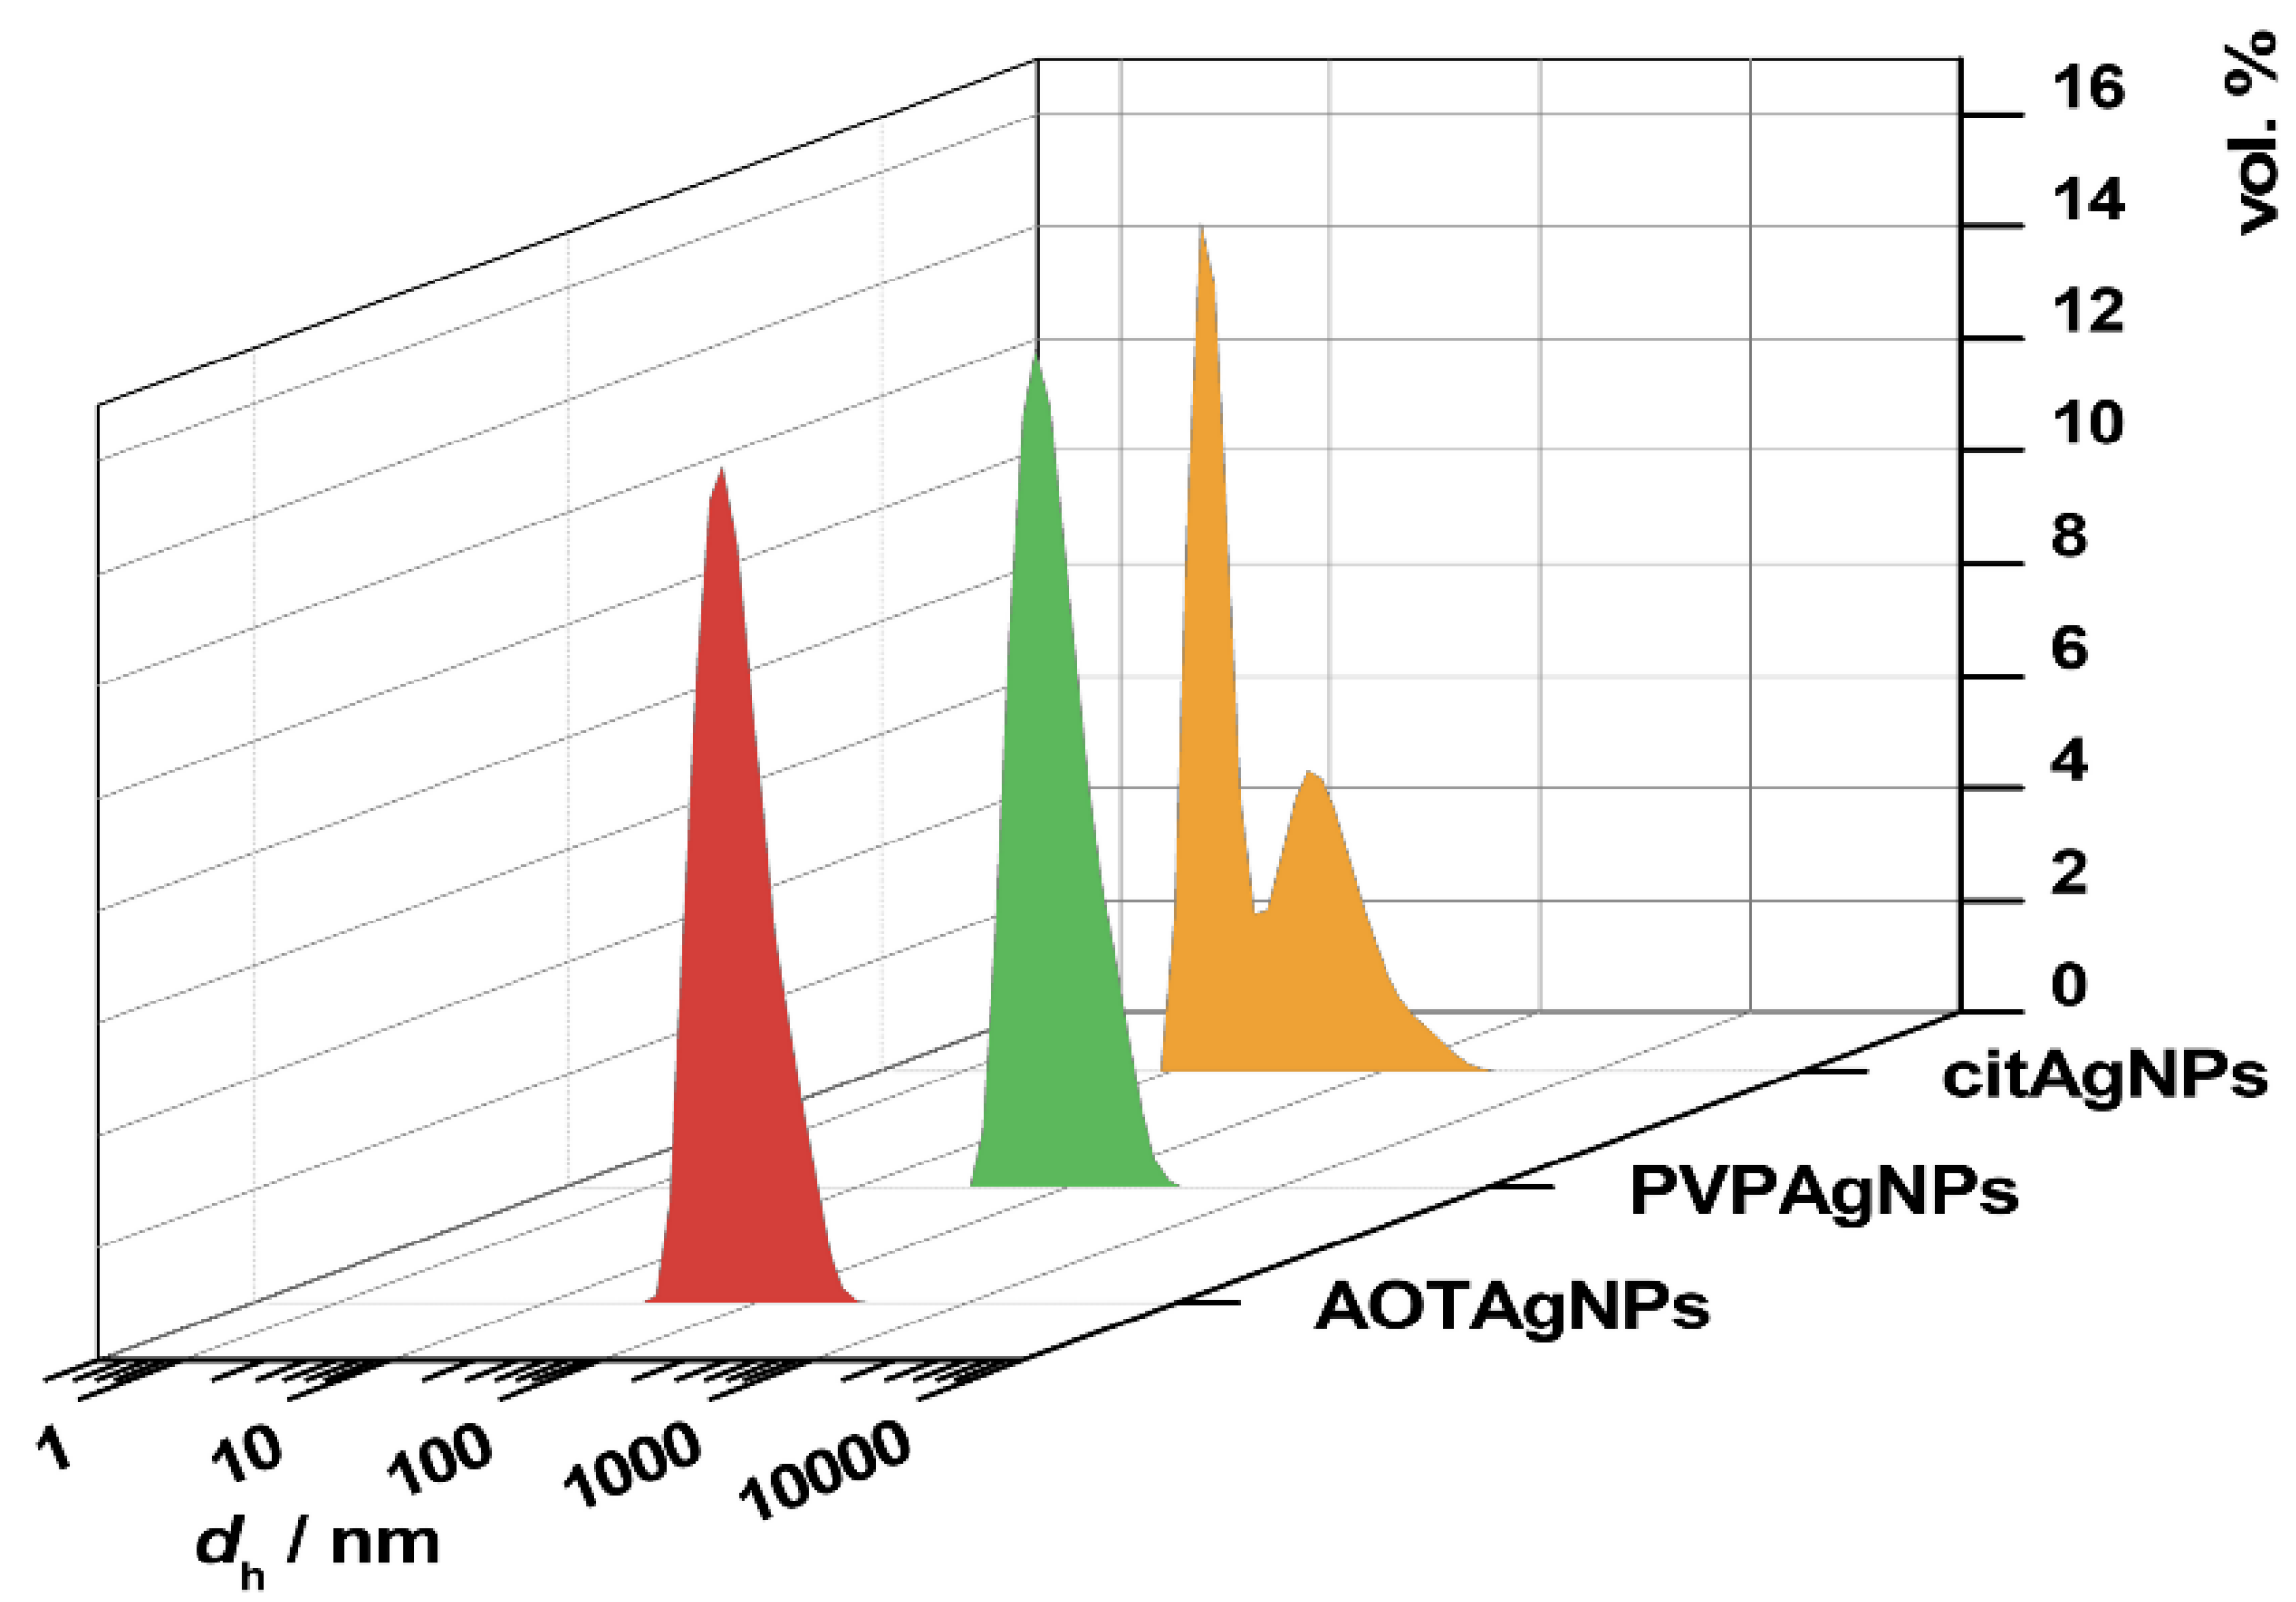
3.1. Characterization of AgNPs

The freshly prepared AgNPs were imaged by TEM (Figure 1) and characterized by UV-Vis spectroscopy (Figure 2), DLS, and ELS measurements (Table 1 and Figure 3).
TEM micrographs revealed the presence of quasi-spherical and triangular cit-AgNPs (Figure 1a). In addition, sporadically, longer rod-like particles were observed, consistent with previous studies [42]. The average size of cit-AgNPs was 75.1 ± 23.2 nm (Figure 1b). PVP-AgNPs formed as polyhedral particles with an average size of 85.2 ± 26.0 nm (Figure 1c,d). A similar morphology was observed for AOT-AgNPs (Figure 1e), but they had a smaller average size, 55.42 ± 15.0 nm, and a narrower distribution than PVP-AgNPs (Figure 1f).
The UV-Vis spectra of the synthesized AgNPs are shown in Figure 2. The presence of the SPR peak at 433, 435, and 450 nm in the spectra of cit-AgNPs, PVP-AgNPs, and AOT-AgNPs, respectively, confirmed the formation of nanoparticles [49]. In addition to the position, the width of the plasmon band also varied depending on the type of particle. However, in all cases the intensity and position of the SPR peak didn’t change during 24 h, indicating good stability of all the AgNPs prepared.
To determine a possible aggregation of the AgNPs in the anionic reactant solution, the size distribution and the zeta potential of the nanoparticles were determined (Figure 3 and Table 1). DLS measurements revealed a bimodal size distribution of the cit-AgNPs. A dominant population of particles with an average dh value of 15.9 nm and a population of larger particles with an average dh value of 64.4 nm was detected. Monomodal particle size distributions with similar average dh values of 89.9 nm and 84.8 nm, were observed in the suspensions of PVP-AgNPs and AOT-AgNPs in an anionic reactant solution, respectively.
The low aggregation of AgNPs in an anionic reactant solution might be due to their relatively large negative zeta-potential ranging from −24.5 mV for PVP-AgNPs to −59.9 mV for AOT-Ag NPs (Table 1).

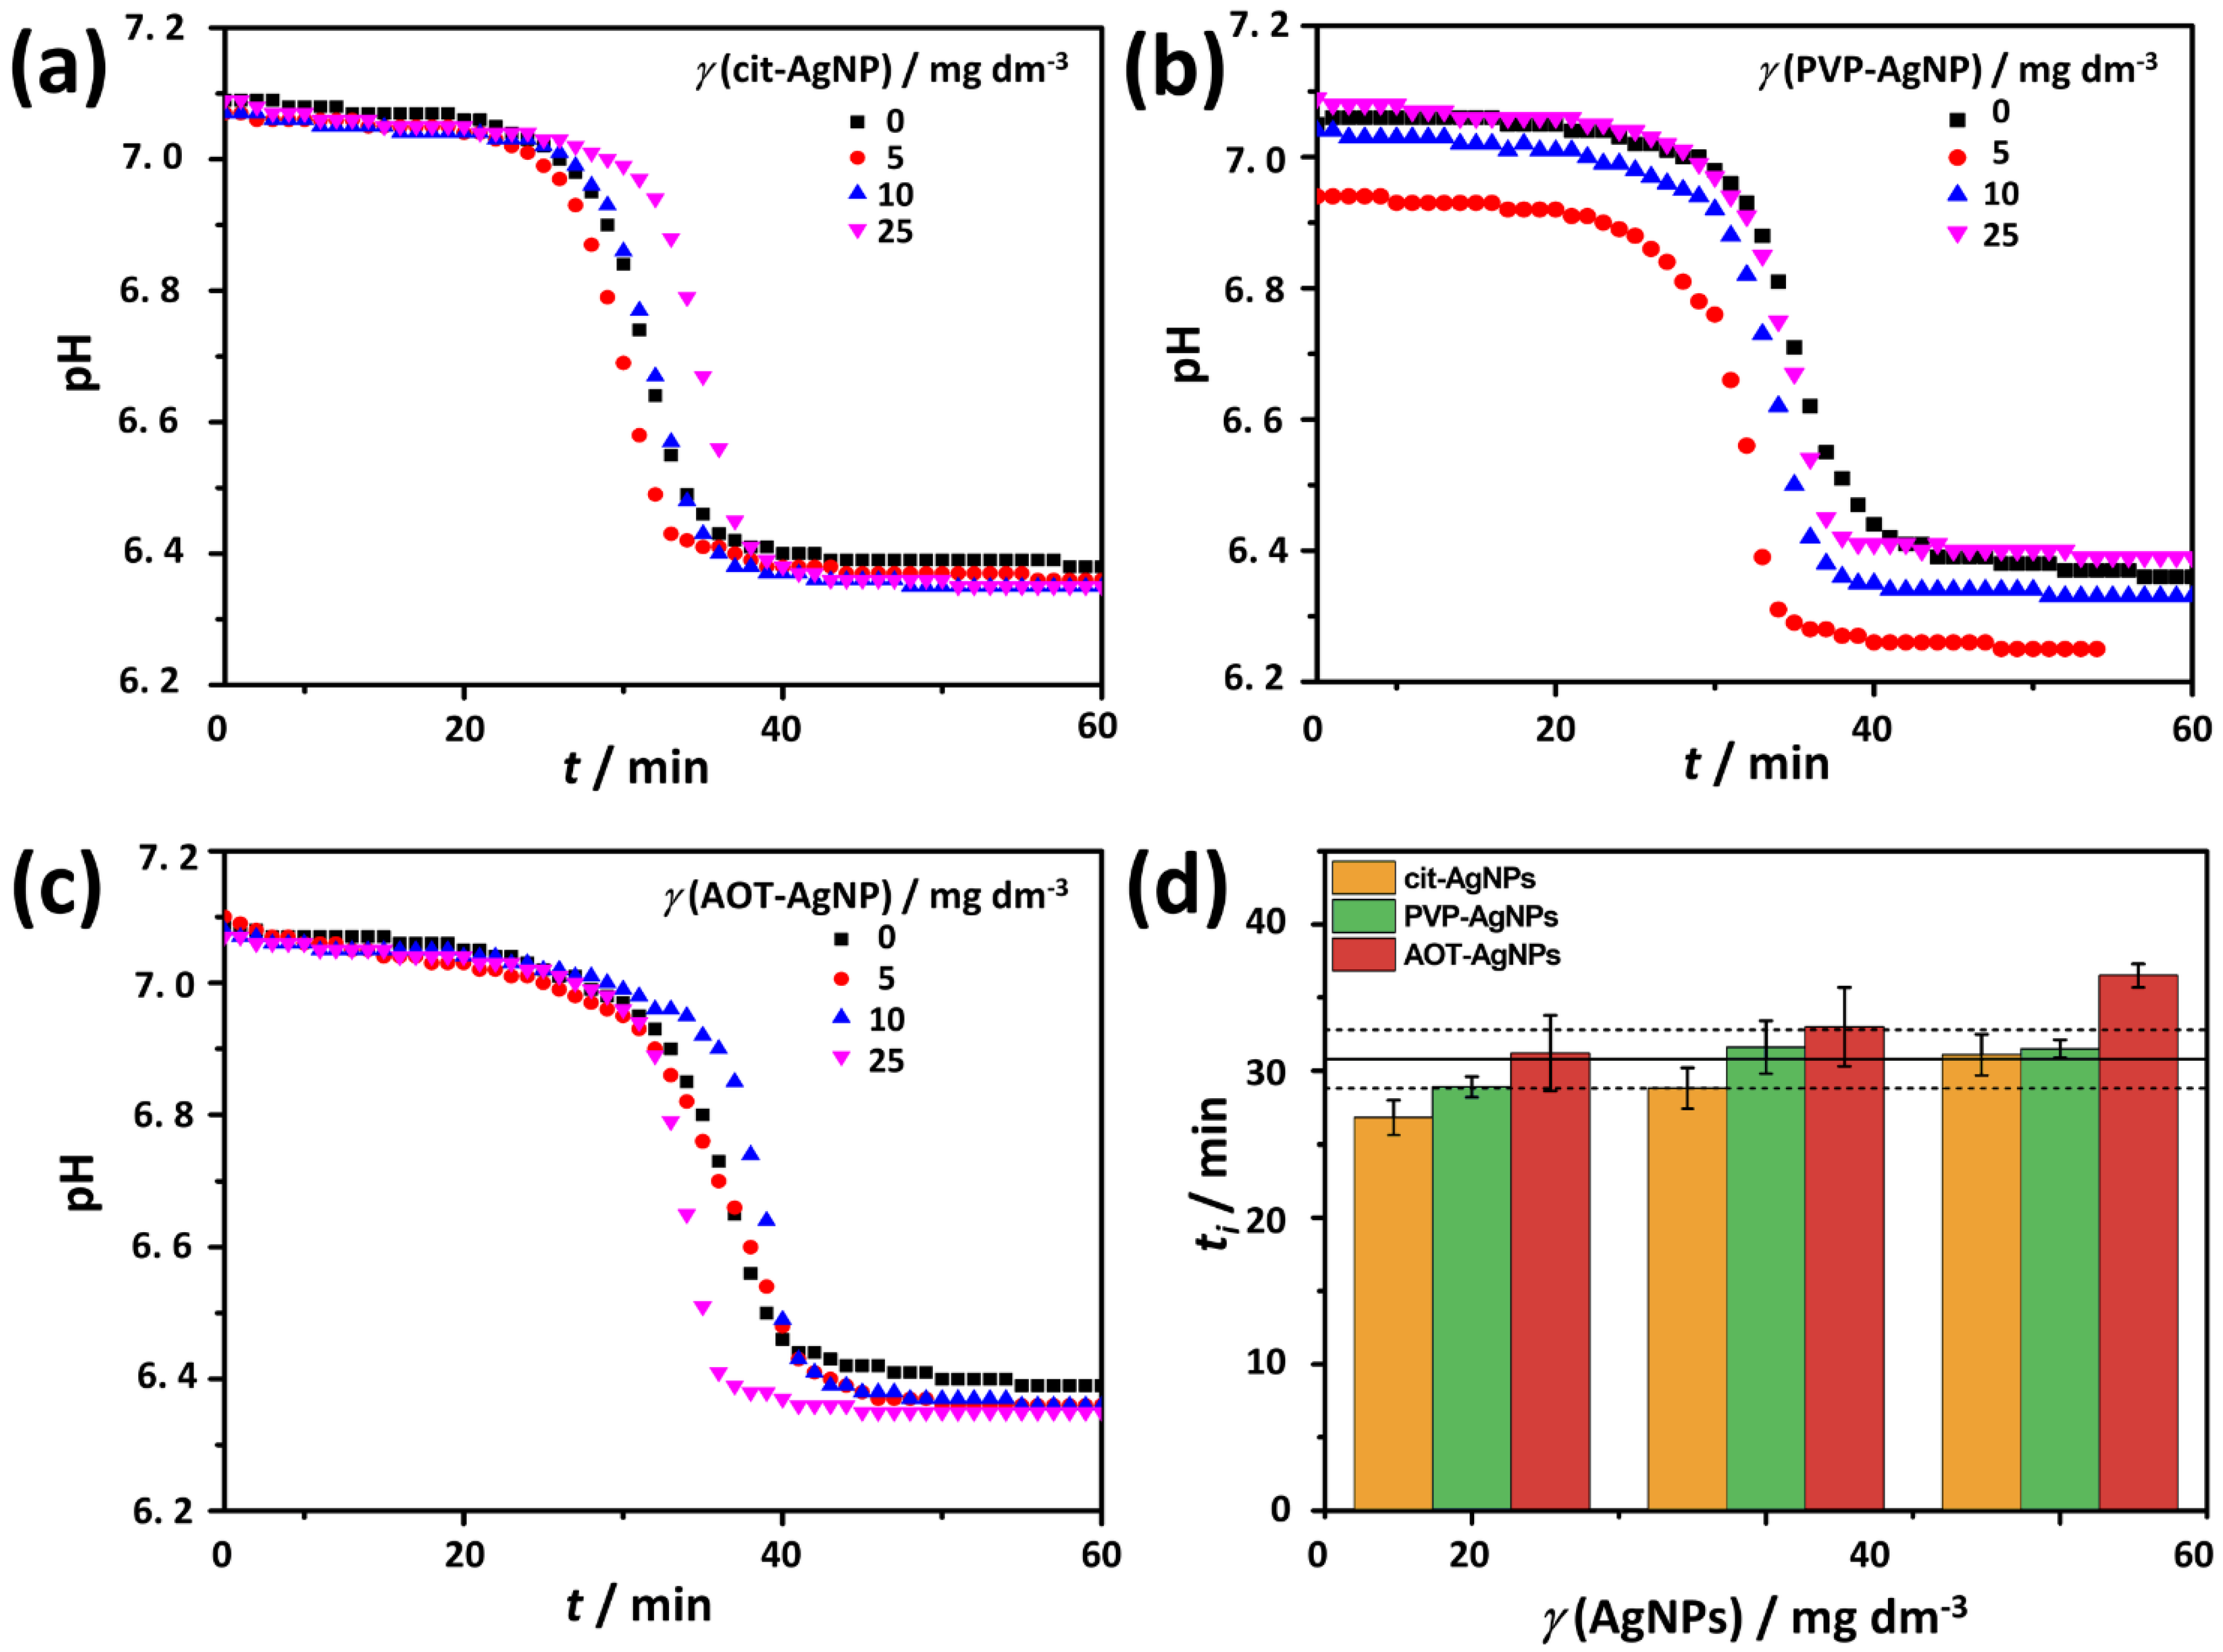
3.2. Influence of Silver Nanoparticles on Precipitation of Calcium Phosphates

To investigate the influence of AgNPs on the precipitation of CaPs, a precipitation system was chosen in which crystalline CaPs are formed via the formation of the amorphous precursor ACP.

3.2.1. Influence of AgNPs on Amorphous Calcium Phosphate

The precipitation of CaPs is accompanied by a change in the pH of the precipitation system [50,51,52]. In the pH range 4.5–9.5, where HPO 4 2 and H 2 PO 4 are the dominant phosphate species, the formation of CaPs can be represented by the equation [53]:
x Ca 2 + + y HPO 4 2 + z H 2 PO 4 + w H 2 O   Ca x ( HPO 4 ) u ( PO 4 ) v ( OH ) t + ( y + 2 z + w u ) H +
The change in pH reflects the different stages of the precipitation process and allows the progress of the precipitation process to be followed, at least semi-quantitatively [50,51,52]. The representative pH vs. time curves obtained in the control system and in systems with different concentrations of the investigated AgNPs are shown in Figure 4a–c. In all precipitation systems studied, sigmoidal curves were obtained, reflecting three different stages of the precipitation process. The first stage, associated with a slight decrease in pH, corresponds to the formation of ACP. According to Du et al. [54], such a pH change indicates that the formation of ACP occurs through a ligand substitution reaction in which water molecules in the Ca2+ coordination sphere are replaced by partially protonated phosphate ions. In the second stage, an abrupt drop in pH is associated with secondary precipitation of the crystalline phase on the already formed ACP. The final stage of the precipitation process, solution-mediated growth, and phase transformation are also associated with a slight change in pH [50,52,55,56,57]. The similar shape of the curves obtained may indicate that the AgNPs did not cause a change in the pathway of calcium phosphate formation. This is consistent with previous studies that have shown that the precipitation pathway of CaP is not influenced by different classes of additives such as small ions [56,58,59], liposomes [60], phosphorylated osteopontin peptides [55], cationic and anionic polyelectrolytes [50], and TiO2 nanomaterials of different dimensionality [61,62]. On the other hand, data on the influence of amino acids are contradictory [58,61], while surfactants have been shown to affect the formation pathway [52].
The stability of the ACP under certain conditions can be assessed from the pH vs. time curves, by determining the induction time for the formation of the crystalline phase (ti) i.e., the time elapsed between the start of the reaction and the start of the secondary precipitation of the crystalline phase, as indicated by an abrupt change in pH in the second stage (Figure 4a–c) [50,52]. The ti is determined from the intersection of the tangents drawn at the first two parts of the pH vs. time curve [50]. The longer it is, the more stable ACP is considered to be [50,59]. In the control system, the average ti was 30.8 ± 2 min (Figure 4d). In all cases, the average ti increased with increasing AgNPs concentration. Compared to the control system, a significantly shorter ti was obtained in the presence of the lowest concentration of cit-AgNPs studied, indicating the promotion of ACP transformation. In contrast, a longer ti was obtained only in the presence of the highest applied concentration of AOT-AgNPs, indicating stabilization of ACP. Interestingly, ti increased at all AgNPs concentrations studied in the order cit-AgNPs < PVP-AgNPs < AOT-AgNPs, indicating a subtle influence of surface coating. A previous study showed that TiO2 nanoparticles (TiNPs) at low concentrations, comparable to the concentrations of AgNPs investigated in this study, also prolonged ACP transformation. However, at higher concentrations, the transformation was accelerated. This was attributed to the dominant formation of ACP on TiNPs at higher concentrations [61]. Interestingly, a previous study on the effect of citrate on ACP transformation showed that citrate has the opposite effect, i.e., it stabilizes ACP [59]. However, it should be noted that in that case the citrate was dissolved, and not bound to the surface as in the case of cit-AgNPs.
To determine the influence of AgNPs on the properties of ACP, the precipitates formed after 10 min of reaction time were analyzed by PXRD, FTIR (Figure 5), and TEM (Figure 6). In the PXRD pattern of the precipitate, formed in the control system after 10 min, a broad amorphous peak of low intensity was observed at 2θ 25.0°–33.5° (Figure 5). Such a peak is characteristic of ACP [27,63,64]. In the PXRD patterns obtained in the presence of different concentrations of AgNPs, the amorphous peak characteristic of ACP was observed only in the presence of the lowest concentration of cit-AgNPs, but not in the PXRD patterns of the precipitates formed in other systems with AgNPs, due to the high intensity of the peaks characteristic of silver observed at 2θ 38.1°, 44.2° and 64.50° corresponding to the (111), (200) and (220) reflections of silver (ICCD File No 04-0783), respectively (Figure 5a,c,e).
The FTIR spectra (Figure 5) confirmed that ACP was formed in all precipitation systems. In the FTIR spectrum of ACP formed in the control system, vibrational bands characteristic of phosphate groups were observed at 1024 cm−1 (ν3 asymmetric stretching mode of PO 4 3 group), 875 cm−1 ( HPO 4 2 group), and 553 cm−1 (ν4 bending mode of PO 4 3 group). Water bands were observed at 3677–2789 cm−1 (broad band), and 1651 cm−1 [63,65]. The absence of a multiplet structure of the phosphate bands at 1024 cm−1 and 553 cm−1 is characteristic of an amorphous phase [45,63,65]. A more detailed analysis of the phosphate band region was performed using first- and second-order derivative spectra (Figure S1). While the position of the bands can be determined more precisely using the first-order derivative, the second-order derivative can be used to distinguish overlapping features [66]. The largest shift in the maximum of the band characteristic of the asymmetric stretching mode of the PO 4 3 group to a higher wavenumber by 25 cm−1 was observed at the two highest concentrations of AOT-AgNPs and the lowest concentration of PVP-AgNPs, indicating somewhat different influences of these two types of nanoparticles (Figure S1). Spectral features observed in the second-order derivative spectra in 1150–1030 cm−1 and 650–575 cm−1 regions indicated the onset of ACP transformation (Figure S1). Similar features were previously observed during ACP transformation to HAP [45].
TEM micrographs (Figure 6) showed that chain-like aggregates of spherical particles typical of ACP [50,64] formed in the control system. The average size of the individual ACP particles was 75.6 ± 19.2 nm. In the presence of AgNPs, two types of ACP morphologies were observed, depending on the type of AgNPs and their concentration. In the case of cit-AgNPs, a dense gel-like phase was formed at all concentrations. Such a morphology was also observed previously for ACP formed in different conditions [52,58,67,68]. It is worth noting, that in the presence of dissolved citrate, chain-like aggregates of ACP particles with rougher surfaces compared to the control were obtained [59]. The different effects on morphology could be a consequence of different citrate concentrations, as well as of the different states of the citrate, i.e., dissolved or bound to the AgNPs. With increasing cit-AgNPs concentration, the granular structure of the dense phase decreased. In the presence of PVP-AgNPs, chain-like aggregates of irregular spherical particles were observed at all concentrations, while the gel-like phase was observed only at the highest concentration studied. In contrast, in the presence of AOT-AgNPs, the chain-like aggregates of spherical particles were observed only at the lowest concentration studied, whereas the gel-like phase was observed at all investigated concentrations (Figure 7). The spherical ACP particles formed in the presence of PVP-AgNPs (67.6 ± 16.2 nm) and AOT-AgNPs (76.7 ± 21.4 nm and 66.1 ± 17.2 nm, at 10 and 25 mg dm−3, respectively) were similar in size to those in the control system. In both cases, the onset of their transformation to the gel phase was visible. The obtained result indicated a possible method of controlling ACP morphology by the selection of an AgNPs stabilizing agent.
Interestingly, in all cases, the NPs were distributed throughout the ACP, and single particles embedded in ACP were mostly observed. This indicates the potential of obtaining the material in which the NPs are dispersed throughout the material, the lack of which was cited as one of the major drawbacks for existing CaP/AgNPs composites [69]. To the best of our knowledge, Keskar et al. [27] were the only ones to study ACP-AgNPs composites. They obtained spherical ACP particles with smaller AgNPs incorporated into the particles and/or their surface by spray pyrolysis.

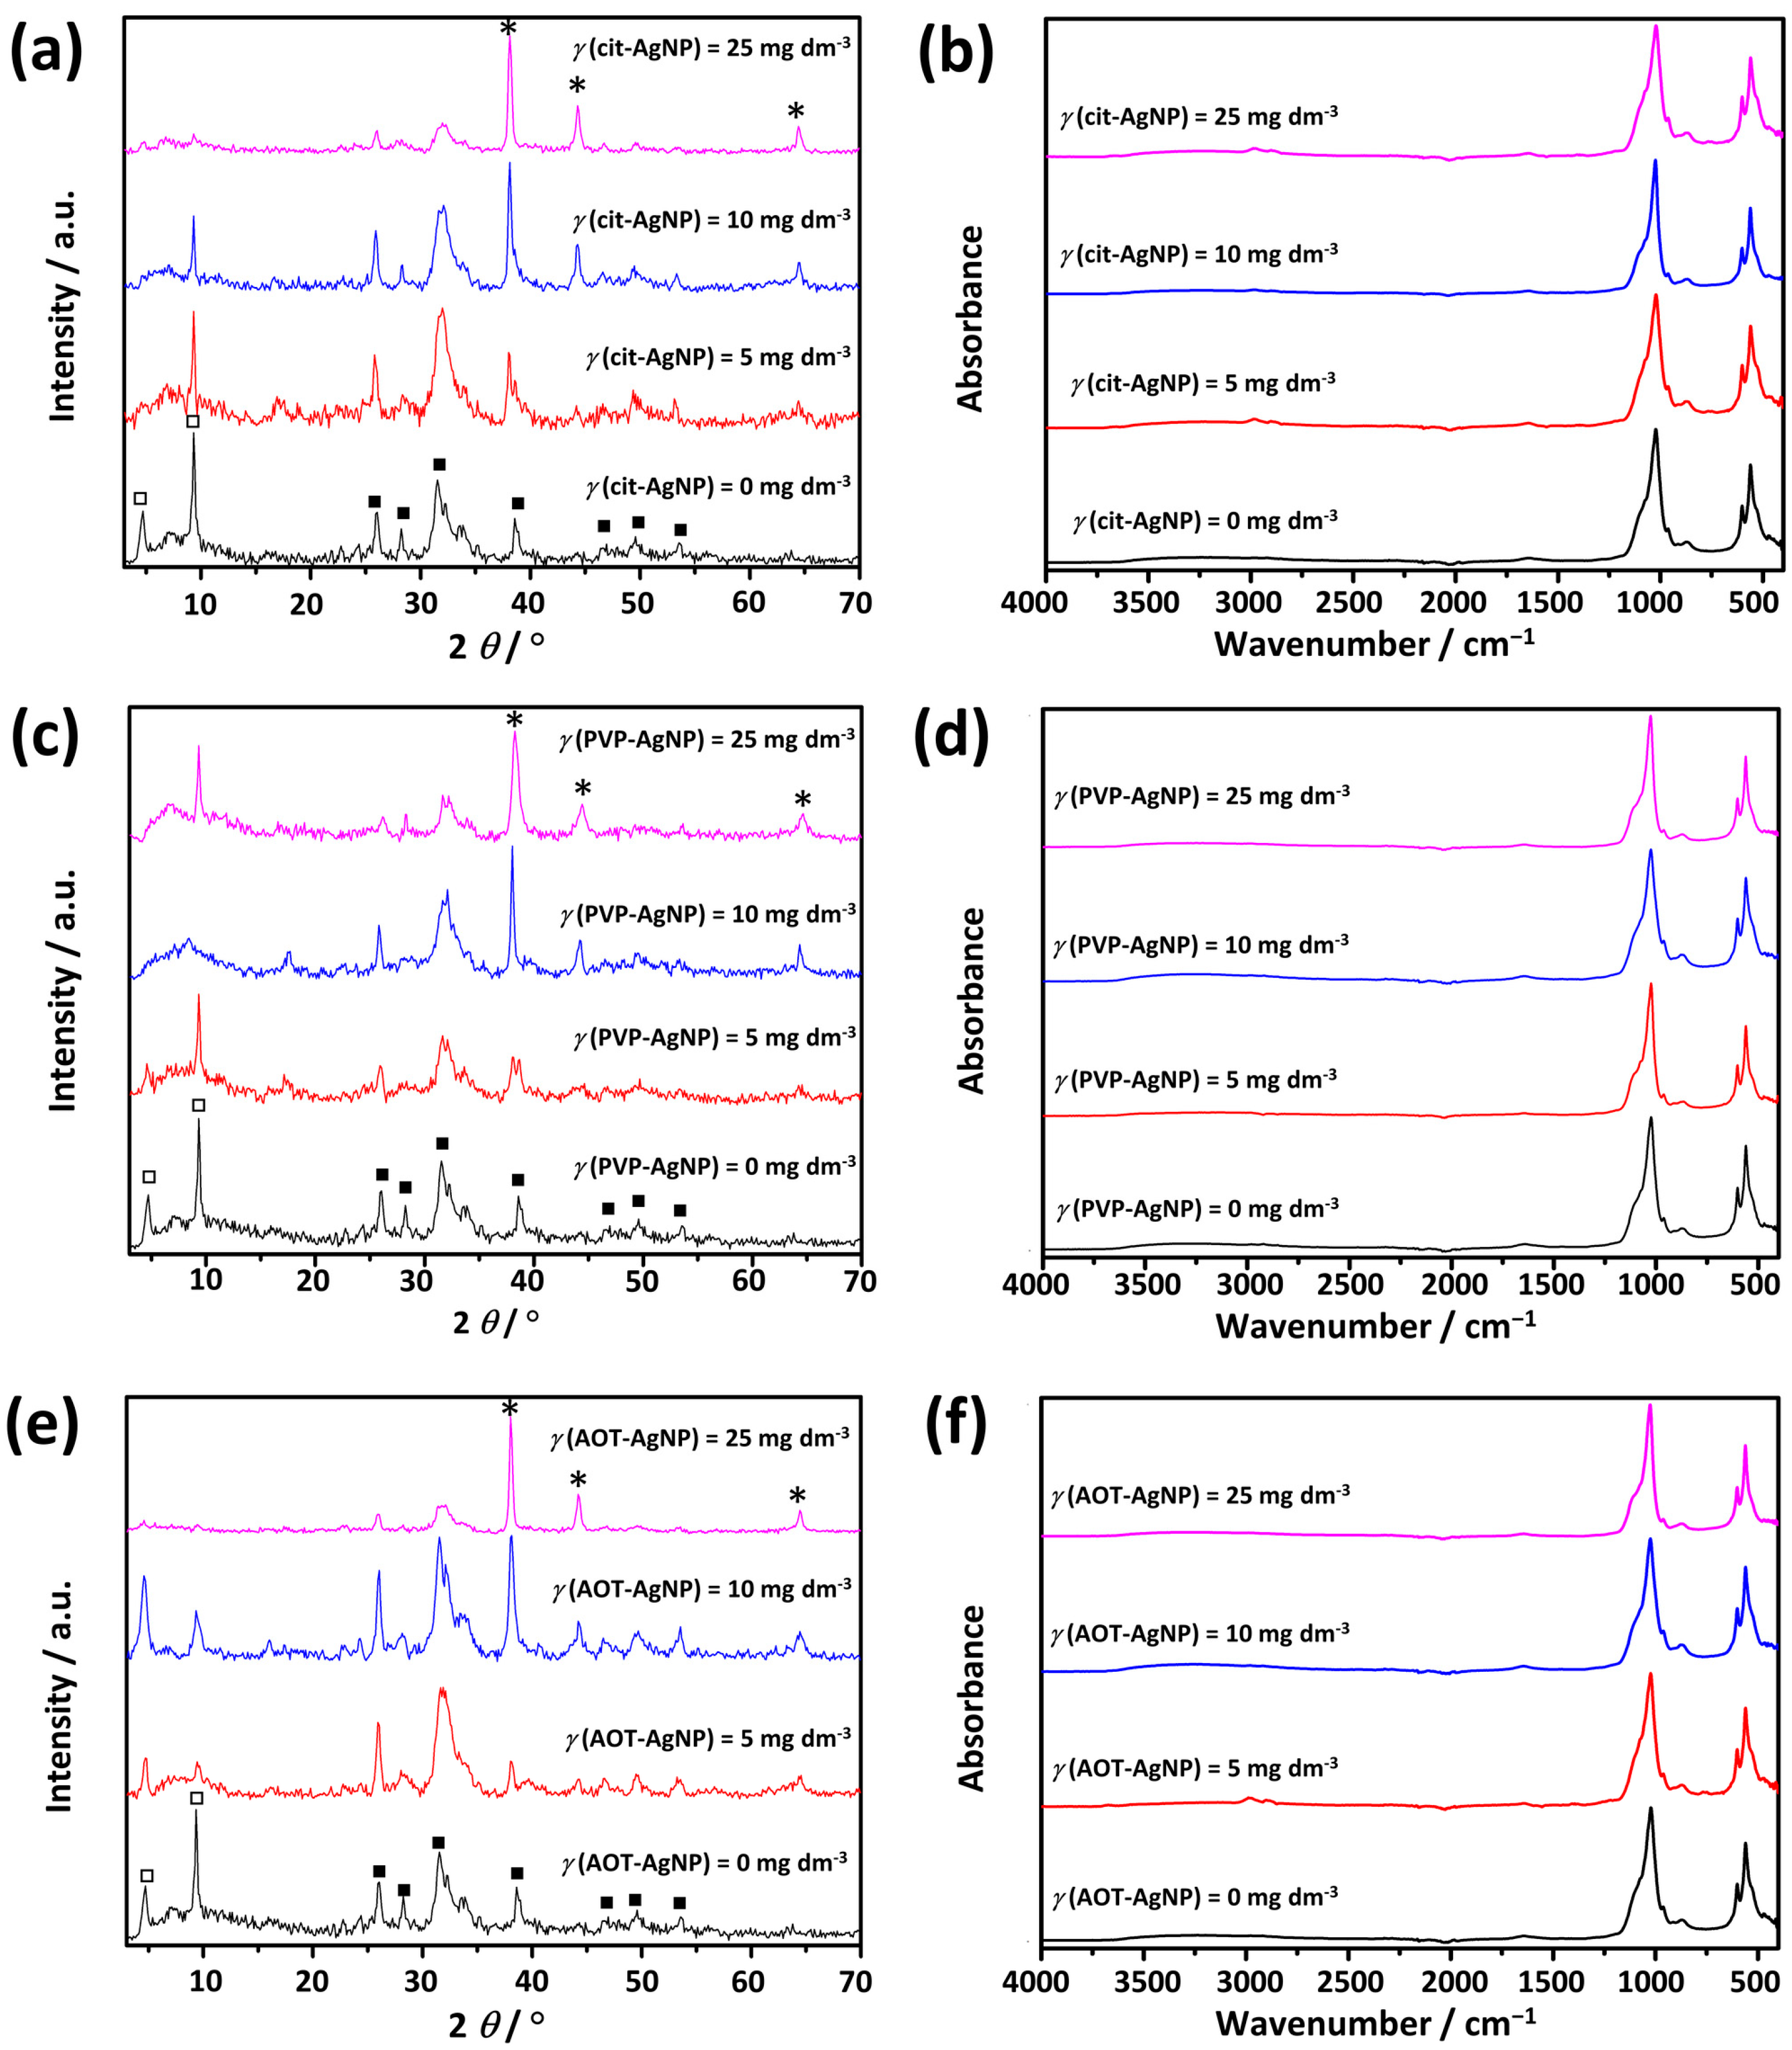
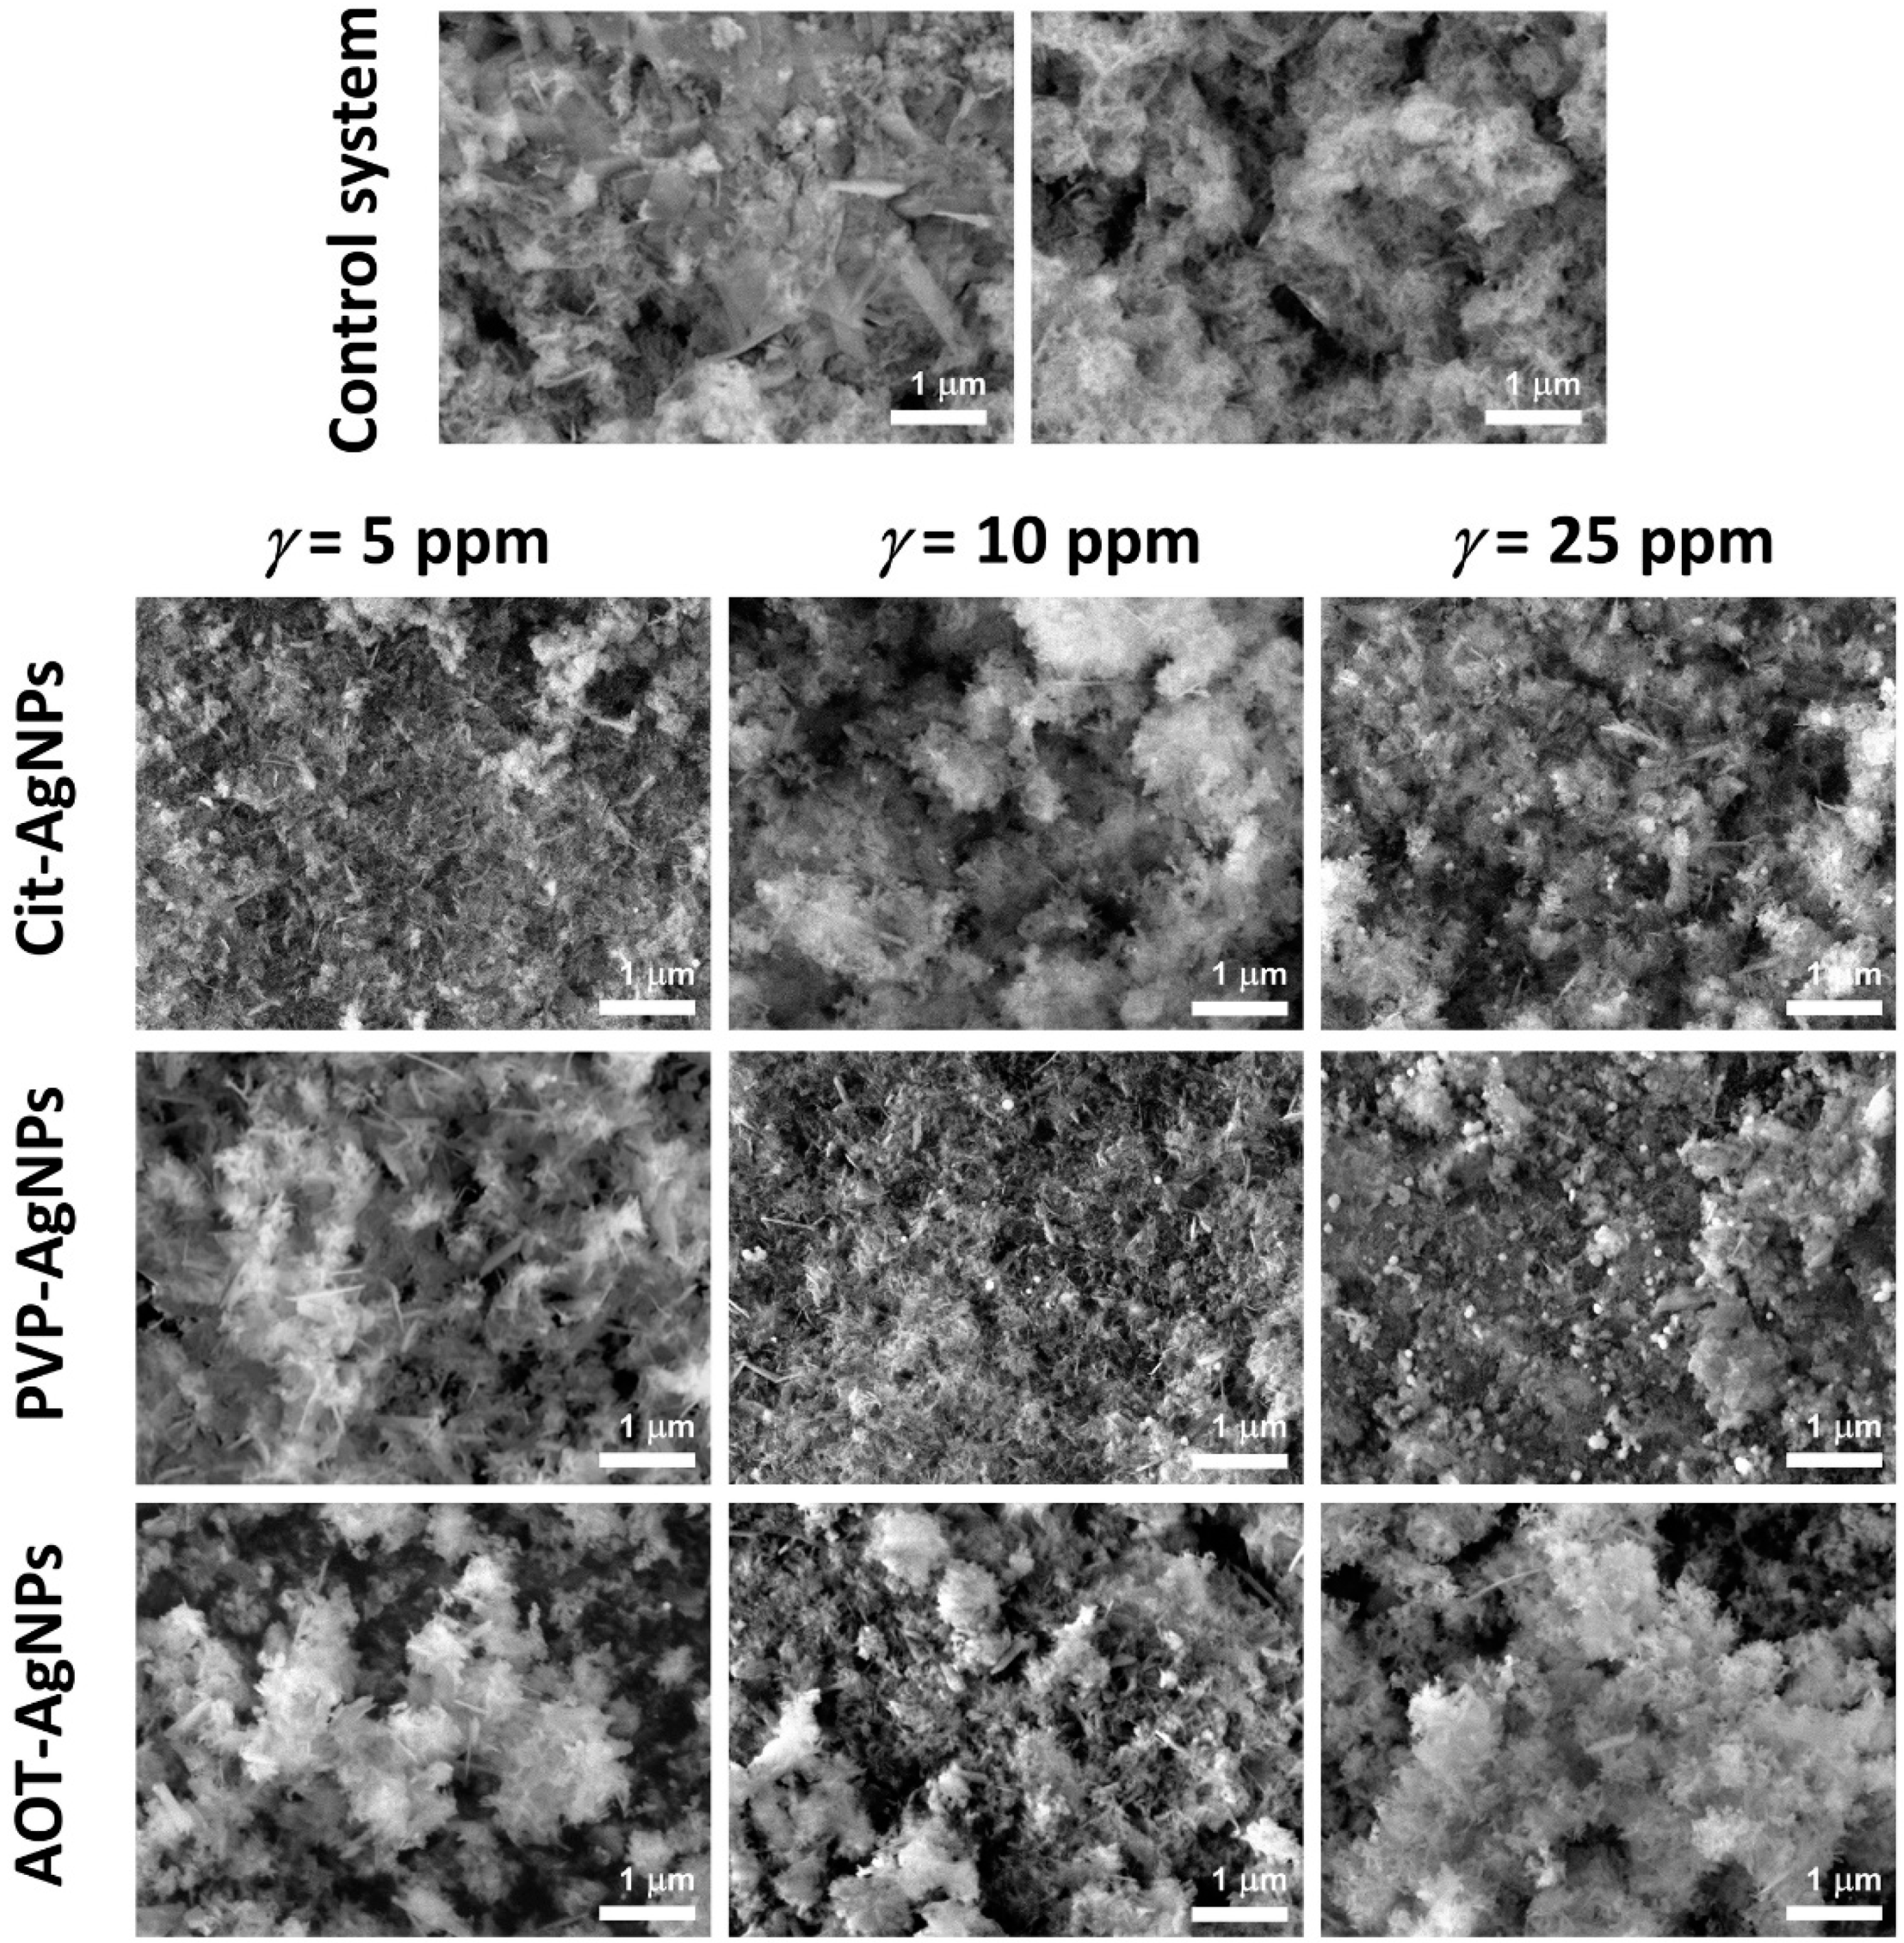
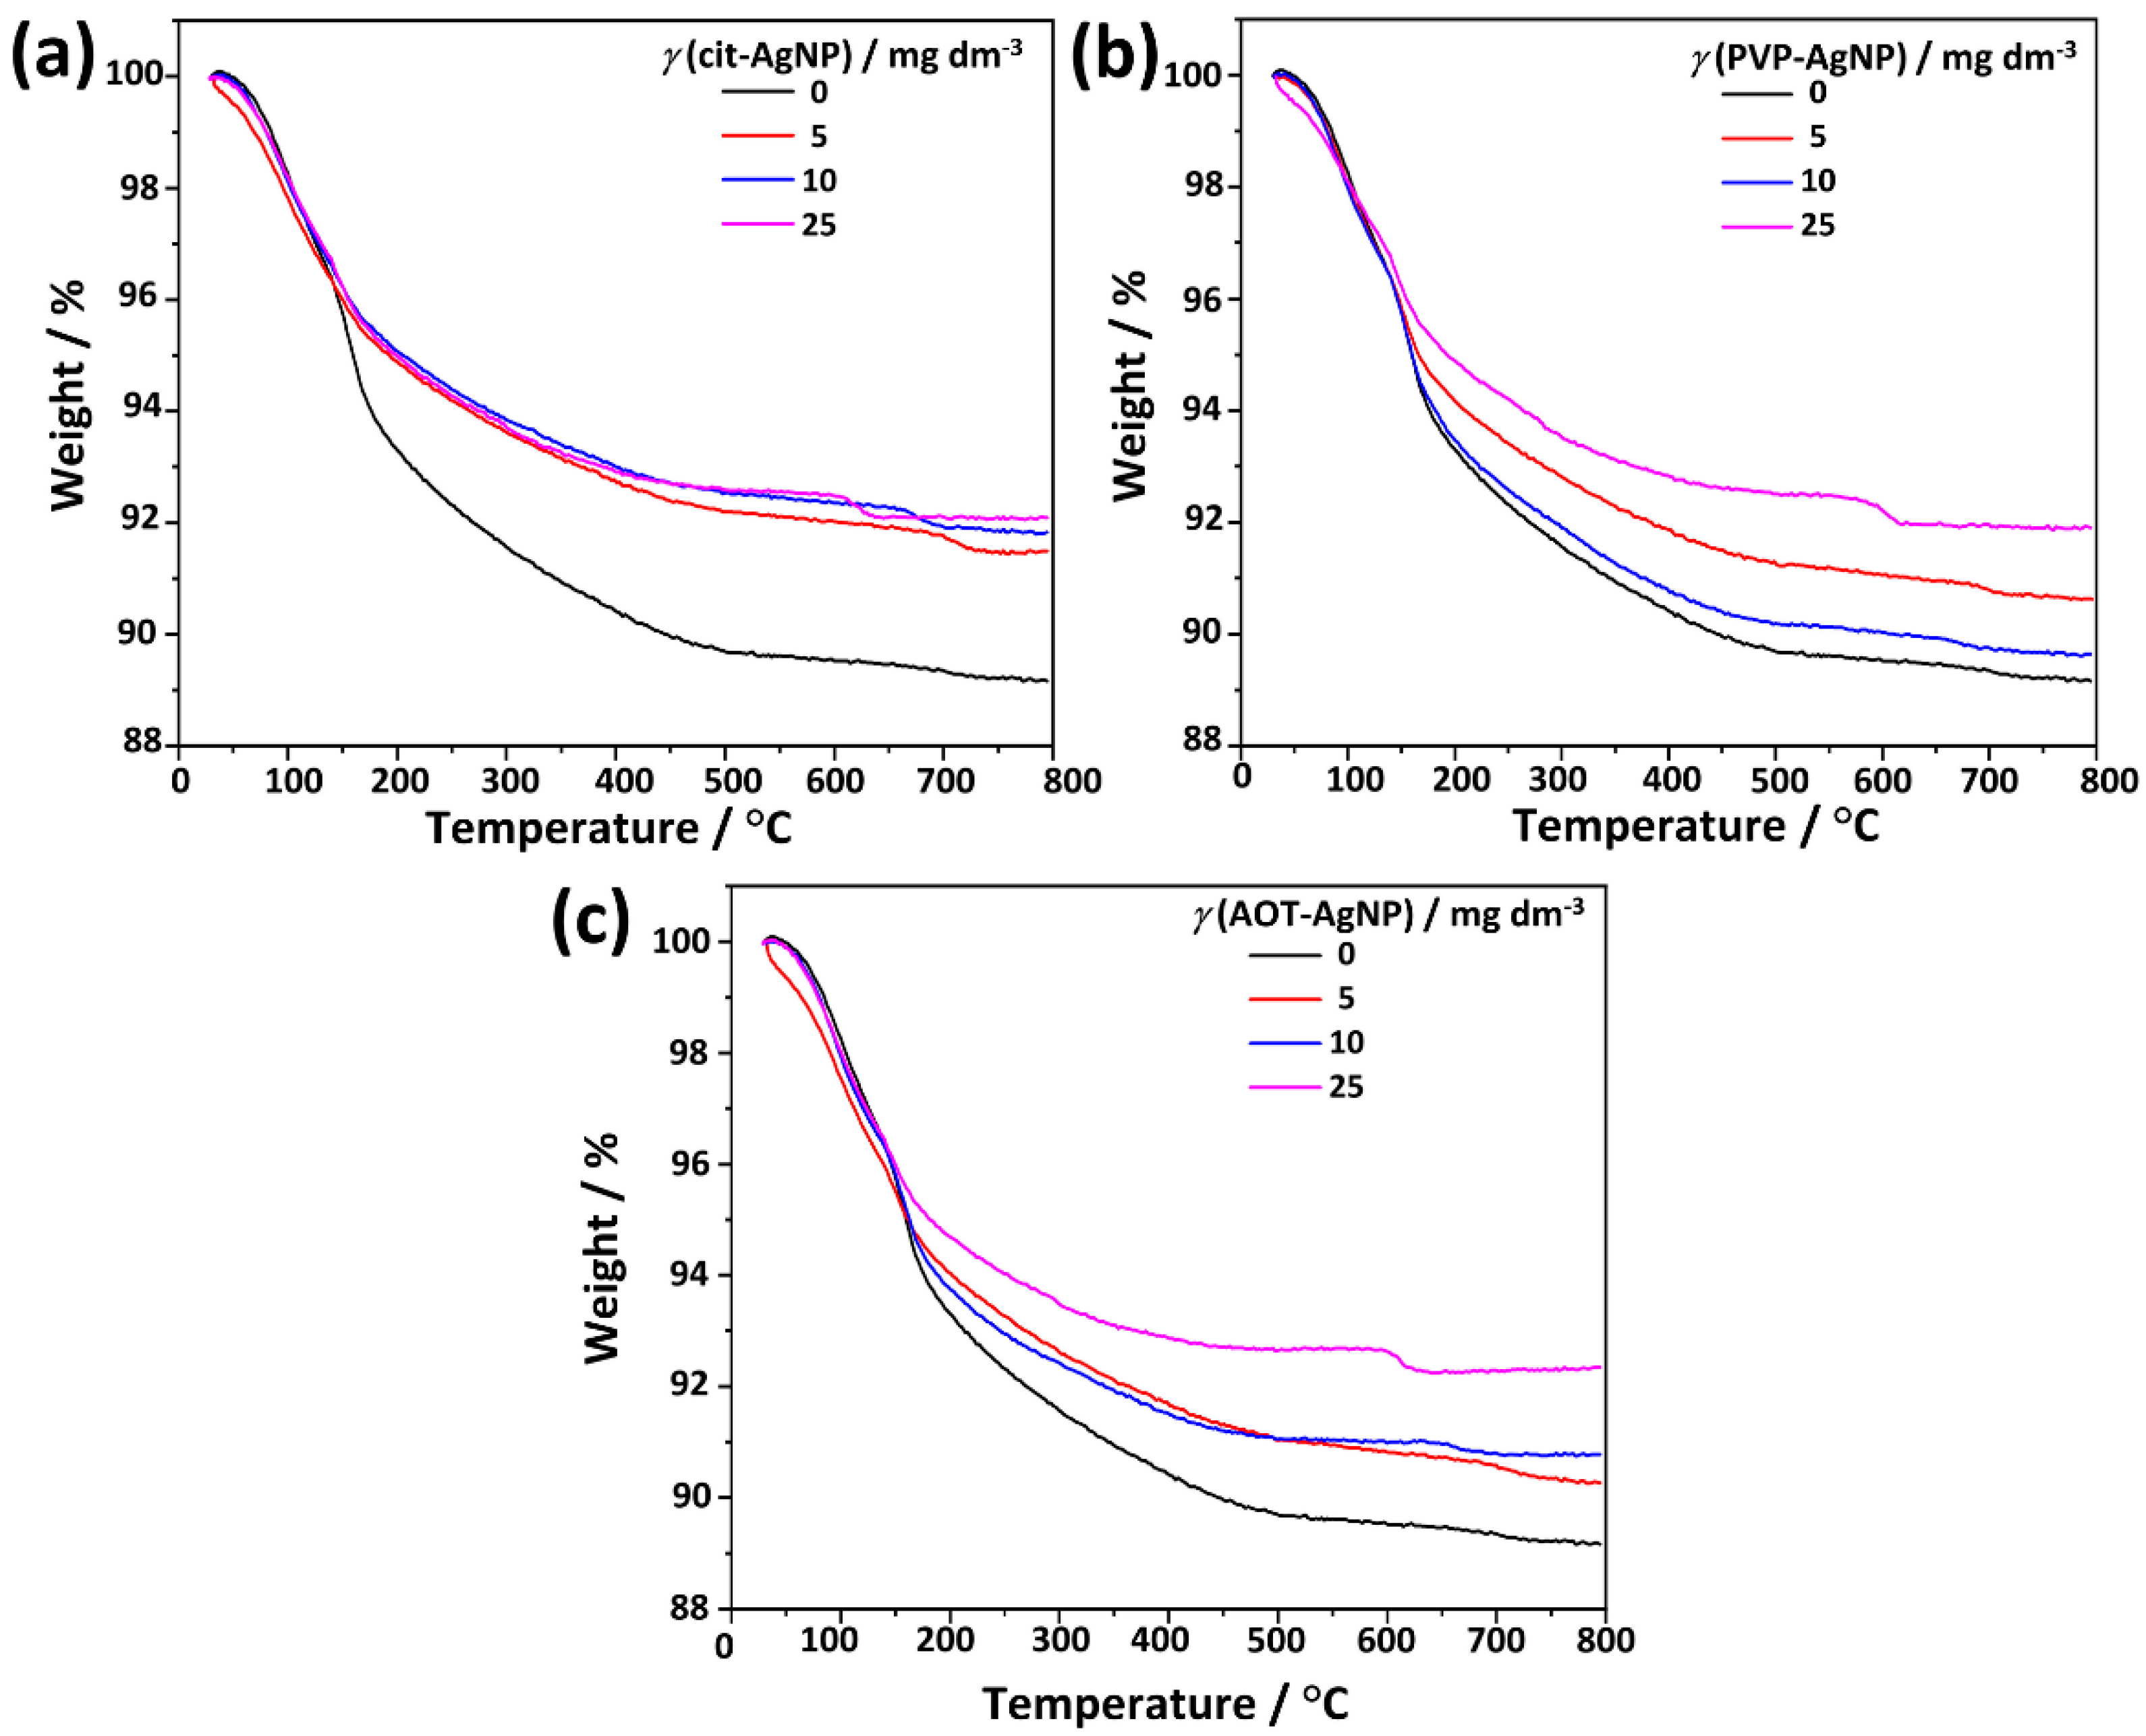
3.2.2. Influence of AgNPs on the Properties of Crystalline Phase

According to the supersaturation calculation, the control precipitation system was supersaturated to different CaPs phases (ACP, β-TCP, OCP, DCPD, HAP). PXRD and FTIR analyses were performed to determine the composition of the precipitates formed (Figure 7). The PXRD pattern of the control system (Figure 7a) contained two low angle peaks at 2θ 4.7° and 9.3° corresponding to (100) and (200) reflections of OCP (JCPDS card 26-1056). In addition, prominent apatitic peaks at 2θ 26.0° and 31.8°, as well as lower intensity peaks at 2θ 28.1°, 39.3°, 46.4°, 49.6° and 53.3° were observed. The shape and width of apatitic peaks indicated the possibility of the formation of poorly crystalline CaDHA [63,70]. It should be noted, that compared to our previous studies on the effect of TiNMs CaP precipitation, [61,62] in which the same reactant concentrations were used, the reaction volume was increased tenfold, resulting in the difference in precipitate composition.
Characteristic phosphate and water vibration bands were observed in the FTIR spectra of the control system (Figure 7b). Phosphate bands were observed at 1303 cm−1 ( HPO 4 2 bending), 1091 cm−1 (ν3a triply degenerated asymmetric stretching mode of PO 4 3 ) , 1020 cm−1 (ν3c triply degenerated asymmetric stretching mode of PO 4 3 ), 964 cm−1 (ν1 nondegenerated symmetric stretching mode of PO 4 3 ), 912 cm−1 and 869 cm−1( HPO 4 2 stretching), 597 cm−1 (ν4a triply degenerated bending mode of PO 4 3 ), and 560 cm−1 (ν4b triply degenerated bending mode of PO 4 3 . The water bands were observed at 3627–2884 cm−1 (broad band) and 1637 cm−1 [71,72,73]. Although there is a great similarity between the FTIR spectra of apatites and OCP exists, it is considered that the bands at around 1195 cm−1 and 916 cm−1 correspond to the vibrations of HPO 4 2 groups in the OCP lattice, can be used to distinguish between CaDHA and OCP in the FTIR spectra [73]. In the spectrum of the control system, the band at 912 cm−1 was detected, but not the band at around 1195 cm−1, indicating that the amount of OCP was smaller than that of CaDHA. Also, the hyperfine structure of the phosphate bands in the 1200–1000 cm−1 region, which is characteristic of OCP, refs. [73,74] was not observed, confirming that OCP is present in a small amount.
The PXRD patterns of the precipitates prepared in the presence of AgNPs (Figure 7a,c,e) in addition to CaPs peaks, contained Ag peaks at around 2θ 38.0°, 44.3°, and 64.4°. It was found that the relative intensity of OCP peaks at around 2θ 4.7° and 9.5° varied depending on the type of AgNPs and their concentration. Both these peaks were not observed at the highest applied AOT-AgNPs concentration and 10 mg dm−3 concentration of PVP-AgNPs. This indicates possible variations in the amount of precipitated OCP, i.e., possible inhibition of OCP formation. Studies on the formation of calcium phosphates in the presence of various additives have shown that additives can affect the composition of the precipitates formed in two ways. In precipitation systems where several phases can form, the additive can effectively adsorb to the nuclei of a particular phase, inhibiting its formation. Another possibility is that the additive acts as an efficient heteronucleus for one of the forming phases, promoting its formation and indirectly inhibiting the formation of other phases [4,75].
Analysis of the first-order derivative FTIR spectra in the 1200–450 cm−1 phosphate band region (Figure S2) revealed no significant changes in the position of the bands. However, the second-order derivative spectra showed the shape change in the region 1005–975 cm−1 at the highest investigated concentrations of PVP-AgNPs and AOT-AgNPs, as well as at 10 mg dm−3 of cit-AgNPs.
SEM analysis of the precipitates formed in the control system and in the presence of different concentrations of AgNPs confirmed that a mixture of different CaPs phases was formed (Figure 8). Two different morphologies were observed in all systems. Spherical aggregates of thin, irregular, leaf-like crystals are characteristic of CaDHA, [76] while single plate-like crystals are characteristic of OCP [50,77]. In addition, individual AgNPs can be observed both embedded in the CaDHA crystal aggregates and adsorbed on their surface. It is difficult to comment on the changes in OCP crystal morphology, because most crystals in the precipitates formed in the presence of AgNPs are oriented with their largest face perpendicular to the substrate. However, compared to the control system, they appear smaller in size and less developed. With increasing AgNPs concentrations, the morphological changes of OCP became more evident. The changes in the morphology of CaDHA depended on the type of AgNPs. In the presence of lower concentrations of cit-AgNPs, the spherical aggregates were denser and more fused together. With increasing concentration, more distinct spherical aggregates were observed, which were smaller at the highest concentration studied than in the control system. The morphology of the precipitate obtained at the lowest concentration of PVP-AgNPs was similar to that of the control system. With increasing concentrations of PVP-AgNPs, smaller crystals, and fused spherical aggregates were observed. In the presence of AOT-AgNPs, the spherical aggregates were the dominant CaDHA morphology at all concentrations.
To determine if the incorporation of differently stabilized AgNPs influences the thermal behavior of formed precipitates TGA analysis was performed. From the TGA curve of the control system (Figure 9) can be concluded that the thermal decomposition of the precipitate, formed in the control system after 60 min, proceeds in four steps. In the first step, at temperatures between 50 °C and 140 °C, a weight loss of about 4.5% was observed. Two weight losses at higher temperatures of about 3% and 4.6% were observed in the temperature range of 140–170 °C and 170–500 °C, respectively. Weight loss of 0.3% was observed at temperatures above 700 °C. Previous studies have shown that the thermal decomposition of CaDHA proceeds in three steps. In the first step, at temperatures up to 130 °C, the weight loss is due to the loss of adsorbed water. At higher temperatures, two steps are observed that can be attributed to the decomposition of CaDHA [62,78,79,80]. On the other hand, a weight loss of adsorbed water can be observed in the TGA curve of OCP at temperatures around 125 °C [81]. The loss of crystallization water can be observed up to 300–350 °C, while the loss of chemically bound water occurs at temperatures up to 400 °C. At temperatures above 400 °C, a small continuous weight loss, corresponding to further water loss and decomposition, can be observed [82,83].
Previous studies have shown that the thermal decomposition of AgNPs usually proceeds in a dominant weight loss, attributed by the authors to the loss of water and organic components, at temperatures between 200–500 °C. The exact temperature range in which the dominant weight loss occurs depends on the type of AgNPs. Little or no loss was observed at temperatures above or below this range [84,85]. The TGA curves of the stabilizing agents used in the preparation of AgNPs are shown in Figure S3. The shape of TGA curves of the precipitates formed in the presence of differently stabilized AgNPs are similar to the one of the control system, i.e., weight losses characteristic for AgNPs and stabilizing agents cannot be discerned. However, several interesting features can be observed in the TGA curves of precipitates formed in the presence of differently stabilized AgNPs. Increasing the concentration of cit-AgNPS and AOT-AgNPs in the precipitation system resulted in a decreasing total weight loss. No such trend was observed in the presence of PVP-AgNPs (Figure 9). However, even in that case, the weight loss was smaller than in the control system. This confirmed the presence of AgNPs in the obtained precipitates. Moreover, weight loss was observed at temperatures above 600 °C, which was not present in the precipitate formed in the control system (Figure 9). The temperature at which the loss started decreased with increasing AgNPs concentration. Such weight loss was previously observed for crystalline apatitic CaP at 630 °C [86]. The observed differences in the thermal properties of precipitate formed in the control system and the presence of AgNPs are consistent with the observation that AgNPs present on the surface of β-TCP particles affect thermal stability [87].
In an attempt to determine more precisely the influence of AgNPs on precipitate composition EPR characterization was performed (Figure 10). The EPR analysis of the studied samples is quite complex. First, only powder spectra were available, which obviously provide less information than EPR spectra of single crystals. Second, the obtained spectra are composite and consist of multiple overlapping orientations averaged EPR spectra, i.e., spectral components in different ratios. Finally, special attention was paid to the method of determining the g-values. The fitting was not used because it is certainly unreliable for composite signals. Therefore, the phenomenological parameters, such as the R- and S-values, [88,89,90] were used to monitor the deviations in the line shape, i.e., the changes in the local ordering due to precipitation in the presence of AgNPs. The obtained differences in R- and S-values show the combined effect of changes in the chemical composition of the studied samples, differences in the microcrystalline orientation in different domains, and the competition of the relative contributions of the EPR spectral components isotropic, axial, or orthorhombic radical centers such as ( CO 2 ,   CO 3 3 , CO 3 , NO 3 2 , . ).
The EPR spectra of the control sample clearly indicate that many paramagnetic centers are present in the sample in different ratios (Figure 10a). According to the literature data, [91,92,93,94] part of the spectral components can be attributed to the irradiated OCP, in terms of the specific EPR spectral features due to the presence of nitrogen radicals (two types of NO 3 2 ), the carbonate-centered stable CO 2   radical . These two spectral features (denoted as OCP(1) and OCP(2) in Figure 10a) were not observed in the EPR spectra of CaDHA [61,62]. In addition, the EPR spectra of the control sample in the lower magnetic field position show a peak corresponding to a g-value of about 2.0115, probably a CO 3 radical associated with entrapped water [95,96] and another type of carbonate-centered stable CO 2   radical . Since the powder spectra of the two CO 2 radicals are nearly identical, such direct identifications cannot be performed on powder EPR spectra. Therefore, from the EPR spectra of the control sample, it appears that a mixture of CaDHA and octacalcium phosphate OCP was formed. This finding is consistent with the X-ray, FTIR, and SEM analyses (Figure 7 and Figure 8).
For all three types of stabilizing agents, subtle differences in spectral shape can be observed. Table 2 shows the R- and S- values extracted from the experimental spectra. The values change for all samples studied due to the changes in concentration ratio the of different radicals originating from OCP and CaDHA. For PVP-AgNPs and AOT-AgNPs, the relative changes, ΔR and ΔS, compared to the values of the control samples are the lowest at 10 mg dm−3, while for citAgNPs they are lowest at 25 mg dm−3, which can be attributed to the nature of stabilizing agent, i.e citrate. The largest changes in S- and R-values are observed at 5 mg dm−3 for all samples studied, about 29–34% and 62–65%, respectively. In addition, the decrease in intensity of the OCP(1) and/or OCP(2) signals with increasing AgNPs concentration was observed (Figure 10b). All these differences indicate that the addition of different types of AgNPs at different concentrations affects the component ratio in the resulting mixture of CaDHA and OCP. i.e., decreased amount of OCP with increased AgNPs concentration, confirming the results of the X-ray, FTIR, and SEM analysis (Figure 7 and Figure 8).

4. Conclusions

In this work, the influence of differently stabilized AgNPs, namely cit-AgNPs, PVP-AgNPs, and AOT-AgNPs, on the formation and transformation of CaPs was investigated. The stability of ACP was influenced only in the presence of the lowest and highest concentrations of cit-AgNPs and AOT-AgNPs, respectively. However, in the presence of AgNPs the morphology of ACP was strongly affected, and the nature and extent of the effect depended on the type of AgNPs. It is interesting to note that in all cases, mostly single AgNPs distributed throughout the ACP were observed, indicating their good dispersion in the ACP matrix.
After 60 min of reaction time, a mixture of CaDHA and a small amount of OCP formed in the control system. The presence of the AgNPs affected the composition of the precipitates formed. PXRD and EPR data indicated that the amount of OCP decreased with increasing AgNPs concentration. For PVPAgNPs and AOTAgNPs, the relative changes of phenomenological parameters R- and S- values, i.e., change in complex radical structures of EPR spectra, compared to the values obtained in the control sample, were the lowest at 10 mg dm−3, while for citAgNPs they were lowest at 25 mg dm−3.
The observed effects on the rate of amorphous to crystalline phase transformation, as well as on properties of both amorphous and crystalline phases, indicate that differently stabilized AgNPs can have different effects, even if they have a similar size (PVP-AgnPs and AOT-AgNPs). Although the effects of nanoparticles and stabilizing agents were not separated, as interactions at the interfaces play a major role in precipitation, this points to the important role of the stabilizing agent.
The possibility to fine-tune the solid phase properties, in this simple way, could be of interest for the rapid and cost-effective preparation of CaP/AgNPs composites for biomedical applications.

Supplementary Materials

The following supporting information can be downloaded at: https://www.mdpi.com/article/10.3390/ma16051764/s1, Figure S1: FTIR spectra of phosphate band region and corresponding first- and second-order differentiated spectra of precipitates obtained after 10 min reaction time in the control system and in the presence of silver nanoparticles stabilized with citrate, poly(vinylpyrrolidone), and sodium bis(2-ethylhexyl) sulfosuccinate; Figure S2: FTIR spectra of phosphate band region and corresponding first- and second-order differentiated spectra of precipitates obtained after 60 min reaction time in the control system and in the presence of silver nanoparticles stabilized with citrate, poly(vinylpyrrolidone), and sodium bis(2-ethylhexyl) sulfosuccinate; Figure S3: TGA curves of the stabilizing agents used for the synthesis of silver nanoparticles.

Author Contributions

Conceptualization, M.D.S.; methodology, M.D.S. and N.M.-S.; formal analysis, S.I., M.Ć., K.S., N.K., N.P. and D.D.J.; investigation, S.I., M.Ć., K.S., N.K., N.P., N.M.-S. and D.D.J.; writing—original draft preparation, N.M.-S. and M.D.S.; writing—review and editing, N.M.-S. and M.D.S.; visualization, S.I. and K.S.; funding acquisition, M.D.S. All authors have read and agreed to the published version of the manuscript.

Funding

This work has been fully supported by Croatian Science Foundation under the project HRZZ- IP-2018-01-1493.

Data Availability Statement

Data is contained within the article or Supplementary Materials.

Acknowledgments

We are indebted to Ivana Vinković Vrček for the help and advice regarding the synthesis and characterization of AgNPs.

Conflicts of Interest

The authors declare no conflict of interest.

References

  1. Dorozhkin, S.V. Calcium Orthophosphates (CaPO4): Occurrence and Properties. ProgBiomater 2016, 5, 9–70. [Google Scholar] [CrossRef] [Green Version]
  2. Dorozhkin, S.V.; Epple, M. Biological and Medical Significance of Calcium Phosphates. Angew. Chem. Int. Ed. 2002, 41, 3130–3146. [Google Scholar] [CrossRef]
  3. Dorozhkin, S.V. Calcium Orthophosphates. In Application in Nature, Biology and Medicine; Pan Stanford Publishing: Singapore, 2012. [Google Scholar]
  4. Sikirić, M.D.; Füredi-Milhofer, H. The Influence of Surface Active Molecules on the Crystallization of Biominerals in Solution. Adv. Colloid Interfac. Sci. 2006, 128–130, 135–158. [Google Scholar] [CrossRef] [PubMed]
  5. Bleek, K.; Taubert, A. New Developments in Polymer-Controlled, Bioinspired Calcium Phosphate Mineralization from Aqueous Solution. Acta Biomater. 2013, 9, 6283–6321. [Google Scholar] [CrossRef] [PubMed]
  6. Mann, S. Biomineralization: Principles and Concepts in Bioinorganic Materials Chemistry; Oxford Chemistry Masters; Oxford University Press: New York, NY, USA, 2001. [Google Scholar]
  7. Lowenstam, H.A.; Weiner, S. On Biomineralization; Oxford University Press: New York, NY, USA, 1989. [Google Scholar]
  8. Nudelman, F.; Sommerdijk, N.A.J.M. Biomineralization as an Inspiration for Materials Chemistry. Angew. Chem. Int. Ed. 2012, 51, 6582–6596. [Google Scholar] [CrossRef] [PubMed]
  9. Weiner, S.; Wagner, H.D. The Material Bone: Structure-Mechanical Function Relations. Ann. Rev. Mater. Sci. 1998, 28, 271–298. [Google Scholar] [CrossRef]
  10. Crichton, R. Biomineralization. In Biological Inorganic Chemistry, 3rd ed.; Elsevier: Amsterdam, The Netherlands, 2018; pp. 517–544. [Google Scholar]
  11. Dorozhkin, S.V. Functionalized Calcium Orthophosphates (CaPO4) and Their Biomedical Applications. J. Mater. Chem. B 2019, 7, 7471–7489. [Google Scholar] [CrossRef]
  12. Canal, C.; Ginebra, M.P. Fibre-Reinforced Calcium Phosphate Cements: A Review. J. Mech. Behav. Biom. Mater. 2011, 4, 1658–1671. [Google Scholar] [CrossRef]
  13. Kargupta, R.; Bok, S.; Darr, C.M.; Crist, B.D.; Gangopadhyay, K.; Gangopadhyay, S.; Sengupta, S. Coatings and Surface Modifications Imparting Antimicrobial Activity to Orthopedic Implants. WIRES Nanomed. Nanobiotechnol. 2014, 6, 475–495. [Google Scholar] [CrossRef]
  14. Ben-Nissan, B.; Macha, I.; Cazalbou, S.; Choi, A.H. Calcium Phosphate Nanocoatings and Nanocomposites, Part 2: Thin Films for Slow Drug Delivery and Osteomyelitis. Nanomedicine 2016, 11, 531–544. [Google Scholar] [CrossRef] [Green Version]
  15. Lara, H.H.; Garza-Treviño, E.N.; Ixtepan-Turrent, L.; Singh, D.K. Silver Nanoparticles Are Broad-Spectrum Bactericidal and Virucidal Compounds. J. Nanobiotechnol. 2011, 9, 30. [Google Scholar] [CrossRef] [PubMed] [Green Version]
  16. Percival, S.L.; Bowler, P.G.; Russell, D. Bacterial Resistance to Silver in Wound Care. J. Hospital Infect. 2005, 60, 1–7. [Google Scholar] [CrossRef] [PubMed]
  17. Norton, R.; Finley, P.J. Clinically Isolated Bacteria Resistance to Silver-Based Wound Dressings. J. Wound Care 2021, 30, 238–247. [Google Scholar] [CrossRef]
  18. Bigi, A.; Boanini, E.; Gazzano, M. Ion Substitution in Biological and Synthetic Apatites. In Biomineralization and Biomaterials; Aparicio, C., Ginebra, M.-P., Eds.; Elsevier: Amsterdam, The Netherlands, 2016; pp. 235–266. [Google Scholar]
  19. Range, S.; Hagmeyer, D.; Rotan, O.; Sokolova, V.; Verheyen, J.; Siebers, B.; Epple, M. A Continuous Method to Prepare Poorly Crystalline Silver-Doped Calcium Phosphate Ceramics with Antibacterial Properties. RSC Adv. 2015, 5, 43172–43177. [Google Scholar] [CrossRef] [Green Version]
  20. Webster, T.J. Taylor Reducing Infections through Nanotechnology and Nanoparticles. Int. J. Nanomed. 2011, 6, 1463–1473. [Google Scholar] [CrossRef] [Green Version]
  21. Surmeneva, M.A.; Sharonova, A.A.; Chernousova, S.; Prymak, O.; Loza, K.; Tkachev, M.S.; Shulepov, I.A.; Epple, M.; Surmenev, R.A. Incorporation of Silver Nanoparticles into Magnetron-Sputtered Calcium Phosphate Layers on Titanium as an Antibacterial Coating. Colloid. Surface B 2017, 156, 104–113. [Google Scholar] [CrossRef] [PubMed]
  22. Bartmanski, M.; Cieslik, B.; Glodowska, J.; Kalka, P.; Pawlowski, L.; Pieper, M.; Zielinski, A. Electrophoretic Deposition (EPD) of Nanohydroxyapatite-Nanosilver Coatings on Ti13Zr13Nb Alloy. Ceram. Int. 2017, 43, 11820–11829. [Google Scholar] [CrossRef]
  23. Hu, C.; Wu, L.; Zhou, C.; Sun, H.; Gao, P.; Xu, X.; Zhang, C.; Liang, J.; Fan, Y.; Sun, J.; et al. Berberine/Ag Nanoparticle Embedded Biomimetic Calcium Phosphate Scaffolds for Enhancing Antibacterial Function. Nanotechnol. Rev. 2020, 9, 568–579. [Google Scholar] [CrossRef]
  24. Correia, T.R.; Figueira, D.R.; de Sá, K.D.; Miguel, S.P.; Fradique, R.G.; Mendonça, A.G.; Correia, I.J. 3D Printed Scaffolds with Bactericidal Activity Aimed for Bone Tissue Regeneration. Int. J. Biol. Macromol. 2016, 93, 1432–1445. [Google Scholar] [CrossRef]
  25. Melo, M.A.; Orrego, S.; Weir, M.D.; Xu, H.H.K.; Arola, D.D. Designing Multiagent Dental Materials for Enhanced Resistance to Biofilm Damage at the Bonded Interface. ACS Appl. Mater. Interfaces 2016, 8, 11779–11787. [Google Scholar] [CrossRef] [PubMed]
  26. Clarin, A.; Ho, D.; Soong, J.; Looi, C.; Ipe, D.S.; Tadakamadla, S.K. The Antibacterial and Remineralizing Effects of Biomaterials Combined with DMAHDM Nanocomposite: A Systematic Review. Materials 2021, 14, 1688. [Google Scholar] [CrossRef]
  27. Keskar, M.; Sabatini, C.; Cheng, C.; Swihart, M.T. Synthesis and Characterization of Silver Nanoparticle-Loaded Amorphous Calcium Phosphate Microspheres for Dental Applications. Nanoscale Adv. 2019, 1, 627–635. [Google Scholar] [CrossRef] [Green Version]
  28. Honda, M.; Kawanobe, Y.; Ishii, K.; Konishi, T.; Mizumoto, M.; Kanzawa, N.; Matsumoto, M.; Aizawa, M. In Vitro and in Vivo Antimicrobial Properties of Silver-Containing Hydroxyapatite Prepared via Ultrasonic Spray Pyrolysis Route. Mater. Sci. Eng. C 2013, 33, 5008–5018. [Google Scholar] [CrossRef]
  29. Nakamura, M.; Oyane, A.; Shimizu, Y.; Miyata, S.; Saeki, A.; Miyaji, H. Physicochemical Fabrication of Antibacterial Calcium Phosphate Submicrospheres with Dispersed Silver Nanoparticles via Coprecipitation and Photoreduction under Laser Irradiation. Acta Biomater. 2016, 46, 299–307. [Google Scholar] [CrossRef]
  30. López-Álvarez, M.; González-Rodríguez, L.; Gontad, F.; Teixeira-Santos, R.; Doiro, M.; Álvarez-Gómez, L.; Mergulhão, F.J.M.; González, P.; Serra, J. Dual Pulsed Laser Deposition of Ag Nanoparticles on Calcium Phosphate Coatings for Biomedical Applications. Biomed. Phys. Eng. Express 2022, 8, 065019. [Google Scholar] [CrossRef] [PubMed]
  31. Boanini, E.; Cassani, M.; Rubini, K.; Boga, C.; Bigi, A. (9R)-9-Hydroxystearate-Functionalized Anticancer Ceramics Promote Loading of Silver Nanoparticles. Nanomaterials 2018, 8, 390. [Google Scholar] [CrossRef] [PubMed] [Green Version]
  32. Forte, L.; Torricelli, P.; Bonvicini, F.; Boanini, E.; Gentilomi, G.A.; Lusvardi, G.; Della Bella, E.; Fini, M.; Vecchio Nepita, E.; Bigi, A. Biomimetic Fabrication of Antibacterial Calcium Phosphates Mediated by Polydopamine. J. Inorg. Biochem. 2018, 178, 43–53. [Google Scholar] [CrossRef] [Green Version]
  33. Padmanabhan, V.P.; Sivashanmugam, P.; Kulandaivelu, R.; Sagadevan, S.; Sridevi, B.; Govindasamy, R.; Thiruvengadam, M. Biosynthesised Silver Nanoparticles Loading onto Biphasic Calcium Phosphate for Antibacterial and Bone Tissue Engineering Applications. Antibiotics 2022, 11, 1780. [Google Scholar] [CrossRef]
  34. Vasiliev, A.N.; Zlotnikov, E.; Riman, R.E. Calcium Phosphate-Encapsulated Silver Powder. Surf. Coat. Tec. 2009, 203, 1555–1558. [Google Scholar] [CrossRef]
  35. Gokcekaya, O.; Ergun, C.; Webster, T.J.; Bahadir, A.; Ueda, K.; Narushima, T.; Nakano, T. Effect of Precursor Deficiency Induced Ca/P Ratio on Antibacterial and Osteoblast Adhesion Properties of Ag-Incorporated Hydroxyapatite: Reducing Ag Toxicity. Materials 2021, 14, 3158. [Google Scholar] [CrossRef]
  36. Narendran, P.; Rajendran, A.; Garhnayak, M.; Garhnayak, L.; Nivedhitha, J.; Devi, K.C.; Pattanayak, D.K. Influence of PH on Wet-Synthesis of Silver Decorated Hydroxyapatite Nanopowder. Colloid. Surface B 2018, 169, 143–150. [Google Scholar] [CrossRef]
  37. Martínez-Sanmiguel, J.J.; G Zarate-Triviño, D.; Hernandez-Delgadillo, R.; Giraldo-Betancur, A.L.; Pineda-Aguilar, N.; Galindo-Rodríguez, S.A.; Franco-Molina, M.A.; Hernández-Martínez, S.P.; Rodríguez-Padilla, C. Anti-Inflammatory and Antimicrobial Activity of Bioactive Hydroxyapatite/Silver Nanocomposites. J. Biomater. Appl. 2019, 33, 1314–1326. [Google Scholar] [CrossRef] [PubMed]
  38. Citradewi, P.W.; Hidayat, H.; Purwiandono, G.; Fatimah, I.; Sagadevan, S. Clitorea Ternatea-Mediated Silver Nanoparticle-Doped Hydroxyapatite Derived from Cockle Shell as Antibacterial Material. Chem. Phys. Lett. 2021, 769, 138412. [Google Scholar] [CrossRef]
  39. Sokolova, V.; Epple, M. Biological and Medical Applications of Calcium Phosphate Nanoparticles. Chem. Eur. J. 2021, 27, 7471–7488. [Google Scholar] [CrossRef]
  40. Falini, G.; Fermani, S. The Strategic Role of Adsorption Phenomena in Biomineralization: Biomineralization. Cryst. Res. Technol. 2013, 48, 864–876. [Google Scholar] [CrossRef]
  41. Munro, C.H.; Smith, W.E.; Garner, M.; Clarkson, J.; White, P.C. Characterization of the Surface of a Citrate-Reduced Colloid Optimized for Use as a Substrate for Surface-Enhanced Resonance Raman Scattering. Langmuir 1995, 11, 3712–3720. [Google Scholar] [CrossRef]
  42. Capjak, I.; Zebić Avdičević, M.; Sikirić, M.D.; Domazet Jurašin, D.; Hozić, A.; Pajić, D.; Dobrović, S.; Goessler, W.; Vinković Vrček, I. Behavior of Silver Nanoparticles in Wastewater: Systematic Investigation on the Combined Effects of Surfactants and Electrolytes in Model Systems. Envir. Sci. Water Res. Technol. 2018, 4, 2146–2159. [Google Scholar] [CrossRef]
  43. Vinković Vrček, I.; Pavičić, I.; Crnković, T.; Jurašin, D.; Babič, M.; Horák, D.; Lovrić, M.; Ferhatović, L.; Ćurlin, M.; Gajović, S. Does Surface Coating of Metallic Nanoparticles Modulate Their Interference with in Vitro Assays? RSC Adv. 2015, 5, 70787–70807. [Google Scholar] [CrossRef]
  44. Jurašin, D.D.; Ćurlin, M.; Capjak, I.; Crnković, T.; Lovrić, M.; Babič, M.; Horák, D.; Vinković Vrček, I.; Gajović, S. Surface Coating Affects Behavior of Metallic Nanoparticles in a Biological Environment. Beilstein J. Nanotechnol. 2016, 7, 246–262. [Google Scholar] [CrossRef] [Green Version]
  45. Uskoković, V. Visualizing Different Crystalline States during the Infrared Imaging of Calcium Phosphates. Vib. Spectrosc. 2020, 108, 103045. [Google Scholar] [CrossRef]
  46. Majer, M.; Roguljić, M.; Knežević, Ž.; Starodumov, A.; Ferenček, D.; Brigljević, V.; Mihaljević, B. Dose Mapping of the Panoramic 60Co Gamma Irradiation Facility at the Ruđer Bošković Institute–Geant4 Simulation and Measurements. Appl. Radiat. Isotopes 2019, 154, 108824. [Google Scholar] [CrossRef] [PubMed]
  47. Guidelines for Industrial Radiation Sterilization of Disposable Medical Products (Cobalt-60 Gamma Irradiation); TECDOC Series; International Atomic Energy Agency: Vienna, Austria, 1989.
  48. Radiation Sterilization of Tissue Allografts: Requirements for Validation and Routine Control a Code of Practice; International Atomic Agency: Vienna, Austria, 2007.
  49. Wei, D.; Qian, W. Facile Synthesis of Ag and Au Nanoparticles Utilizing Chitosan as a Mediator Agent. Colloid. Surface B 2008, 62, 136–142. [Google Scholar] [CrossRef]
  50. Bar-Yosef Ofir, P.; Govrin-Lippman, R.; Garti, N.; Füredi-Milhofer, H. The Influence of Polyelectrolytes on the Formation and Phase Transformation of Amorphous Calcium Phosphate. Cryst. Growth Des. 2004, 4, 177–183. [Google Scholar] [CrossRef]
  51. Wang, L.; Nancollas, G.H. Pathways to Biomineralization and Biodemineralization of Calcium Phosphates: The Thermodynamic and Kinetic Controls. Dalton Trans. 2009, 2665–2672. [Google Scholar] [CrossRef] [PubMed]
  52. Selmani, A.; Coha, I.; Magdić, K.; Čolović, B.; Jokanović, V.; Šegota, S.; Gajović, S.; Gajović, A.; Jurašin, D.; Dutour Sikirić, M. Multiscale Study of the Influence of Cationic Surfactants on Amorphous Calcium Phosphate Precipitation. CrystEngComm 2015, 17, 8529–8548. [Google Scholar] [CrossRef] [Green Version]
  53. Füredi-Milhofer, H.; Purgarić, B.; Brečević, L.; Pavković, N. Precipitation of Calcium Phosphates from Electrolyte Solutions: I. A Study of the Precipitates in the Physiological PH Region. Calc. Tiss. Res. 1971, 8, 142–153. [Google Scholar] [CrossRef]
  54. Du, L.-W.; Bian, S.; Gou, B.-D.; Jiang, Y.; Huang, J.; Gao, Y.-X.; Zhao, Y.-D.; Wen, W.; Zhang, T.-L.; Wang, K. Structure of Clusters and Formation of Amorphous Calcium Phosphate and Hydroxyapatite: From the Perspective of Coordination Chemistry. Cryst. Growth Des. 2013, 13, 3103–3109. [Google Scholar] [CrossRef]
  55. Li, S.; Wang, L. Phosphorylated Osteopontin Peptides Inhibit Crystallization by Resisting the Aggregation of Calcium Phosphate Nanoparticles. CrystEngComm 2012, 14, 8037–8043. [Google Scholar] [CrossRef]
  56. Ding, H.; Pan, H.; Xu, X.; Tang, R. Toward a Detailed Understanding of Magnesium Ions on Hydroxyapatite Crystallization Inhibition. Cryst. Growth Des. 2014, 14, 763–769. [Google Scholar] [CrossRef]
  57. Wang, C.-G.; Liao, J.-W.; Gou, B.-D.; Huang, J.; Tang, R.-K.; Tao, J.-H.; Zhang, T.-L.; Wang, K. Crystallization at Multiple Sites inside Particles of Amorphous Calcium Phosphate. Cryst. Growth Des. 2009, 9, 2620–2626. [Google Scholar] [CrossRef]
  58. Yang, X.; Xie, B.; Wang, L.; Qin, Y.; Henneman, Z.J.; Nancollas, G.H. Influence of Magnesium Ions and Amino Acids on the Nucleation and Growth of Hydroxyapatite. CrystEngComm 2011, 13, 1153–1158. [Google Scholar] [CrossRef]
  59. Chen, Y.; Gu, W.; Pan, H.; Jiang, S.; Tang, R. Stabilizing Amorphous Calcium Phosphate Phase by Citrate Adsorption. CrystEngComm 2014, 16, 1864–1867. [Google Scholar] [CrossRef]
  60. Erceg, I.; Kontrec, J.; Strasser, V.; Selmani, A.; Domazet Jurašin, D.; Ćurlin, M.; Džakula, B.N.; Matijaković Mlinarić, N.; Šegota, S.; Lyons, D.M.; et al. Precipitation of Calcium Phosphates and Calcium Carbonates in the Presence of Differently Charged Liposomes. Minerals 2022, 12, 208. [Google Scholar] [CrossRef]
  61. Erceg, I.; Selmani, A.; Gajović, A.; Panžić, I.; Iveković, D.; Faraguna, F.; Šegota, S.; Ćurlin, M.; Strasser, V.; Kontrec, J.; et al. Calcium Phosphate Formation on TiO2 Nanomaterials of Different Dimensionality. Colloid. Surface A 2020, 593, 124615. [Google Scholar] [CrossRef]
  62. Erceg, I.; Selmani, A.; Gajović, A.; Radatović, B.; Šegota, S.; Ćurlin, M.; Strasser, V.; Kontrec, J.; Kralj, D.; Maltar-Strmečki, N.; et al. Precipitation at Room Temperature as a Fast and Versatile Method for Calcium Phosphate/TiO2 Nanocomposites Synthesis. Nanomaterials 2021, 11, 1523. [Google Scholar] [CrossRef]
  63. Dorozhkin, S.V. Amorphous Calcium (Ortho)Phosphates. Acta Biomate. 2010, 6, 4457–4475. [Google Scholar] [CrossRef] [PubMed]
  64. Buljan Meić, I.; Kontrec, J.; Domazet Jurašin, D.; Selmani, A.; Njegić Džakula, B.; Maltar-Strmečki, N.; Lyons, D.M.; Plodinec, M.; Čeh, M.; Gajović, A.; et al. How Similar Are Amorphous Calcium Carbonate and Calcium Phosphate? A Comparative Study of Amorphous Phase Formation Conditions. CrystEngComm 2018, 20, 35–50. [Google Scholar] [CrossRef]
  65. Combes, C.; Rey, C. Amorphous Calcium Phosphates: Synthesis, Properties and Uses in Biomaterials. Acta Biomater. 2010, 6, 3362–3378. [Google Scholar] [CrossRef] [Green Version]
  66. Smith, B.C. Fundamentals of Fourier Transform Infrared Spectroscopy, 2nd ed.; CRC Press: Boca Raton, FL, USA, 2011. [Google Scholar]
  67. Xie, B.; Halter, T.J.; Borah, B.M.; Nancollas, G.H. Tracking Amorphous Precursor Formation and Transformation during Induction Stages of Nucleation. Cryst. Growth Des. 2014, 14, 1659–1665. [Google Scholar] [CrossRef] [PubMed]
  68. Yang, X.; Wang, L.; Qin, Y.; Sun, Z.; Henneman, Z.J.; Moradian-Oldak, J.; Nancollas, G.H. How Amelogenin Orchestrates the Organization of Hierarchical Elongated Microstructures of Apatite. J. Phys. Chem. B 2010, 114, 2293–2300. [Google Scholar] [CrossRef] [Green Version]
  69. Xie, C.-M.; Lu, X.; Wang, K.-F.; Meng, F.-Z.; Jiang, O.; Zhang, H.-P.; Zhi, W.; Fang, L.-M. Silver Nanoparticles and Growth Factors Incorporated Hydroxyapatite Coatings on Metallic Implant Surfaces for Enhancement of Osteoinductivity and Antibacterial Properties. ACS App. Mater. Interfaces 2014, 6, 8580–8589. [Google Scholar] [CrossRef] [PubMed]
  70. Liou, S.-C.; Chen, S.-Y.; Lee, H.-Y.; Bow, J.-S. Structural Characterization of Nano-Sized Calcium Deficient Apatite Powders. Biomaterials 2004, 25, 189–196. [Google Scholar] [CrossRef] [PubMed]
  71. Koutsopoulos, S. Synthesis and Characterization of Hydroxyapatite Crystals: A Review Study on the Analytical Methods. J. Biomed. Mater. Res. 2002, 62, 600–612. [Google Scholar] [CrossRef] [PubMed]
  72. Mochales, C.; Wilson, R.M.; Dowker, S.E.P.; Ginebra, M.-P. Dry Mechanosynthesis of Nanocrystalline Calcium Deficient Hydroxyapatite: Structural Characterisation. J. Alloy. Compd. 2011, 509, 7389–7394. [Google Scholar] [CrossRef]
  73. Drouet, C. Apatite Formation: Why It May Not Work as Planned, and How to Conclusively Identify Apatite Compounds. BioMed. Res. Int. 2013, 2013, 1–12. [Google Scholar] [CrossRef] [PubMed] [Green Version]
  74. Fowler, B.O.; Markovic, M.; Brown, W.E. Octacalcium Phosphate. 3. Infrared and Raman Vibrational Spectra. Chem. Mater. 1993, 5, 1417–1423. [Google Scholar] [CrossRef]
  75. Füredi-Milhofer, H.; Sarig, S. Interactions between Polyelectrolytes and Sparingly Soluble Salts. Prog. Cryst. Growth Charact. Mater. 1996, 32, 45–74. [Google Scholar] [CrossRef]
  76. Buljan Meić, I.; Kontrec, J.; Domazet Jurašin, D.; Njegić Džakula, B.; Štajner, L.; Lyons, D.M.; Dutour Sikirić, M.; Kralj, D. Comparative Study of Calcium Carbonates and Calcium Phosphates Precipitation in Model Systems Mimicking the Inorganic Environment for Biomineralization. Cryst. Growth Des. 2017, 17, 1103–1117. [Google Scholar] [CrossRef]
  77. Furedi-Milhofer, H.; Moradian-Oldak, J.; Weiner, S.; Veis, A.; Mintz, K.P.; Addadf, L. Interactions of Matrix Proteins from Mineralized Tissues with Octacalcium Phosphate. Conn. Tissue Res. 1994, 30, 251–264. [Google Scholar] [CrossRef] [PubMed]
  78. Mir, M.; Siddiqi, S.A.; Hussain, T.; Chaudhry, A.A.; Rehman, I.U.; Khan, A.S.; Abbas, G. Synthesis and Characterization of Calcium Deficient Apatite Granules for Drug Eluting Bone Graft Applications. Ceram. Int. 2014, 40, 10719–10725. [Google Scholar] [CrossRef]
  79. Tõnsuaadu, K.; Gross, K.A.; Plūduma, L.; Veiderma, M. A Review on the Thermal Stability of Calcium Apatites. Therm. Ana. Calorim. 2012, 110, 647–659. [Google Scholar] [CrossRef]
  80. Lazić, S.; Zec, S.; Miljević, N.; Milonjić, S. The Effect of Temperature on the Properties of Hydroxyapatite Precipitated from Calcium Hydroxide and Phosphoric Acid. Thermochim. Acta 2001, 374, 13–22. [Google Scholar] [CrossRef]
  81. Shi, H.; Ye, X.; Zhang, J.; Wu, T.; Yu, T.; Zhou, C.; Ye, J. A Thermostability Perspective on Enhancing Physicochemical and Cytological Characteristics of Octacalcium Phosphate by Doping Iron and Strontium. Bioact. Mater. 2021, 6, 1267–1282. [Google Scholar] [CrossRef]
  82. Putlyaev, V.I.; Kukueva, E.V.; Safronova, T.V.; Ivanov, V.K.; Churagulov, B.R. Features of Octacalcium Phosphate Thermolysis. Refract. Ind. Ceram. 2014, 54, 420–424. [Google Scholar] [CrossRef]
  83. Murray, K.A.; Döbelin, N.; Albadarin, A.B.; Sadło, J.; Ren, G.; Collins, M.N.; O’Neill, C. The Influence of Sterilization on Octacalcium Phosphate for Clinical Applications. In Octacalcium Phosphate Biomaterials; Insley, G., Suzuki, O., Eds.; Elsevier: Amsterdam, The Netherlands, 2020; pp. 55–84. [Google Scholar]
  84. Majeed Khan, M.A.; Kumar, S.; Ahamed, M.; Alrokayan, S.A.; AlSalhi, M.S. Structural and Thermal Studies of Silver Nanoparticles and Electrical Transport Study of Their Thin Films. Nanoscale. Res. Lett. 2011, 6, 434. [Google Scholar] [CrossRef] [PubMed] [Green Version]
  85. Adebayo-Tayo, B.; Salaam, A.; Ajibade, A. Green Synthesis of Silver Nanoparticle Using Oscillatoria Sp. Extract, Its Antibacterial, Antibiofilm Potential and Cytotoxicity Activity. Heliyon 2019, 5, e02502. [Google Scholar] [CrossRef] [PubMed] [Green Version]
  86. Lebugle, A.; Zahidi, E.; Bonel, G. Effect of Structure and Composition on the Thermal Decomposition of Calcium Phosphates (Ca/P = 1.33). React. Solids 1986, 2, 151–161. [Google Scholar] [CrossRef]
  87. Guo, C.; Xue, J.; Tan, Y.; Dong, Y. Fabrication of Silver/Beta-tricalcium Phosphate Particle by a Simple Liquid Chemical Reduction Method. Micro. Nano Lett. 2016, 11, 391–394. [Google Scholar] [CrossRef]
  88. Callens, F.J.; Verbeeck, R.M.H.; Matthys, P.F.A.; Martens, L.C.; Boesman, E.R. The Contribution of CO33− and CO2− to the ESR Spectrum near G=2 of Powdered Human Tooth Enamel. Calc. Tiss. Int. 1987, 41, 124–129. [Google Scholar] [CrossRef]
  89. Erceg, I.; Maltar-Strmečki, N.; Jurašin, D.D.; Strasser, V.; Ćurlin, M.; Lyons, D.M.; Radatović, B.; Mlinarić, N.M.; Kralj, D.; Sikirić, M.D. Comparison of the Effect of the Amino Acids on Spontaneous Formation and Transformation of Calcium Phosphates. Crystals 2021, 11, 792. [Google Scholar] [CrossRef]
  90. Cevc, P.; Schara, M.; Ravnik, Č. Electron Paramagnetic Resonance Study of Irradiated Tooth Enamel. Radiat. Res. 1972, 51, 581–589. [Google Scholar] [CrossRef]
  91. Murzakhanov, F.F.; Grishin, P.O.; Goldberg, M.A.; Yavkin, B.V.; Mamin, G.V.; Orlinskii, S.B.; Fedotov, A.Y.; Petrakova, N.V.; Antuzevics, A.; Gafurov, M.R.; et al. Radiation-Induced Stable Radicals in Calcium Phosphates: Results of Multifrequency EPR, EDNMR, ESEEM, and ENDOR Studies. App. Sci. 2021, 11, 7727. [Google Scholar] [CrossRef]
  92. Gafurov, M.; Yavkin, B.; Mamin, G.; Orlinskii, S.; Smirnov, I.; Fedotov, A.; Komlev, V. Radiation Induced Paramagnetic Radicals in Synthetic Octacalcium Phosphate. IOP Conf. Ser. Earth and Environ. Sci. 2018, 155, 012018. [Google Scholar] [CrossRef]
  93. Shurtakova, D.V.; Yavkin, B.V.; Mamin, G.V.; Orlinskii, S.B.; Sirotinkin, V.P.; Fedotov, A.Y.; Shinkarev, A.; Antuzevics, A.; Smirnov, I.V.; Tovtin, V.I.; et al. X-Ray Diffraction and Multifrequency EPR Study of Radiation-Induced Room Temperature Stable Radicals in Octacalcium Phosphate. Radiat. Res. 2021, 195, 200–210. [Google Scholar] [CrossRef] [PubMed]
  94. Murzakhanov, F.; Mamin, G.V.; Orlinskii, S.; Goldberg, M.; Petrakova, N.V.; Fedotov, A.Y.; Grishin, P.; Gafurov, M.R.; Komlev, V.S. Study of Electron-Nuclear Interactions in Doped Calcium Phosphates by Various Pulsed EPR Spectroscopy Techniques. ACS Omega 2021, 6, 25338–25349. [Google Scholar] [CrossRef]
  95. Callens, F.; Vanhaelewyn, G.; Matthys, P.; Boesman, E. EPR of Carbonate Derived Radicals: Applications in Dosimetry, Dating and Detection of Irradiated Food. Appl. Magn. Reson. 1998, 14, 235–254. [Google Scholar] [CrossRef]
  96. Grün, R.; Joannes-Boyau, R.; Stringer, C. Two Types of CO2 Radicals Threaten the Fundamentals of ESR Dating of Tooth Enamel. Q. Geochronol. 2008, 3, 150–172. [Google Scholar] [CrossRef]
Figure 1. (a,c,e) TEM micrographs and (b,d,f) corresponding size distributions of silver nanoparticles stabilized with (a,b) citrate, (c,d) poly(vinylpyrrolidone), and (e,f) sodium bis(2-ethylhexyl) sulfosuccinate.
Materials 16 01764 g001
Figure 2. UV-Vis spectra of silver nanoparticles (AgNPs), stabilized with (a) citrate (cit-AgNPs), (b) poly(vinylpyrrolidone) (PVP-AgNPs), and (c) sodium bis(2-ethylhexyl) sulfosuccinate (AOT-AgNPs). (γ (AgNPs) = 50 mg dm−3) in UPW at 25 °C recorded at different time periods.
Materials 16 01764 g002
Figure 3. Representative volume size distribution of silver nanoparticles (AgNPs), stabilized with citrate (cit-AgNPs), poly(vinylpyrrolidone) (PVP-AgNPs), sodium bis(2-ethylhexyl) sulfosuccinate (AOT-AgNPs) suspended in anionic reactant solution (c(Na2HPO4) = 8 · 10−3 mol dm−3, γ (AgNPs) = 50 mg dm−3, pH 7.4) at 25 °C. dh—hydrodynamic diameter.
Materials 16 01764 g003
Figure 4. Representative pH vs. time curves (ac) and corresponding average induction time for crystalline phase precipitation (ti) with corresponding standard deviation (d) obtained in the control system (γ(AgNPs) = 0 mg dm−3) and in the presence of different concentrations of silver nanoparticles (AgNPs) stabilized with (a) citrate (cit-AgNPs), (b) poly(vinylpyrrolidone) (PVP-AgNPs), and (c) sodium bis(2-ethylhexyl) sulfosuccinate (AOT-AgNPs). In figure (d) full and dashed lines represent the average induction time and corresponding standard deviation in the control system, respectively. c(CaCl2) = c(Na2HPO4) = 4 · 10−3 mol dm−3, pH 7.4, 25 °C.
Materials 16 01764 g004
Figure 5. PXRD patterns (a,c,e) and FTIR spectra (b,d,f) of precipitates obtained after 10 min reaction time in the control system and in the presence of silver nanoparticles (AgNPs) stabilized with (a,b) citrate (cit-AgNPs), (c,d) poly(vinylpyrrolidone) (PVP-AgNPs), and (e,f) sodium bis(2-ethylhexyl) sulfosuccinate (AOT-AgNPs). c(CaCl2) = c(Na2HPO4) = 4 · 10−3 mol dm−3, pH 7.4, 25 °C. ■—amorphous calcium phosphate, *—silver nanoparticles.
Materials 16 01764 g005
Figure 6. TEM micrographs of precipitates obtained after 10 min reaction time in the control system and in the presence of different concentrations of silver nanoparticles (AgNPs) stabilized with citrate (cit-AgNPs), poly(vinylpyrrolidone) (PVP-AgNPs), and sodium bis(2-ethylhexyl) sulfosuccinate (AOT-AgNPs). c(CaCl2) = c(Na2HPO4) = 4 · 10−3 mol dm−3, pH 7.4, 25 °C.
Materials 16 01764 g006
Figure 7. PXRD patterns (a,c,e) and FTIR (b,d,f) spectra of precipitates obtained after 60 min reaction time in the presence of silver nanoparticles (AgNPs) stabilized with (a,b) citrate (cit-AgNPs), (c,d) poly(vinylpyrrolidone) (PVP-AgNPs), and (e,f) sodium bis(2-ethylhexyl) sulfosuccinate (AOT-AgNPs). c(CaCl2) = c(Na2HPO4) = 4 · 10−3 mol dm−3, pH 7.4, 25 °C. □—octacalcium phosphate, ■—calcium deficient hydroxyapatite, *—silver nanoparticles.
Materials 16 01764 g007
Figure 8. SEM micrographs of precipitates obtained after 60 min reaction time in the control system and in the presence of different concentrations of silver nanoparticles (AgNPs) stabilized with citrate (cit-AgNPs), poly(vinylpyrrolidone) (PVP-AgNPs), and sodium bis(2-ethylhexyl) sulfosuccinate (AOT-AgNPs). c(CaCl2) = c(Na2HPO4) = 4 · 10−3 mol dm−3, pH 7.4, 25 °C.
Materials 16 01764 g008
Figure 9. TGA curves of the precipitates obtained after 60 min reaction time in the presence of different concentrations of silver nanoparticles (AgNPs) stabilized with (a) citrate (cit-AgNPs), (b) poly(vinylpyrrolidone) (PVP-AgNPs), and (c) sodium bis(2-ethylhexyl) sulfosuccinate (AOT-AgNPs). c(CaCl2) = c(Na2HPO4) = 4 · 10−3 mol dm−3, pH 7.4, 25 °C.
Materials 16 01764 g009
Figure 10. EPR spectra of (a) the precipitate obtained after 60 min reaction time in the control system and (b) the precipitates obtained after 60 min reaction time in the presence of different concentrations of silver nanoparticles (AgNPs) stabilized with citrate (cit-AgNPs), poly(vinylpyrrolidone) (PVP-AgNPs), and sodium bis(2-ethylhexyl) sulfosuccinate (AOT-AgNPs). c(CaCl2) = c(Na2HPO4) = 4 · 10−3 mol dm−3, pH 7.4, 25 °C.
Materials 16 01764 g010
Table 1. The hydrodynamic diameter (dh) and zeta potential (ζ) of silver nanoparticles (AgNPs), stabilized with citrate (cit-AgNPs), poly(vinylpyrrolidone) (PVP-AgNPs), sodium bis(2-ethylhexyl) sulfosuccinate (AOT-AgNPs) suspended in anionic reactant solution (c(Na2HPO4) = 8 · 10−3 mol dm−3, γ (AgNPs) = 50 mg dm−3, pH 7.4) at 25 °C.
SamplePeak IPeak IIζ/mV
dh/nmvol. %dh/nmvol. %
cit-AgNPs15.9 ± 2.059.7 ± 3.764.4 ± 2.640.3 ± 3.7−40.2 ± 1,4
PVP-AgNPs89.9 ± 1.0100 −24.5 ± 1.6
AOT-AgNPs84.8 ± 0.8100 −59.9 ± 2.5
Table 2. R- and S-values of the powdered irradiated precipitates obtained after 60 min reaction time in the presence of different concentrations of silver nanoparticles (AgNPs) stabilized with citrate (cit-AgNPs), poly(vinylpyrrolidone) (PVP-AgNPs), and sodium bis(2-ethylhexyl) sulfosuccinate (AOT-AgNPs). c(CaCl2) = c(Na2HPO4) = 4 · 10−3 mol dm−3, pH 7.4, 25 °C.
Sampleγ (AgNPs)/mg dm−3RS
Control system00.5360.443
Cit-AgNPs50.7190.729
100.6110.542
250.5490.482
PVP-AgNPs50.6920.720
100.5770.508
250.6430.567
AOT-AgNPs50.6980.719
100.6430.589
250.6620.615
Disclaimer/Publisher’s Note: The statements, opinions and data contained in all publications are solely those of the individual author(s) and contributor(s) and not of MDPI and/or the editor(s). MDPI and/or the editor(s) disclaim responsibility for any injury to people or property resulting from any ideas, methods, instructions or products referred to in the content.

