

Historical Silk: A Novel Method to Evaluate Degumming with Non-Invasive Infrared Spectroscopy and Spectral Deconvolution
 , ,
, ,  , , and
Abstract
:1. Introduction
- (i)
- Raw or hard silk. It is obtained after twisting some single filaments together in order to obtain the thread. The sericin coating is still present, which makes dyeing difficult [3].
- (ii)
- Partially degummed or supple silk [3].
- (iii)
Aim of the Work
2. Materials and Methods
2.1. Reference Silk
- -
- HS1 and HS2: Hard silk cloth
- -
- HS3: Hard silk yarn
- -
- SS1, SS2, and SS3: Soft silk cloth
2.2. The Morigi Collection of Traditional Japanese Armors
2.3. Attenuated Total Reflectance Fourier Transform Infrared Spectroscopy
2.4. External Reflection Fourier Transform Infrared Spectroscopy
2.5. Data Treatment and Elaboration
2.6. Spectral Deconvolution/Curve-Fitting Analysis
2.7. Principal Component Analysis
3. Results and Discussion
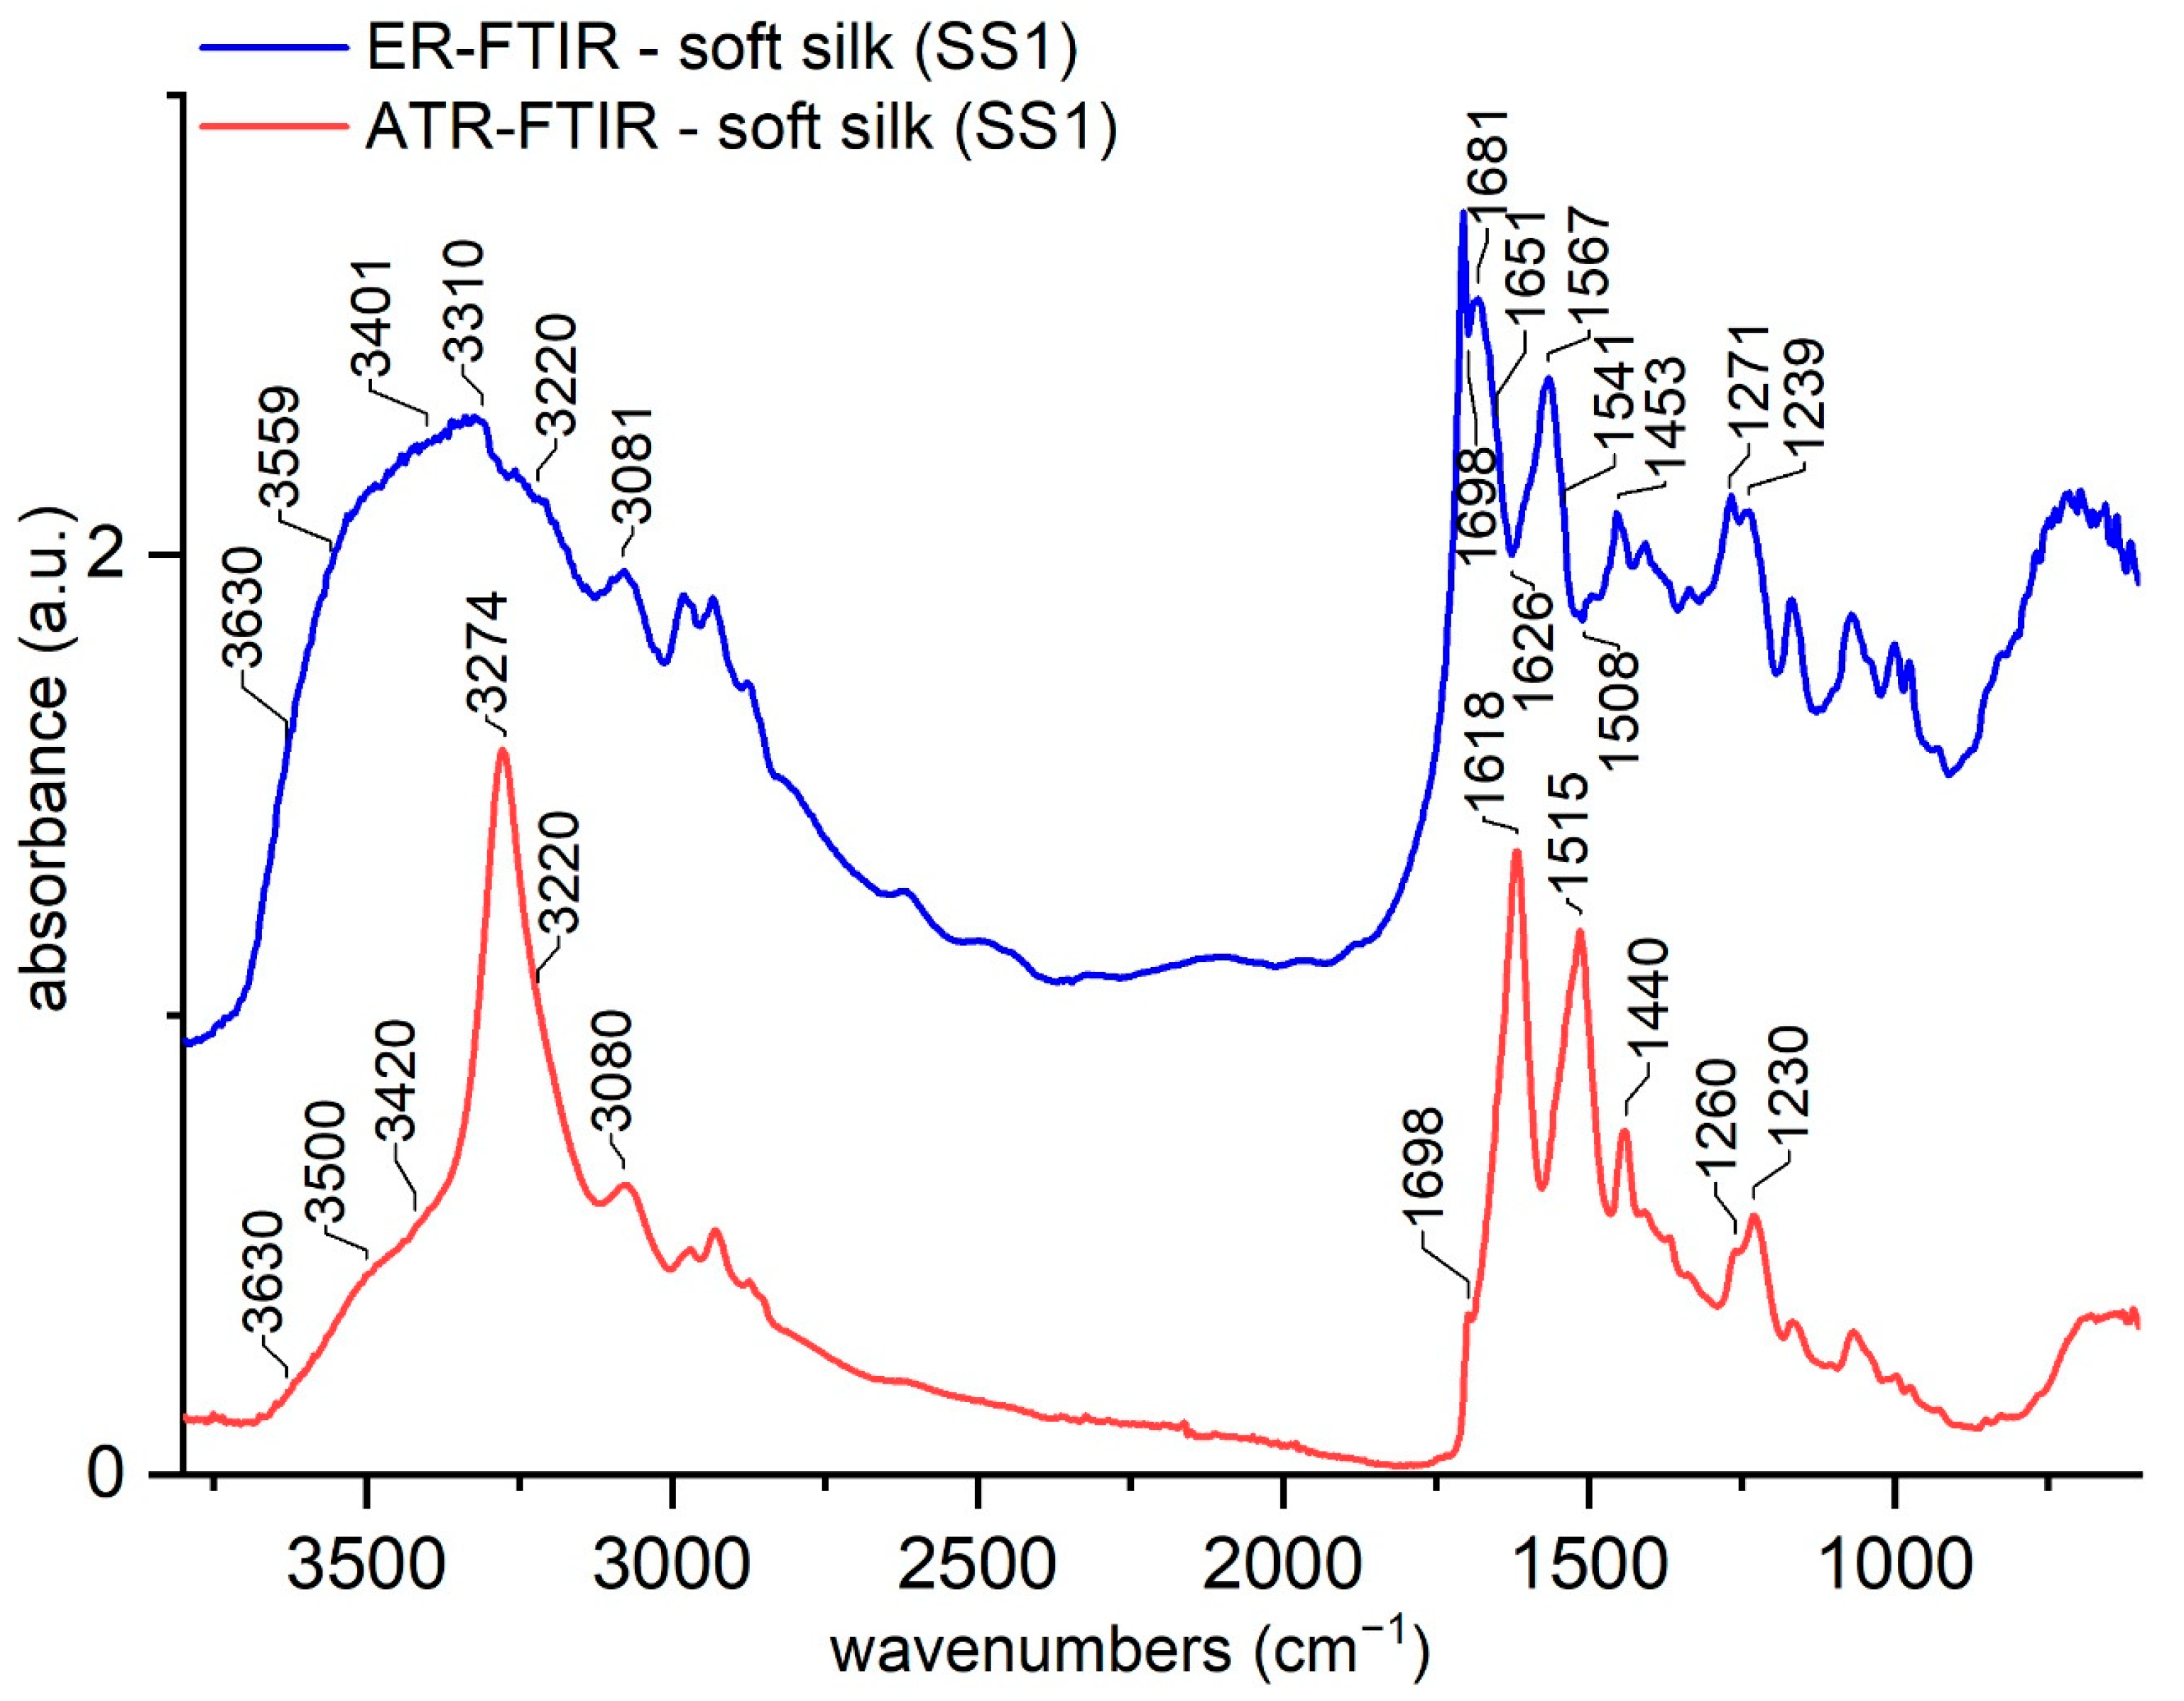
3.1. ATR-FTIR and ER-FTIR Spectra of Soft Silk
3.2. Water Uptake Behavior of Soft Silk
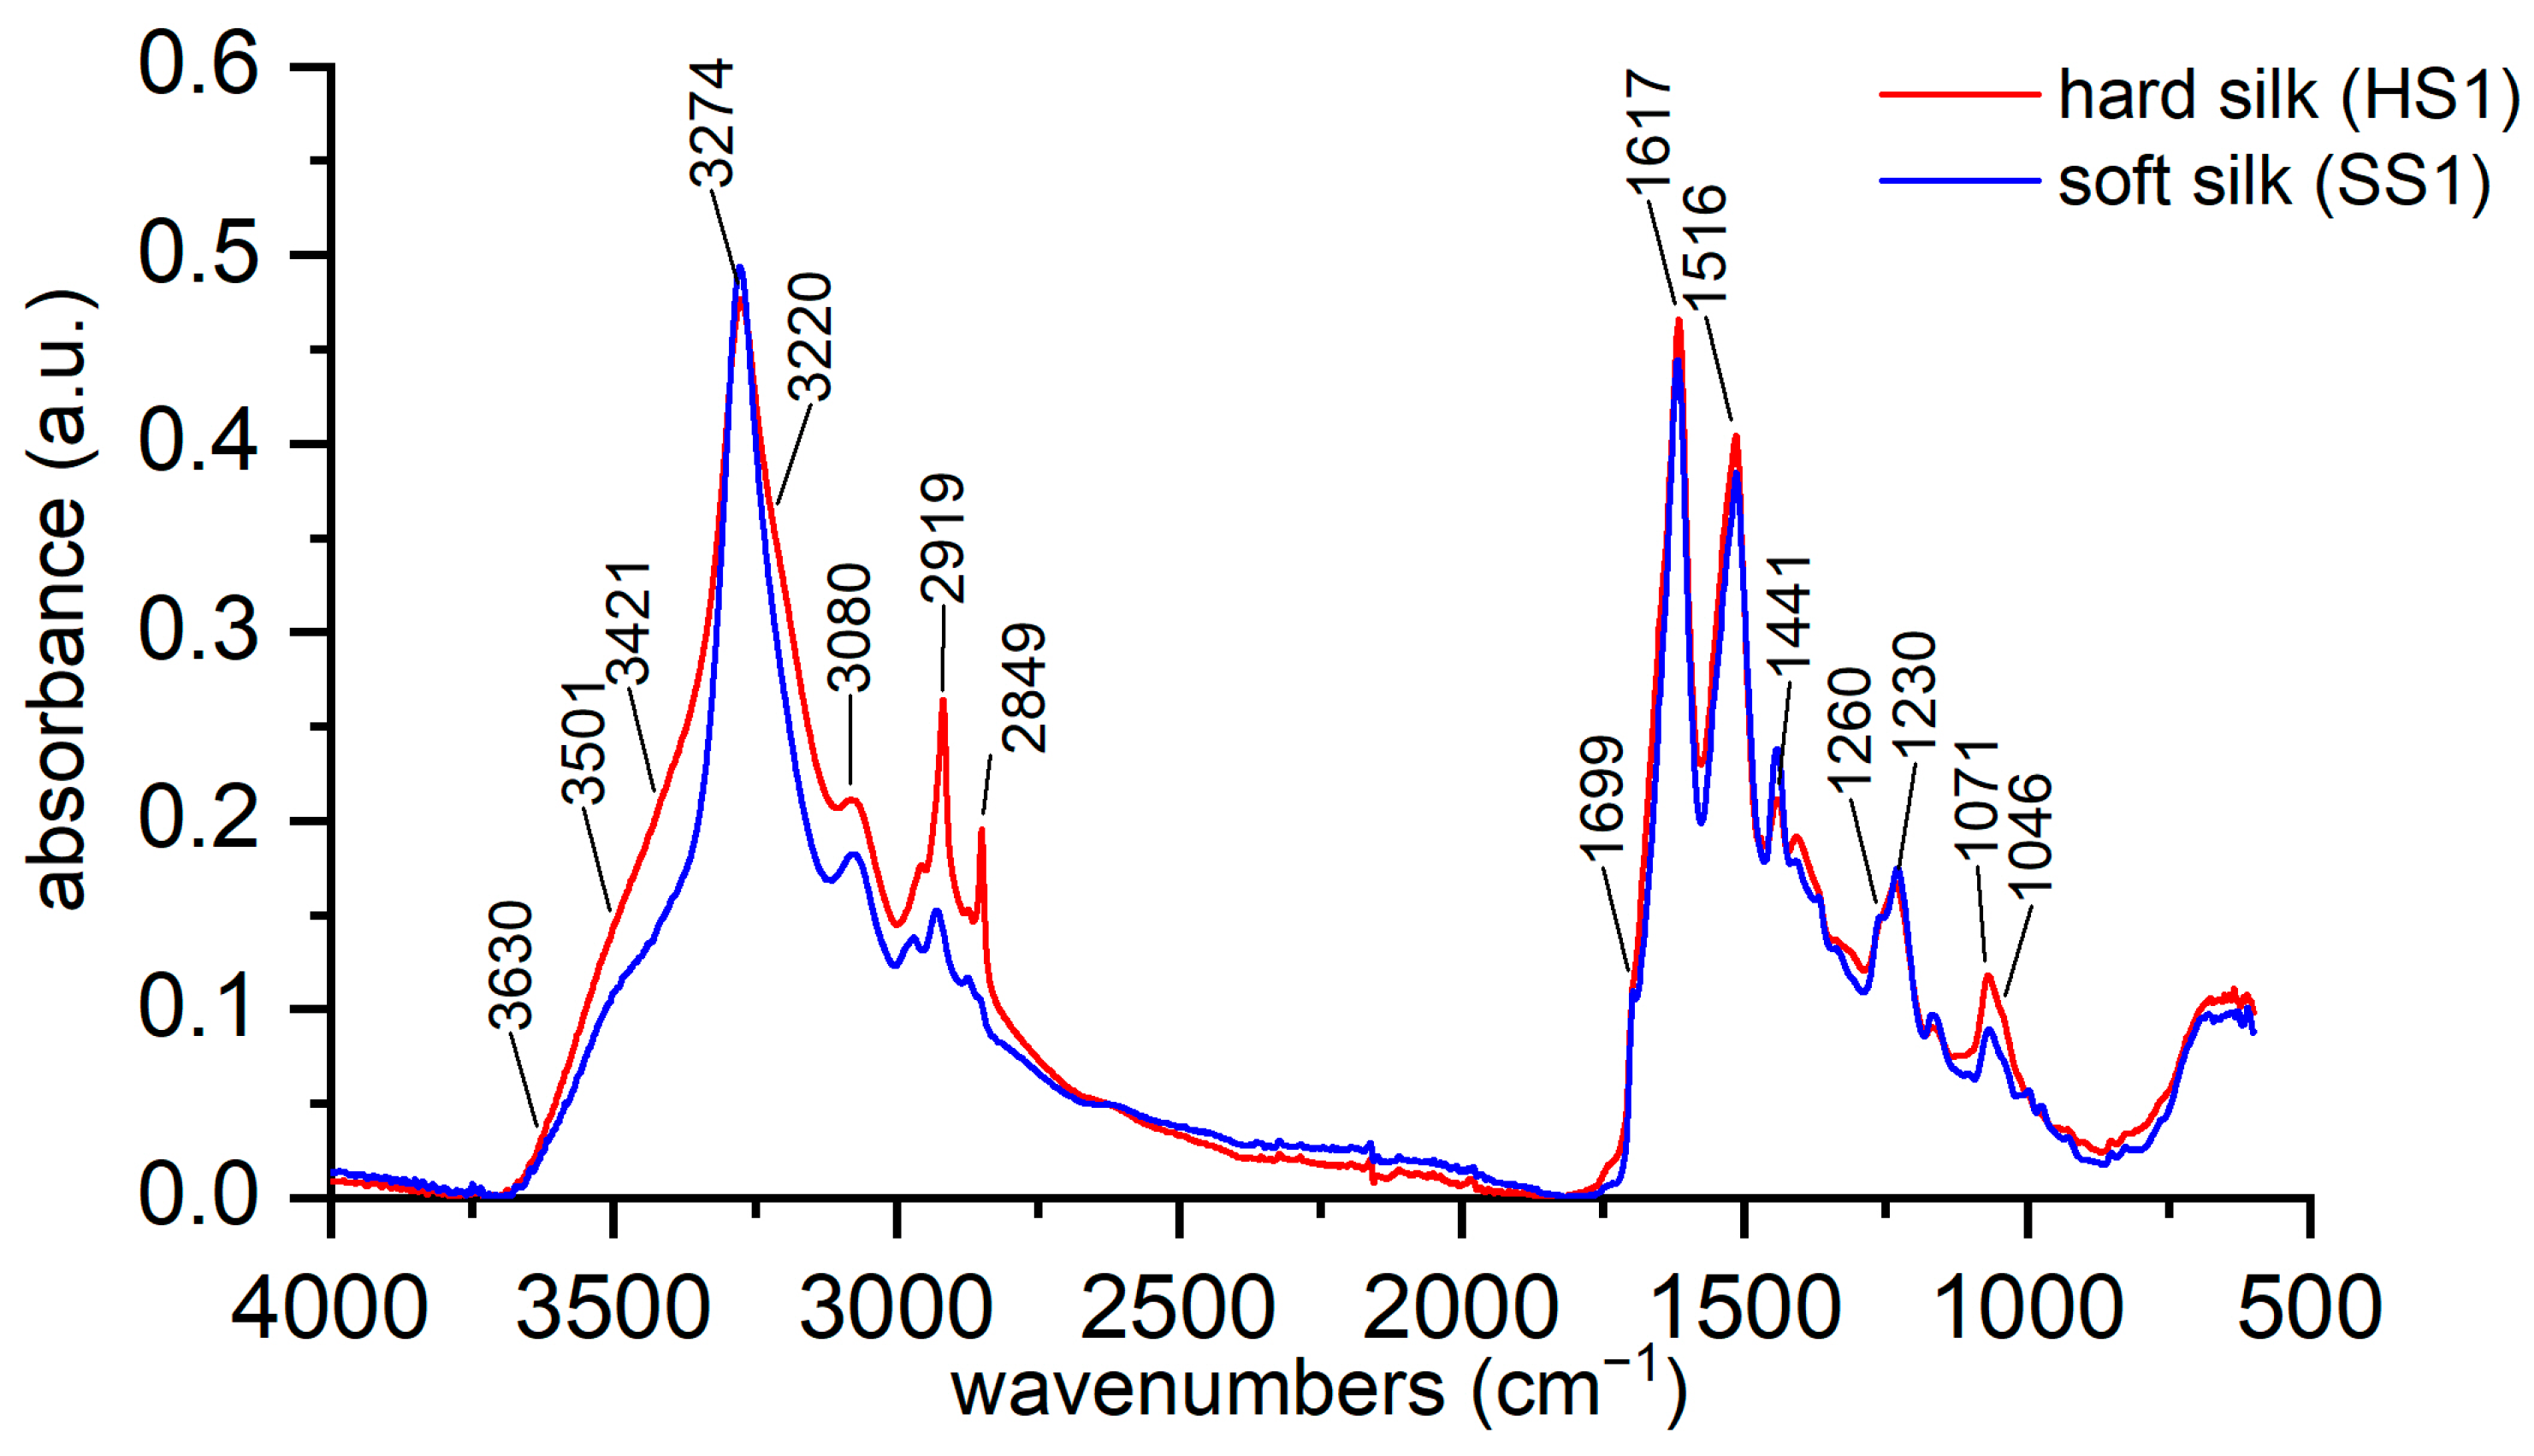
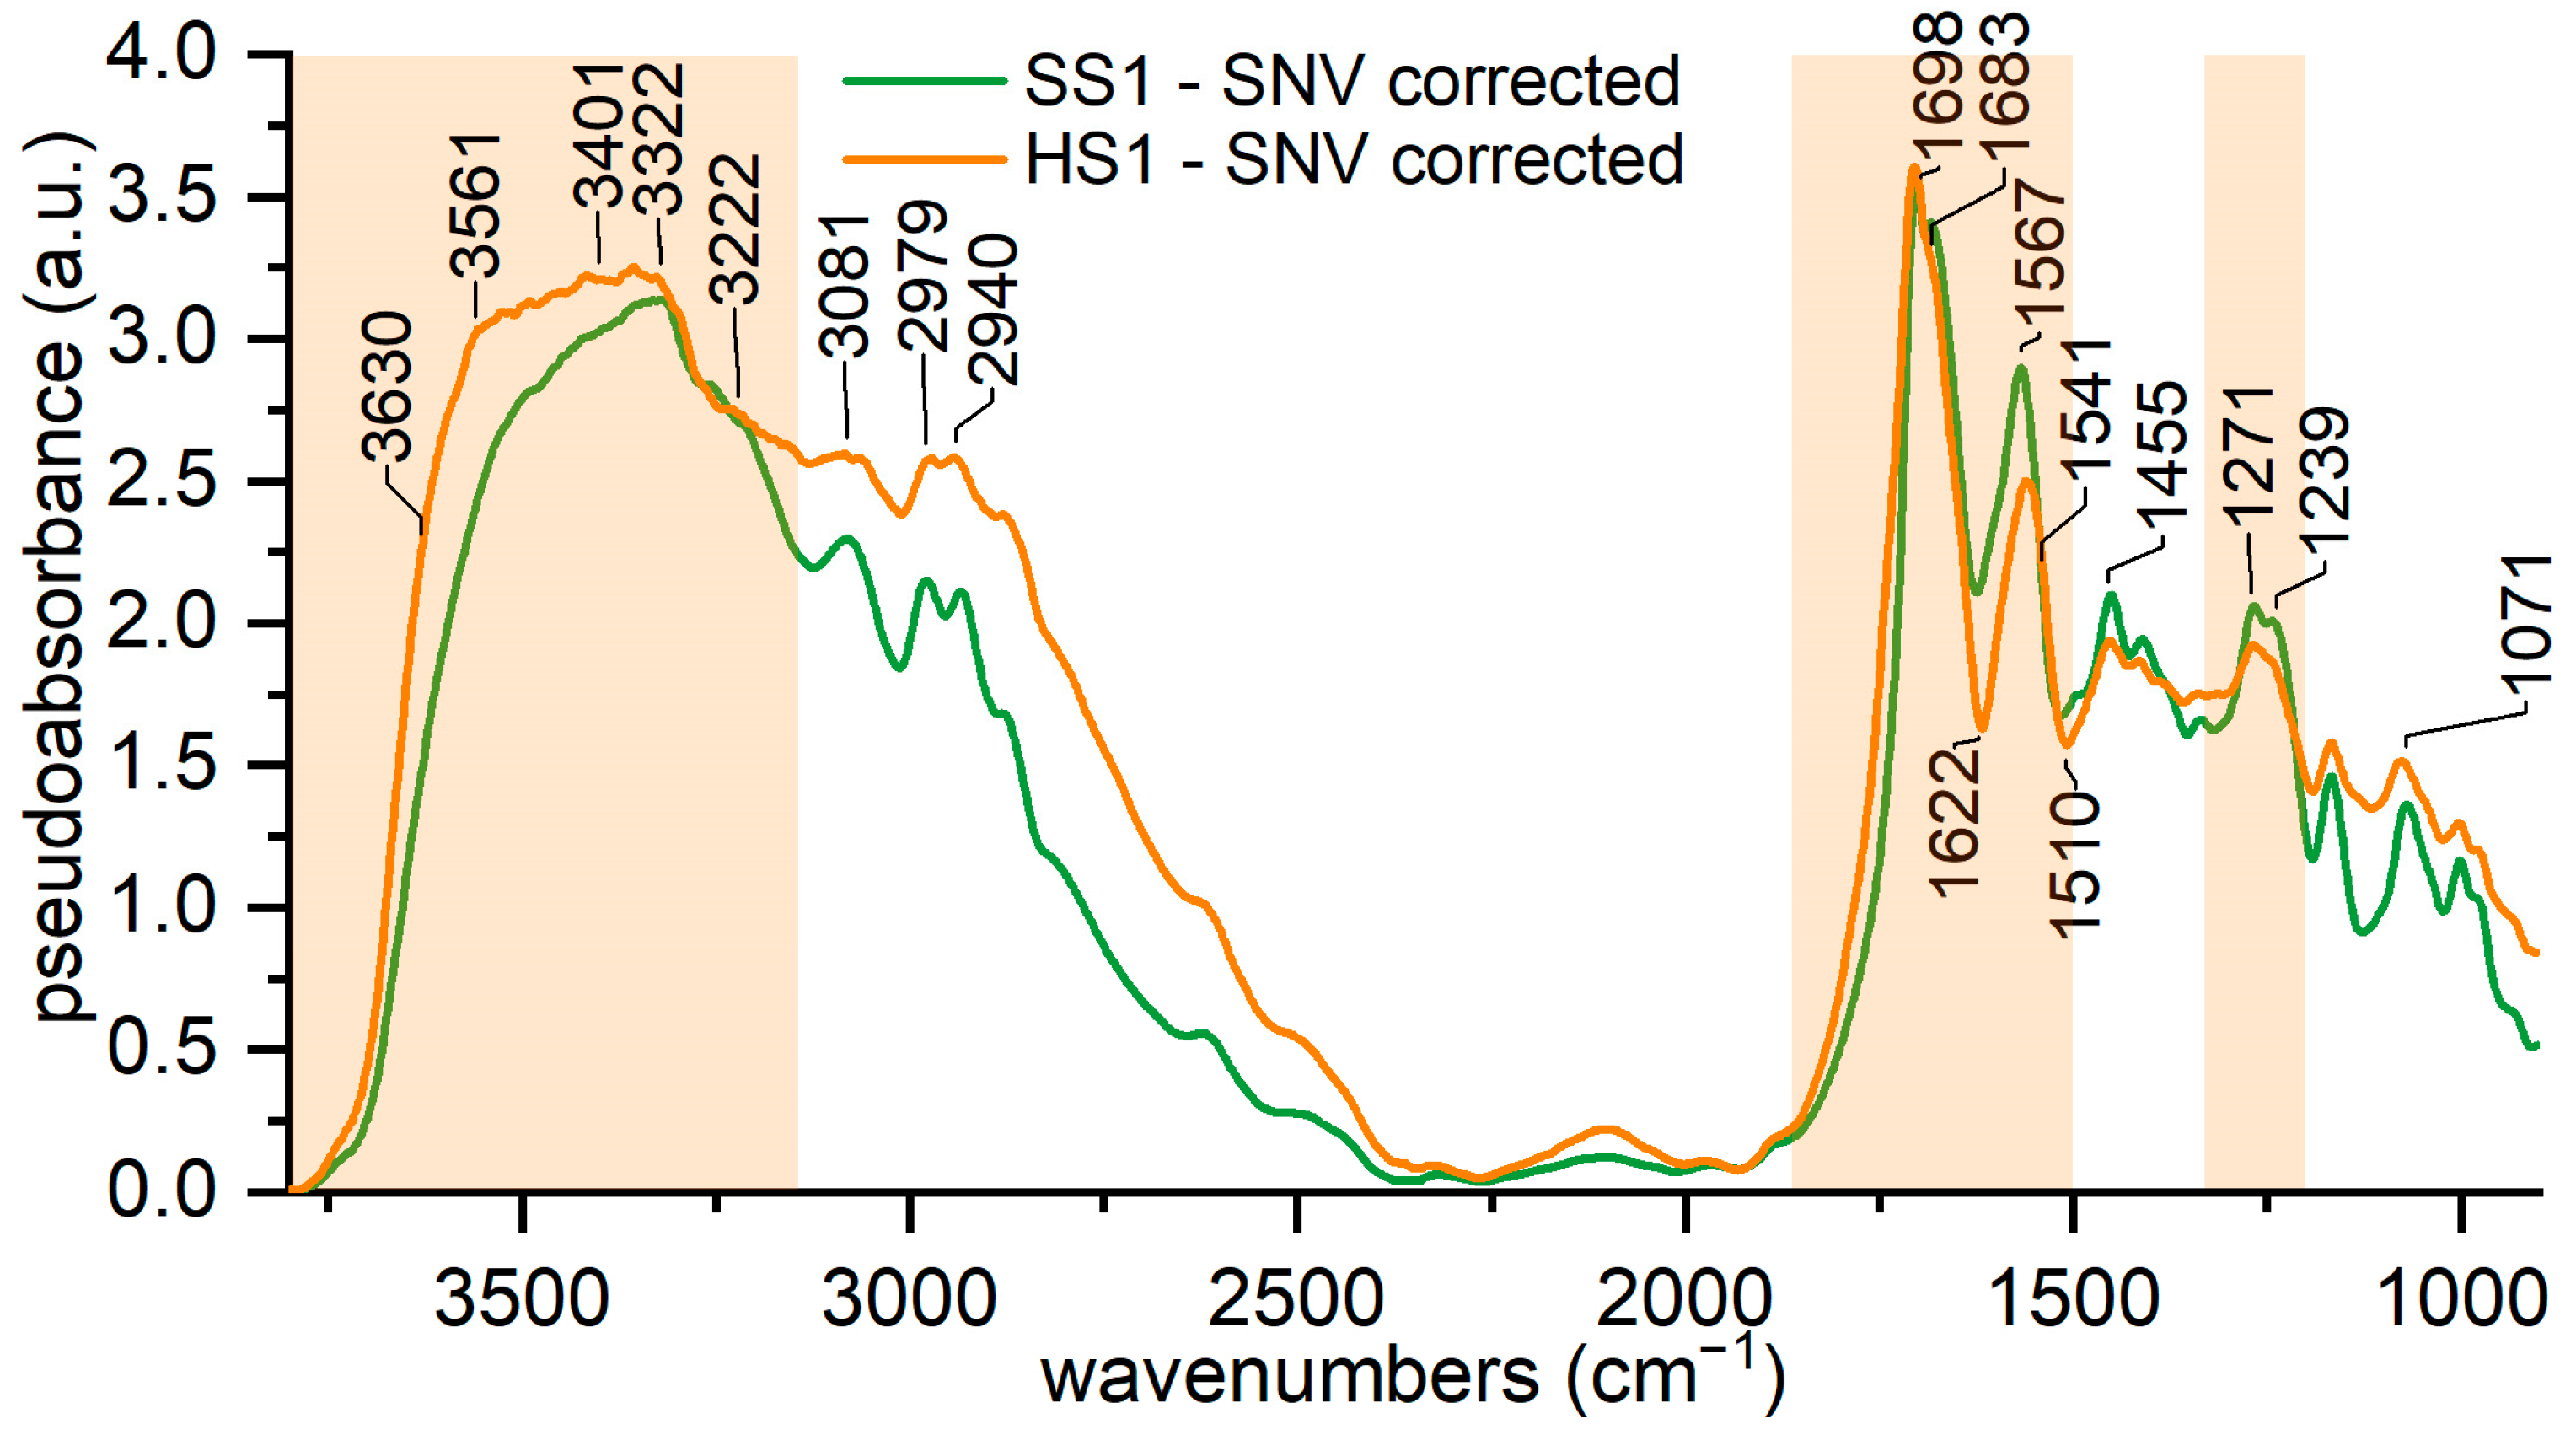
3.3. Characterization of Hard and Soft Silk
3.4. Characterization of Silk in Traditional Japanese Armors
4. Conclusions
Supplementary Materials
Author Contributions
Funding
Institutional Review Board Statement
Informed Consent Statement
Data Availability Statement
Conflicts of Interest
Appendix A
References
- Garside, P. The Role of Fibre Identification in Textile Conservation. In Identification of Textile Fibers; Houck, M.M., Ed.; Cambridge-Woodhead Publishing: Boca Raton, FL, USA, 2009; pp. 335–365. ISBN 9781845692667. [Google Scholar]
- Garside, P.; Lahlil, S.; Wyeth, P. Characterization of Historic Silk by Polarized Attenuated Total Reflectance Fourier Transform Infrared Spectroscopy for Informed Conservation. Appl. Spectrosc. 2005, 59, 1242–1247. [Google Scholar] [CrossRef]
- Desrosiers, S. Scrutinizing Raw Material between China and Italy: The Various Processing Sequences of Bombyx Mori Silk. Available online: https://journals.openedition.org/acrh/10323 (accessed on 14 July 2022).
- Silva, A.S.; Costa, E.C.; Reis, S.; Spencer, C.; Calhelha, R.C.; Miguel, S.P.; Ribeiro, M.P.; Barros, L.; Vaz, J.A.; Coutinho, P. Silk Sericin: A Promising Sustainable Biomaterial for Biomedical and Pharmaceutical Applications. Polymers 2022, 14, 4931. [Google Scholar] [CrossRef] [PubMed]
- Cao, T.T.; Zhang, Y.Q. Processing and Characterization of Silk Sericin from Bombyx Mori and Its Application in Biomaterials and Biomedicines. Mater. Sci. Eng. C 2016, 61, 940–952. [Google Scholar] [CrossRef] [PubMed]
- Zhang, X.; van den Berghe, I.; Wyeth, P. Heat and Moisture Promoted Deterioration of Raw Silk Estimated by Amino Acid Analysis. J. Cult. Herit. 2011, 12, 408–411. [Google Scholar] [CrossRef]
- Timar-Balazsy, A.; Eastop, D. Materials. In Chemical Principles in Textile Conservation; Routledge: New York, NY, USA, 1998; pp. 3–66. [Google Scholar]
- Becker, M.A.; Willman, P.; Tuross, N.C. The U.S. First Ladies Gowns: A Biochemical Study of Silk Preservation. J. Am. Inst. Conserv. 1995, 34, 141–152. [Google Scholar] [CrossRef]
- van Assche, A. Avvolti Nel Mito, Tessuti e Costumi Tra Settecento e Novecento. Dalla Collezione Montgomery; Ideart: Milano, Italy, 2005. [Google Scholar]
- Civita, F. Le Sete e Le Lacche Vanno in Battaglia: Le Armature Giapponesi. In Il Samurai. Da Guerriero a Icona; Luraschi, M., Ed.; Silvana Editoriale: Cinisello Balsamo, Italy, 2018; pp. 80–87. [Google Scholar]
- Becker, M.A.; Magoshi, Y.; Sakai, T.; Tuross, N.C. Chemical and Physical Properties of Old Silk Fabrics. Stud. Conserv. 1997, 42, 27–37. [Google Scholar]
- Kaur, J.; Rajkhowa, R.; Tsuzuki, T.; Millington, K.; Zhang, J.; Wang, X. Photoprotection by Silk Cocoons. Biomacromolecules 2013, 14, 3660–3667. [Google Scholar] [CrossRef]
- Zhang, X.; Wyeth, P. Performance Measurement of Sericin-Coated Silks during Aging. Sci. China Chem. 2011, 54, 1011–1016. [Google Scholar] [CrossRef]
- Luxford, N.; Thickett, D.; Wyeth, P. Applying Preventive Conservation Recommendations for Silk in Historic Houses. In Proceedings of the Multidisciplinary Conservation: A Holistic View for Historic Interiors. Joint Interim Meeting of Five ICOM-CC Working Groups; ICOM-CC: Rome, Italy, 2010. [Google Scholar]
- Liu, X.; Zhang, K.-Q. Silk Fiber—Molecular Formation Mechanism, Structure- Property Relationship and Advanced Applications. In Oligomerization of Chemical and Biological Compounds; Lesieur, C., Ed.; IntechOpen: London, UK, 2014; pp. 69–102. [Google Scholar]
- Padaki, N.V.; Das, B.; Basu, A. Advances in Understanding the Properties of Silk; Elsevier Ltd.: Amsterdam, The Netherlands, 2015; ISBN 9781782423249. [Google Scholar]
- Gupta, D.; Agrawal, A.; Rangi, A. Extraction and Characterization of Silk Sericin. Indian J. Fibre. Text Res. 2014, 39, 364–372. [Google Scholar]
- Zhang, X.M.; Wyeth, P. Using FTIR Spectroscopy to Detect Sericin on Historic Silk. Sci. China Chem. 2010, 53, 626–631. [Google Scholar] [CrossRef]
- Vilaplana, F.; Nilsson, J.; Sommer, D.V.P.; Karlsson, S. Analytical Markers for Silk Degradation: Comparing Historic Silk and Silk Artificially Aged in Different Environments. Anal. Bioanal. Chem. 2015, 407, 1433–1449. [Google Scholar] [CrossRef] [Green Version]
- Akyuz, S.; Akyuz, T.; Cakan, B.; Basaran, S. Investigations of the Historic Textiles Excavated from Ancient Ainos (Enez-Turkey) by Multiple Analytical Techniques Dedicated to Professor Simion Simon. J. Mol. Struct. 2014, 1073, 37–43. [Google Scholar] [CrossRef]
- Asai, M.; Tsuboi, M.; Shimanouchi, T. Infrared Spectra of Polypeptides and Related Compounds. J. Phys. Chem. 1964, 59, 322–325. [Google Scholar] [CrossRef]
- Miyazawa, T.; Blout, E.R. The Infrared Spectra of Polypeptides in Various Conformations: Amide I and II Bands. J. Am. Chem. Soc. 1961, 83, 712–719. [Google Scholar] [CrossRef]
- Grdadolnik, J. Atr-ftir spectroscopy: Its advantages and limitations. Acta Chim. Slov. 2002, 49, 631–642. [Google Scholar]
- Nodari, L.; Ricciardi, P. Non-Invasive Identification of Paint Binders in Illuminated Manuscripts by ER-FTIR Spectroscopy: A Systematic Study of the Influence of Different Pigments on the Binders’ Characteristic Spectral Features. Herit. Sci. 2019, 7, 7. [Google Scholar] [CrossRef]
- Boulet-Audet, M.; Vollrath, F.; Holland, C. Identification and Classification of Silks Using Infrared Spectroscopy. J. Exp. Biol. 2015, 218, 3138–3149. [Google Scholar] [CrossRef] [PubMed] [Green Version]
- Shao, J.; Zheng, J.; Liu, J.; Carr, C.M. Fourier Transform Raman and Fourier Transform Infrared Spectroscopy Studies of Silk Fibroin. J. Appl. Polym. Sci. 2005, 96, 1999–2004. [Google Scholar] [CrossRef]
- van Nimmen, E.; de Clerck, K.; Verschuren, J.; Gellynck, K.; Gheysens, T.; Mertens, J.; van Langenhove, L. FT-IR Spectroscopy of Spider and Silkworm Silks. Part I. Different Sampling Techniques. Vib. Spectrosc. 2008, 46, 63–68. [Google Scholar] [CrossRef]
- Carissimi, G.; Baronio, C.M.; Montalbán, M.G.; Víllora, G.; Barth, A. On the Secondary Structure of Silk Fibroin Nanoparticles Obtained Using Ionic Liquids: An Infrared Spectroscopy Study. Polymers 2020, 12, 1294. [Google Scholar] [CrossRef] [PubMed]
- Koperska, M.A.; Pawcenis, D.; Bagniuk, J.; Zaitz, M.M.; Missori, M.; Łojewski, T.; Łojewska, J. Degradation Markers of Fibroin in Silk through Infrared Spectroscopy. Polym. Degrad. Stab. 2014, 105, 185–196. [Google Scholar] [CrossRef]
- Teramoto, H.; Miyazawa, M. Molecular Orientation Behavior of Silk Sericin Film as Revealed by ATR Infrared Spectroscopy. Biomacromolecules 2005, 6, 2049–2057. [Google Scholar] [CrossRef]
- Teramoto, H.; Miyazawa, M. Analysis of Structural Properties and Formation of Sericin Fiber by Infrared Spectroscopy. J. Insect. Biotechnol. Sericology 2003, 72, 157–162. [Google Scholar]
- Geminiani, L.; Campione, F.P.; Corti, C.; Luraschi, M.; Mo, S.; Recchia, S.; Rampazzi, L. Differentiating Natural and Modified Cellulosic Fibres by ATR- FTIR Spectroscopy. Heritage 2022, 5, 4114–4139. [Google Scholar] [CrossRef]
- Akyuz, S. Investigation of the Degradation Stages of Archaeological and Historical Silk Textiles: An ATR-FTIR Spectroscopic Study. Archaeol. Anthropol. Sci. 2019, 3, AAOA.000573. [Google Scholar] [CrossRef]
- Gorassini, A.; Adami, G.; Calvini, P.; Giacomello, A. ATR-FTIR Characterization of Old Pressure Sensitive Adhesive Tapes in Historic Papers. J. Cult. Herit. 2016, 21, 775–785. [Google Scholar] [CrossRef]
- Vahur, S.; Teearu, A.; Peets, P.; Joosu, L.; Leito, I. ATR-FT-IR Spectral Collection of Conservation Materials in the Extended Region of 4000-80 Cm-1. Anal. Bioanal. Chem. 2016, 408, 3373–3379. [Google Scholar] [CrossRef] [PubMed]
- Coletti, F.; Romani, M.; Ceres, G.; Zammit, U.; Guidi, M.C. Evaluation of Microscopy Techniques and ATR-FTIR Spectroscopy on Textile Fibers from the Vesuvian Area: A Pilot Study on Degradation Processes That Prevent the Characterization of Bast Fibers. J. Archaeol. Sci. Rep. 2021, 36, 102794. [Google Scholar] [CrossRef]
- Brunello, V.; Corti, C.; Sansonetti, A.; Tedeschi, C.; Rampazzi, L. Non-Invasive FTIR Study of Mortar Model Samples: Comparison among Innovative and Traditional Techniques. Eur. Phys. J. Plus 2019, 134, 270. [Google Scholar] [CrossRef]
- Rampazzi, L.; Brunello, V.; Corti, C.; Lissoni, E. Non-Invasive Techniques for Revealing the Palette of the Romantic Painter Francesco Hayez. Spectrochim. Acta A Mol. Biomol. Spectrosc. 2017, 176, 142–154. [Google Scholar] [CrossRef]
- Rampazzi, L.; Brunello, V.; Campione, F.P.; Corti, C.; Geminiani, L.; Recchia, S.; Luraschi, M. Non-Invasive Identification of Pigments in Japanese Coloured Photographs. Microchem. J. 2020, 157, 36–42. [Google Scholar] [CrossRef]
- Miliani, C.; Rosi, F.; Daveri, A.; Brunetti, B.G. Reflection Infrared Spectroscopy for the Non-Invasive in Situ Study of Artists’ Pigments. Appl. Phys. A Mater. Sci. Process. 2012, 106, 295–307. [Google Scholar] [CrossRef]
- Peets, P.; Kaupmees, K.; Vahur, S.; Leito, I. Reflectance FT-IR Spectroscopy as a Viable Option for Textile Fiber Identification. Herit. Sci. 2019, 7, 93. [Google Scholar] [CrossRef]
- Margariti, C. The Application of FTIR Microspectroscopy in a Non-Invasive and Non-Destructive Way to the Study and Conservation of Mineralised Excavated Textiles. Herit. Sci. 2019, 7, 63. [Google Scholar] [CrossRef] [Green Version]
- Delaney, J.K.; Ricciardi, P.; Glinsman, L.; Palmer, M.; Burke, J. Use of near Infrared Reflectance Imaging Spectroscopy to Map Wool and Silk Fibres in Historic Tapestries. Anal. Methods 2016, 8, 7886–7890. [Google Scholar] [CrossRef]
- Zhou, C.; Han, G.; Via, B.K.; Song, Y.; Gao, S.; Jiang, W. Rapid Identification of Fibers from Different Waste Fabrics Using the Near-Infrared Spectroscopy Technique. Text. Res. J. 2019, 89, 3610–3616. [Google Scholar] [CrossRef]
- Cleve, E.; Bach, E.; Schollmeyer, E. Using Chemometric Methods and NIR Spectrophotometry in the Textile Industry. Anal. Chim. Acta 2000, 420, 163–167. [Google Scholar] [CrossRef]
- Richardson, E.; Garside, P. The Use of near Infrared Spectroscopy as a Diagnostic Tool for Historic Silk Artefacts. E-Preserv. Sci. 2009, 6, 68–74. [Google Scholar]
- Zhang, X.; Wyeth, P. Moisture Sorption as a Potential Condition Marker for Historic Silks: Noninvasive Determination by near-Infrared Spectroscopy. Appl. Spectrosc. 2007, 61, 218–222. [Google Scholar] [CrossRef] [PubMed] [Green Version]
- Mossotti, R.; Innocenti, R.; Zoccola, M.; Anghileri, A.; Freddi, G. The Degumming of Silk Fabrics: A Preliminary near Infrared Spectroscopy Study. J. Near Infrared Spectrosc. 2006, 14, 201–208. [Google Scholar] [CrossRef]
- Menges, F. Spectragryph—Optical Spectroscopy Software, Version 1.2.16. 2021. Available online: http://www.effemm2.de/spectragryph/ (accessed on 30 December 2022).
- Barnes, R.J.; Dhanoa, M.S.; Lister, S.J. Standard Normal Variate Transformation and De-Trending of near-Infrared Diffuse Reflectance Spectra. Appl. Spectrosc. 1989, 43, 772–777. [Google Scholar] [CrossRef]
- Bramanti, E.; Benedetti, E. Determination of the Secondary Structure of Isomeric Forms of Human Serum Albumin by a Particular Frequency Deconvolution Procedure Applied to Fourier Transform; John Wiley & Sons, Inc: Hoboken, NJ, USA, 1996; Volume 38. [Google Scholar]
- Badillo-Sanchez, D.; Chelazzi, D.; Giorgi, R.; Cincinelli, A.; Baglioni, P. Characterization of the Secondary Structure of Degummed Bombyx Mori Silk in Modern and Historical Samples. Polym. Degrad. Stab. 2018, 157, 53–62. [Google Scholar] [CrossRef]
- Barth, A.; Zscherp, C. What Vibrations Tell Us about Proteins. Q. Rev. Biophys. 2002, 35, 369–430. [Google Scholar] [CrossRef] [PubMed]
- Barth, A. Infrared Spectroscopy of Proteins. Biochim. Biophys. Acta Bioenerg. 2007, 1767, 1073–1101. [Google Scholar] [CrossRef] [PubMed] [Green Version]
- de Meutter, J.; Goormaghtigh, E. Amino Acid Side Chain Contribution to Protein FTIR Spectra: Impact on Secondary Structure Evaluation. Eur. Biophys. J. 2021, 50, 641–651. [Google Scholar] [CrossRef] [PubMed]
- Hernández, B.; Pflüger, F.; Adenier, A.; Kruglik, S.G.; Ghomi, M. Vibrational Analysis of Amino Acids and Short Peptides in Hydrated Media. VIII. Amino Acids with Aromatic Side Chains: L-Phenylalanine, l-Tyrosine, and l-Tryptophan. J. Phys. Chem. B 2010, 114, 15319–15330. [Google Scholar] [CrossRef] [PubMed]
- Tanaka, M.; Hayashi, T.; Morita, S. The Roles of Water Molecules at the Biointerface of Medical Polymers. Polym. J. 2013, 45, 701–710. [Google Scholar] [CrossRef]
- Morita, S.; Tanaka, M.; Ozaki, Y. Time-Resolved in Situ ATR-IR Observations of the Process of Sorption of Water into a Poly(2-Methoxyethyl Acrylate) Film. Langmuir 2007, 23, 3750–3761. [Google Scholar] [CrossRef] [PubMed]
- Vasylieva, A.; Doroshenko, I.; Vaskivskyi, Y.; Chernolevska, Y.; Pogorelov, V. FTIR Study of Condensed Water Structure. J. Mol. Struct. 2018, 1167, 232–238. [Google Scholar] [CrossRef]
- Maeda, Y.; Ide, M.; Kitano, H. Vibrational Spectroscopic Study on the Structure of Water in Polymer Systems. J. Mol. Liq. 1999, 80, 149–163. [Google Scholar] [CrossRef]
- Jin, Y.; Wang, W.; Su, Z. Spectroscopic Study on Water Diffusion in Aromatic Polyamide Thin Film. J. Memb. Sci. 2011, 379, 121–130. [Google Scholar] [CrossRef]
- Ling, S.; Qi, Z.; Knight, D.P.; Shao, Z.; Chen, X. Synchrotron FTIR Microspectroscopy of Single Natural Silk Fibers. Biomacromolecules 2011, 12, 3344–3349. [Google Scholar] [CrossRef]
- Yoshimizu, H.; Asakura, T. The Structure of Bombyx Mori Silk Fibroin Membrane Swollen by Water Studied with ESR, 13C-NMR, and FT-IR Spectroscopies. J. Appl. Polym. Sci. 1990, 40, 1745–1756. [Google Scholar] [CrossRef]
- Chong, S.H.; Ham, S. Dynamics of Hydration Water Plays a Key Role in Determining the Binding Thermodynamics of Protein Complexes. Sci. Rep. 2017, 7, 8744. [Google Scholar] [CrossRef] [PubMed] [Green Version]
- Chen, F.; Porter, D.; Vollrath, F. Silk Cocoon (Bombyx Mori): Multi-Layer Structure and Mechanical Properties. Acta Biomater. 2012, 8, 2620–2627. [Google Scholar] [CrossRef]
- Célino, A.; Gonçalves, O.; Jacquemin, F.; Fréour, S. Qualitative and Quantitative Assessment of Water Sorption in Natural Fibres Using ATR-FTIR Spectroscopy. Carbohydr. Polym. 2014, 101, 163–170. [Google Scholar] [CrossRef] [Green Version]
- Morita, S.; Kitagawa, K.; Ozaki, Y. Hydrogen-Bond Structures in Poly(2-Hydroxyethyl Methacrylate): Infrared Spectroscopy and Quantum Chemical Calculations with Model Compounds. Vib. Spectrosc. 2009, 51, 28–33. [Google Scholar] [CrossRef]
- Cheng, Y.; Koh, L.D.; Li, D.; Ji, B.; Han, M.Y.; Zhang, Y.W. On the Strength of β-Sheet Crystallites of Bombyx Mori Silk Fibroin. J. R. Soc. Interface 2014, 11, 20140305. [Google Scholar] [CrossRef] [PubMed] [Green Version]
- Lucas, F.; Smith, S.G. 43—The Moisture Sorption of the Silk of Bombyx Mori in Relation to the Proportion and Chemical Composition of the Crystalline and Amorphous Phases. J. Text. Inst. Trans. 1959, 50, T695–T700. [Google Scholar] [CrossRef]
- Kuhn, L.A.; Siani, M.A.; Pique, M.E.; Fisher, C.L.; Getzoff, E.D.; Tainer, J.A. The Interdependence of Protein Surface Topography and Bound Water Molecules Revealed by Surface Accessibility and Fractal Density Measures. J. Mol. Biol. 1992, 228, 13–22. [Google Scholar] [CrossRef]
- Myshakina, N.S.; Ahmed, Z.; Asher, S.A. Dependence of Amide Vibrations on Hydrogen Bonding. J. Phys. Chem. B 2008, 112, 11873–11877. [Google Scholar] [CrossRef] [Green Version]
- Moore, W.H.; Krimm, S. Vibrational Analysis of Peptides, Polypeptides, and Proteins. II. Β-Poly(L-alanine) and Β-poly(L-alanylglycine). Biopolymers 1976, 15, 2465–2483. [Google Scholar] [CrossRef] [PubMed] [Green Version]
- Zhang, S.; Ma, J. Study on the Unsaturated Hydrogen Bond Behavior Abstract: Let F Denote a Field and Let V Denote a Vector Space over F with Finite Positi of Bio-Based Polyamide 56. e-Polymers 2019, 19, 23–31. [Google Scholar] [CrossRef]
- Manas, E.S.; Getahun, Z.; Wright, W.W.; DeGrado, W.F.; Vanderkooi, J.M. Infrared Spectra of Amide Groups in α-Helical Proteins: Evidence for Hydrogen Bonding between Helices and Water. J. Am. Chem. Soc. 2000, 122, 9883–9890. [Google Scholar] [CrossRef]
- Wang, J.; Sowa, M.G.; Ahmed, M.K.; Mantsch, H.H. Photoacoustic near-infrared investigation of homo-polypeptides. J. Phys. Chem. 1994, 98, 4748–4755. [Google Scholar] [CrossRef]
- Mo, C.; Wu, P.; Chen, X.; Shao, Z. The Effect of Water on the Conformation Transition of Bombyx Mori Silk Fibroin. Vib. Spectrosc. 2009, 51, 105–109. [Google Scholar] [CrossRef]
- Fukuda, M.; Miyagawa, M. Fundamental Studies on the Interactions between Moisture and Textiles V. FT-IR Study on the Moisture Sorption Isotherm of Nylon 6. Polym. J. 1987, 19, 785–804. [Google Scholar] [CrossRef] [Green Version]
- Bro, R.; Smilde, A.K. Principal Component Analysis. Anal. Methods 2014, 6, 2812–2831. [Google Scholar] [CrossRef] [Green Version]


2017.Mor.1 | Sample | Dating | 2017.Mor.2 | Sample | Dating |
| 1_2 | Late 16th c. | 2_2 | Late 19th c. | ||
| 1_6 | Late 16th c. | 2_3 | Late 19th c. | ||
| 1_8 | Late 16th c. | ||||
| 1_9 | Late 16th c. | ||||
| 1_26 | Late 16th c. | ||||
2017.Mor.3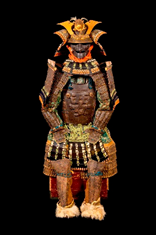 | Sample | Dating | 2017.Mor.4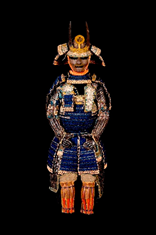 | Sample | Dating |
| 3_3 | 17th c. | 4_2 | 18th c. | ||
| 3_4 | 17th c. | 4_3 | 18th c. | ||
| 3_8 | 17th c. | 4_4 | 18th c. | ||
| 3_10 | 17th c. | 4_11 | 18th c. | ||
| 3_11 | 17th c. | 4_13 | 18th c. | ||
| 3_12 | 17th c. | ||||
| 3_18 | 17th c. | ||||
| 3_23 | Late 16th c. | ||||
2017.Mor.5 | Sample | Dating | 2017.Mor.7 | Sample | Dating |
| 5_1 | After 1926 | 7_4 | 17th c. | ||
| 5_2 | After 1926 | 7_8 | 17th c. | ||
| 5_9 | After 1926 | ||||
2017.Mor.8 | Sample | Dating | 2017.Mor.9 | Sample | Dating |
| 8_4 | 17th c. | 9_5 | Late 19th c. | ||
| 8_7 | 17th c. | 9_6 | Late 19th c. | ||
| 8_12 | Early 16th c. | 9_17 | Late 19th c. | ||
| 8_18 | Early 16th c. | ||||
| Peak | 1 | 2 | 3 | 4 | 5 | 6 | 7 | 8 | 9 |
|---|---|---|---|---|---|---|---|---|---|
| Centre (cm−1) | 3630 | 3560 | 3400 | 3320 | 3220 | 3060 | 2977 | 2931 | 2875 |
| Centre bounds (cm−1) | ±15 | ±15 | ±30 | ±15 | ±30 | ±5 | ±5 | ±5 | ±5 |
| FWHH bounds (cm−1) | 0–200 | 0–200 | 0–200 | 0–80 | 0–350 | 0–80 | 0–50 | 0–50 | 0–50 |
| ER-FTIR (cm−1) | ATR-FTIR (cm−1) | ATR-FTIR Band Assignment |
|---|---|---|
| ~3630 | 3630 | Free OH (water dimers) [54] |
| ~3560 | 3500 (sh) | Non-freezing water (O-H---O=C) [57,58] |
| ~3400 | 3420 (sh) | Freezing bound water (O-H---polar groups) [57,58,59] |
| 3320 | 3274 | Amide A, N-H stretching [18,42] |
| 3220 | 3220 | O-H stretching, bulk water (---OH---OH---OH---) [59,60,61] |
| 3080 | 3080 | Amide B, N-H stretching [54] |
| 1698 (inv) | 1698 (sh) | ν(C=O) amide I bond, β-sheets [25,29] |
| 1682 | 1675 (sh) | Amide I, β-turn [25,29] |
| 1650 | 1650 | Amide I, α-helix/random coil [25,29] |
| 1627–17 (inv) | 1628–1621 | Amide I, intermolecular β-sheets [25,29] |
| 1621–1616 | Aggregated β-strand/intermolecular β-sheet | |
| 1567 | 1555 | Amide II, β-sheets [25,29] |
| 1541 | 1545 | Amide II, α-helix/random coil [25,29] |
| 1508 (inv) | 1515 | Amide II, β-sheets [25,29] |
| 1453 | 1440 | CH2, CH3 bending in alanine [25,29] |
| 1270 | 1260 | Amide III, β-sheets [62,63] |
| 1238 | 1230 | Amide III, α-helix/random coil [62,63] |
| Wavenumber (cm−1) | Assignment [47,48,75,76] |
|---|---|
| 7500–6000 | Water, first overtone |
| 5900–5700 | ν(CH), first overtone |
| 5170 | O-H combination |
| 4860 | Amide A ν(NH) + amide I/amide II |
| 4620 | Amide A ν(NH) + amide III/amide B + amide II |
| 4534 | Amide A ν(NH) + amide III/amide B + amide II |
| 4420 | ν + δ(CH) |
| 4358 | ν + δ(CH) |
| 4205 | ν + δ(CH) |
Disclaimer/Publisher’s Note: The statements, opinions and data contained in all publications are solely those of the individual author(s) and contributor(s) and not of MDPI and/or the editor(s). MDPI and/or the editor(s) disclaim responsibility for any injury to people or property resulting from any ideas, methods, instructions or products referred to in the content. |
© 2023 by the authors. Licensee MDPI, Basel, Switzerland. This article is an open access article distributed under the terms and conditions of the Creative Commons Attribution (CC BY) license (https://creativecommons.org/licenses/by/4.0/).
Share and Cite
Geminiani, L.; Campione, F.P.; Canevali, C.; Corti, C.; Giussani, B.; Gorla, G.; Luraschi, M.; Recchia, S.; Rampazzi, L. Historical Silk: A Novel Method to Evaluate Degumming with Non-Invasive Infrared Spectroscopy and Spectral Deconvolution. Materials 2023, 16, 1819. https://doi.org/10.3390/ma16051819
Geminiani L, Campione FP, Canevali C, Corti C, Giussani B, Gorla G, Luraschi M, Recchia S, Rampazzi L. Historical Silk: A Novel Method to Evaluate Degumming with Non-Invasive Infrared Spectroscopy and Spectral Deconvolution. Materials. 2023; 16(5):1819. https://doi.org/10.3390/ma16051819
Chicago/Turabian StyleGeminiani, Ludovico, Francesco Paolo Campione, Carmen Canevali, Cristina Corti, Barbara Giussani, Giulia Gorla, Moira Luraschi, Sandro Recchia, and Laura Rampazzi. 2023. "Historical Silk: A Novel Method to Evaluate Degumming with Non-Invasive Infrared Spectroscopy and Spectral Deconvolution" Materials 16, no. 5: 1819. https://doi.org/10.3390/ma16051819