3.1. Zeolite Physicochemical Characteristics
The main physical properties of the micronized and thermally treated zeolitic tuff samples in terms of the total surface area, total pore volume, and average pore radius are presented in
Table 2.
The total surface area determined by the BET method in the Chilioara samples was 73 m
2 g
−1 in CS100 and 72 m
2 g
−1 in CS40, while the total pore volume was 0.187 cm
3 g
−1 in CS100, and 0.160 cm
3 g
−1 in CS40, respectively. The average pore radius was 27 Å in both the CS100 and CS40 samples. In the samples from Valea Pomilor, the total surface area was smaller by about 25% than the samples from Chilioara: 55 m
2 g
−1 in VP100 and 53 m
2 g
−1 in VP40. Additionally, the total pore volume was approximately 30% smaller than the Chilioara samples, namely 0.119 cm
3 g
−1 in VP100 and 0.114 cm
3 g
−1 in VP40. The average pore radius was 31 Å in both the VP40 and VP100 samples. Since the pore radius is less than 50 nm and in accordance with the classification established by the International Union of Pure and Applied Chemistry (IUPAC) [
33], all samples have mesoporous structures.
The total surface area was slightly reduced in the samples with grain sizes < 40 µm compared to the samples with grain sizes < 100 µm; a possible explanation could be that the surface area of porous materials is divided into the external and internal specific surface areas and even thought by advanced grinding the external surface area growths, the internal surface area which has the most significant contribution to the total surface area remains almost unchanged [
33,
34]. The surface area and total pore volume are linked with the adsorption process and offer spaces for retention [
35,
36]. Therefore, according to the obtained results, the zeolitic samples from Chilioara should offer more places to retain different substances from the filtered liquids.
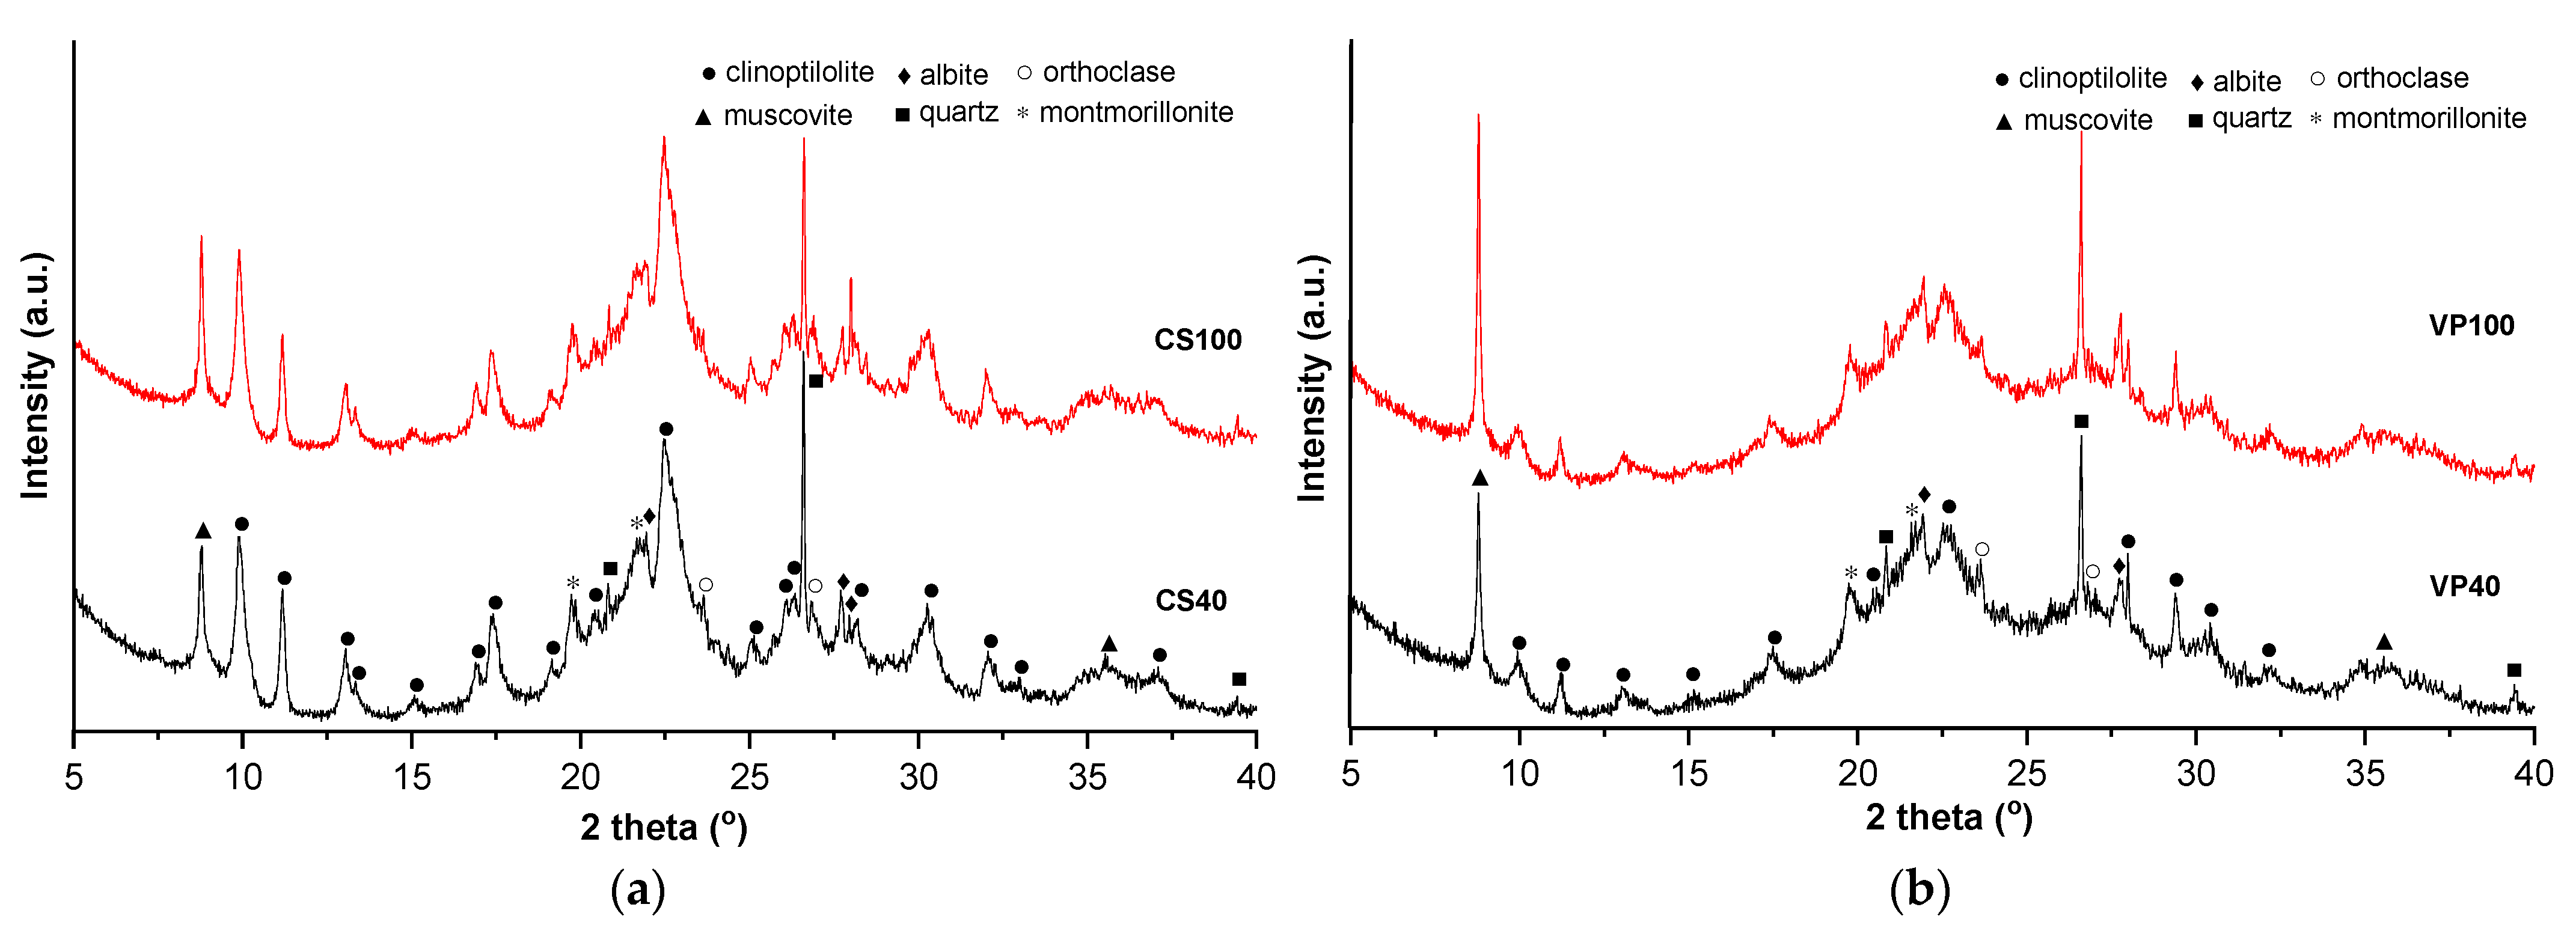
The XRD patterns of the zeolitic tuffs show the presence of K-clinoptilolite (PDF 01-080-1557) as the main phase, attended by muscovite (PDF 00-060-1516), albite (PDF 00-020-0548), orthoclase (PDF 00-031-0966), quartz (PDF 01-070-7344), and montmorillonite (PDF 00-058-0548) (
Figure 4). The XRD pattern displays the characteristic peaks of the clinoptilolite zeolite structure (2θ at around 10, 25, 26, 30, and 32°) [
19]. The RIR (reference intensity ratio) method was used for the quantitative phase analysis, indicating a clinoptilolite content of 60–65% for CS and 35–40% for the VP samples, respectively. The degree of crystallinity is similar at <100 and <40 µm in both cases but significantly higher for CS (approximately 65%) when compared to VP (approximately 5%) samples. The occurrence of amorphous volcanic glass in the zeolitic tuffs is indicated by the broad hump centered near 25° (2θ) [
37].
The chemical composition, in terms of the major oxides and inorganic components, pH, exchangeable cations, and total exchange capacity of the four samples (CS100, CS40, VP100, VP40) thermally treated at 450 °C, are presented in
Table 3.
According to the SiO
2/Al
2O
3 ratio, the zeolitic tuffs from Chilioara and Valea Pomilor are in the group of super silicic materials [
38]. The grain sizes do not significantly influence the chemical composition of the filtering materials obtained from the same quarry. The samples from Valea Pomilor generally contain higher amounts of Na and K than those from Chilioara, while the contents of the other major constituents (Si, Al, Ca, and Mg) are comparable. Mostly, the content of the trace and ultra-trace elements (Fe, Mn, Cr, Cu, Co, Ni, Pb, and Zn) are higher in the samples from Valea Pomilor than in those from Chilioara, while the concentrations of As and Cd are below the corresponding limits of quantification in all the samples.
The cation exchange capacity (CEC), calculated as the sum of the exchangeable concentrations of the major cations (K+, Na+, Ca2+, and Mg2+) extracted from the 1 M ammonium acetate solution, was higher in the samples from the Chilioara quarry, mainly because of the lower exchangeability of Ca2+ in the VP40 and VP100 samples. In all the samples, the main contribution to the total CEC was represented by Ca2+, followed by K+ (about 18 meq 100 g−1), while Na+ and Mg2+ had minor contributions. Since the total concentrations of Na+, K+, Ca2+, and Mg2+ measured by acid digestion were generally higher in the samples from Valea Pomilor, the lower CEC values could be explained by the different mobility of these cations from the two sources. In the samples from Chilioara, the percent of exchangeable Ca2+ was in the range of 87–98% of the total content, the percent of exchangeable K+ was approximately 35% of the total content, and the percent of exchangeable Na+ was about 23%, while about 12–15% of total Mg2+ were exchangeable. In the samples from Valea Pomilor, the percent of exchangeable Ca2+ was in the range of 63–74% of the total content, the percent of exchangeable Na+ was approximately 47%, the percent of exchangeable K+ was approximately 36%, and only about 4–6% of Mg2+ were exchangeable. These results indicate which cations are exchangeable and can be involved in the exchange processes.
3.2. Main Physical-Chemical Characteristics of Filtered Beer from Laboratory Tests
Based on the laboratory tests and beer analysis, the influence of filtering material mixtures on the main parameters of the beer is presented in
Table 4. The filtration time generally increases when only zeolites are used to form the filter cakes. Additionally, using smaller particle sizes as filtering materials increases the filtration time. A variation from 16 min (when only rough-size kieselguhr DIF BO was used as the filter cake) to 28 min when mixtures of fine-size particles (<40 µm) and rough-size particles (<100 µm) zeolites were used to form the filter cake was recorded. According to the data for experiments E1–E3, the material used for beer dosage (CBL3, VP40, or CS40) does not significantly influence the filtration time.
The pH of the unfiltered beer was 4.20, and generally, this very slowly increased because of interaction with the filtering material. The highest pH value was measured in the beer filtered in experiment E16, in which the pH increased by 0.26 units, probably due to the release of some alkaline cations (Na
+, K
+) from the filtering material to the beer. On average, an increase in beer pH of 0.2 units was observed after filtration, but the beer pH remained in the acceptable range of pH 4.0–4.4 [
39].
The taste, specific smell, and color of beer are given by colloidal particles with sizes of 0.5–3 μm [
40]. Particles with higher diameters are significantly correlated with nephelometric haze values. Thus, to obtain a beer of satisfactory quality, it is necessary to maintain colloidal particles that provide the specific taste, smell, and color and to separate (by filtration) the larger particles that affect the beer turbidity and its long-term stability. According to the physical properties presented in
Table 2, the average pore radius value of the zeolites (27–31 Å) is much smaller than the colloids, which should be maintained in beer, and, consequently, the retention of these particles is avoided, while the large particles from beer (haze) can be retained on the external surface of filtering material.
In all the experiments, the taste and flavor of beer remained mainly unaffected by filtration (
Table 4). These parameters were evaluated by triangle testing, a sensory evaluation to blindly identify any differences between samples. Briefly, for each test, within the three samples presented to each assessor, two were similar. Particularly, for the beers filtered using only zeolites, the perception of the wort flavor of the beer was reduced, probably due to the removal of some aldehydes that resulted from beer fermentation. This sensory perception was also previously reported when zeolites were used as molecular sieves to remove the volatile flavor compounds or during wort fermentation [
22,
23,
24]. The beer color generally decreased in intensity from 14.1 EBC (amber) to a gold color (EBC value 8 to 12) in the beers filtered in most of the filtration experiments. The beers filtered in experiments E9, E14, E15, E20, and E21 had a yellow color (EBC value 6 to 8). As a particularity, in those experiments, only zeolites were used to obtain the filter cakes.
The European Brewery Convention recommends a standard haze for diatomaceous-earth-filtrated beer of less than 0.6 EBC units is recommended [
30,
41]. The turbidity of the unfiltered beer was 14.1 EBC units, which means a very hazy beer (EBC > 8.0). In our experimental conditions, the beer filtered using only DIF BO (rough-size kieselguhr) as the filter cake and CBL3 (fine-size kieselguhr) as the filtration dosage had the higher turbidity (1.51 EBC) in the scale of very slightly hazy (EBC 1.0–2.0). Additionally, the beers filtered in experiments E2, E3, E12, and E13 were slightly hazy (1.25 EBC, 1.12 BC, 1.11 EBC, and 1.05 EBC). In most cases, the filtered beers have turbidity in the range of 0.5 EBC to 1.0 EBC, indicating an almost brilliant beer, while in experiments E15, E20, and E21, the beer was brilliant (EBC < 0.5). By increasing the amount of zeolite in the mixtures used as the filtering material, an improvement in the elimination of beer haze was observed. The lower values for turbidity were obtained in experiments E20 and E21 with values of 0.44 EBC and 0.35 EBC, respectively, in which both the filter cakes and filtration dosage were zeolite.
Even if, in some breweries, the beer started to be filtered through 0.45 µm hollow-fiber modules by the so-called Norit process [
42], the filtration in most breweries worldwide still uses conventional powder filters has been the standard industrial practice for more than 100 years. According to the laboratory-scale results, zeolites meet the criteria as a substitute for diatomaceous earth when considering the main characteristics of filtered beers: pH, color, turbidity, taste, and flavor, and the filtration time, which were not highly affected.
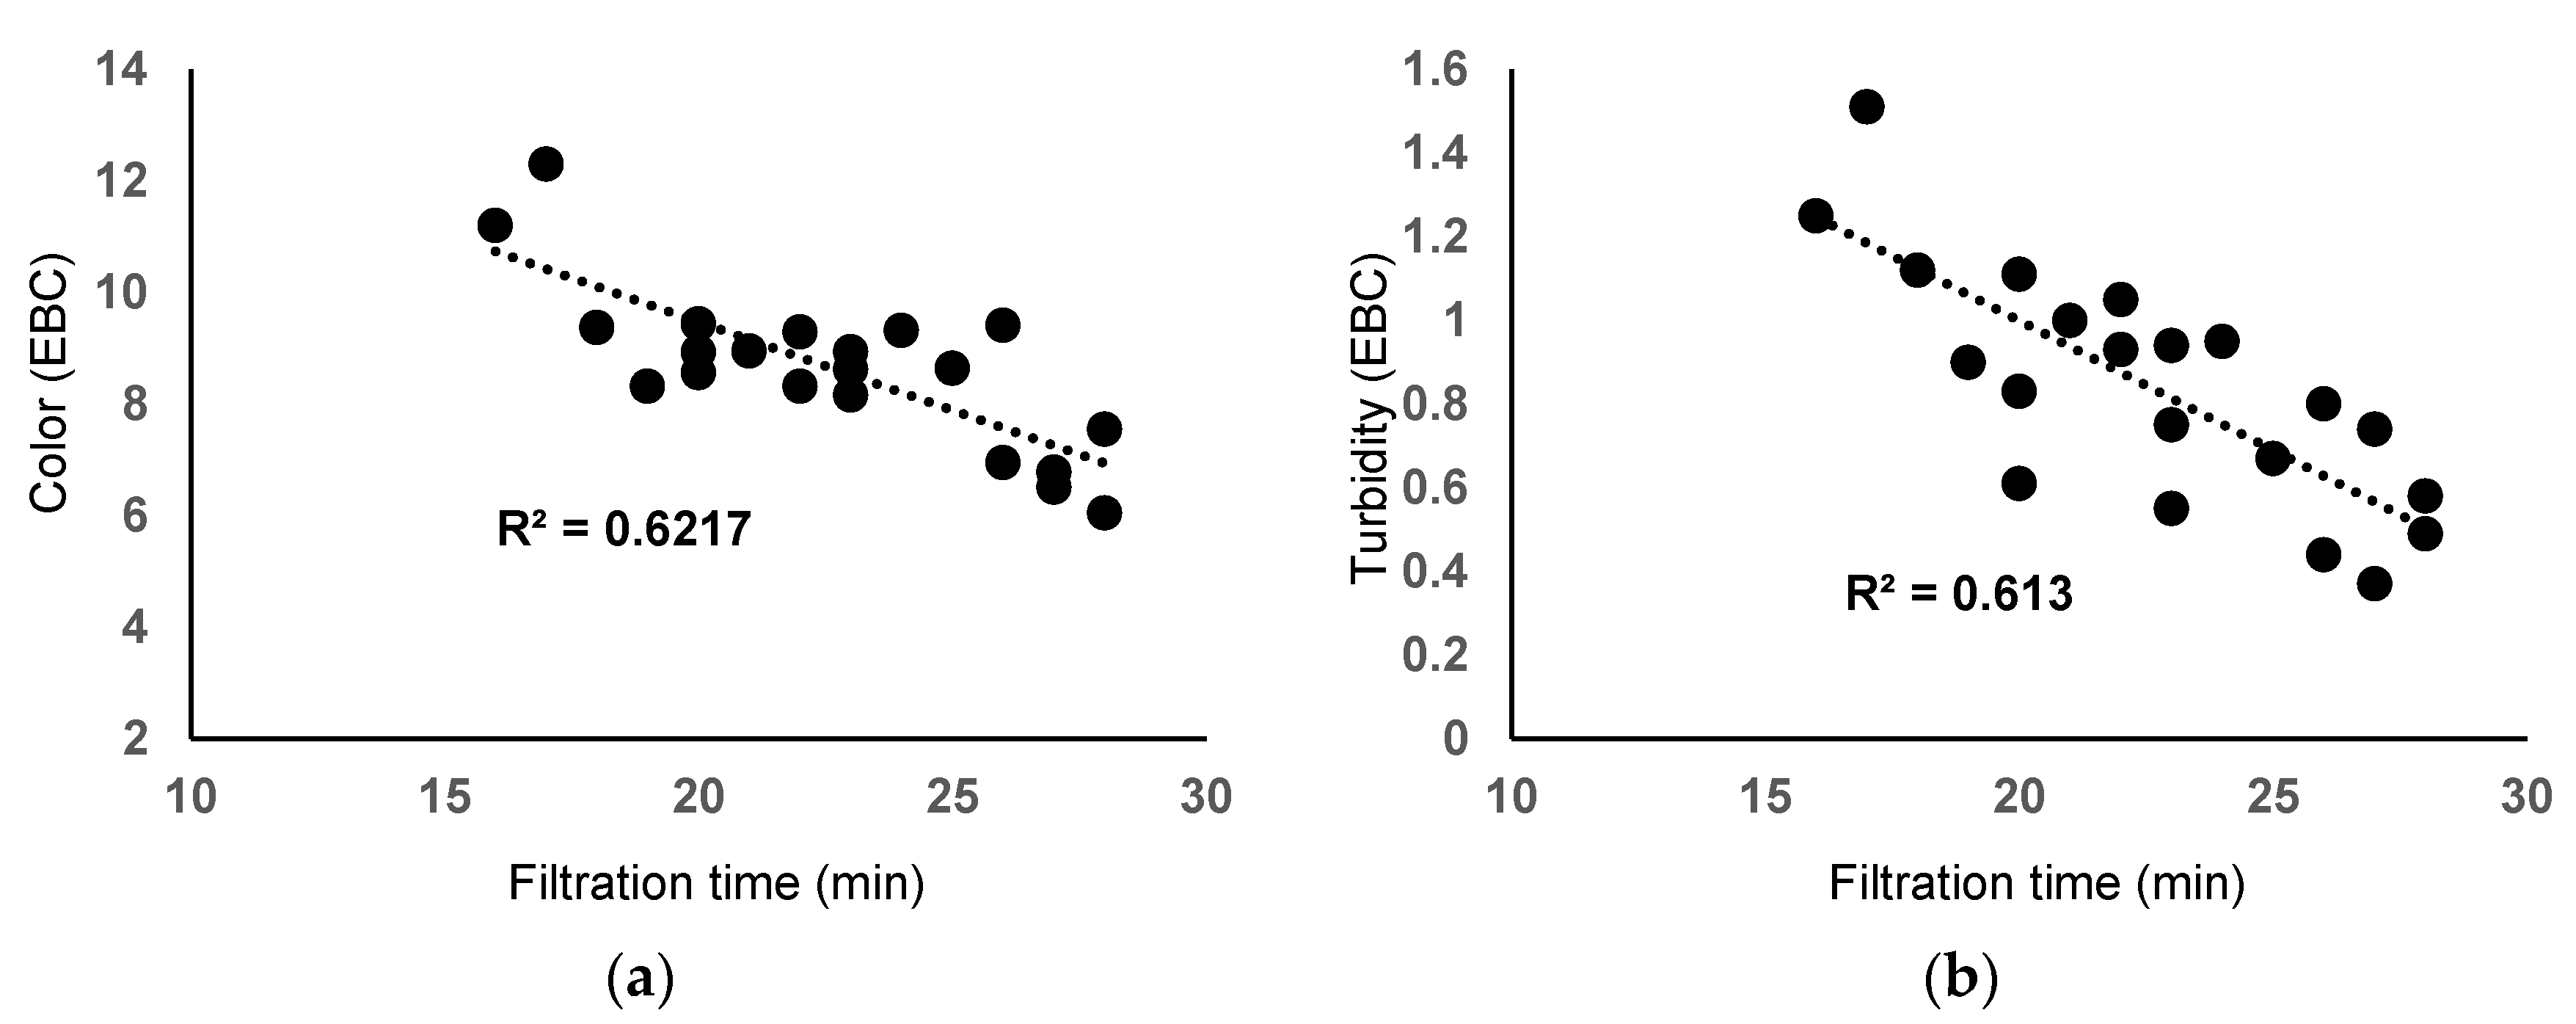
Figure 5 shows a negative correlation between filtration time and beer color (R
2 = 0.6217, r = −0.7885). Similarly, a negative correlation between filtration time and beer color was observed (R
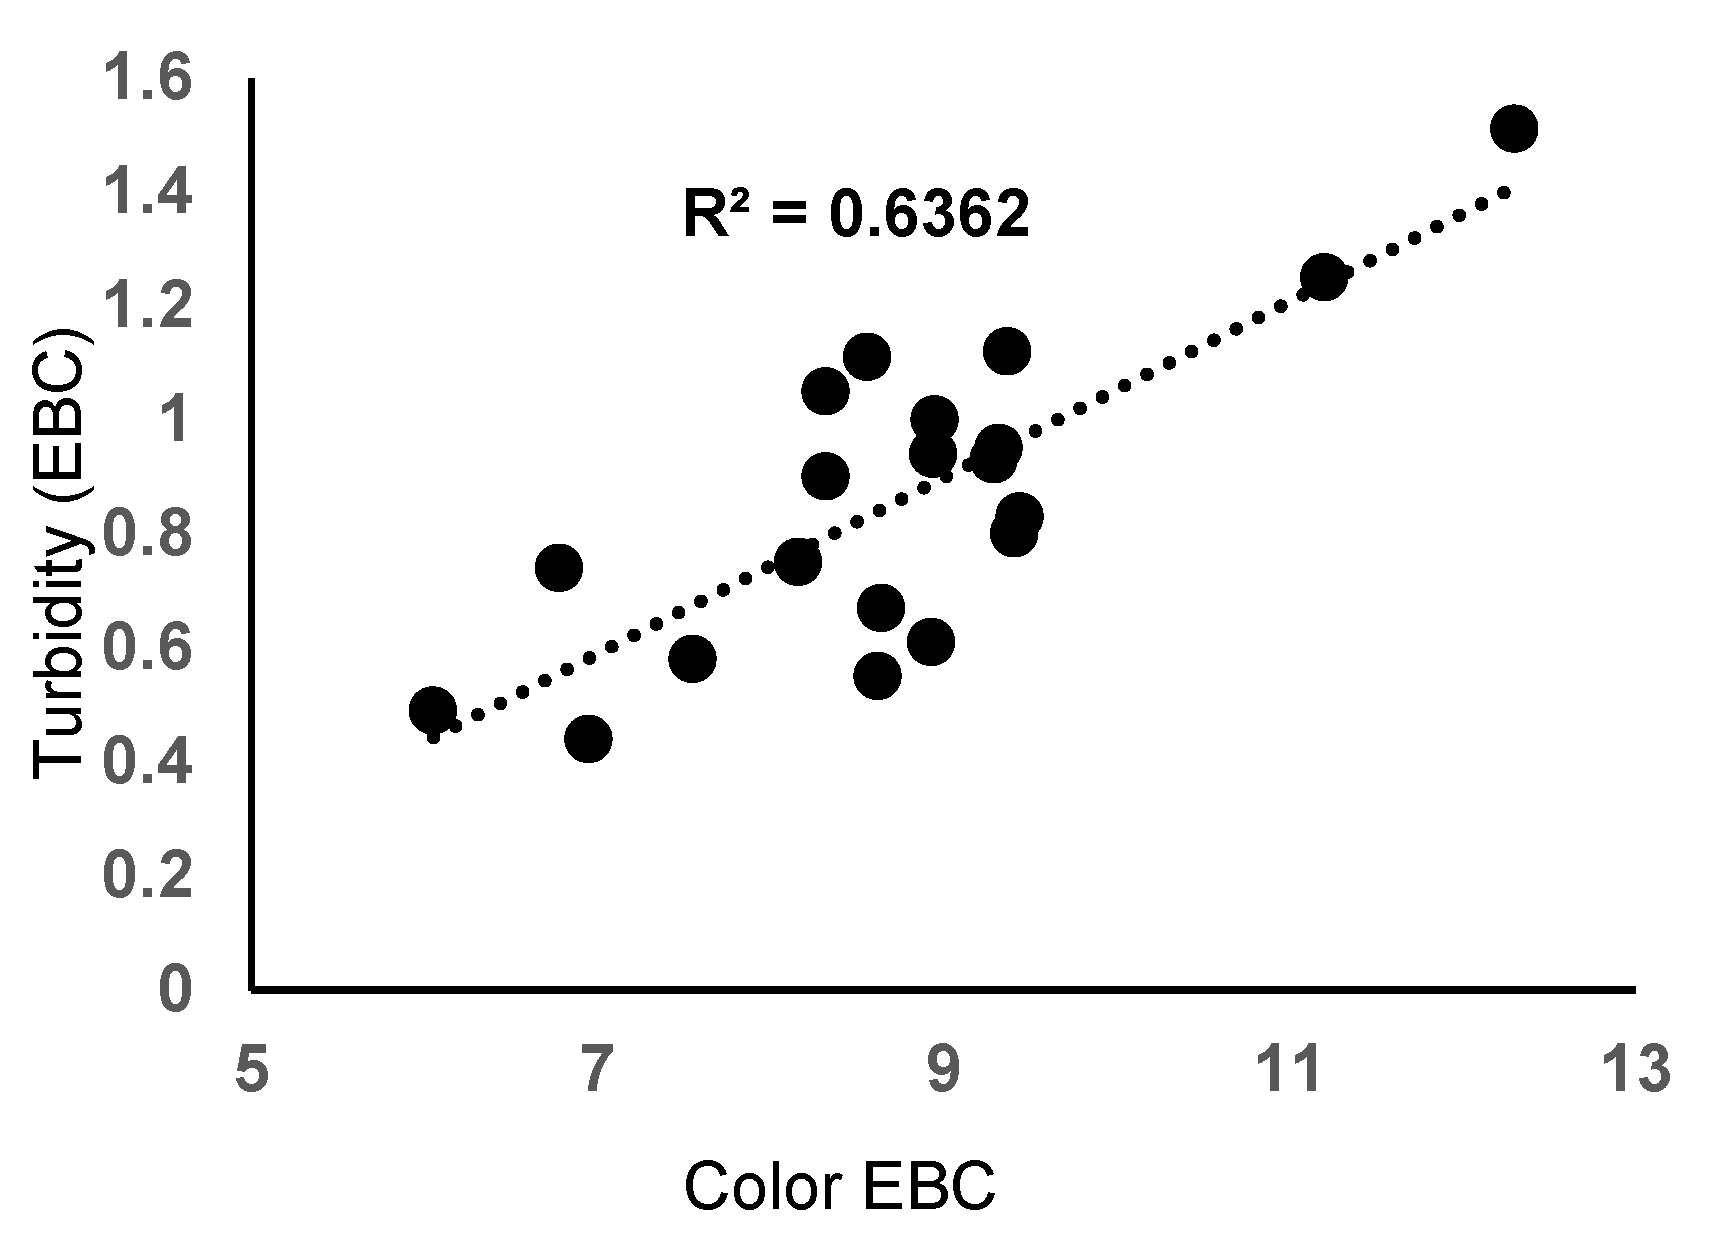
2 = 0.6130, r = −0.7829). Consequently, a strong positive correlation exists between turbidity and the color of filtered beer (
Figure 6). Using zeolites in high amounts and fine particle sizes increases the filtration time but also retains more colloids from the beer, having the main effect of reducing beer color and turbidity.
3.3. Influence of Filtering Media on Metal Content in Filtered Beer
According to the concentration and type, metals may be essential or toxic to the human body andaffect beer quality [
43]. Metals such as Fe, Cu, Cr, Ni, Co, and Zn have various biochemical and physiological functions, being essential elements, but can become toxic in elevated concentrations [
44,
45,
46]. Other elements, such as Pb, As, and Cd, may cause severe problems for human health even at low levels and are considered non-essential elements [
47,
48]. Pb is a highly toxic metal with a negative impact on nearly every organ in the human body, while Cd has no biological role in the human body, affecting mainly the liver and kidneys [
49], as it is a toxic metalloid that is widespread in nature, known as an endocrine disrupter and human carcinogen [
50]. Metals can enter into beer from the raw materials used for beer production (cereals, water, and yeasts) [
51], but the materials used for filtration can also transfer metals into the filtered beer following their interaction during the filtration process, which is another source of toxic elements entering into beers. The concentrations of major elements and trace elements in beer samples are presented in
Table 5.
When considering the chemical composition of the natural zeolites used to produce the filter aids used in the laboratory-scale filtration experiments, one of the aims of this study was to evaluate if these elements are transferred into the beer during filtration.
The average concentrations of major elements decreased in the following order: K > Mg > Ca > Na. When compared to the unfiltered beer, the concentrations of K decreased by about 10% in the first three experiments, in which only kieselguhr was used as the filter cake, and increased in all the other experiments, with the highest concentration (615 mg L
−1) measured in the sample filtered in experiment E9. The concentrations of Na and Mg were not significantly modified by filtration. The concentration of Na in the beer samples ranged between 10.9–20.5 mg/L, much lower than the maximum admitted limit for drinking water of 200 mg L
−1 [
52]. Na concentrations higher than 200 mg L
−1 can induce a salty taste in drinks. In the case of Ca, the concentrations in the filtered beers generally increased from 21.0 mg L
−1 to a maximum concentration of 69.1 mg L
−1 in sample E9, probably due to the higher exchangeability of Ca
2+ ions in the zeolites. Increasing Ca and K concentrations following filtration does not affect the beer taste. Moreover, these elements have a beneficial effect on health.
Fe concentration is an important parameter in beer; its deficiency is manifested mainly by anemia. On the other hand, increased concentrations of Fe
3+ ions contribute to the beer’s metallic and astringent taste. As observed in
Table 5, the concentration of Fe was not strongly influenced by the filtration process and remained in the same order of magnitude as that from the unfiltered beer. In a previous study on metal content in beers from a Turkish market, Charehsaz et al. [
53] reported Fe concentrations in the range of 392.27 to 1454.14 µg/L, close to the Fe concentrations measured in the present study. Higher Fe concentrations were reported by Kostic et al. [
54] for wine samples from Serbia, in the range of 2.93–36.2 mg L
−1. The concentrations of trace elements in beer samples analyzed by GFAAS are presented in
Table 6.
The concentrations of Cd and Co in all the analyzed samples were below the quantification limits (LOQs) of 0.26 µg L
−1 and 0.65 µg L
−1, respectively. In drinking water, the maximum admitted level for Cd is 5.0 µg L
−1 [
52]; thus, the Cd concentration in filtered beers is well below this limit. The concentration of As was <0.50 µg L
−1 in the unfiltered sample and increased to concentrations in the range of 0.68–4.05 µg L
−1 after filtration. Thus, this concentration can be attributed to the filtering materials (both kieselguhr and zeolites), which are used in the filtering stage. However, this concentration is below the maximum limit for drinking water (10 µg L
−1) [
52]. In a previous study on the transfer of As, Cd, and Pb from diatomaceous earth filter aids, Redan et al. [
55] reported a significant increase in inorganic As in filtered beverages (beer and wine) in the range of 11.2–13.7 μg L
−1 following the contact with the filter aids. At the same time, no modifications were observed for the Pb and Cd concentrations. Donadini et al. [
56] surveyed As, Cd, and Pb in beer brands from the Italian market. The reported average content of As was 10.82 ± 5.54 µg L
−1, which is higher than in our study. The Cd concentration was 0.16 ± 0.15 µg L
−1, while the Pb average concentration was 1.84 ± 3.24 µg L
−1.
Cr is an essential element with beneficial effects for human health in low concentrations, but it becomes toxic in increased concentrations [
57]. Consequently, the maximum admitted level in drinking water for total Cr is 50 µg L
−1 [
52]. In the analyzed beer samples, higher Cr concentration from 2.80 µg L
−1 in the unfiltered sample to concentrations in the range of 11.2–26.6 µg L
−1 in filtered beers was observed. Indeed, in all cases, the Cr content was below the maximum limit. Still, it can be observed that the highest Cr concentration was measured in the beer filtered using only kieselguhr as a filter aid. In contrast, the lowest concentration was found in the beer filtered using the zeolite from Chilioara (CS100 and CS40) for filtration. Thus, it can be concluded that zeolite contributes less to a higher Cr content in filtered beer than commercial filter aids.
Cu is recognized as an essential element with a role in the function of necessary enzymes in the organism, such as cytochrome c-oxidase, which is a critical enzyme in energy metabolism [
53]. Like other essential elements, in augmented concentrations, this can become toxic; thus, its maximum limit in drinking water was established at 2.000 µg L
−1 [
52]. The concentration of Cu in the unfiltered beer was 57.9 µg L
−1 and generally decreased in the range of 16.5–50.9 µg L
−1 after the filtration. The most critical removal of Cu was observed in beers filtered only with zeolites as a filter aid. Ni also became toxic in elevated concentrations, and its maximum limit in drinking water is 20 µg L
−1 [
52]. In the unfiltered beer sample, the concentration of Ni was 10.9 µg L
−1, and, as was the case for Cu, the concentrations of Ni decreased following filtration. Additionally, the zeolites were found to be more efficient in removing Ni than the commercial filter aids. The concentrations of Ni in the filtered beer samples ranged between 3.11–10.7 µg L
−1 after the filtration in all cases below the maximum limit for drinking water.
Zn is an essential element as it is implied to produce hundreds of enzymes in the human body [
58]. However, exposure to high concentrations of Zn may cause gastrointestinal symptoms or renal damage [
58], but a maximum admitted concentration in drinking water exists. Generally, the concentrations of Zn increased in the beers after the interaction with the filter aids, from 10.9 µg L
−1 in unfiltered beer to a range of concentrations between 17.7–44.1 µg L
−1 in the filtered beer samples.
The spent filtration aids after beer clarification represent an important issue. Usually, the spent diatomaceous earth is disposed of via landfilling or is directly applied as a fertilizer in agriculture due to the high content of organic matter [
59]. Natural zeolites are already used to improve agricultural soil quality [
60]; thus, using the spent zeolites from the beer filtration process is easy to implement. However, it should be noted that applying it to soil can release nitrogenous substances that can leach into the groundwater [
59]. Moreover, like diatomaceous earth, natural zeolites are nonrenewable natural minerals with limited resources. At present, only limited amounts of waste materials are reused after removing organic loading by thermal or acid/alkaline treatment [
61,
62]. When considering environmental safety and resource management and correlated with the high thermal and chemical stability of clinoptilolite-type zeolites, future studies on the regeneration procedures of spent zeolites from beer filtration are of great interest.


