
Effects of Al/Na and Si/Na Molar Ratios on the Alkalinity of Metakaolin-Based Geopolymer Pore Solutions

Abstract
:1. Introduction
2. Experimental Setup
2.1. Raw Materials
2.2. Mix Design
2.3. Specimen Manufacture
2.4. Test and Analysis Methods
2.4.1. Pore Solution Test
2.4.2. Microstructure Test
2.4.3. Phase Composition Analysis
3. Results and Discussion
3.1. The pH Analysis of the Pore Solutions
3.1.1. Effects of the Al/Na Ratio
3.1.2. Effects of the Si/Na Ratio
3.2. Analysis of Compressive Strength
3.2.1. Effects of the Al/Na Ratio
3.2.2. Effects of the Si/Na Ratio
3.3. Geopolymerization
3.3.1. Study of Reaction Levels under Changes in Al/Na Ratio
3.3.2. Study of Reaction Levels under Changes in Si/Na Ratio
3.4. Microstructure Analysis
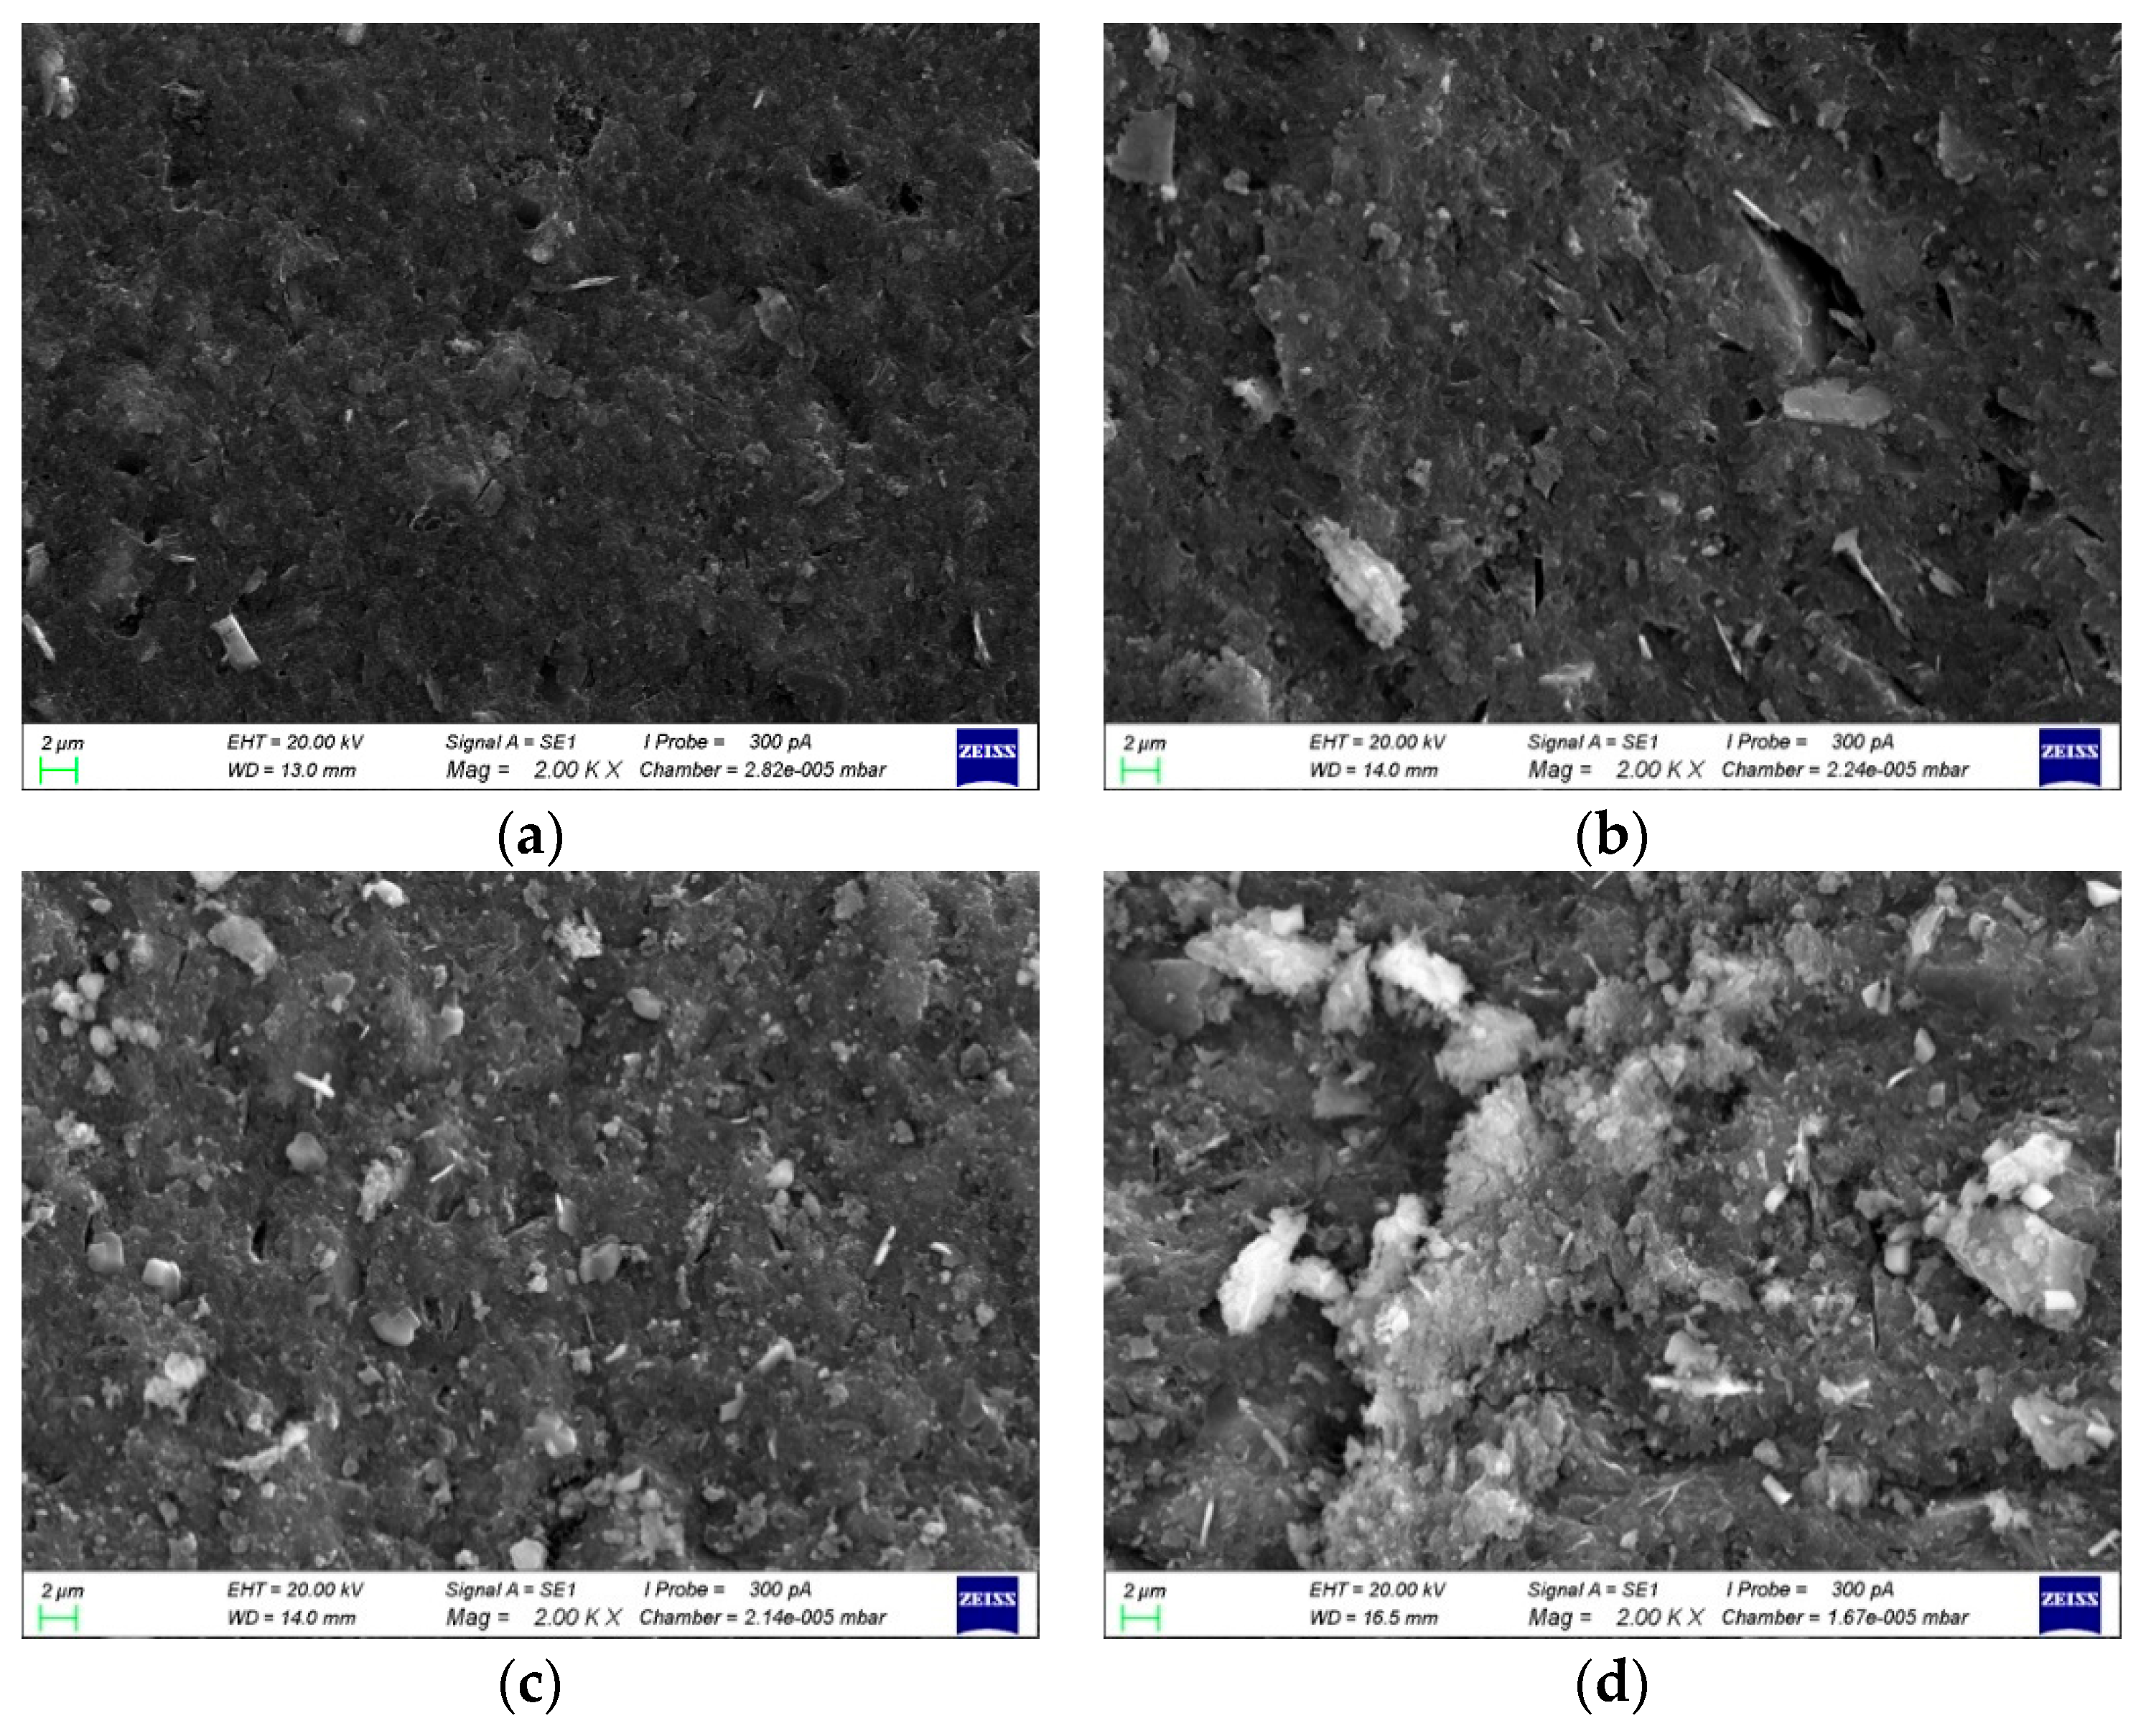
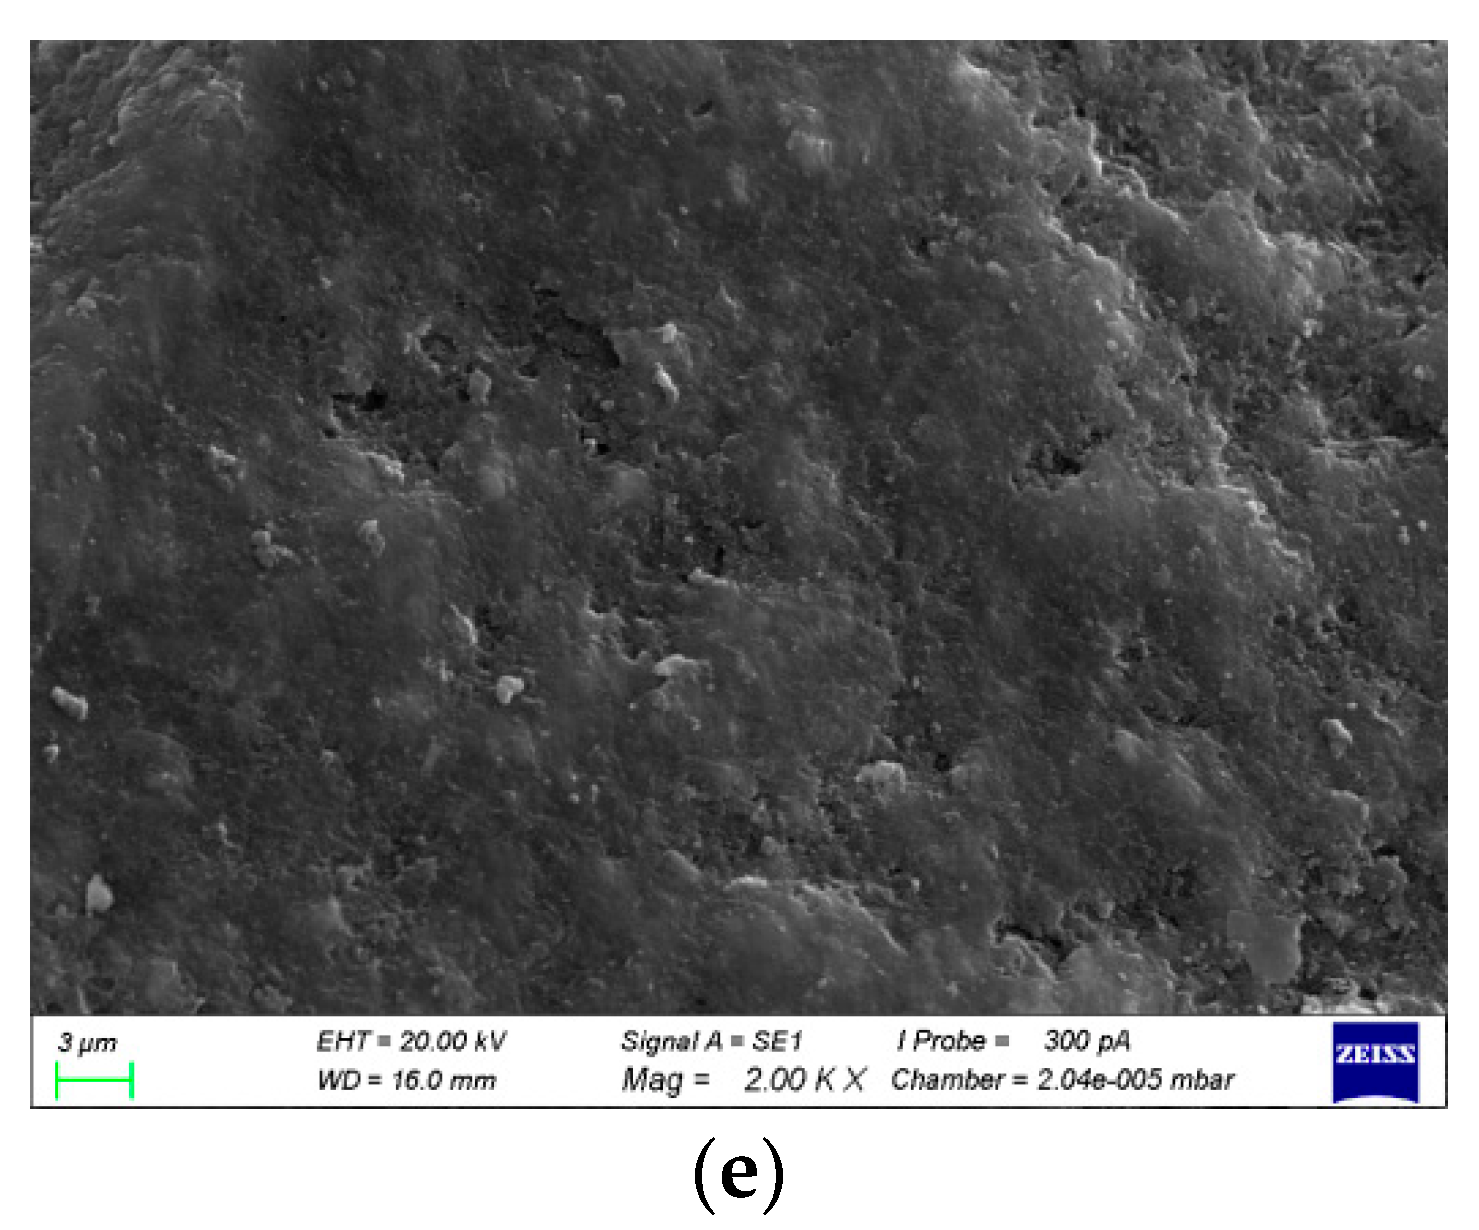
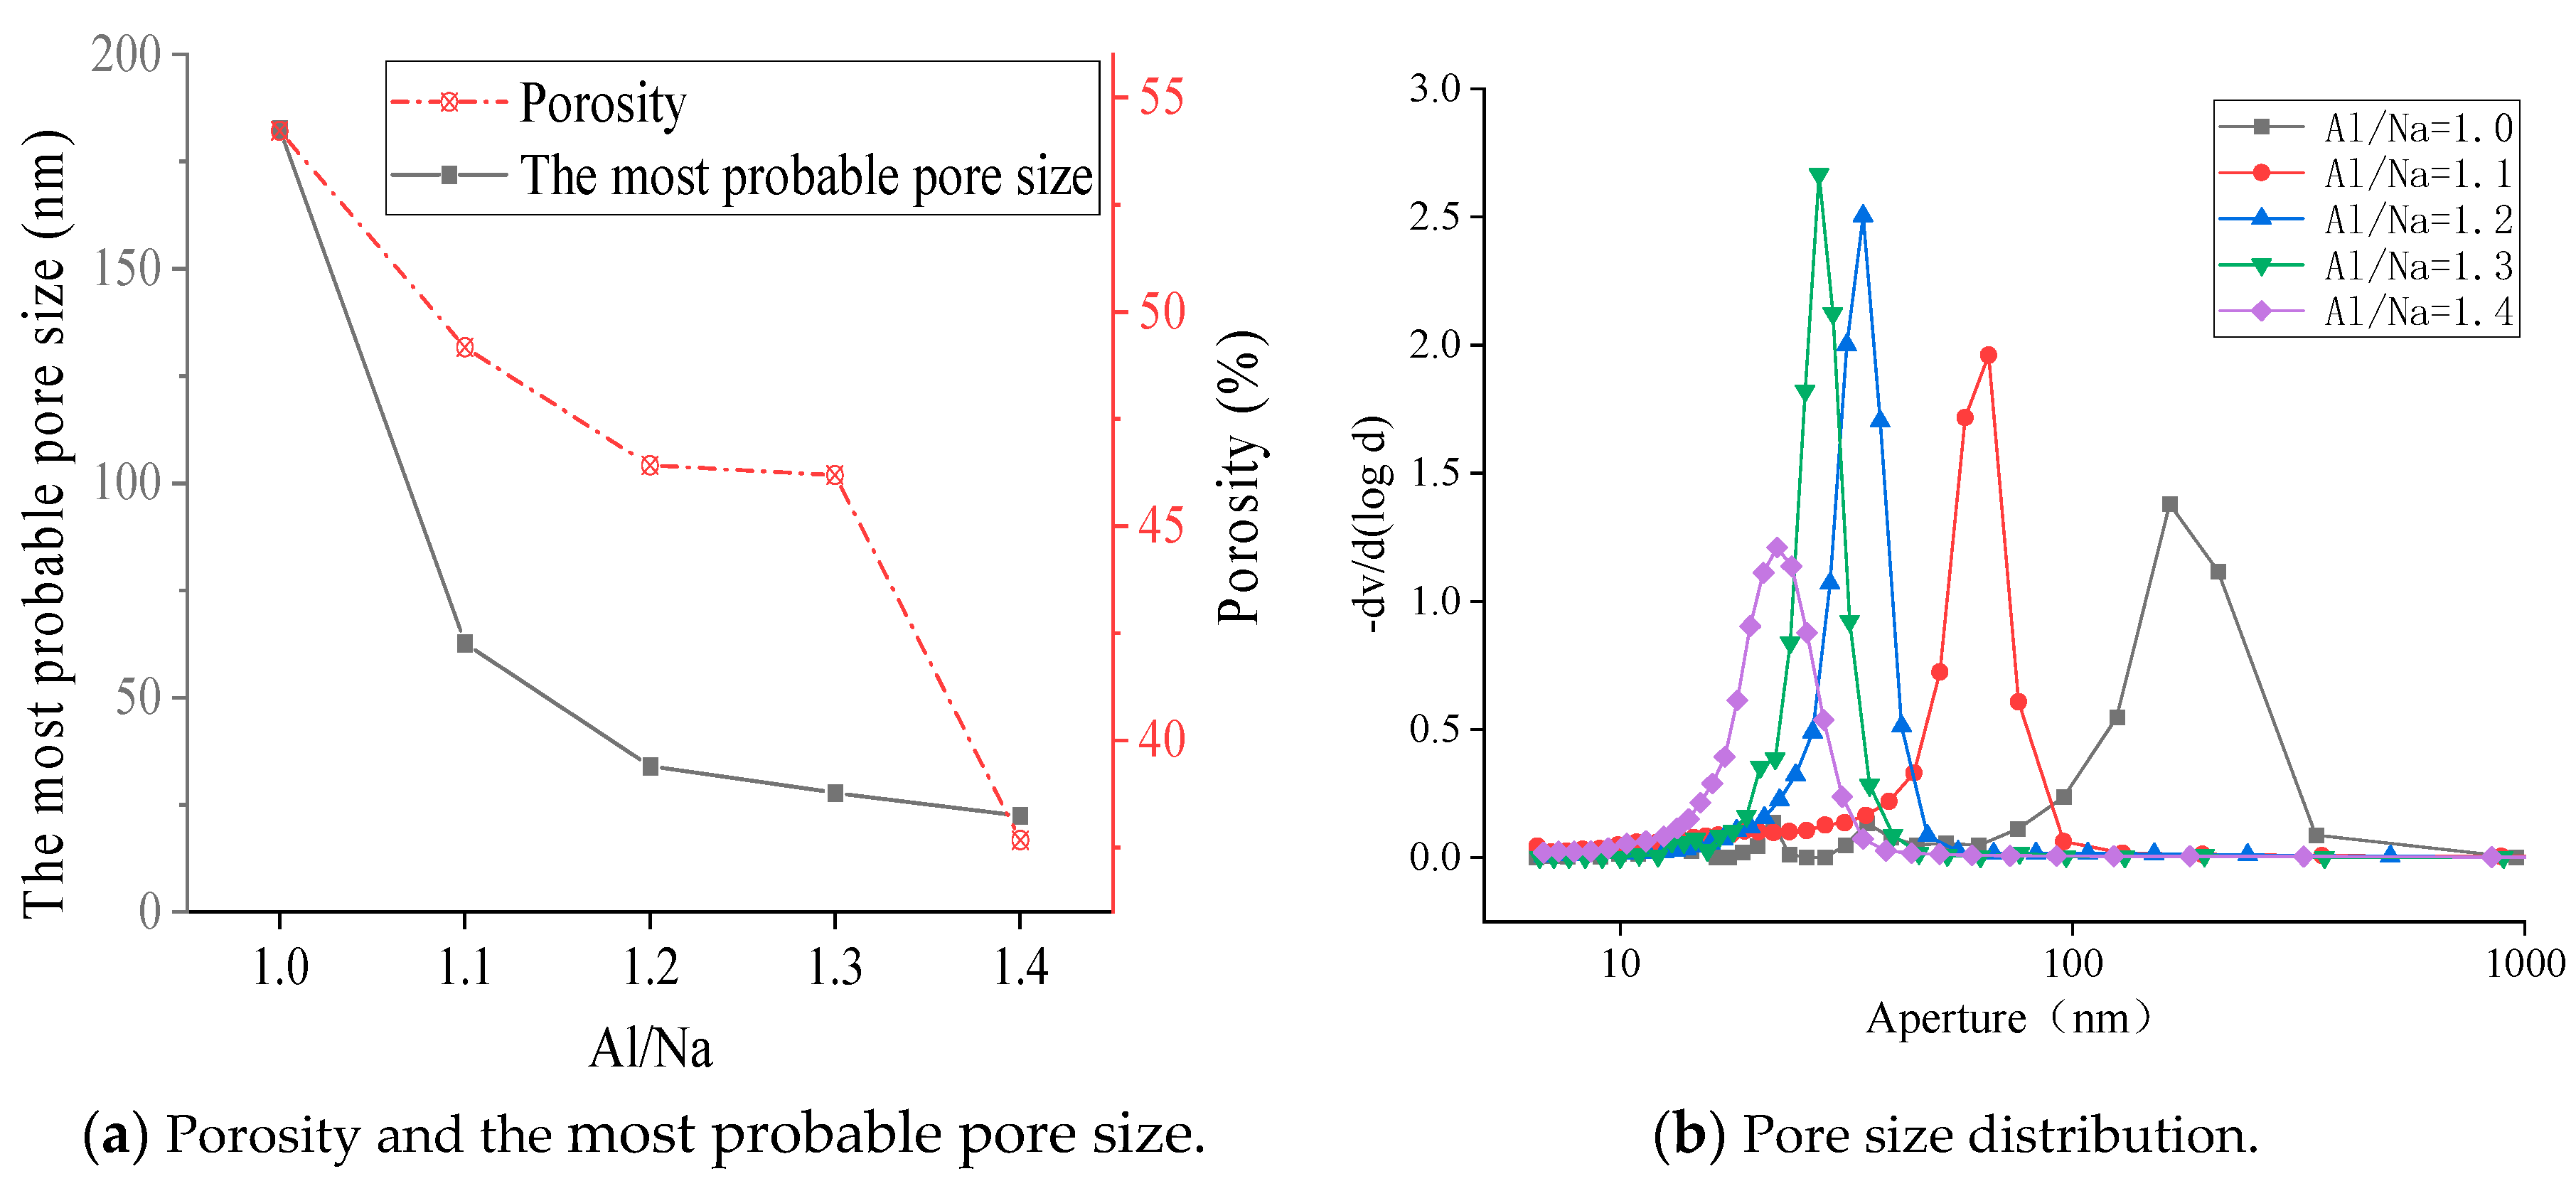
3.4.1. SEM Diagrams and Pore Structures with Different Al/Na Ratios
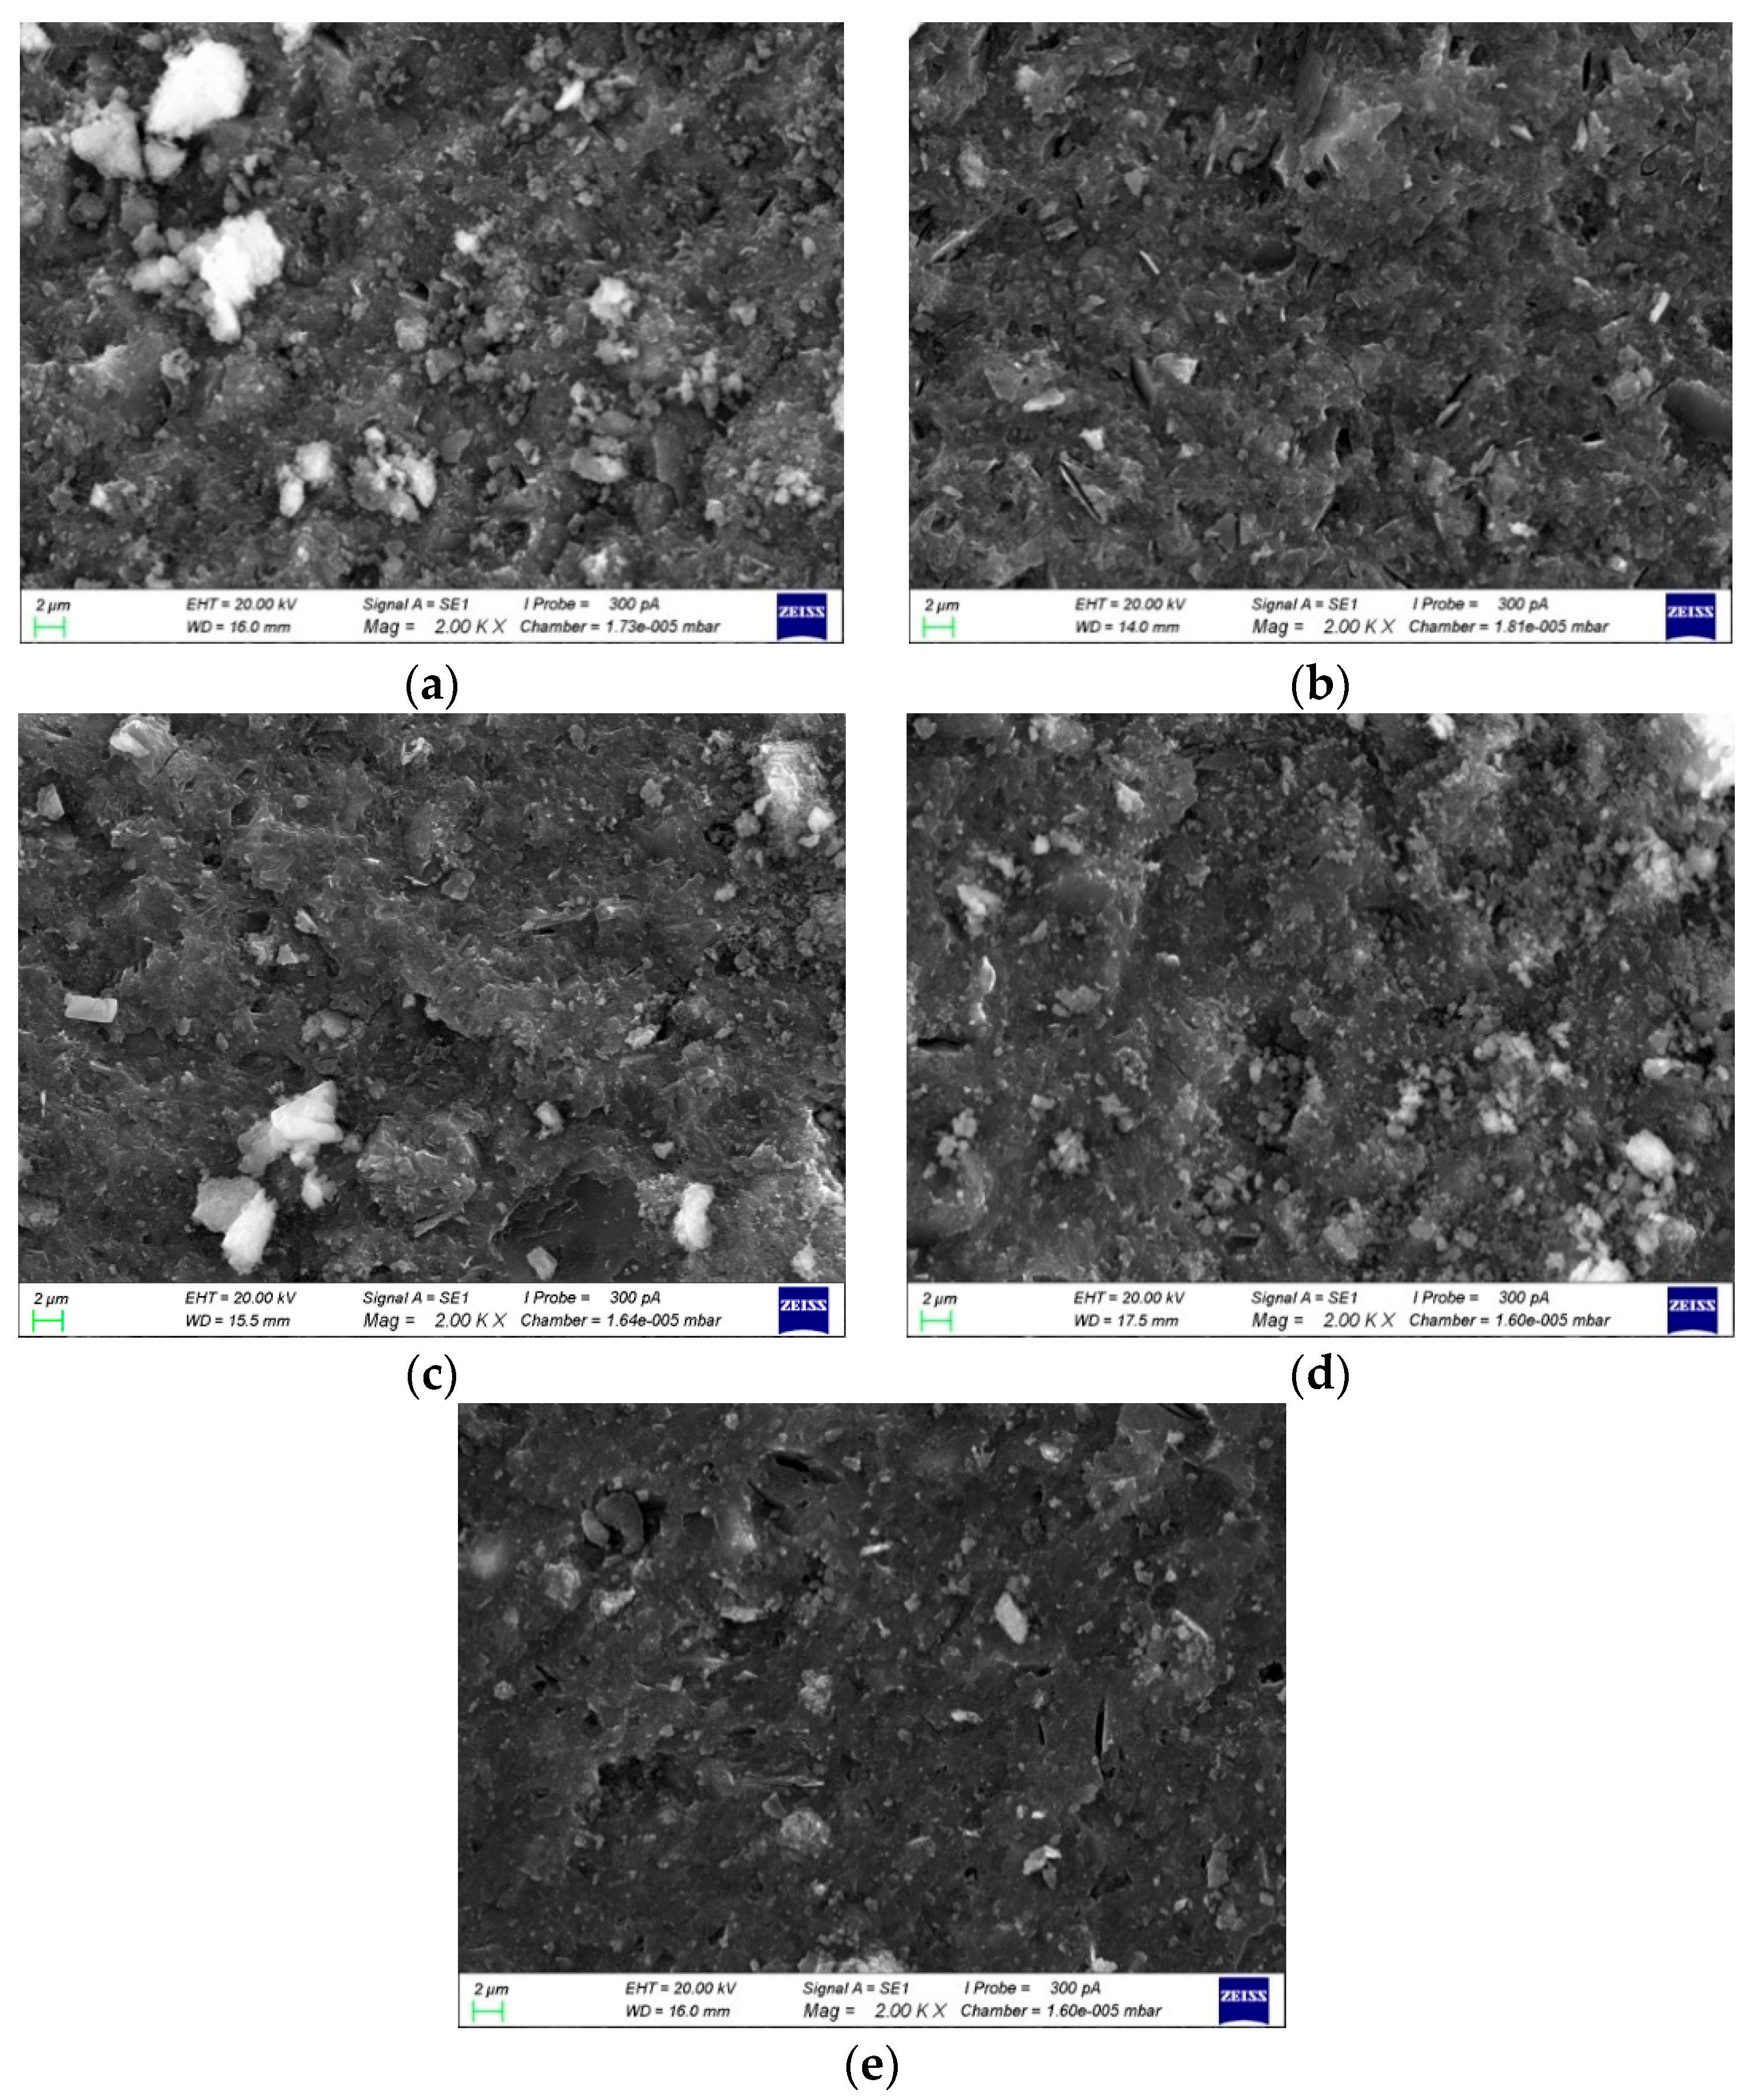
3.4.2. SEM Diagrams and Pore Structures with Different Si/Na Ratios
3.5. Phase Composition Analysis
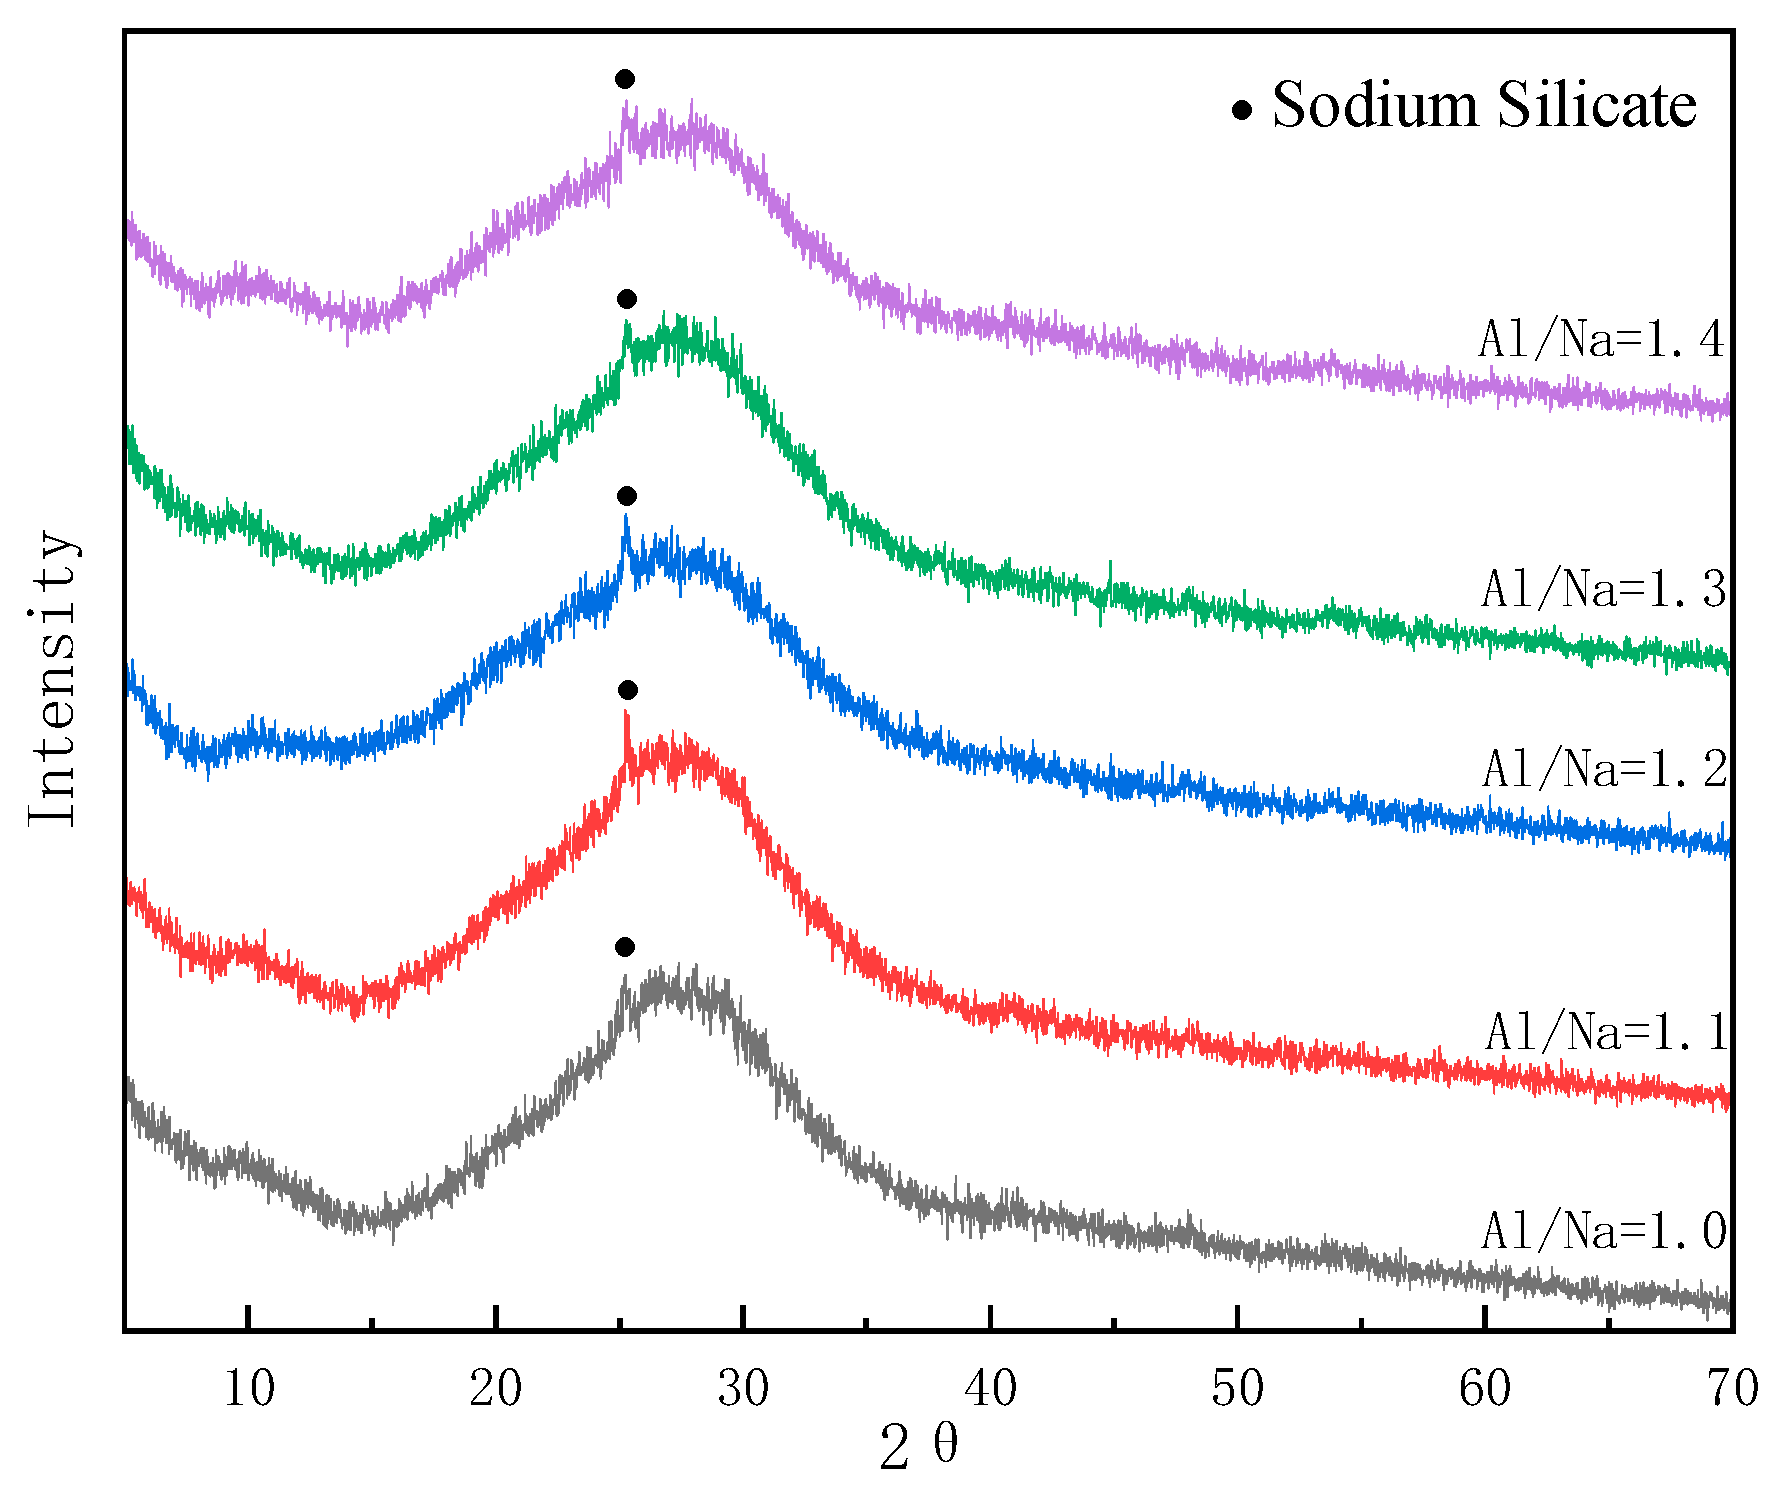
3.5.1. Changes in Phase Composition with Changes in Al/Na Ratio
3.5.2. Changes in Phase Composition with Changes in Si/Na Ratio
4. Conclusions
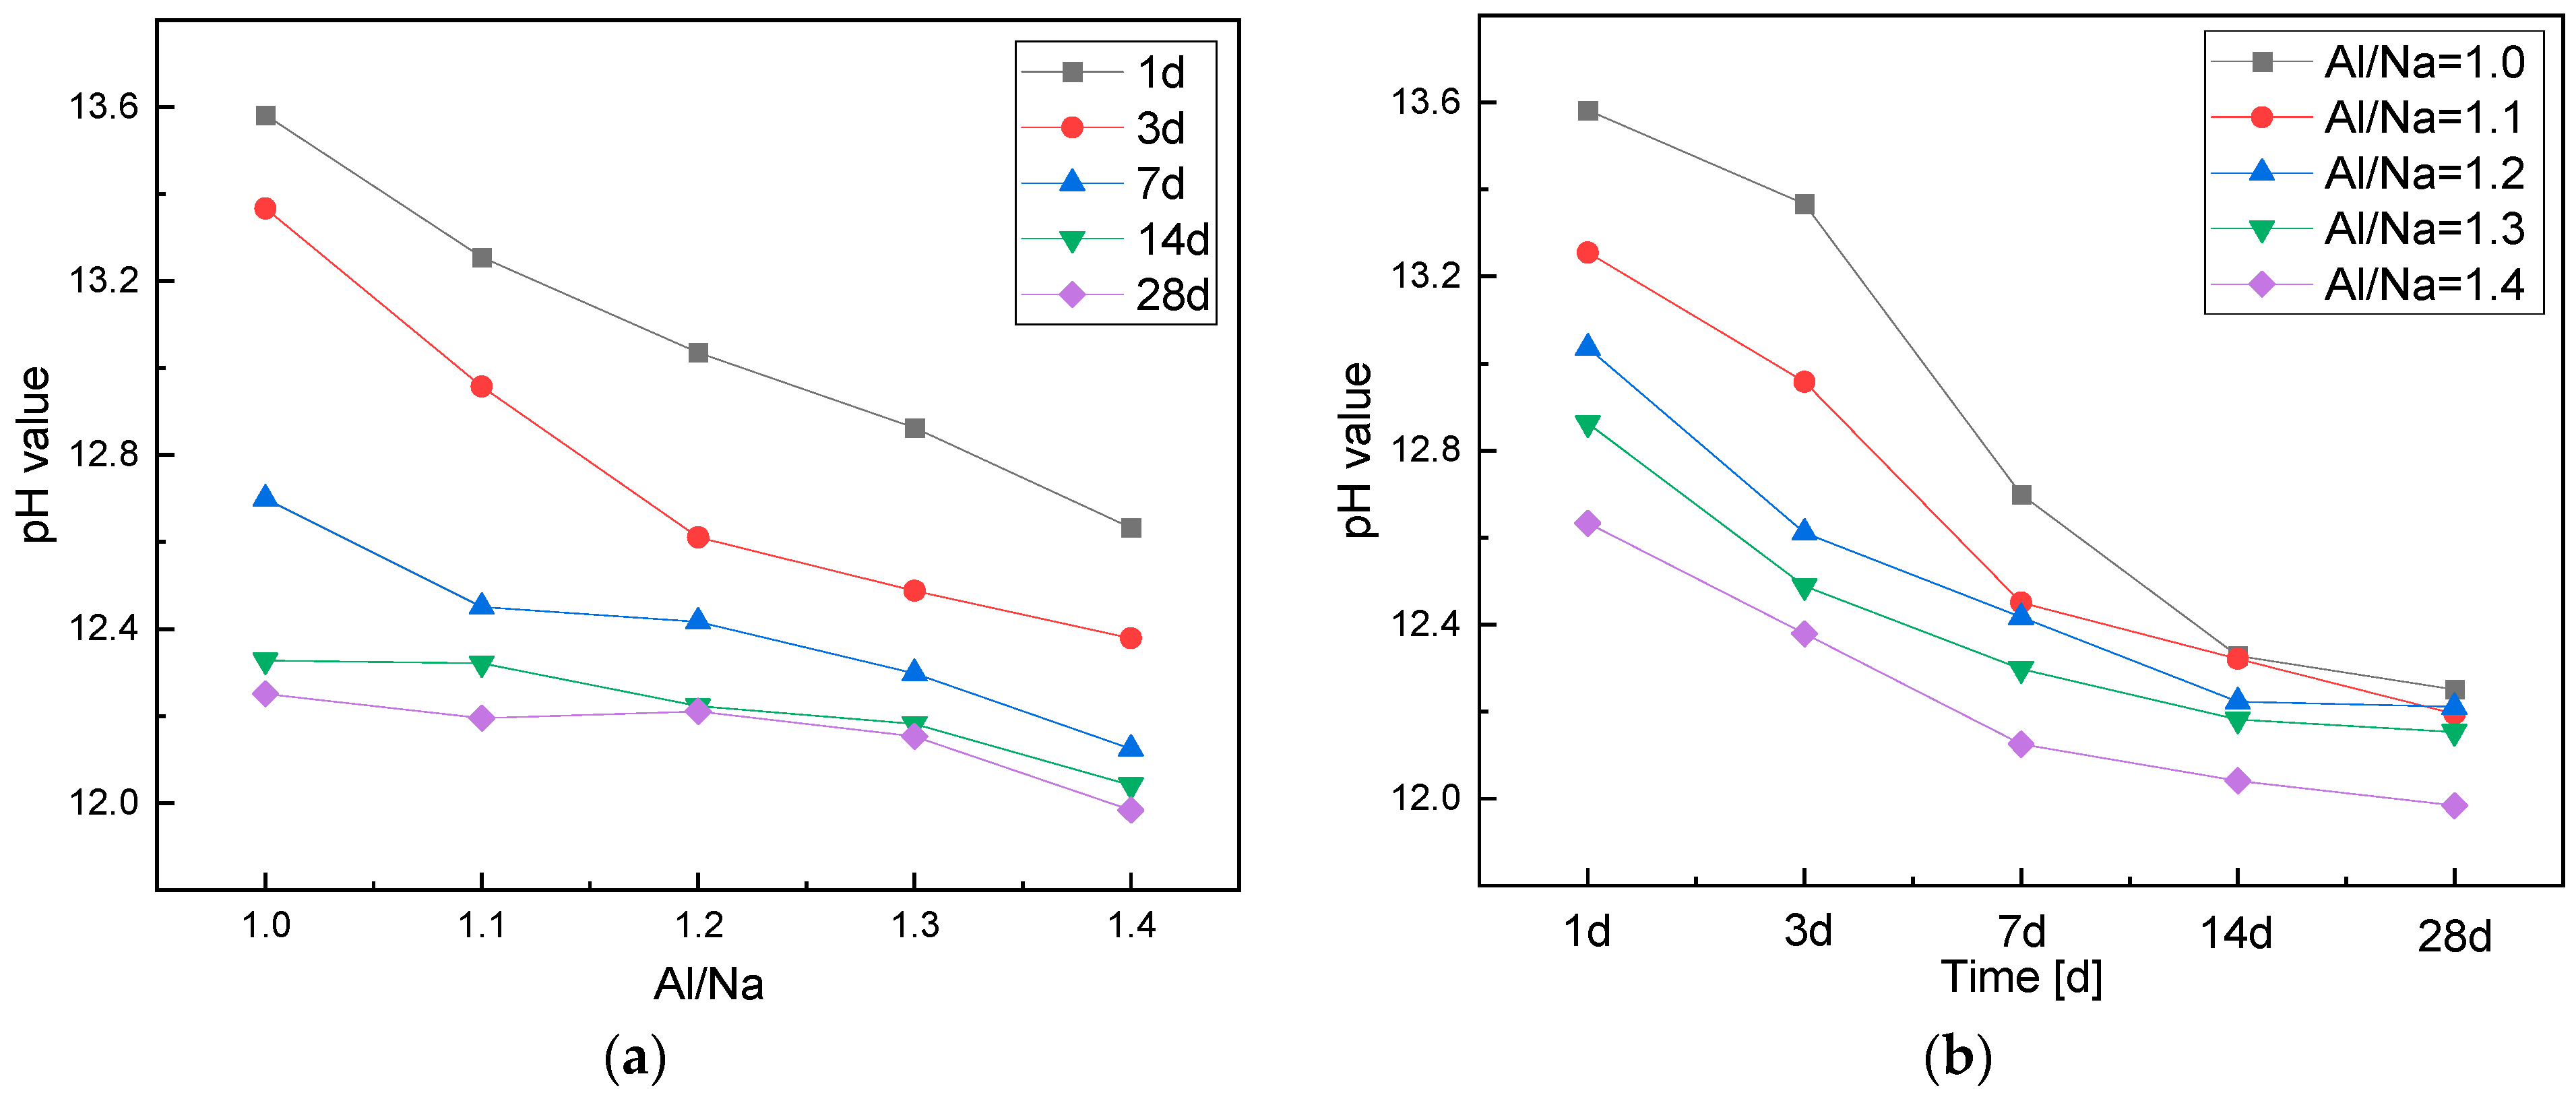
- With an increase in the Al/Na ratio, the Al contents of the systems increased and more OH− was consumed to generate AlO4 tetrahedrons, so the residual OH− contents after the reactions decreased and the pH of the pore solutions continued to decrease.
- With an increase in the Si/Na ratio, the alkalinity of the initiator became weaker, but the amount of excipient increased and the total OH− contents in the systems remained almost unchanged. The OH− concentrations on the surfaces of the raw material particles decreased, resulting in lower reaction levels and less OH− being consumed. Therefore, the residual OH− contents after the reactions increased and the pH of the pore solutions increased.
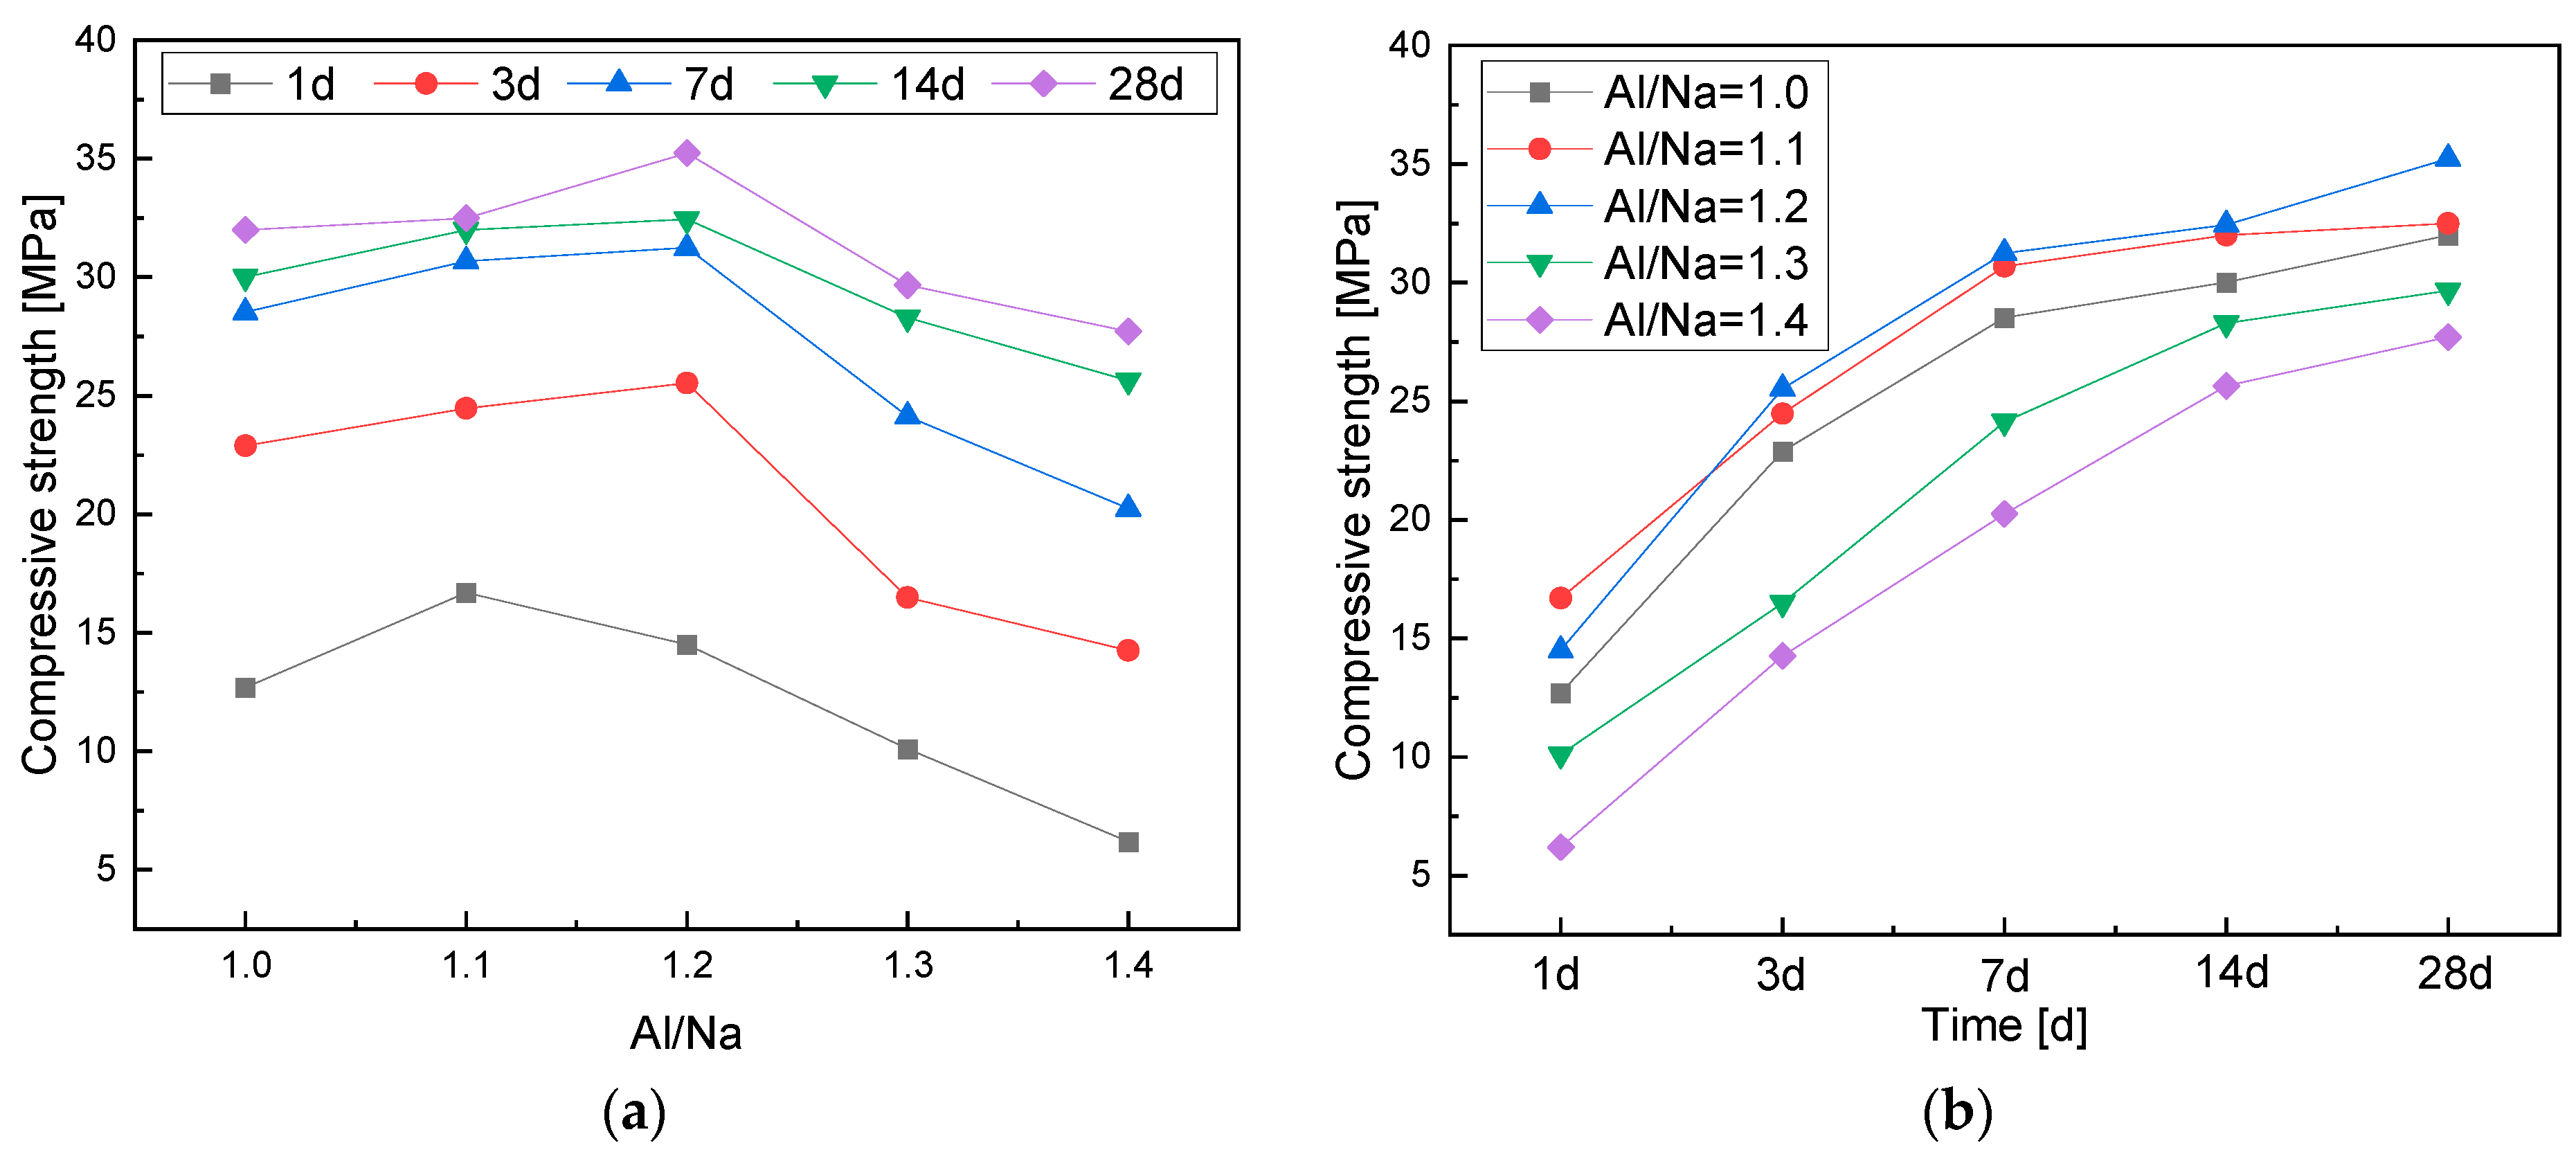
- The compressive strength of the geopolymers first increased and then decreased with an increase in the Al/Na ratio. The highly active Al increased the hydration reaction levels, which made the geopolymer structures become denser and demonstrate higher compressive strength. The Al components in the systems were excessive and the alkali contents gradually decreased when the Al/Na ratio was too high, which meant that the reaction levels and compressive strength of the geopolymers decreased.
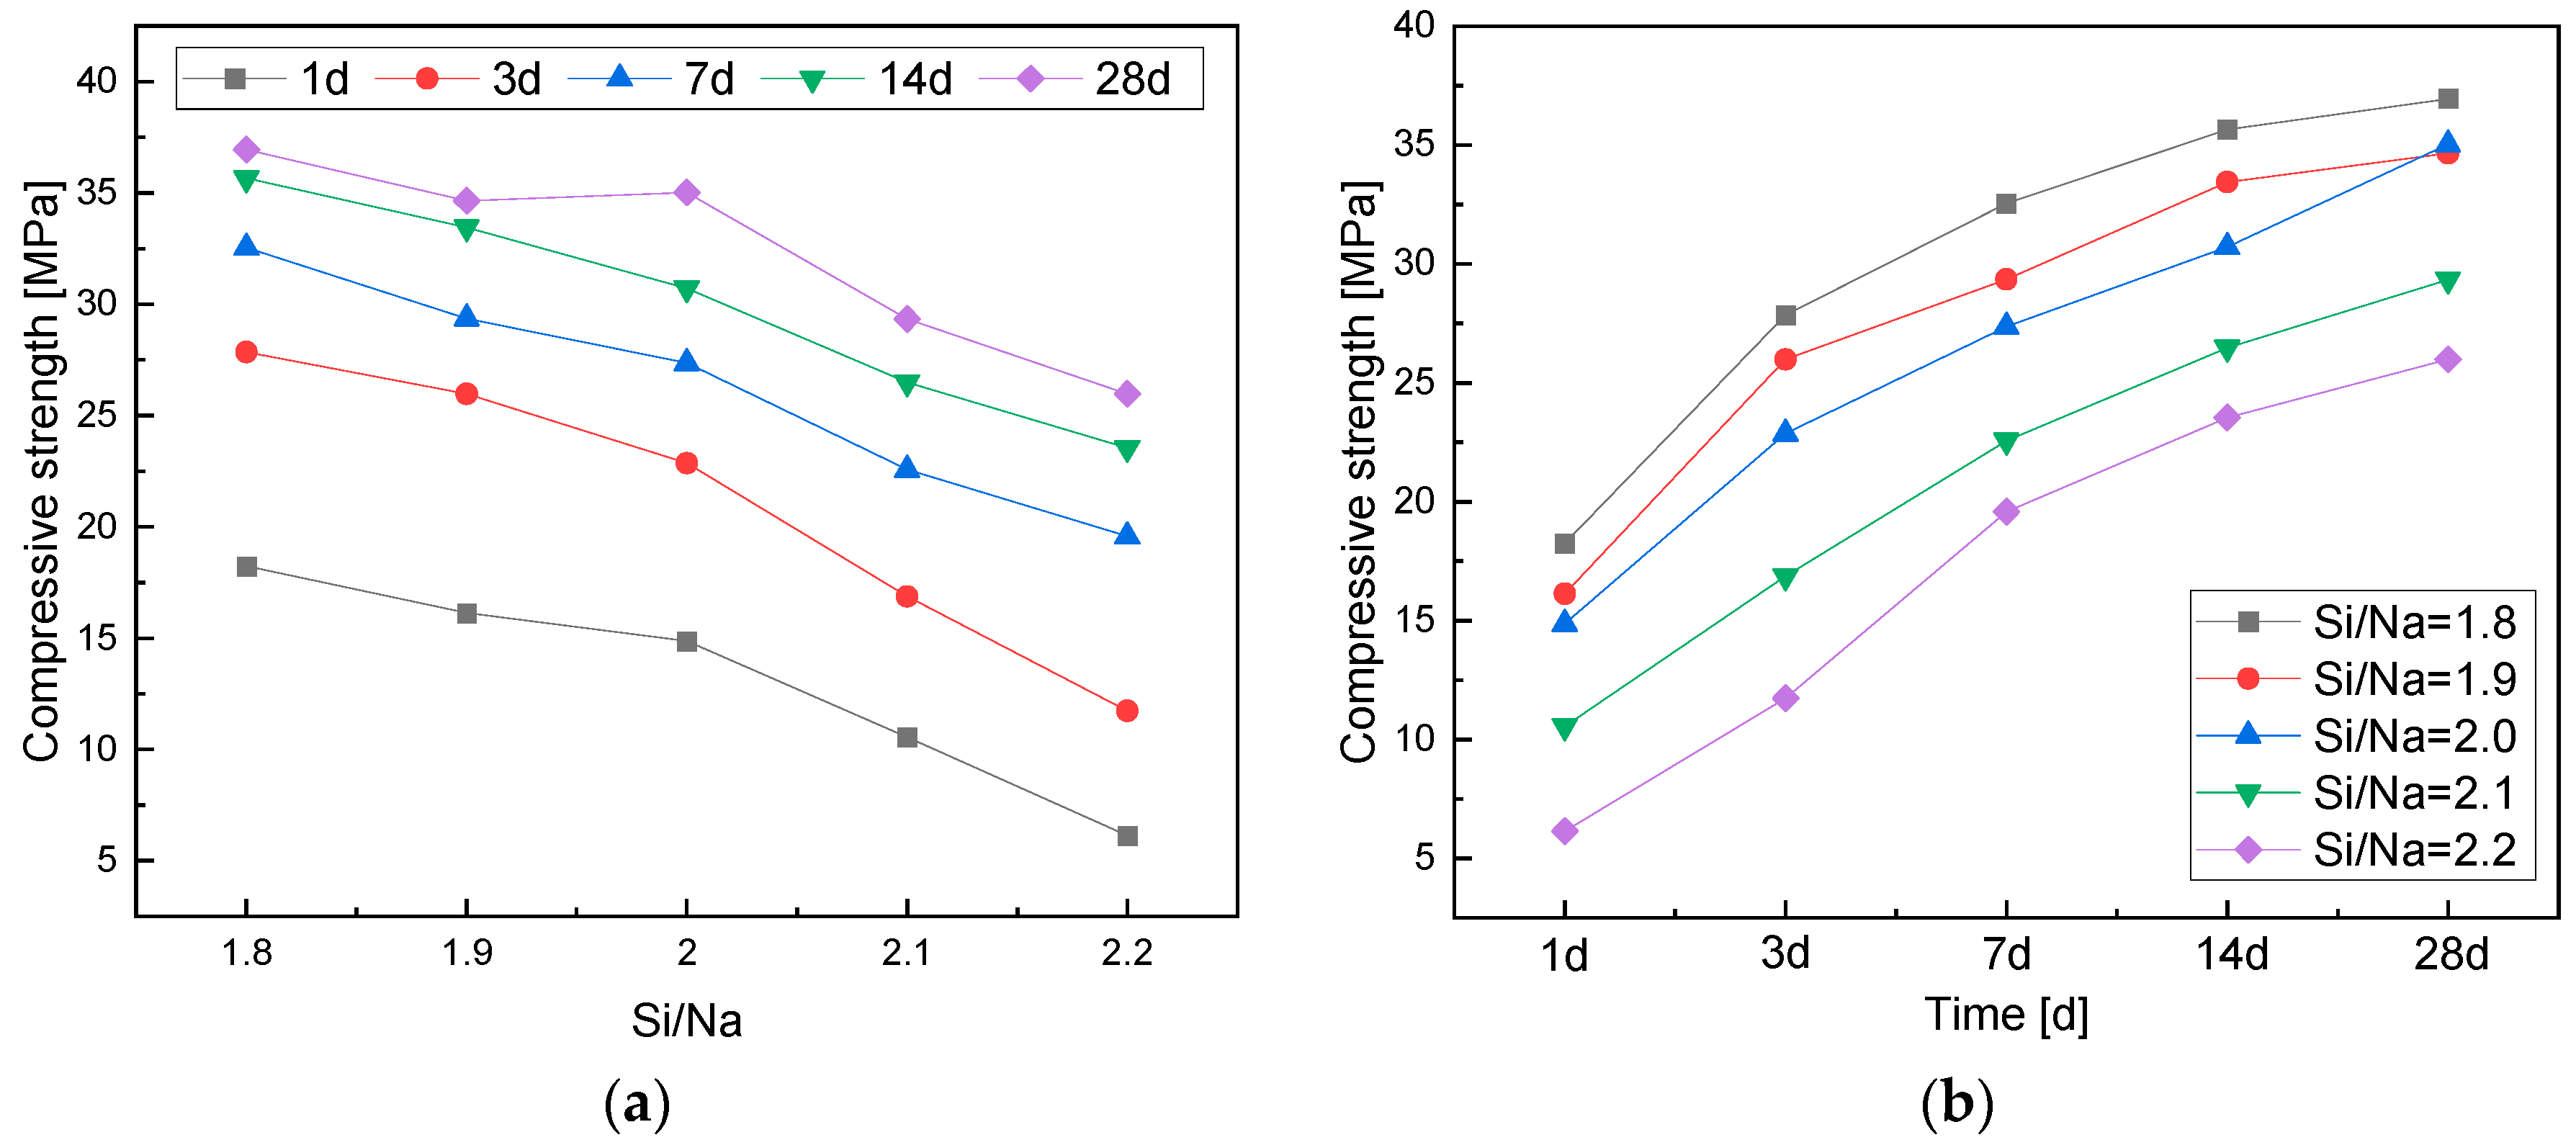
- The compressive strength of the geopolymers gradually decreased with an increase in the Si/Na ratio. An increase in the Si/Na ratio led to a decrease in the alkali contents in the systems and the amount of metakaolin. Then, the reaction rates and levels of geopolymers decreased, so the compressive strength of the geopolymers also decreased.
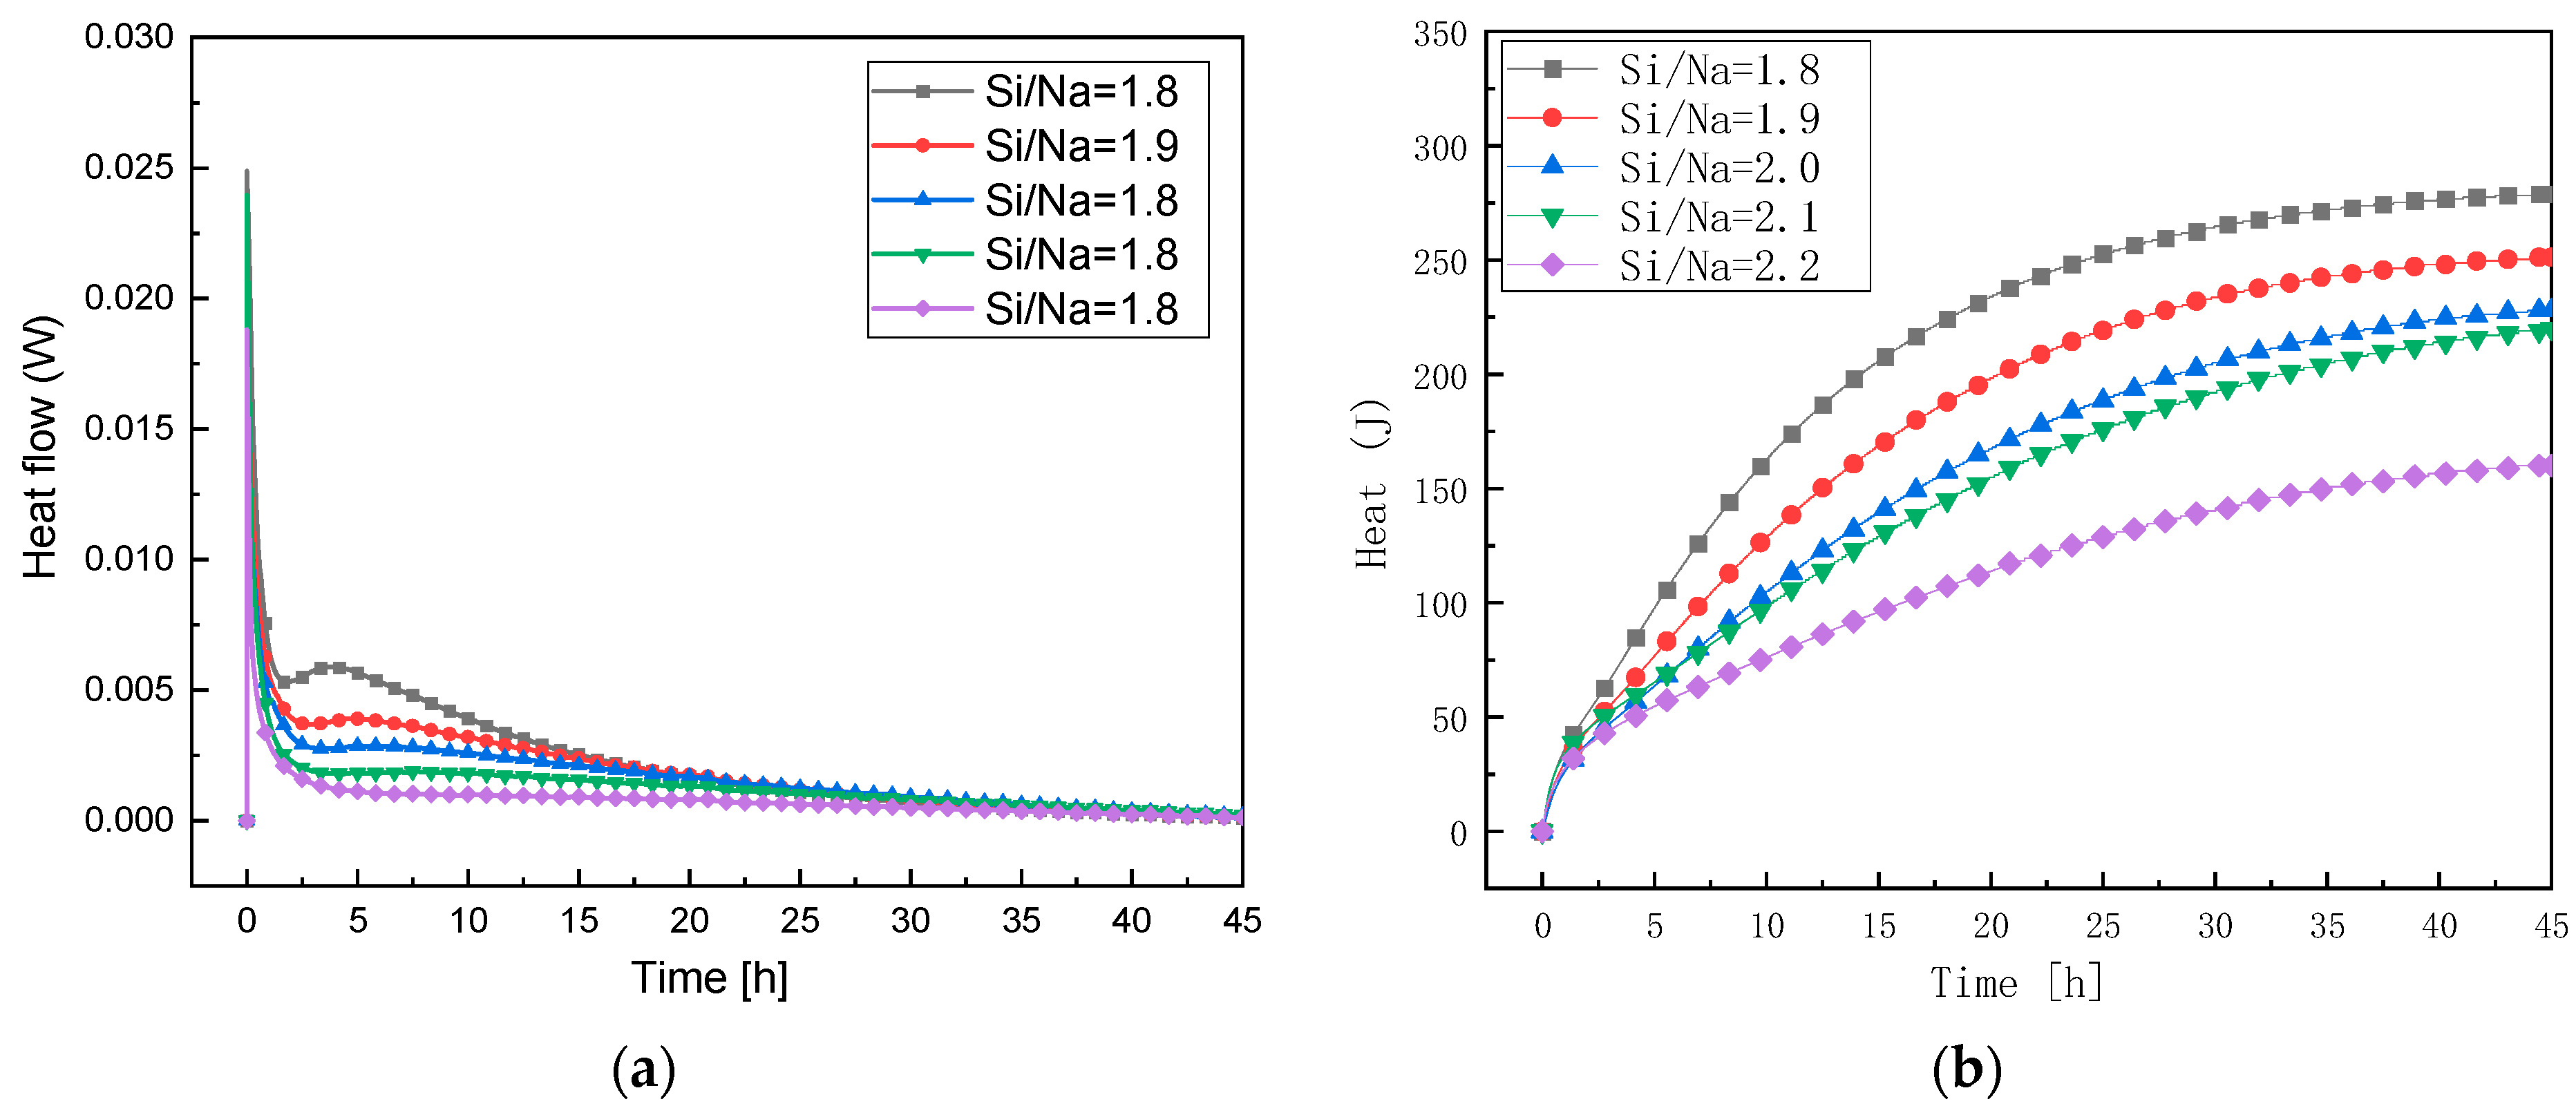
- The exothermic reaction rates and the cumulative exothermic reactions of the geopolymers first increased and then gradually slowed down with an increase in the Al/Na ratio. This showed that an increase in the Al/Na ratio made the reaction levels first increase and then decrease. The exothermic reaction rates and the cumulative exothermic reaction of the geopolymers gradually decreased with an increase in the Si/Na ratio, which indicated that an increase in the Si/Na ratio made the reaction levels decrease.
- The SEM and MIP results showed that the smaller the pH value of a geopolymer pore solution, the denser the microstructure. Thus, the microstructures had good correlations with the changes in the pH values of the geopolymer pore solutions. The phase compositions after the hydration reactions were basically the same since the Al/Na and Si/Na ratios mainly affected the reaction levels of the geopolymers.
Author Contributions
Funding
Institutional Review Board Statement
Informed Consent Statement
Data Availability Statement
Conflicts of Interest
References
- Davidovits, J. Geopolymers: Inorganic polymeric new materials. J. Therm. Anal. Calorim. 1991, 37, 1633–1656. [Google Scholar] [CrossRef]
- Awoyera, P.O.; Adesina, A.; Sivakrishna, A.; Gobinath, R.; Kumar, K.R.; Srinivas, A. Alkali activated binders: Challenges and opportunities. Mater. Today Proc. 2020, 27, 40–43. [Google Scholar] [CrossRef]
- Peiliang, C.; Yaqian, C. Advances in geopolymer materials: A comprehensive review. J. Traffic Transp. Eng. Engl. Ed. 2021, 8, 283–314. [Google Scholar]
- Komnitsas, K.; Zaharaki, D. Geopolymerisation: A review and prospects for the minerals industry. Miner. Eng. 2007, 20, 1261–1277. [Google Scholar] [CrossRef]
- Ahmaruzzaman, M. A review on the utilization of fly ash. Prog. Energy Combust. Sci. 2010, 36, 327–363. [Google Scholar] [CrossRef]
- Zhang, B.; Zhu, H.; Cheng, Y.; Huseien, G.F.; Shah, K.W. Shrinkage mechanisms and shrinkage-mitigating strategies of alkali-activated slag composites: A critical review. Constr. Build. Mater. 2022, 318, 125993. [Google Scholar] [CrossRef]
- Ding, Y.; Dai, J.-G.; Shi, C.-J. Mechanical properties of alkali-activated concrete: A state-of-the-art review. Constr. Build. Mater. 2016, 127, 68–79. [Google Scholar] [CrossRef] [Green Version]
- Gao, X.; Yu, Q.L.; Brouwers, H.J.H. Reaction kinetics, gel character and strength of ambient temperature cured alkali activated slag–fly ash blends. Constr. Build. Mater. 2015, 80, 105–115. [Google Scholar] [CrossRef] [Green Version]
- Abdelli, K.; Tahlaiti, M.; Belarbi, R.; Oudjit, M.N. Influence of the origin of metakaolin on pozzolanic reactivity of mortars. Energy Procedia 2017, 139, 230–235. [Google Scholar] [CrossRef]
- Imtiaz, L.; Rehman, S.; Memon, S.A.; Khan, M.K.; Javed, M.F. A Review of Recent Developments and Advances in Eco-Friendly Geopolymer Concrete. Appl. Sci. 2020, 10, 7838. [Google Scholar] [CrossRef]
- Yang, T.; Zhu, H.; Zhang, Z. Influence of fly ash on the pore structure and shrinkage characteristics of metakaolin-based geopolymer pastes and mortars. Constr. Build. Mater. 2017, 153, 284–293. [Google Scholar] [CrossRef]
- Hadi, M.N.; Al-Azzawi, M.; Yu, T. Effects of fly ash characteristics and alkaline activator components on compressive strength of fly ash-based geopolymer mortar. Constr. Build. Mater. 2018, 175, 41–54. [Google Scholar] [CrossRef]
- Gharzouni, A.; Joussein, E.; Samet, B.; Baklouti, S.; Rossignol, S. Effect of the reactivity of alkaline solution and metakaolin on geopolymer formation. J. Non-Cryst. Solids 2015, 410, 127–134. [Google Scholar] [CrossRef]
- Muñiz-Villarreal, M.S.; Manzano-Ramírez, A.; Sampieri-Bulbarela, S.; Gasca-Tirado, J.R.; Reyes-Araiza, J.L.; Rubio-Ávalos, J.C.; Amigó-Borrás, V. The effect of temperature on the geopolymerization process of a metakaolin-based geopolymer. Mater. Lett. 2011, 65, 995–998. [Google Scholar] [CrossRef]
- Rovnaník, P. Effect of curing temperature on the development of hard structure of metakaolin-based geopolymer. Constr. Build. Mater. 2010, 24, 1176–1183. [Google Scholar] [CrossRef]
- Tang, S.; Yao, Y.; Andrade, C.; Li, Z. Recent durability studies on concrete structure. Cem. Concr. Res. 2015, 78, 143–154. [Google Scholar] [CrossRef]
- Stefanoni, M.; Angst, U.; Elsener, B. Corrosion rate of carbon steel in carbonated concrete—A critical review. Cem. Concr. Res. 2018, 103, 35–48. [Google Scholar] [CrossRef]
- Lizcano, M.; Gonzalez, A.; Basu, S.; Lozano, K.; Radovic, M. Effects of Water Content and Chemical Composition on Structural Properties of Alkaline Activated Metakaolin-Based Geopolymers. J. Am. Ceram. Soc. 2012, 95, 2169–2177. [Google Scholar] [CrossRef]
- Shi, Z.; Lothenbach, B. The role of calcium on the formation of alkali-silica reaction products. Cem. Concr. Res. 2019, 126, 105898. [Google Scholar] [CrossRef]
- Bernal, S.A. The resistance of alkali-activated cement-based binders to carbonation. In Handbook of Alkali-Activated Cements, Mortars and Concretes; Woodhead Publishing: Sawston, UK, 2015; pp. 319–332. [Google Scholar]
- Pouhet, R.; Cyr, M. Carbonation in the pore solution of metakaolin-based geopolymer. Cem. Concr. Res. 2016, 88, 227–235. [Google Scholar] [CrossRef]
- Su, M.; Zhong, Q.; Peng, H. Regularized multivariate polynomial regression analysis of the compressive strength of slag-metakaolin geopolymer pastes based on experimental data. Constr. Build. Mater. 2021, 303, 124529. [Google Scholar] [CrossRef]
- Shi, Z.; Shi, C.; Wan, S.; Ou, Z. Effect of alkali dosage on alkali-silica reaction in sodium hydroxide activated slag mortars. Constr. Build. Mater. 2017, 143, 16–23. [Google Scholar] [CrossRef]
- Lv, Y.; Wang, S.; Ge, Y.; Xiao, B.; Peng, H. CInfluence of slag mixing on alkalinity and geological polymerization behavior of polymer pore solution in metakaolin base. J. Cent. South Univ. Sci. Technol. 2021, 52, 4434–4442. [Google Scholar]
- Wang, H.; Wu, H.; Xing, Z.; Wang, R.; Dai, S. The Effect of Various Si/Al, Na/Al Molar Ratios and Free Water on Micromorphology and Macro-Strength of Metakaolin-Based Geopolymer. Materials 2021, 14, 3845. [Google Scholar] [CrossRef]
- Lahoti, M.; Narang, P.; Tan, K.H.; Yang, E.H. Mix design factors and strength prediction of metakaolin-based geopolymer. Ceram. Int. 2017, 43, 11433–11441. [Google Scholar] [CrossRef]
- Wan, Q.; Rao, F.; Song, S.; García, R.E.; Estrella, R.M.; Patiño, C.L.; Zhang, Y. Geopolymerization reaction, microstructure and simulation of metakaolin-based geopolymers at extended Si/Al ratios. Cem. Concr. Compos. 2017, 79, 45–52. [Google Scholar] [CrossRef]
- Gao, B.; Jang, S.; Son, H.; Lee, H.J.; Lee, H.J.; Yang, J.J.; Bae, C.J. Study on mechanical properties of kaolin-based geopolymer with various Si/Al ratio and aging time. J. Korean Ceram. Soc. 2020, 57, 709–715. [Google Scholar] [CrossRef]
- Castillo, H.; Collado, H.; Droguett, T.; Sánchez, S.; Vesely, M.; Garrido, P.; Palma, S. Factors Affecting the Compressive Strength of Geopolymers: A Review. Minerals 2021, 11, 1317. [Google Scholar] [CrossRef]
- Noorpour, M.; Tarighat, A. Effects of Si/Al ratio on structure, modulus of elasticity, and density in NASH geopolymer: A molecular dynamics simulation based on novel macromolecular model. J. Mol. Model. 2021, 27, 342. [Google Scholar] [CrossRef]
- Berry, E.; Hemmings, R.; Cornelius, B. Mechanisms of hydration reactions in high volume fly ash pastes and mortars. Cem. Concr. Compos. 1990, 12, 253–261. [Google Scholar] [CrossRef]
- Newton, C.; Sykes, J. The effect of salt additions on the alkalinity of Ca(OH)2 solutions. Cem. Concr. Res. 1987, 17, 765–776. [Google Scholar] [CrossRef]
- Bérubé, M.A.; Frenette, J.; Rivest, M.; Vézina, D. Measurement of the alkali content of concrete using hot-water extraction. Cem. Concr. Aggreg. 2002, 24, 28–36. [Google Scholar]
- Duchesne, J.; Berube, M.A. Available alkalies from supplementary cementing materials. Mater. J. 1994, 91, 289–299. [Google Scholar]
- Figueira, R.; Sousa, R.; Coelho, L.; Azenha, M.; de Almeida, J.; Jorge, P.; da Silva, C.J.R. Alkali-silica reaction in concrete: Mechanisms, mitigation and test methods. Constr. Build. Mater. 2019, 222, 903–931. [Google Scholar] [CrossRef]
- Haque, M.N.; Kayyali, O.A. Aspects of chloride ion determination in concrete. Mater. J. 1993, 92, 532–541. [Google Scholar]
- Paudel, S.R.; Yang, M.; Gao, Z. pH Level of Pore Solution in Alkali-Activated Fly-Ash Geopolymer Concrete and Its Effect on ASR of Aggregates with Different Silicate Contents. J. Mater. Civ. Eng. 2020, 32, 04020257. [Google Scholar] [CrossRef]
- Natkunarajah, K.; Masilamani, K.; Maheswaran, S.; Lothenbach, B.; Amarasinghe, D.; Attygalle, D. Analysis of the trend of pH changes of concrete pore solution during the hydration by various analytical methods. Cem. Concr. Res. 2022, 156, 106780. [Google Scholar] [CrossRef]


| Raw Material | SiO2 | Al2O3 | Fe2O3 | MgO | Na2O | K2O | Others |
|---|---|---|---|---|---|---|---|
| Amount (%) | 54.5 | 43 | 1.0 | 0.8 | 0.1 | 0.4 | 0.2 |
| Sample | Al/Na | Si/Na | Sodium Silicate Dosage (g) | NaOH Dosage (g) | Amount of Deionized Water (g) |
|---|---|---|---|---|---|
| A1 | 1.0 | 2.0 | 175.89 | 14.74 | 26.83 |
| A2 | 1.1 | 141.23 | 15.42 | 28.19 | |
| A3 | 1.2 | 112.36 | 15.98 | 29.32 | |
| A4 | 1.3 | 87.93 | 16.45 | 30.28 | |
| A5 | 1.4 | 66.93 | 16.86 | 31.10 | |
| S1 | 1.3 | 1.8 | 58.61 | 19.62 | 36.25 |
| S2 | 1.9 | 73.27 | 18.03 | 33.26 | |
| S3 | 2.0 | 87.93 | 16.45 | 30.28 | |
| S4 | 2.1 | 102.59 | 14.87 | 27.30 | |
| S5 | 2.2 | 117.25 | 13.29 | 24.31 |
Disclaimer/Publisher’s Note: The statements, opinions and data contained in all publications are solely those of the individual author(s) and contributor(s) and not of MDPI and/or the editor(s). MDPI and/or the editor(s) disclaim responsibility for any injury to people or property resulting from any ideas, methods, instructions or products referred to in the content. |
© 2023 by the authors. Licensee MDPI, Basel, Switzerland. This article is an open access article distributed under the terms and conditions of the Creative Commons Attribution (CC BY) license (https://creativecommons.org/licenses/by/4.0/).
Share and Cite
Han, W.; Lv, Y.; Wang, S.; Qiao, J.; Zou, C.; Su, M.; Peng, H. Effects of Al/Na and Si/Na Molar Ratios on the Alkalinity of Metakaolin-Based Geopolymer Pore Solutions. Materials 2023, 16, 1929. https://doi.org/10.3390/ma16051929
Han W, Lv Y, Wang S, Qiao J, Zou C, Su M, Peng H. Effects of Al/Na and Si/Na Molar Ratios on the Alkalinity of Metakaolin-Based Geopolymer Pore Solutions. Materials. 2023; 16(5):1929. https://doi.org/10.3390/ma16051929
Chicago/Turabian StyleHan, Weiwei, Yigang Lv, Shiyu Wang, Jie Qiao, Chaosheng Zou, Miao Su, and Hui Peng. 2023. "Effects of Al/Na and Si/Na Molar Ratios on the Alkalinity of Metakaolin-Based Geopolymer Pore Solutions" Materials 16, no. 5: 1929. https://doi.org/10.3390/ma16051929