Article

Effects of Film Thickness of ALD-Deposited Al2O3, ZrO2 and HfO2 Nano-Layers on the Corrosion Resistance of Ti(N,O)-Coated Stainless Steel

1
National Institute of Research and Development for Optoelectronics INOE 2000, 409 Atomistilor St., 077125 Magurele, Romania
2
Department of Energy, Environmental & Chemical Engineering, Washington University in St. Louis, St. Louis, MO 63130, USA
3
Department of Separation Science, School of Engineering Science, Lappeenranta-Lahti University of Technology LUT, Yliopistonkatu 34, FI-53850 Lappeenranta, Finland
4
Physical Materials Science and Composite Materials Centre, Research School of Chemistry & Applied Biomedical Sciences, National Research Tomsk Polytechnic University, Lenin Avenue 43, Tomsk 634050, Russia
5
Department of Chemistry, Environmental and Nano Sciences, University of the Western Cape, Robert Sobukwe Road, Bellville 7535, South Africa
*
Author to whom correspondence should be addressed.
Materials 2023, 16(5), 2007; https://doi.org/10.3390/ma16052007
Submission received: 30 December 2022 / Revised: 15 February 2023 / Accepted: 24 February 2023 / Published: 28 February 2023

Abstract

:
The goal of this stydy was to explore the potential of the enhanced corrosion resistance of Ti(N,O) cathodic arc evaporation-coated 304L stainless steel using oxide nano-layers deposited by atomic layer deposition (ALD). In this study, we deposited Al2O3, ZrO2, and HfO2 nanolayers of two different thicknesses by ALD onto Ti(N,O)-coated 304L stainless steel surfaces. XRD, EDS, SEM, surface profilometry, and voltammetry investigations of the anticorrosion properties of the coated samples are reported. The amorphous oxide nanolayers homogeneously deposited on the sample surfaces exhibited lower roughness after corrosion attack compared to the Ti(N,O)-coated stainless steel. The best corrosion resistance was obtained for the thickest oxide layers. All samples coated with thicker oxide nanolayers augmented the corrosion resistance of the Ti(N,O)-coated stainless steel in a saline, acidic, and oxidising environment (0.9% NaCl + 6% H2O2, pH = 4), which is of interest for building corrosion-resistant housings for advanced oxidation systems such as cavitation and plasma-related electrochemical dielectric barrier discharge for breaking down persistent organic pollutants in water.

Graphical Abstract

1. Introduction

The exposure of stainless steel (SS) to harsh environments may result in corrosion that further limits its performance and durability. It is therefore necessary to develop an effective method to prevent corrosion. For decades, thin films have been studied because of their exceptional physical and chemical features including excellent thermal stability, low friction coefficient, and good wear resistance [1]. These properties have been improved by means of multilayer deposition onto selected supports, although their application depends on cost and practicality. Physical vapor deposition (PVP), such as the reactive arc evaporation process, has long been used as an adequate technique to develop monolayer and multilayer coatings. Titanium nitride (TiN) films obtained by PVD are claimed to show restricted corrosion protection ability due to their fundamental permeability. The increase in film thickness has been identified as a practical approach in order to enhance corrosion resistance [2]. Moreover, the use of bi- and multi-layered coatings containing two layers with distinct composition was productively used in engineering applications such as the automotive, aircraft, and tool industries [1]. The superior features are the result of the presence of interfaces that ensure crack deflection, thus providing enhanced ductility and decreased stress levels, resulting in higher adhesion to the bulk substrate. In corrosive environments, the interfaces block the access of liquid to the bulk support, providing superior corrosion resistance.
Subramanian et al. investigated the corrosion protection ability of the titanium nitride coatings TiN, TiON, and TiAlN for biomedical applications [3] and their results showed that the CP–Ti/TiAlN coating exhibited higher corrosion performance. Ti(N,O) coatings represent a valuable option due to their superior mechanical and tribological properties. The quite recent studies on titanium oxynitride films explored their dependency on the N/O ratio, which allow their use as solar selective absorbers [4], biocompatible materials [5,6], plasmonic material for nano-photonics [7], or photocatalytic coatings [8,9], to name a few. We previously reported on the improved corrosion resistance of cathodic acr deposited TiN coating in 0.10 M NaCl + 1.96 M H2O2 solution with low oxygen concentration (about 7.3 at.%), compared to TiN coatings obtained using the same deposition method [10]. Even if TiN coatings are known to be corrosion resistant, Esaka et al. demonstrated using absorption and X-ray photoelectron spectroscopies that the oxidation of TiN films is ascribable to the formation of Nx–Ti–Oy-like structures, permitting the diffusion of oxygen from the corrosive solution. Thus, a decrease in the corrosion resistance of TiN compared to CrN is observed, in which Cr2O3 is immediately formed at the coating–solution interface, without the formation of Nx–Cr–Oy-like structures [11]. In addition, Wang et al. demonstrated that in an O2 environment, TiN coating, unlike stainless steel, showed lower corrosion resistance than in a H2 environment [12].
Our aim is to use corrosion-resistant, coated SS as a material for building corrosion-resistant housings for advanced oxidation systems such as cavitation and plasma-related electrochemical dielectric barrier discharge for breaking down persistent organic pollutants in water [13,14,15,16], because normal SS corrodes very quickly in these systems.
Attempting to further improve the corrosion resistance of Ti(N,O) coatings with a low oxygen content, we apply a second layer of ultrathin oxide coating due to the known good chemical and mechanical stability of oxide films [17]. Because TiN and Ti(N,O) grown by CAE present a compressive stress, we chose to use a deposition method that may produce a very thin, continuous and conformal coating to avoid delamination of the two layers. These dense and conformal films are expected to diminish the pinhole and droplet density specific for the CAE-deposited coatings, enabling sealing even with thin coatings of nanometre thicknesses [18]. Even though various approaches have been used to prepare thin films, it is still challenging to obtain a smooth and conformal dense film. Previous investigations claimed that ALD is an advanced method to engineer films of good quality at the nanoscale [19,20]. Atomic layer deposition (ALD) is a self-limiting reaction that involves the use of a precursor and oxidant followed by a flow of inert gas [21,22]. The common advantages of ALD include the control of film thickness, minor structural pinholes, low defect density, and good film uniformity [23,24]. These unique properties justify the extensive application of ALD for film coatings over the past decades [25,26,27,28,29]. Fedel and Deflorian performed atomic layer-deposited Al2O3 films on AISI 316L stainless steel [30]. The corrosion resistance of Al2O3 deposits were evaluated by potentiodynamic measurements and electrochemical impedance spectroscopy (EIS) in 0.2 M NaCl saline environment for up to 1000 h of non-stop immersion. Their outcomes showed that the corrosion current density of the bare support (10−6 A/cm2) declined proportionally with the increase in the deposition layers Al2O3–500 (10−8 A/cm2) and Al2O3–1000 (10−9 A/cm2), respectively. Their results suggested that the addition of Al2O3 layers greatly shielded the bare AISI 316L stainless steel against corrosive aggression. Belén Díaz et al. engineered ultra-thin (5 to 50 nm) films of aluminium and tantalum oxides by ALD at two deposition temperatures (250 °C and 160 °C) onto a 316L stainless steel support [31]. The corrosion protection behaviour of the coatings was investigated by linear scan voltammetry (LSV) and electrochemical impedance spectroscopy (EIS) in 0.8 M NaCl saline medium. The results indicated that the current density decreased by up to four orders of magnitude with an increase of coating thickness from 5 to 50 nm. In both cases, thicker coatings (50 nm) of Al2O3 and Ta2O5 exhibited the greatest corrosion resistance at 250 °C, with Al2O3 having superior shielding properties. These examples show that ALD is an ideal method because it is capable of depositing ultrathin, conformal films with sub-nanometre thickness control [32]. ALD has been widely used in anti-corrosion applications without diminishing the desirable functions of the support [18,32,33,34]. Generally, inorganic coatings, especially ceramics, show good insulating, tribological, and corrosion resistance properties in aggressive media. Al2O3 is the most frequently studied ALD thin film for corrosion protection, because it has been shown to nucleate well on metals, giving rise to low porosity that prevents the solution from accessing the metal [32,35,36]. ZrO2 reveals excellent properties such as high strength, high fracture toughness, excellent wear resistance, high hardness, and excellent chemical resistance [17,26,37,38,39]. HfO2 is a highly resistive material; its dielectric constant is several times higher than conventional silica gate dielectrics. The Pourbaix diagram shows the formation of a stable passive oxide on hafnium over the entire potential pH range. Due to these features, thin layers of HfO2 are applied for anticorrosion protection [17,39].
In this study, we coated Al2O3, ZrO2, and HfO2 thin films of various thicknesses on stainless steel support surfaces using ALD to investigate their anticorrosion performance. We theorise that Al2O3, ZrO2 and HfO2 prepared using ALD could improve the corrosion protection properties of the Ti(N,O) coating that we previously developed using CAE onto stainless steel supports [10]. Based on our information, the deposition on stainless steel supports of different layers obtained by CAE and then by ALD has not been reported to date. The rationale of this approach is based on the attempt to combine the chemical stability of oxide films obtained by ALD, which perfectly enrobe the support, and the high hardness and adhesion of the coatings synthetised by CAE. Furthermore, we used an accelerated corrosion test using saline, acidic, and oxidising solution. To our knowledge, there are few examples of tests carried out in such corrosive solutions [40,41,42] on ALD-coated supports. The corrosion protection behaviour of the fabricated coatings was assessed by potentiodynamic polarisation tests in a simulated corrosive environment (0.9% NaCl + 6% H2O2, pH = 4). The 0.9% NaCl solution is often used as an initial baseline test for understanding the fundamental response of the metal or coating [43]. The addition of H2O2 mimics the solutions used in an advanced oxidation system, and that is the reason for using the aggressive test solution 0.9%NaCl + 6% H2O2. Noteworthy is that the chloride ion is one of the important driving forces of corrosion for steels, but it consumes hydroxyl radicals. To prevent this, we added 6% H2O2, because at a low pH of the solution and a H2O2 concentration higher than 10 mg/L, the consumption of the hydroxyl radicals by chlorine is hindered, permitting the presence of H2O2 for a few hours in the saline solution [44]. The effect of the number of ALD cycles on the ceramic film thickness, growth mechanism, and corrosion resistance were also investigated.

2. Materials and Methods

All coatings were deposited on 304L stainless steel, abbreviated as SS. The composition of 304 SS rods (provided by Bibus Metals AG, Fehraltorf, Switzerland), from which the discs were machined, is (wt.%): Fe = 70.974%, Cr = 17.742%, Ni = 8.526%, Mn = 1.23%, Mo = 0.585%, Cu = 0.536%, Si = 0.206%, Co = 0.16%, P = 0.021%, S = 0.014%, and C = 0.006%.

2.1. Coating Deposition

According to a previous study [10], PVD-deposited Ti(O,N) showed the highest protection efficiency for SS against NaCl corrosive attack.
To summarise, the Ti(N,O) coatings were deposited on SS discs (20 mm diameter and 2 mm thickness) using a Ti cathode (99.5% purity, Cathay Advanced Materials Ltd., Guangzhou, China) by reactive CAE in a mixture of nitrogen and oxygen. We chose 304L SS because compared to other types of stainless steels, it has a low carbon content, such that it presents a higher corrosion resistance. Moreover, it is non-magnetic after annealing, which might be of interest for certain applications.
The discs were first polished with abrasive paper (80 to 800 mesh size) and then repeatedly polished with a 0.5 μm diamond suspension to reach a roughness (Ra) of about 13 nm. The discs were cleaned using an ultrasonic bath in acetone, isopropyl alcohol, and distilled water, and then were flushed with dried nitrogen. Two Si coupons of 10 × 10 mm were used for the measurement of the coatings, covered with 2 mm Si band firmly attached to the Si coupons, so as to provide a non-coated area with a sharp edge. After being introduced into the deposition chamber, on a rotating holder that ensured the uniformity of the coating, a residual pressure of 5 × 10⁻⁴ Pa was attained. Then, the discs were bombarded by 1 keV Ar+ at 10−2 Pa for final cleaning. The Ti(N,O) deposition parameters were as follows: total gas pressure during deposition = 8 × 10⁻² Pa; N2 flow rate = 60 sccm; O2 flow rate = 17 sccm; arc current on Ti cathode = 90 A; support bias voltage = −200 V; support temperature = 200 °C. All of the 21 SS discs were coated with Ti(N,O) in one run due to the large diameter of the deposition chamber (80 cm).
Figure 1 presents the setup for the cathodic arc deposition.
In the present work, ALD was employed to further inhibit the corrosion of the prepared SS/Ti(N,O) using Al2O3, ZrO2, and HfO2 layer deposition. The precursors were trimethylaluminum (TMA, Sigma Aldrich, St. Louis, MO, USA) and deionised (DI) water for Al2O3 ALD, tetrakis(dimethylamido)zirconium (TDMAZ, Sigma Aldrich) and 30 wt.% hydrogen peroxide (Sigma Aldrich) in water for ZrO2 ALD, and tetrakis(diethylamido)hafnium (TDEAH, Sigma Aldrich) and 30 wt.% hydrogen peroxide in water for HfO2 ALD.
For the Al2O3 ALD, 40 and 80 cycles of Al2O3 ALD (40c- and 80c-Al2O3) were applied; for the ZrO2 ALD, 45 and 90 cycles of ZrO2 ALD were applied; and for the HfO2 ALD, 55 and 110 cycles of HfO2 ALD were applied. Each type of oxide coating with two thickness was deposited on three SS/Ti(N,O) samples.
In a typical run, the pieces of SS/Ti(N,O) were degassed at 150 °C overnight under nitrogen (N2) atmosphere before ALD. All of the ALD processes were carried out at 200 °C. All precursor feed lines were kept above 120 °C to prevent the condensation of any precursors. Taking Al2O3 ALD as an example, TMA was used as the Al precursor and DI water as the other reactant. TMA was kept at 25 °C to achieve a reasonable vapor pressure. The obtained TMA vapor was carried by ultrahigh purity N2 to the reactor. Then, the system was held for several seconds. After that, unreacted precursors and any by-products were removed by ultrahigh purity N2 during the reaction. The timing sequence for a typical Al2O3 ALD was 5 s, 10 s, 180 s, 30 s, 3 s, 10 s, 180 s, and 30 s for TMA dose, system hold, N2 flush, evacuation, DI water dose, system hold, N2 flush, and evacuation, respectively. ZrO2 and HfO2 ALD followed a similar procedure. The temperature for the TDMAZ/TDEAH bubbler was held at 80 °C. The time sequence for ZrO2 and HfO2 ALD was 10 s, 20 s, 240 s, 30 s, 5 s, 20 s, 240 s, and 30 s for TDMAZ/TDEAH dose, system hold, N2 flush, evacuation, 30 wt.% hydrogen peroxide dose, system hold, N2 flush, and evacuation, respectively. In the ALD process, the number of cycles was chosen so as to obtain the same thickness values for all oxides, i.e., 5 nm for the lower number of cycles and 10 nm for the highest ones. This choice of metal oxide was based on our previous studies [33]. The number of cycles was determined based on different theoretical growth rates. For example, Al2O3 exhibited a growth rate of 1.3Å per cycle [45], while ZrO2 was 1.2Å per cycle [46], slightly lower than that of Al2O3. HfO2 had a growth rate of 0.94 Å per cycle [47].

2.2. Coating Characterisation

A Dektak 150 surface profilometer (Bruker, Billerica, MA, USA) with a 2.5 µm stylus diameter was used to measure the Ti(N,O) coatings and the surface roughness of the SS supports as well as all of the deposited coatings. The thickness of the deposited coating was obtained using the edge separating the coating and the uncoated part of the Si coupons. Five lines perpendicular to the edge were measured on each Si coupon. The measured thickness values were averaged, resulting a thickness of about 1 µm (1008 ± 12 nm). All roughness measurements were taken at 10 randomly chosen areas, with the results being averaged. The roughness of each coating was determined over 1 cm during 200 s. Three roughness parameters were used for roughness evaluation and their impact on corrosion resistance: Ra (arithmetic average), Rq (root-mean-square), and Sk (symmetry of the profile about the mean line).
A Hitachi TM3030 Plus (Tokyo, Japan) scanning electron microscope (SEM) coupled to an energy-dispersive X-ray spectrometer (EDS) (Bruker, Billerica, MA, USA) provided the surface morphology and elemental composition of the coatings. The elemental composition measurements were taken at three different areas on each deposited coating, the results were averaged, and the standard deviation (SD) was calculated. The images of surface morphology and elemental composition were obtained by mixed images of backscattering and secondary electrons in one area.
A SmartLab diffractometer (Rigaku, Tokyo, Japan) with CuKα radiation (λ = 0.15405 nm) was used for phase composition investigation. The measurements were performed in a 2θ range of 20° to 100°, using the following parameters: 2° incidence angle, 2°/min. scanning speed, 0.02° step size.
The corrosion process was evaluated by a potentiostat/galvanostat VersaSTAT 3 (Princeton Applied Research, Oak Ridge, TN, USA) and the data were recorded using Versa Studio software (version 2.60.6, Princeton Applied Research, Oak Ridge, TN, USA). 100 mL of 0.9% NaCl + 6% H2O2 (pH = 4) was used as test medium. The tests were carried out at room temperature (22 ± 1 °C). A standard three electrode cell was used, with platinum as the counter electrode (CE), Ag/AgCl (KCl sat. (0.197 V)) as the reference electrode (RE), and the investigated specimens as the working electrode (WE) (mounted in a Teflon holder with 1 cm2 exposed area). After immersion, the specimens were monitored for 1 h, while the open circuit potential (Eoc) was recorded over time. The time evolution of the potential assumed by the surface in the absence of electrical polarisation (Eoc) defines its ability to either be oxidised or reduced, as the sample’s surface is already subject to degradation, but the corrosive attack is very slow, as happens in natural conditions. The Eoc evolution indicates whether the electrochemical system is stable, or at least stable enough thermodynamically, for a perturbation-based experiment, such as the potentiodynamic polarisation experiment. Even if the oxides are resistant to corrosion, we measured the time evolution of Eoc because this is the norm for thin and very thin films due to the possible degradation of the deposited oxides, e.g., Jafari et al. [48]. The potentiodynamic tests were carried out afterward and the corrosion potential (Ecorr), corrosion current density (icorr), and anodic (βa) and cathodic (βc) slopes were directly estimated from Tafel plots, which were recorded from −250 to 250 mV vs. Eoc, at a scanning rate of 1 mV/s. The polarisation resistance (Rp) was calculated based on the Stern–Geary equation [49], using the icorr values previously determined, and Tafel anodic and cathodic slopes.
The sample designation indicates the support (SS), the first coating Ti(N,O) deposited by reactive CAE, and the second layer of oxide deposited using ALD along with the number of cycles, e.g., SS/Ti(N,O)/Al2O3-40c.

3. Results

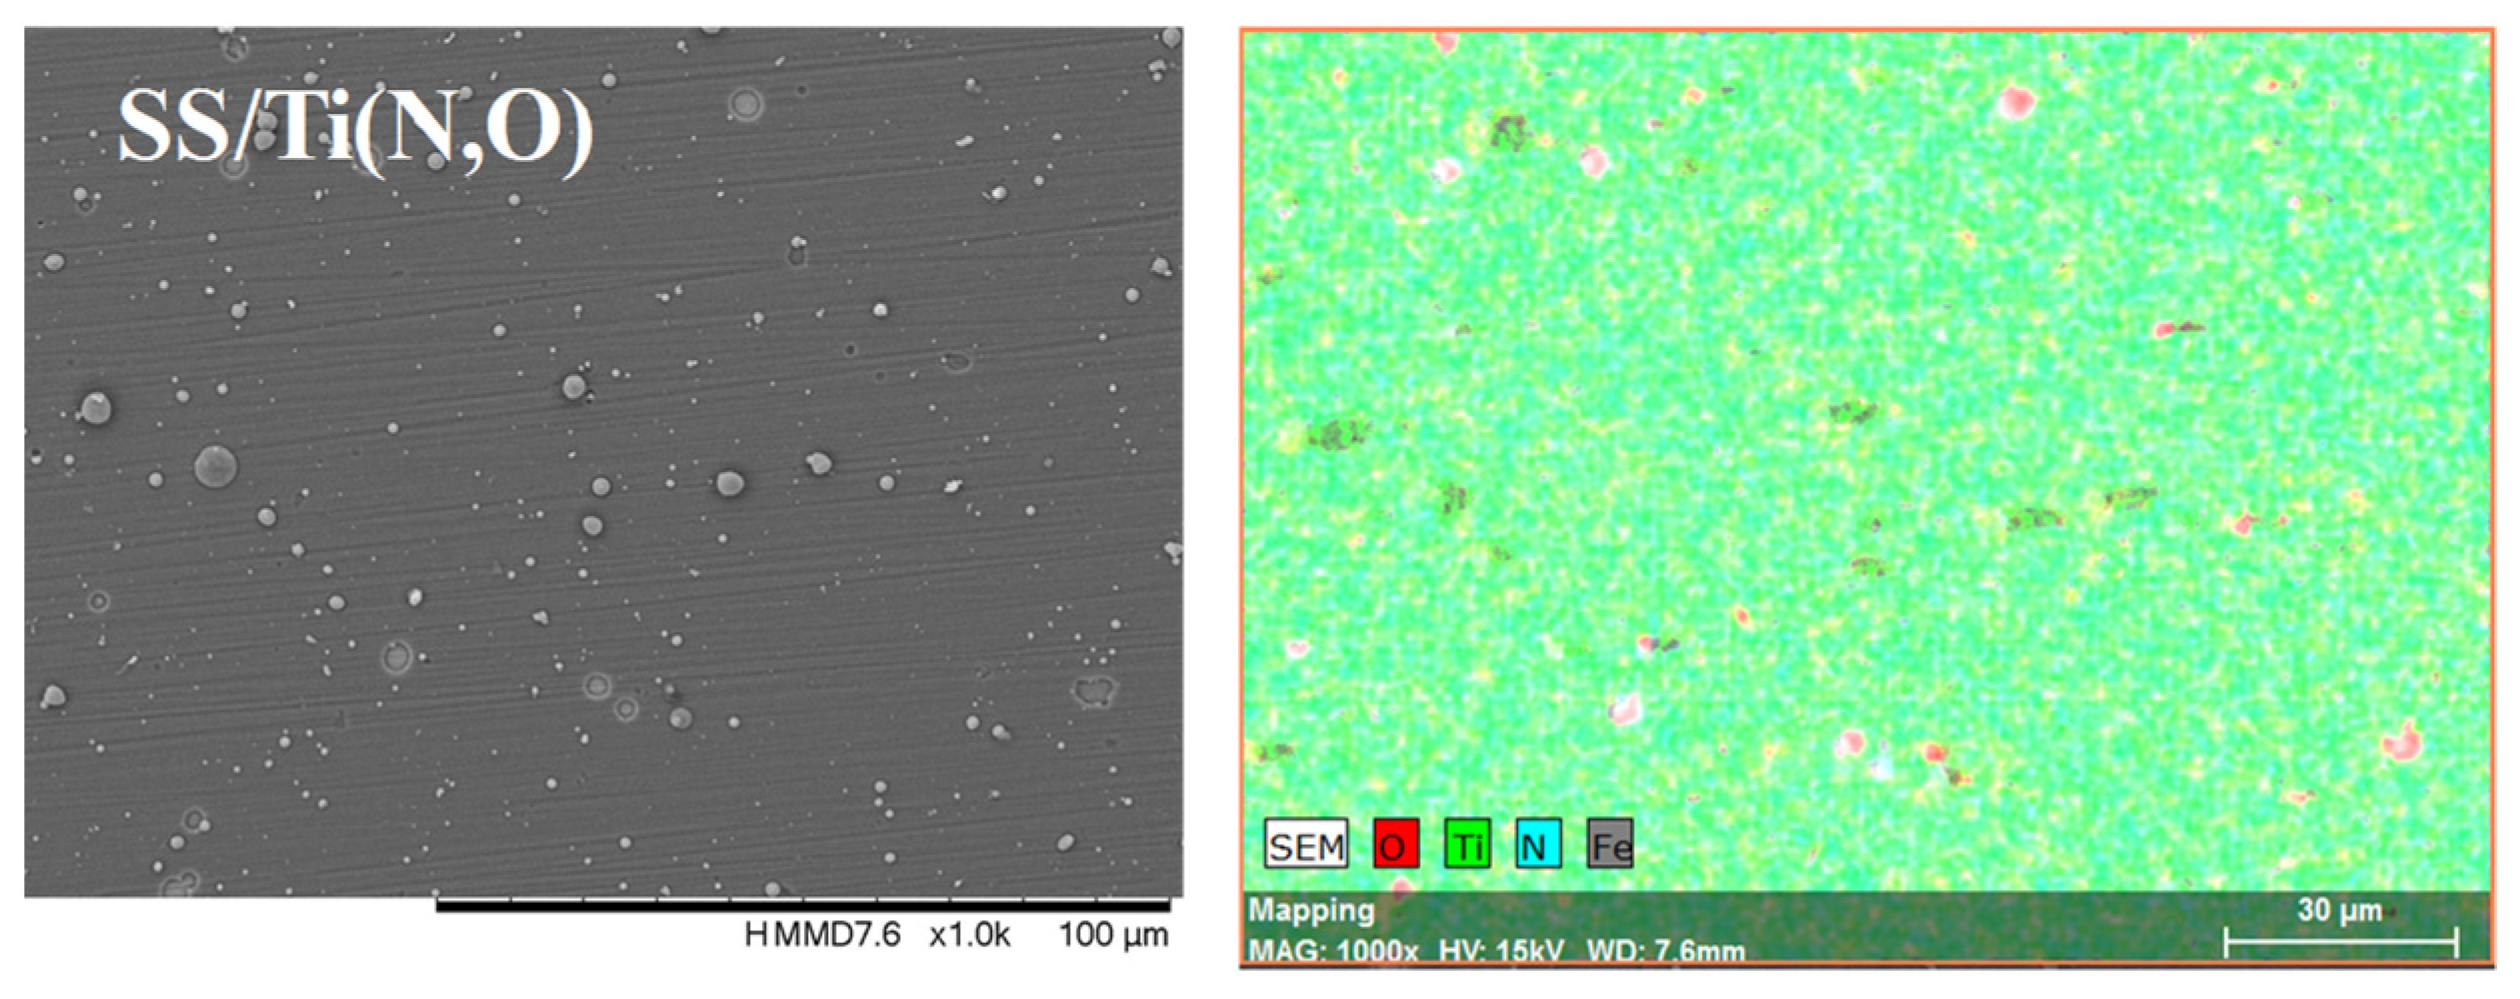
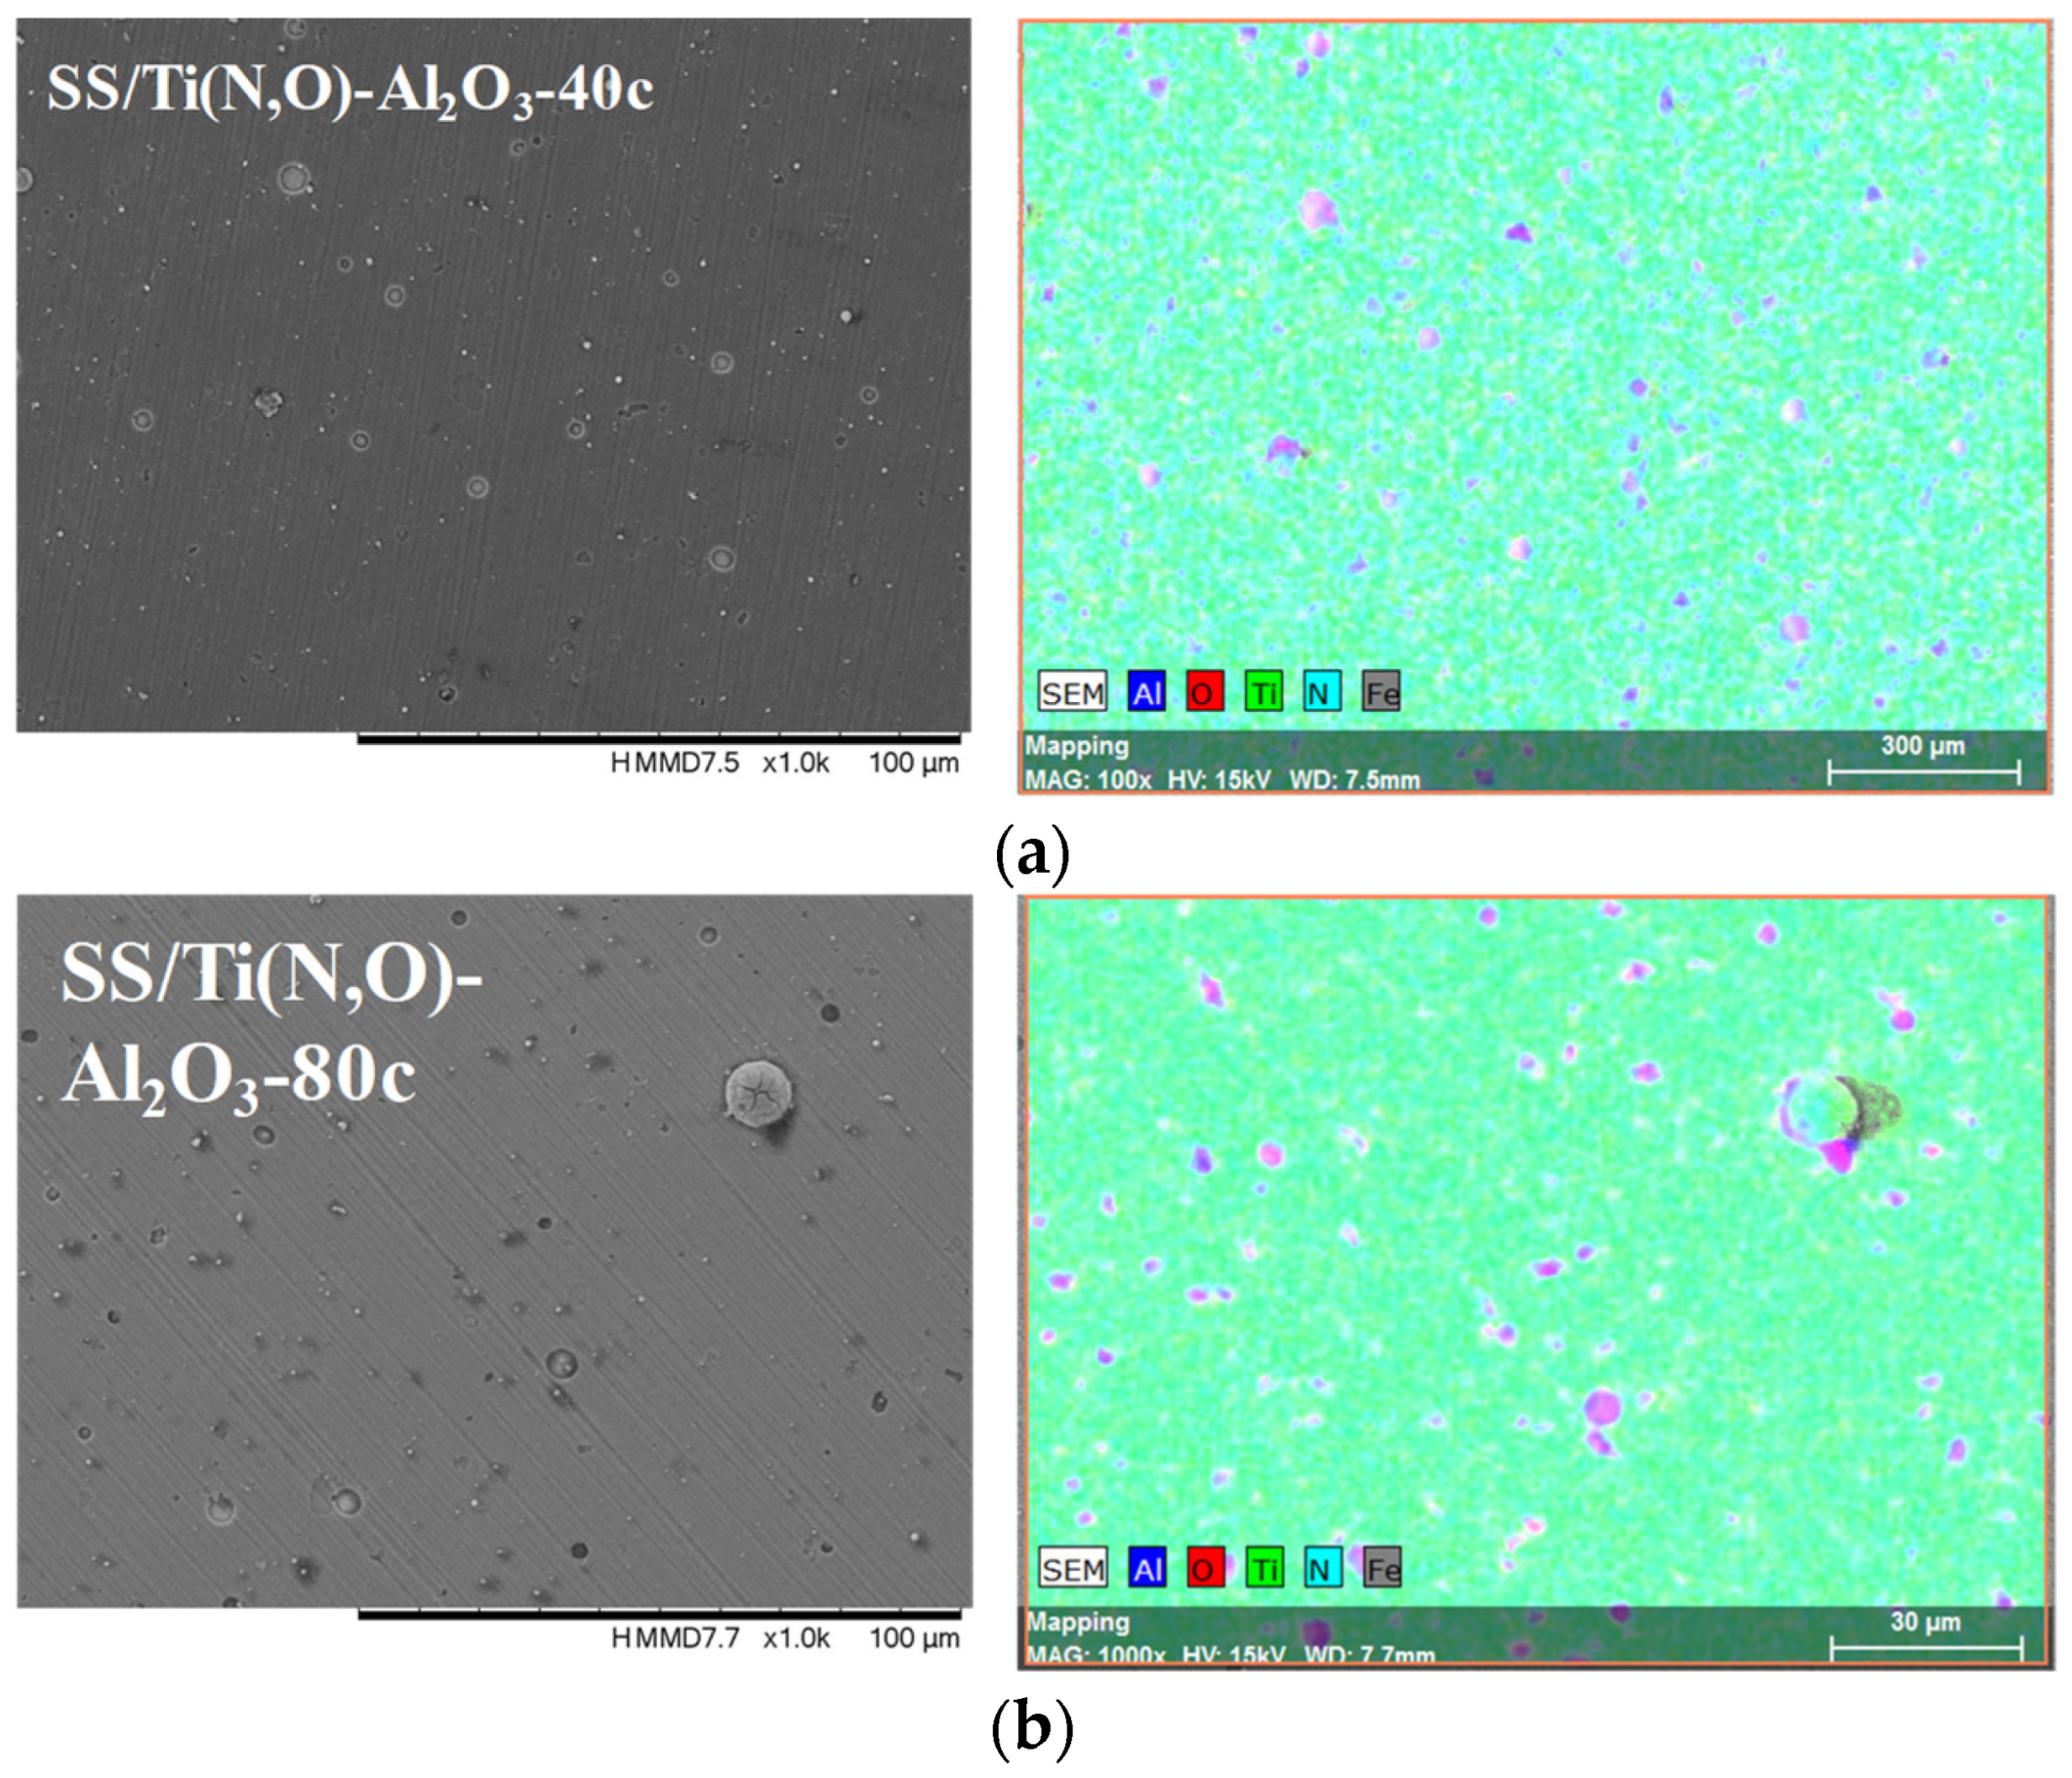
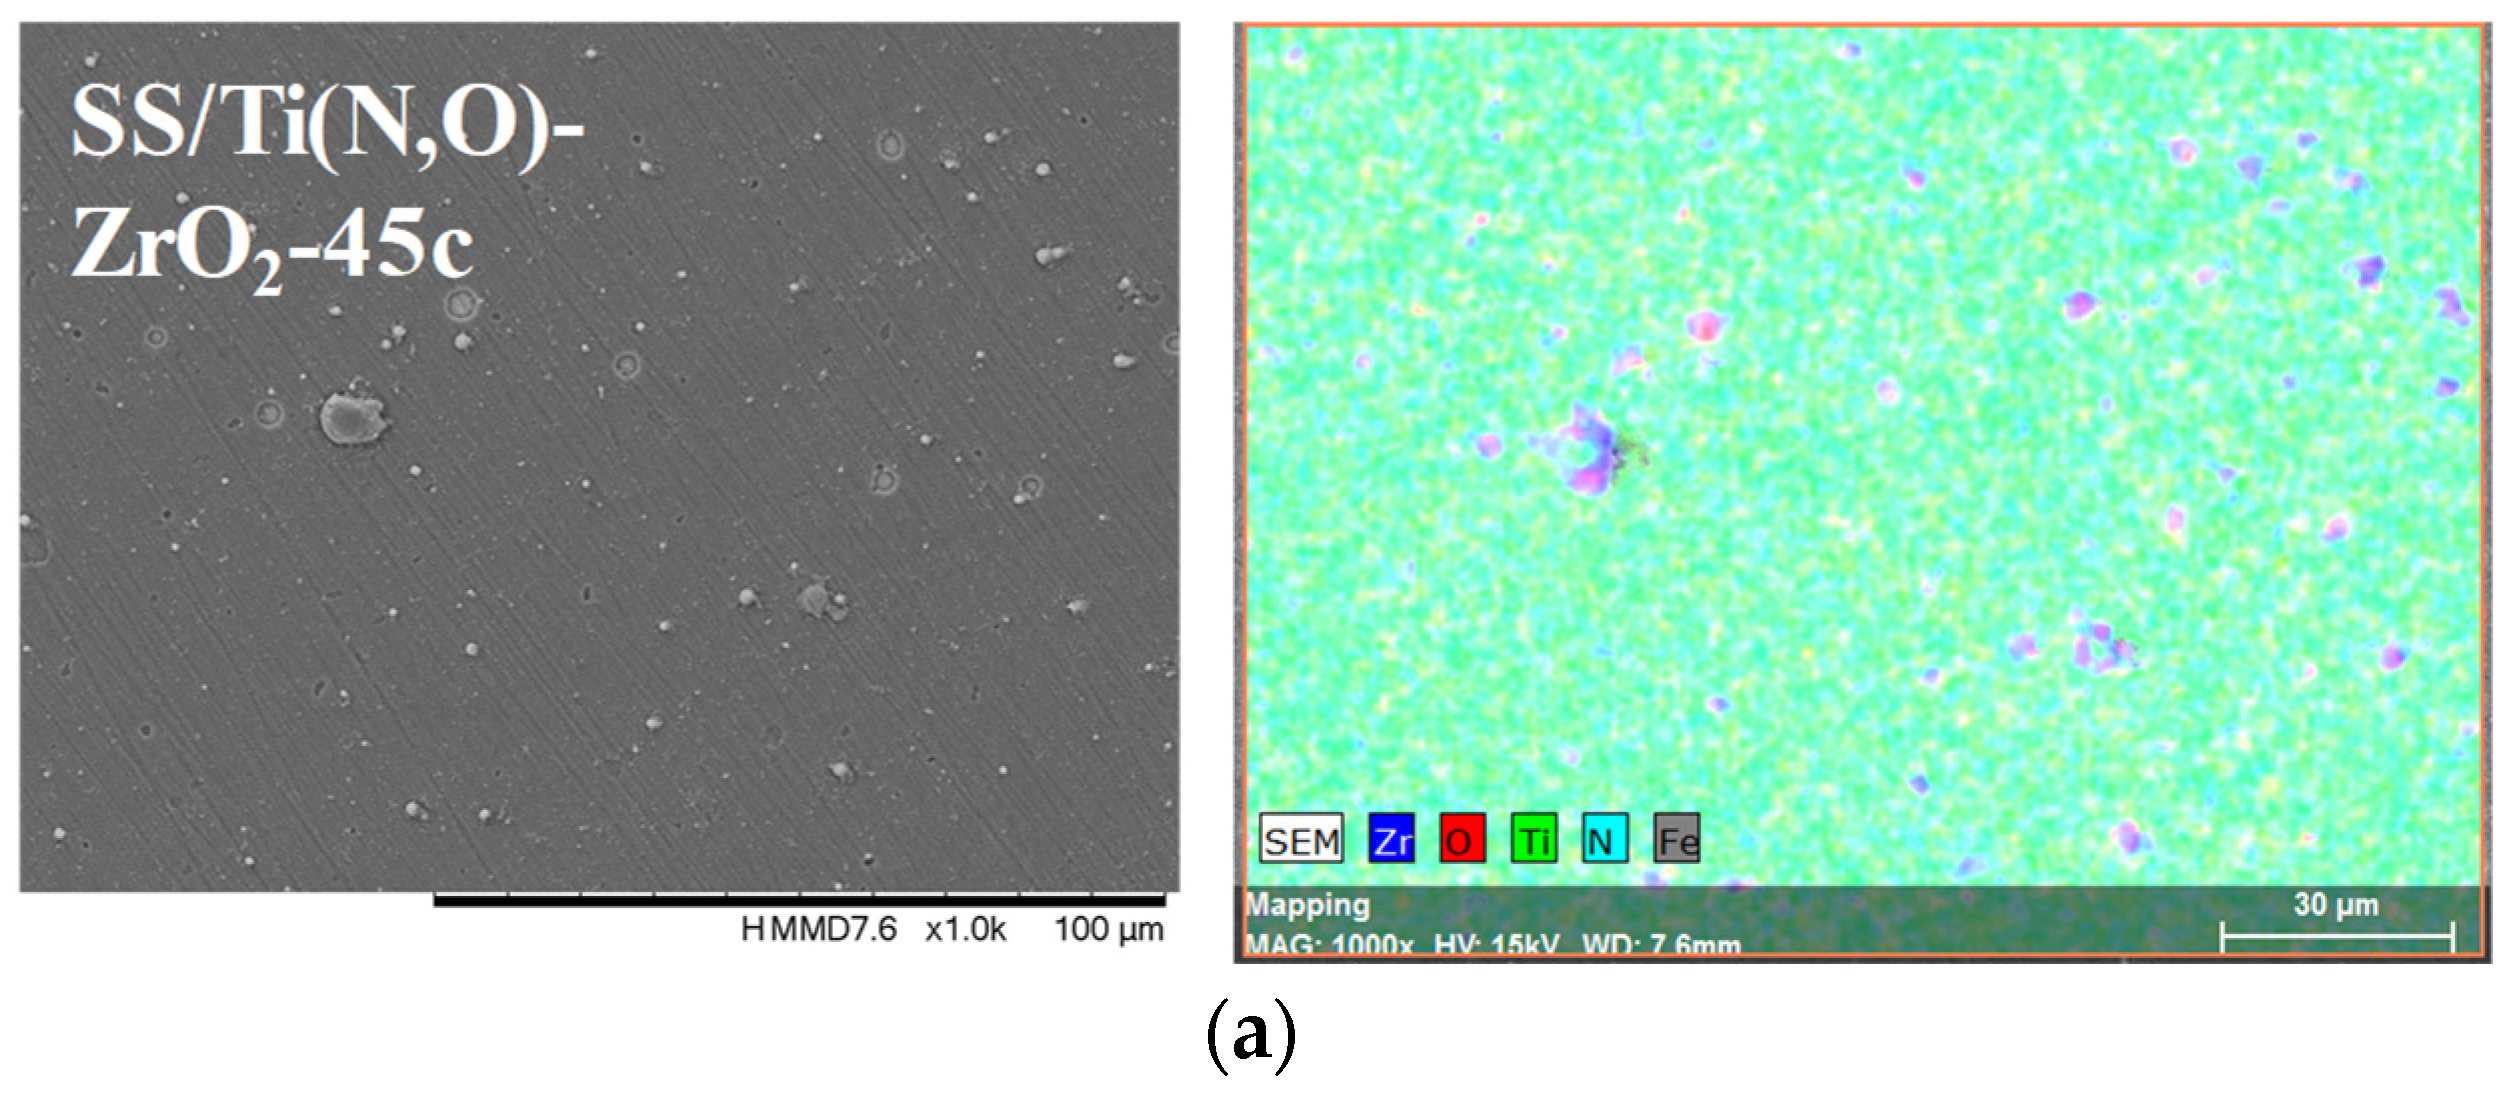
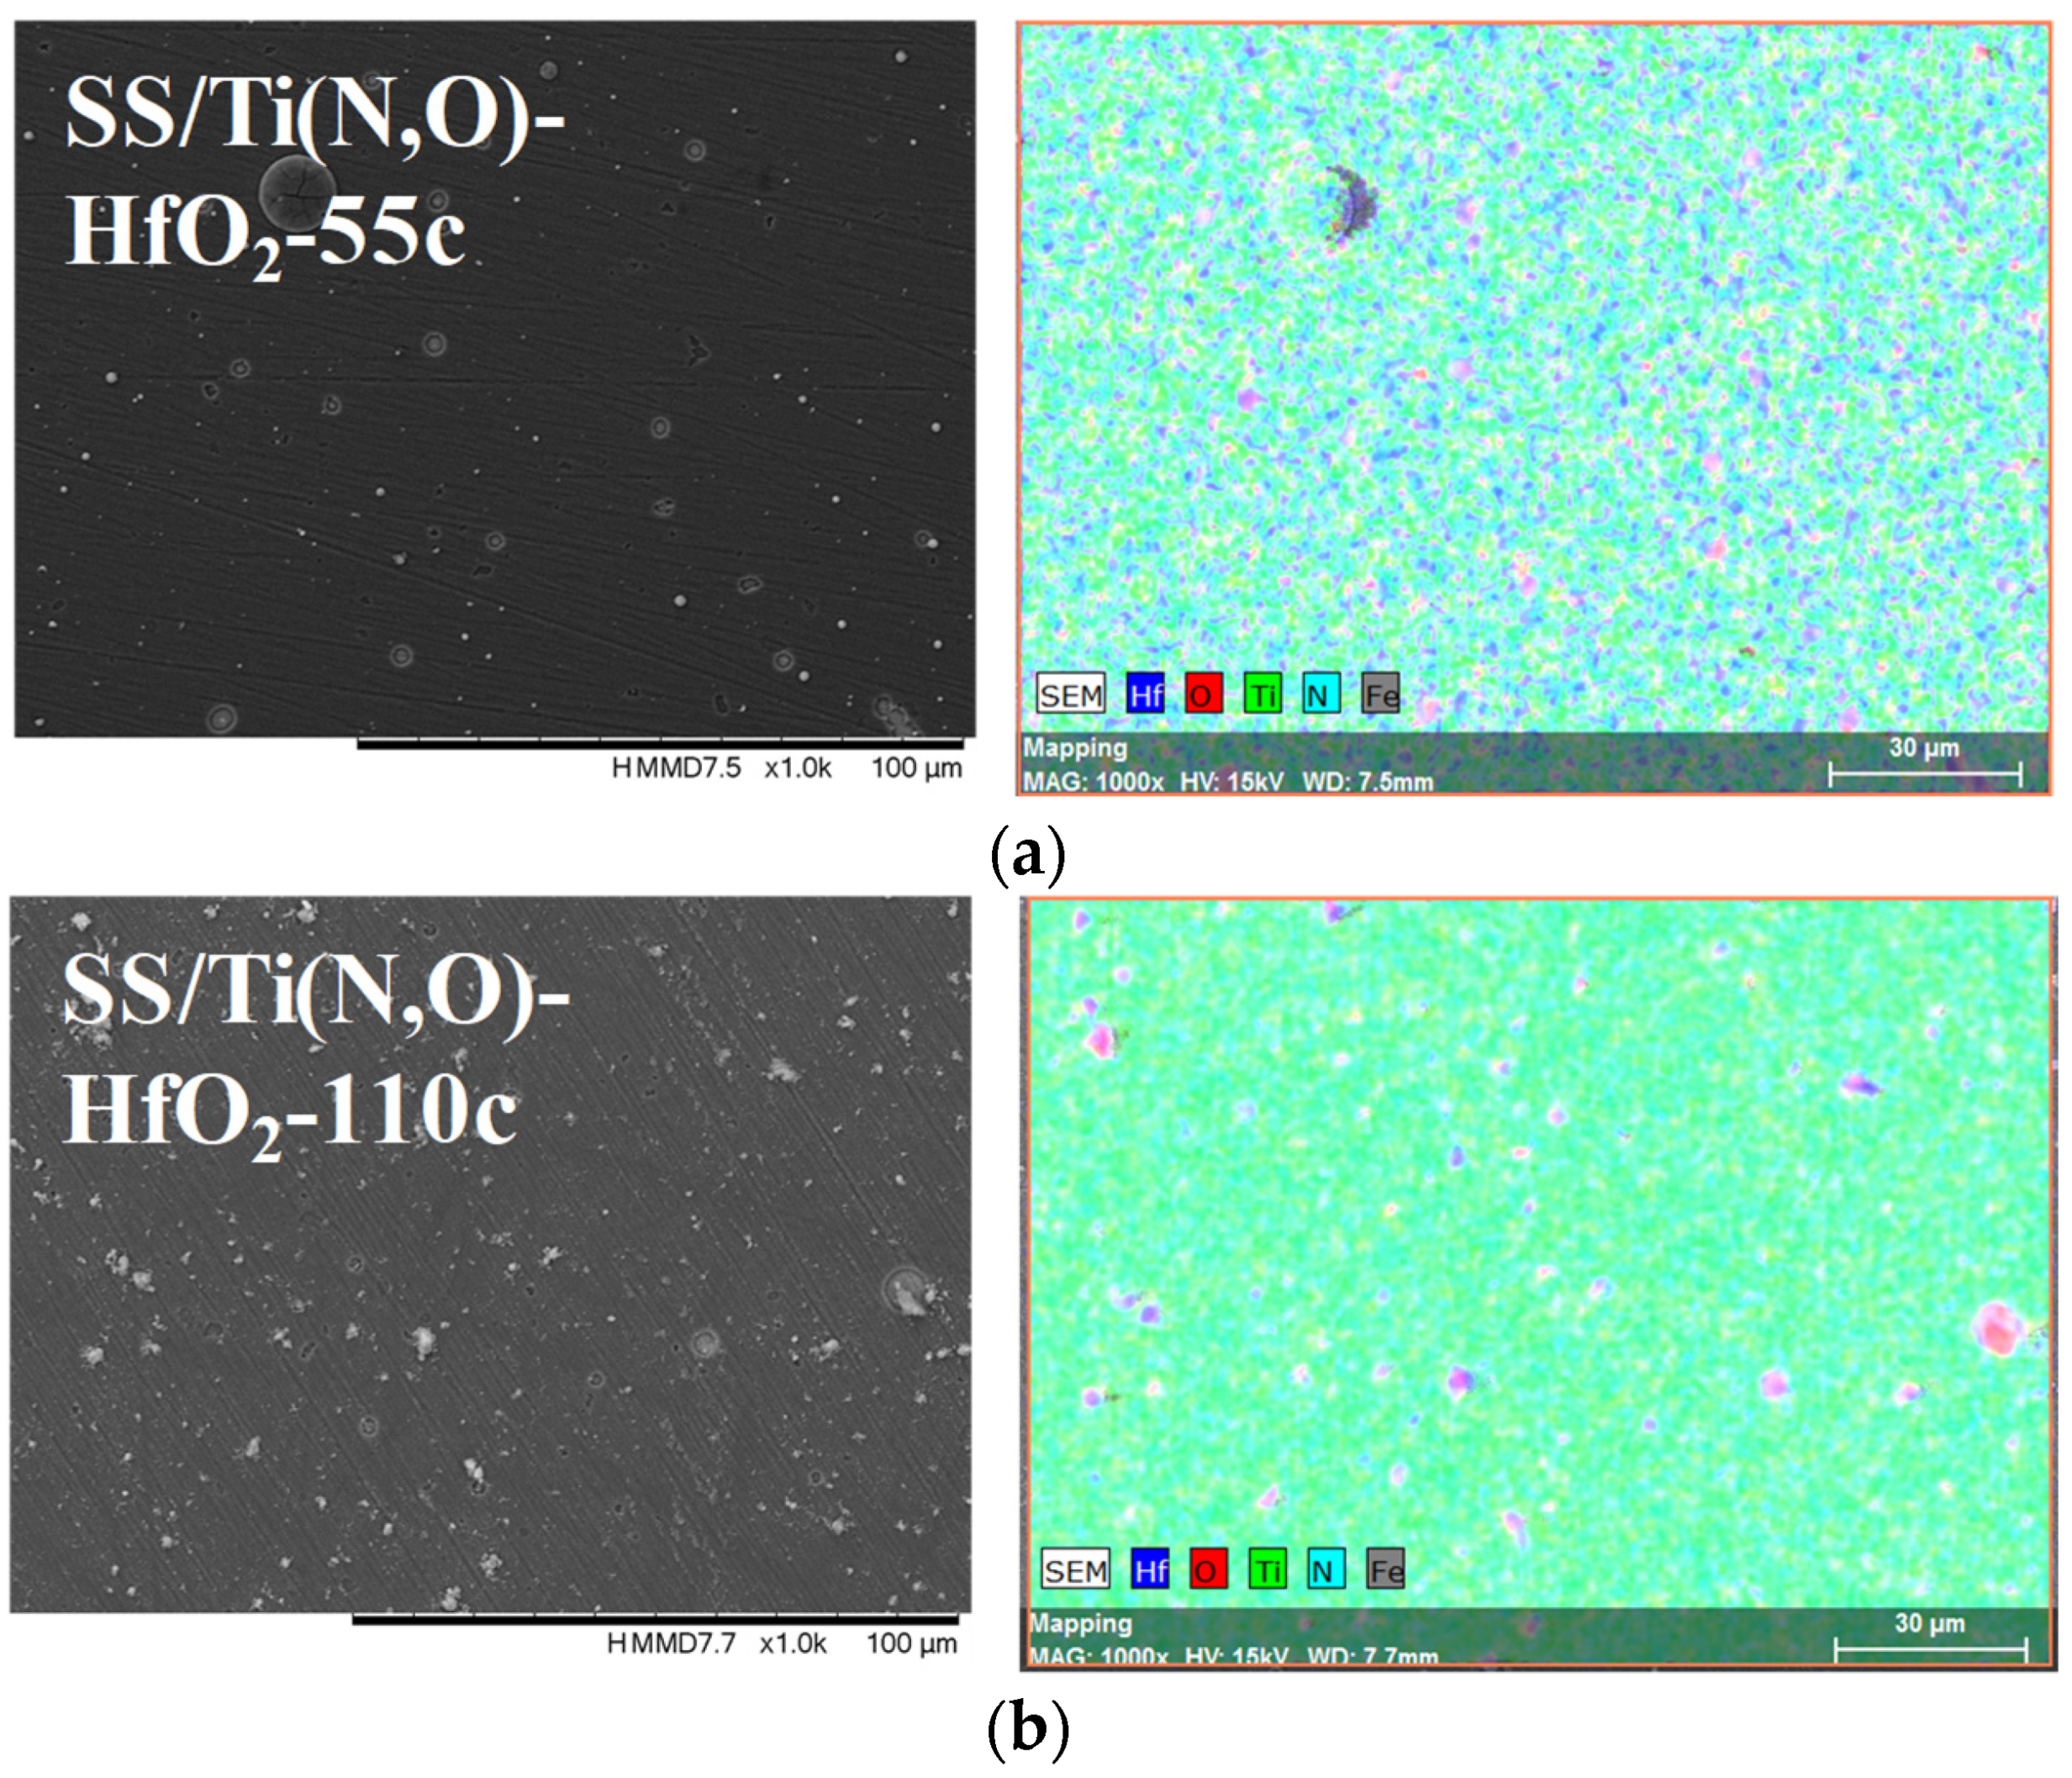
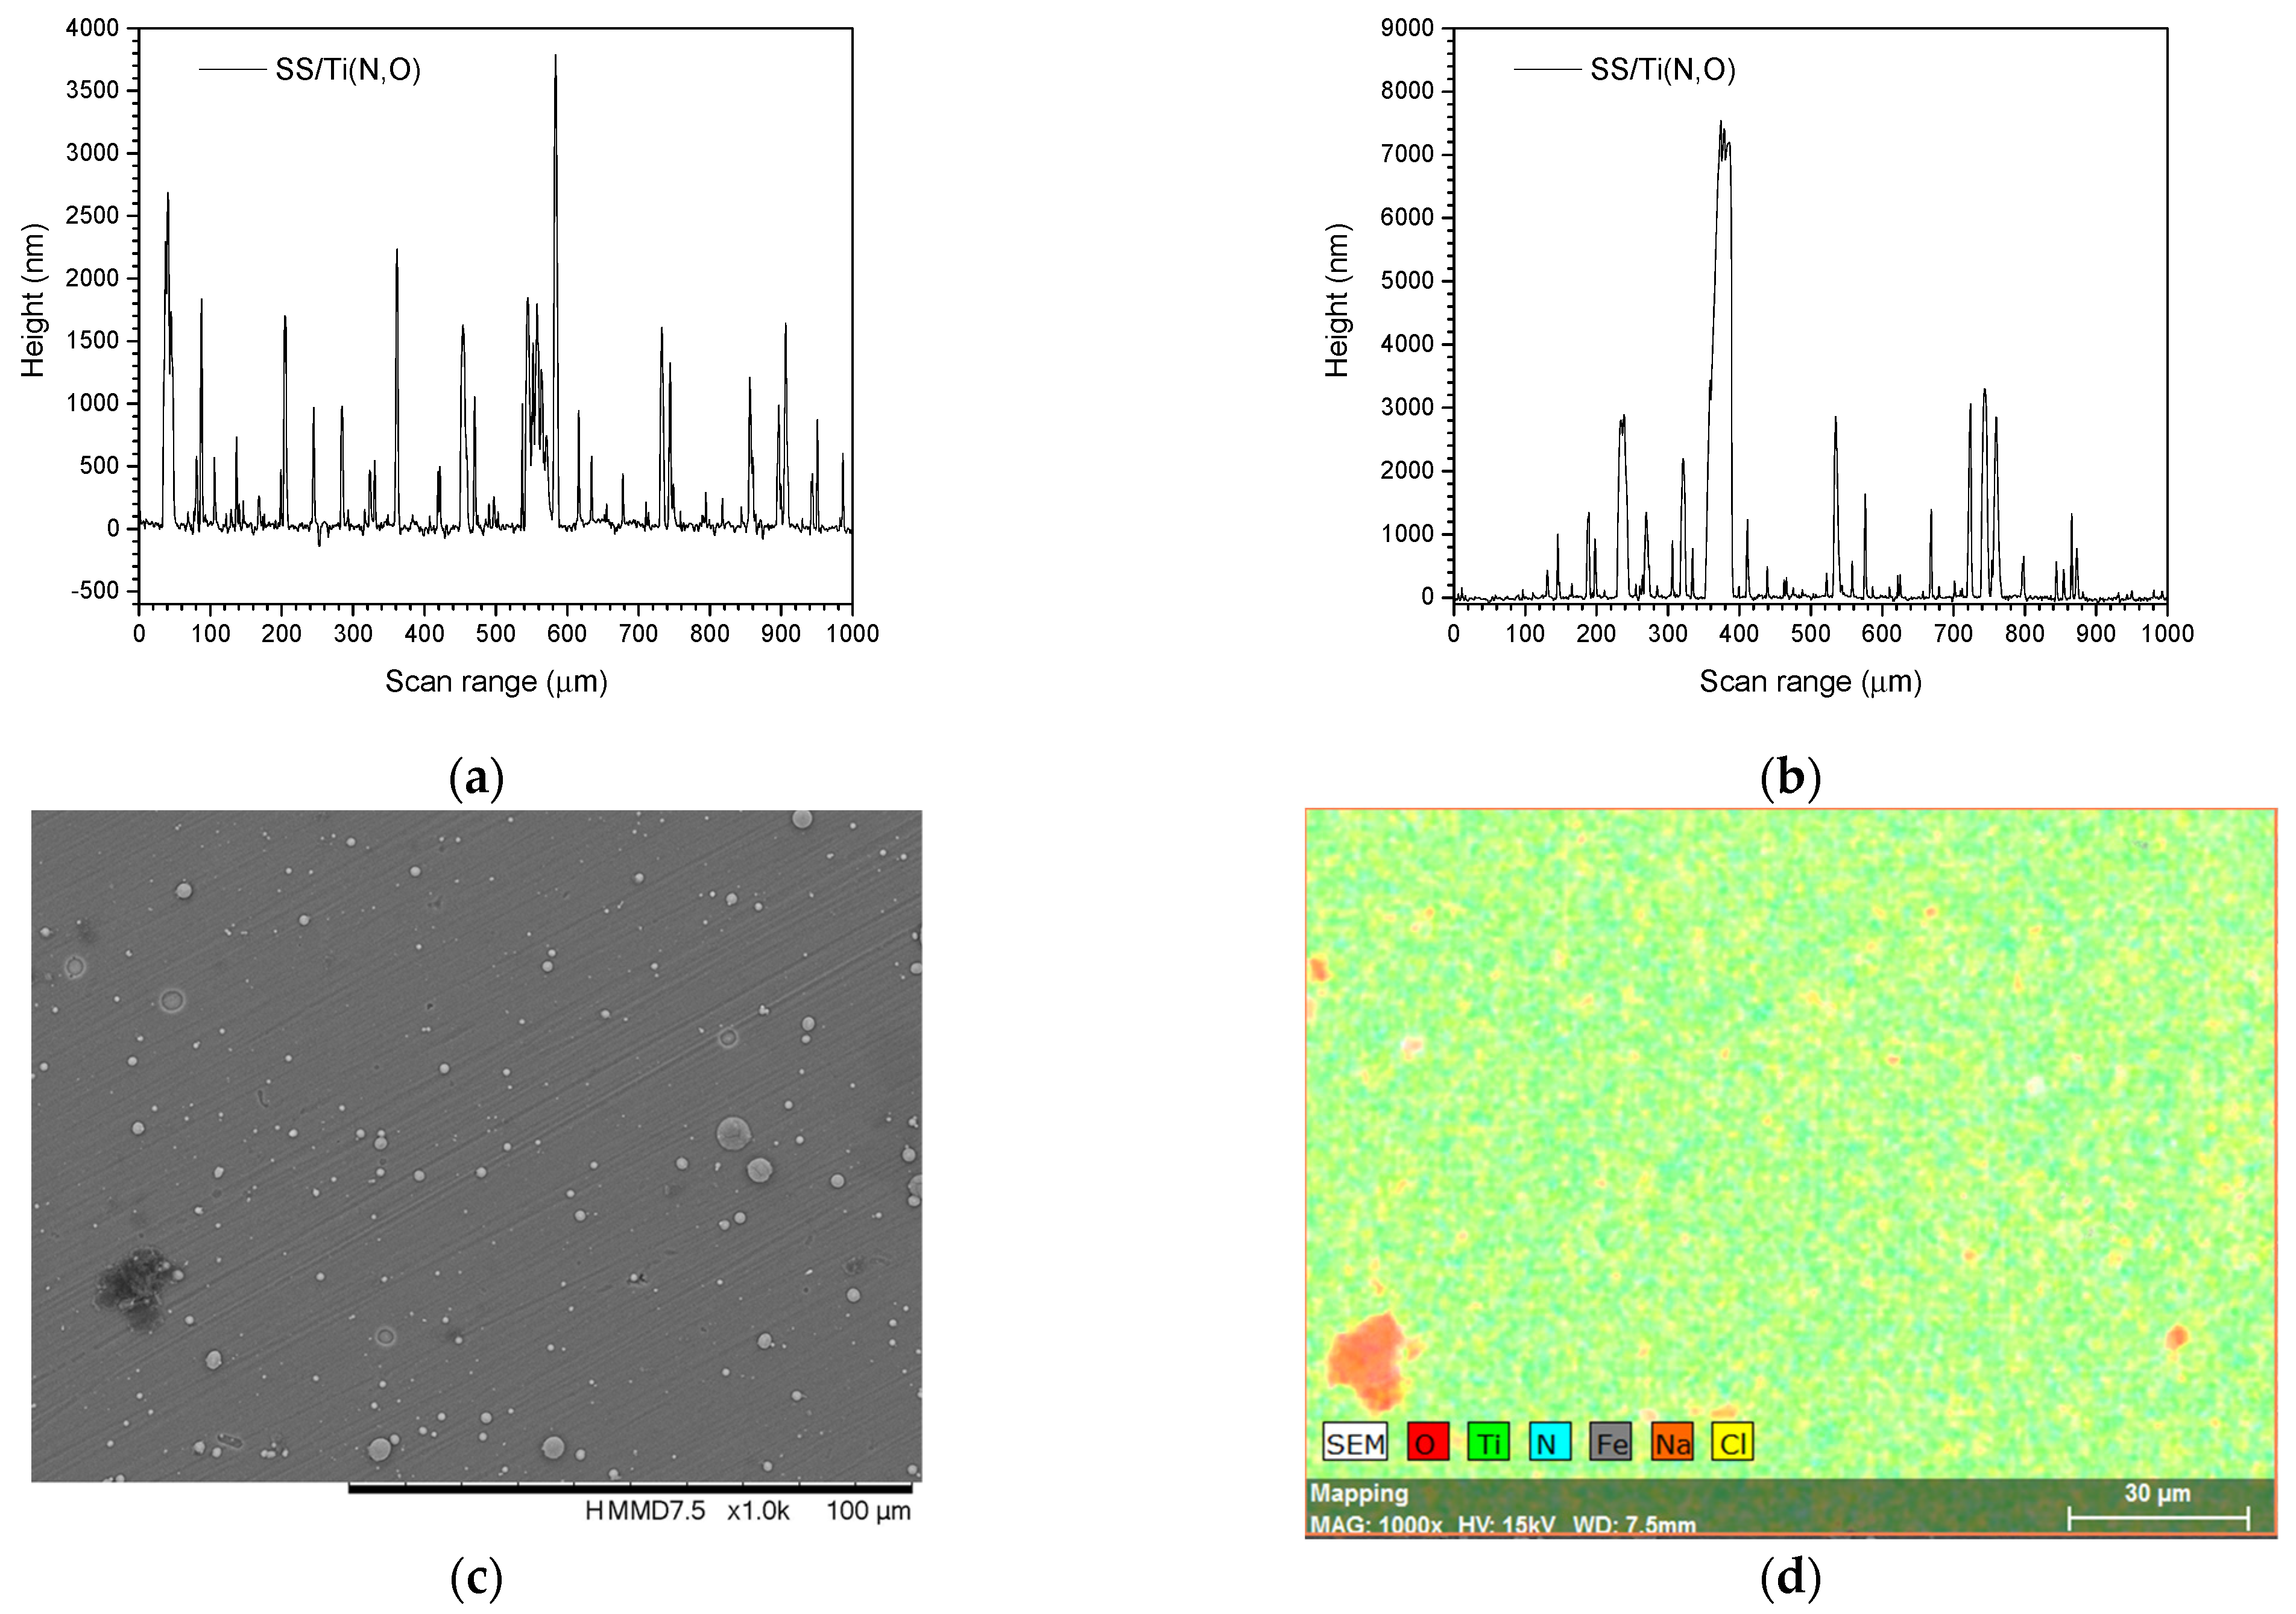
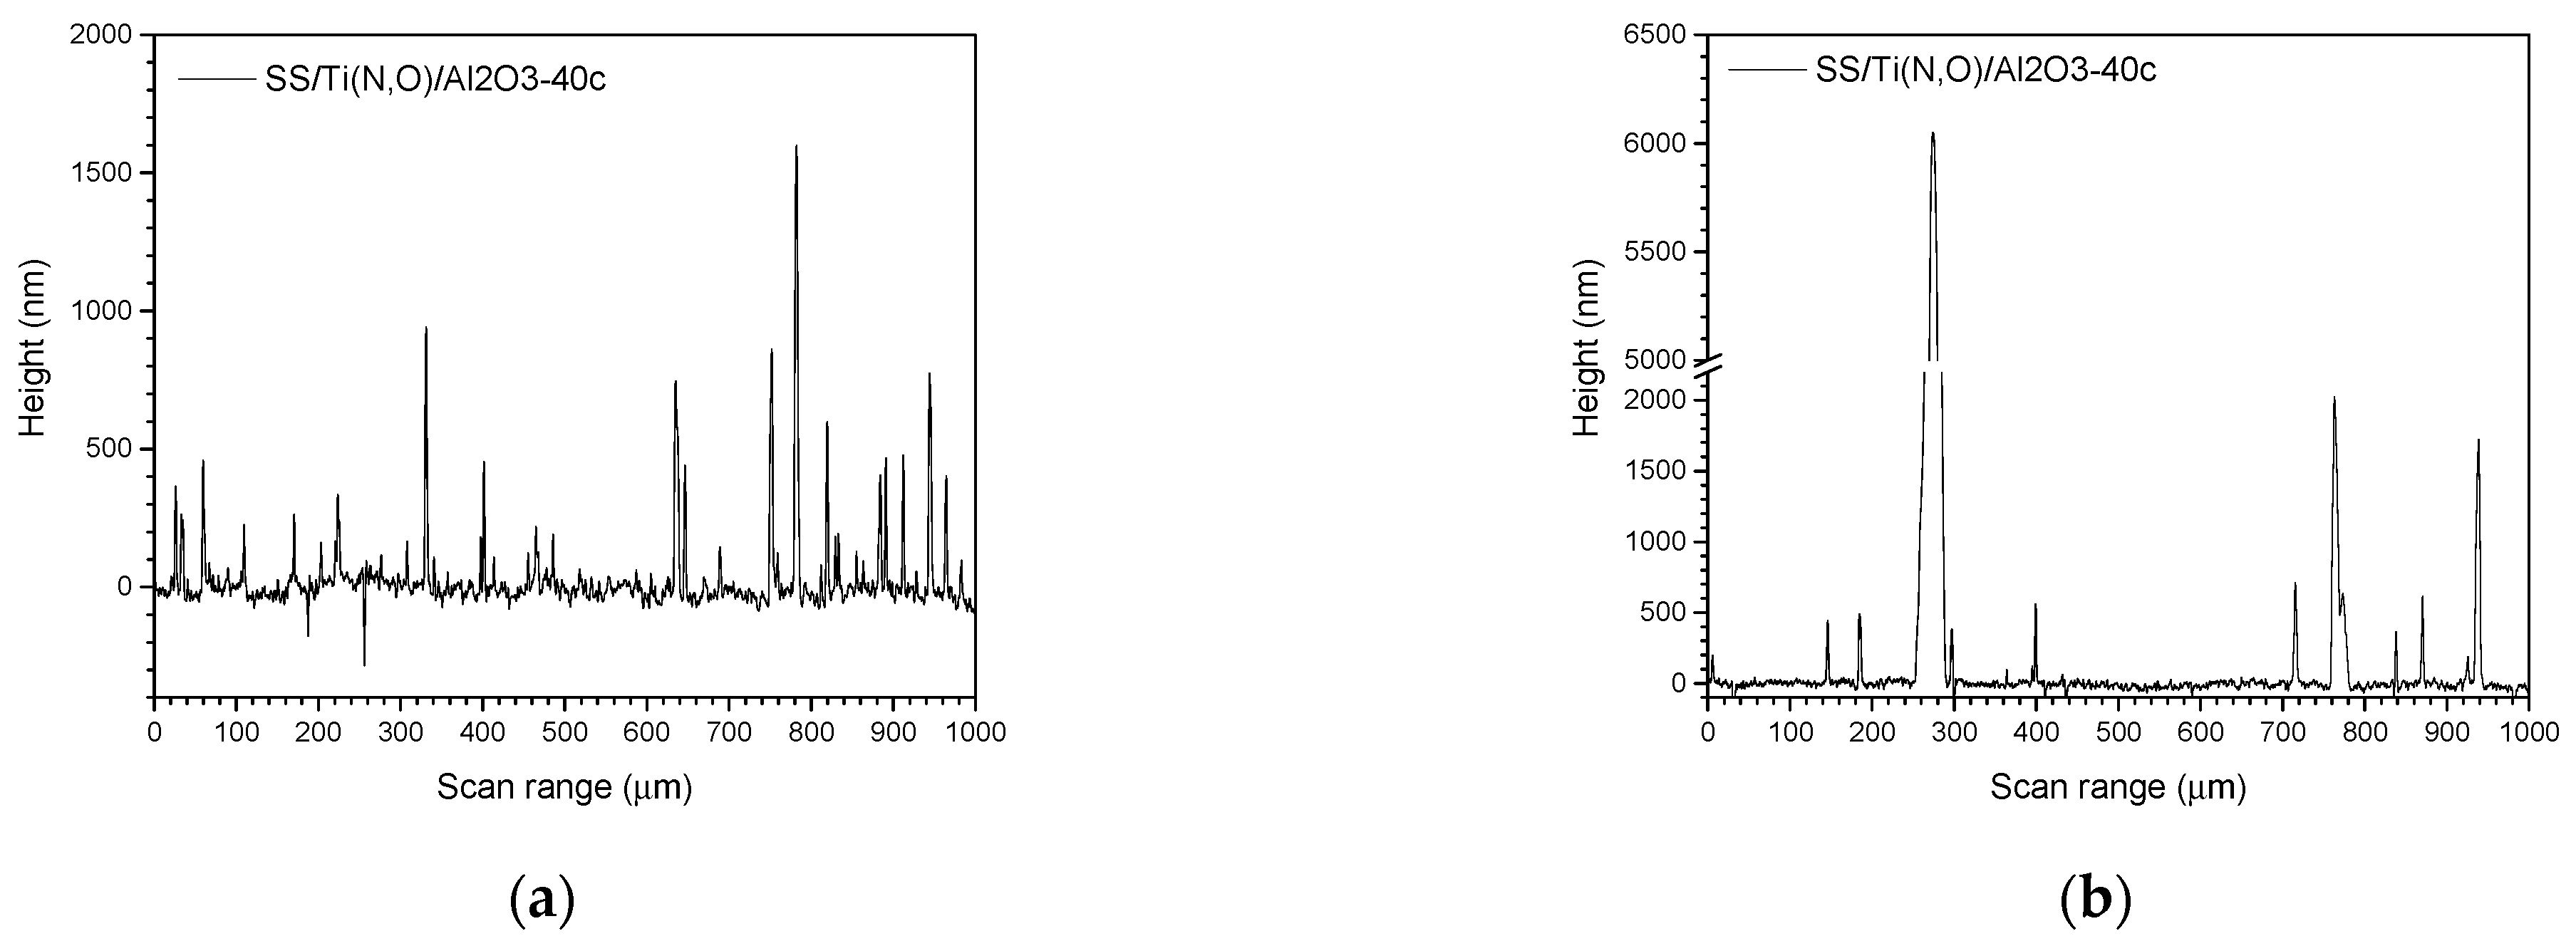
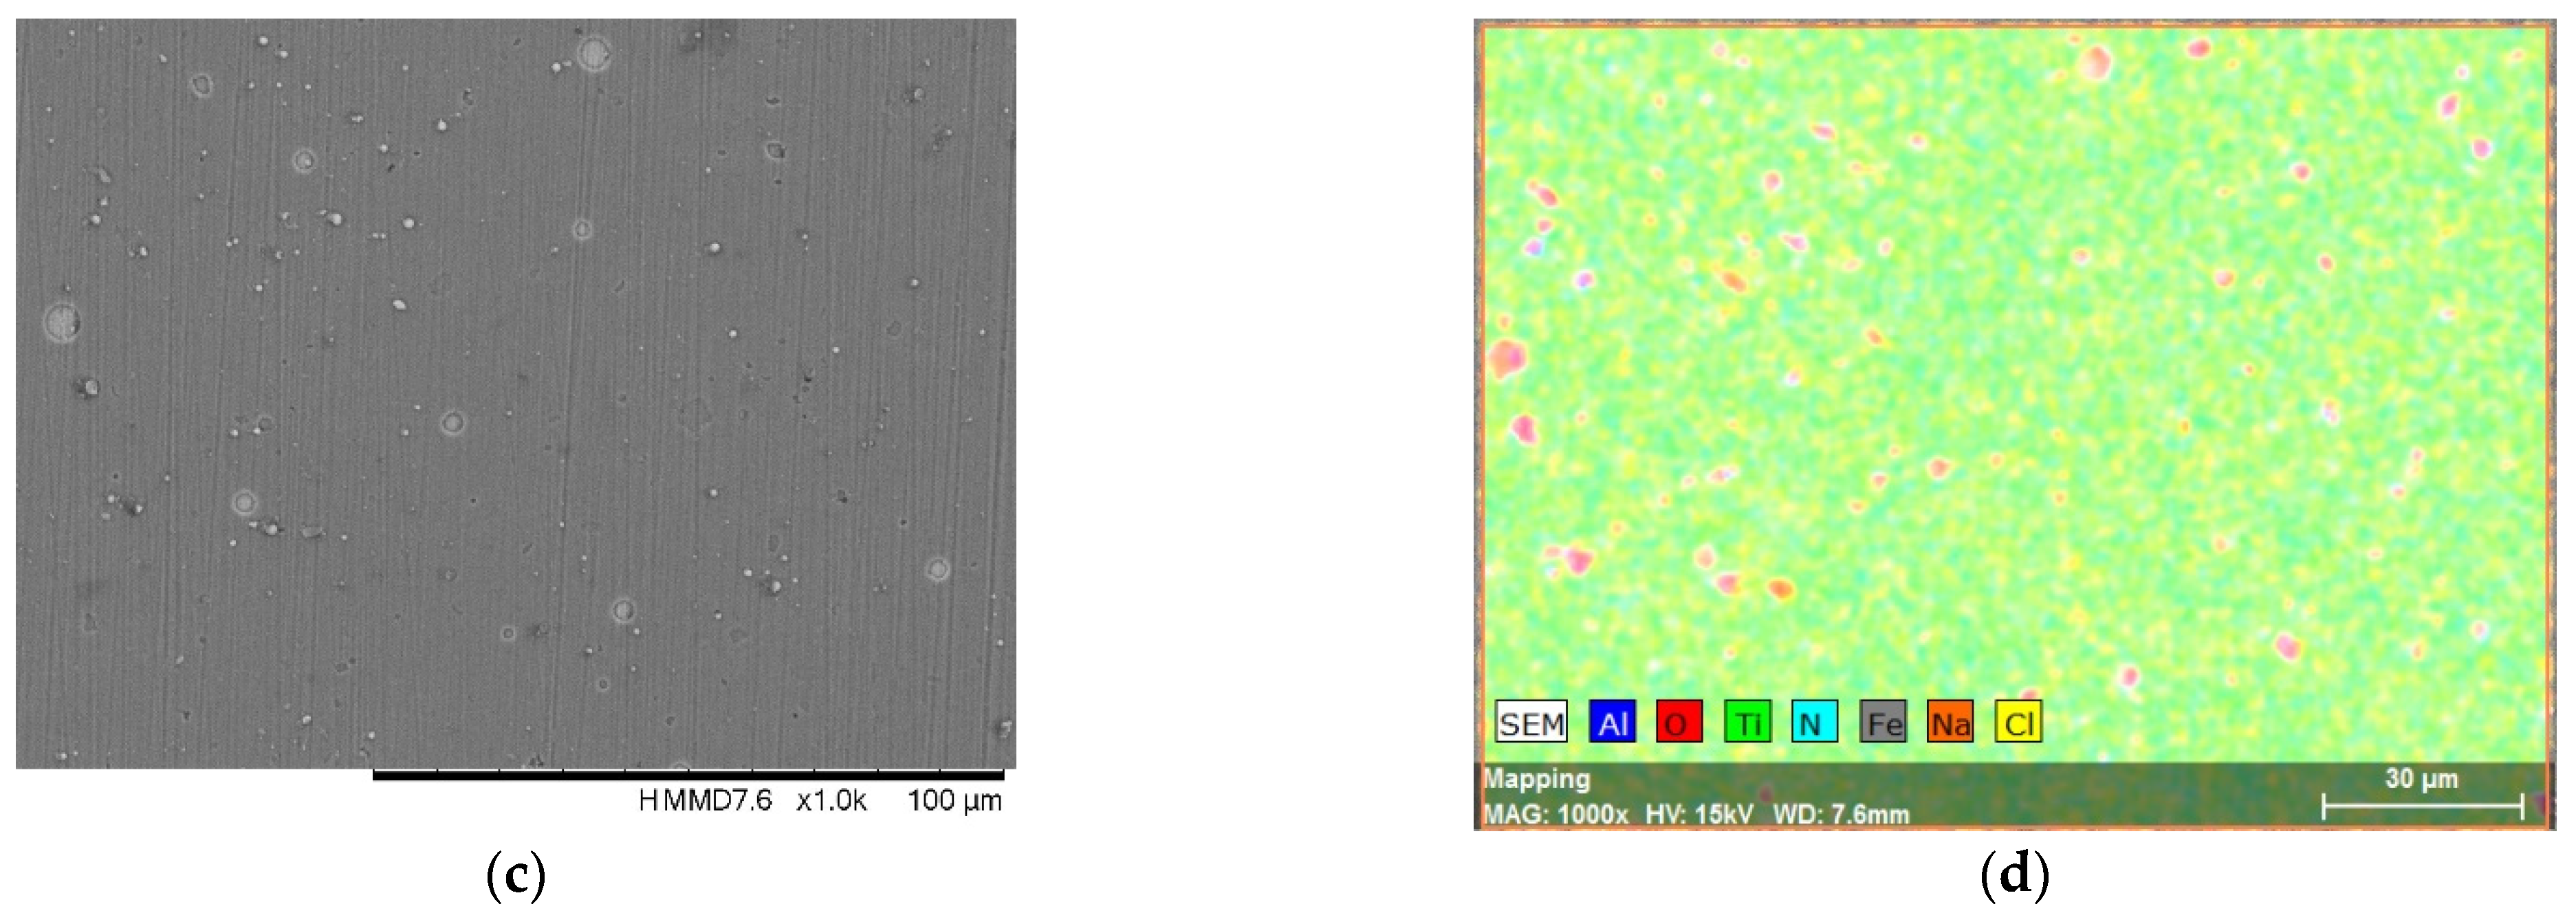
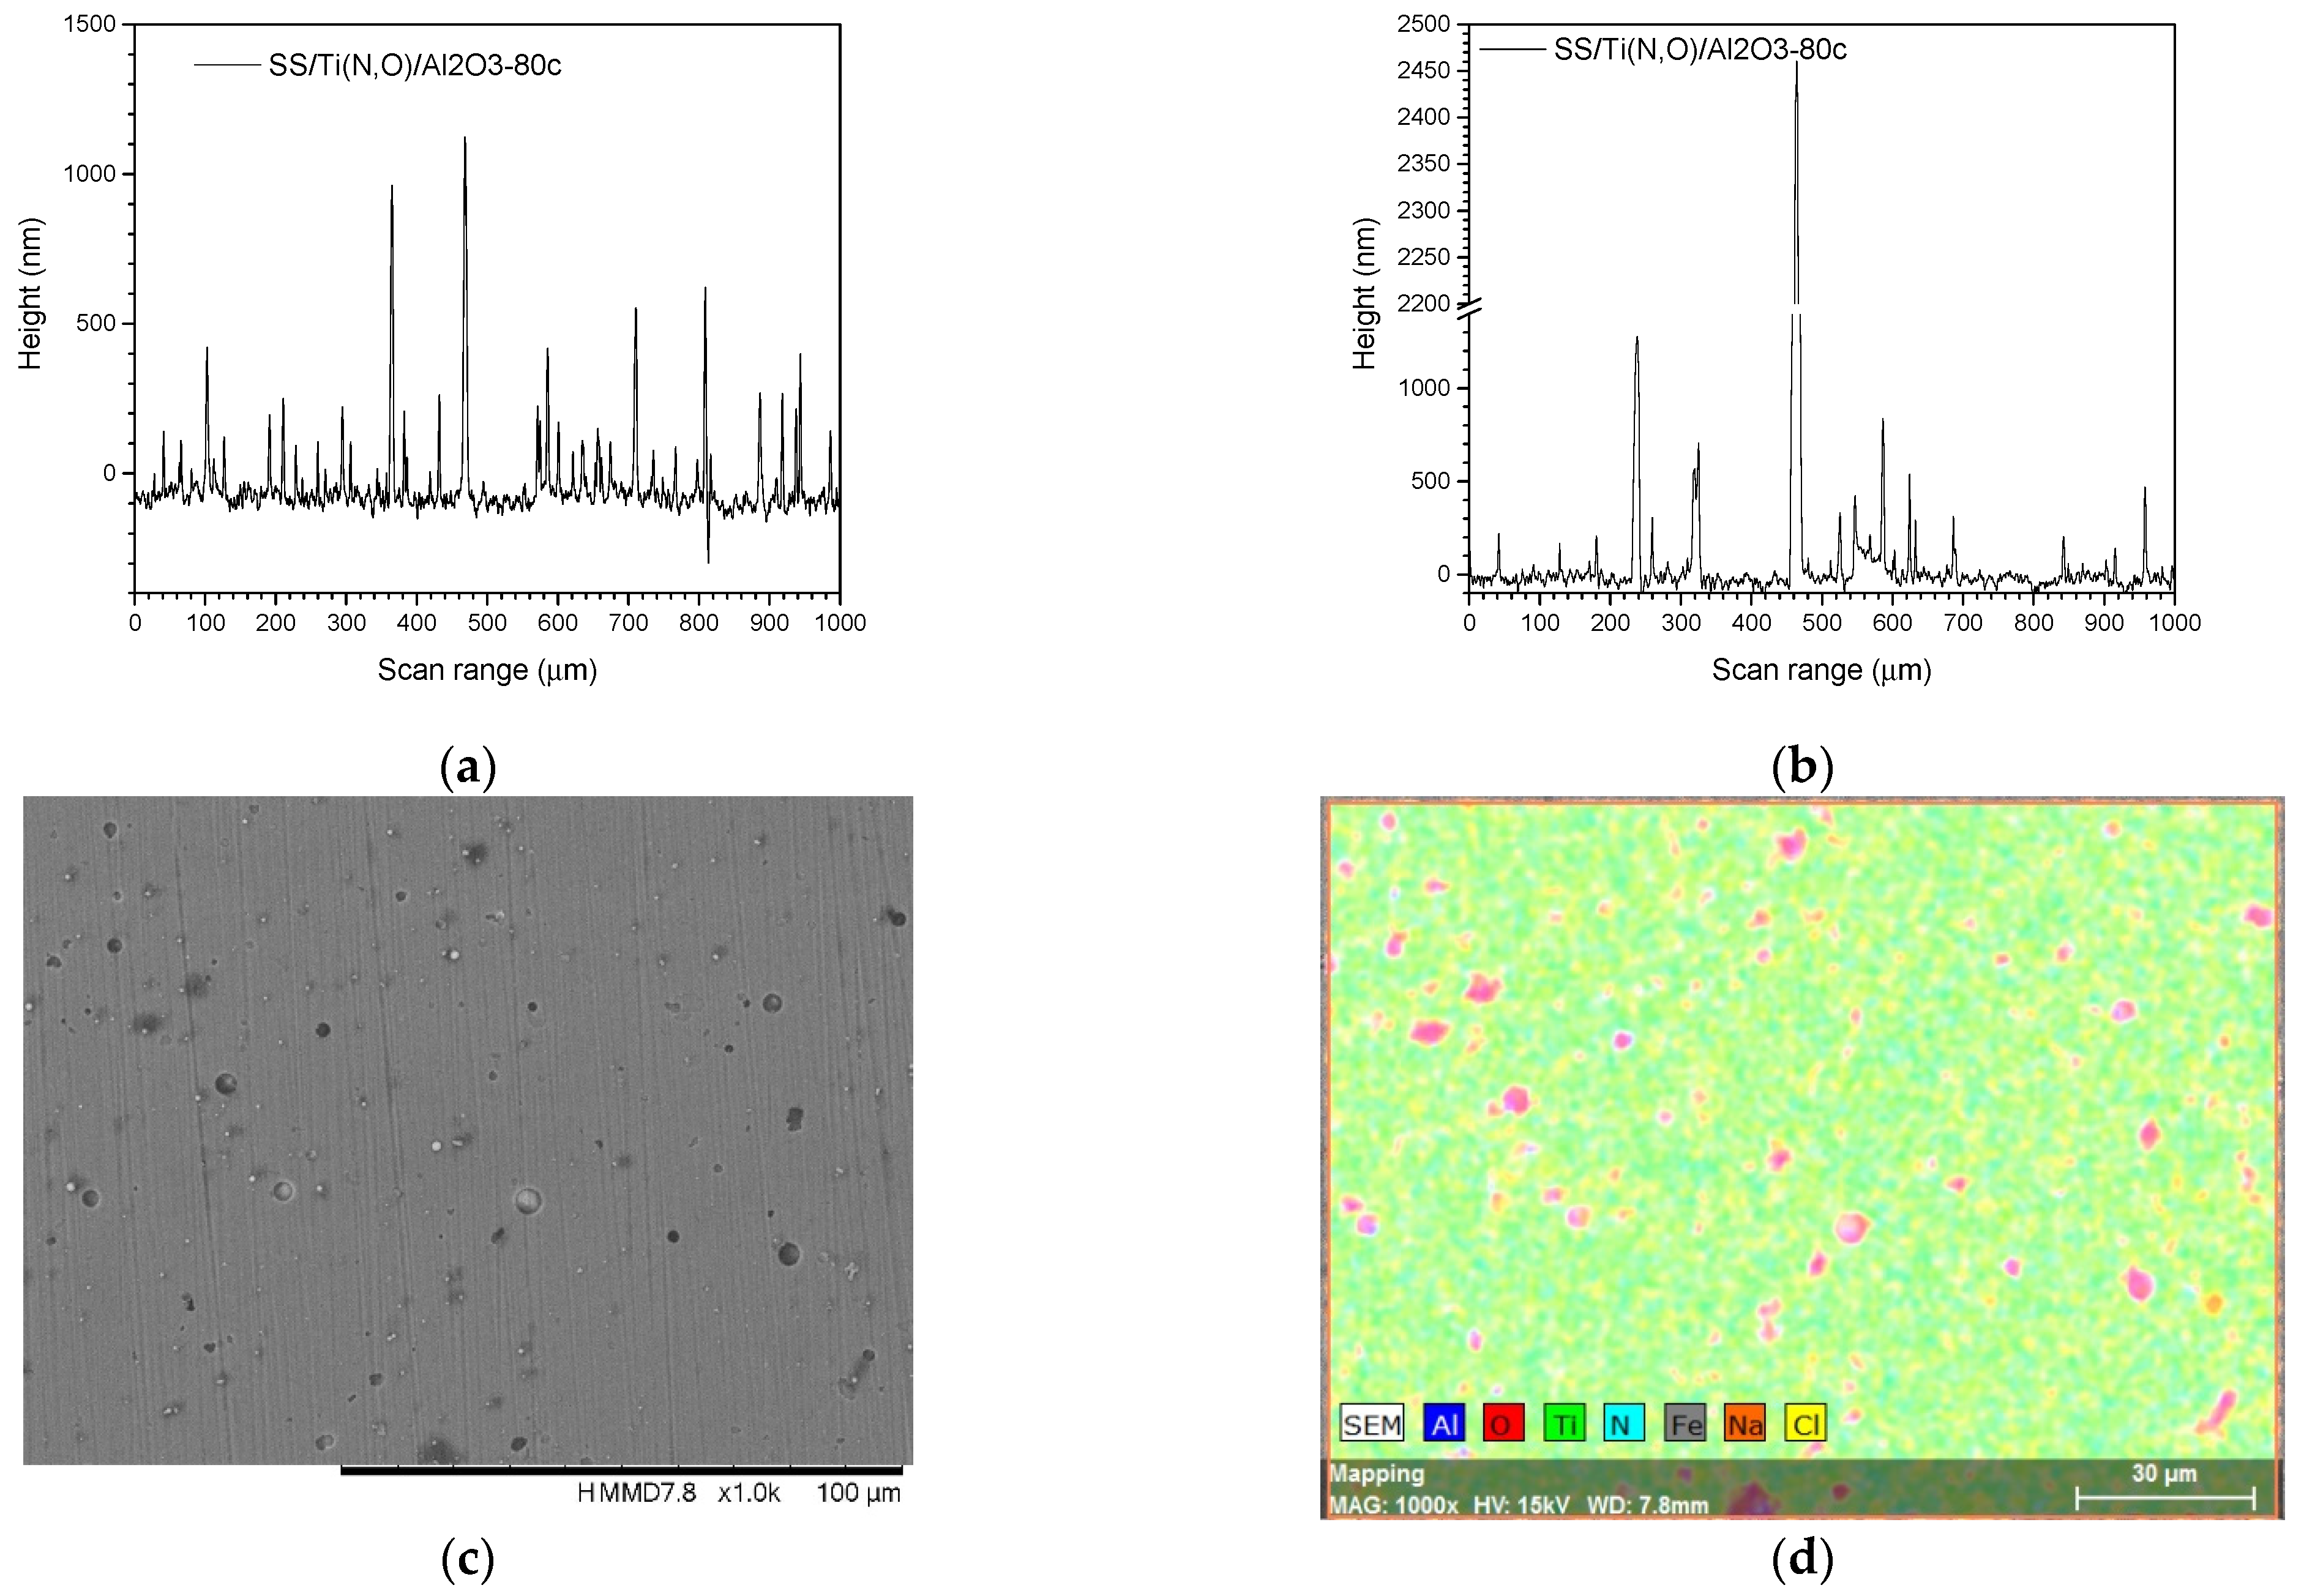
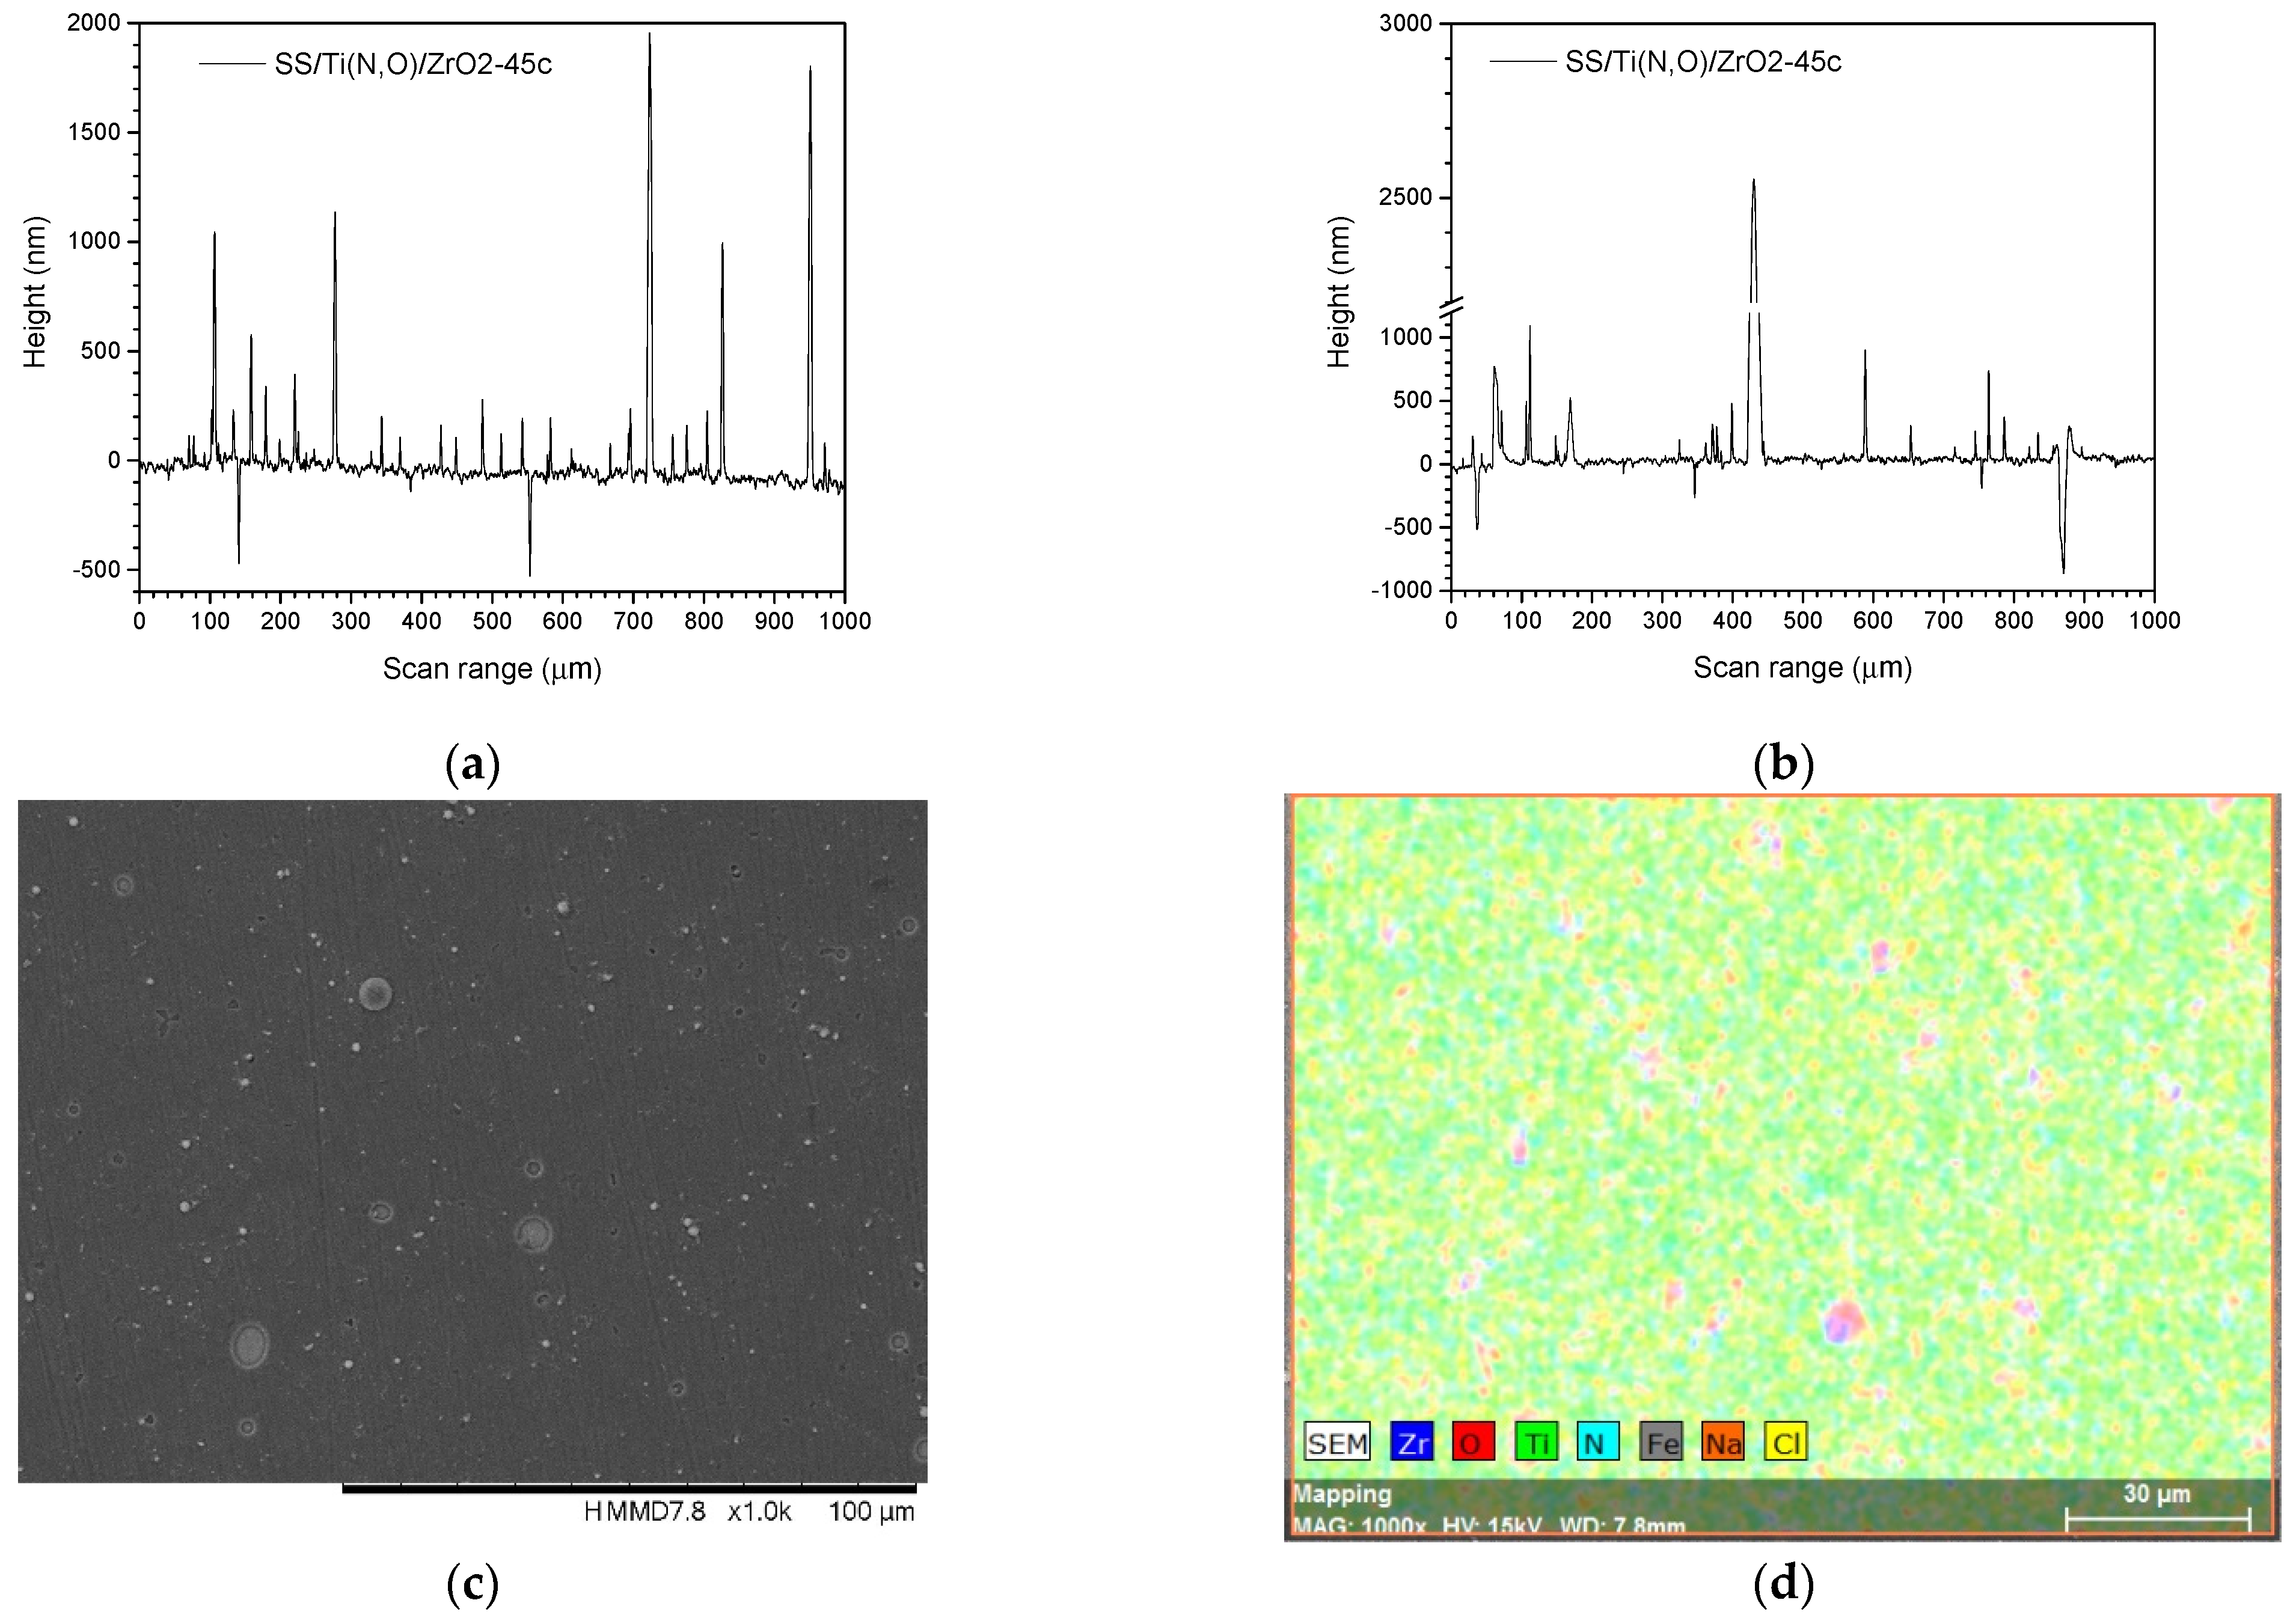
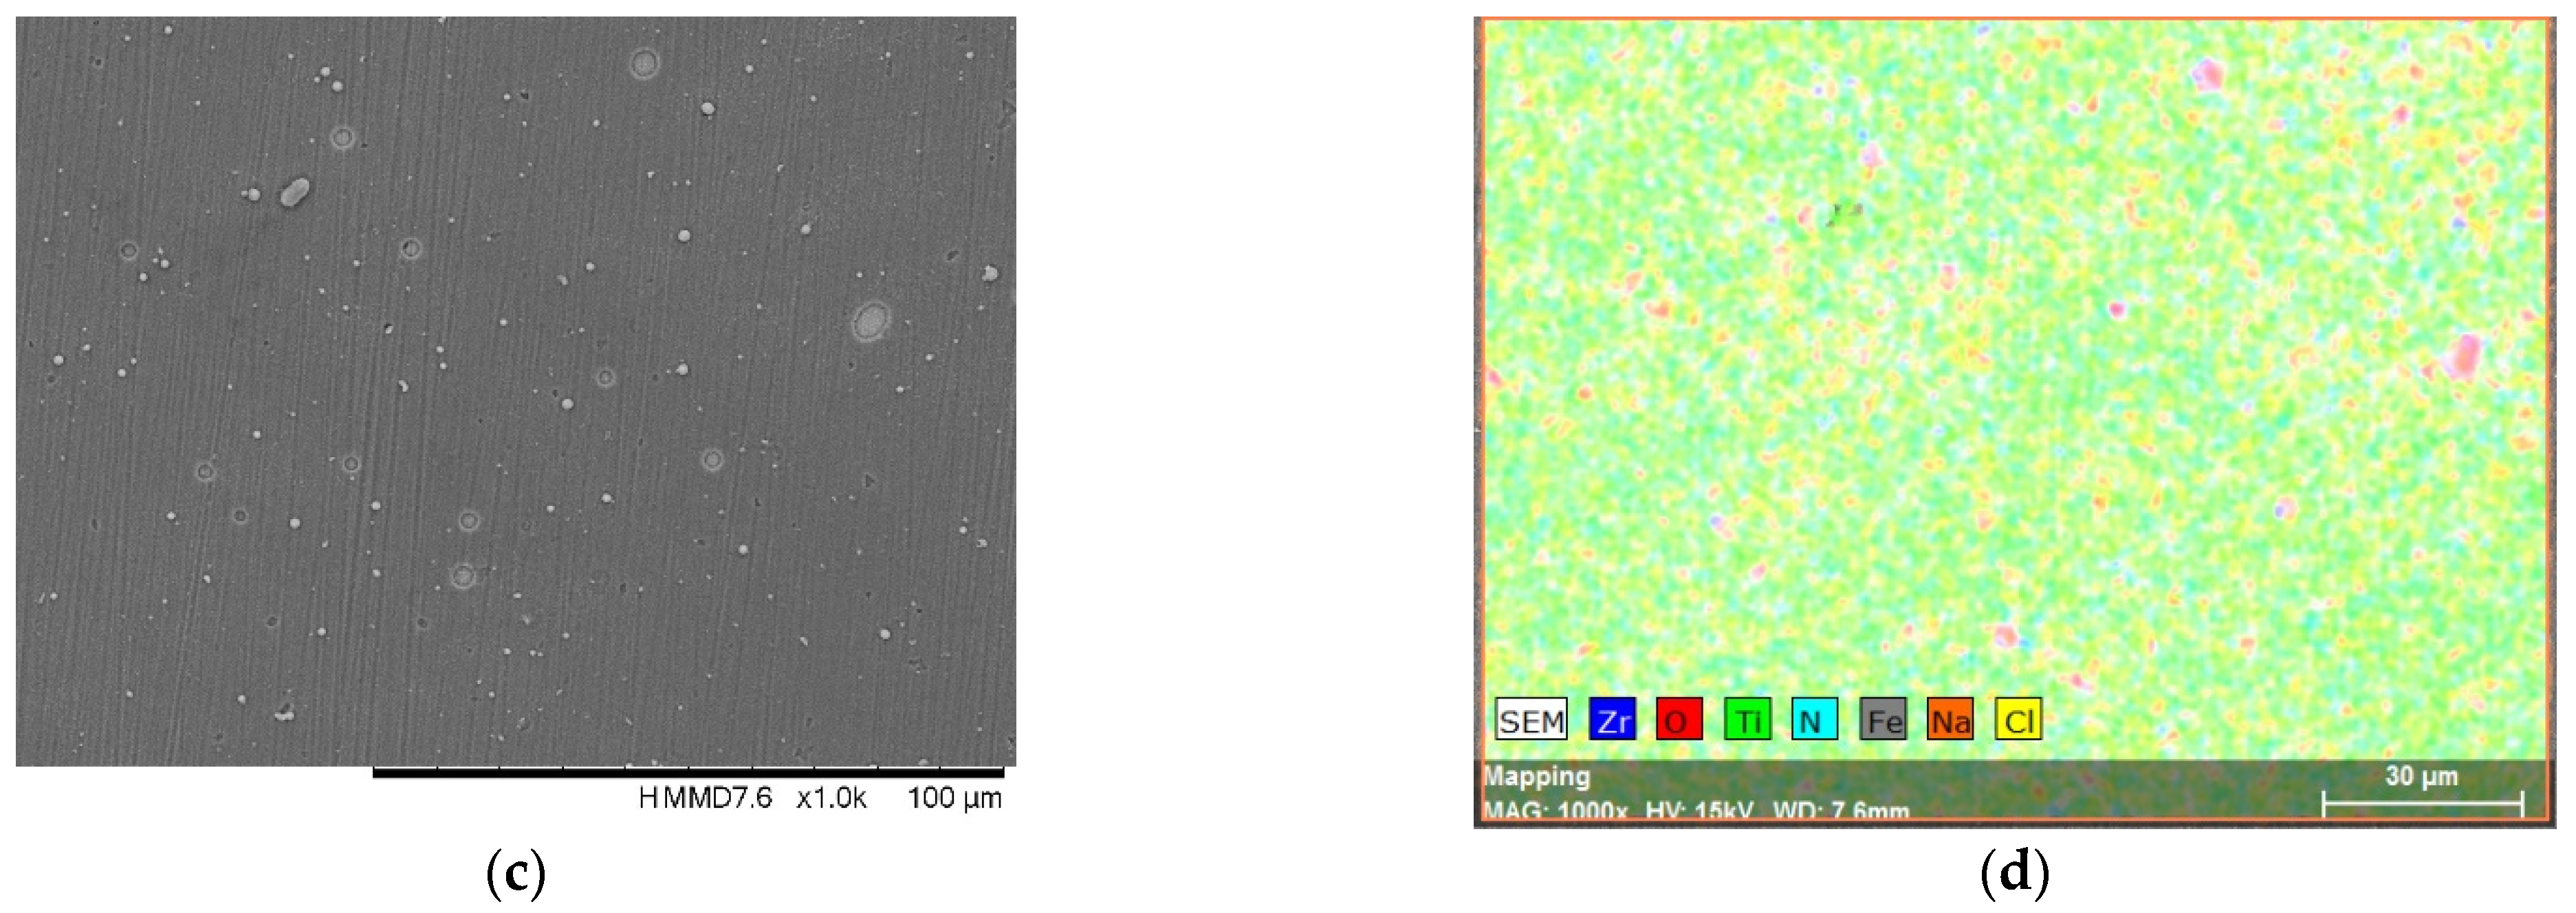
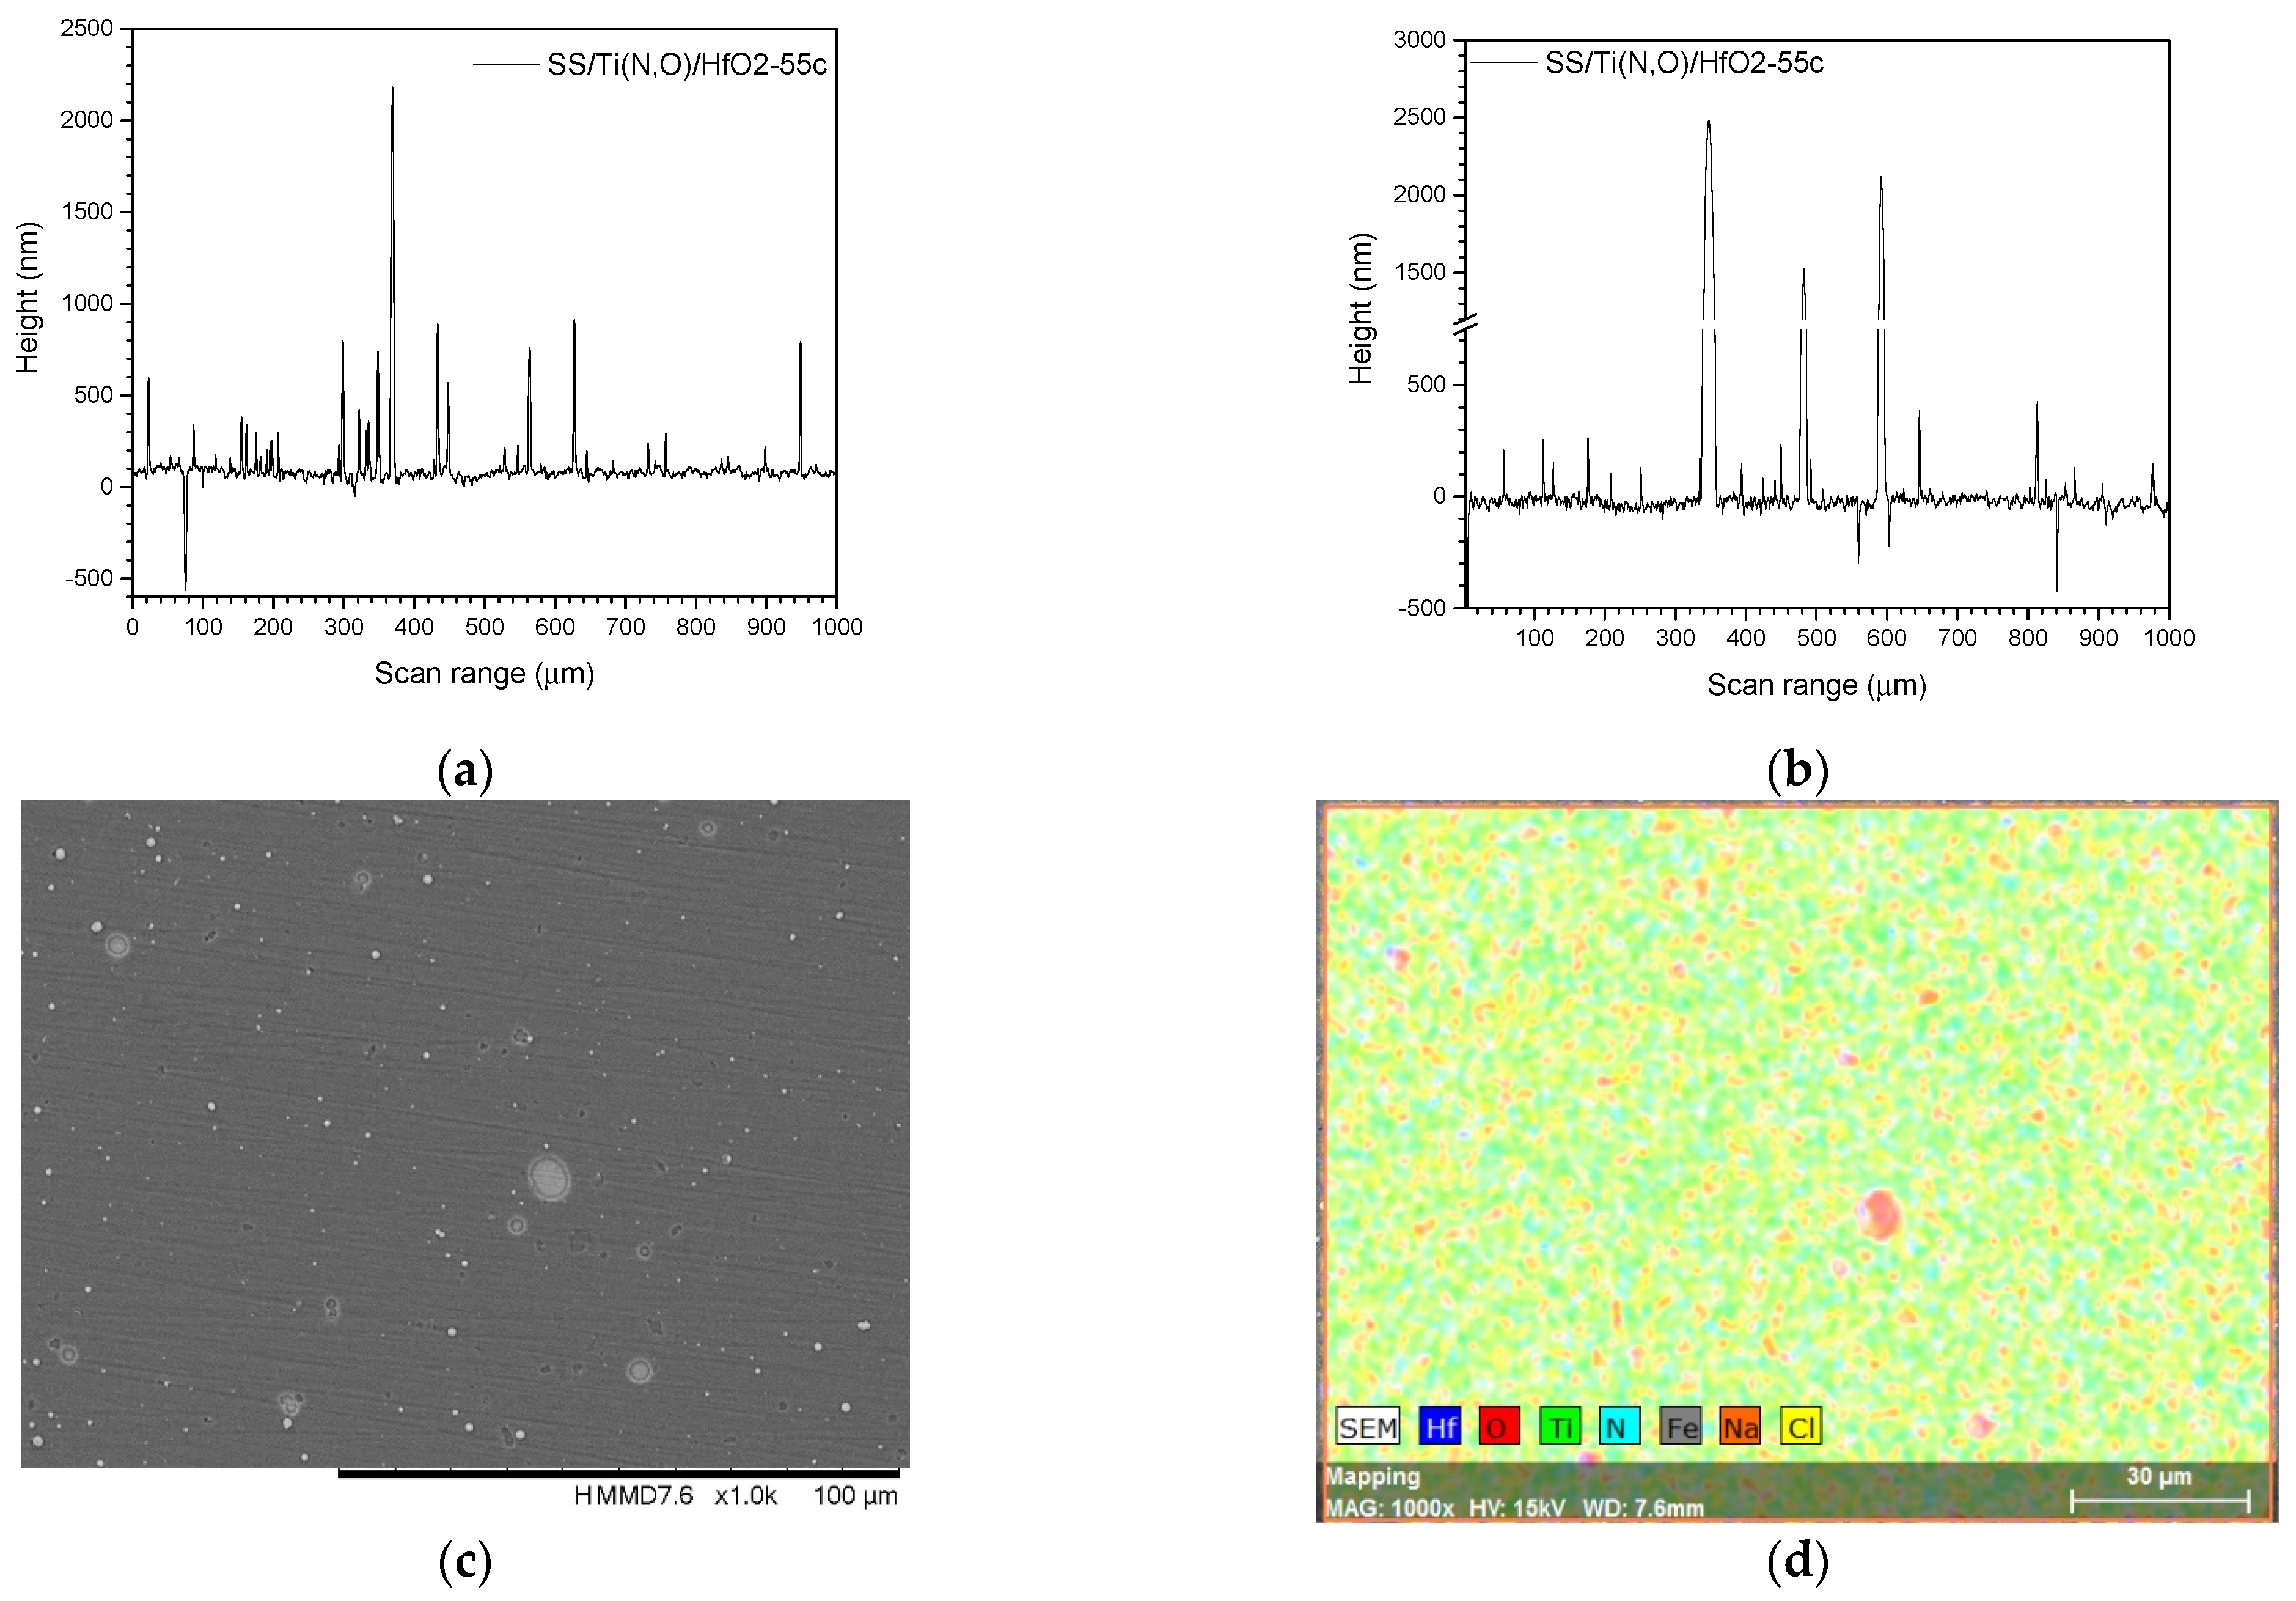
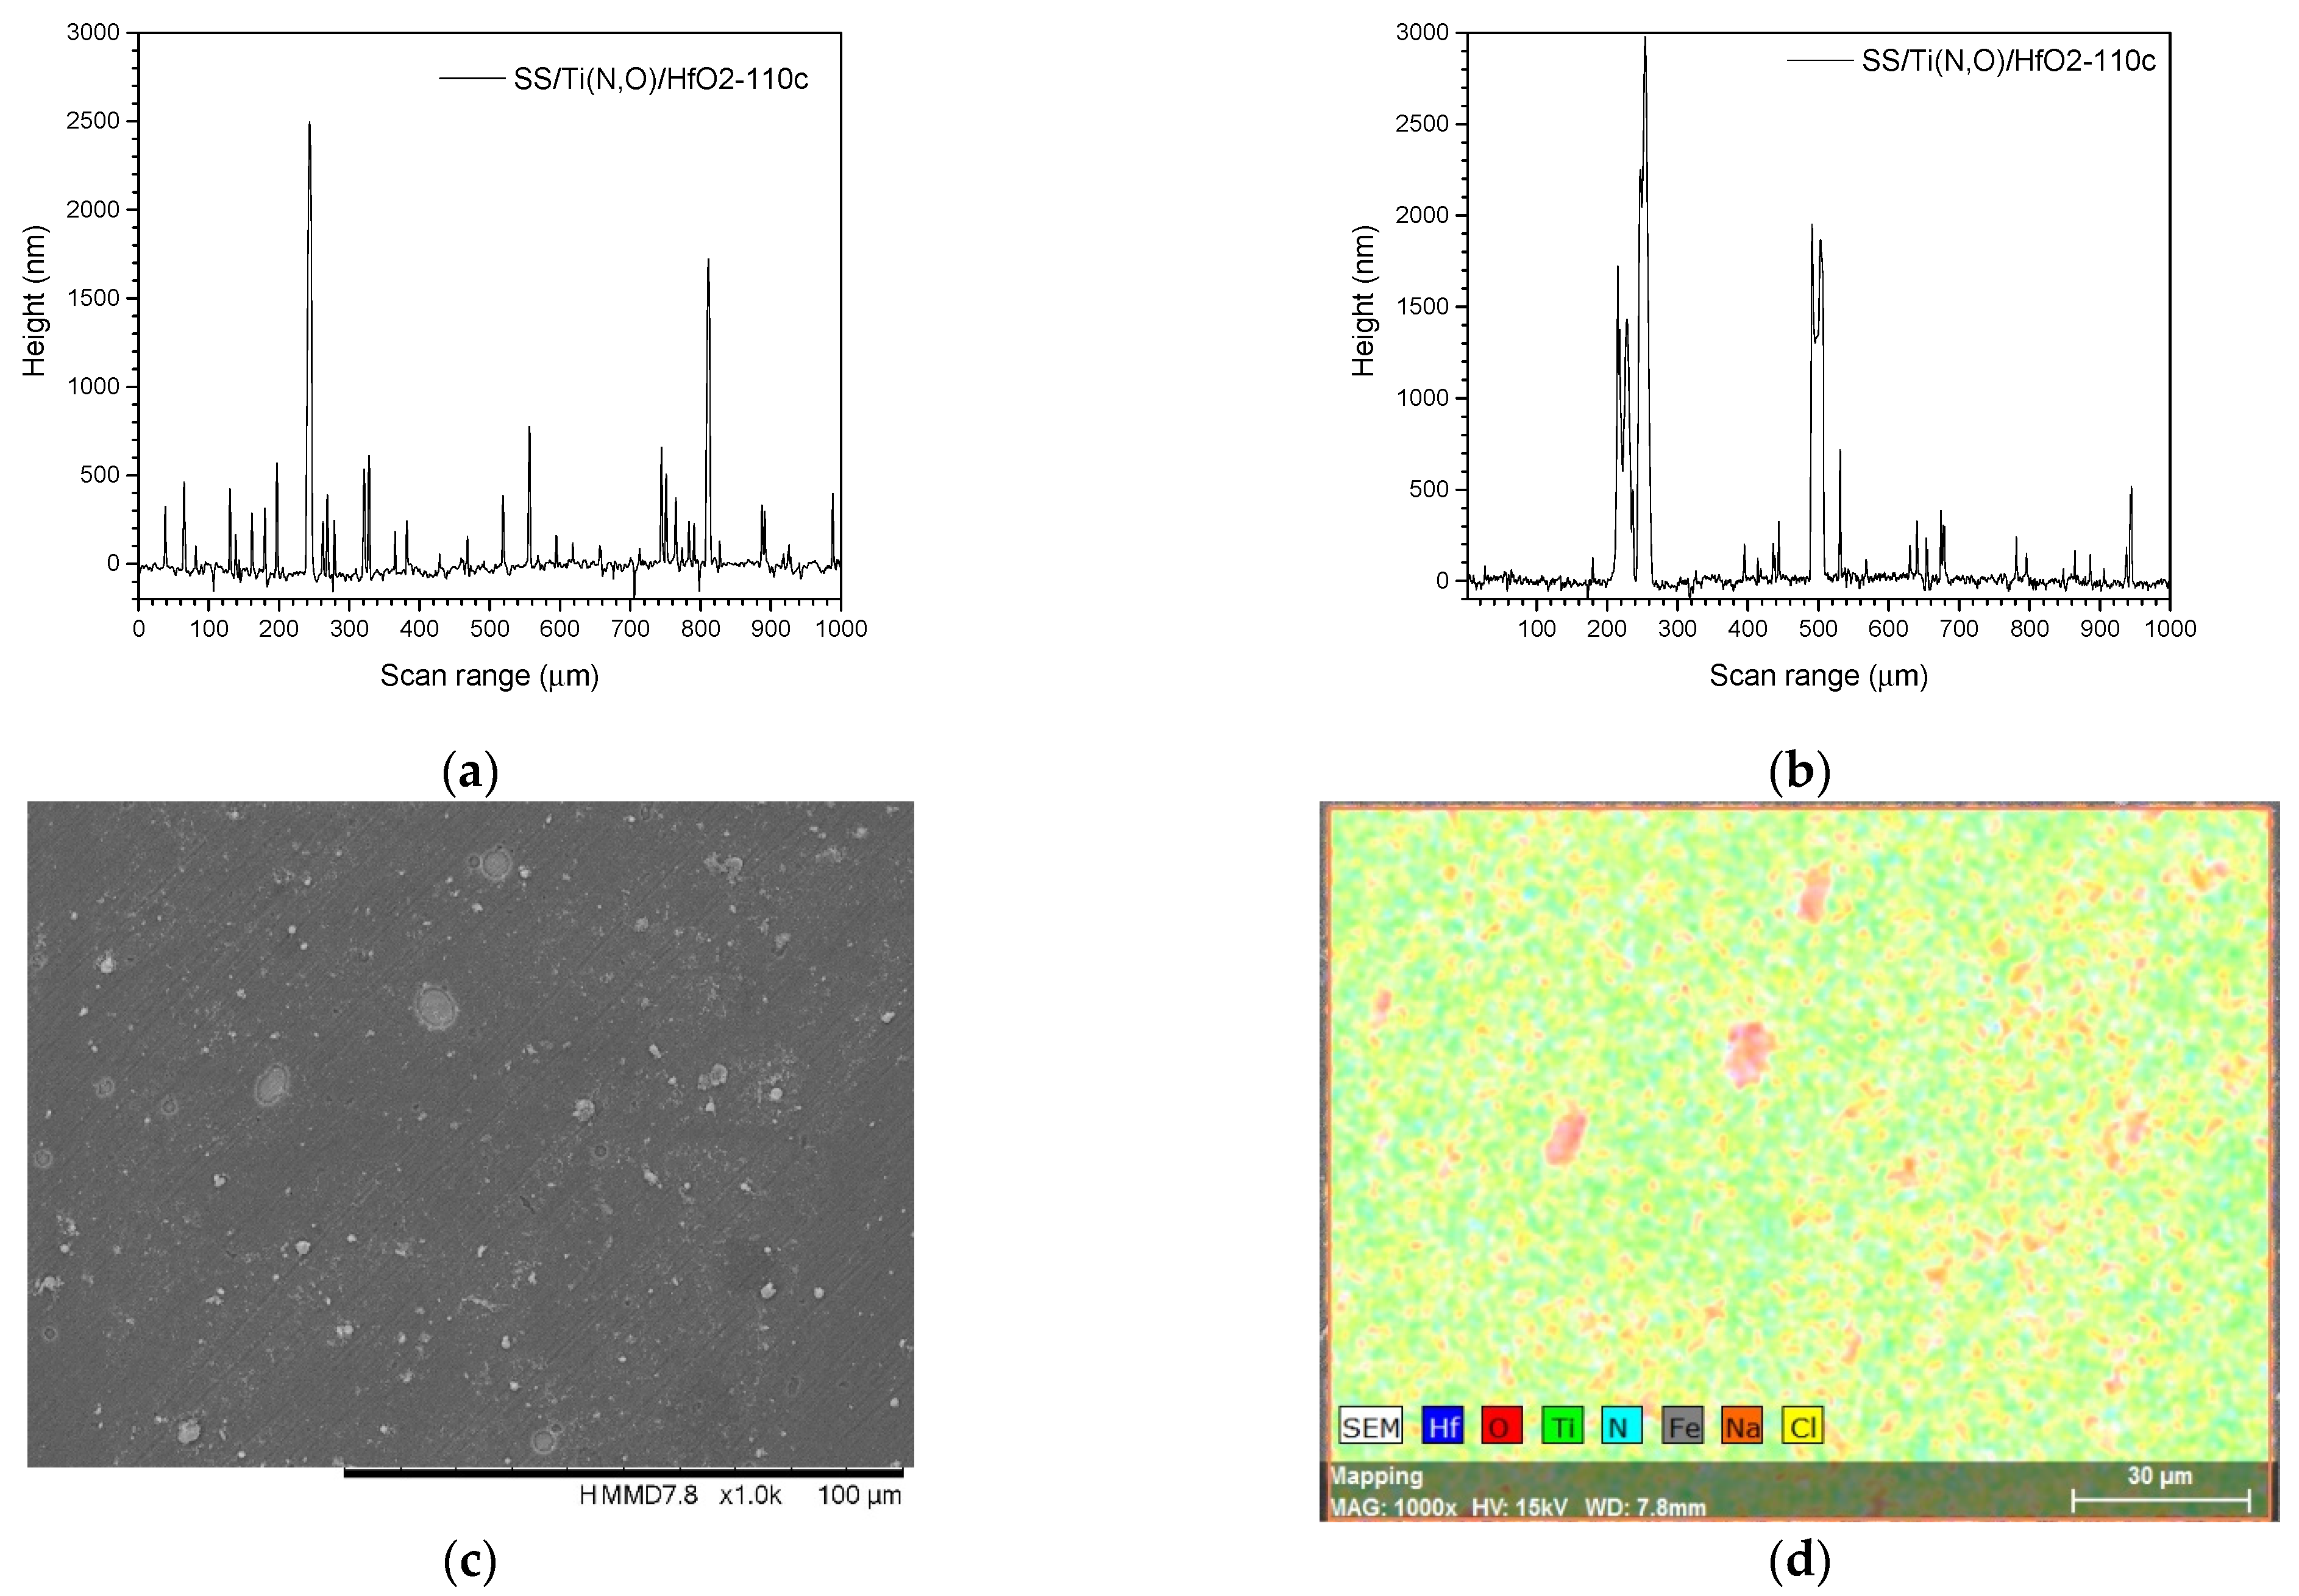
3.1. Surface Morphology and Elemental Composition

Table 1 presents the elemental composition of the samples. The acquisition time for the EDS analysis was chosen according to the film thickness: 1200 s for Ti(N,O) coatings, about 1 µm thick, and 3600 s for the other six oxynitride/oxide coatings.
Figure 2, Figure 3, Figure 4 and Figure 5 show the surface morphology of all coatings. It is noticeable that the few visible pinholes on the SS/Ti(N,O) sample disappeared after ALD coating. The EDS results for each coating, also shown in Figure 2, Figure 3, Figure 4 and Figure 5, indicate the homogeneous distribution of elements on each sample’s surface. The presence of each metal in the ALD-deposited oxides is well visible, including some small metal agglomeration. This comes from the ultrathin nature of ALD. All of the coatings are thin enough that EDS can still clearly detect the metal composition under the coatings. One can observe that the signal corresponding to atomic Fe concentration increased in the case of SS/Ti(N,O)-HfO2 coatings, indicating that the bilayers were thinner than the other types of ALD coatings, probably due to the slow growth rate of HfO2. The actual thickness of HfO2 may be thinner than expected. The designed thickness of HfO2 was estimated from the literature. However, the actual growth rate varied because of different conditions such as the dose time and different substrates. The reported growth rate was an average value based on several hundred cycles. The initial growth rate may be slower than the average value. Unlike Al2O3 and ZrO2, HfO2 followed an island growth mechanism: nucleation, the development of separated nuclei, and flattening. So, 55 cycles of HfO2 may not be enough for a smooth film. Therefore, 110 cycles of HfO2 were required to protect the substrate [50].

3.2. Phase Composition

Figure 6 presents the diffractograms of the coatings. The red lines show the maxima specific for the SS and the blue lines those for the Ti(N,O) coatings. Even if the ALD-deposited layer showed no specific signature, it is clear that the ALD process had a certain influence on the SS support, as the support and Ti(N,O) maxima have lower intensity values. The ALD temperature was 200 °C, which is not high enough to crystallise in general. For example, ZrO2 starts to crystallise at 420 °C [51].
The as-deposited HfO2 films were amorphous and remained amorphous after annealing at 400 and 450 °C. At an annealing temperature higher than 500 °C, diffraction peaks appeared, indicating the formation of crystalline HfO2 [52]. For a flat support, the amorphous Al2O3 phase of any thickness was always the most stable in the case of ALD deposition [53,54].

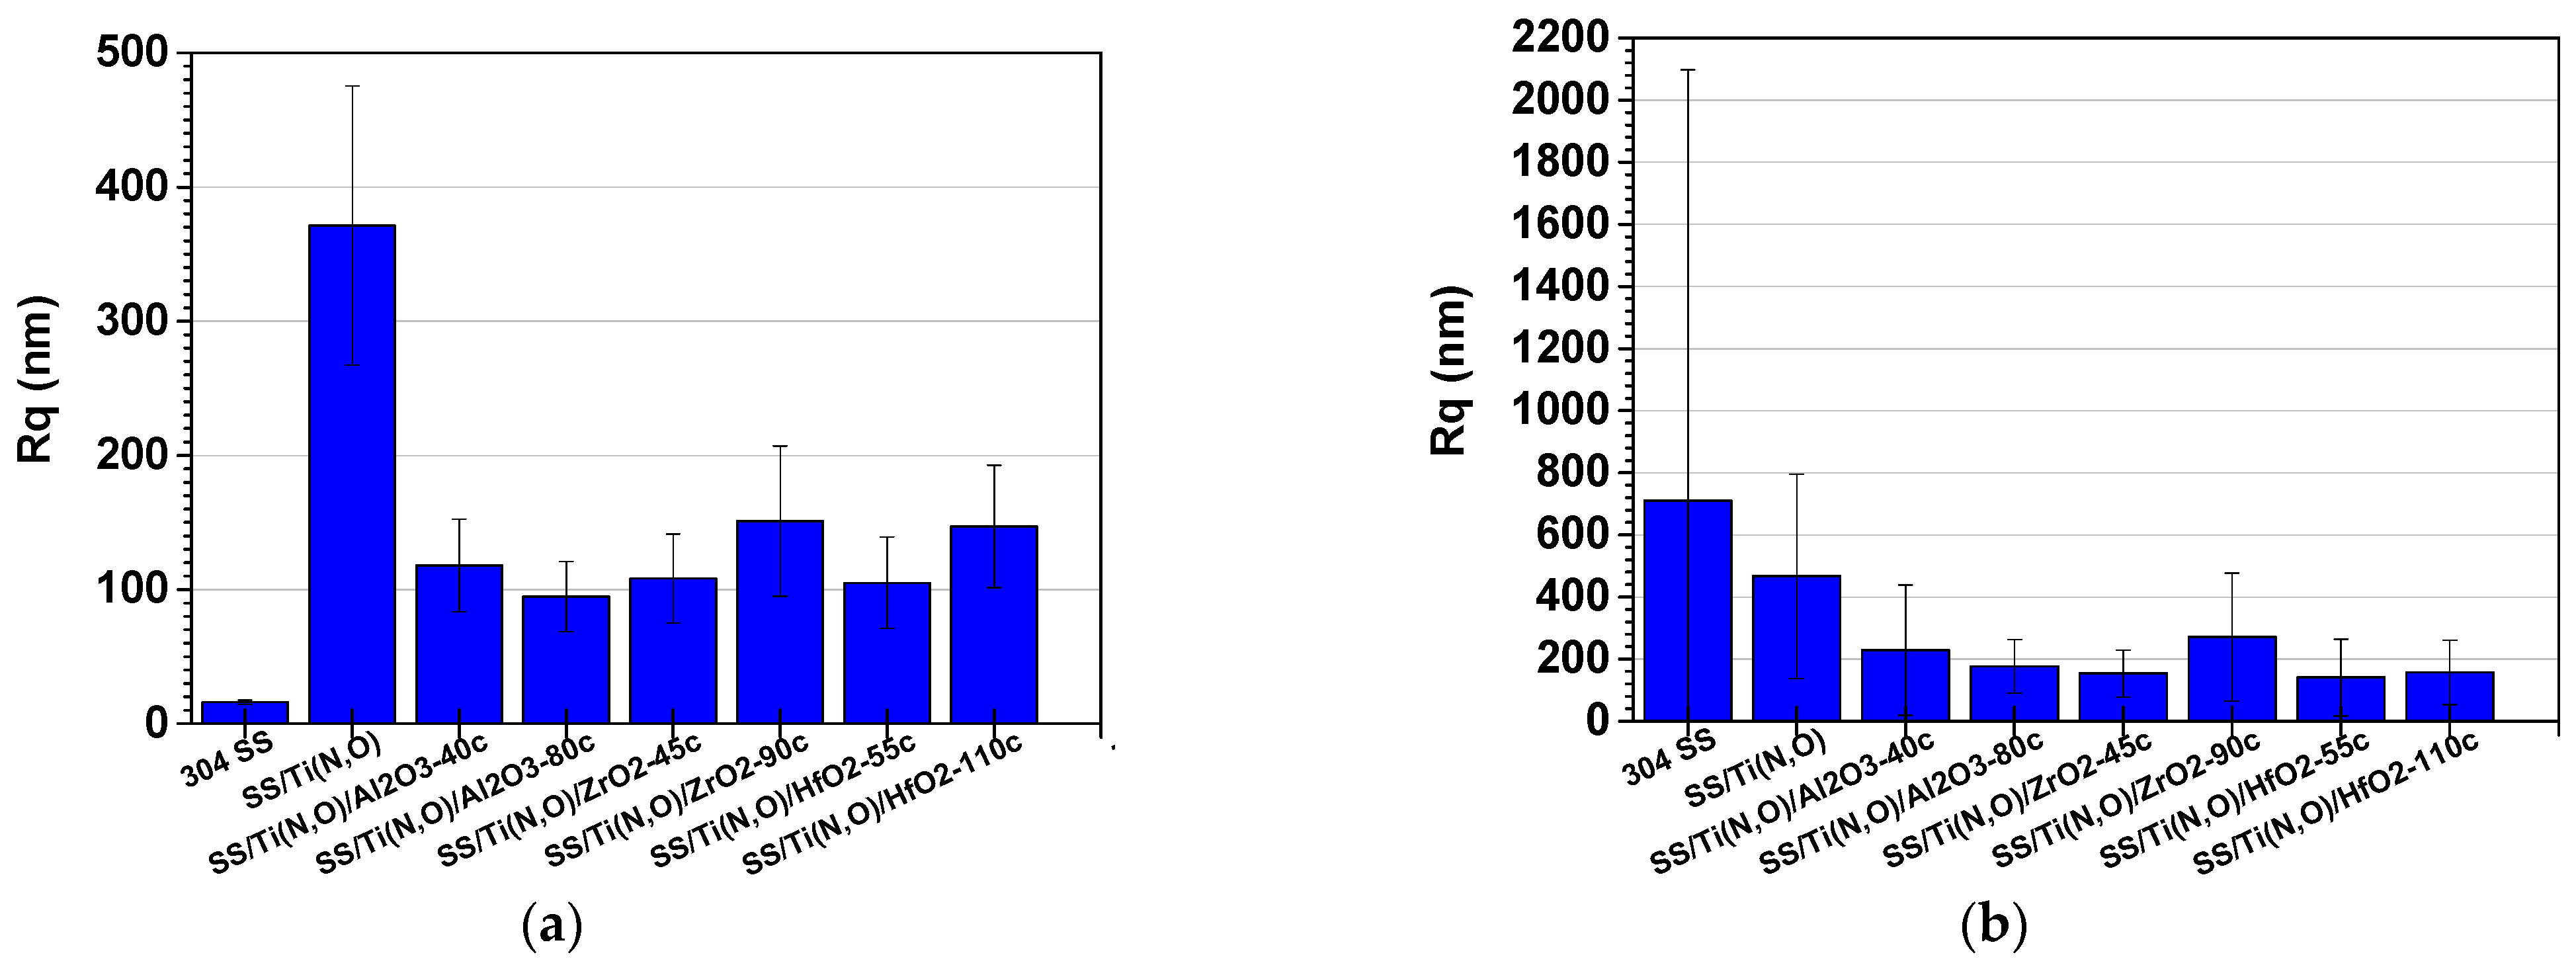
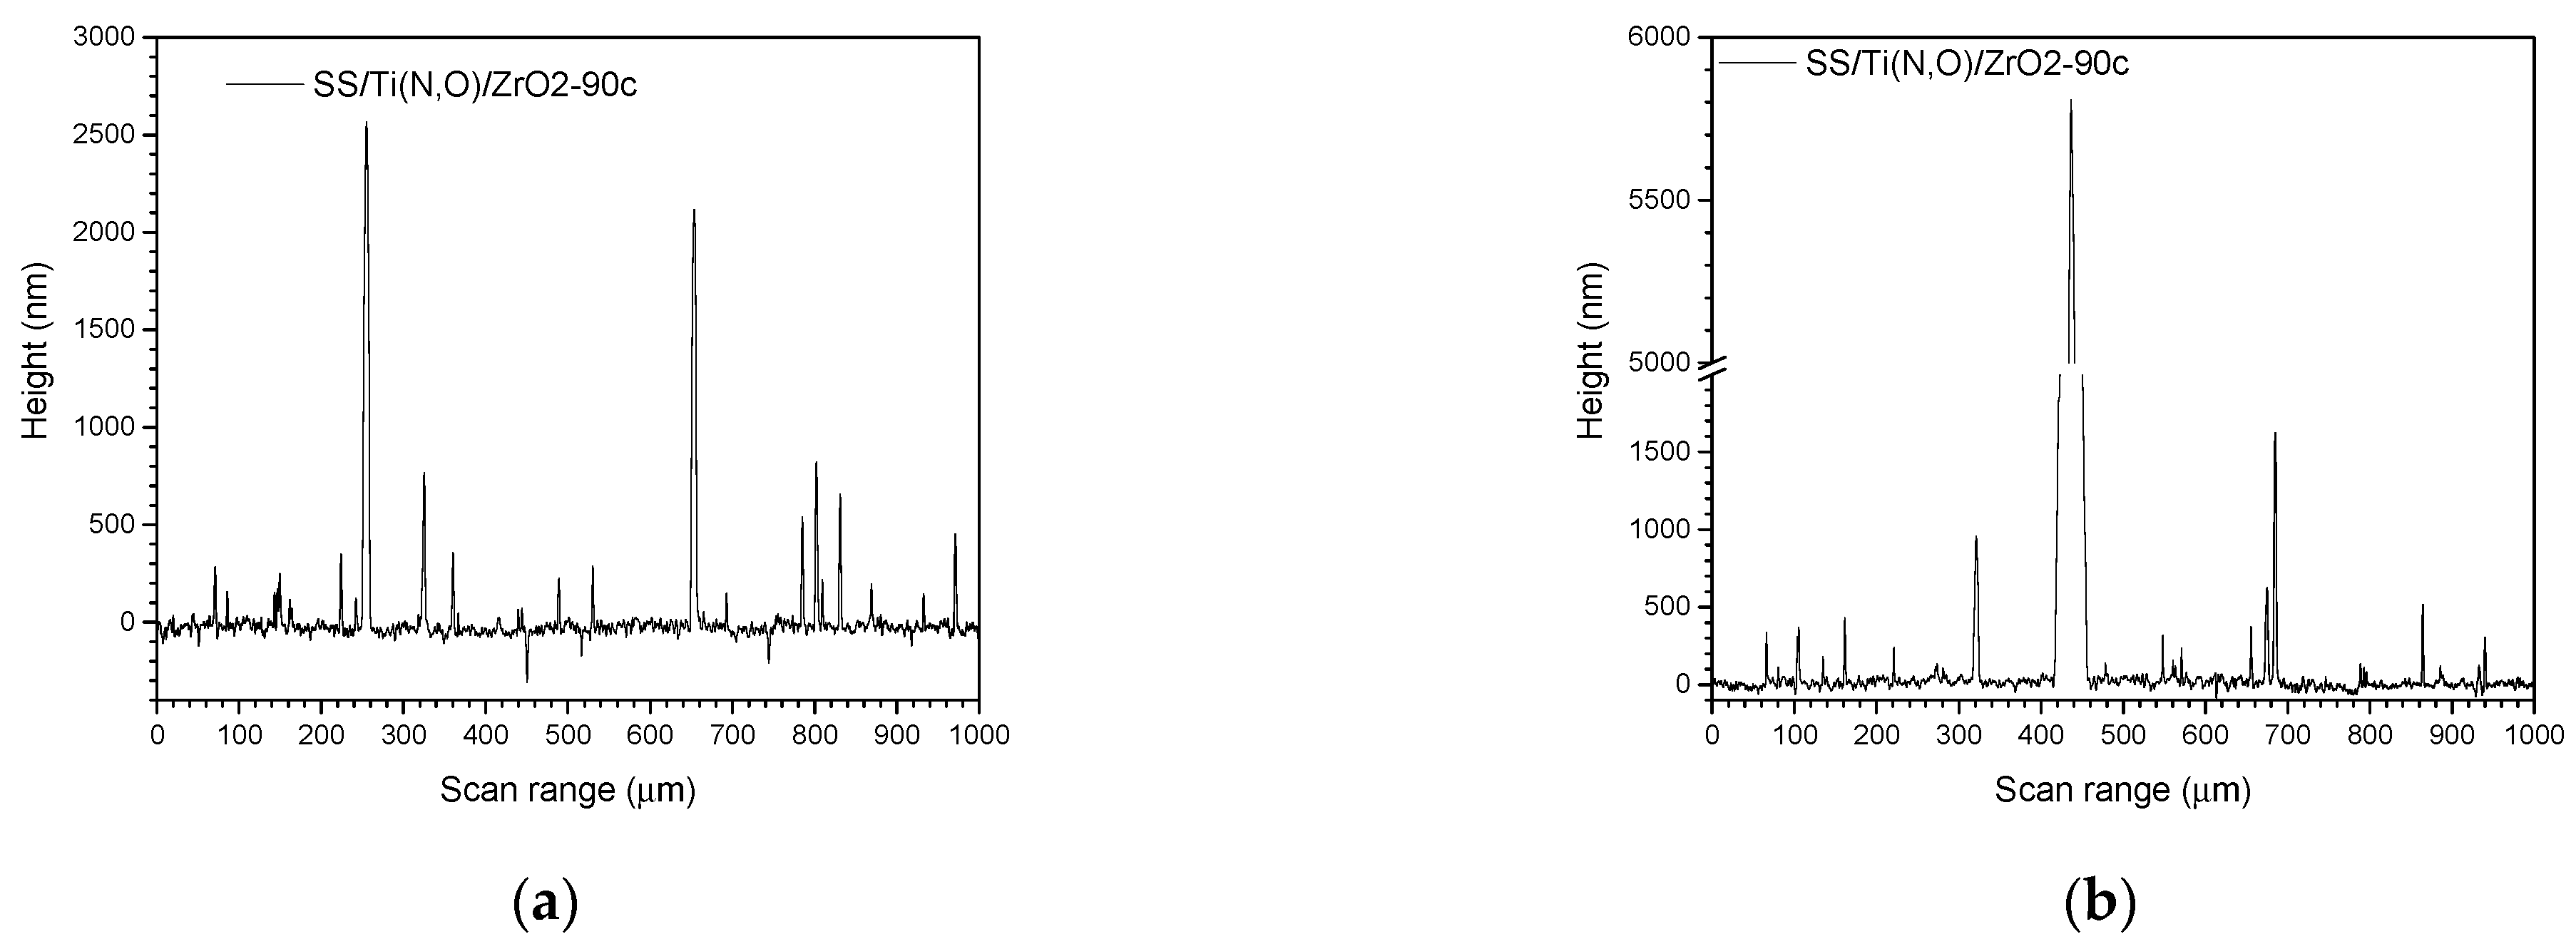
3.3. Surface Roughness before and after the Corrosive Attack

Figure 7, Figure 8 and Figure 9 show the main roughness parameters of the coatings before and after the corrosion attack. The roughness of all samples increased significantly after the corrosion tests. The most significant increase in the Ra and Rq parameters was noted for the SS and SS/Ti(N,O) sample, while in the case of the oxide-coated samples, only a slight increase was observed. Before corrosion, in contrast to the SS and SS/Ti(N,O) samples, the oxide-coated samples exhibited not only higher roughness values, but also a large dispersion of the measured value.
Due to the quite large non-uniformities present on the surfaces, the roughness parameters of the oxide-coated samples are in the same range, such that the surface roughness could not be further used in the assessment of corrosion resistance.
To sustain this statement, Figure 10, Figure 11, Figure 12, Figure 13, Figure 14, Figure 15 and Figure 16 present the scanned lines obtained by Dektak before and after the corrosion tests showing in detail the surface features responsible for the large error bars, and the morphology (SEM) and composition (EDS) images after the corrosion tests. The corroded surface showed traces of the solution used as electrolyte, as seen in the EDS images, even if the samples were flushed with deionised water after the corrosion test. However, the concentrations (obtained by EDS) of Na and Cl are very low: Cl about 10−3 at. % and Na 10−2 at.%, and the errors are one order of magnitude lower.

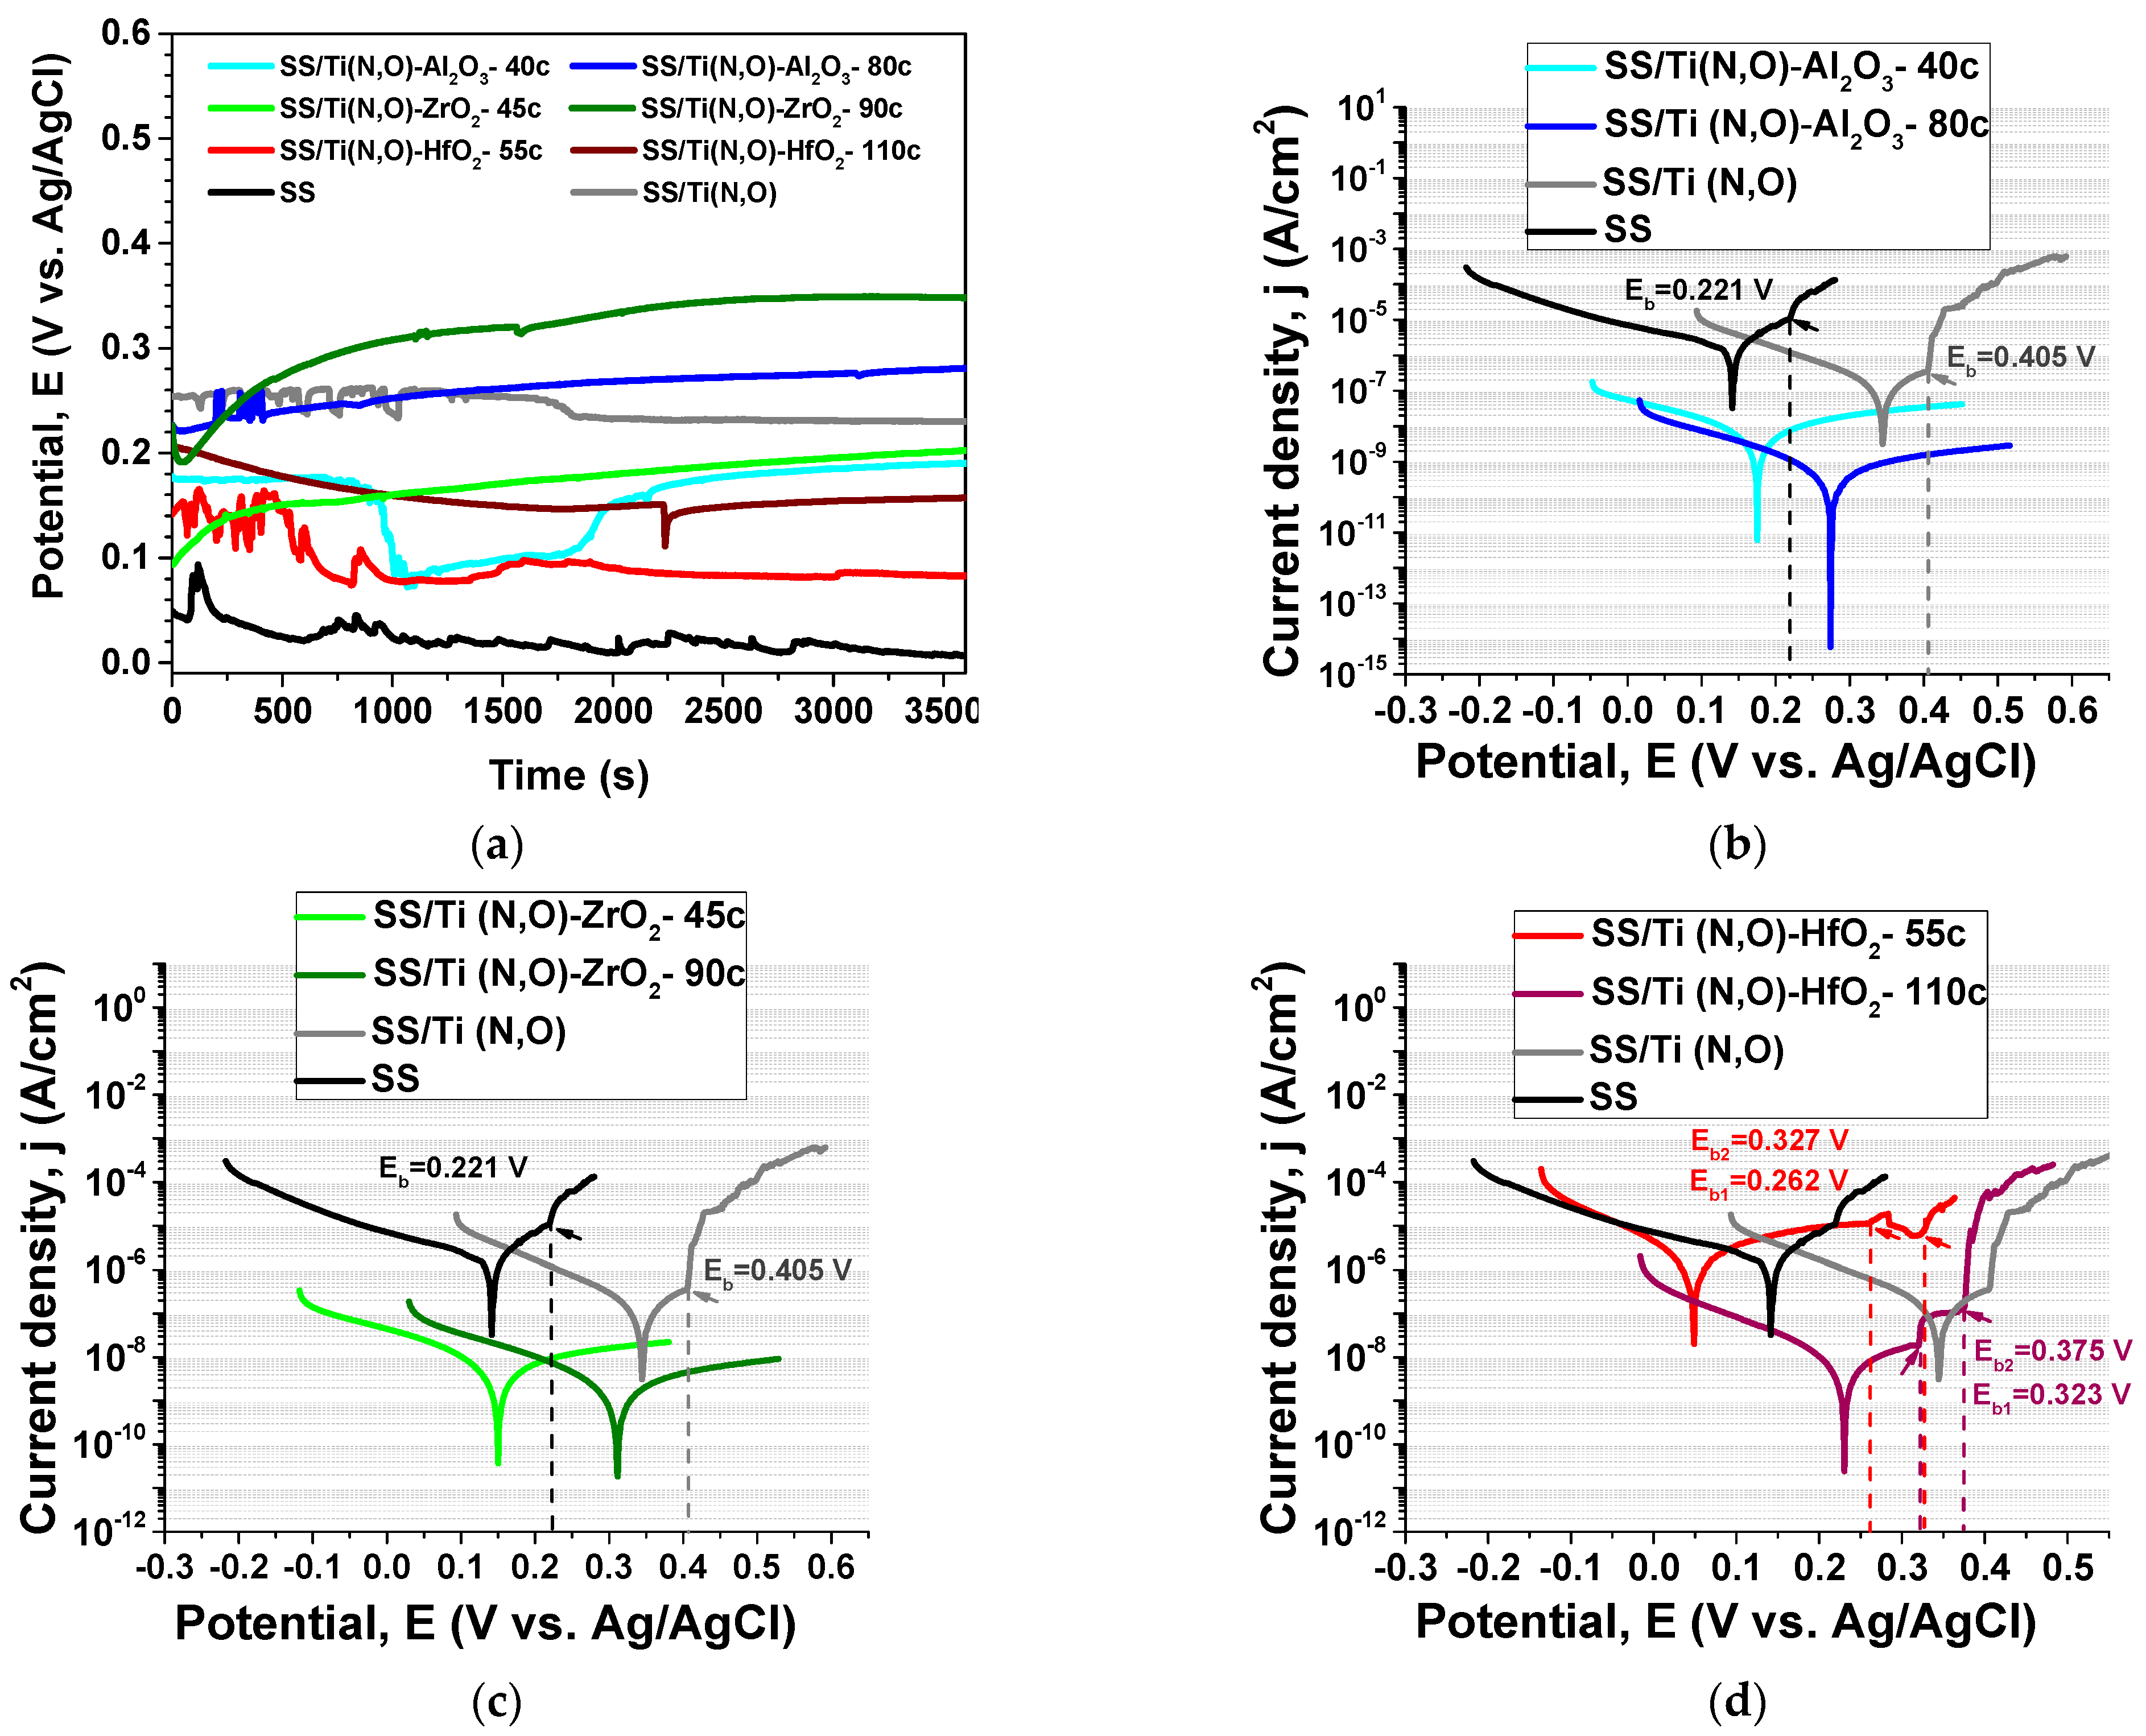
3.4. Electrochemical Evaluation—Tafel Plots

The value of the open circuit potential (Eoc) depends on the chemical composition of the electrolyte, its temperature and oxygen content, and the nature of the investigated material [55], providing information about the sample’s “nobility”. All coatings presented more electropositive values compared to the SS support (Table 2), indicating a better corrosion resistance due to surface oxidation during the initial immersion in the electrolyte. The time-dependent Eoc values measured for all investigated samples are presented in Figure 17a. Even if at Eoc the anodic and the cathodic reaction rates are in equilibrium, the increase of Eoc during immersion until value stabilisation is usually determined by the decrease in the anodic reaction due to the growth of a passive film [56], and also by the possible increase in the cathodic reaction generated by the increased dissolved oxygen [57]. This trend is observed in the case of thicker alumina and both zirconia-coated samples, indicating that these samples are less prone to corrosion. The highest value was measured for SS/Ti(N,O)-ZrO2-90c, followed by SS/Ti(N,O)-Al2O3-80c. On the other hand, the decrease in Eoc indicates an increased susceptibility to corrosion. This is the case for SS, SS/Ti(N,O), and both hafnia-coated samples.
Considering the Tafel plots (Figure 17b–d), one can see that both the uncoated and Ti(N,O)-coated SS showed a local disruption of the passive layer, evidenced by the breakdown potential (Eb), giving rise to a sharp increase in the ion current density, indicating that local corrosion processes were activated. Eb represents the potential where the current sharply increases with increasing potential, revealing information related to the breakdown of the formed layer during the anodic reactions [57,58]. The Eb(SS/Ti(N,O) is located at about 405 mV, while Eb(SS) is located at 221 mV, indicating that, in the bare SS metal, the cathodic process was significantly higher than in the coated one. No breakdown was observed in the case of samples with a top nanolayer of Al2O3 and ZrO2. However, SS/Ti(N,O)/HfO2 coatings presented two breakdown values for both thickness values. Additionally, the position of both breakdown potentials related to SS/Ti(N,O)/HfO2-55c coating were lower than that related to SS/Ti(N,O).
The Tafel slopes (βc and βa) were determined from the parts that exhibited linearity in accordance with the Tafel relationship. The calculated values of the cathode and anode slope were all high. However, for the bare SS support, the cathodic slope was significantly higher than the anodic one, indicating a cathodic reduction detrimental to the anodic oxidation [58,59,60]. In the case of SS/Ti(N,O) coatings, the slopes were quite similar, such that it may be concluded that the hydrogen evolution and metal dissolution were almost in equilibrium [61]. For the ALD-coated samples, except for SS/Ti(N,O)/HfO2-110c, the anodic slope became higher than the cathodic slope, indicating an inhibition action of the oxides by simply blocking the metal from interaction with the acidic and oxidising environment [62,63,64].
The results obtained from the corrosion tests are presented in Table 2.
The corrosion potential Ecorr can be defined as the potential at which the applied potential changes its polarity; the rate of oxidation is equal to the rate of reduction and is indicative of the kinetic control of the investigated material [57,58]. A high electropositive corrosion potential value (Ecorr) is commonly interpreted to indicate an improved resistance to corrosion. Using this criterion, one can observe that the samples coated with a thicker oxide nanolayer were more resistant to corrosion attack than those with a thinner oxide nanolayer.
Comparing the corrosion current density values (icorr), we observed that the highest value was obtained for SS/Ti(N,O)-HfO2-55c. All other coatings exhibited lower icorr values than the bare SS support. This parameter is probably the most important in considering a material’s corrosion resistance. In this respect, the samples coated with a thicker oxide nanolayer were more resistant to corrosion attack than those with a thinner oxide nanolayer, in the following order: SS/Ti(N,O)/Al2O3-80c > SS/Ti(N,O)/ZrO2-90c > SS/Ti(N,O)/HfO2-110c.
The polarisation resistance (Rp) parameter designates the degree of protection imparted by the passive layer formed on the material’s surface, such that a higher Rp value denotes a higher resistance to corrosive attack [65]. The Rp parameter has high values for SS/Ti(N,O)/Al2O3-80c and SS/Ti(N,O)/ZrO2-90c. Both hafnia top-coated samples show low values, in the following order: SS/Ti(N,O)/HfO2-55c < SS < SS/Ti(N,O) < SS/Ti(N,O)/HfO2-110c < SS/Ti(N,O)/Al2O3-40c.
For a comprehensive assessment related to the corrosion resistance of the samples, we applied the Kendall rank correlation [66], considering the parameters with a major influence: Ecorr, icorr and Rp. Table 3 presents the results for each corrosion parameter labelled from 1 to 8, with rank 1 being related to the best corrosion resistance and rank 8 being assigned to the worst. The last column shows the sum of the ranks (ΣRanks) for each sample, and the best corrosion performance corresponds to the lowest ΣRanks value. Upon summing the ranks, we obtained the same values (4) for SS/Ti(N,O) and SS/Ti(N,O)-ZrO2-45c. The last column indicates the coatings’ overall ranks. The coating ordering related to their corrosion resistance may be expressed as: SS/Ti(N,O)/Al2O3-80c > SS/Ti(N,O)/ZrO2-90c > SS/Ti(N,O)/HfO2-110c > SS/Ti(N,O)/ZrO2-45c = SS/Ti(N,O) > SS/Ti(N,O)/Al2O3-40c > SS > SS/Ti(N,O)/HfO2-55c. The sum of the ranks (ΣRanks) for each sample are calculated such that the highest corrosion performance corresponds to the lowest ΣRanks value. The last column presents the overall rank in which the lower value (1) was ascribed to the best corrosion performance and the highest value (7) to the lowest performance.
The information derived from the Tafel plots is concurrent with that obtained from the time evolution of Eoc. Indeed, the SS/Ti(N,O)-ZrO2-45c samples was less prone to corrosion compared to SS/Ti(N,O)-Al2O3-40c, even if the best corrosion resistance was exhibited by the SS/Ti(N,O)-Al2O3-80c sample. Considering all coated samples, the lowest Eoc value was measured for SS/Ti(N,O)-HfO2-55c, which presented a lower corrosion resistance, even compared to SS. This result might be explained by the growth mechanism of HfO2, such that the thinner hafnia films might not have been continuous.
The results obtained for the thinner oxide coatings indicate that during the preparation of oxide coatings, the use of the hydrogen peroxide started to aggressively corrode the Ti(N,O) and possibly also the SS support. Due to the island mechanism of growth of the hafnia coating, the corrosion attack of the electrolyte in the highly oxidative environment depreciated both the Ti(N,O) coatings and the SS support, resulting in the poor corrosion resistance of the SS/Ti(N,O)/HfO2-55c sample. The superior results obtained for SS/Ti(N,O)/ZrO2-45c compared to SS/Ti(N,O)/Al2O3-40c may be ascribed to the higher Eoc values obtained for the thin zirconia coating. This result is also concurrent with the fact that the ALD technique is sensitive to the chemical state of the substrate used, and in the case of alumina, its growth is eased if the support surface is rich in hydroxyl groups [67,68]. Due to this peculiarity of ALD-grown alumina, the proper nucleation of film was impeded because the support had insufficient hydroxyl groups, as these were consumed by etching the Ti(N,O) initial layer. We infer that, at the beginning of the growth process, a slight decrease in the sealing properties of the first alumina oxide layers occurred, such that SS/Ti(N,O) outperformed its corrosion resistance.
The mechanisms responsible for the different electrochemical properties of the thinner oxide coatings might be also related to the very thin layer of oxide and to the possibility of two opposing reactions occurring: the hot hydrogen peroxide partially removing the Ti(N,O) and starting to corrode the SS support, and the common oxidation reaction that forces the oxide layer to form.
Both the thickness of the coating and the coating materials are important. In this study, thin films with ~10 nm thickness exhibited good corrosion resistance, which was much thinner than most of the reported values due to the high quality of our ALD thin films. For example, ∼50 nm ALD films of Al2O3 (64 nm), TiO2 (40 nm), ZnO (50 nm), ZrO2 (60 nm), and HfO2 (60 nm) was required for the corrosion protection of copper [32]. A 70 nm TiO2 film was used to protect magnesium alloys [69]. The considerably thinner ALD films we prepared were still beneficial to maintain the original function of the primary coated supports.
Summarising, we conclude that the thicker ALD oxide coatings improved the corrosion resistance of the Ti(N,O)-coated 304 L stainless steel. The best results were obtained when using alumina and zirconia as upper coatings. Despite the quite high roughness of the coatings after corrosion, the coatings blocked the attack of the corrosive solution. The less promising results obtained for thin hafnia nanolayer-coated samples might be related to the thinner coating of HfO2 than Al2O3 and ZrO2 due to its lower growth rate and specific island growth mechanism, which is consistent with the hafnia composition shown in Table 1, pointing to a certain minimum thickness required for the ALD-deposited oxide. This detail should be further studied as it is likely a specific characteristic of each oxide. This is an example of what happens in an advanced oxidation system and explains why the best ALD coating selection is needed to achieve the most corrosion-resistant material coatings. This study neatly shows that the standard anticorrosion coatings require significant improvement for applications such as advanced oxidation. Moreover, it shows which coatings are likely to be robust enough to protect SS in such highly oxidative environments, and which do not offer any advantage.

4. Conclusions

We report on the deposition on stainless steel supports of two different layers with different compositions, Ti(N,O) oxynitride, obtained using CAE, and alumina, zirconia, or hafnia deposited using ALD. Though Ti(N,O)-coated 304L stainless steel proved to be quite corrosion resistant in the applied acidic, saline, and oxidising environment, the presence of some pinholes specific for the cathodic arc evaporation still renders it vulnerable to oxidation and corrosion. This work aimed to increase the protection of the surface of Ti(N,O)-coated 304L stainless steel in an aqueous acidic, saline, oxidising solution by nanometre ultrathin Al2O3, ZrO2, and HfO2 ALD coatings. The corrosion protection behaviour of the fabricated coatings was assessed by potentiodynamic polarisation tests in a simulated corrosive environment. The effect of the number of ALD cycles on ceramic film thickness and corrosion resistance was also investigated. Two thickness values of the oxides were deposited. The surfaces coated by oxynitride and oxides presented a good corrosion resistance, with the best results being obtained for the thicker oxides, which outperformed the corrosion resistance of Ti(N,O)-coated 304L stainless steel. The thicker Al2O3, ZrO2, and HfO2 ALD coatings with ~10nm thickness showed excellent corrosion resistance, while the thinner Al2O3, ZrO2, and HfO2 ALD coatings exhibited different performances. Thinner HfO2 films had lower corrosion resistance than Al2O3 and ZrO2 films. The reason for this may be due to the different growth mechanisms. The island growth mechanism of HfO2 required more cycles of coating to efficiently protect the substrate. The thinner oxide coatings had a lower corrosion resistance, with the lowest performance being observed for the thin hafnia coating SS/Ti(N,O)/HfO2-55c. Due to the conformal nature of ALD coatings, the corrosion of droplets specific for the coatings obtained using cathodic arc evaporation could be efficiently contained, even with a thickness of only several nanometres, blocking the metal from interactions with the acidic and oxidising environment.
The obtained results indicated that the use of CAE and ALD deposition methods can obtain coatings with higher protection resistance to corrosive attack in saline and acidic environments.

Author Contributions

Conceptualisation, L.F.P. and V.B.; methodology, M.B. and X.L.; validation, V.B. and K.W.; formal analysis, M.B. and X.L.; investigation, M.D., A.C.P., E.S.M.M. and K.W.; resources, V.B. and X.L.; data curation, M.D., A.C.P., A.V. and K.W.; writing—original draft preparation, E.S.M.M., M.D., M.D. and K.W.; supervision, L.F.P.; writing—review and editing, M.B. and L.F.P.; funding acquisition: M.B., L.F.P. and X.L. All authors have read and agreed to the published version of the manuscript.

Funding

This work was carried out by the Core Program Project 18N/2019 and through the Core Program within the National Research Development and Innovation Plan 2022–2027, carried out with the support of MCID, project no. PN 23 05 (M.D., A.C.P., V.B., A.V., M.B.); K.W. and X.L acknowledge the funding from US NSF award CBET-2306177 for the work at Washington University, St. Louis.

Data Availability Statement

https://www.mdpi.com/ethics (accessed on 30 December 2022).

Acknowledgments

AlinaVadescu (Dragomir) thanks Tomsk Polytechnic University within the framework of the Tomsk Polytechnic University Competitiveness Enhancement Program grant. Emile S. Massima Mouele acknowledges Katri Laatikainen and Eveliina Repo from LUT for their support.

Conflicts of Interest

The authors declare no conflict of interest. The founding sponsors had no role in the design of the research; in the collection, analyses, or interpretation of data; in the writing of the manuscript, and in the decision to publish the results.

References

  1. Marin, E.; Guzman, L.; Lanzutti, A.; Fedrizzi, L.; Saikkonen, M. Chemical and electrochemical characterization of hybrid PVD + ALD hard coatings on tool steel. Electrochem. Commun. 2009, 11, 2060–2063. [Google Scholar] [CrossRef]
  2. Perillo, P.M. Corrosion Behavior of Coatings of Titanium Nitride and Titanium-Titanium Nitride on Steel Substrates. Corrosion 2006, 62, 182–185. [Google Scholar] [CrossRef]
  3. Subramanian, B.; Muraleedharan, C.; Ananthakumar, R.; Jayachandran, M. A comparative study of titanium nitride (TiN), titanium oxy nitride (TiON) and titanium aluminum nitride (TiAlN), as surface coatings for bio implants. Surf. Coat. Technol. 2011, 205, 5014–5020. [Google Scholar] [CrossRef]
  4. El-Fattah, H.A.A.; El-Mahallawi, I.S.; Shazly, M.H.; Khalifa, W.A. Optical Properties and Microstructure of TiNxOy and TiN Thin Films before and after Annealing at Different Conditions. Coatings 2019, 9, 22. [Google Scholar] [CrossRef] [Green Version]
  5. Rtimi, S.; Baghriche, O.; Sanjines, R.; Pulgarin, C.; Bensimon, M.; Kiwi, J. TiON and TiON-Ag sputtered surfaces leading to bacterial inactivation under indoor actinic light. J. Photochem. Photobiol. A Chem. 2013, 256, 52–63. [Google Scholar] [CrossRef] [Green Version]
  6. Duta, O.C.; Ficai, D.; Ficai, A.; Andronescu, E.; Beshchasna, N.; Saqib, M.; Opitz, J.; Kraśkiewicz, H.; Wasyluk, Ł.; Kuzmin, O.; et al. Titanium oxynitride coatings deposited by magnetron sputtering for improvement of cardiovascular stent design. In Proceedings of the World Congress on New Technologies, Madrid, Spain, 19–21 August 2018; pp. 18–20. [Google Scholar] [CrossRef]
  7. Braic, L.; Vasilantonakis, N.; Mihai, A.; Villar-Garcia, I.J.; Fearn, S.; Zou, B.; Alford, N.M.; Doiron, B.; Oulton, R.F.; Maier, S.A.; et al. Titanium Oxynitride Thin Films with Tunable Double Epsilon-Near-Zero Behavior for Nanophotonic Applications. ACS Appl. Mater. Interfaces 2017, 9, 29857–29862. [Google Scholar] [CrossRef] [PubMed] [Green Version]
  8. Asahi, R.; Morikawa, T.; Ohwaki, T.; Aoki, K.; Taga, Y. Visible-Light Photocatalysis in Nitrogen-Doped Titanium Oxides. Science 2001, 293, 269–271. [Google Scholar] [CrossRef] [PubMed]
  9. Ahmed, M.; Xinxin, G. A review of metal oxynitrides for photocatalysis. Inorg. Chem. Front. 2016, 3, 578–590. [Google Scholar] [CrossRef]
  10. Pana, I.; Braic, V.; Dinu, M.; Mouele, E.S.M.; Parau, A.C.; Petrik, L.F.; Braic, M. In Vitro Corrosion of Titanium Nitride and Oxynitride-Based Biocompatible Coatings Deposited on Stainless Steel. Coatings 2020, 10, 710. [Google Scholar] [CrossRef]
  11. Esaka, F.; Furuya, K.; Shimada, H.; Imamura, M.; Matsubayashi, N.; Sato, H.; Nishijima, A.; Kawana, A.; Ichimura, H.; Kikuchi, T. Comparison of surface oxidation of titanium nitride and chromium nitride films studied by x-ray absorption and photoelectron spectroscopy. J. Vac. Sci. Technol. A 1997, 15, 2521–2528. [Google Scholar] [CrossRef]
  12. Wang, L.; Northwood, D.; Nie, X.; Housden, J.; Spain, E.; Leyland, A.; Matthews, A. Corrosion properties and contact resistance of TiN, TiAlN and CrN coatings in simulated proton exchange membrane fuel cell environments. J. Power Sources 2010, 195, 3814–3821. [Google Scholar] [CrossRef]
  13. Mouele, E.M.; Tijani, J.; Badmus, K.; Pereao, O.; Babajide, O.; Zhang, C.; Shao, T.; Sosnin, E.; Tarasenko, V.; Fatoba, O.; et al. Removal of Pharmaceutical Residues from Water and Wastewater Using Dielectric Barrier Discharge Methods—A Review. Int. J. Environ. Res. Public Health 2021, 18, 1683. [Google Scholar] [CrossRef]
  14. Mouele, E.S.M.; Tijani, J.O.; Badmus, K.O.; Pereao, O.; Babajide, O.; Fatoba, O.O.; Zhang, C.; Shao, T.; Sosnin, E.; Tarasenko, V.; et al. A critical review on ozone and co-species, generation and reaction mechanisms in plasma induced by dielectric barrier discharge technologies for wastewater remediation. J. Environ. Chem. Eng. 2021, 9, 105758. [Google Scholar] [CrossRef]
  15. Badmus, K.O.; Irakoze, N.; Adeniyi, O.R.; Petrik, L. Synergistic advance Fenton oxidation and hydrodynamic cavitation treatment of persistent organic dyes in textile wastewater. J. Environ. Chem. Eng. 2019, 8, 103521. [Google Scholar] [CrossRef]
  16. Badmus, K.O.; Tijani, J.O.; Massima, E.; Petrik, L. Treatment of persistent organic pollutants in wastewater using hydrodynamic cavitation in synergy with advanced oxidation process. Environ. Sci. Pollut. Res. 2018, 25, 7299–7314. [Google Scholar] [CrossRef] [PubMed] [Green Version]
  17. Li, M.; Jin, Z.-X.; Zhang, W.; Bai, Y.-H.; Cao, Y.-Q.; Li, W.-M.; Di Wu, D.; Li, A.-D. Comparison of chemical stability and corrosion resistance of group IV metal oxide films formed by thermal and plasma-enhanced atomic layer deposition. Sci. Rep. 2019, 9, 10438. [Google Scholar] [CrossRef] [Green Version]
  18. Díaz, B.; Härkönen, E.; Światowska, J.; Maurice, V.; Seyeux, A.; Marcus, P.; Ritala, M. Low-temperature atomic layer deposition of Al2O3 thin coatings for corrosion protection of steel: Surface and electrochemical analysis. Corros. Sci. 2011, 53, 2168–2175. [Google Scholar] [CrossRef]
  19. Zhang, C.; Yang, C.; Ding, G.; Wu, J. Effects of aging on the characteristics of TiNiPd shape memory alloy thin films. Mater. Charact. 2008, 59, 957–960. [Google Scholar] [CrossRef]
  20. Abbas, A.; Hung, H.-Y.; Lin, P.-C.; Yang, K.-C.; Chen, M.-C.; Lin, H.-C.; Han, Y.-Y. Atomic layer deposited TiO2 films on an equiatomic NiTi shape memory alloy for biomedical applications. J. Alloys Compd. 2021, 886, 161282. [Google Scholar] [CrossRef]
  21. Chu, C.; Chung, C.; Lin, P. DSC study of the effect of aging temperature on the reverse martensitic transformation in porous Ni-rich NiTi shape memory alloy fabricated by combustion synthesis. Mater. Lett. 2005, 59, 404–407. [Google Scholar] [CrossRef]
  22. Baradaran, S.; Basirun, W.; Zalnezhad, E.; Hamdi, M.; Sarhan, A.A.; Alias, Y. Fabrication and deformation behaviour of multilayer Al2O3/Ti/TiO2 nanotube arrays. J. Mech. Behav. Biomed. Mater. 2013, 20, 272–282. [Google Scholar] [CrossRef]
  23. Bose, S.; Roy, M.; Bandyopadhyay, A. Recent advances in bone tissue engineering scaffolds. Trends Biotechnol. 2012, 30, 546–554. [Google Scholar] [CrossRef] [Green Version]
  24. Zhang, H.; Marshall, C.L. Atomic layer deposition: Catalytic preparation and modification technique for the next generation. Chin. J. Catal. 2019, 40, 1311–1323. [Google Scholar] [CrossRef]
  25. Marin, E.; Guzman, L.; Lanzutti, A.; Ensinger, W.; Fedrizzi, L. Multilayer Al2O3/TiO2 Atomic Layer Deposition coatings for the corrosion protection of stainless steel. Thin Solid Films 2012, 522, 283–288. [Google Scholar] [CrossRef]
  26. Peron, M.; Cogo, S.; Bjelland, M.; Bin Afif, A.; Dadlani, A.; Greggio, E.; Berto, F.; Torgersen, J. On the evaluation of ALD TiO2, ZrO2 and HfO2 coatings on corrosion and cytotoxicity performances. J. Magnes. Alloy. 2021, 9, 1806–1819. [Google Scholar] [CrossRef]
  27. Xu, Z.; Zhang, Q.; Luo, L.; Liu, Y.; Wan, J. Microstructure and corrosion resistance of TiN/TiO2 nano-composite film on AZ31 magnesium alloy. Surf. Coat. Technol. 2020, 406, 126681. [Google Scholar] [CrossRef]
  28. Shahmohammadi, M.; Sun, Y.; Yuan, J.C.-C.; Mathew, M.T.; Sukotjo, C.; Takoudis, C.G. In vitro corrosion behavior of coated Ti6Al4V with TiO2, ZrO2, and TiO2/ZrO2 mixed nanofilms using atomic layer deposition for dental implants. Surf. Coat. Technol. 2022, 444, 128686. [Google Scholar] [CrossRef]
  29. Peron, M.; Bertolini, R.; Cogo, S. On the corrosion, stress corrosion and cytocompatibility performances of ALD TiO2 and ZrO2 coated magnesium alloys. J. Mech. Behav. Biomed. Mater. 2021, 125, 104945. [Google Scholar] [CrossRef]
  30. Fedel, M.; Deflorian, F. Electrochemical characterization of atomic layer deposited Al2O3 coatings on AISI 316L stainless steel. Electrochim. Acta 2016, 203, 404–415. [Google Scholar] [CrossRef]
  31. Díaz, B.; Światowska, J.; Maurice, V.; Seyeux, A.; Härkönen, E.; Ritala, M.; Tervakangas, S.; Kolehmainen, J.; Marcus, P. Tantalum oxide nanocoatings prepared by atomic layer and filtered cathodic arc deposition for corrosion protection of steel: Comparative surface and electrochemical analysis. Electrochim. Acta 2013, 90, 232–245. [Google Scholar] [CrossRef]
  32. Daubert, J.S.; Hill, G.T.; Gotsch, H.N.; Gremaud, A.P.; Ovental, J.S.; Williams, P.S.; Oldham, C.J.; Parsons, G.N. Corrosion Protection of Copper Using Al2O3, TiO2, ZnO, HfO2, and ZrO2 Atomic Layer Deposition. ACS Appl. Mater. Interfaces 2017, 9, 4192–4201. [Google Scholar] [CrossRef]
  33. Gao, Y.; Walsh, M.; Liang, X. Atomic layer deposited conformal ceramic coatings for anti-corrosion of Ag nanoparticles. Appl. Surf. Sci. 2020, 532, 147374. [Google Scholar] [CrossRef]
  34. Mondal, J.; Marques, A.; Aarik, L.; Kozlova, J.; Simões, A.; Sammelselg, V. Development of a thin ceramic-graphene nanolaminate coating for corrosion protection of stainless steel. Corros. Sci. 2016, 105, 161–169. [Google Scholar] [CrossRef]
  35. Díaz, B.; Światowska, J.; Maurice, V.; Seyeux, A.; Normand, B.; Härkönen, E.; Ritala, M.; Marcus, P. Electrochemical and time-of-flight secondary ion mass spectrometry analysis of ultra-thin metal oxide (Al2O3 and Ta2O5) coatings deposited by atomic layer deposition on stainless steel. Electrochim. Acta 2011, 56, 10516–10523. [Google Scholar] [CrossRef]
  36. Chai, Z.; Liu, Y.; Li, J.; Lu, X.; He, D. Ultra-thin Al2O3 films grown by atomic layer deposition for corrosion protection of copper. RSC Adv. 2014, 4, 50503–50509. [Google Scholar] [CrossRef]
  37. Behzadnasab, M.; Mirabedini, S.; Kabiri, K.; Jamali, S. Corrosion performance of epoxy coatings containing silane treated ZrO2 nanoparticles on mild steel in 3.5% NaCl solution. Corros. Sci. 2011, 53, 89–98. [Google Scholar] [CrossRef]
  38. Cai, Y.; Quan, X.; Li, G.; Gao, N. Anticorrosion and Scale Behaviors of Nanostructured ZrO2–TiO2 Coatings in Simulated Geothermal Water. Ind. Eng. Chem. Res. 2016, 55, 11480–11494. [Google Scholar] [CrossRef]
  39. Staišiūnas, L.; Kalinauskas, P.; Juzeliūnas, E.; Grigucevičienė, A.; Leinartas, K.; Niaura, G.; Stanionytė, S.; Selskis, A. Silicon Passivation by Ultrathin Hafnium Oxide Layer for Photoelectrochemical Applications. Front. Chem. 2022, 10, 859023. [Google Scholar] [CrossRef] [PubMed]
  40. Bodunrin, M.O.; Chown, L.H.; van der Merwe, J.W.; Alaneme, K.K.; Oganbule, C.; Klenam, D.E.; Mphasha, N.P. Corrosion behavior of titanium alloys in acidic and saline media: Role of alloy design, passivation integrity, and electrolyte modification. Corros. Rev. 2020, 38, 25–47. [Google Scholar] [CrossRef]
  41. Seethammaraju, S.; Rangarajan, M. Corrosion of stainless steels in acidic, neutral and alkaline saline media: Electrochemical and microscopic analysis. IOP Conf. Ser. Mater. Sci. Eng. 2019, 577, 012188. [Google Scholar] [CrossRef]
  42. Dinu, M.; Parau, A.C.; Vladescu, A.; Kiss, A.E.; Pana, I.; Mouele, E.S.M.; Petrik, L.F.; Braic, V. Corrosion Improvement of 304L Stainless Steel by ZrSiN and ZrSi(N,O) Mono- and Double-Layers Prepared by Reactive Cathodic Arc Evaporation. Coatings 2021, 11, 1257. [Google Scholar] [CrossRef]
  43. Bailey, R.; Sun, Y. Corrosion and Tribocorrosion Performance of Pack-Carburized Commercially Pure Titanium with Limited Oxygen Diffusion in a 0.9% NaCl Solution. J. Bio-Tribo-Corros. 2017, 4, 6. [Google Scholar] [CrossRef]
  44. Li, J.; Zhang, Q.; Chen, B.; Wang, L.; Zhu, R.; Yang, J. Hydrogen peroxide formation in water during the VUV/UV irradiation process: Impacts and mechanisms of selected anions. Environ. Res. 2021, 195, 110751. [Google Scholar] [CrossRef]
  45. Gorey, T.J.; Dai, Y.; Anderson, S.L.; Lee, S.; Lee, S.; Seifert, S.; Winans, R.E. Selective growth of Al2O3 on size-selected platinum clusters by atomic layer deposition. Surf. Sci. 2020, 691, 121485. [Google Scholar] [CrossRef]
  46. Liu, J.; Li, J.; Wu, J.; Sun, J. Structure and Dielectric Property of High-k ZrO2 Films Grown by Atomic Layer Deposition Using Tetrakis(Dimethylamido)Zirconium and Ozone. Nanoscale Res. Lett. 2019, 14, 154. [Google Scholar] [CrossRef] [Green Version]
  47. Gonta, C.J. Atomic Layer of Deposition of Ferroelectric HfO2. J. Microelectron. Eng. Conf. 2017, 23, 12. Available online: https://scholarworks.rit.edu/ritamec/vol23/iss1/12 (accessed on 30 December 2022).
  48. Jafari, A.; Alam, M.H.; Das-tan, D.; Ziakhodadadian, S.; Shi, Z.; Garmestani, H.; Weidenbach, A.S.; Ţălu, Ş. Statistical, morphological, and corrosion behavior of PECVD derived cobalt oxide thin films. J. Mater. Sci. Mater. Electron. 2019, 30, 21185–21198. [Google Scholar] [CrossRef]
  49. Stern, M.; Geary, A.L. Electrochemical Polarization I. A theoretical analysis of the shape of polarization curves. J. Electrochem. Soc. 1957, 104, 56–63. [Google Scholar] [CrossRef]
  50. Delabie, A.; Caymax, M.; Maes, J.W.; Bajolet, P.; Brijs, B.; Cartier, E.; Conard, T.; De Gendt, S.; Richard, O.; Vandervorst, W.; et al. ALD HfO2 surface preparation study. MRS Online Proc. Libr. 2002, 745, 511. [Google Scholar] [CrossRef]
  51. Lebeau, B.; Naboulsi, I.; Michelin, L.; Marichal, C.; Rigolet, S.; Carteret, C.; Brunet, S.; Bonne, M.; Blin, J.-L. Amorphous mesostructured zirconia with high (hydro)thermal stability. RSC Adv. 2020, 10, 26165–26176. [Google Scholar] [CrossRef]
  52. Zhang, X.-Y.; Hsu, C.-H.; Lien, S.-Y.; Wu, W.-Y.; Ou, S.-L.; Chen, S.-Y.; Huang, W.; Zhu, W.-Z.; Xiong, F.-B.; Zhang, S. Temperature-Dependent HfO2/Si Interface Structural Evolution and its Mechanism. Nanoscale Res. Lett. 2019, 14, 83. [Google Scholar] [CrossRef] [Green Version]
  53. Prokes, S.M.; Katz, M.B.; Twigg, M.E. Growth of crystalline Al2O3 via thermal atomic layer deposition: Nanomaterial phase stabilization. APL Mater. 2014, 2, 032105. [Google Scholar] [CrossRef]
  54. Miikkulainen, V.; Leskela, M.; Ritala, M.; Puurunen, R.L. Crystallinity of inorganic films grown by atomic layer deposition: Overview and general trends. J. Appl. Phys. 2013, 113, 021301. [Google Scholar] [CrossRef]
  55. Reclaru, L.; Eschler, P.-Y.; Lerf, R.; Blatter, A. Electrochemical corrosion and metal ion release from Co-Cr-Mo prosthesis with titanium plasma spray coating. Biomaterials 2005, 26, 4747–4756. [Google Scholar] [CrossRef] [PubMed]
  56. Rahmouni, K.; Keddam, M.; Srhiri, A.; Takenouti, H. Corrosion of copper in 3% NaCl solution polluted by sulphide ions. Corros. Sci. 2005, 47, 3249–3266. [Google Scholar] [CrossRef]
  57. Revie, R.W.; Uhlig, H.H. Corrosion and Corrosion Control—An Introduction to Corrosion Science and Engineering, 4th ed.; Wiley Interscience, A John Wiley & Sons, Inc., Publication: Hoboken, NJ, USA, 2008. [Google Scholar]
  58. Khoshnaw, F.; Gubner, R. Corrosion Atlas Case Studies, Part II: Corrosion Topics. In Corrosion Atlas Series, 2021 ed.; Elsevier: Amsterdam, The Netherlands, 2021; pp. xliii–lxviii. [Google Scholar] [CrossRef]
  59. Ramón, J.E.; Martínez, I.; Gandía-Romero, J.M.; Soto, J. Improved Tafel-Based Potentiostatic Approach for Corrosion Rate Monitoring of Reinforcing Steel. J. Nondestruct. Eval. 2022, 41, 70. [Google Scholar] [CrossRef]
  60. Mobtaker, H.; Azadi, M.; Rassouli, M. The corrosion inhibition of carbon steel in 1 M HCl solution by Oestrus ovis larvae extract as a new bio–inhibitor. Heliyon 2022, 8, e12297. [Google Scholar] [CrossRef]
  61. Li, T.; Hu, T.; Dai, L.; Li, C.M. Metal-free photo- and electro-catalysts for hydrogen evolution reaction. J. Mater. Chem. A 2020, 8, 23674–23698. [Google Scholar] [CrossRef]
  62. Boudalia, M.; Fernández-Domene, R.M.; Guo, L.; Echihi, S.; Belghiti, M.E.; Zarrouk, A.; Bellaouchou, A.; Guenbour, A.; García-Antón, J. Experimental and Theoretical Tests on the Corrosion Protection of Mild Steel in Hydrochloric Acid Environment by the Use of Pyrazole Derivative. Materials 2023, 16, 678. [Google Scholar] [CrossRef] [PubMed]
  63. Finšgar, M.; Jackson, J. Application of corrosion inhibitors for steels in acidic media for the oil and gas industry: A review. Corros. Sci. 2014, 86, 17–41. [Google Scholar] [CrossRef] [Green Version]
  64. Fouda, A.E.-A.S.; Al-Bonayan, A.M.; Eissa, M.; Eid, D.M. Electrochemical and quantum chemical studies on the corrosion inhibition of 1037 carbon steel by different types of surfactants. RSC Adv. 2022, 12, 3253–3273. [Google Scholar] [CrossRef] [PubMed]
  65. Baboian, R. Corrosion Tests and Standards: Application and Interpretation; ASTM Series; ASTM International: West Conshohocken, PA, USA, 2005. [Google Scholar]
  66. Kendall, M.G. Rank Correlation Methods, 2nd ed.; Charles Griffin & Co.: London, UK, 1955. [Google Scholar]
  67. Chang, Y.; Ducroquet, F.; Gautier, E.; Renault, O.; Legrand, J.; Damlencourt, J.; Martin, F. Surface preparation and post thermal treatment effects on interface properties of thin Al2O3 films deposited by ALD. Microelectron. Eng. 2004, 72, 326–331. [Google Scholar] [CrossRef]
  68. Gosset, L.; Damlencourt, J.-F.; Renault, O.; Rouchon, D.; Holliger, P.; Ermolieff, A.; Trimaille, I.; Ganem, J.-J.; Martin, F.; Séméria, M.-N. Interface and material characterization of thin Al2O3 layers deposited by ALD using TMA/H2O. J. Non-Cryst. Solids 2002, 303, 17–23. [Google Scholar] [CrossRef]
  69. Kania, A.; Szindler, M.M.; Szindler, M. Structure and Corrosion Behavior of TiO2 Thin Films Deposited by ALD on a Biomedical Magnesium Alloy. Coatings 2021, 11, 70. [Google Scholar] [CrossRef]
Figure 1. Setup for the cathodic arc deposition.
Materials 16 02007 g001
Figure 2. SEM micrographs and composition (EDS) of SS/Ti(N,O) layer.
Materials 16 02007 g002
Figure 3. SEM micrographs and composition (EDS) of Al2O3 layer coated with (a) 40 cycles and (b) 80 cycles, 1000× magnification.
Materials 16 02007 g003
Figure 4. SEM micrographs and composition (EDS) of ZrO2 layer coated with (a) 45 cycles and (b) 90 cycles, 1000× magnification.
Materials 16 02007 g004aMaterials 16 02007 g004b
Figure 5. SEM micrographs and composition (EDS) of HfO2 layer coated with (a) 55 cycles and (b) 110 cycles, 1000× magnification.
Materials 16 02007 g005
Figure 6. Diffractograms of the 304 L support (SS), the Ti(N,O) coating, and ALD-deposited thin films.
Materials 16 02007 g006
Figure 7. Ra roughness parameter of the samples: (a) before and (b) after the corrosion tests.
Materials 16 02007 g007
Figure 8. Rq roughness parameter of the samples: (a) before and (b) after the corrosion tests.
Materials 16 02007 g008
Figure 9. Sk roughness parameter of the samples: (a) before and (b) after the corrosion tests.
Materials 16 02007 g009
Figure 10. SS/Ti(N,O). Scanned lines obtained by Dektak: (a) before and (b) after the corrosion test. (c) Surface morphology (SEM) and (d) elemental composition (EDS) after the corrosion test, magnification 1000×.
Materials 16 02007 g010
Figure 11. SS/Ti(N,O)/Al2O3-40c. Scanned lines obtained by Dektak: (a) before and (b) after the corrosion test. (c) Surface morphology (SEM) and (d) elemental composition (EDS) after the corrosion test, magnification 1000×.
Materials 16 02007 g011aMaterials 16 02007 g011b
Figure 12. SS/Ti(N,O)/Al2O3-80c. Scanned lines obtained by Dektak: (a) before and (b) after the corrosion test. (c) Surface morphology (SEM) and (d) elemental composition (EDS) after the corrosion test, magnification 1000×.
Materials 16 02007 g012
Figure 13. SS/Ti(N,O)/ZrO2-45c. Scanned lines obtained by Dektak: (a) before and (b) after the corrosion test. (c) Surface morphology (SEM) and (d) elemental composition (EDS) after the corrosion test, magnification 1000×.
Materials 16 02007 g013
Figure 14. SS/Ti(N,O)/ZrO2-90c. Scanned lines obtained by Dektak: (a) before and (b) after the corrosion test. (c) Surface morphology (SEM) and (d) elemental composition (EDS) after the corrosion test, magnification 1000×.
Materials 16 02007 g014aMaterials 16 02007 g014b
Figure 15. SS/Ti(N,O)/HfO2-55c. Scanned lines obtained by Dektak: (a) before and (b) after the corrosion test. (c) Surface morphology (SEM) and (d) elemental composition (EDS) after the corrosion test, magnification 1000×.
Materials 16 02007 g015
Figure 16. SS/Ti(N,O)/HfO2-110c. Scanned lines obtained by Dektak: (a) before and (b) after the corrosion test. (c) Surface morphology (SEM) and (d) elemental composition (EDS) after the corrosion test, magnification 1000×.
Materials 16 02007 g016
Figure 17. (a) Time evolution of Eoc; Tafel plots of oxides deposited on SS/Ti(N,O): (b) Al2O3, (c) ZrO2, and (d) HfO2.
Materials 16 02007 g017
Table 1. Elemental composition of the investigated specimens.
SampleAl (at.%)Zr (at.%)Hf (at.%)O (at.%)Ti (at.%)N (at.%)Fe (at.%)
SS/Ti(N,O)---8.95 ± 0.5352.60 ± 2.2847.58 ± 1.720.87 ± 0.07
SS/Ti(N,O)-Al2O3-40c1.802 ± 0.106 28.13 ± 1.7241.61 ± 2.0927.36 ± 1.441.09 ± 0.09
SS/Ti(N,O)-Al2O3-80c2.887 ± 0.165 37.29 ± 2.4337.11 ± 2.2521.82 ± 1.250.89 ± 0.082
SS/Ti(N,O)-ZrO2-45c 0.710 ± 0.102 23.18 ± 1.2848.06 ± 2.1426.77 ± 1.261.288 ± 0.09
SS/Ti(N,O)-ZrO2-90c 1.832 ± 0.230 37.70 ± 2.1044.28 ± 2.4915.05 ± 0.751.14 ± 0.09
SS/Ti(N,O)-HfO2-55c 0.006 ± 0.0018.05 ± 0.4950.85 ± 2.1839.70 ± 1.801.40 ± 0.10
SS/Ti(N,O)-HfO2-110c 0.540 ± 0.12717.06 ± 1.0147.99 ± 2.1733.06 ± 1.601.36 ± 0.10
Table 2. Corrosion parameters (open circuit potential—Eoc, corrosion potential—Ecorr, corrosion current density—icorr, polarisation resistance—Rp).
SampleEoc (mV)Ecorr (mV)icorr (nA/cm2)βc (mV)βa (mV)Rp (kΩ)
SS61421362182.9867.7516
SS/Ti(N,O)230345174144.961132.523173
SS/Ti(N,O)-Al2O3-40c19017112.62405095627
SS/Ti(N,O)-Al2O3-80c2812710.514228782,646
SS/Ti(N,O)-ZrO2-45c20215210.32206136846
SS/Ti(N,O)-ZrO2-90c3483114.523165416,503
SS/Ti(N,O)-HfO2-55c8348434418542813
SS/Ti(N,O)-HfO2-110c1572317.71271303627
Table 3. Kendall ranks attributed to the coated samples according to three corrosion parameters: corrosion potential—Ecorr, corrosion current density—icorr, polarisation resistance—Rp.
SampleRank-EcorrRank-icorrRank-RpΣRanksOverall Rank
SS777216
SS/Ti(N,O)166134
SS/Ti(N,O)-Al2O3-40c554145
SS/Ti(N,O)-Al2O3-80c31151
SS/Ti(N,O)-ZrO2-45c64313 4
SS/Ti(N,O)-ZrO2-90c22262
SS/Ti(N,O)-HfO2-55c88824 7
SS/Ti(N,O)-HfO2-110c435123
Disclaimer/Publisher’s Note: The statements, opinions and data contained in all publications are solely those of the individual author(s) and contributor(s) and not of MDPI and/or the editor(s). MDPI and/or the editor(s) disclaim responsibility for any injury to people or property resulting from any ideas, methods, instructions or products referred to in the content.

