Article

Phase Equilibria, Thermodynamics and Solidified Microstructure in the Copper–Zirconium–Yttrium System

1
State Key Laboratory of Powder Metallurgy, Central South University, Changsha 410083, China
2
School of Materials Science and Engineering, Anhui University of Science and Technology, Huainan 232001, China
3
School of Material Science and Engineering, Nanjing Institute of Technology, Nanjing 211167, China
*
Authors to whom correspondence should be addressed.
Materials 2023, 16(5), 2063; https://doi.org/10.3390/ma16052063
Submission received: 6 January 2023 / Revised: 18 February 2023 / Accepted: 23 February 2023 / Published: 2 March 2023

Abstract

:
A copper alloy with the addition of zirconium and yttrium is an attractive high strength and high conductivity (HSHC) copper alloy. The study of the solidified microstructure, thermodynamics and phase equilibria in the ternary Cu–Zr–Y system is expected to provide new insight into designing an HSHC copper alloy. In this work, the solidified and equilibrium microstructure and phase transition temperatures in the Cu–Zr–Y ternary system were studied by X-ray diffraction (XRD), electron probe microanalysis (EPMA) and differential scanning calorimeter (DSC). The isothermal section at 973 K was experimentally constructed. No ternary compound was found, while the Cu6Y, Cu4Y, Cu7Y2, Cu5Zr, Cu51Zr14 and CuZr phases substantially extended into the ternary system. According to the experimental phase diagram data from the present work and the literature, the Cu–Zr–Y ternary system was assessed using the CALPHAD (CALculation of PHAse diagrams) method. The isothermal sections, vertical section and liquidus projection calculated by the present thermodynamic description agree well with the experimental results. This study not only establishes a thermodynamic description of the Cu–Zr–Y system, but also contributes to the design of a copper alloy with the required microstructure.

Graphical Abstract

1. Introduction

Copper alloy has excellent electrical and thermal conductivity, good ductility and moderate strength. It is widely used in new energy, electrical and electronics, rail transit and so on [1,2,3]. With the continuous iterative development of products, the requirements for the properties of copper alloy are gradually increasing [4,5,6,7,8]. The high strength and high conductivity (HSHC) copper alloy is drawing growing interest. The influence of zirconium (Zr) on the properties of copper alloy has been systematically studied by many researchers [9,10,11]. Peng et al. [9] studied phase transition for the Cu-0.12 wt.% Zr alloy in the course of aging at 723 K and concluded that the Cu5Zr precipitation contributes to the strength. Du et al. [10] investigated the Zr-containing precipitate evolution of the copper–chromium–zirconium alloy and noted that the yield strength was mainly influenced by the Cu5Zr phase, Cr-rich precipitation and Zr-rich atomic clusters. To further improve the performance of copper alloy, more and more studies [12,13,14,15,16] have been conducted on the microstructure and properties influenced by the rare earth elements added to copper alloy. The properties for the copper–zirconium–yttrium alloy after cold-rolling and aging were studied systematically by Gao et al. [12] using selected area electron diffraction (SAED) and transmission electron microscopy (TEM), and they concluded that second-phase precipitation can be promoted by adding yttrium (Y). Wang et al. [15] noted that the addition of Y into a Cu–Cr alloy will inhibit the growth of Cr precipitation and decrease the dislocation density, thus increasing the ultimate tensile strength and hardness after cold-rolling and aging. As depicted above, the addition of Zr and Y can promote strength during aging in copper alloy, and Cu–Zr–Y alloy is a key system for potential HSHC copper alloy. The aging process is driven by thermodynamics and knowledge of phase equilibrium and thermodynamics is essential to design compositions and optimize the aging process [17]. Therefore, obtaining an accurate thermodynamic description for the Cu–Zr–Y ternary system is expected to provide new insight into designing an HSHC copper alloy.
Thus far, only two studies on the phase equilibria of the Cu–Zr–Y system have been reported. He et al. [18] first determined the partial isothermal section at 978 K by an electron probe microanalysis (EPMA) technique applied to diffusion couples and extrapolated the ternary isothermal section according to the thermodynamic parameters of three binary systems. No ternary compound was found, and the solubilities of Y in the Cu–Zr system and those of Zr in the Cu–Y system were not considered. The crack in the diffusion-triple affected the results and eight three-phase regions were estimated in the Cu–Zr–Y system by alloy-sampling and diffusion-triple. He et al. [18] noted that measuring three-phase equilibrium was difficult due to electron scattering effects and the presence of a lot of small phase regions around the tri-junction points. Myronenko et al. [19] studied the isothermal section of the Cu–Zr–Y system at 870 K by the alloy annealed at 870 k for 720 h with X-ray diffraction (XRD) and microstructural analysis. The solubility of Y in the Cu51Zr14 phase was surprisingly high compared to Cu51Zr2.3Y11.7, but no detailed experimental data were provided. The solubilities of Y in the Cu–Zr system and those of Zr in the Cu–Y system are still not clearly characterized.
Further experimental studies for the Cu–Zr–Y system are therefore warranted to provide basic information for the thermodynamic description. The purposes of this work are (1) to experimentally investigate the solidification and equilibrium microstructure and phase transition temperatures in the Cu–Zr–Y system; (2) to evaluate experimental data from the present work and literature to optimize thermodynamic parameters; and (3) to calculate the phase diagram and perform the Scheil solidification simulations.

2. Experimental Procedure

The purities of the elements used were Cu-99.99 wt.%, Zr-99.95 wt.% and Y-99.99 wt.%. The alloys were prepared in an arc furnace (WKDHL-1, Opto-electronics Co. Ltd., Beijing, China) with a water-cooled copper crucible in a highly pure argon environment. The alloys were flipped and remelted at least four times to ensure uniformity. The weight of each sample was usually between 4–6 g. The weight loss of every alloy was lower than 2.5%. The real overall composition of the alloys was determined through inductively coupled plasma-optical emission spectrometry (ICP-OES, Thermo Fisher Scientific Inc., Waltham, MA, USA). Each alloy was cut into two parts using wire electrical discharge machining (EDM). One part was analyzed as an as-cast alloy. The other part was encapsulated in a vacuum quartz pipe. A total of 12 samples were melted and numbered sequentially as A1–A12, and their compositions are listed in Table 1. Alloys A1–A8 were annealed at 973 K for 40 days, then water quenched. Alloys A9–A12 were annealed at 1073 K for 40 h, and then annealed at 973 K for 30 days and finally water quenched. XRD (Bruker-AXS D8) and EPMA with wavelength dispersive X-ray spectroscopy (WDX) (JXA-8230, JEOL, Japan) were then used to determine the microstructure and components of these alloys. Afterwards, differential scanning calorimeter (DSC, Netzsch, Germany) measurements of the phase change temperatures of the annealed alloys were performed. The DSC device was performed in an Al2O3 crucible under a continuous flow of argon (99.998 wt.% purity) with a heating rate of 5 K/min from 303 K to 1323 K. The temperatures for the invariant reactions and liquidus were defined by the initial and peak temperatures, respectively.

3. Thermodynamic Models

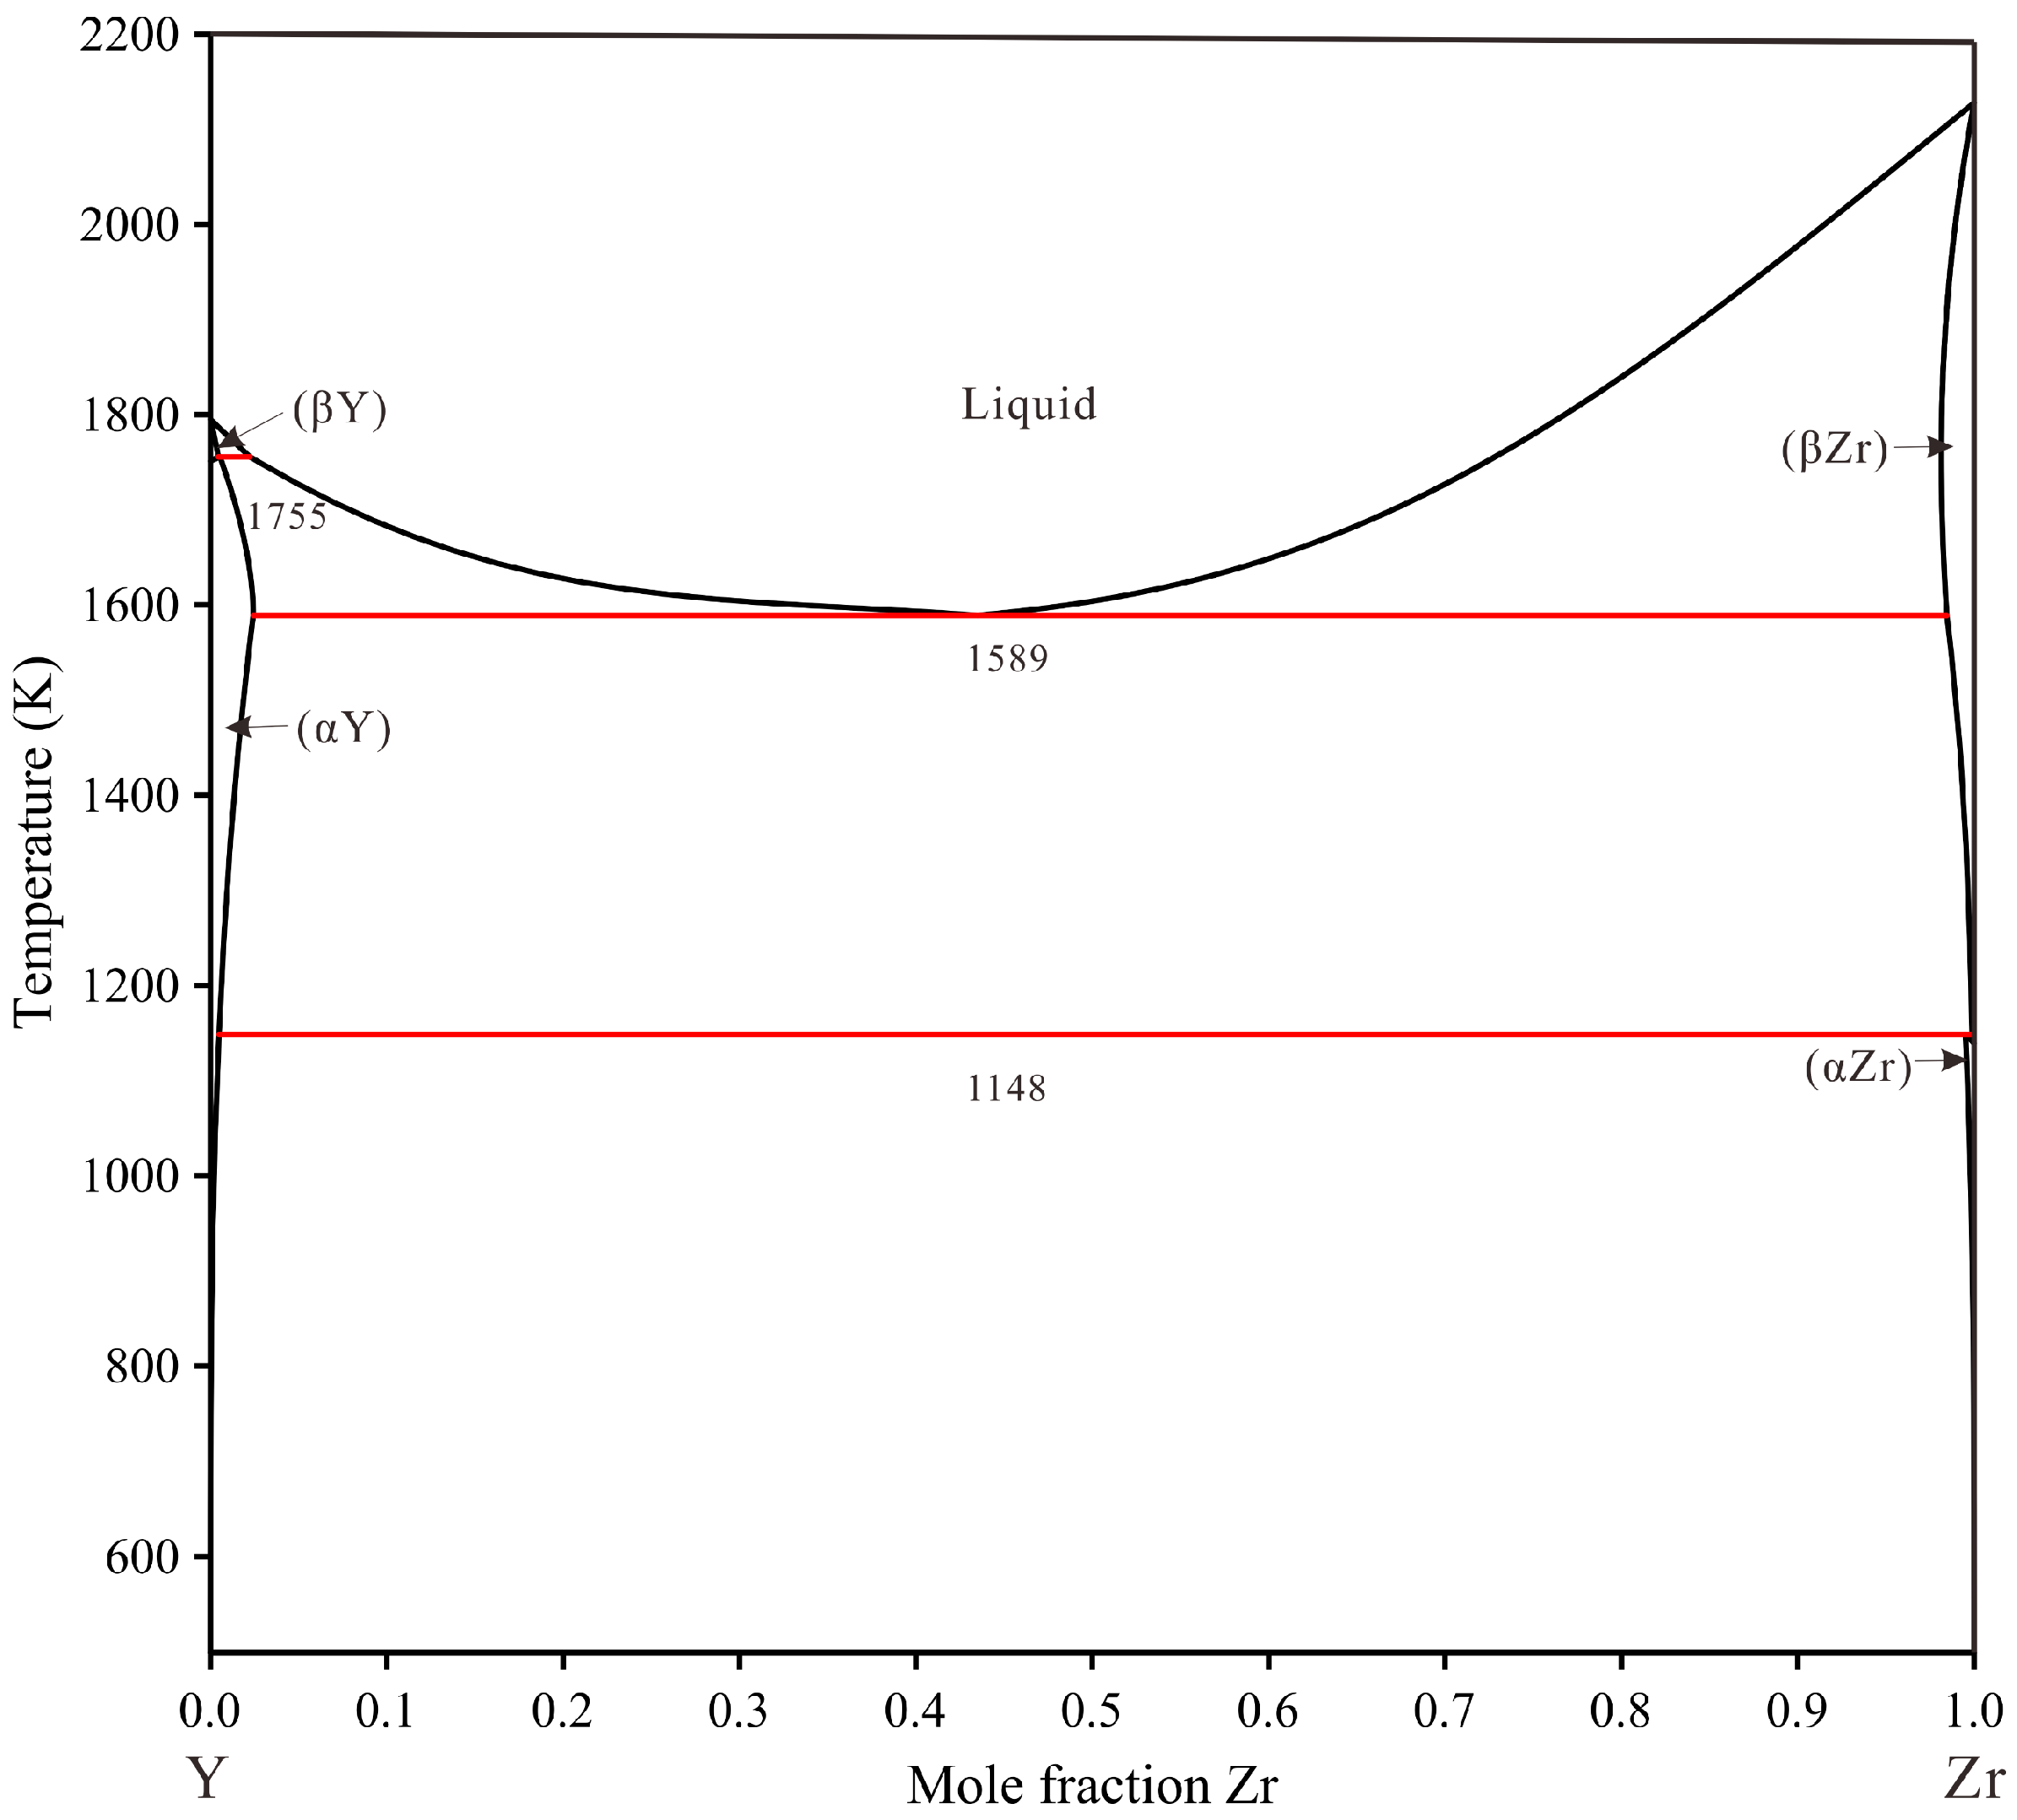
The phase diagram of the Cu–Y system was minutely adjusted in the present work based on the work of Fries et al. [20]. The phase diagrams of the Cu–Zr system by Liu et al. [21] and the Zr–Y system by Bu et al. [22] are accepted in this work due to the consistency of the thermodynamic databases of copper alloy [23,24,25,26]. The crystallographic data for stable phases in the Cu–Zr–Y system are shown in Table S1 [20,27,28,29,30,31,32,33,34,35] in the supporting information. The calculated binary sub-systems phase diagrams are shown in Figure 1, Figure 2 and Figure 3.

3.1. Pure Elements

The Gibbs energy function for the pure element i ( i = Cu ,   Zr   and   Y ) is taken from the Scientific Group Thermodata Europe (SGTE) by Dinsdale [36] and described in the form of:
G i ( T ) H i S E R = a + b T + c T · ln T + d T 2 + e T 1 + f T 3 + i T 7 + j T 9
where H i S E R means the mole enthalpy of element i relative to the stable element reference (SER) at 298.15 K and 1 bar, and T is the absolute temperature in Kelvin.

3.2. The Solution Phases

In the Cu–Y and Cu–Zr–Y systems, (Cu) is the fcc phase, (αZr) and (αY) are the hcp phases (βZr) and (βY) are the bcc phases. The liquid, fcc, hcp and bcc phases serve as a substitutional solution model. The molar Gibbs free energy of the solution phase is described as follows:
G φ 0 H S E R = i x i G i φ 0 + R T i x i ln ( x i ) + G m φ e x
where x i is the mole fraction of element i ( i = Cu ,   Zr   and   Y ); G i φ 0 denotes the molar Gibbs energy of component i in the state phase φ ; and R represents the gas constant. G m φ e x represents the excess Gibbs energy, which is described by the Redlich–Kister (R–K) [37] polynomial. In the Cu–Zr–Y system, G m φ e x is represented as follows.
G m φ e x = x C u x Y m = 0 ,   1 L C u , Y φ m ( x C u x Y ) m + x C u x Z r m = 0 ,   1 L C u , Y φ m ( x C u x Z r ) m + x Y x Z r m = 0 ,   1 L Y , Z r φ m ( x Y x Z r ) m + x C u x Y x Z r L C u , Y , Z r φ
where L i , j φ m is the m th binary interaction parameter, which can be shown by:
L i , j φ m = a m + b m T
where L C u , Y , Z r φ is ternary interaction parameter, which can be shown by:
L C u , Y , Z r φ = x C u L C u , Y , Z r φ 0 + x Y L C u , Y , Z r φ 1 + x Z r L C u , Y , Z r φ 2
The interaction parameters were optimized in this work based on the available experimental data.

3.3. Intermetallic Compounds

There are 11 intermetallic compounds in the system. The Cu2Y, CuY, Cu8Zr3, Cu10Zr7 and CuZr2 phases with ignorable homogeneity are considered as stoichiometric compounds according to the literature and current experimental data, whose Gibbs energy description is given as follows:
G A m B n = m G A H S E R 0 + n G B H S E R 0 + a + b T
where m and n stand for the ratios of stoichiometry and G A H S E R 0 and G B H S E R 0 represent the molar Gibbs energy referring to the SER states of A and B , respectively.
The Cu4Y, Cu6Y, Cu7Y2, Cu5Zr, Cu51Zr14 and CuZr phases with solubilities of a third element were described by a two-sublattice model. Take a phase φ modeled as ( A ,   B ) p ( A ,   C ) q for example. The molar Gibbs energy formula is given as Equation (7):
G m φ = y A y A G A : A φ + y A y C G A : C φ + y B y A G B : A φ + y B y C G B : C φ + R T [ p ( y A ln y A + y B ln y B ) + q ( y A ln y A + y C ln y C ) + y A y B ( y A i L A , B : A φ i ( y A y B ) i + y C i L A , B : C φ i ( y A y B ) i ) + y A y C ( y A i L A : A , C φ i ( y A y C ) i + y B i L B : A , C φ i ( y A y C ) i )
where y A and y A are the fraction of the constituent A in the first and second sublattice, respectively. L i represents the i th optimized interaction parameter in this work.

4. Results and Discussion

4.1. Microstructure and Phase Transition Temperatures Analysis

In this work, twelve alloys were prepared to determine the primary phase and phase equilibria of the Cu–Zr–Y system at 973 K. Table 1 summarizes the results measured by EPMA and XRD, including the primary phase and solidification paths of the as-cast alloy, as well as the equilibria phases of the annealed alloy. In this work, eight primary phases, i.e., (αY), (αZr), CuZr2, Cu51Zr14, Cu5Zr, CuY, Cu7Y2 and Cu6Y, were found. The representative alloys are discussed in detail below. Table 2 lists the temperatures of the invariant reactions and liquidus measured by DSC.

4.1.1. Microstructure of Solidification

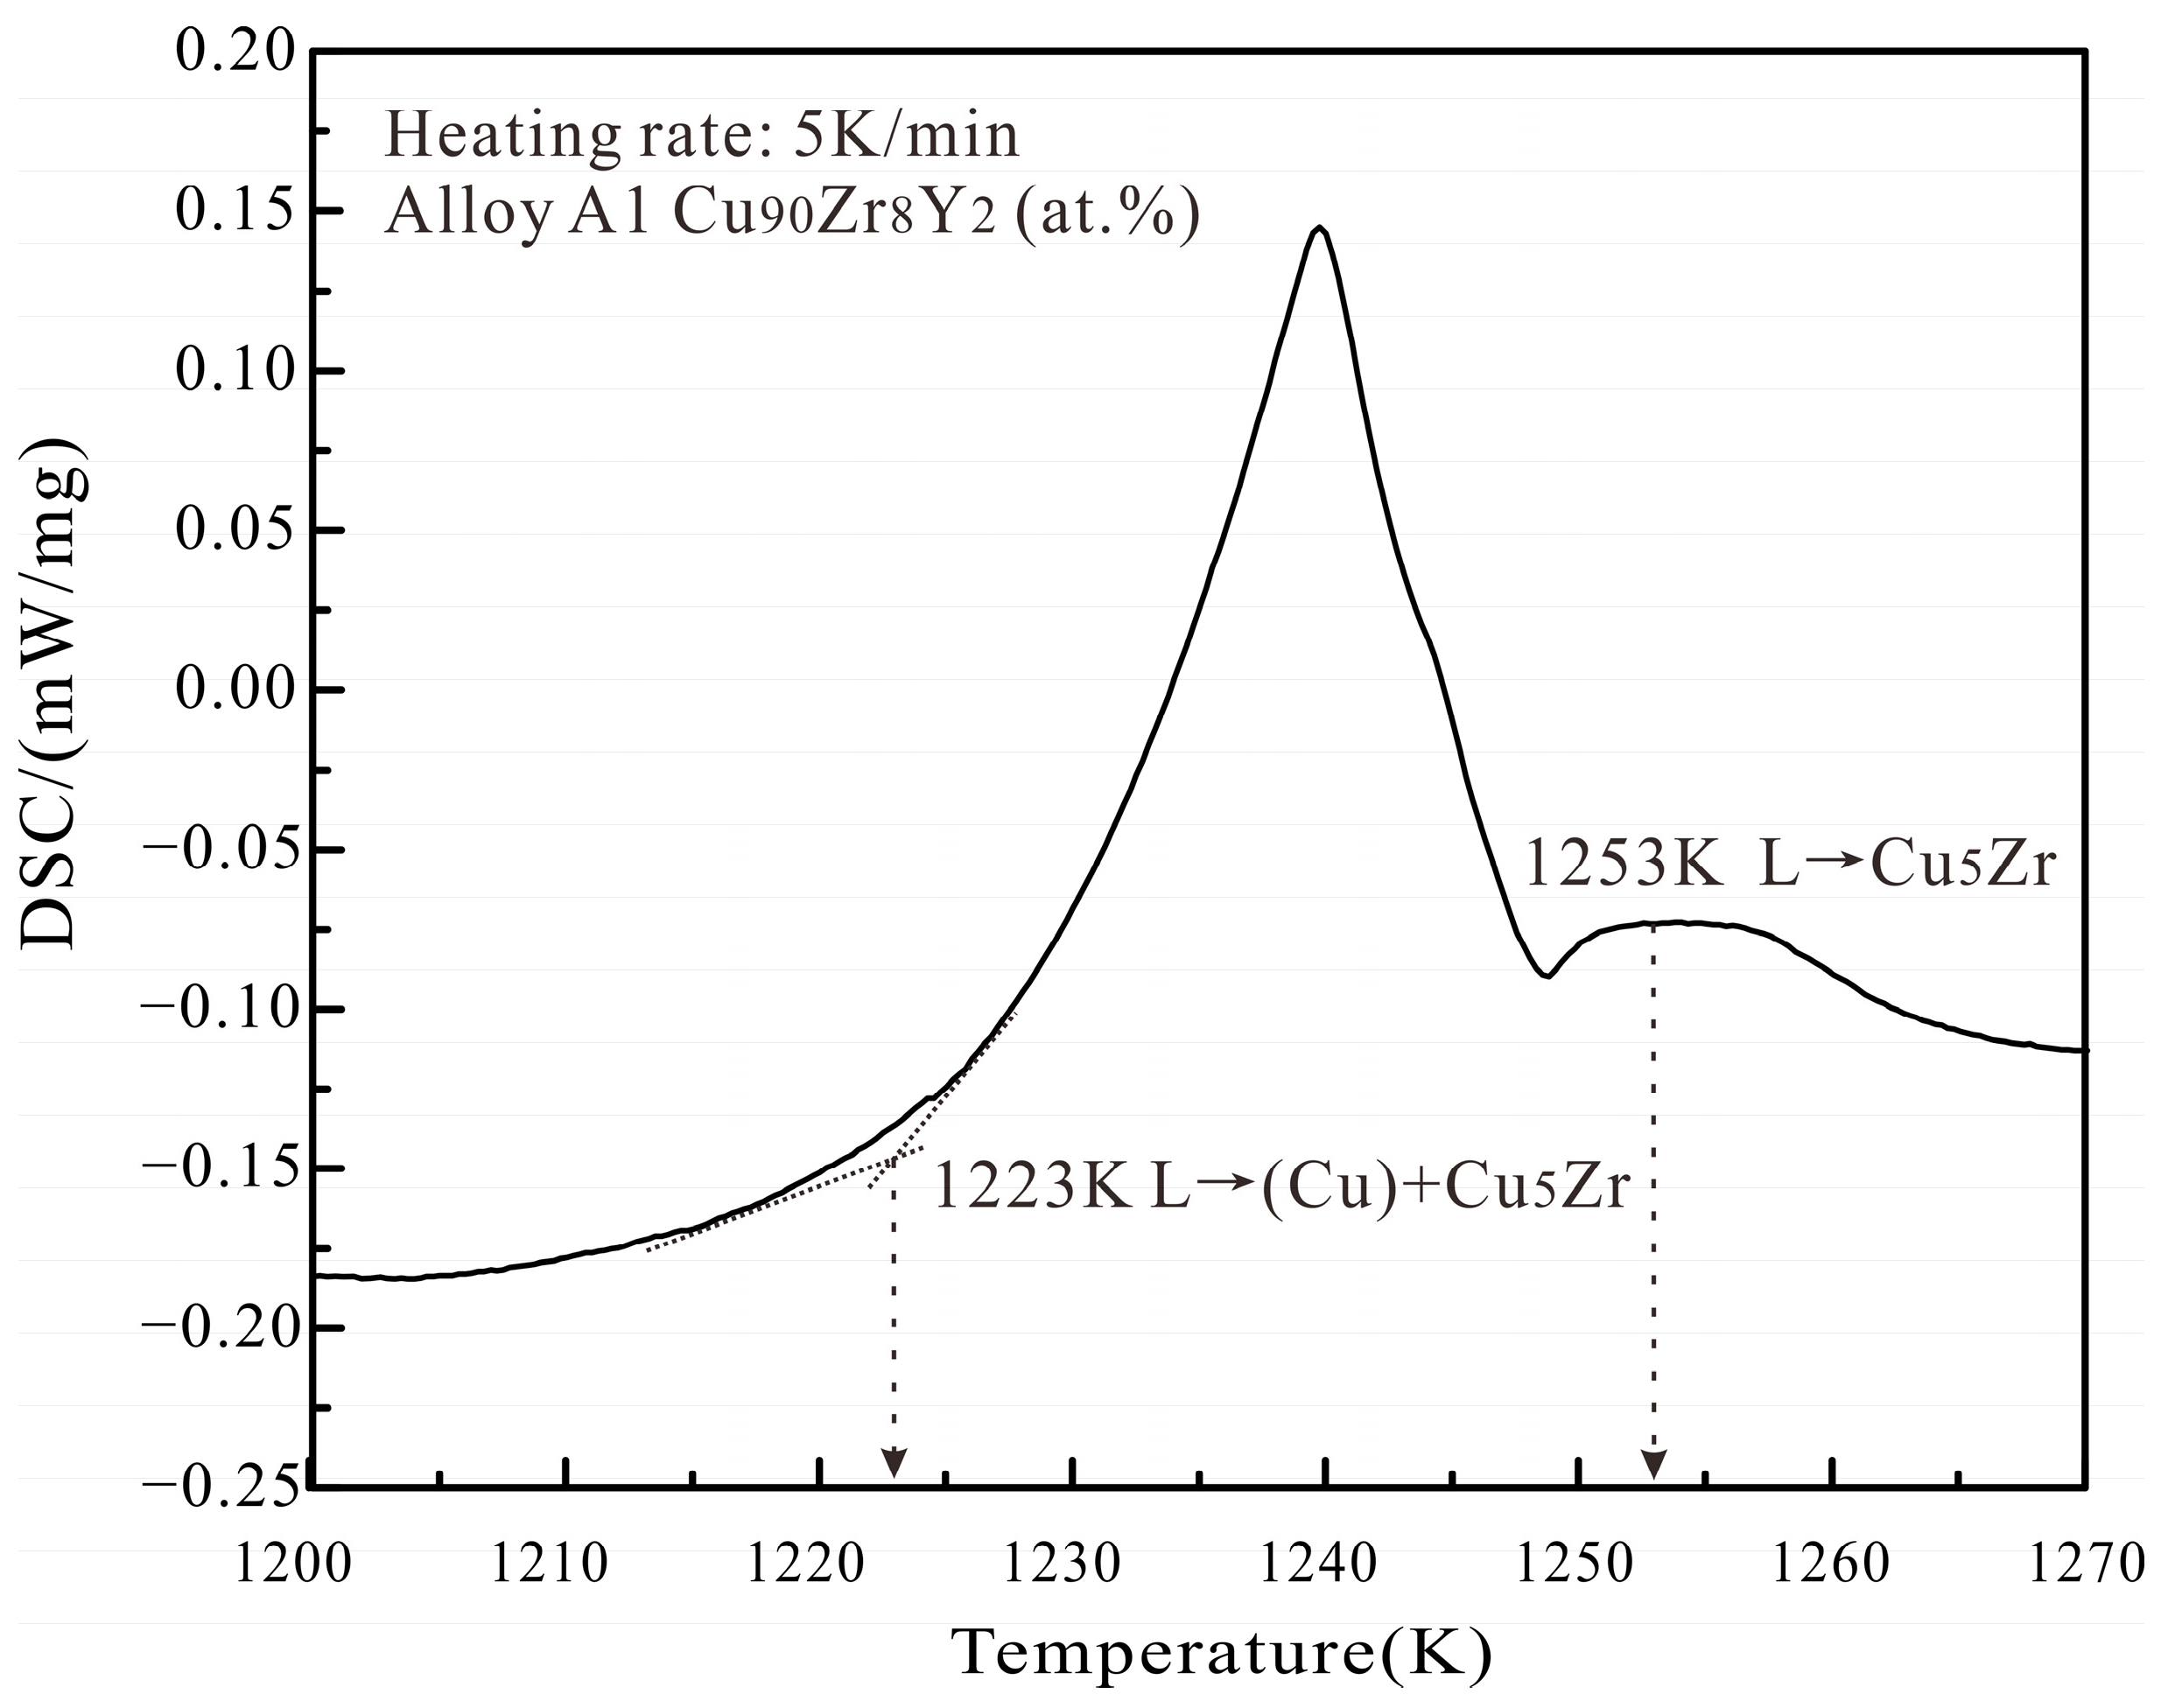
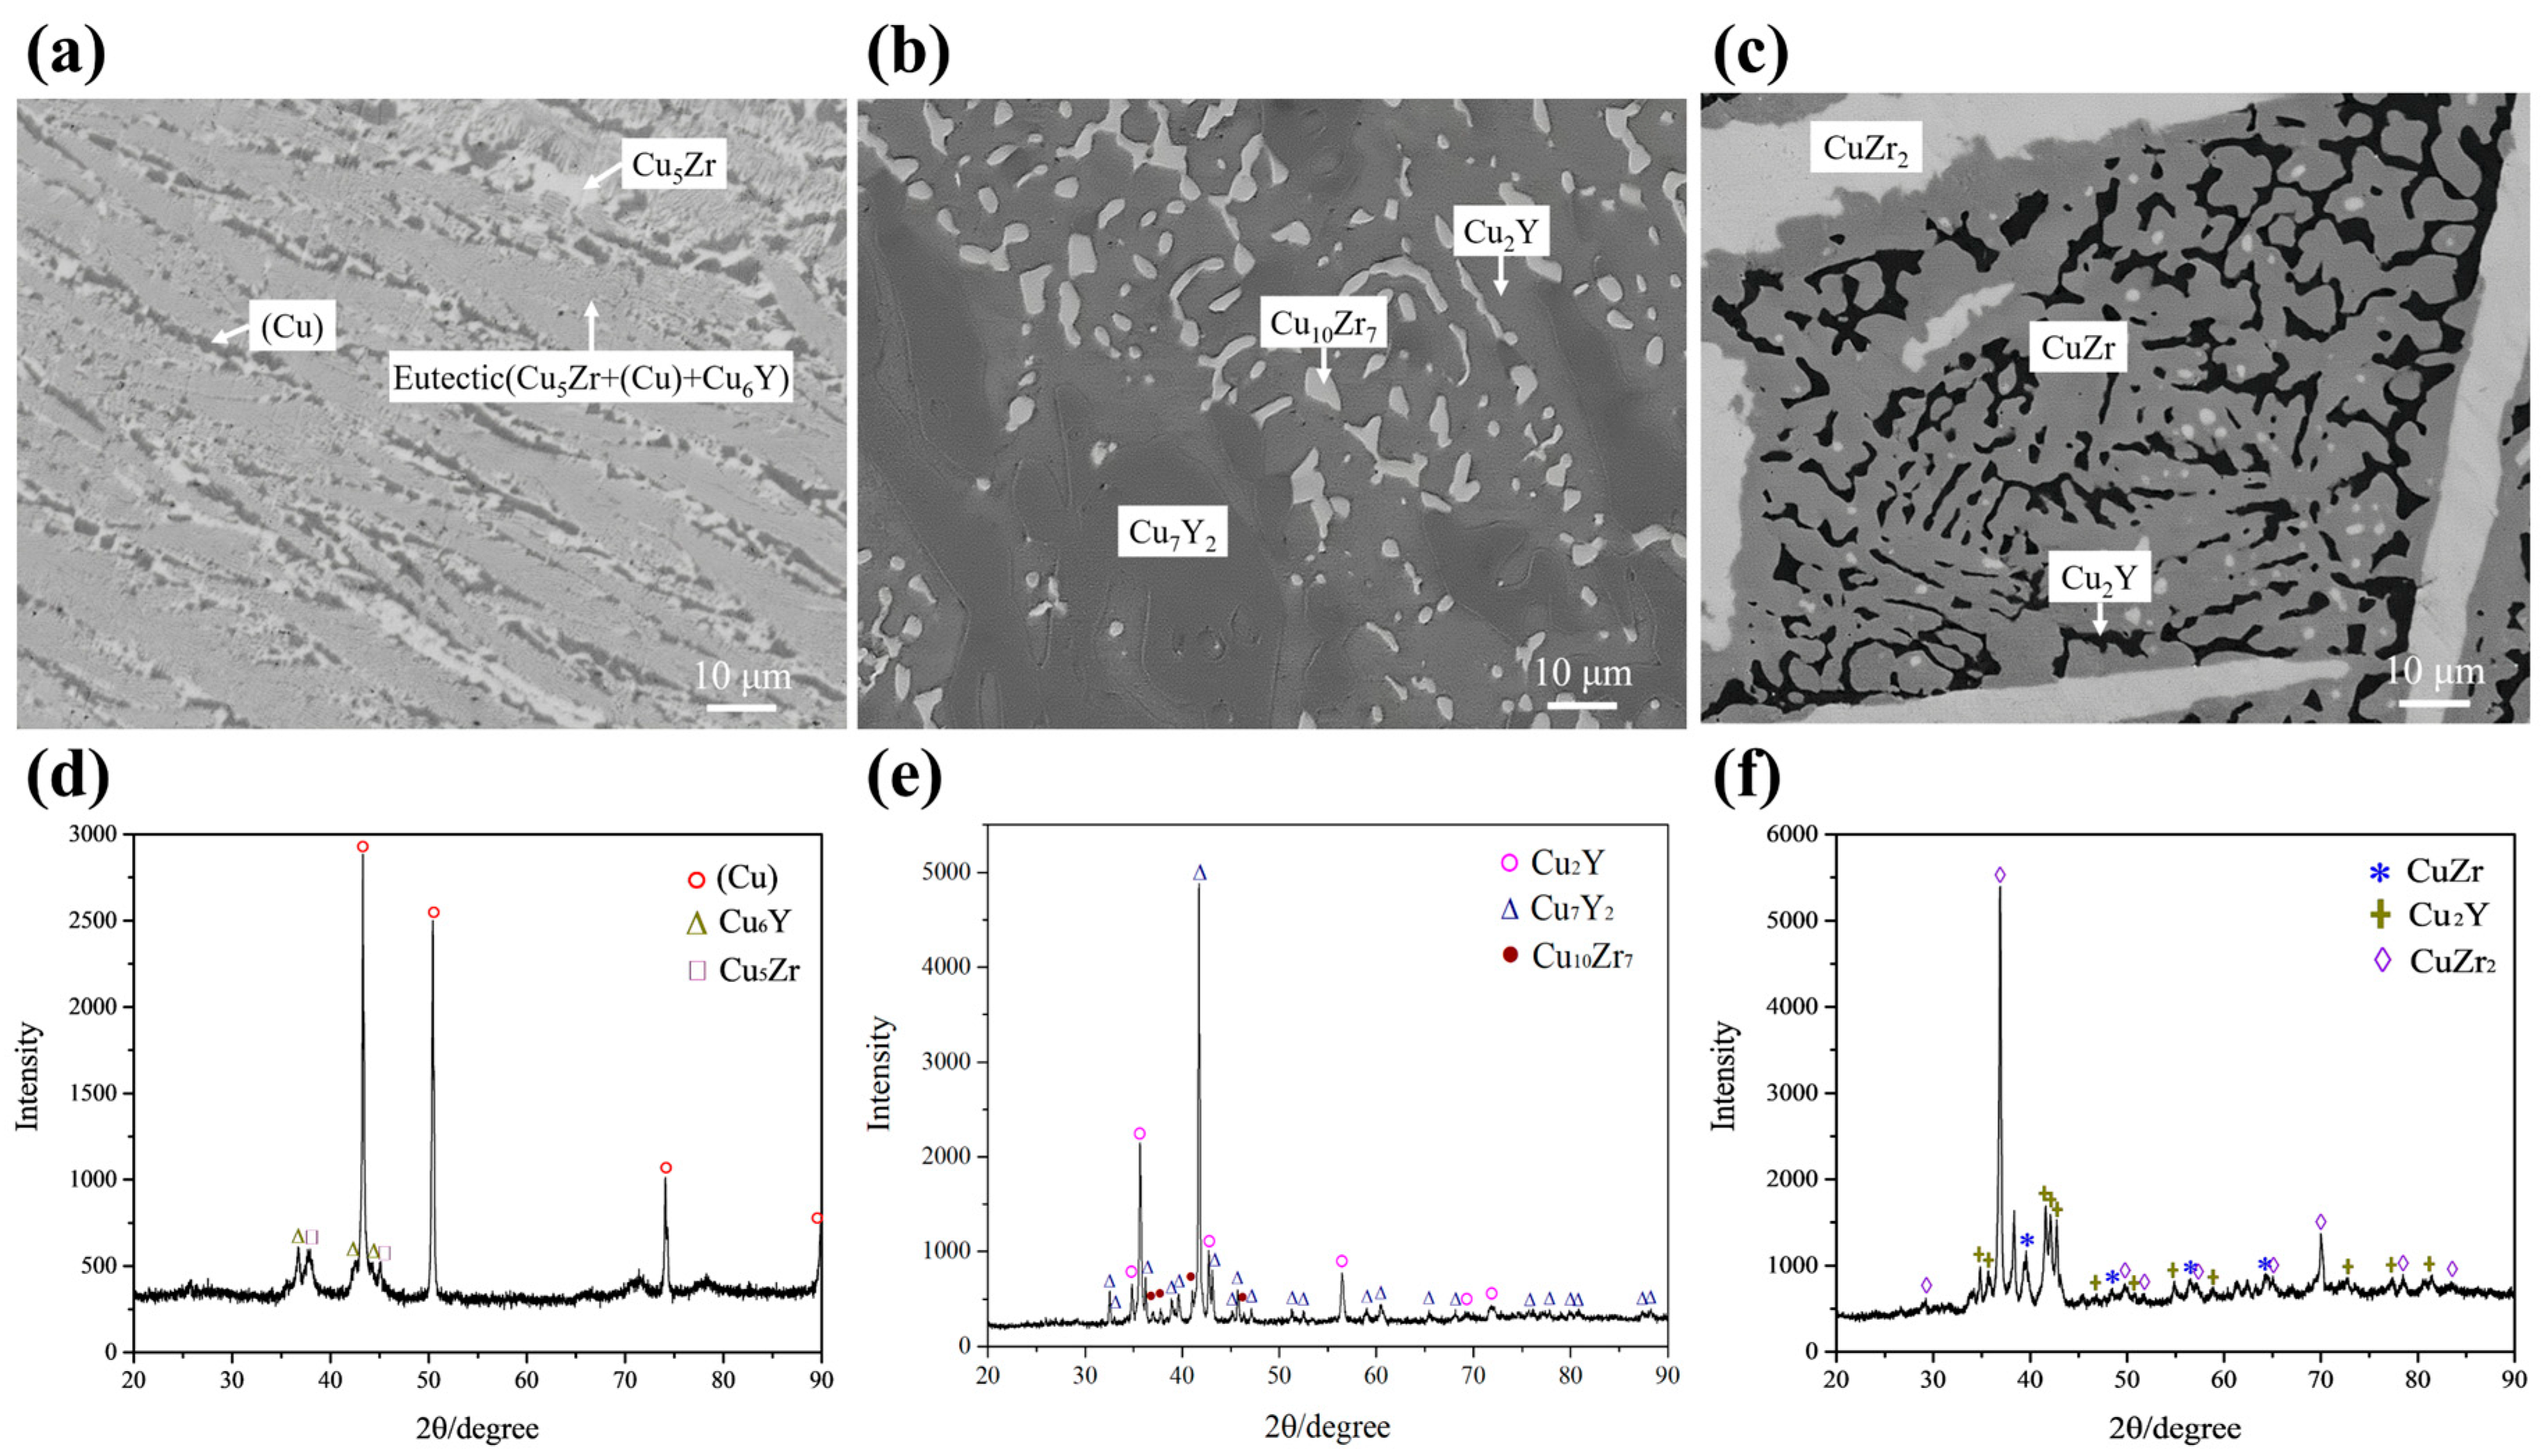
Figure 4a,d presents the back-scattered electron (BSE) micrograph and XRD pattern of the as-cast alloy A1 Cu90Zr8Y2 (at.%). The primary phase in the images is shown in bold. The analysis shows that the gray phase of Cu5Zr is the primary phase, and there are a lot of eutectic structures around it. During the arc-melting process, the side close to the copper crucible cools faster and the solidified microstructure is coarser, while the microstructure further away from crucible is finer. As shown in Figure 4a, the microstructure on the right is coarser than that on the left side. The coarser and finer microstructures in one alloy were also found in our previous Ag–Cr–Zr alloy [24]. Combined with the XRD results, the eutectic structure should be composed of (Cu) + Cu5Zr + Cu6Y. It can be postulated that the Cu5Zr phase solidifies first during the solidification process. Then the liquidus transformation component point soon contacts L → (Cu) + Cu5Zr eutectic reaction. Finally, the eutectic equilibrium reaction of L → (Cu) + Cu5Zr + Cu6Y occurs quickly, therefore a large number of eutectic structures are formed. Figure 5 shows a representative DSC curve for the A1 alloy with a heating rate of 5K/min. There are two visible peaks on this curve. Combined with the previous solidification analysis, the onset temperature of 1123 K of the first peak corresponds to the reaction of L → (Cu) + Cu5Zr. The peak temperature of 1153 K of the second peak corresponds to the liquidus temperature of the alloy.
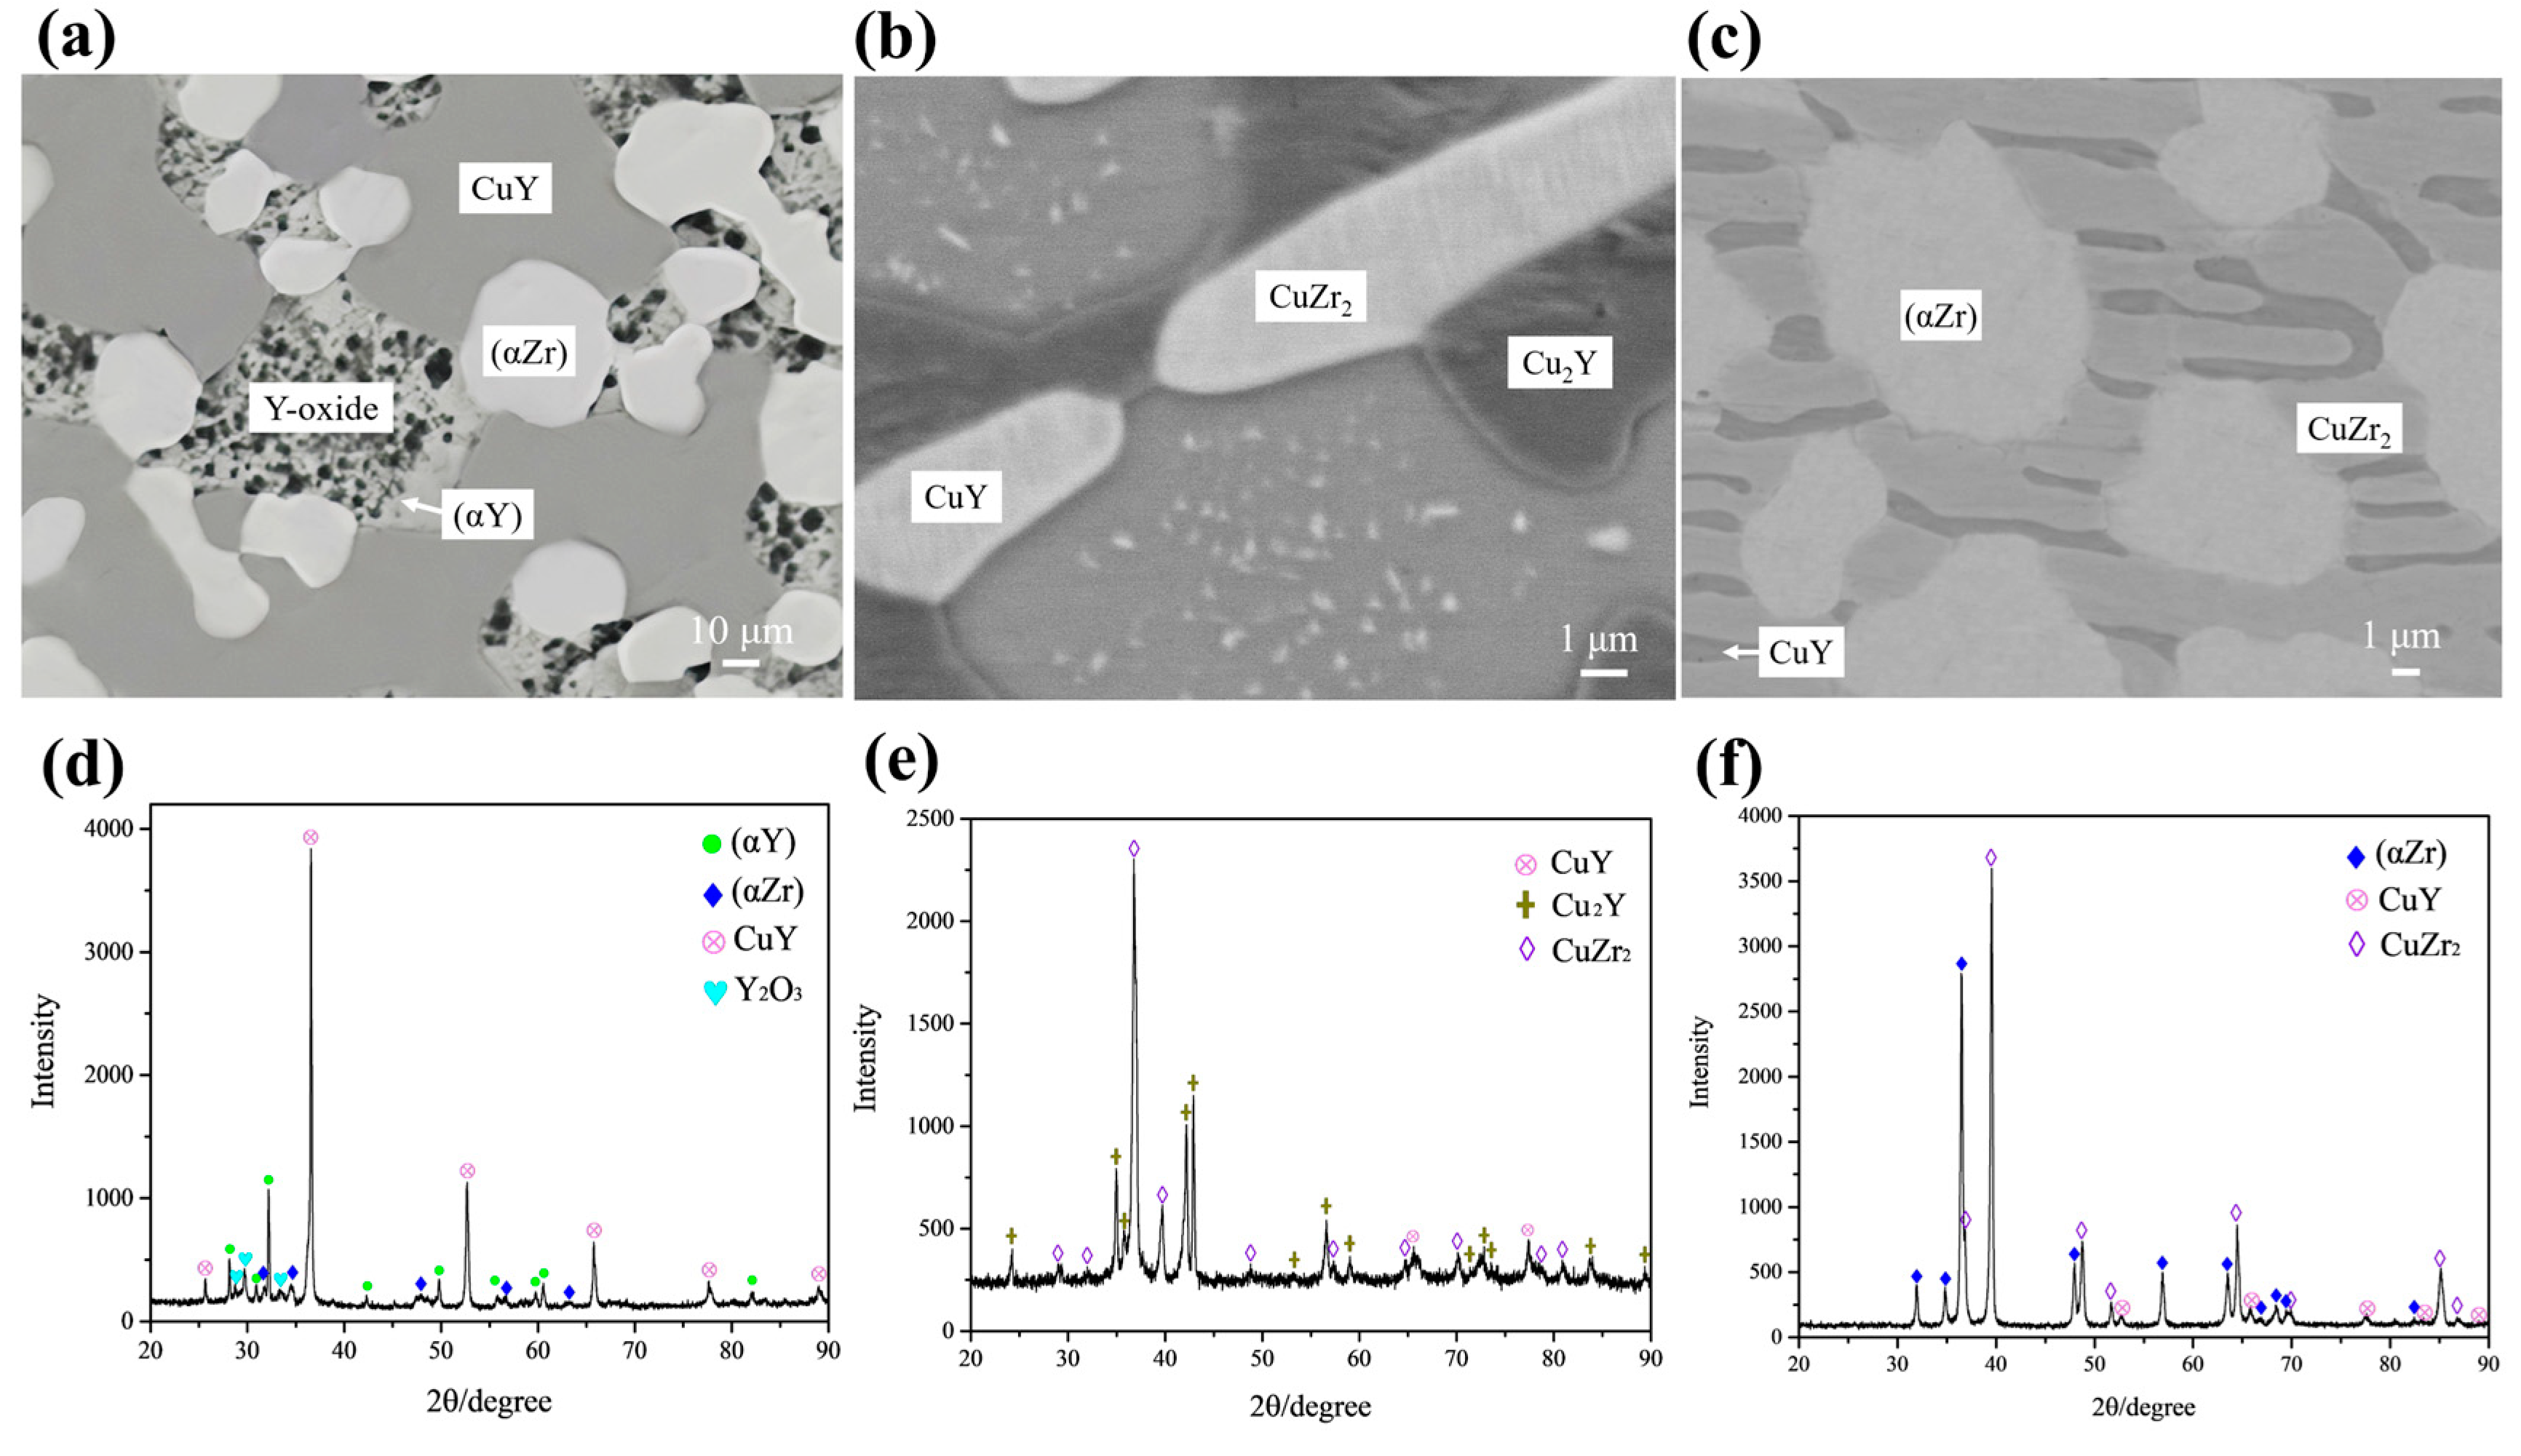
Figure 4b,e presents the BSE micrograph and XRD pattern of the as-cast alloy A9 Cu53Zr12Y35 (at.%). There are bright phase CuZr2, gray phase CuY, black phase Cu2Y and a eutectic structure of CuZr2 + CuY + Cu2Y noted in the white rectangle. The solidification paths of A9 are L → CuZr2, L → CuZr2 + CuZr and L → CuZr2 + Cu2Y + CuZr.
Figure 4c,f presents the BSE micrograph and XRD pattern of the as-cast alloy A12 Cu66Zr32Y2 (at.%). There are gray phase Cu10Zr7, dark gray phase Cu51Zr14 and a eutectic structure of Cu10Zr7 + Cu51Zr14 in the alloy. Combined with the as-cast microstructure and XRD results, the primary phase of A12 is Cu51Zr14, although the composition of Cu51Zr14 in the as-cast alloy deviates slightly from the equilibrium phase composition shown in Table 1. The solidification paths of A12 are L → Cu51Zr14 and L → Cu10Zr7 + Cu51Zr14.

4.1.2. Microstructure of Annealed Alloys

The experimental results of 12 alloys annealed at 973 K are summarized in Table 1. No ternary compound exists. Four two-phase regions, i.e., (Cu) + Cu6Y, (Cu) + Cu5Zr, Cu51Zr14 + Cu4Y, Cu51Zr14 + Cu10Zr7, and six three-phase regions, i.e., (Cu) + Cu6Y +Cu5Zr, Cu10Zr7 + Cu2Y + Cu7Y2, (αY) + (αZr) + CuY, Cu2Y + CuZr2 + CuZr, Cu2Y + CuZr2 + CuY, (αZr) + CuZr2 + CuY, are determined experimentally. The relationships are discussed as follows.
Figure 6a,d shows the BSE micrograph and XRD pattern for alloy A1 Cu90Zr8Y2 (at.%), respectively. The annealed microstructure of alloy A1 is similar to that of the cast state shown in Figure 4a. The XRD result indicates the presence of the Cu6Y phase and the BSE micrograph illustrates the presence of the Cu6Y phase in the eutectic microstructure. Therefore, in conjunction with the analysis above, alloy A1 consists of white Cu5Zr, gray Cu6Y and black (Cu). The solubility of Y in Cu5Zr is 2.03 at.%. The solubility of Zr in Cu6Y is 6.61 at.%. Figure 6b,e shows the BSE micrograph and XRD pattern for alloy A3 Cu69Zr10Y21 (at.%), respectively. The annealing alloy A3 is composed of Cu10Zr7 (white), Cu2Y (gray) and Cu7Y2 (dark). The concave–convex morphology of the Cu7Y2 phase and Cu2Y phase is the same as the result of He et al. [18]. The solubility of Y in Cu10Zr7 is 1.53 at.%. The solubility of Zr in Cu7Y2 is 7.83 at.%. Figure 6c,f shows the BSE micrograph and XRD pattern for alloy A8 Cu48Zr41Y11 (at.%), respectively. According to the results, alloy A8 is located in the three-phase region, i.e., bright CuZr2, grey CuZr and black Cu2Y. The solubility of Y in CuZr is 3.38 at.%.
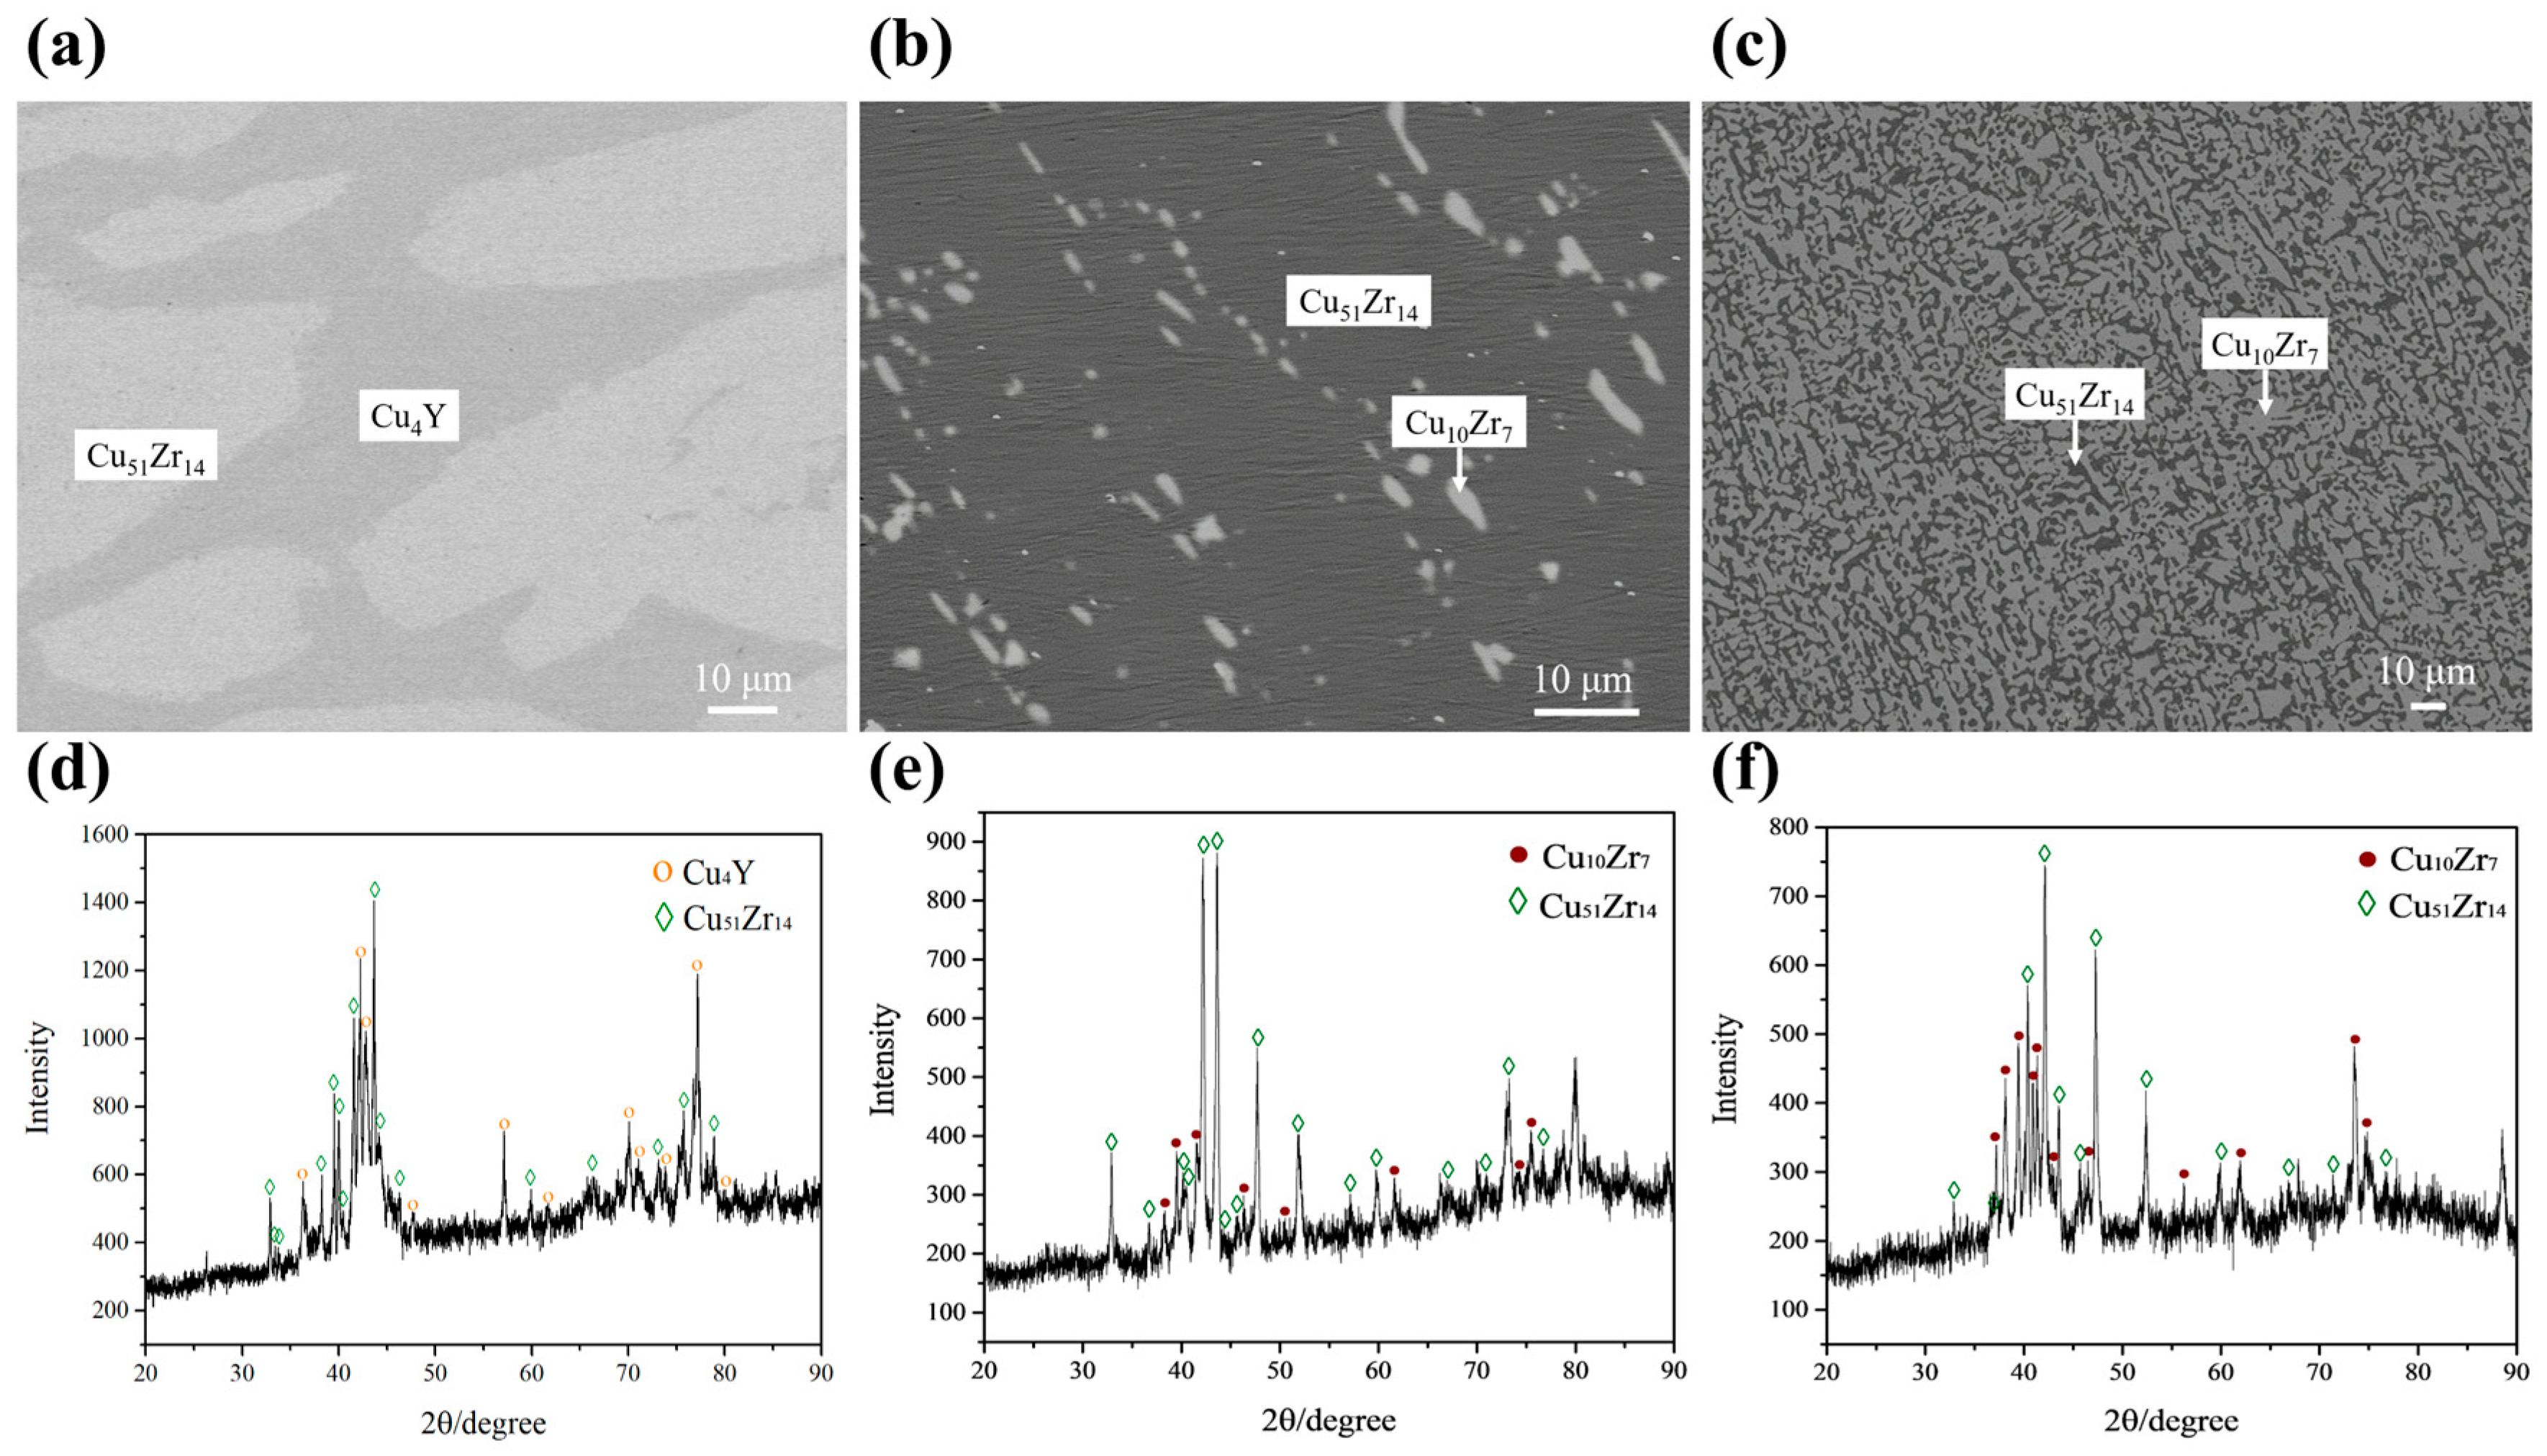
Figure 7a,d shows the BSE micrograph and XRD pattern for alloy A7 Cu79Zr13Y8 (at.%), respectively. The results show that alloy A7 consists of light gray Cu51Zr14 and dark gray Cu4Y phases. The A7 alloy is located in the two-phase region of Cu51Zr14 and Cu4Y. Figure 7b,e and Figure 7c,f show the BSE micrographs and XRD patterns for alloys A11 Cu78Zr18Y4 (at.%) and A12 Cu66Zr32Y2 (at.%), respectively. In the standard PDF cards for the Cu51Zr14 and Cu10Zr7 phases, there is no standard peak after 77.757° of 2θ, therefore the peak larger than 78° is not calibrated in the XRD pattern. According to the results, alloys A11 and A12 are both located in the grey Cu10Zr7 and dark gray Cu51Zr14 two-phase region, although their microstructures differ considerably. More Cu51Zr14 phases are present in alloy A11. The measured maximum solubility of Y in Cu51Zr14 is about 4.45 at.%. The solubilities of the 3rd element are determined in this work for the Cu–Zr–Y system. Noticeable solubilities were also measured in the Al–Zr–Y system by Liu et al. [38] and Bao et al. [39].
Figure 8a,d shows the BSE micrograph and XRD pattern for alloy A4 Cu33Zr7Y60 (at.%), respectively. The results show that alloy A4 is in the three-phase region for white αZr, grey αY and dark CuY. The rare earth Y is chemically active [40]. The oxidation of Y can be observed during the metallographic polishing process, which does not affect the phase equilibrium after vacuum annealing at 973 K. Combined with the XRD result, the black Y-oxide is Y2O3. The solubility of Cu in the hcp phase is about 2 at.%. Figure 8b,e shows the BSE micrograph and XRD pattern for alloy A9 Cu53Zr12Y35 (at.%), respectively. The diagrams show that alloy A9 is in the three-phase region for white CuZr2, grey CuY and black Cu2Y. Figure 8c,f shows the BSE micrograph and XRD pattern for alloy A10 Cu22Zr71Y7 (at.%), respectively. The diagrams show that alloy A10 is in the three-phase region for white αZr, grey CuZr2 and dark CuY.
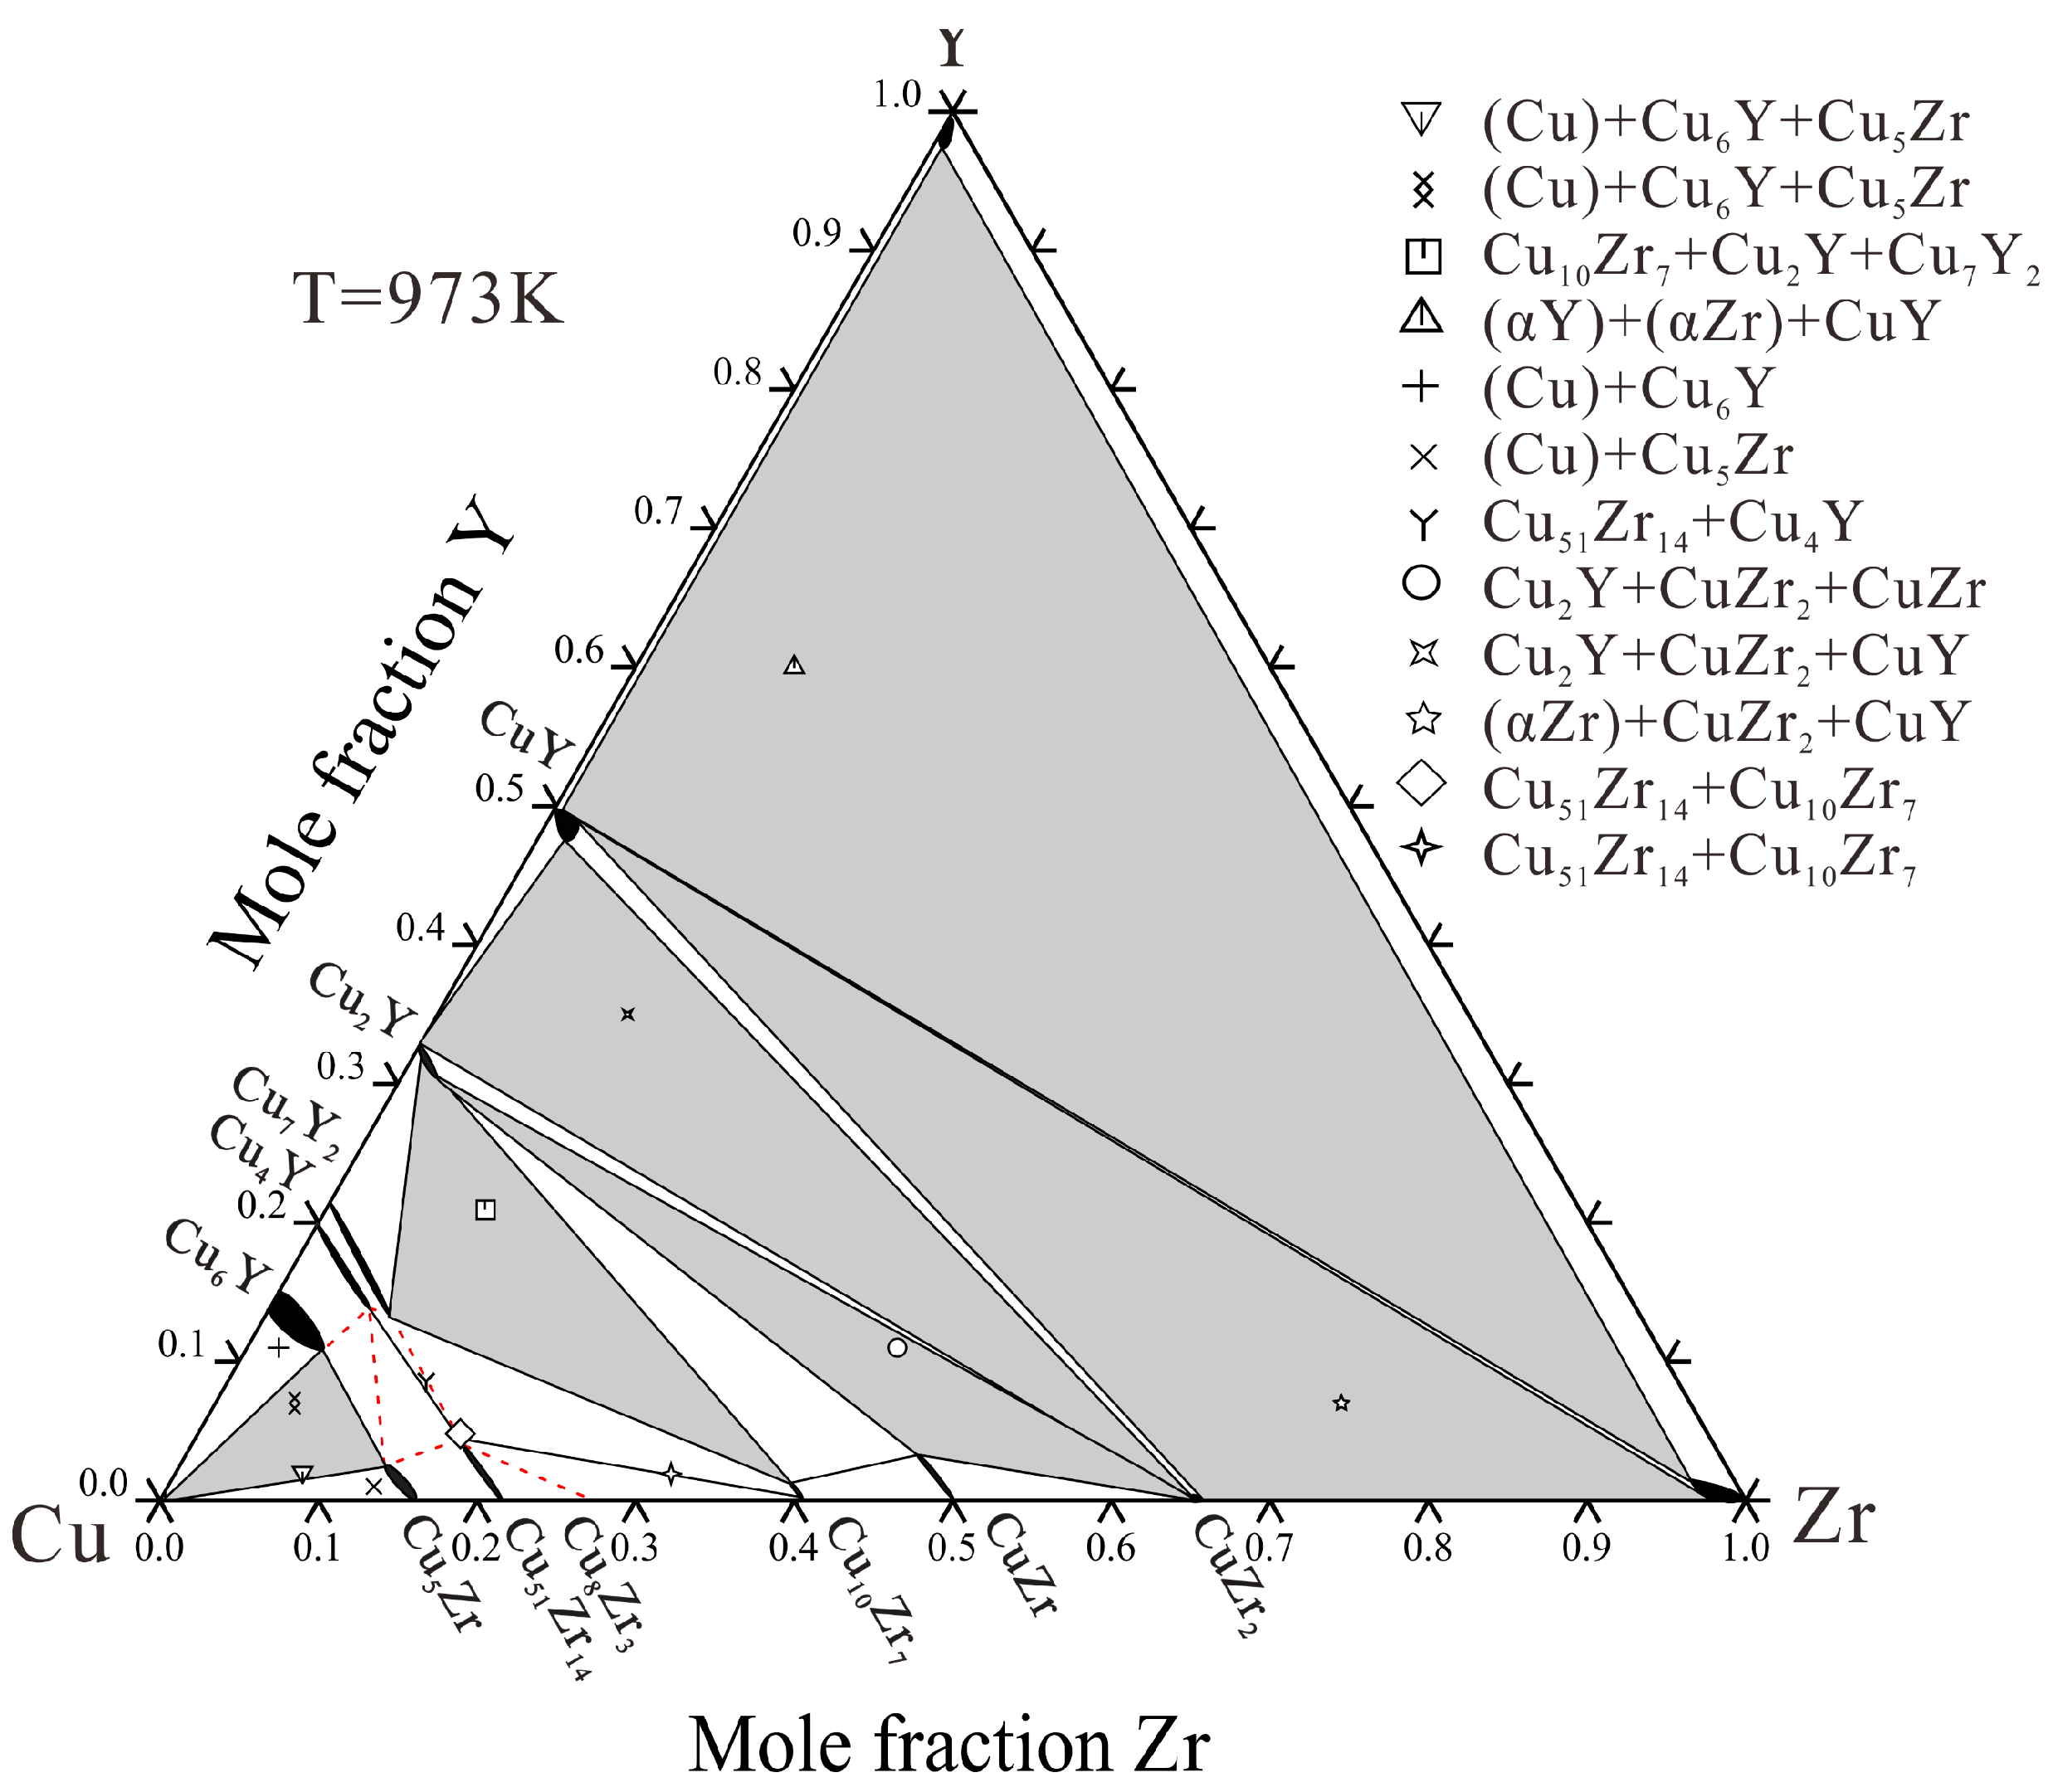
Based on the present experiments, the isothermal section at 973 K is constructed in Figure 9. Three two-phase regions and four three-phase regions agree well with those of He et al. [18]. The red dashed line in the experimental phase diagram indicates the phase regions that were not directly measured by the experiment. The alloys designed in the three-phase region of Cu4Y + Cu6Y + Cu5Zr tend to shift into the three-phase region of (Cu) + Cu6Y + Cu5Zr due to the small range of the phase region and the easy volatilization of Y during melting. This part has not been experimentally determined.

4.2. Thermodynamic Assessment

The PARROT module in Thermo-Calc software [41] was used for optimization based on the least square method. The thermodynamic descriptions for the Cu–Y [20], Cu–Zr [21] and Zr–Y [22] systems in the literature were combined to form a basis for the Cu–Zr–Y system assessment. Before optimizing the ternary system, the thermodynamic parameters of Cu−Y were optimized in order to satisfy the phase relations of (αY) + (αZr) + CuY and (αZr) + CuZr2 + CuY at 870K of the Cu–Zr–Y system. After optimization the temperature of the invariant reaction (αZr) + CuY → (αY) + CuZr2 was adjusted downward to 860 K. The presently calculated phase diagram of the Cu–Y system is consistent with the experimental data [20,42,43,44] and the calculated date [45], which is shown in Figure 1. For the Cu–Zr–Y system, the experimental data measured by alloy-sampling from the literature [18] are also used in the optimization.
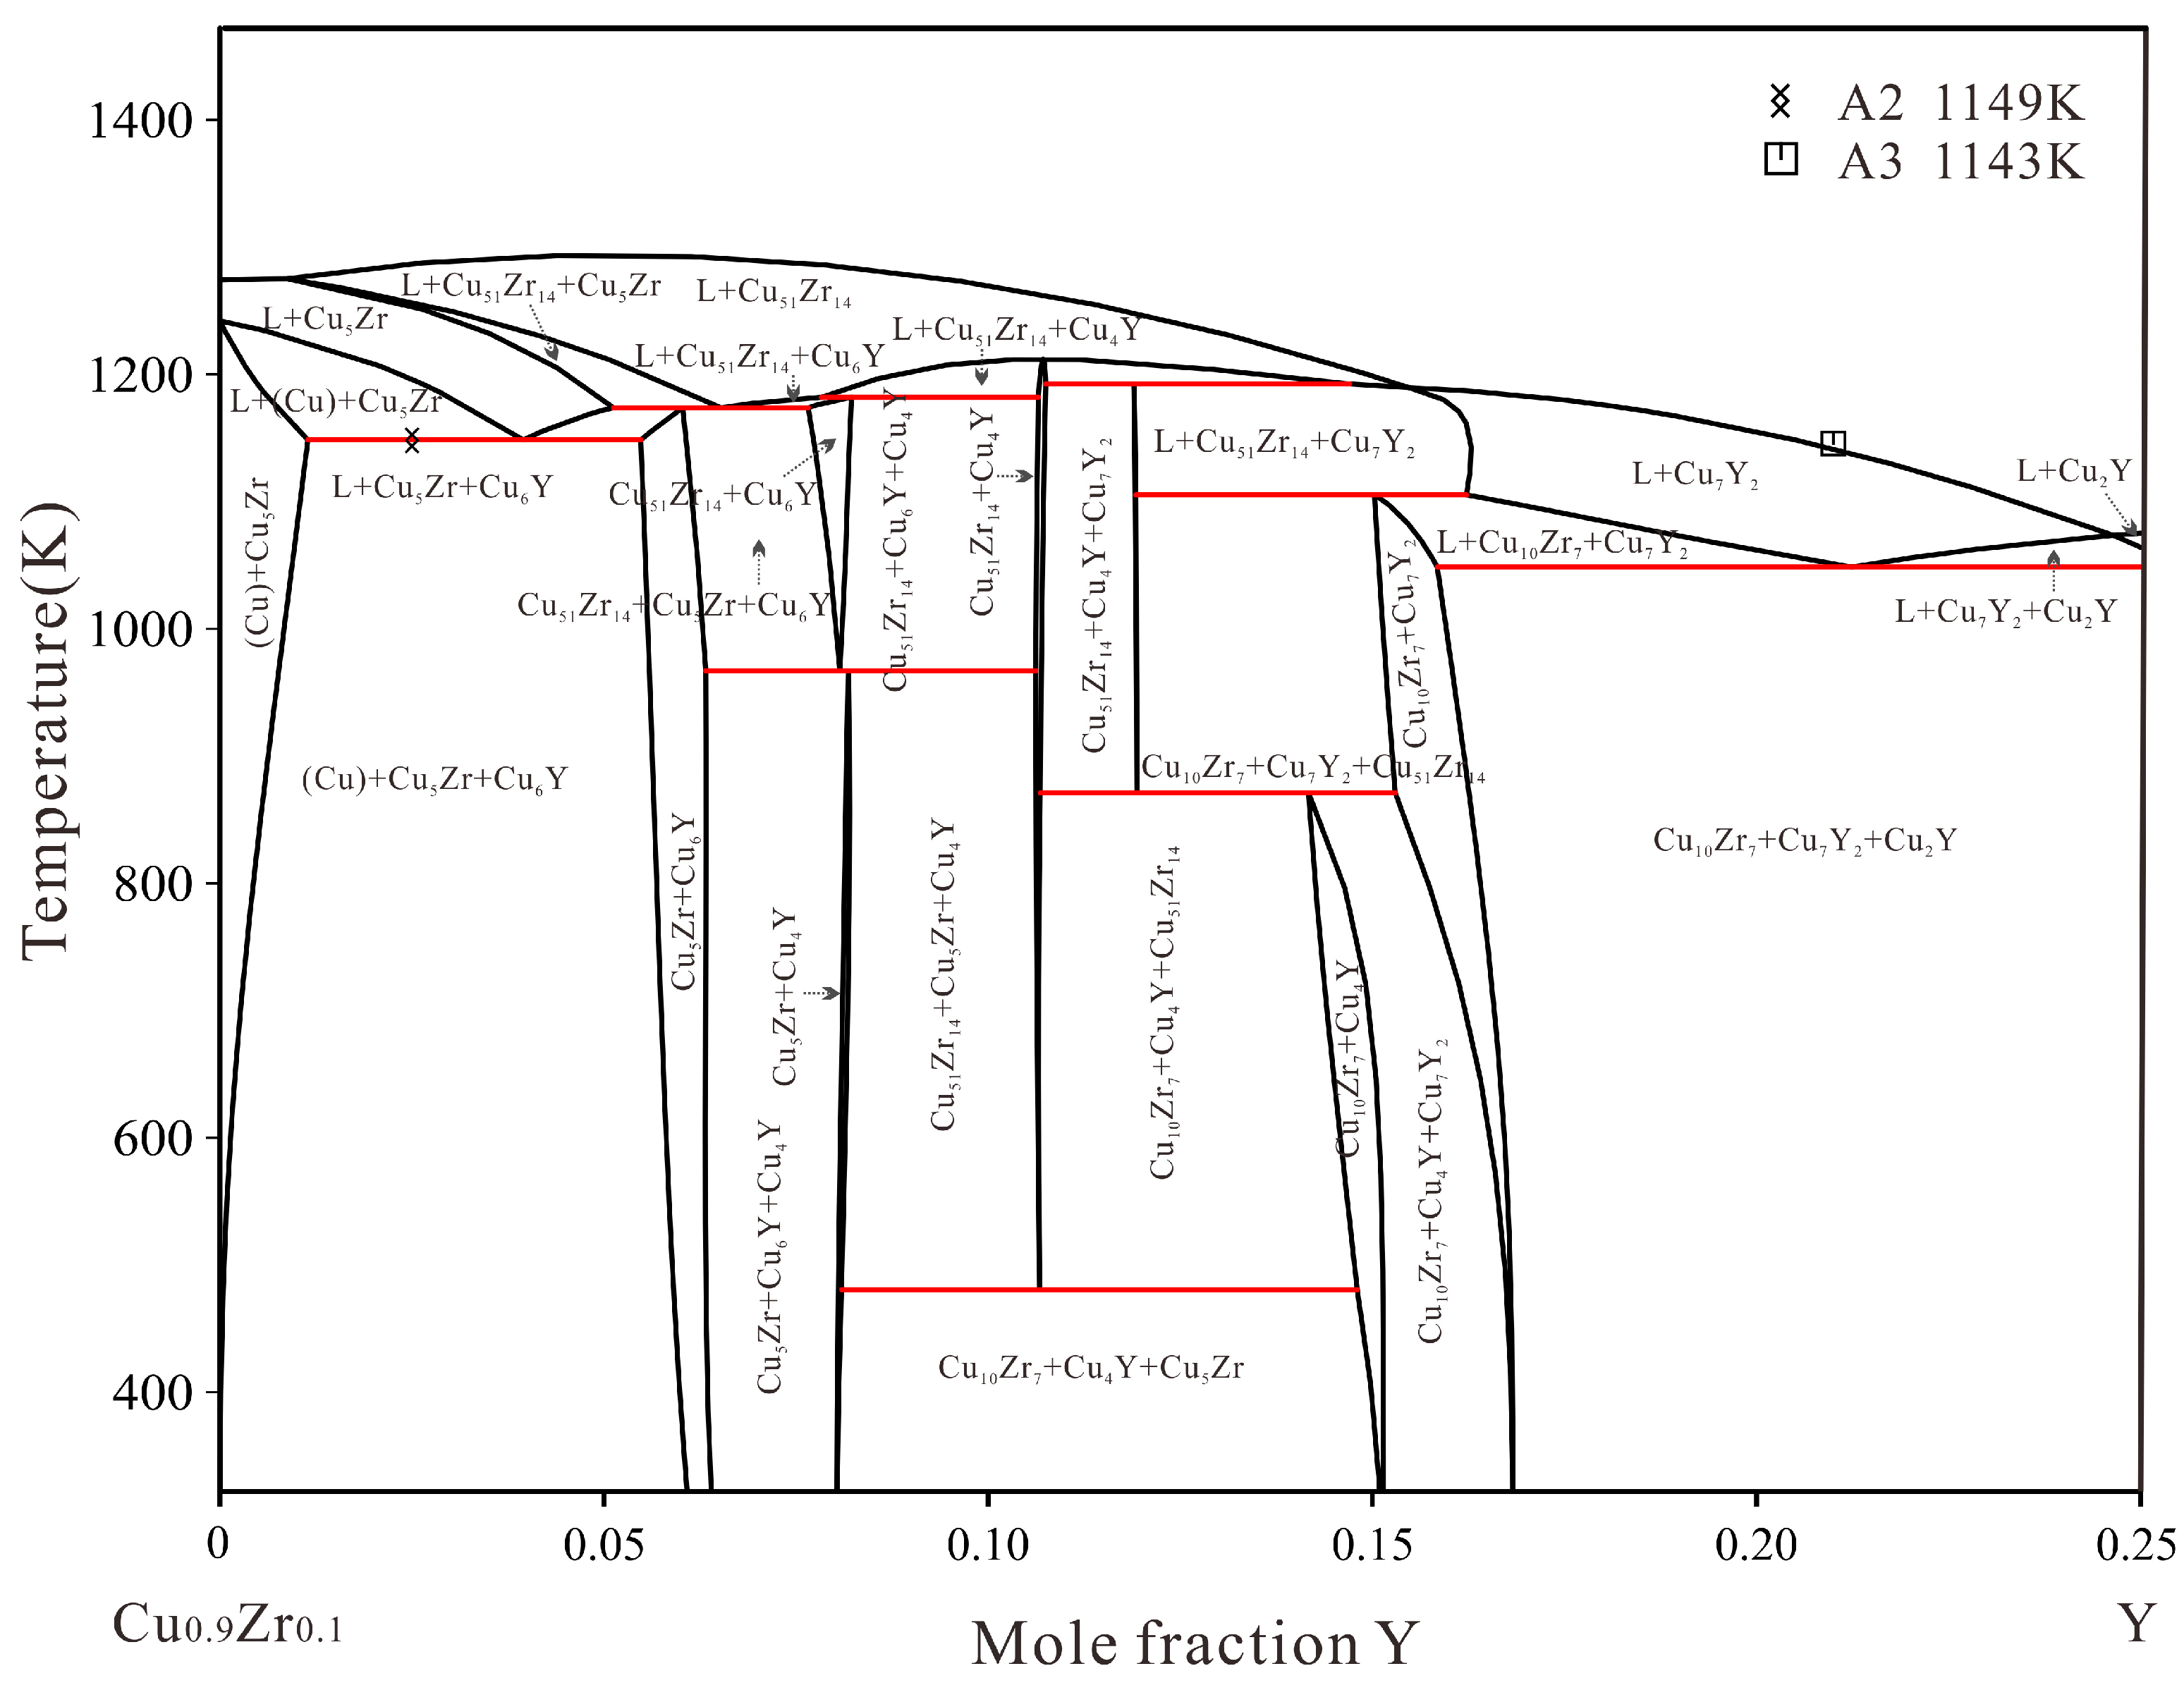
Then the measured ternary solubilities of Cu6Y, Cu4Y, Cu7Y2, Cu5Zr and Cu51Zr14 were considered. Optimization was carried out sequentially from the copper-rich end to the copper-poor end. Afterward, all the parameters were optimized simultaneously to achieve reasonable thermodynamic parameters. Finally, Table 3 provides the reasonable parameters of the Cu–Zr–Y system obtained in this work where the adjusted parameters are bolded. According to the current thermodynamic parameters, the calculated isothermal sections at 870 K, 973 K and 978 K are shown in Figure 10 compared with the reported experimental data [18,19] and the present measurement results. These calculations are in good agreement with experimental data. The calculated vertical section of the Cu–Zr–Y system at 10 at.% Zr, compared with the measured temperatures by DSC, are shown in Figure 11. It is noteworthy that only alloy A3 is located at the 10 at.% Zr vertical section. Alloy A2 is labeled in the vertical section by L → (Cu) + Cu5Zr + Cu6Y invariant reactions.
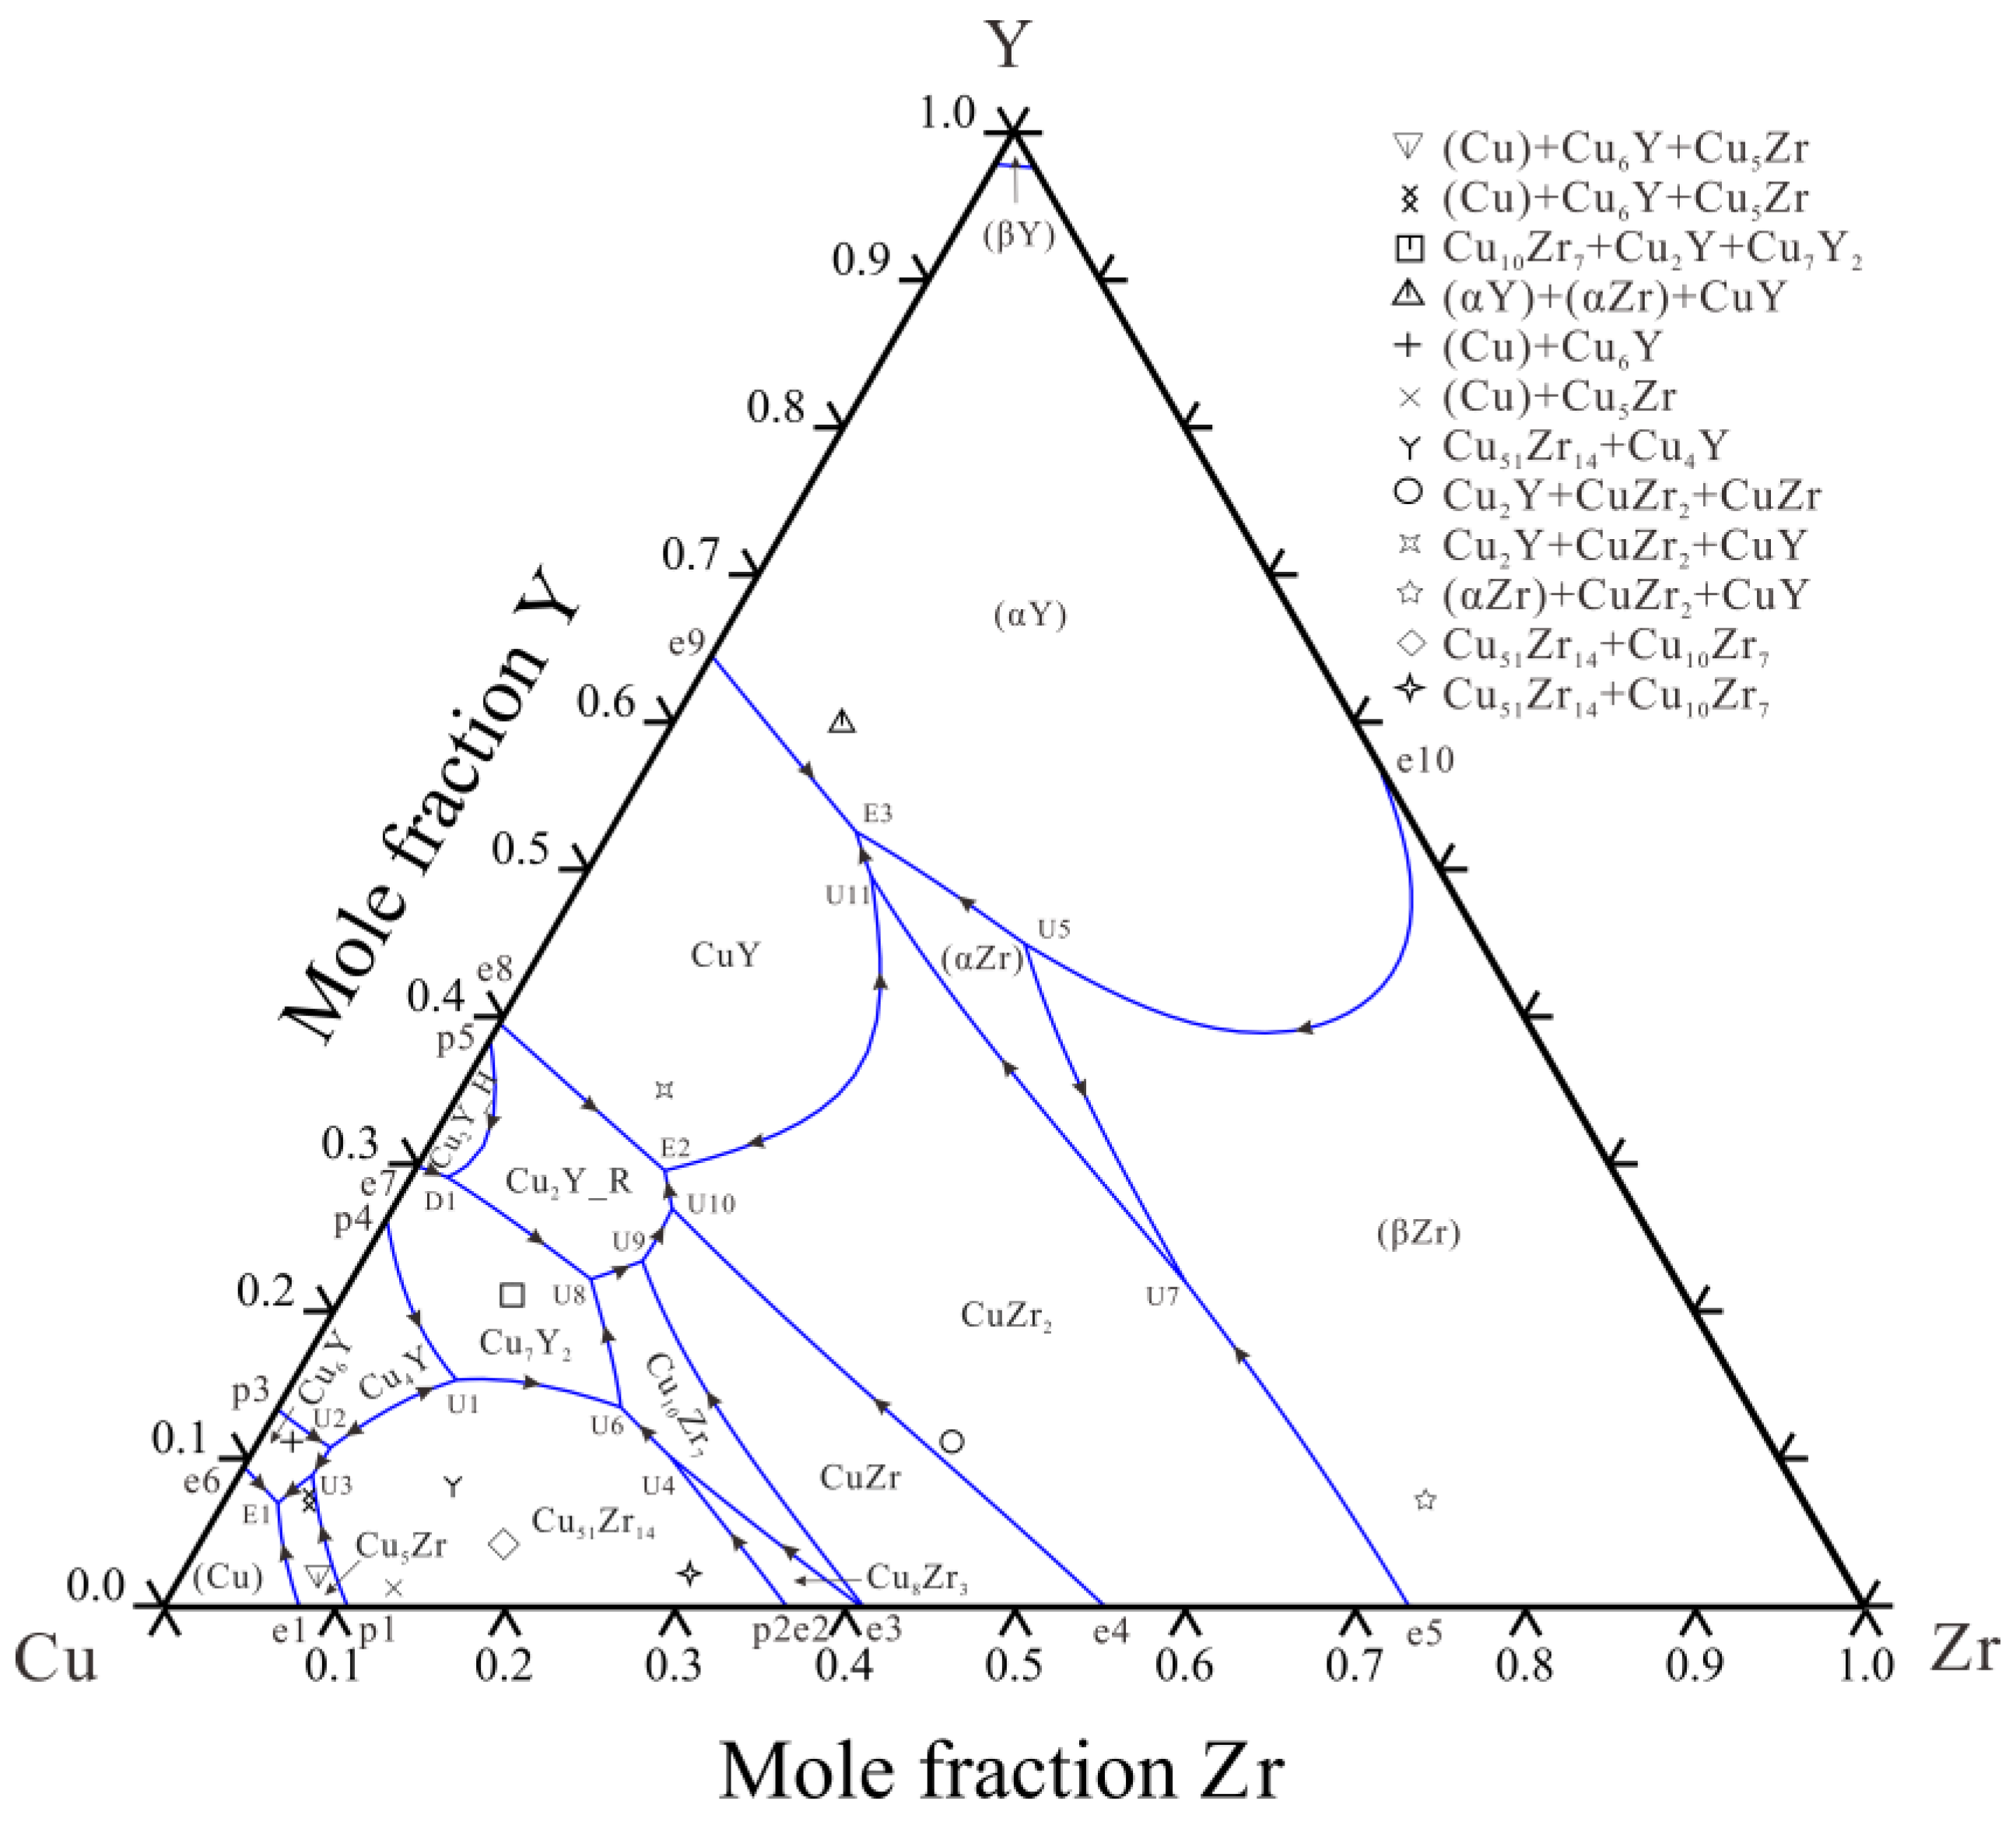
Figure 12 shows the calculated liquidus projection in comparison with the experimental primary phases. The present thermodynamic parameters are used for Scheil solidification simulation to guide the solidification behavior. Figure 13 shows the Scheil solidification simulation results of alloys A1 and A9. It can be seen that the primary phases of alloys A1 and A9 are Cu5Zr and CuY, respectively. The ternary eutectic structure of (Cu) + Cu5Zr + Cu6Y and CuZr2 + Cu2Y + CuZr are formed. These Scheil solidification simulations are consistent with the experimental result discussed in Section 4.1.1.
Based on the CALPHAD method and key experiments, a reasonable set of thermodynamic parameters for the Cu–Zr–Y system was obtained. The thermodynamic parameters were used to simulate phase equilibrium and Scheil solidification, which can guide the design of composition and microstructure of HSHC copper alloy.

5. Conclusions and Summary

The solidification microstructure, phase equilibria and phase transition temperatures in the Cu–Zr–Y ternary system were investigated by XRD, EPMA and DSC technologies. Furthermore, the thermodynamic optimization and a sequence of calculations and simulations using the present thermodynamic parameters were carried out. The major conclusions are as follows:
  • The solid solubility in the ternary system is determined. The maximum solubility of Zr in Cu6Y, Cu4Y and Cu7Y2 are about 6.61, 6.27 and 7.83 at.% Zr, respectively. The solubility of Y in Cu5Zr, Cu51Zr14 and CuZr are about 2.57, 4.45 and 3.38 at.% Y, respectively. The solubility of Cu in the hcp phase is about 2 at.%.
  • The Cu–Y system and the Cu–Zr–Y system were optimized by the CALPHAD method. The calculated isothermal sections, liquidus projection and vertical section are consistent with the experimental data.
  • The observed solidified microstructure agrees with the result of the Scheil solidification simulations using the thermodynamic parameters. The presently obtained thermodynamic description for the Cu–Zr–Y system can be used to guide the composition and microstructure design of Cu–Zr–Y alloys.

Supplementary Materials

The following supporting information can be downloaded at: https://www.mdpi.com/article/10.3390/ma16052063/s1, Table S1. Summary of the crystallographic data for stable phases in the Cu–Zr–Y system. References [20,27,28,29,30,31,32,33,34,35] are cited in the supplementary materials.

Author Contributions

Conceptualization, F.J. and Y.L.; Validation, F.J. and Y.L.; Investigation, F.J.; Resources, F.J.; Data Curation, F.J.; Writing—Original Draft Preparation, F.J. and Y.L.; Writing—Review & Editing, Y.D., C.S., B.H. and X.H.; Visualization, F.J.; Supervision, Y.L. and Y.D.; Project Administration, Y.D.; Funding Acquisition, Y.L. and B.H. All authors have read and agreed to the published version of the manuscript.

Funding

This work was supported by the National Natural Science Foundation of China (Grants Nos. 5210011609 and 52071002) and the National Natural Science Foundation of Hunan Province (Grant No. 2021JJ40749).

Institutional Review Board Statement

Not applicable.

Informed Consent Statement

Not applicable.

Data Availability Statement

The data that support the findings of this study are available from the corresponding author.

Acknowledgments

The authors would like to thank Rainer Schmid-Fetzer for his guidance in thermodynamic optimization and paper writing.

Conflicts of Interest

The authors declare no conflict of interest.

References

  1. Minneci, R.P.; Lass, E.A.; Bunn, J.R.; Choo, H.; Rawn, C.J. Copper-based alloys for structural high-heat-flux applications: A review of development, properties, and performance of Cu-rich Cu-Cr-Nb alloys. Int. Mater. Rev. 2021, 66, 394–425. [Google Scholar] [CrossRef]
  2. Lin, C.H. Newly-developed Cu(NbZrNx) copper-alloy films for microelectronic manufacture advancement. Mater. Trans. 2022, 63, 1080–1086. [Google Scholar] [CrossRef]
  3. Qin, Y.Q.; Tian, Y.; Peng, Y.Q.; Luo, L.M.; Zan, X.; Xu, Q.; Wu, Y.C. Research status and development trend of preparation technology of ceramic particle dispersion strengthened copper-matrix composites. J. Alloys Compd. 2020, 848, 156475. [Google Scholar] [CrossRef]
  4. Zhang, H.T.; Fu, H.D.; Zhu, S.C.; Yong, W.; Xie, J.X. Machine learning assisted composition effective design for precipitation strengthened copper alloys. Acta Mater. 2021, 215, 117118. [Google Scholar] [CrossRef]
  5. Wang, C.S.; Fu, H.D.; Jiang, L.; Xue, D.Z.; Xie, J.X. A property-oriented design strategy for high performance copper alloys via machine learning. NPJ Comput. Mater. 2019, 5, 87. [Google Scholar] [CrossRef] [Green Version]
  6. Yang, H.Y.; Ma, Z.C.; Lei, C.H.; Meng, L.; Fang, Y.T.; Liu, J.B.; Wang, H.T. High strength and high conductivity Cu alloys: A review. Sci. China Technol. Sci. 2020, 63, 2505–2517. [Google Scholar] [CrossRef]
  7. Zhang, P.C.; Shi, J.F.; Yu, Y.S.; Sun, J.C.; Li, T.J. Effect of cryorolling on microstructure and property of high strength and high conductivity Cu-0.5wt.%Cr alloy. T Nonferr. Metal. Soc. 2020, 30, 2472–2479. [Google Scholar] [CrossRef]
  8. Chen, J.S.; Xiao, X.P.; Guo, C.J.; Yuan, D.W.; Huang, H.; Yang, B. Regulation of primary phase in Cu-Cr-Zr alloy and its effect on nano-structure and properties. J. Alloys Compd. 2022, 926, 166836. [Google Scholar] [CrossRef]
  9. Peng, L.J.; Xie, H.F.; Huang, G.J.; Li, Y.F.; Yin, X.Q.; Feng, X.; Mi, X.J.; Yang, Z. The phase transformation and its effects on properties of a Cu−0.12wt% Zr alloy. Mat. Sci. Eng. A-Struct. 2015, 633, 28–34. [Google Scholar] [CrossRef]
  10. Du, Y.B.; Zhou, Y.J.; Song, K.X.; Huang, T.; Hui, D.; Liu, H.T.; Cheng, C.; Yang, J.Z.; Niu, L.Y.; Guo, H.W. Zr-containing precipitate evolution and its effect on the mechanical properties of Cu-Cr-Zr alloys. J. Mater. Res. Technol. 2021, 14, 1451–1458. [Google Scholar] [CrossRef]
  11. Liu, B.; Zhang, X.B.; Huang, Z.C.; Guo, J.L.; Gong, S.; Xie, G.L.; Peng, L.J.; Li, Z. Microstructure and properties of a novel ultra-high strength, high elasticity and high plasticity Cu-20Ni-20Mn-0.3Nb-0.3Cr-0.1Zr alloy. J. Alloys Compd. 2021, 853, 157402. [Google Scholar] [CrossRef]
  12. Gao, L.Q.; Yang, X.; Zhang, X.F.; Zhang, Y.; Sun, H.L.; Li, N. Aging behavior and phase transformation of the Cu-0.2 wt%Zr-0.15 wt%Y alloy. Vacuum 2019, 159, 367–373. [Google Scholar] [CrossRef]
  13. Li, H.H.; Liu, X.; Li, Y.; Zhang, S.H.; Chen, Y.; Wang, S.W.; Liu, J.S.; Wu, J.H. Effects of rare earth Ce addition on microstructure and mechanical properties of impure copper containing Pb. Trans. Nonferrous Met. Soc. China 2020, 30, 1574–1581. [Google Scholar] [CrossRef]
  14. Li, H.H.; Sun, X.Q.; Zhang, S.Z.; Zhao, Q.Y.; Wang, G.Z. Application of rare-earth element Y in refining impure copper. Int. J. Min. Met. Mater. 2015, 22, 453–459. [Google Scholar] [CrossRef]
  15. Wang, Y.; Qu, J.; Wang, X.; Jie, J.; Li, T. Effects of Y addition on the microstructure, properties and softening resistance of Cu-Cr alloy. J. Alloys Compd. 2022, 902, 163816. [Google Scholar] [CrossRef]
  16. Zhang, Y.; Sun, H.L.; Volinsky, A.A.; Wang, B.J.; Tian, B.H.; Chai, Z.; Liu, Y.; Song, K.X. Small Y addition effects on hot deformation behavior of copper-matrix alloys. Adv. Eng. Mater. 2017, 19, 1700197. [Google Scholar] [CrossRef]
  17. Liu, X.J.; Oikawa, K.; Ohnuma, I.; Kainuma, R.; Ishida, K. The use of phase diagrams and thermodynamic databases for electronic materials. JOM-US 2003, 55, 53–59. [Google Scholar] [CrossRef]
  18. He, X.C.; Liu, H.S. Determination of the isothermal section of the Cu–Zr–Y ternary system at 978K. J. Alloys Compd. 2009, 475, 245–251. [Google Scholar] [CrossRef]
  19. Myronenko, P.; Myakush, O.; Babizhetskyy, V.; Kotur, B. Phase equilibria in Y-Zr-Cu system at 870 K. Visnyk Lviv. Univ. Ser. Chem. 2011, 52, 22–26. [Google Scholar]
  20. Fries, S.G.; Lukas, H.L.; Konetzki, R.; Schmid-Fetzer, R. Experimental investigation and thermodynamic optimization of the Y-Cu binary system. J. Phase Equilib. 1994, 15, 606–614. [Google Scholar] [CrossRef]
  21. Liu, Y.; Liu, S.; Zhang, C.; Du, Y.; Wang, J.; Li, Y. Experimental investigation and thermodynamic description of the Cu-Zr system. J. Phase Equilib. Diffus. 2017, 38, 121–134. [Google Scholar] [CrossRef]
  22. Bu, M.J.; Wang, P.S.; Xu, H.H.; Liu, S.H.; Sha, C.S.; Du, Y.; Pan, F.S.; Tang, A.T. Experimental investigation and thermodynamic modeling of the Zr-Y system. J. Min. Metall. B 2010, 46, 181–192. [Google Scholar] [CrossRef]
  23. Zeng, G.; Hu, B.; Jin, C.G.; Chen, X.J.; Liu, S.H.; Du, Y.; Hu, J.Q. Experimental investigation and thermodynamic assessment of the Ag-Cr-Y and Ag-Cu-Y ternary systems. Calphad 2022, 78, 102455. [Google Scholar] [CrossRef]
  24. Shi, C.Y.; Liu, Y.L.; Yang, B.B.; Jin, B.; Hu, B.; Rajkumar, V.B.; Du, Y. Phase equilibria thermodynamics and solidified microstructure in the Ag-Cr-Zr system. J. Alloys Compd. 2021, 863, 158618. [Google Scholar] [CrossRef]
  25. Liu, Y.L.; Zhou, P.; Liu, S.H.; Du, Y. Experimental investigation and thermodynamic description of the Cu-Cr-Zr system. Calphad 2017, 59, 1–11. [Google Scholar] [CrossRef]
  26. Zhang, Y.; Hu, B.; Li, B.; Zhang, M.; Wang, Q.; Du, Y. Experimental investigation and CALPHAD modeling of the Cu–Cr–Si ternary system. Calphad 2021, 74, 102324. [Google Scholar] [CrossRef]
  27. Okamoto, H. Cu-Y (Copper-Yttrium). J. Phase Equilib. 1992, 13, 102–103. [Google Scholar] [CrossRef]
  28. Ellinger, F.H.; Land, C.C. On the plutonium-zirconium phase diagram. Nucl. Metall. 1971, 17, 686–698. [Google Scholar]
  29. Yasohama, K.; Ogasawara, T. Specific heat and superconducting properties of zirconium-molybdenum alloys. J. Phys. Soc. Jpn. 1974, 36, 1349–1355. [Google Scholar] [CrossRef]
  30. Forey, P.; Glimois, J.L.; Feron, J.L.; Develey, G.; BECLE, C. Cheminform abstract: Synthesis, characterization and crystal structure of copper-zirconium (Cu5Zr). Chem. Inf. 1981, 12, 10. [Google Scholar] [CrossRef]
  31. Bsenko, L. Crystallographic data for intermediate phases in the copper-zirconium and copper-hafnium systems. J. Less-Common Met. 1975, 40, 365–366. [Google Scholar] [CrossRef]
  32. Glimois, J.L.; Forey, P.; Feron, J.; Becle, C. Structural investigations of the pseudo-binary compounds nickel-copper-zirconium (Ni10-xCuxZr7). J. Less-Common Met. 1981, 78, 45–50. [Google Scholar] [CrossRef]
  33. Carvalho, E.M.; Harris, I.R. Constitutional and structural studies of the intermetallic phase, zirconium-copper (ZrCu). J. Mater. Sci. 1980, 15, 1224–1230. [Google Scholar] [CrossRef]
  34. Nevitt, M.V.; Downey, J.W. A family of intermediate phases having the Si2Mo type structure. Trans. Am. Inst. Min. Metall. Pet. Eng. 1962, 224, 195–196. [Google Scholar]
  35. Belyavina, N.N.; Markiv, V.Y.; Nakonechna, O.I. Reinvestigation of the Y–Cu–Ga system at 700°C. J. Alloys Compd. 2012, 541, 288–296. [Google Scholar] [CrossRef]
  36. Dinsdale, A.T. SGTE data for pure substances. Calphad 1991, 15, 317–425. [Google Scholar] [CrossRef]
  37. Redlich, O.; Kister, A.T. Algebraic representation of thermodynamic properties and the classification of solutions. J. Ind. Eng. Chem. 1948, 40, 345–348. [Google Scholar] [CrossRef]
  38. Liu, X.X.; Du, Y.; Liu, S.H.; Pan, Y.F. Measurement of the phase equilibria in the Al-Zr-Y system at 673 and 823 K. Calphad 2020, 68, 101726. [Google Scholar] [CrossRef]
  39. Bao, X.; Liu, L.; Huang, S.; Jiang, Y.; Wang, X.; Zhang, L. Phase relationships in the al-rich region of the Al-Y-Zr system. J. Min. Metall. B 2017, 53, 9–12. [Google Scholar] [CrossRef]
  40. Ryan, A.J.; Evans, W.J. The periodic table as a career guide: A journey to rare earths. In Periodic Table I: Historical Development and Essential Features; Mingos, D.M.P., Ed.; Springer: Berlin, Germany, 2019; Volume 181, pp. 197–224. [Google Scholar]
  41. Sundman, B.; Jansson, B.; Andersson, J.O. The thermo-calc databank system. Calphad 1985, 9, 153–190. [Google Scholar] [CrossRef]
  42. Domagala, R.F.; Rausch, J.J.; Levinson, D.W. The systems Y–Fe, Y–Ni, and Y–Cu. Trans. Am. Soc. Met 1961, 53, 137–155. [Google Scholar]
  43. Qi, G.; Itagaki, K.; Yazawa, A. High temperature heat content measurements of Cu-RE (RE=Y, La, Ce, Pr, Nd) binary systems. Mater. Trans. JIM 1989, 30, 273–282. [Google Scholar] [CrossRef] [Green Version]
  44. Abend, U.; Schaller, H.J. Constitution and thermodynamics of Cu-Y alloys. Ber. Bunsenges. Phys. Chem. 1997, 101, 741–748. [Google Scholar] [CrossRef]
  45. Massalski, T.B.; Murray, J.L.; Bennett, L.H. Binary Alloy Phase Diagrams: Cu-Y.; Barker, H., Ed.; ASM International, Materials Park: Novelty, OH, USA, 1986; Volume 1. [Google Scholar]
Figure 1. Calculated Cu–Y phase diagram using the parameter from Fries et al. [20] and this work.
Materials 16 02063 g001
Figure 2. Calculated Cu–Zr phase diagram using the parameter from Liu et al. [21].
Materials 16 02063 g002
Figure 3. Calculated Y–Zr phase diagram using the parameter from Bu et al. [22].
Materials 16 02063 g003
Figure 4. BSE micrographs and XRD patterns of as-cast alloys: (a,d) A1 Cu90Zr8Y2 (at.%); (b,e) A9 Cu53Zr12Y35 (at.%); (c,f) A12 Cu66Zr32Y2 (at.%).
Materials 16 02063 g004
Figure 5. The DSC curves with a heating rate of 5 K/min for annealed alloy A1 Cu90Zr8Y2 (at.%) of the Cu–Zr–Y system.
Materials 16 02063 g005
Figure 6. BSE micrographs and XRD patterns of annealed alloys: (a,d) A1 Cu90Zr8Y2 (at.%); (b,e) A3 Cu69Zr10Y21 (at.%); (c,f) A8 Cu48Zr41Y11 (at.%).
Materials 16 02063 g006
Figure 7. BSE micrographs and XRD patterns of annealed alloys: (a,d) A7 Cu79Zr13Y8 (at.%); (b,e) A11 Cu78Zr18Y4 (at.%); (c,f) A12 Cu66Zr32Y2 (at.%).
Materials 16 02063 g007
Figure 8. BSE micrographs and XRD patterns of annealed alloys: (a,d) A4 Cu33Zr7Y60 (at.%); (b,e) A9 Cu53Zr12Y35 (at.%); (c,f) A10 Cu22Zr71Y7 (at.%).
Materials 16 02063 g008
Figure 9. Experimental isothermal section of Cu–Zr–Y system with experimental data at 973 K.
Materials 16 02063 g009
Figure 10. Calculated isothermal sections of Cu–Zr–Y system at (a) 870 K with experimental data [19], (b) 973 K with experimental data from this work and (c) 978 K with experimental data [18].
Materials 16 02063 g010
Figure 11. Calculated vertical section of the Cu–Zr–Y system at 10 at.% Zr with the experimental data.
Materials 16 02063 g011
Figure 12. Calculated liquidus projection of the Cu–Zr–Y system with experimental data.
Materials 16 02063 g012
Figure 13. The Scheil simulation for alloys A1 Cu90Zr8Y2 (at.%) (a) and A9 Cu53Zr12Y35 (at.%) (b).
Materials 16 02063 g013
Table 1. Summary of the experimental data for the Cu–Zr–Y system.
AlloyAlloyPrimaryPrimary Phase PhaseEquilibrium Phase
No.CompositionPhaseComposition (at.%)Solidification PathsEquilibriaComposition (at.%)
(at.%) CuYZr CuYZr
A1Cu90Zr8Y2Cu5Zr83.051.0515.9L → Cu5Zr(Cu)99.9500.05
L → (Cu) + Cu5ZrCu5Zr83.222.0314.75
L → (Cu) + Cu5Zr + Cu6YCu6Y84.698.76.61
A2Cu88Zr5Y7Cu5Zr82.847.0810.08L → Cu51Zr14(Cu)99.620.150.23
L + Cu51Zr14 → Cu5ZrCu5Zr82.202.5715.23
L → (Cu) + Cu5ZrCu6Y84.269.845.9
A3Cu69Zr10Y21Cu7Y277.1817.005.82L → Cu7Y2Cu10Zr759.741.5338.73
L → Cu7Y + Cu2YCu2Y67.5931.790.62
L + Cu7Y2 → Cu10Zr7 + Cu2YCu7Y278.7913.387.83
A4Cu33Zr7Y60(αY)4.7894.280.94L → (αY)(αY)2.0697.260.68
L → (αY) + (αZr)(αZr)2.811.5195.68
L → (αY) + (αZr) + CuYCuY49.6449.760.60
A5Cu87Zr2Y11Cu6Y84.2511.124.63L → Cu6Y(Cu)98.801.190.01
L → Cu6Y + (Cu)Cu6Y85.3411.563.1
A6Cu86Zr13Y1Cu51Zr1479.460.1320.41L → Cu51Zr14(Cu)98.980.160.86
L + Cu51Zr14 → Cu5ZrCu5Zr83.071.0415.89
L → (Cu) + Cu5Zr
A7Cu79Zr13Y8Cu51Zr1479.173.7217.11L → Cu51Zr14Cu51Zr1478.873.9917.14
L → Cu4YCu4Y79.8813.856.27
A8Cu48Zr41Y11CuZr234.520.0465.44L → CuZr2CuZr234.550.165.35
L → CuZr + CuZr2CuZr50.543.3846.08
L + CuZr → Cu2Y + CuZr2Cu2Y67.3830.502.12
A9Cu53Zr12Y35CuY50.1446.083.78L → CuYCuY50.7647.431.81
L → CuY + Cu2YCu2Y67.0532.950
L → CuY + Cu2Y + CuZr2CuZr234.78065.22
A10Cu22Zr71Y7(αZr)4.34095.66L → (αZr)(αZr)2.28097.72
L → (αZr) + CuZr2CuZr234.06065.94
L → (αZr) + CuZr2 + CuYCuY49.0948.782.13
A11Cu78Zr18Y4Cu51Zr1479.106.1614.74L → Cu51Zr14Cu51Zr1478.804.4216.78
L → Cu10Zr7 + Cu51Zr14Cu10Zr759.820.3139.87
A12Cu66Zr32Y2Cu51Zr1473.391.8724.73L → Cu51Zr14Cu51Zr1478.234.4517.32
L → Cu10Zr7 + Cu51Zr14Cu10Zr759.660.0140.33
Table 2. Comparison of the DSC results with the calculated results in the Cu–Zr–Y system.
AlloyAlloyPhase Transition Temperatures (K)
No.CompositionLiquidus Invariant
(at.%)Exp.Calc.Exp.Calc.
A1Cu90Zr8Y212531252
12231217
A2Cu88Zr5Y71225119711491149
A3Cu69Zr10Y2111431141
A4Cu33Zr7Y6010931090
A5Cu87Zr2Y1111801179
11531151
A6Cu86Zr13Y112231217
A7Cu79Zr13Y812951299
Table 3. The thermodynamic parameters obtained in this work.
PhasesModelsThermodynamic Parameters
Liquid(Cu,Y,Zr)1 G C u , Y L i q u i d 0 = 89300 + 21.5669 · T
L C u , Y , Z r L i q u i d 1 = 2000
CuZr(Cu)1(Zr,Y)1 G C u : Y C u Z r 0 = 11582 + G C u F c c 0 + G Y H c p 0
Cu51Zr14(Cu)51(Zr,Y)14 G C u : Y C u 51 Z r 14 0 = 896480 + 51 · G C u F c c 0 + 14 · G Y H c p 0
Cu5Zr(Cu)5(Zr,Y)1 G C u : Y C u 5 Z r 0 = 64998 + 5 · G C u F c c 0 + G Y H c p 0
Cu4Y(Cu)4(Y,Zr)1 G C u : Y C u 4 Y 0 = 89500 + 8.25205 · T + 4 · G C u F c c 0 + G Z r H c p 0
G C u : Z r C u 6 Y 0 = 40366 + 4 · G C u F c c 0 + G Z r H c p 0
Cu6Y(Cu)5(Cu2,Y,Zr)1 G C u : Y C u 6 Y 0 = 90000 + 8.29539 · T + 5 · G C u F c c 0 + G Z r H c p 0
G C u : Z r C u 6 Y 0 = 45447 + 5 · G C u F c c 0 + G Z r H c p 0
Cu7Y2(Cu)7(Y,Zr)2 G C u : Y C u 7 Y 2 0 = 168880 + 15.56757 · T + 7 · G C u F c c 0 + 2 · G Z r H c p 0
G C u : Z r C u 7 Y 2 0 = 55642 + 7 · G C u F c c 0 + 2 · G Z r H c p 0
L C u : Y , Z r C u 7 Y 2 0 = 35442
CuY(Cu)1(Y)1 G C u : Y C u Y 0 = 44760 + 4.12 · T + G C u F c c 0 + G Y H c p 0
Disclaimer/Publisher’s Note: The statements, opinions and data contained in all publications are solely those of the individual author(s) and contributor(s) and not of MDPI and/or the editor(s). MDPI and/or the editor(s) disclaim responsibility for any injury to people or property resulting from any ideas, methods, instructions or products referred to in the content.