4.1. Water Migration Freezing Model
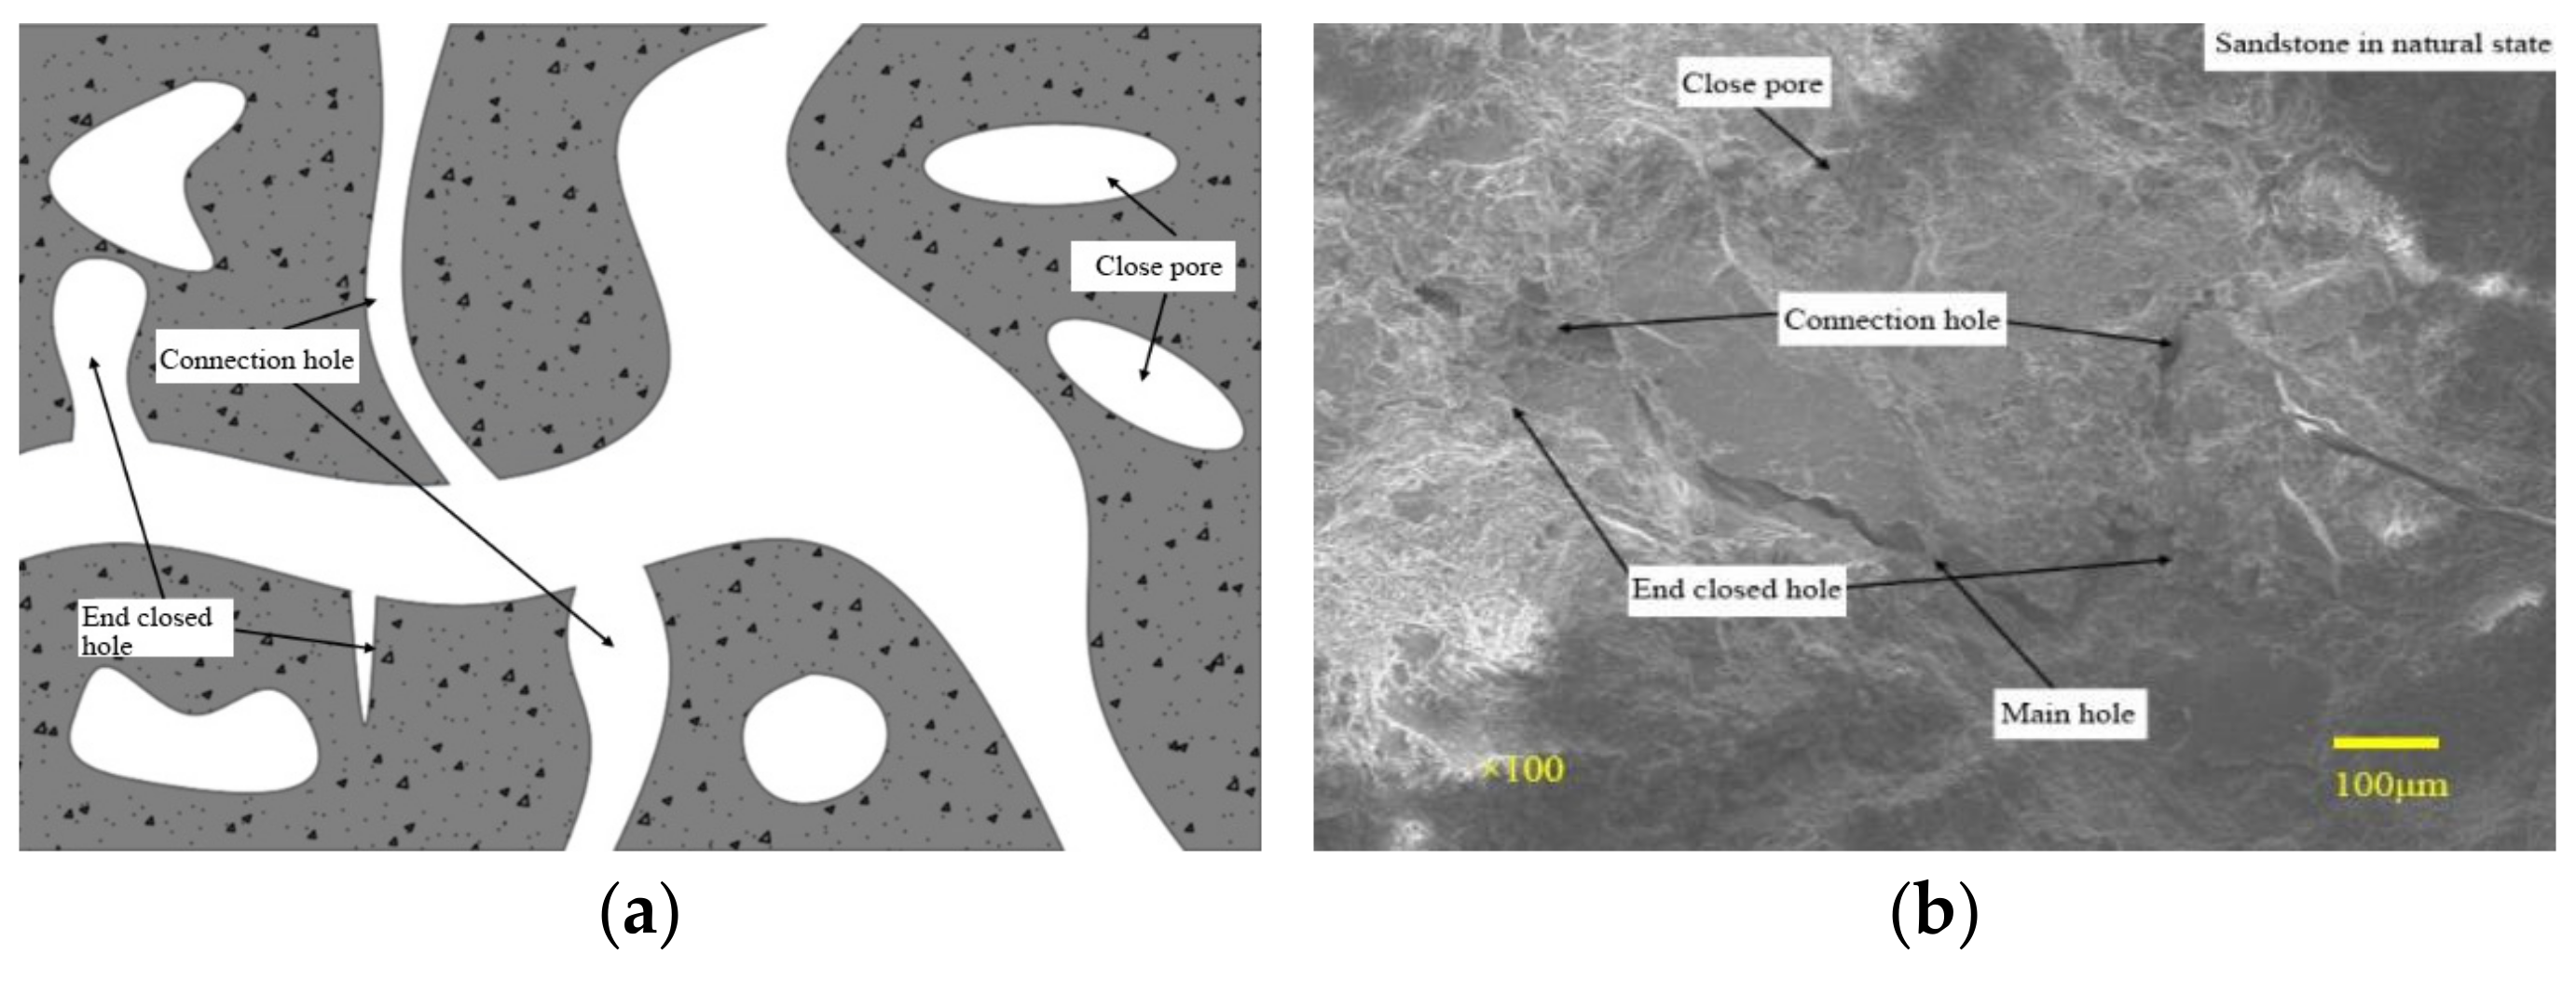
According to the size, shape, and connectivity of pores, they are divided into trunk holes, connecting holes, end closed holes, and closed holes. As shown in
Figure 11, the main pore has a large size, so it is the main migration channel for pore water. The holes connected with the main hole are called side branch holes. The difference between the connecting hole and the end closed hole is that one end of the end closed hole is closed. The closed hole is independent of the main hole and the side branch hole and is not connected with other holes. During the freezing process, different pore types may be converted. The connected hole may become an end closed hole after one end is frozen, the end closed hole may become a closed hole after the main hole is frozen, and the closed hole may become an end closed hole due to the expansion of the pore.
According to previous studies, the heat conduction process of any material follows a gradient mode. Similarly, during the freezing process of sandstone, its internal temperature field changes unevenly, so it is necessary to consider the temperature transmission process when distinguishing the freezing conditions that the pore water meets in different freezing stages. According to solidification theory [
30], the freezing rate of water is slow during the freezing process, so the process of the water–ice phase transition can be regarded as a static process. Moreover, there is a supercooling stage in the freezing process; that is, in the process of ice growth, a stable temperature field is formed in the cross-section of cylindrical fractures. The temperature of the environment
where the rock is located is the same as the temperature of the boundary
, and in the pores, the temperature of the water/ice interface is the same as the temperature of the ice body, namely:
According to Laplace’s equation:
In polar coordinates, the two-dimensional Laplace equation is:
The general solution of Equation (7) can be expressed as
,
i and
j are assumed to be constant. The temperature field distribution around the crack can be obtained by bringing Equations (4) and (5) into Equation (7):
According to the principle of energy conservation, the heat balance equation is:
By substituting Equations (8) and (9) into Equation (10), the relationship between the water–ice phase transition velocity and temperature field is obtained.
where
—latent heat of phase change,
—thermal conductivity in ice,
—thermal conductivity in unfrozen water,
—the quality of fissure ice,
—water-ice interface area,
-outer normal direction of water–ice interface,
—the growth rate of ice in the fissure,
, and
—Fissure water density.
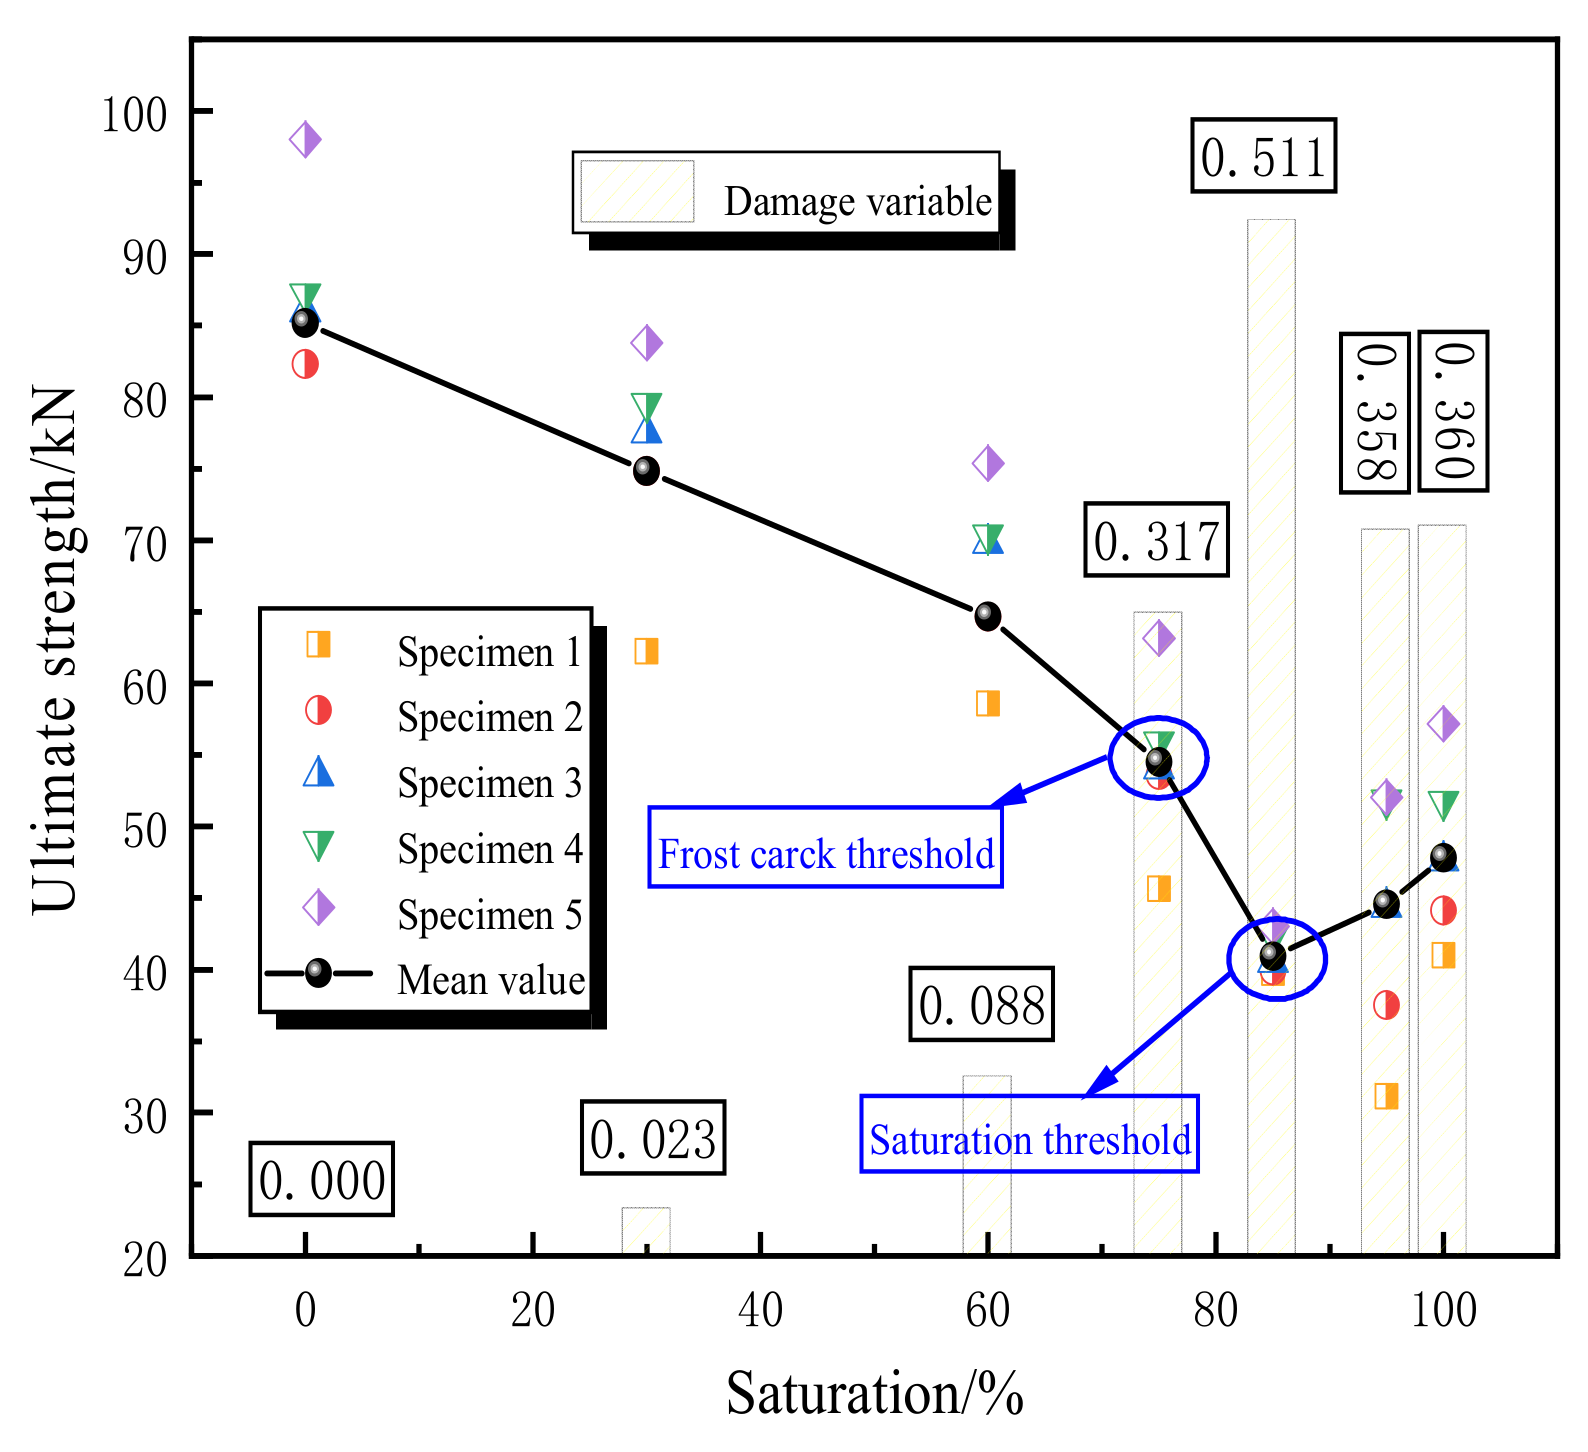
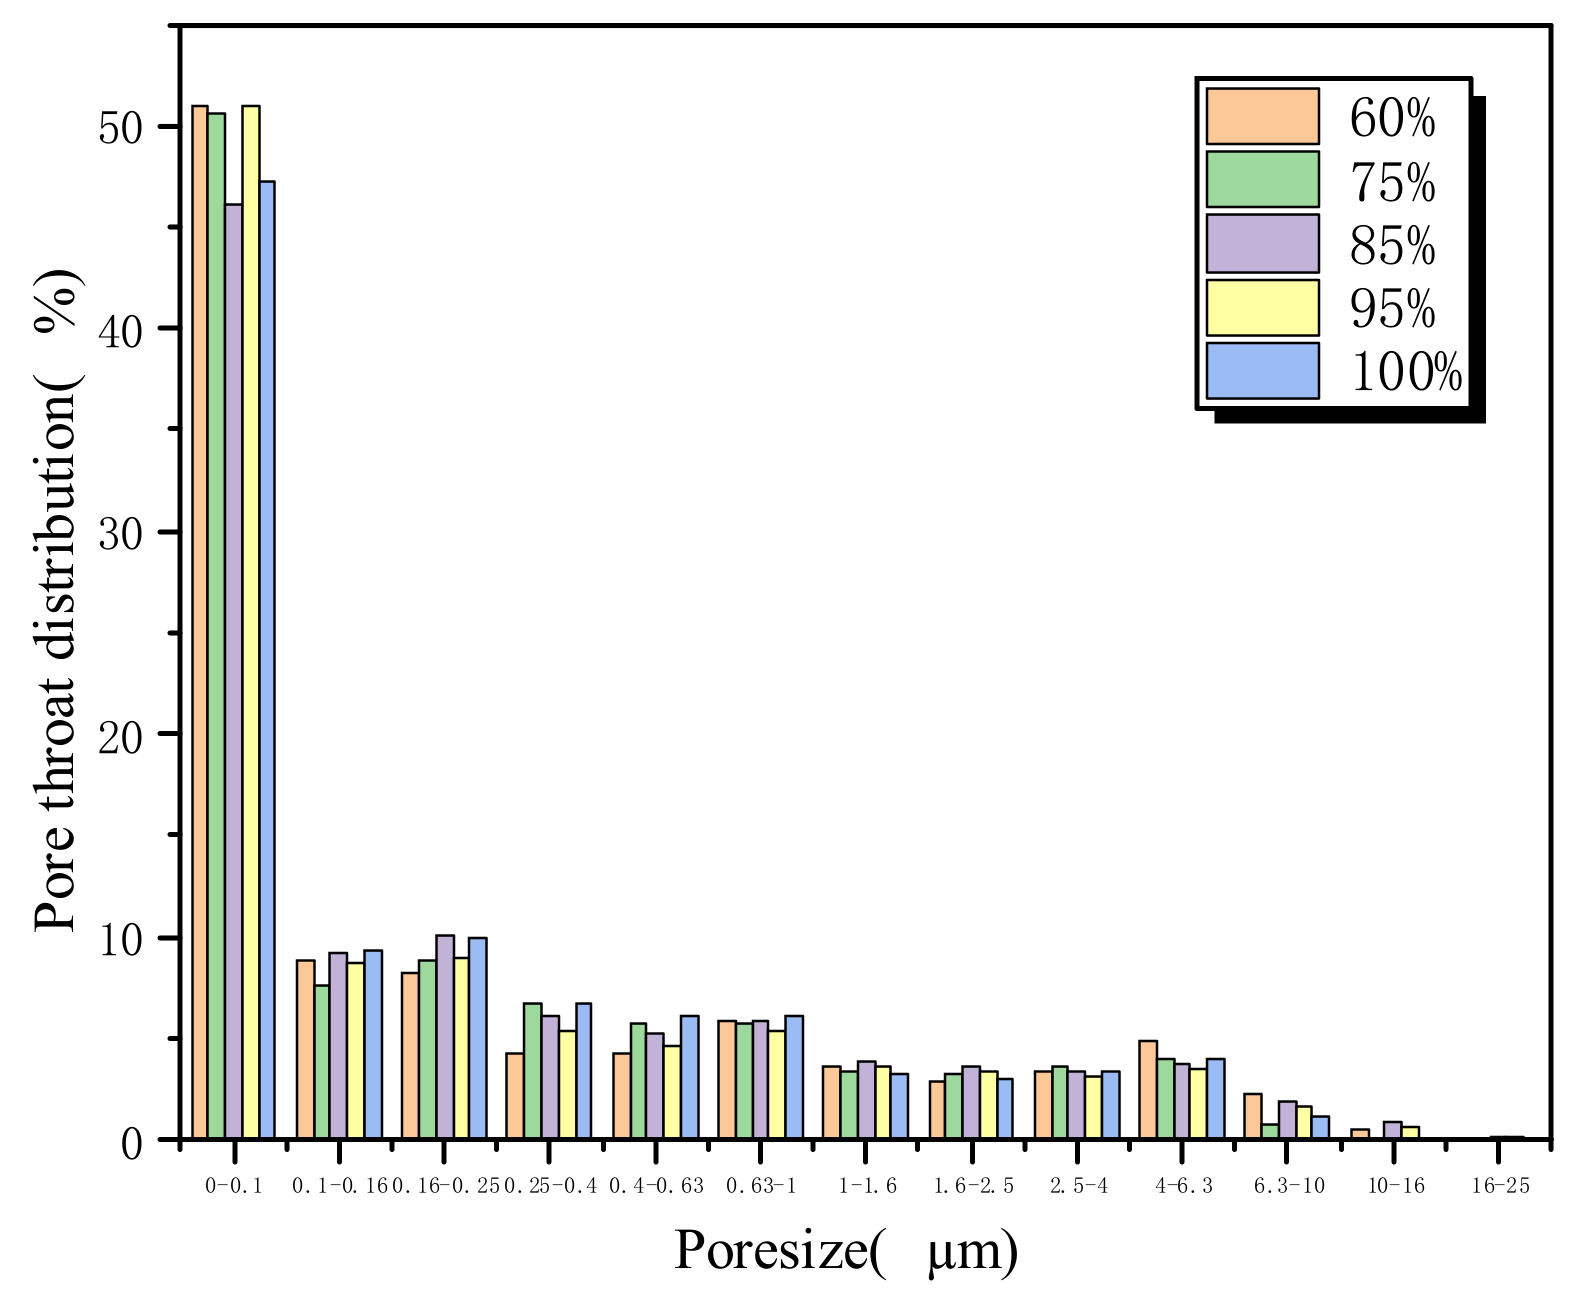
With the decrease in pore radius, the freezing temperature also decreases. Therefore, the freezing direction of sandstone is consistent with the decreasing direction of pore size. Unfrozen water in different pores is classified according to the pore classification standard proposed by previous researchers [
31] (
Table 4).
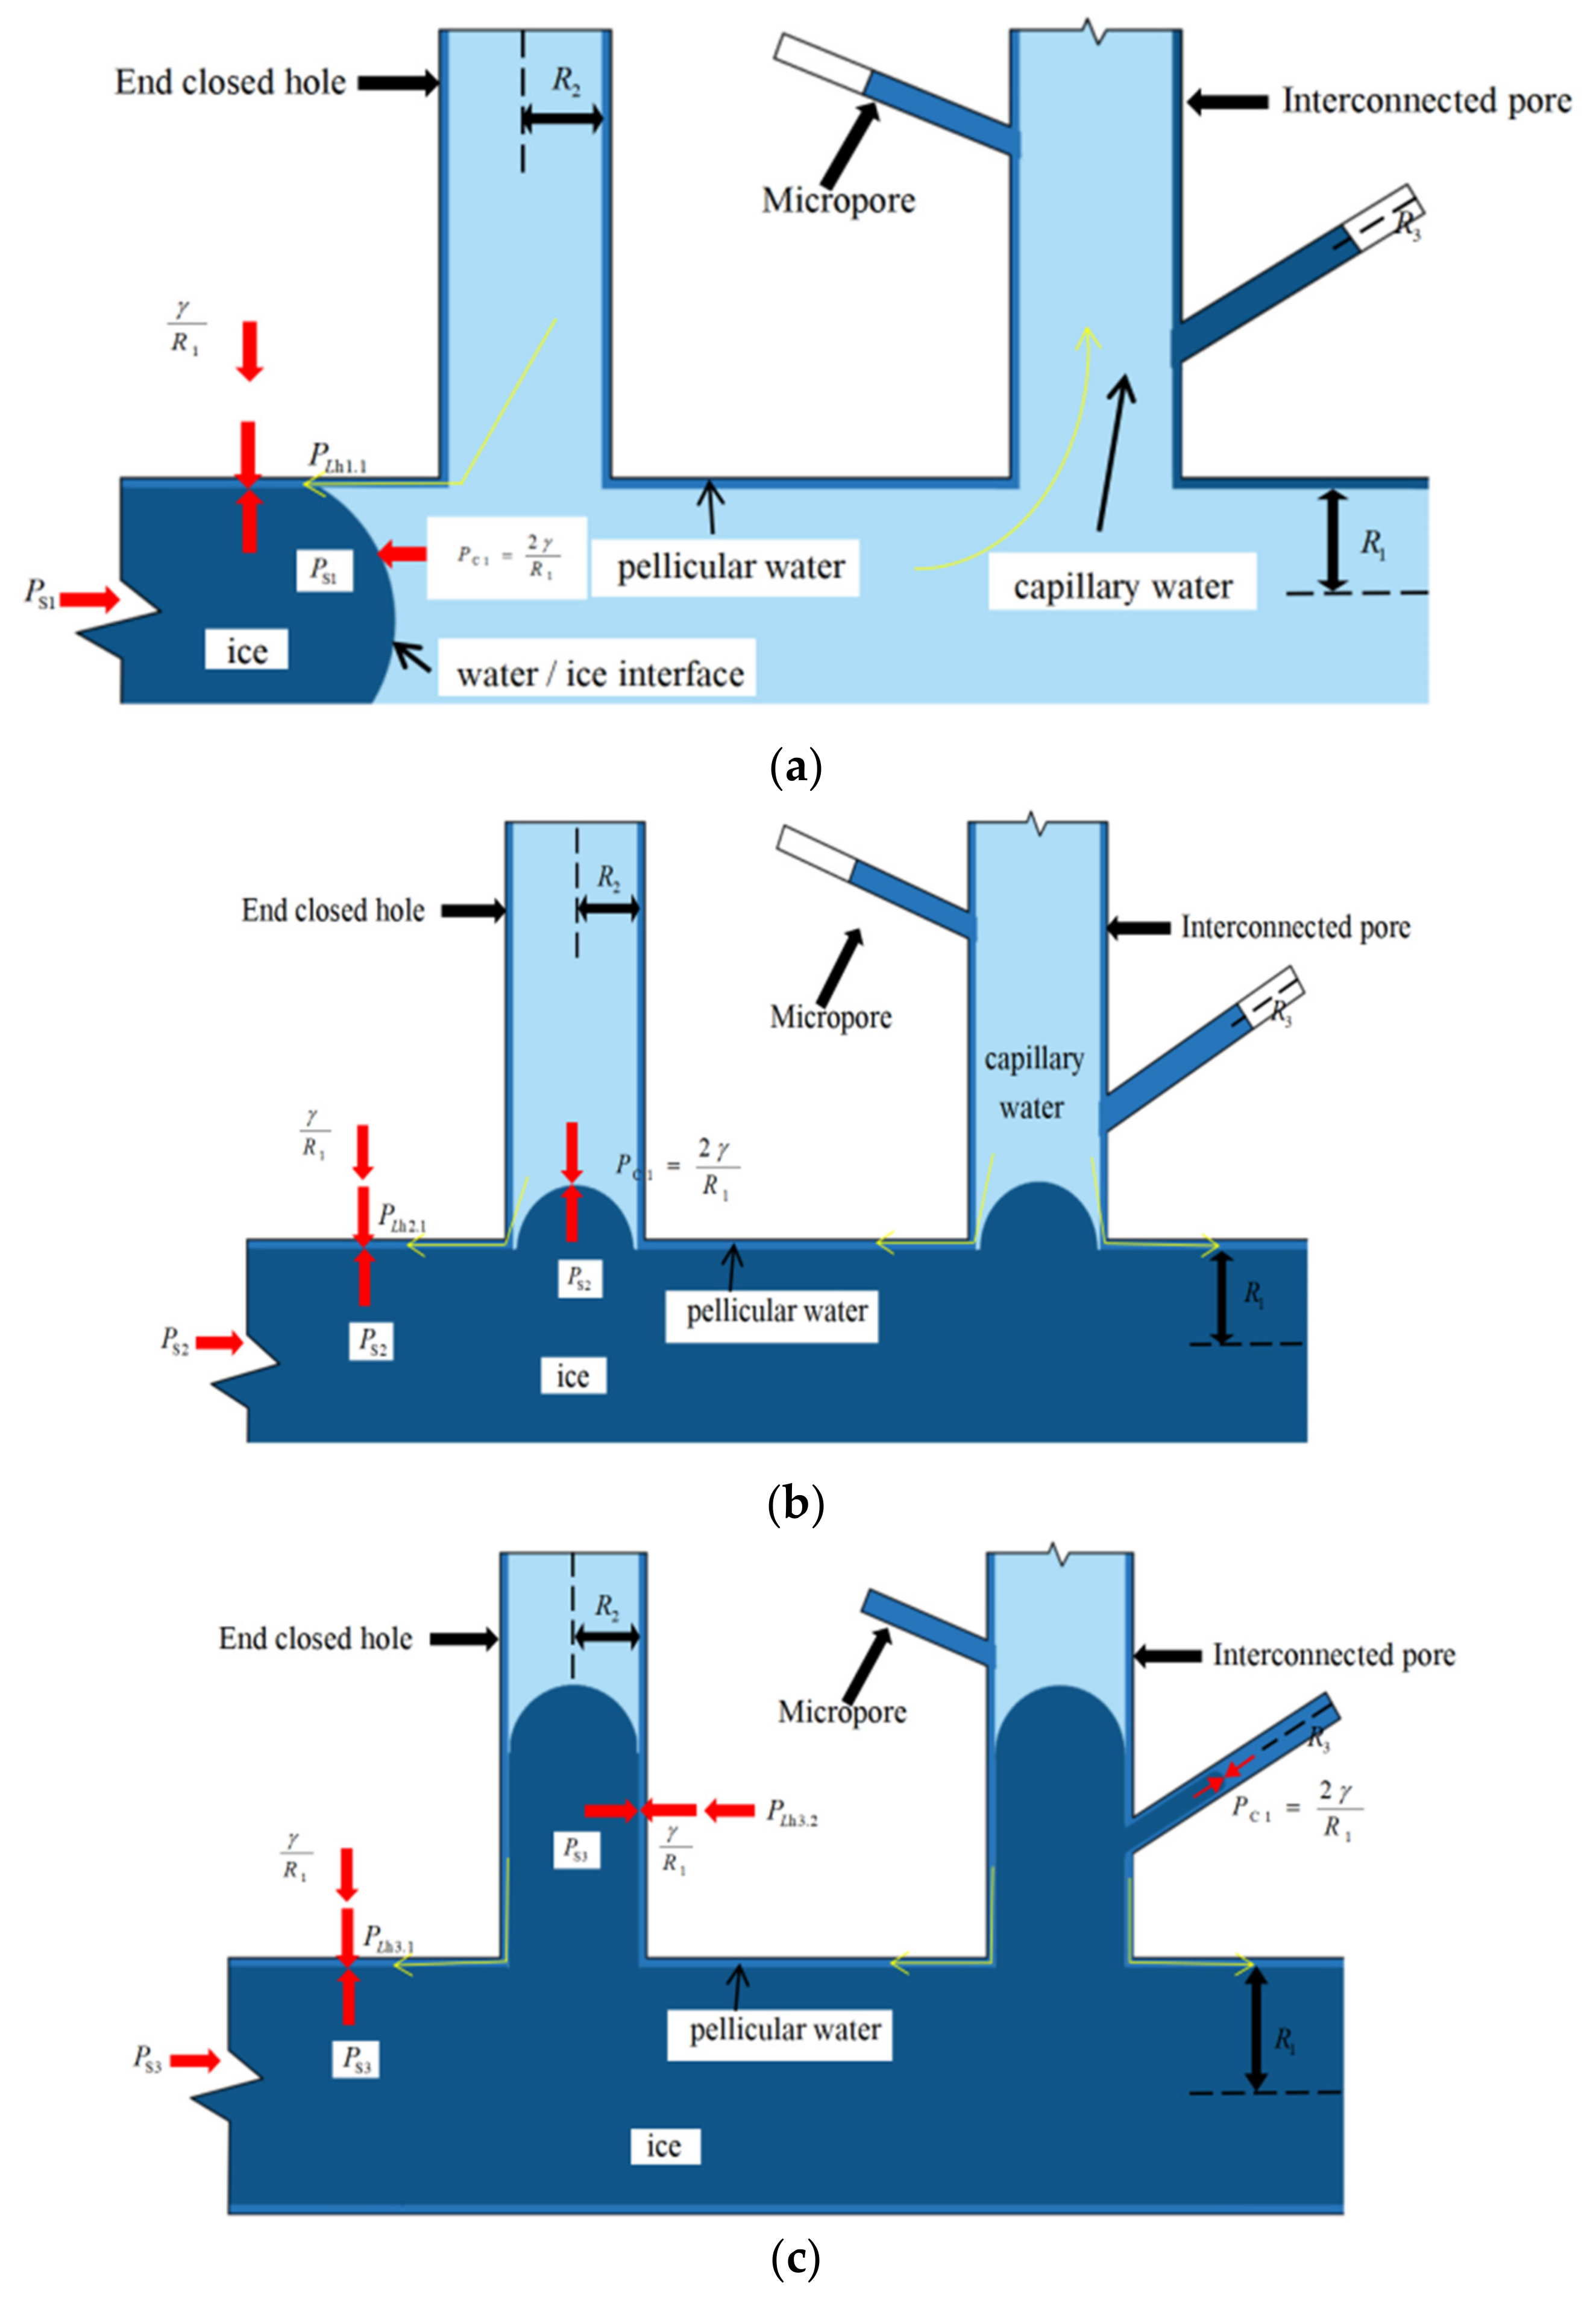
According to the theory of thin film water and capillary theory, the influence of pore radius on the migration of unfrozen water in the freezing process was explored, and the ‘main-branch’ pore structure with poor frost resistance was analyzed. The ‘main-branch’ pore structure is composed of main pores, secondary pores, and micropores. Due to the good connectivity between pores and the small resistance of water migration, the frost resistance is poor. Based on the freezing temperature of the main pore, secondary pore, and micropore, the capillary film moisture transfer unit model was established in turn according to the freezing sequence, as shown in
Figure 12.
It can be seen from Equation (11) that the freezing order is in the order of macropores, mesopores, and micropores, and the stress analysis is performed on the frozen state. The total suction is the source of hydraulic and gravitational acceleration and, in equilibrium, is
The relationship between total suction and hydraulic pressure is
- (1)
Macropore freezing
Assuming that the freezing temperature of the main hole is
, as shown in
Figure 12a, the theoretical ice pressure at this time is
According to capillary theory, capillary suction is
According to the freezing temperature equation of pore water, the freezing temperature is
According to the ice pressure, hydraulic, and interface force balance, the hydraulic pressure is the difference between the ice pressure and the interface pressure is
From Equation (13), the total suction is
At the initial stage of freezing, the ice pressure is greater than the hydraulic pressure; that is, the water–ice phase change speed is greater than the migration speed of capillary water and film water so that the unfrozen water will flow to other pores, causing a freezing overflow.
- (2)
Mesoporous freezing
When the temperature reaches
, as shown in
Figure 12b, according to the capillary theory, the capillary suction is
The hydraulic pressure of film water in macropores and mesopores is
From Equation (13), the total suction is
It can be seen from that the total suction of macropores is stronger than that of mesopores, so unfrozen water migrates from micropores and mesopores to macropores.
- (3)
Micropore freezing
When the temperature reaches
, as shown in
Figure 12c, according to the capillary theory, the capillary suction is
The hydraulic pressure of thin film water in macropores, mesopores, and micropores is:
From Equation (13), the total suction is:
It can be seen from that a macropore has the strongest adsorption capacity. The larger the pore diameter, the smaller the membrane water pressure. Therefore, it continues to drive the membrane water in mesopores and micropores to migrate to macropores. To sum up, the migration direction of capillary film water during freezing is micropore → mesopore → macropore.
4.2. Analysis of Crack Propagation Mechanism
We define the crack in the rock as a “coin” shape; that is, it is circular in plain view and elliptical in side view, with a radius of
, and has a very small opening. From the maximum value
in the center to 0 at the edge, it is assumed that the crack spacings are wide enough, and they grow independently of each other. The growth of all cracks is in the crack plane, which is completely caused by uniform internal ice pressure; that is, all crack growth is Type I. Under these conditions, Sneddon and Lowengrub [
32] believed that crack growth in brittle elastic solids was controlled by the magnitude of stress intensity factors
.
The film water in the freezing trunk hole is subjected to the maximum hydraulic pressure and total suction. The total suction will drive the water to move towards the freezing main hole continuously. Based on the capillary theory, the increase in hydraulic pressure will also lead to an increase in stress intensity factor, namely:
When
exceeds the ‘fracture toughness’ value
of the material, the crack propagates unstably at a speed close to the compressive elastic wave. When
, the crack propagation occurs slowly and stably. Segall [
33] believed that when
dropped below a critical value
, crack propagation should stop. There are many factors affecting the crack growth rate, such as temperature, pressure, and chemical environment. Considering water ice as a pure medium, Segall proposed an empirical formula for the crack growth rate:
where
for crack propagation speed,
and
for material properties.
When the stress intensity factor is greater than the stress corrosion limit value K⁎, the pore ice will overcome the bondage of the pipe wall, crack, and expand at the weak points at both ends of the main hole, eventually leading to the destruction of the pore structure of the main hole and the increase in the fracture surface.
In the initial stage of freezing, the temperature gradient increases with the decrease in the radius of the rock sample cross-section; that is, the initial freezing process occurs on the rock surface, and therefore the unfrozen water in the rock will continue to migrate under the effect of the temperature gradient. With the intensification of the freezing process, the expansion of the frozen area and the continuous growth of ice would lead to the occurrence of freezing damage. At this time, the freezing environment meets the fractional ice theory in rock mass established by Walder et al. [
34].
Gilpin [
35] learned from the generalized Darcy’s law and the conservation of frozen water mass that the volume change of ice during the water/ice phase transition is
If the fissure volume expands, the free water in the rock will migrate to the fissure under the combined action of gravity, capillary force, and membrane force, and the ice pressure will decrease rapidly. The change of water mass caused by the water–ice phase change in the pore is defined as
By substituting Equation (35) into Equation (36), it can get:
Under the action of pressure, temperature, gravity, and other migration forces, the internal unfrozen water always migrates to the external frozen area so that the external pores will eventually be saturated. It is assumed that the pores are ellipsoidal, and the volume of pores is
. Therefore, another manifestation of water quality change in pores is:
It can be known from Equations (37) and (38) that the change rate of the fissure is
The formula of freezing temperature changing with pore size is
In the formula,
is the interfacial tension of water/ice. Substituting Equation (40) into Equation (39) yields:
where
are pore parameters. Because
and
represent the size of the crack, Formula (41) is simplified by substituting
R for
and
:
Because the hydraulic
is
Taking Equation (43) into Equation (42), the crack propagation rate is
According to Formula (44), the crack propagation rate is positively correlated with the theoretical suction. During the freezing process, the theoretical suction and the theoretical ice pressure increase with the decrease in temperature, which accelerates crack propagation. According to the division of macropores, mesopores, and micropores, the crack propagation rate is Vmacropore > Vmesopore > Vmicropore.
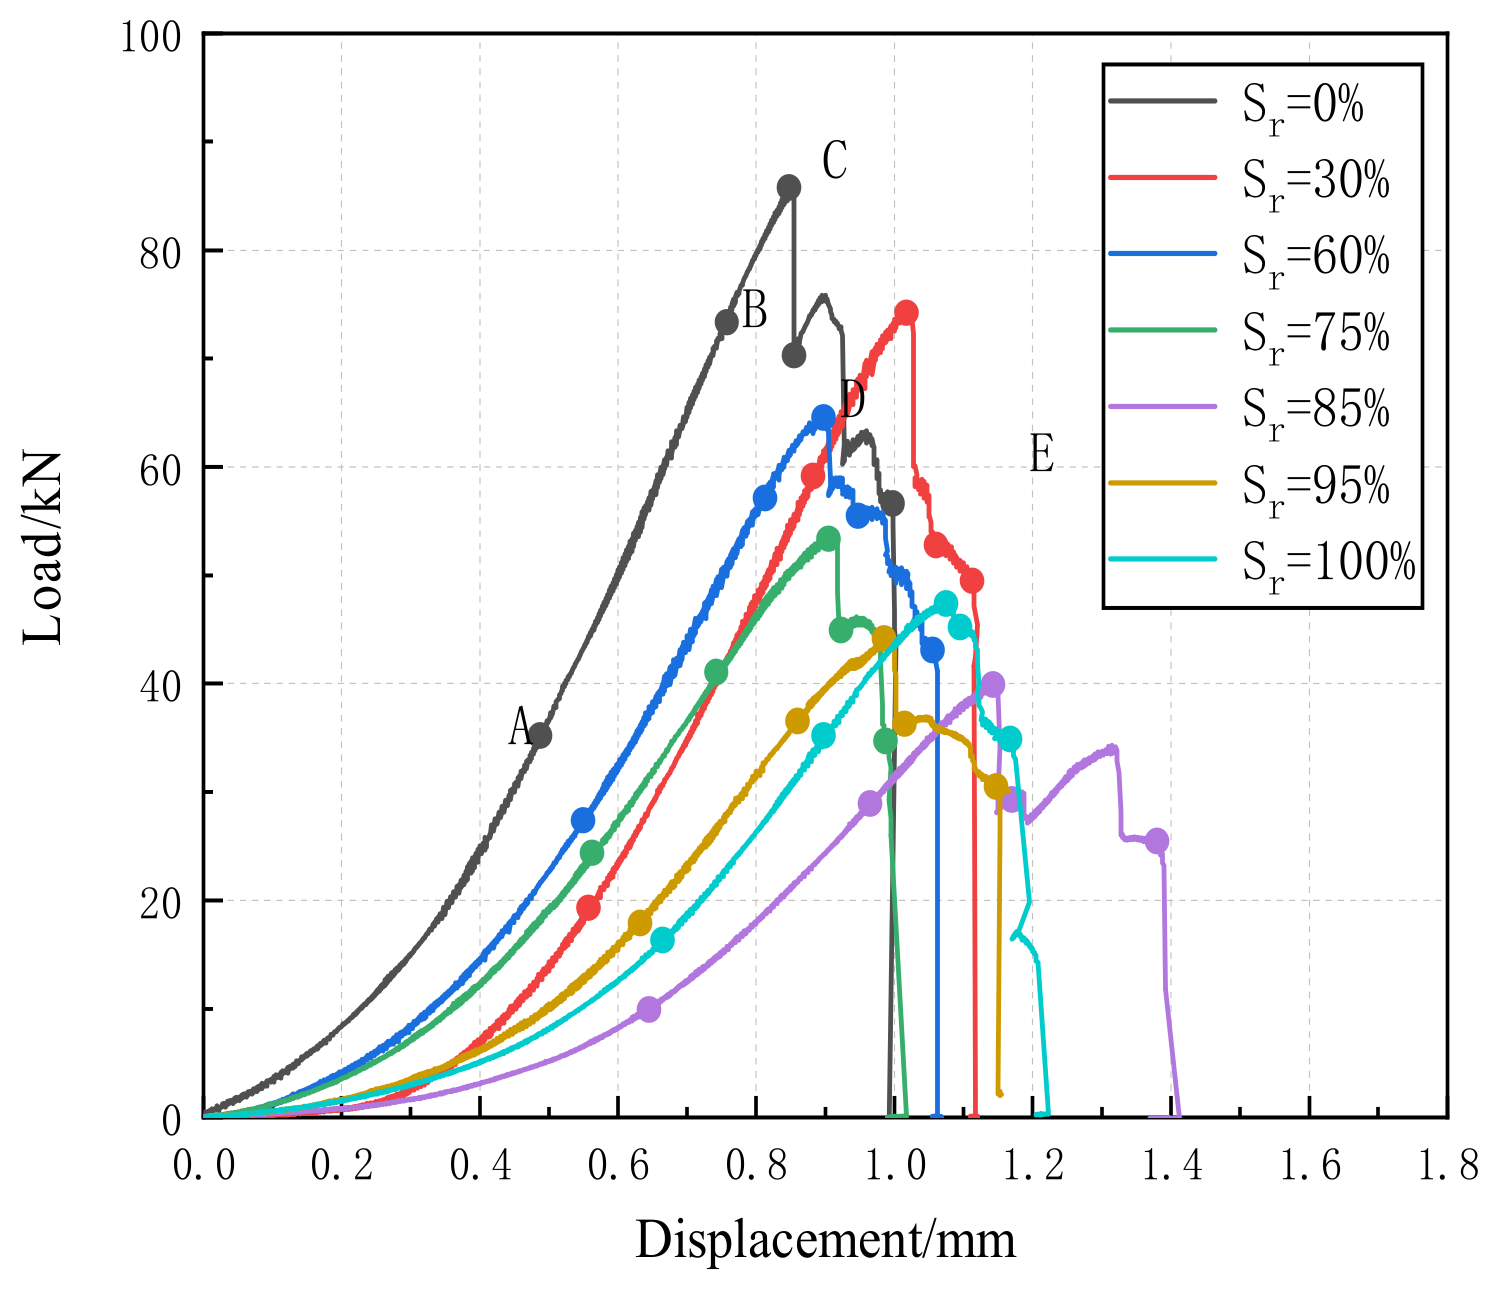
4.3. Model Validation
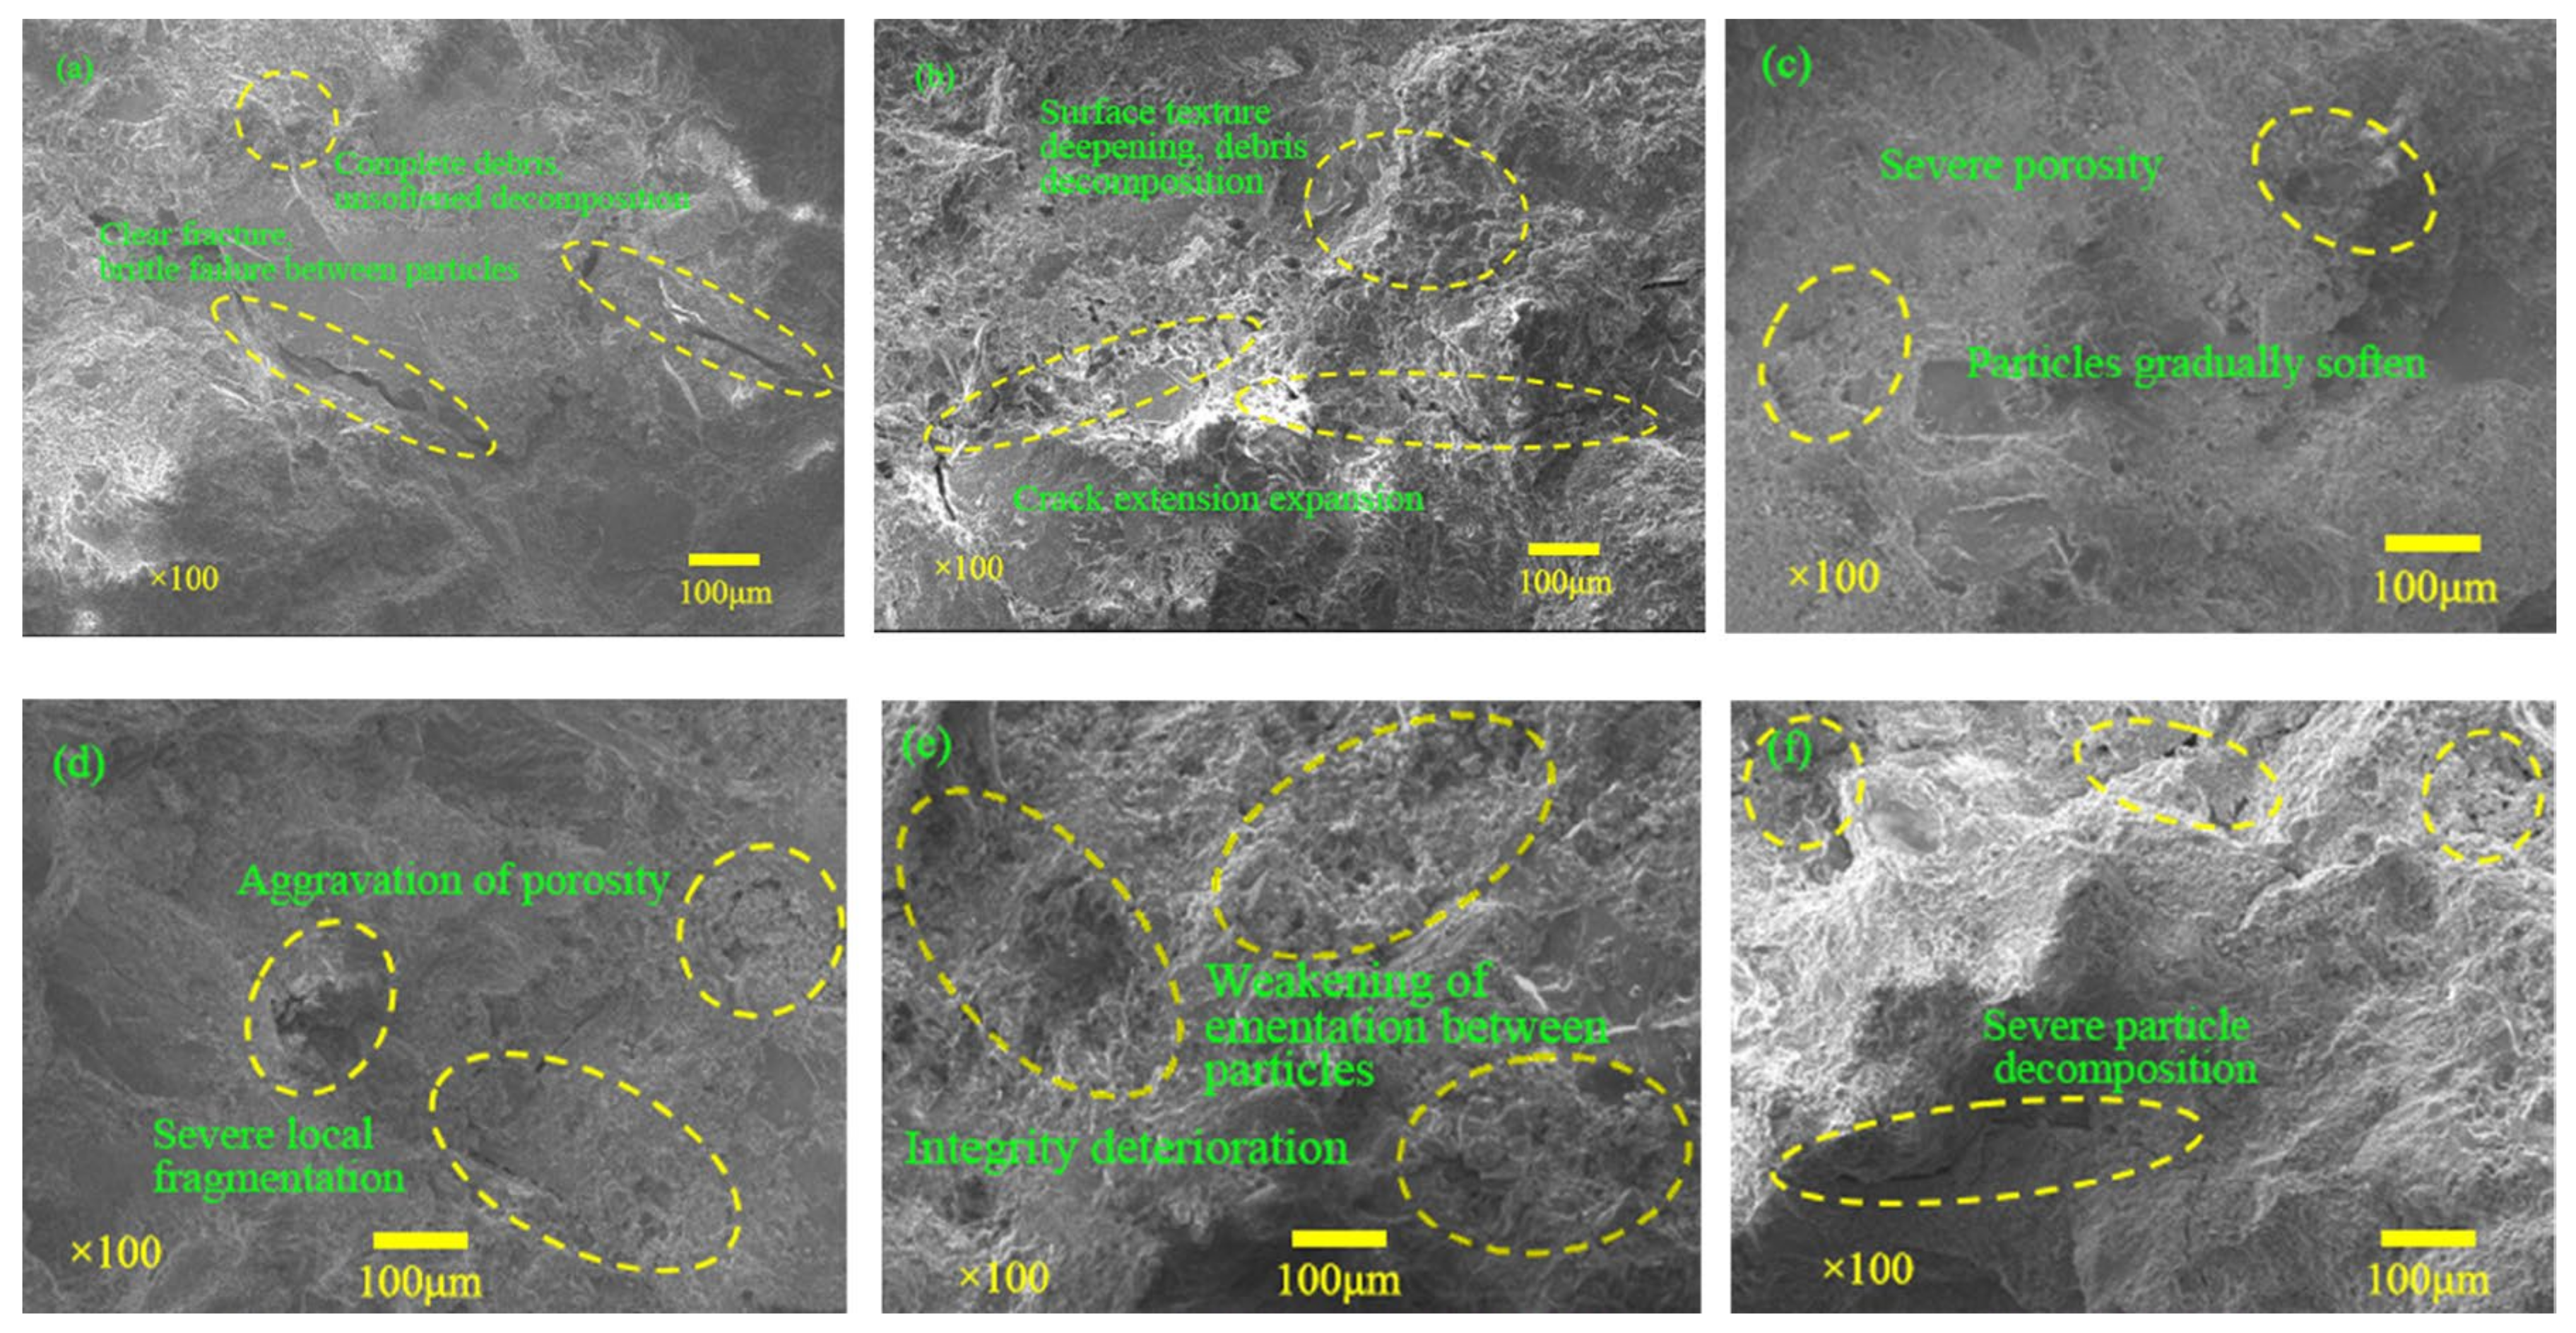
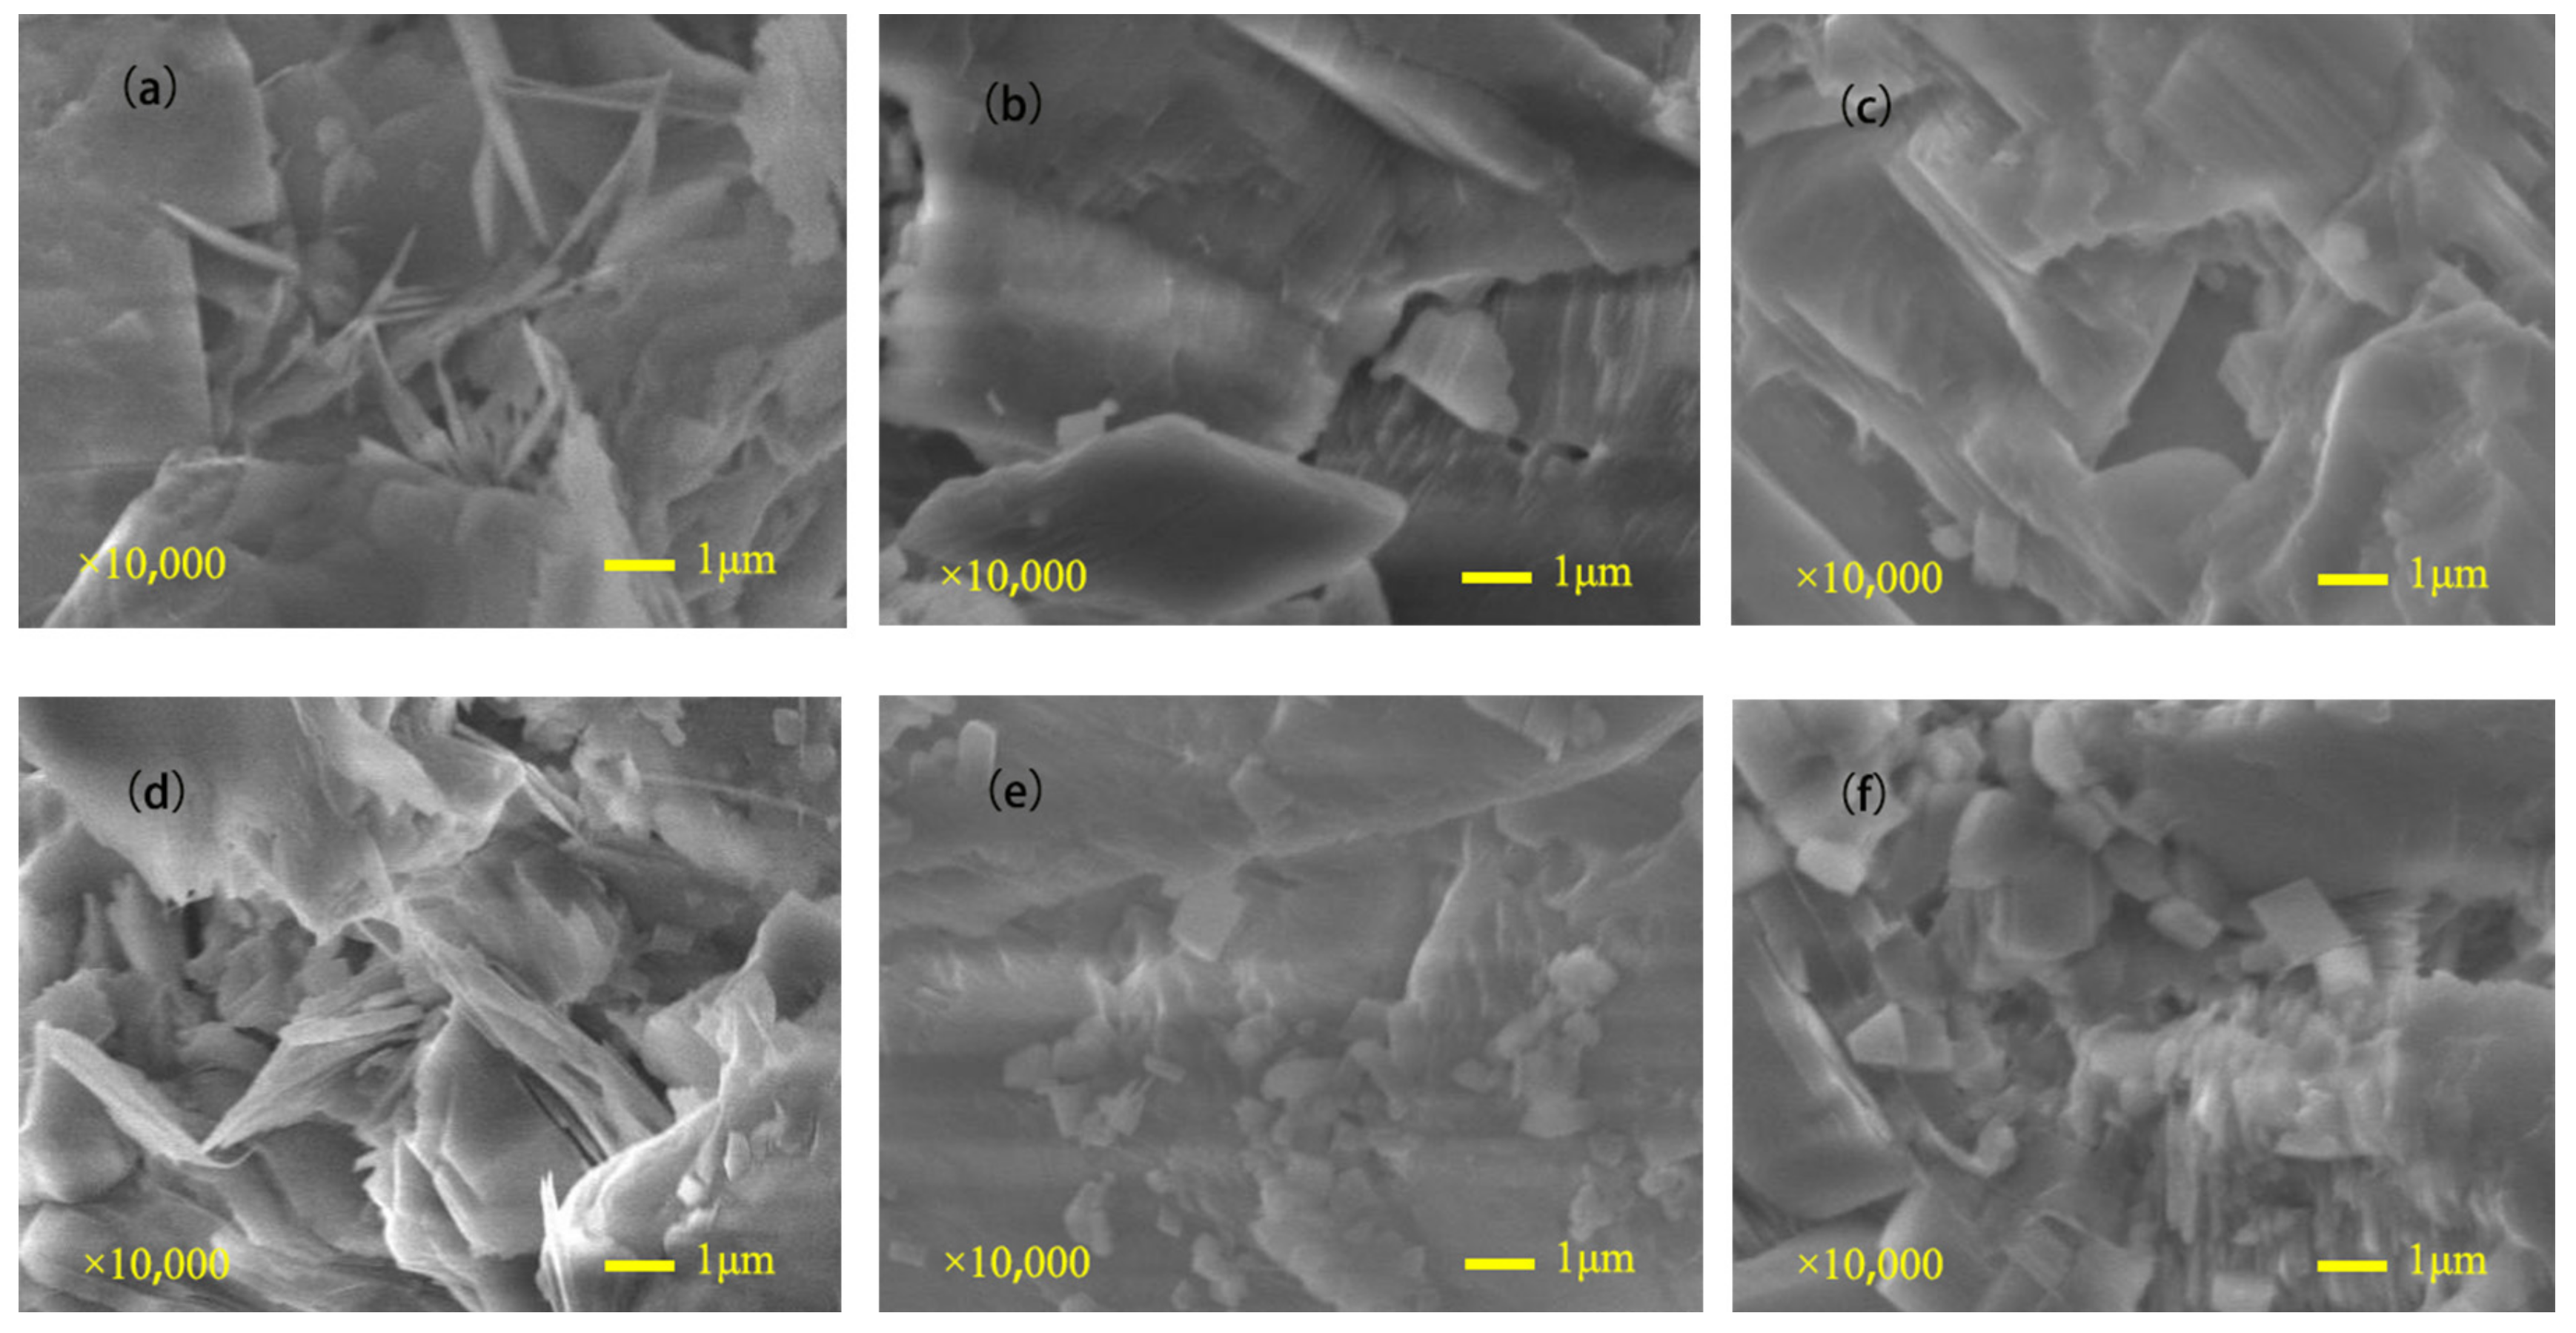
The water in the rock sample is frozen into ice during the freezing process, and the volume expansion exerts pressure on the pore wall, leading to the growth of the pore structure and the formation of new pores in the rock.
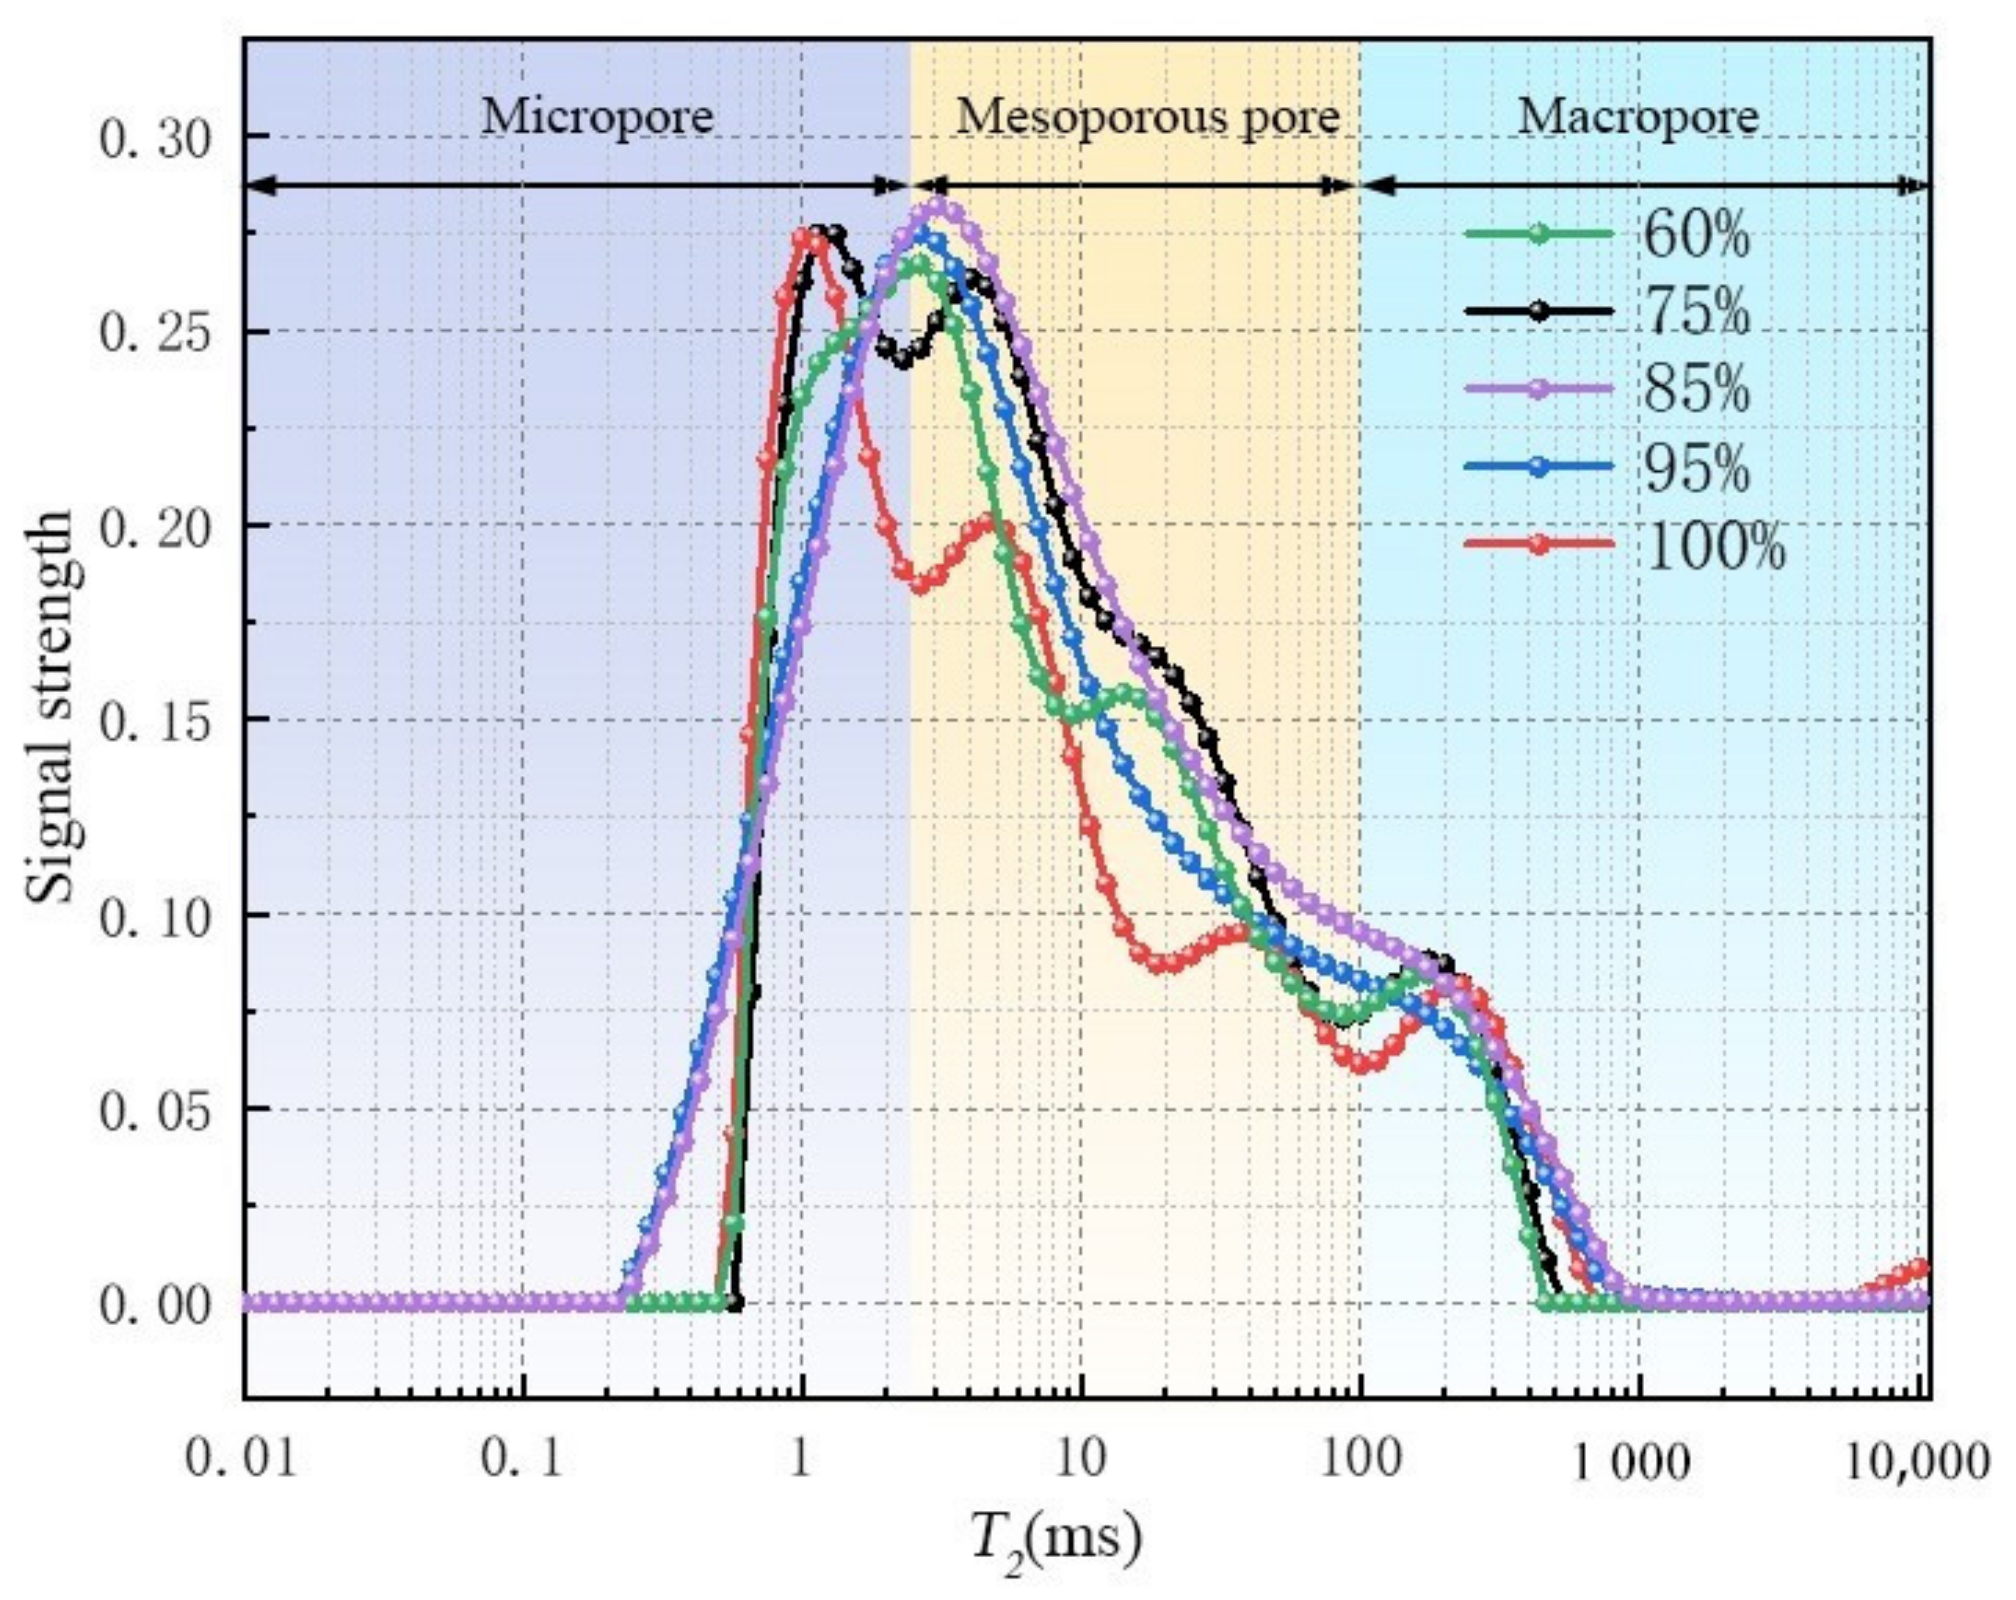
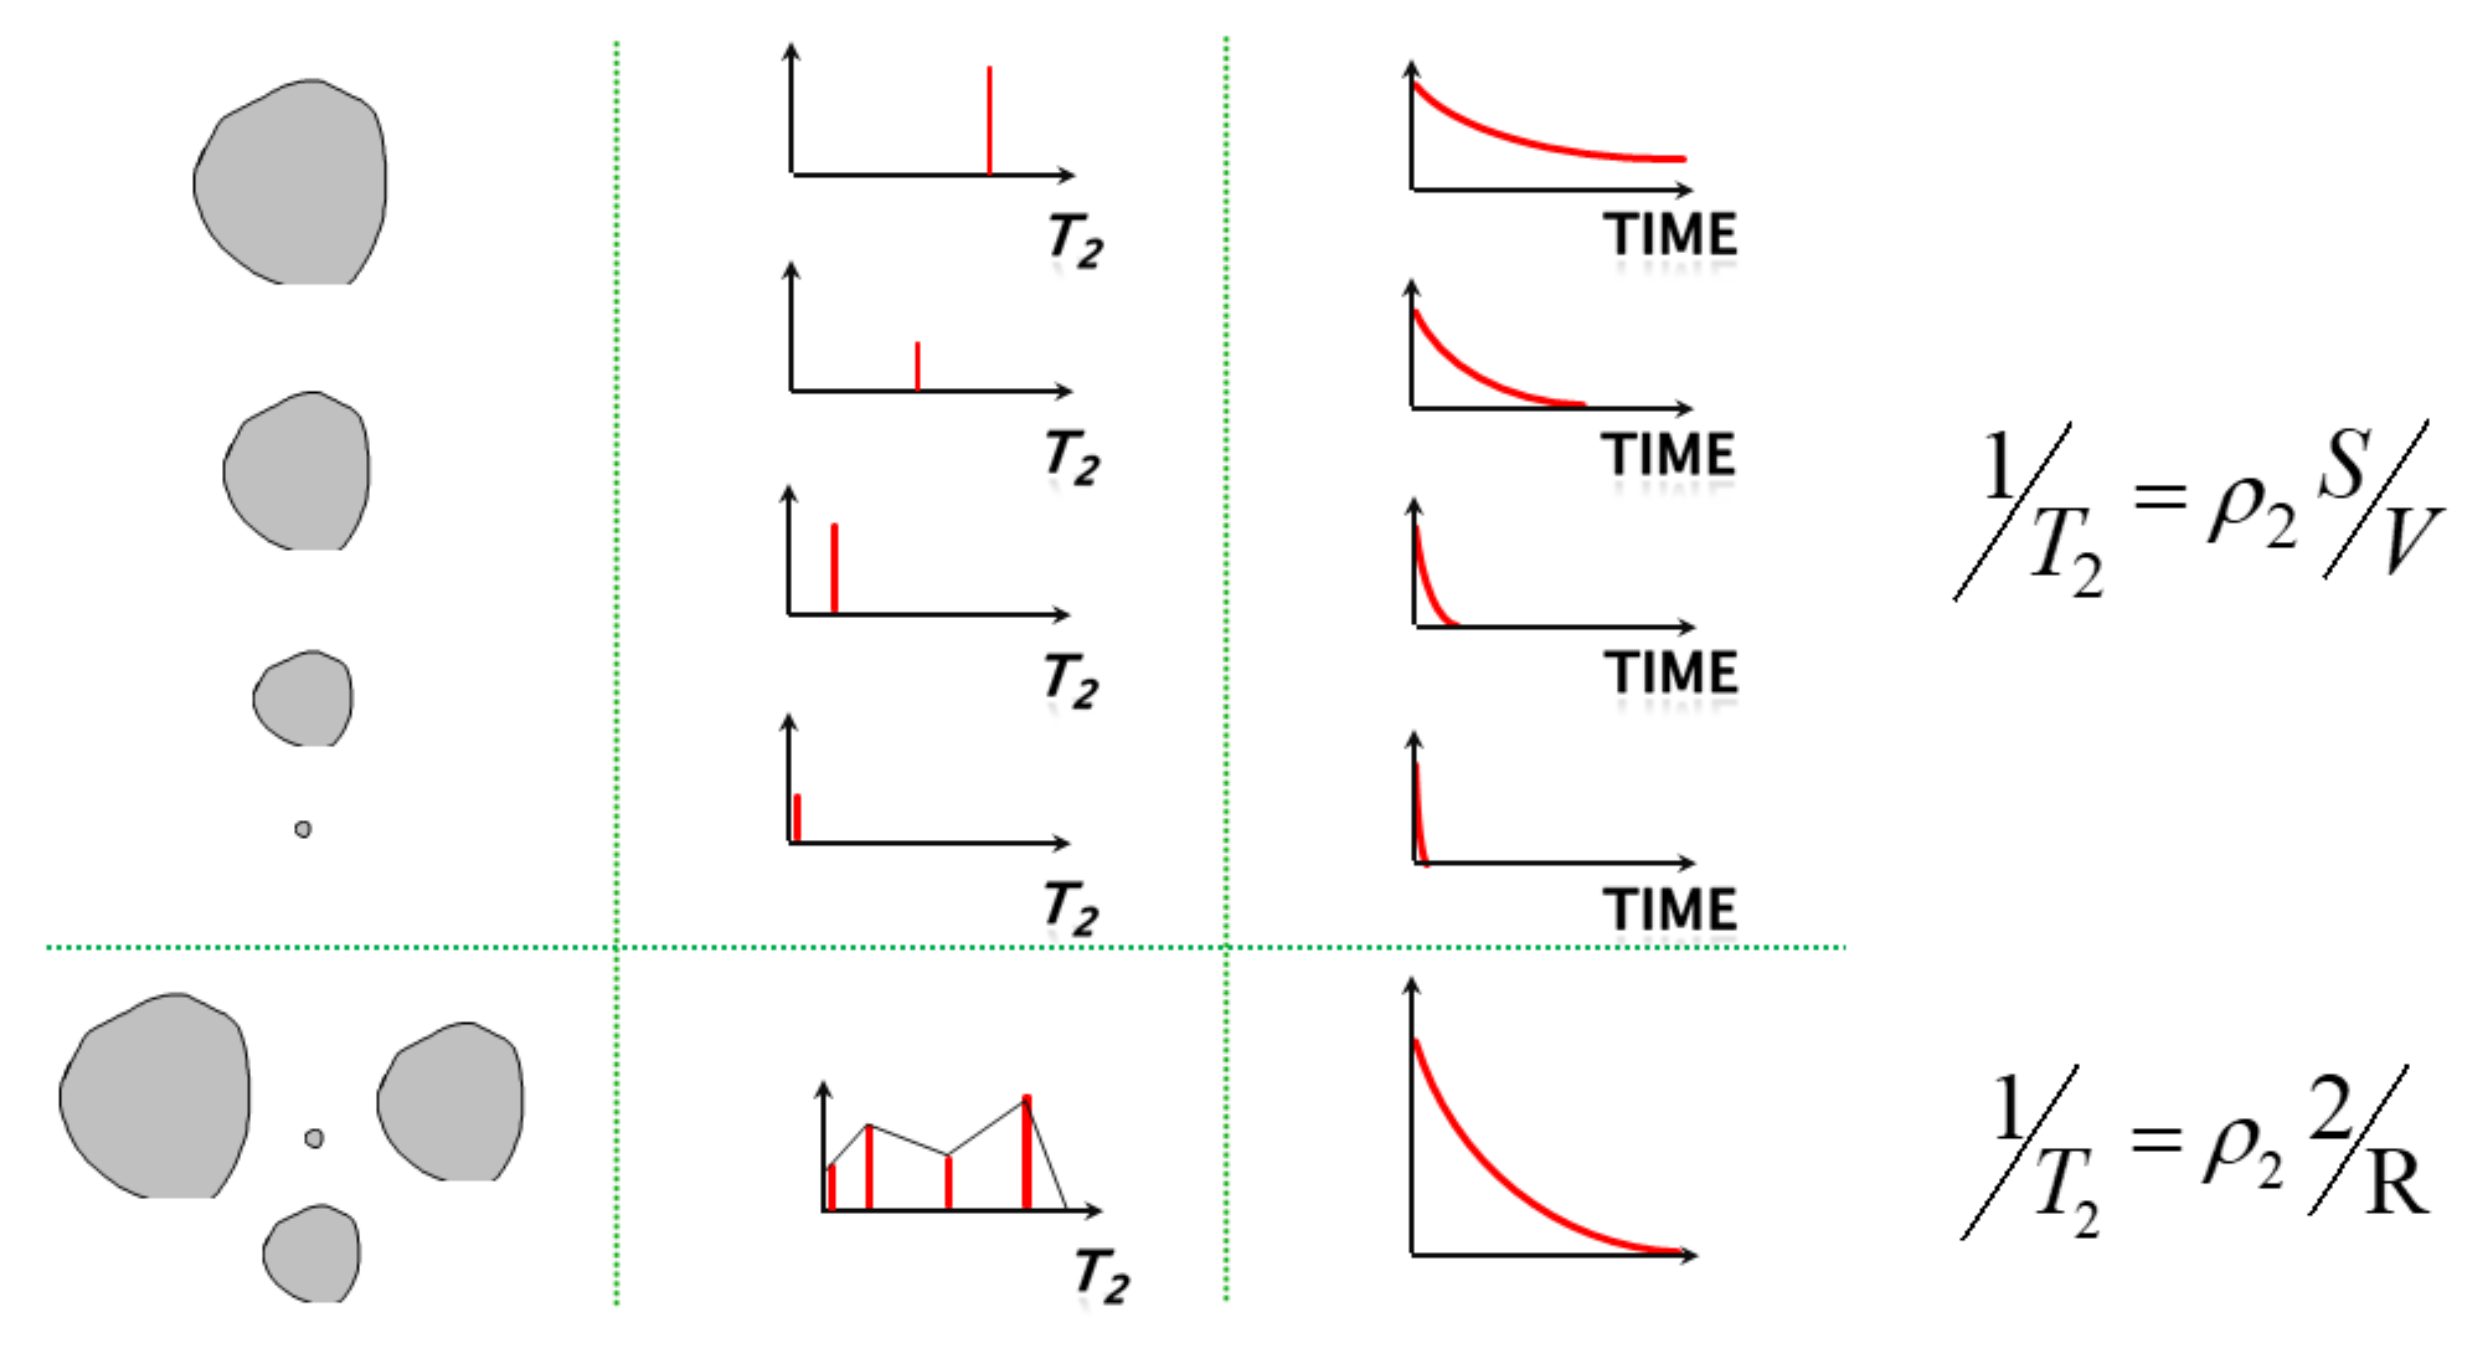
Figure 13 shows the relaxation time decay curve of porous media.
The migration of water molecules during the freezing process is studied based on the analysis of porosity,
T2 distribution, and NMR images. The transverse relaxation time
T2 of pore fluid is proportional to the pore size. The peak value and area of
T2 distribution represent the concentration degree and the number of pores with different sizes. In order to ensure the reference of the test, a group of saturated sandstones was selected and subjected to freezing tests. The samples were tested after 0 h, 4 h, 8 h, and 12 h, respectively. After the freezing test, nuclear magnetic resonance detection was performed to analyze the
T2 distribution. The relationship between the transverse relaxation time
T2 of nuclear magnetic resonance and the pore diameter can be expressed by the formula:
where
T2 is the transverse relaxation time (
),
is the transverse surface relaxation intensity factor, and
S and
V are the surface area (cm
2) and volume (cm
3) of the pores, respectively.
Yao [
36] gave the corresponding relationship between transverse relaxation time
T2, pore throat diameter D, and pore water type according to the mercury injection test and low field-nuclear magnetic resonance test, as shown in
Table 5.
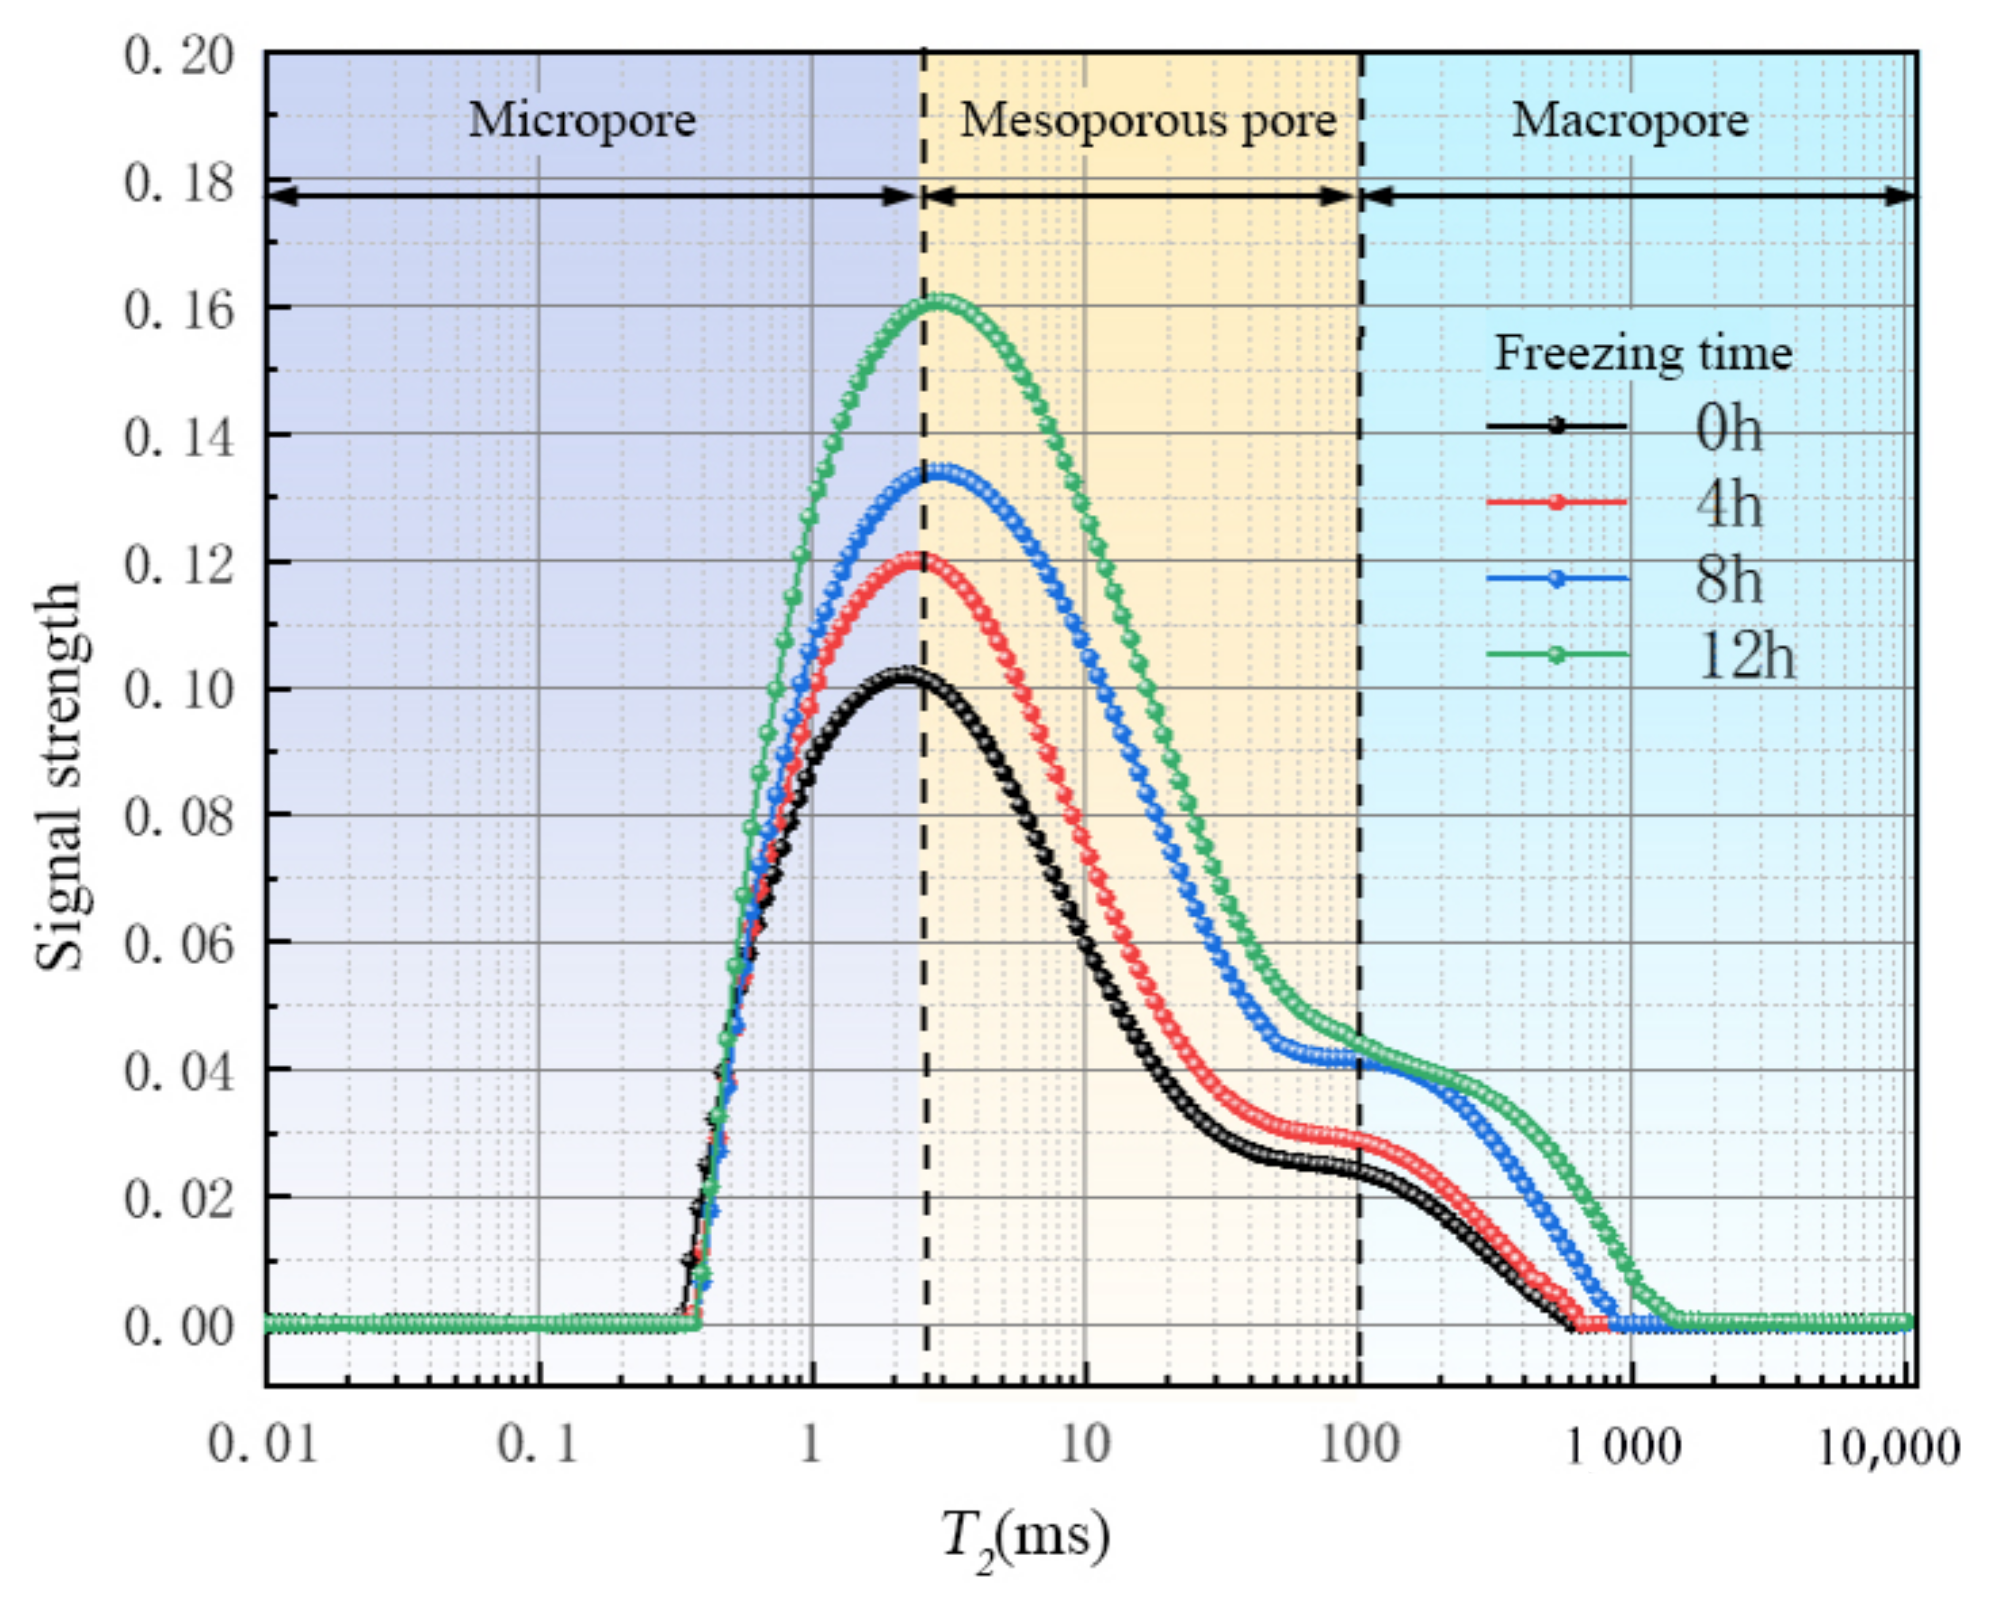
Figure 14 shows the pore size distribution of saturated sandstone during freezing. Before freezing, there are only two peaks in the
T2 distribution of sandstone, and
T2 within the main peak range is less than 2.5 ms, so there is film water in the pores. The
T2 in the secondary peak range is in the range of 2.5~100 ms, so the pore has mainly capillary water.
T2 > 100 ms belongs to the macropore, and the pore has mainly free water. According to the above pore classification standards, sandstone can be divided into three types of pores: trunk pore, secondary pore, and micropore. In combination with
Figure 11, the pores in the sandstone are of the “main branch–side branch” pore structure with poor frost resistance, so the freeze–thaw process is more destructive to the siltstone.
It can be found that the porosity and pore diameter of the frozen samples are larger than those of the unfrozen samples. In general, the first T2 peak area of each sample is the largest, which means that most of the pores in the samples are micropores. It can also be seen that after 4 h, 8 h, and 12 h of freezing treatment, the first T2 peaks of the samples move toward the right side as compared to that of an unfrozen sample (0 h), and the peak area increases as the extension of freezing time, which suggests that the freezing process produces more new pores in these samples. This is also a clear indicator of more severe damage as the extension of freezing time. Macropores have a tendency to expand further, and therefore the maximum relaxation time continues to increase. It is shown that the membrane water in the micropores moves continuously to the freezing secondary pores under freezing conditions, leading to an increase in the secondary pore diameter and the increase in the maximum pore diameter. The water migration path is microporous membrane water → mesoporous capillary water → macroporous free water, which is completely consistent with the migration direction and path of the water migration unit model.
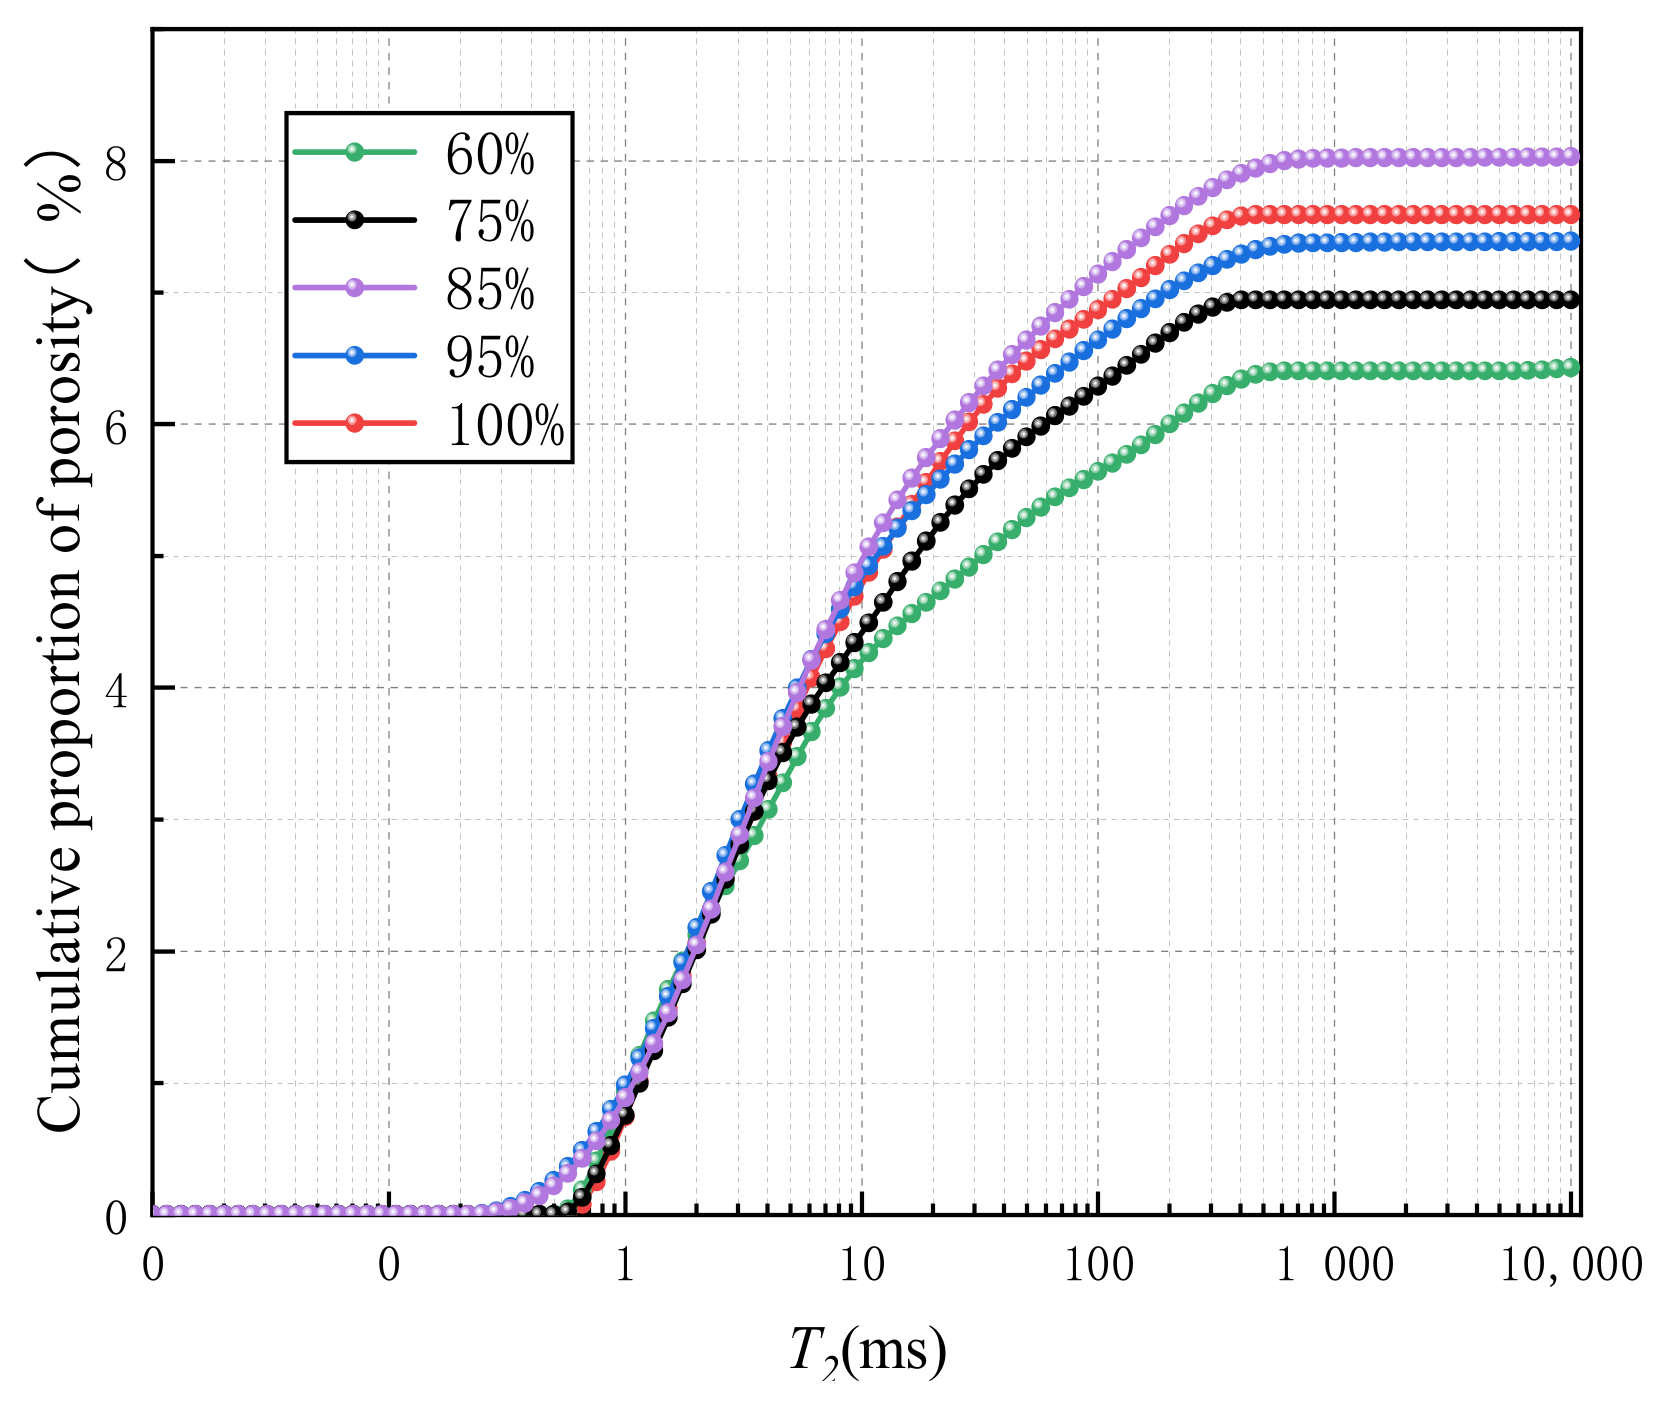
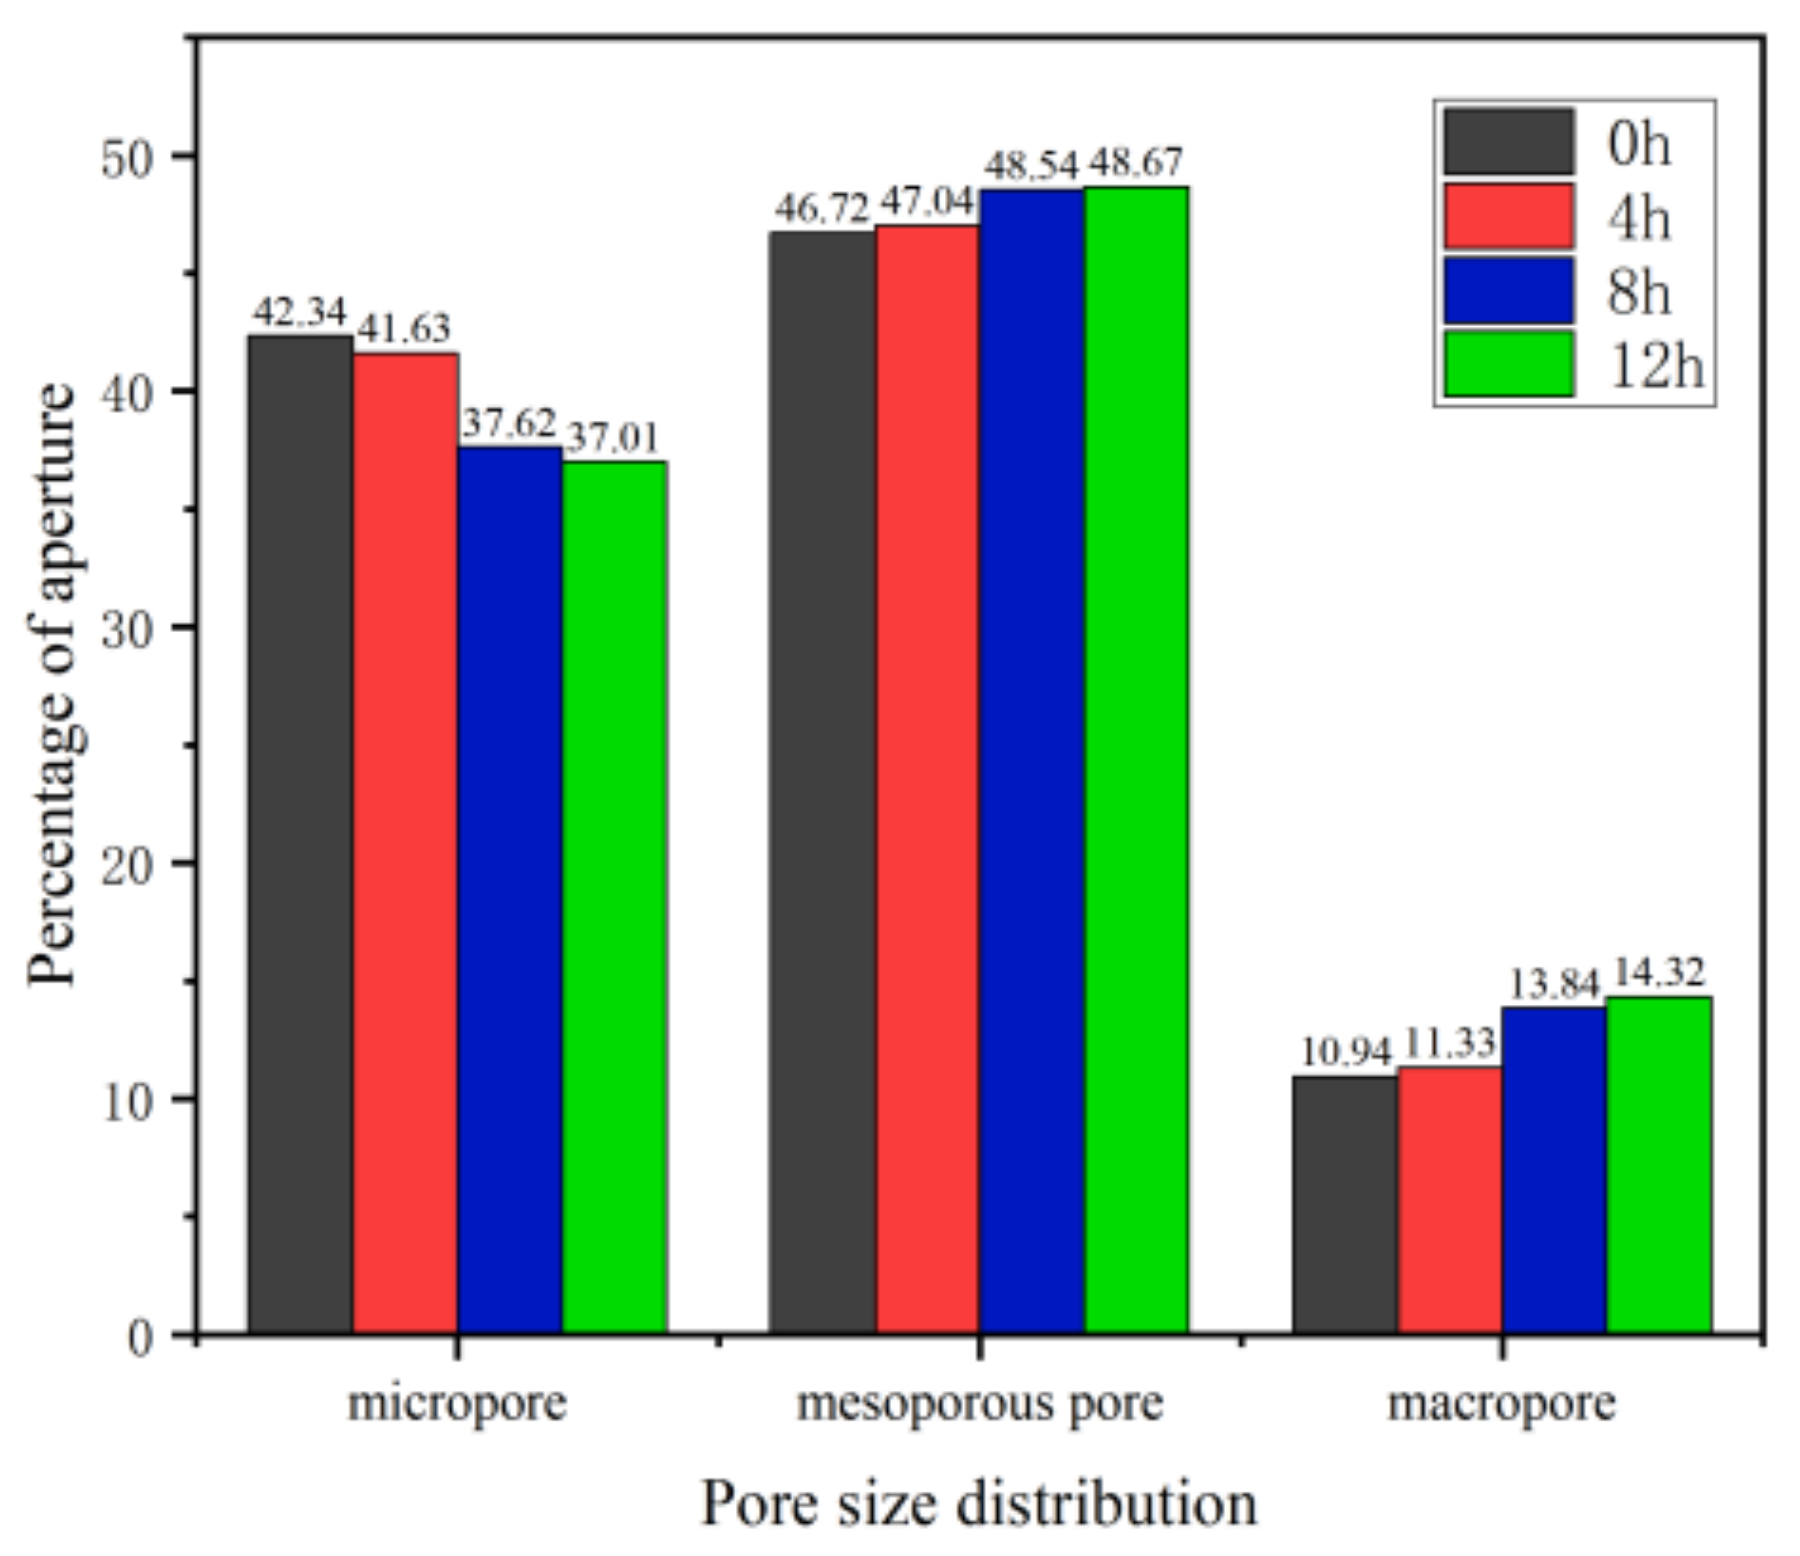
Figure 15 shows the pore size distribution of saturated sandstone during freezing. The proportion of pore distribution under different freezing times can be clearly seen. Then the change rate of the
T2 spectral area of sandstone under different freezing times is calculated, as shown in
Table 6. With the increase in freezing time, the proportion of pore size change to its internal structure always shows the rule that the growth rate of macropores is greater than that of mesopores and larger than that of small pores. The above results are highly consistent with the fracture propagation model.


