
Temperature Experiment and Parameter Optimization of Cemented Carbide Tool in Milling 508III Steel

Abstract
:1. Introduction
2. Temperature Experiment and FE Analysis of Milling 508III Steel
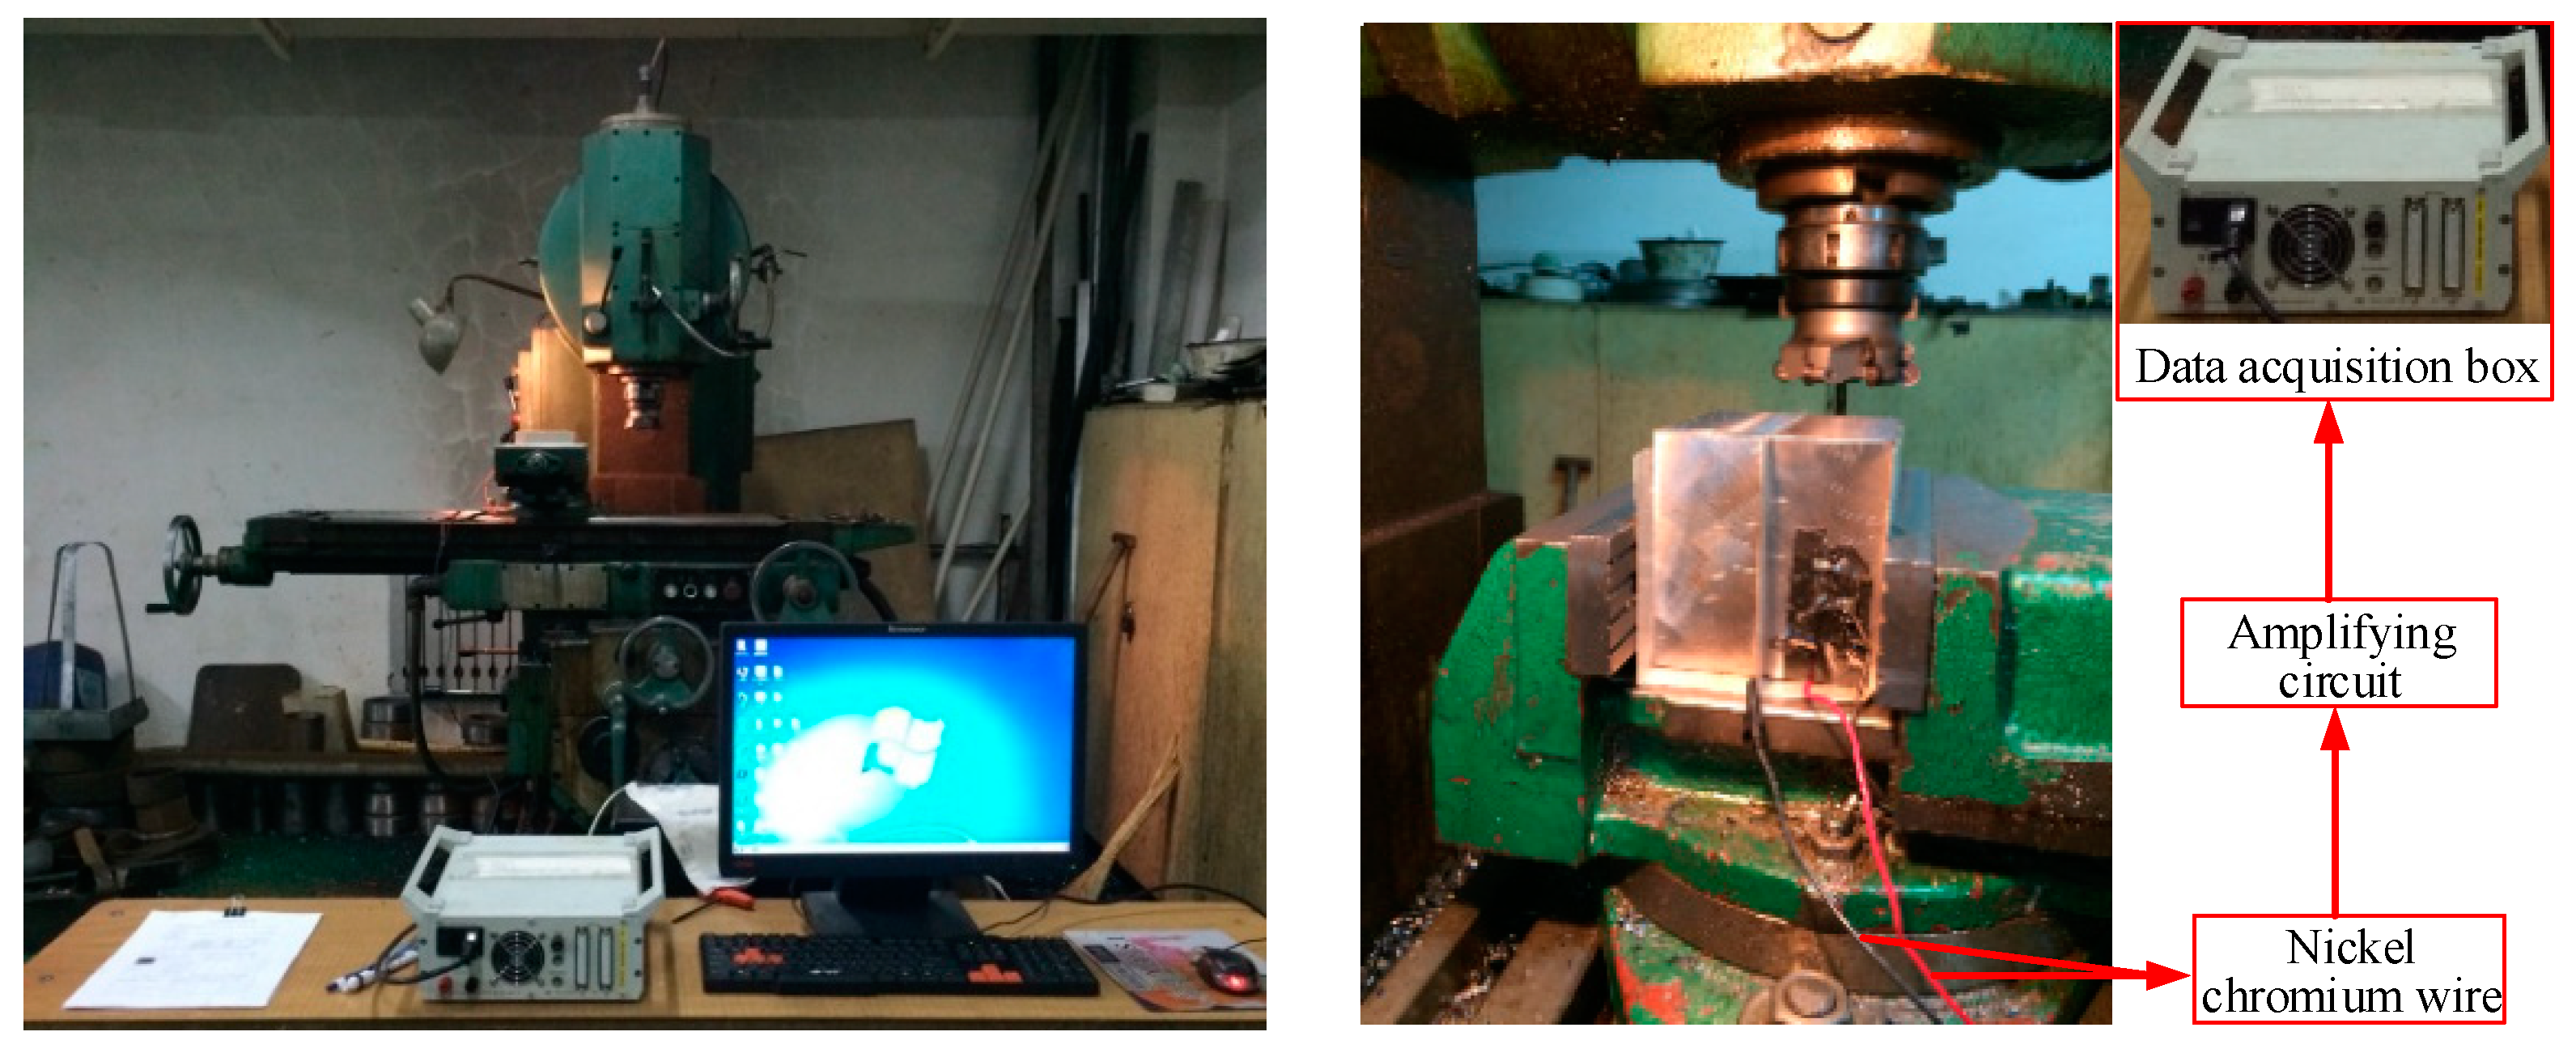
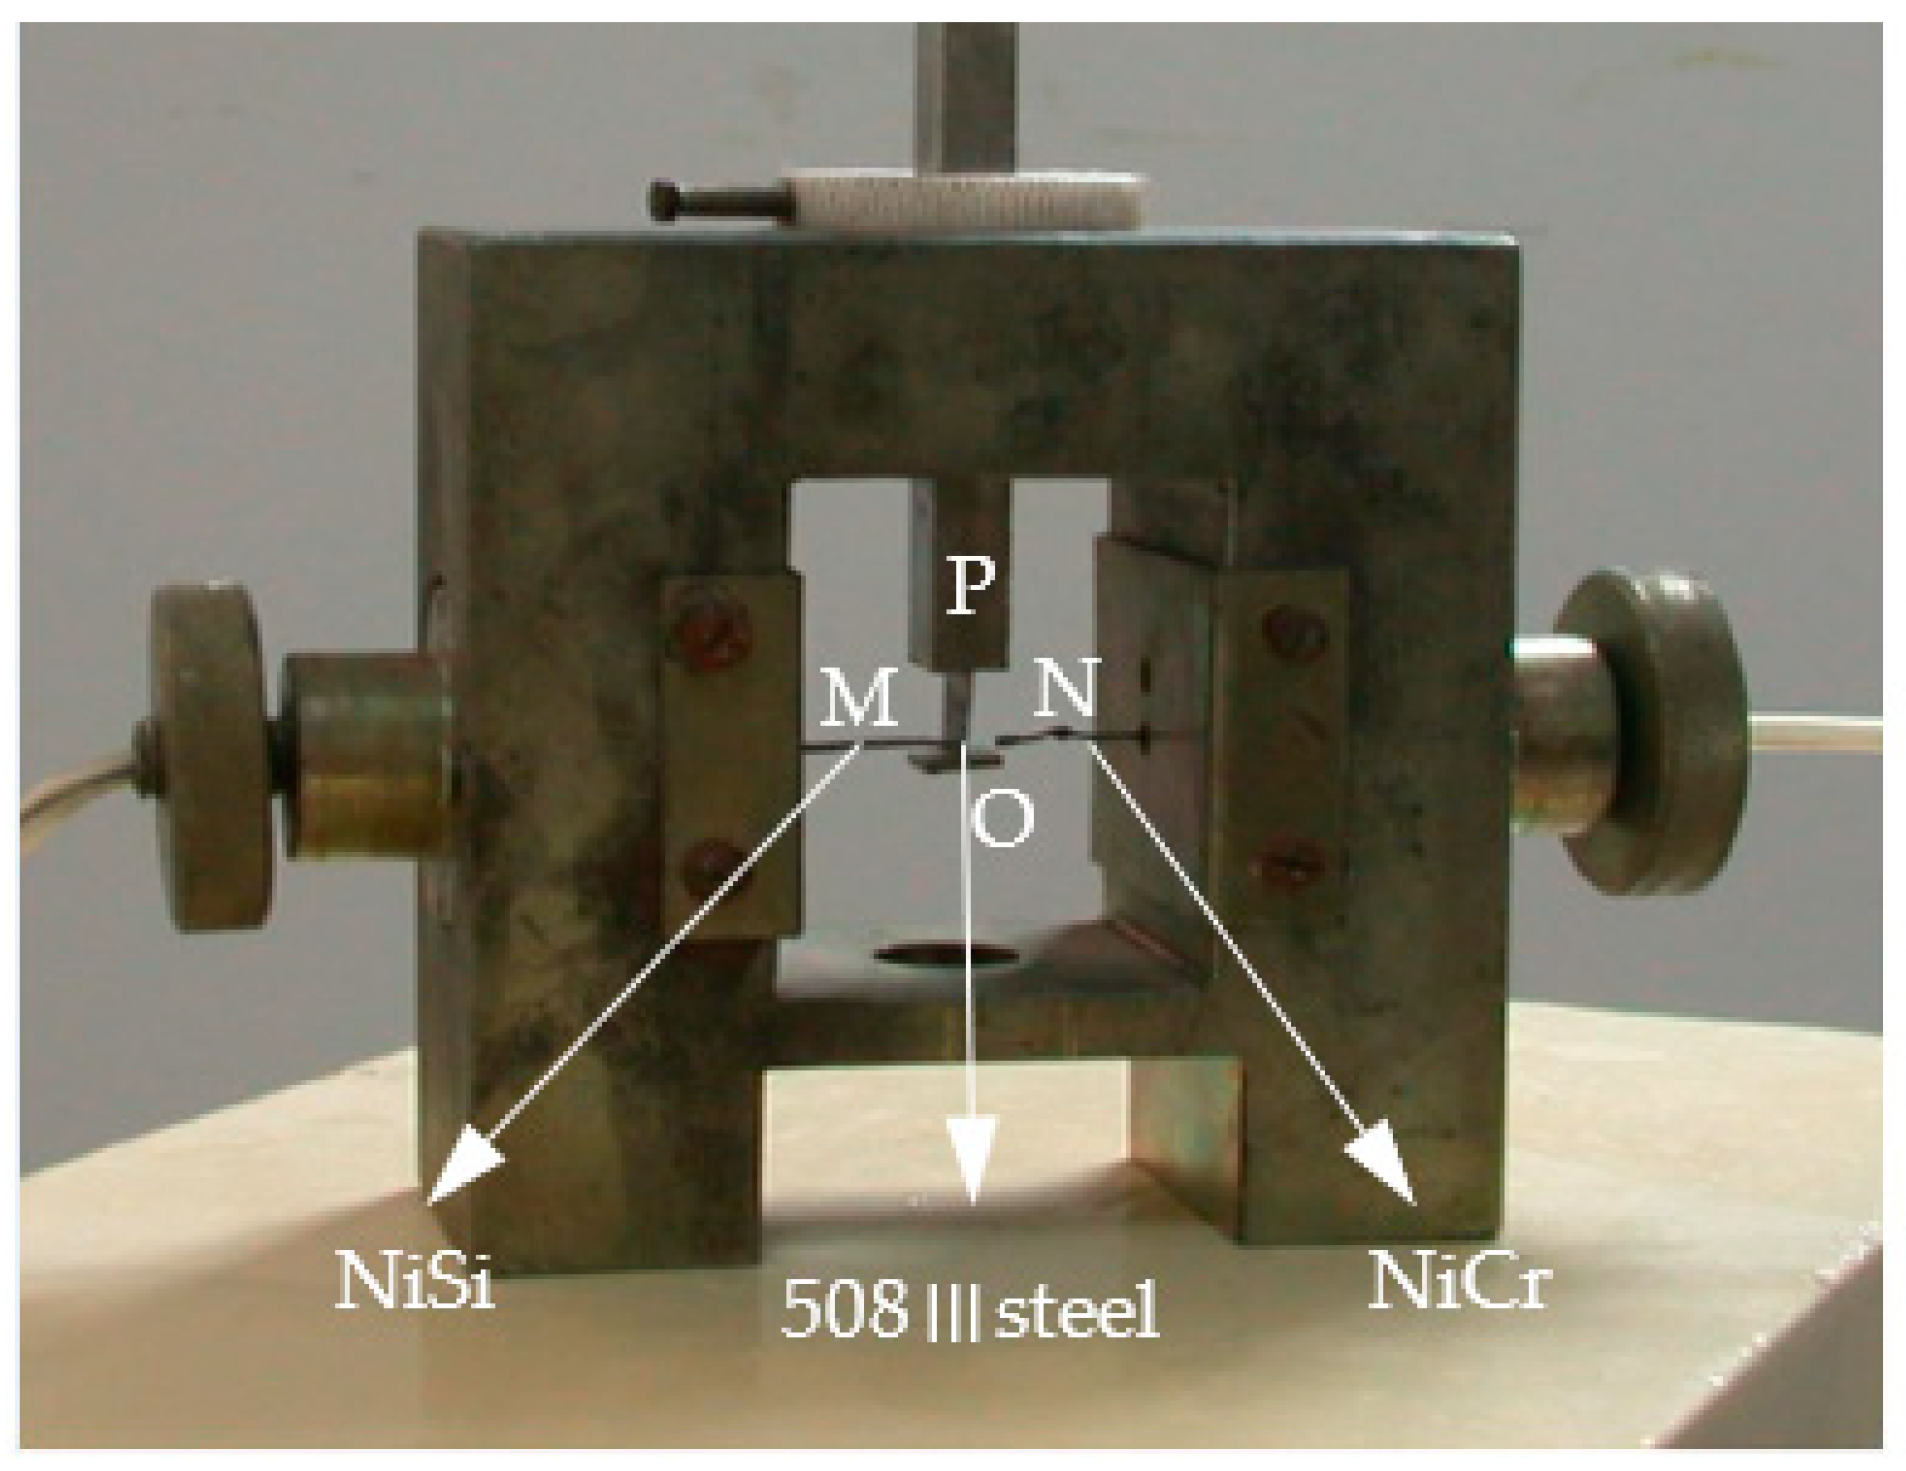
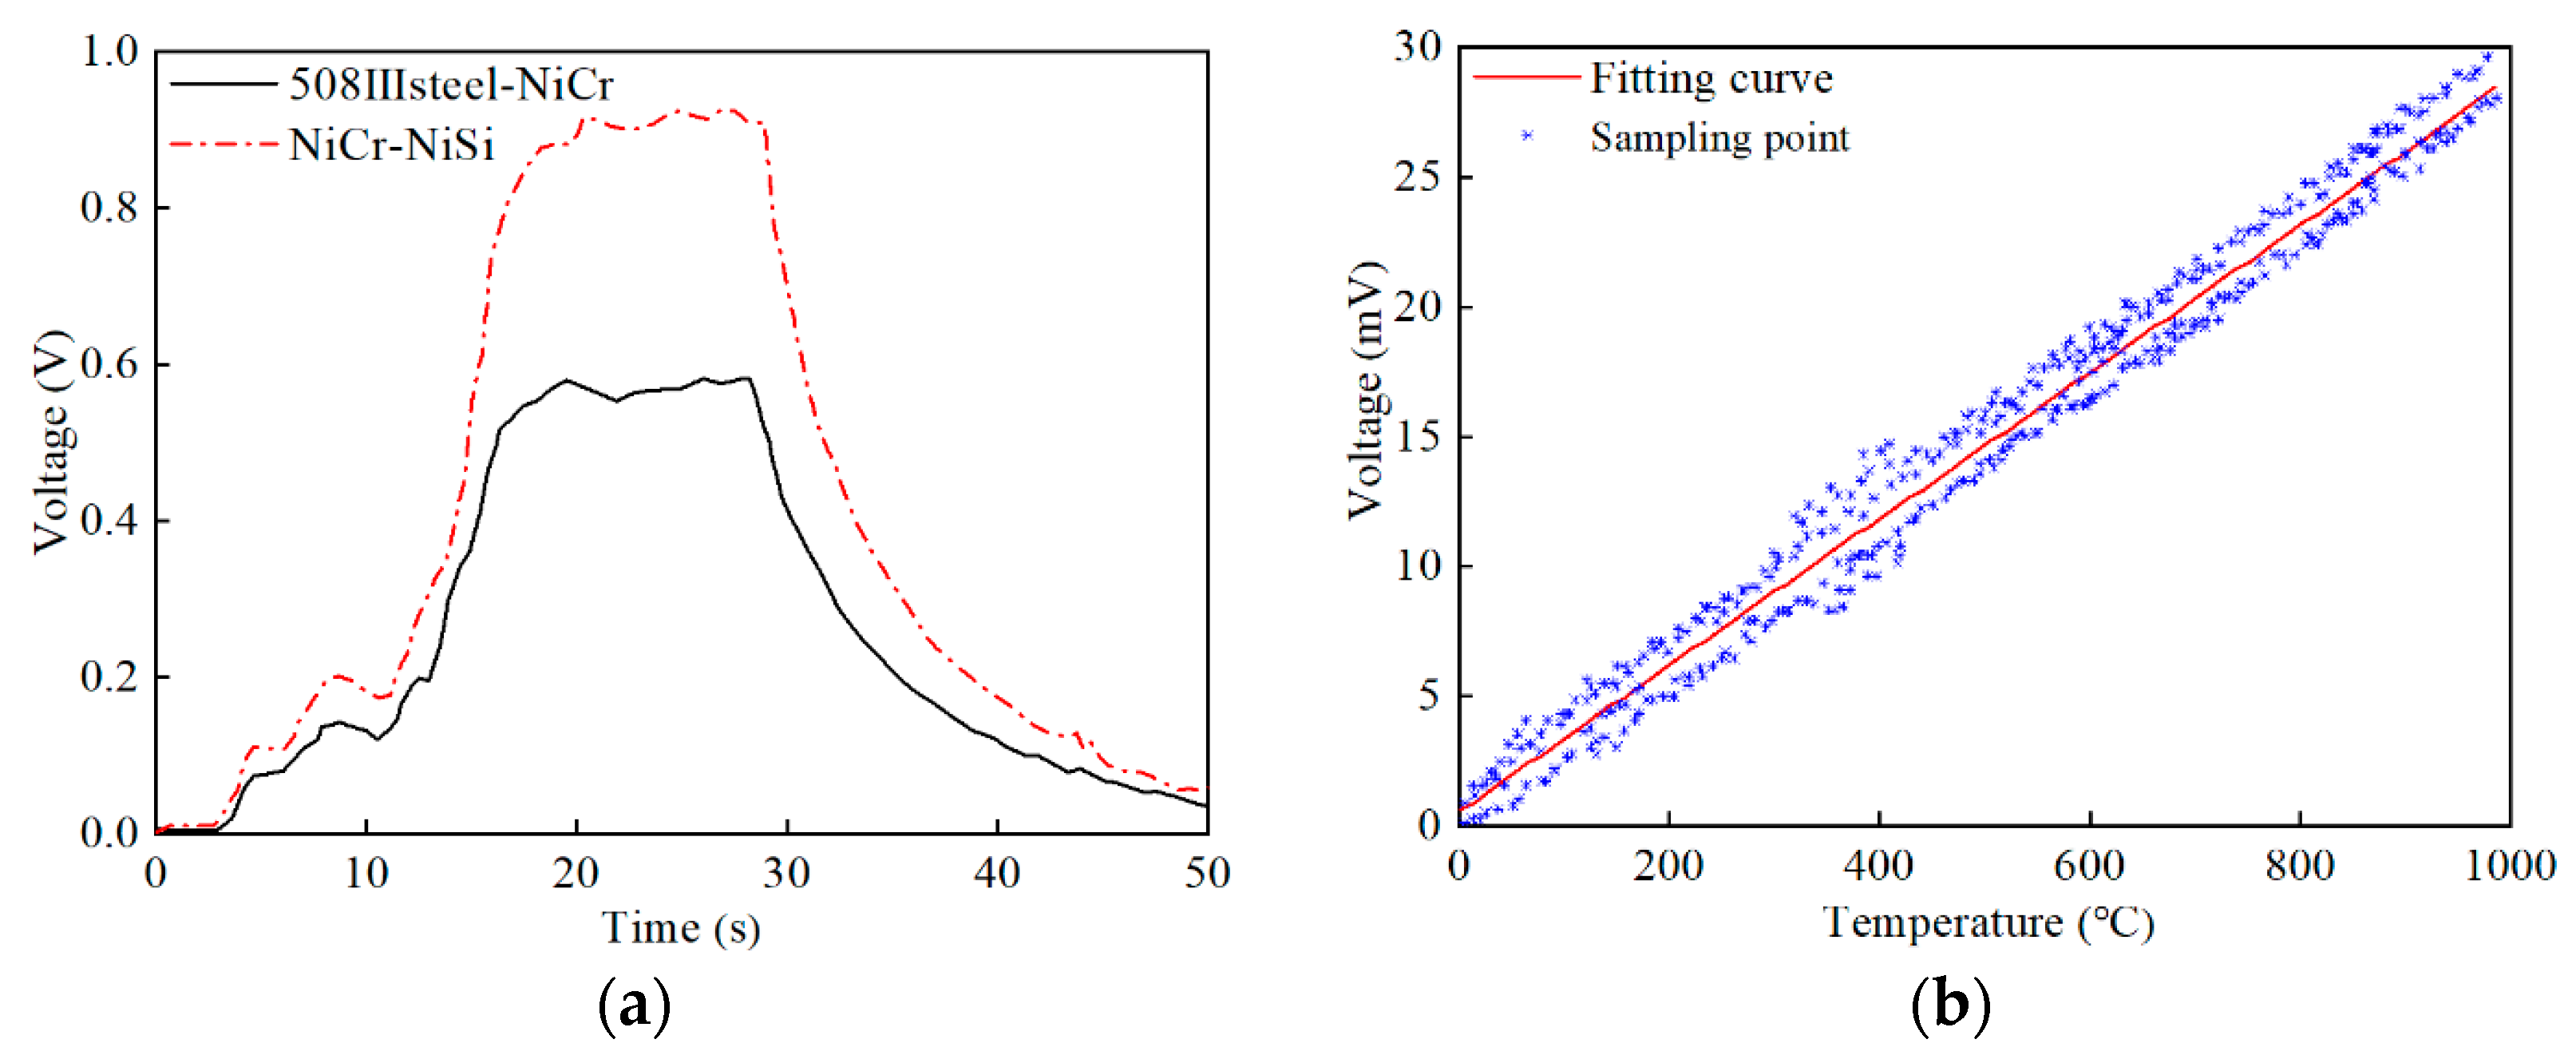
2.1. Temperature Experimental Protocol and Measurement Method Design
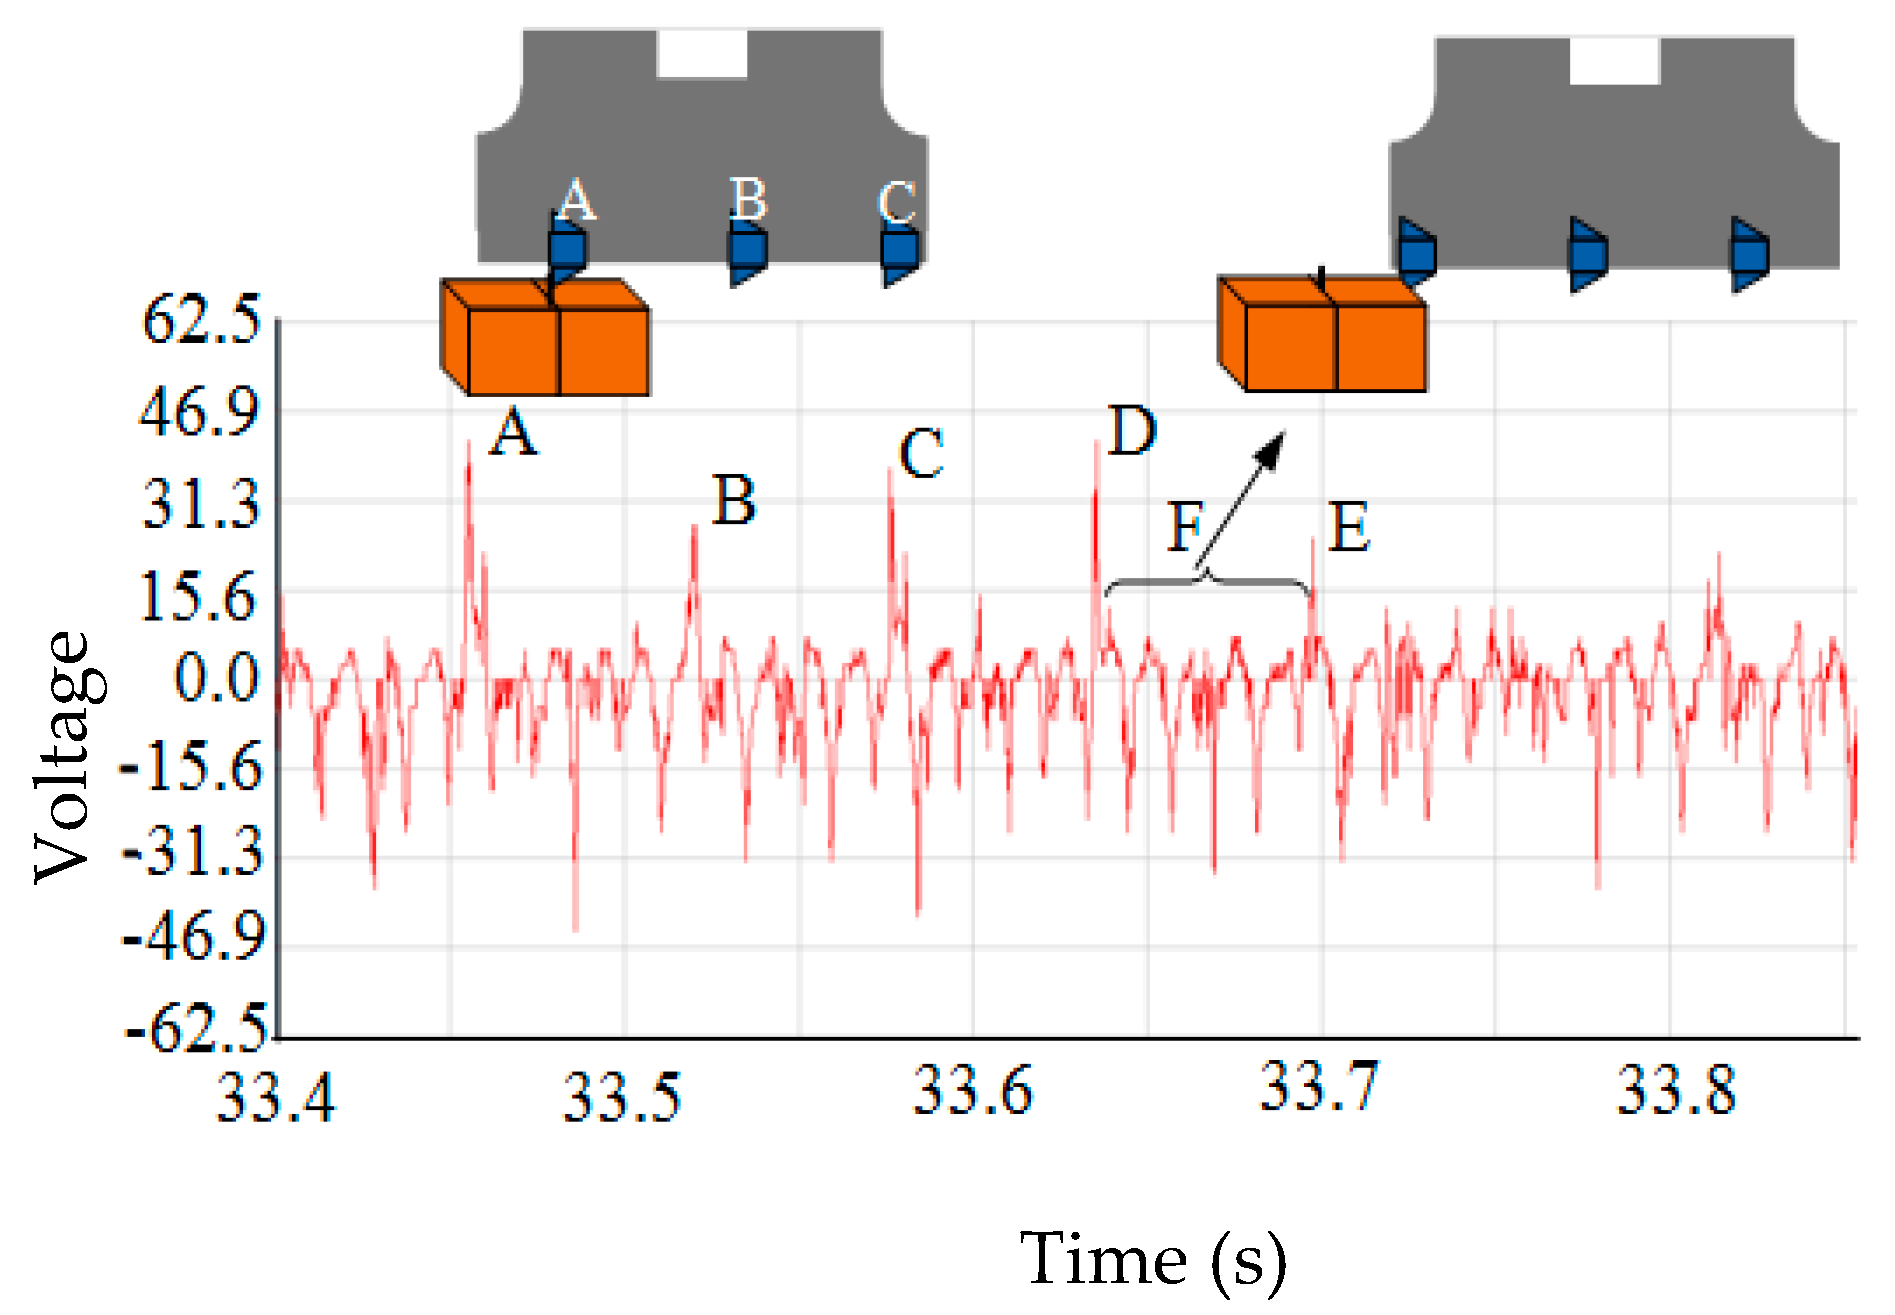
2.2. Temperature Signal Test of Milling 508III Steel
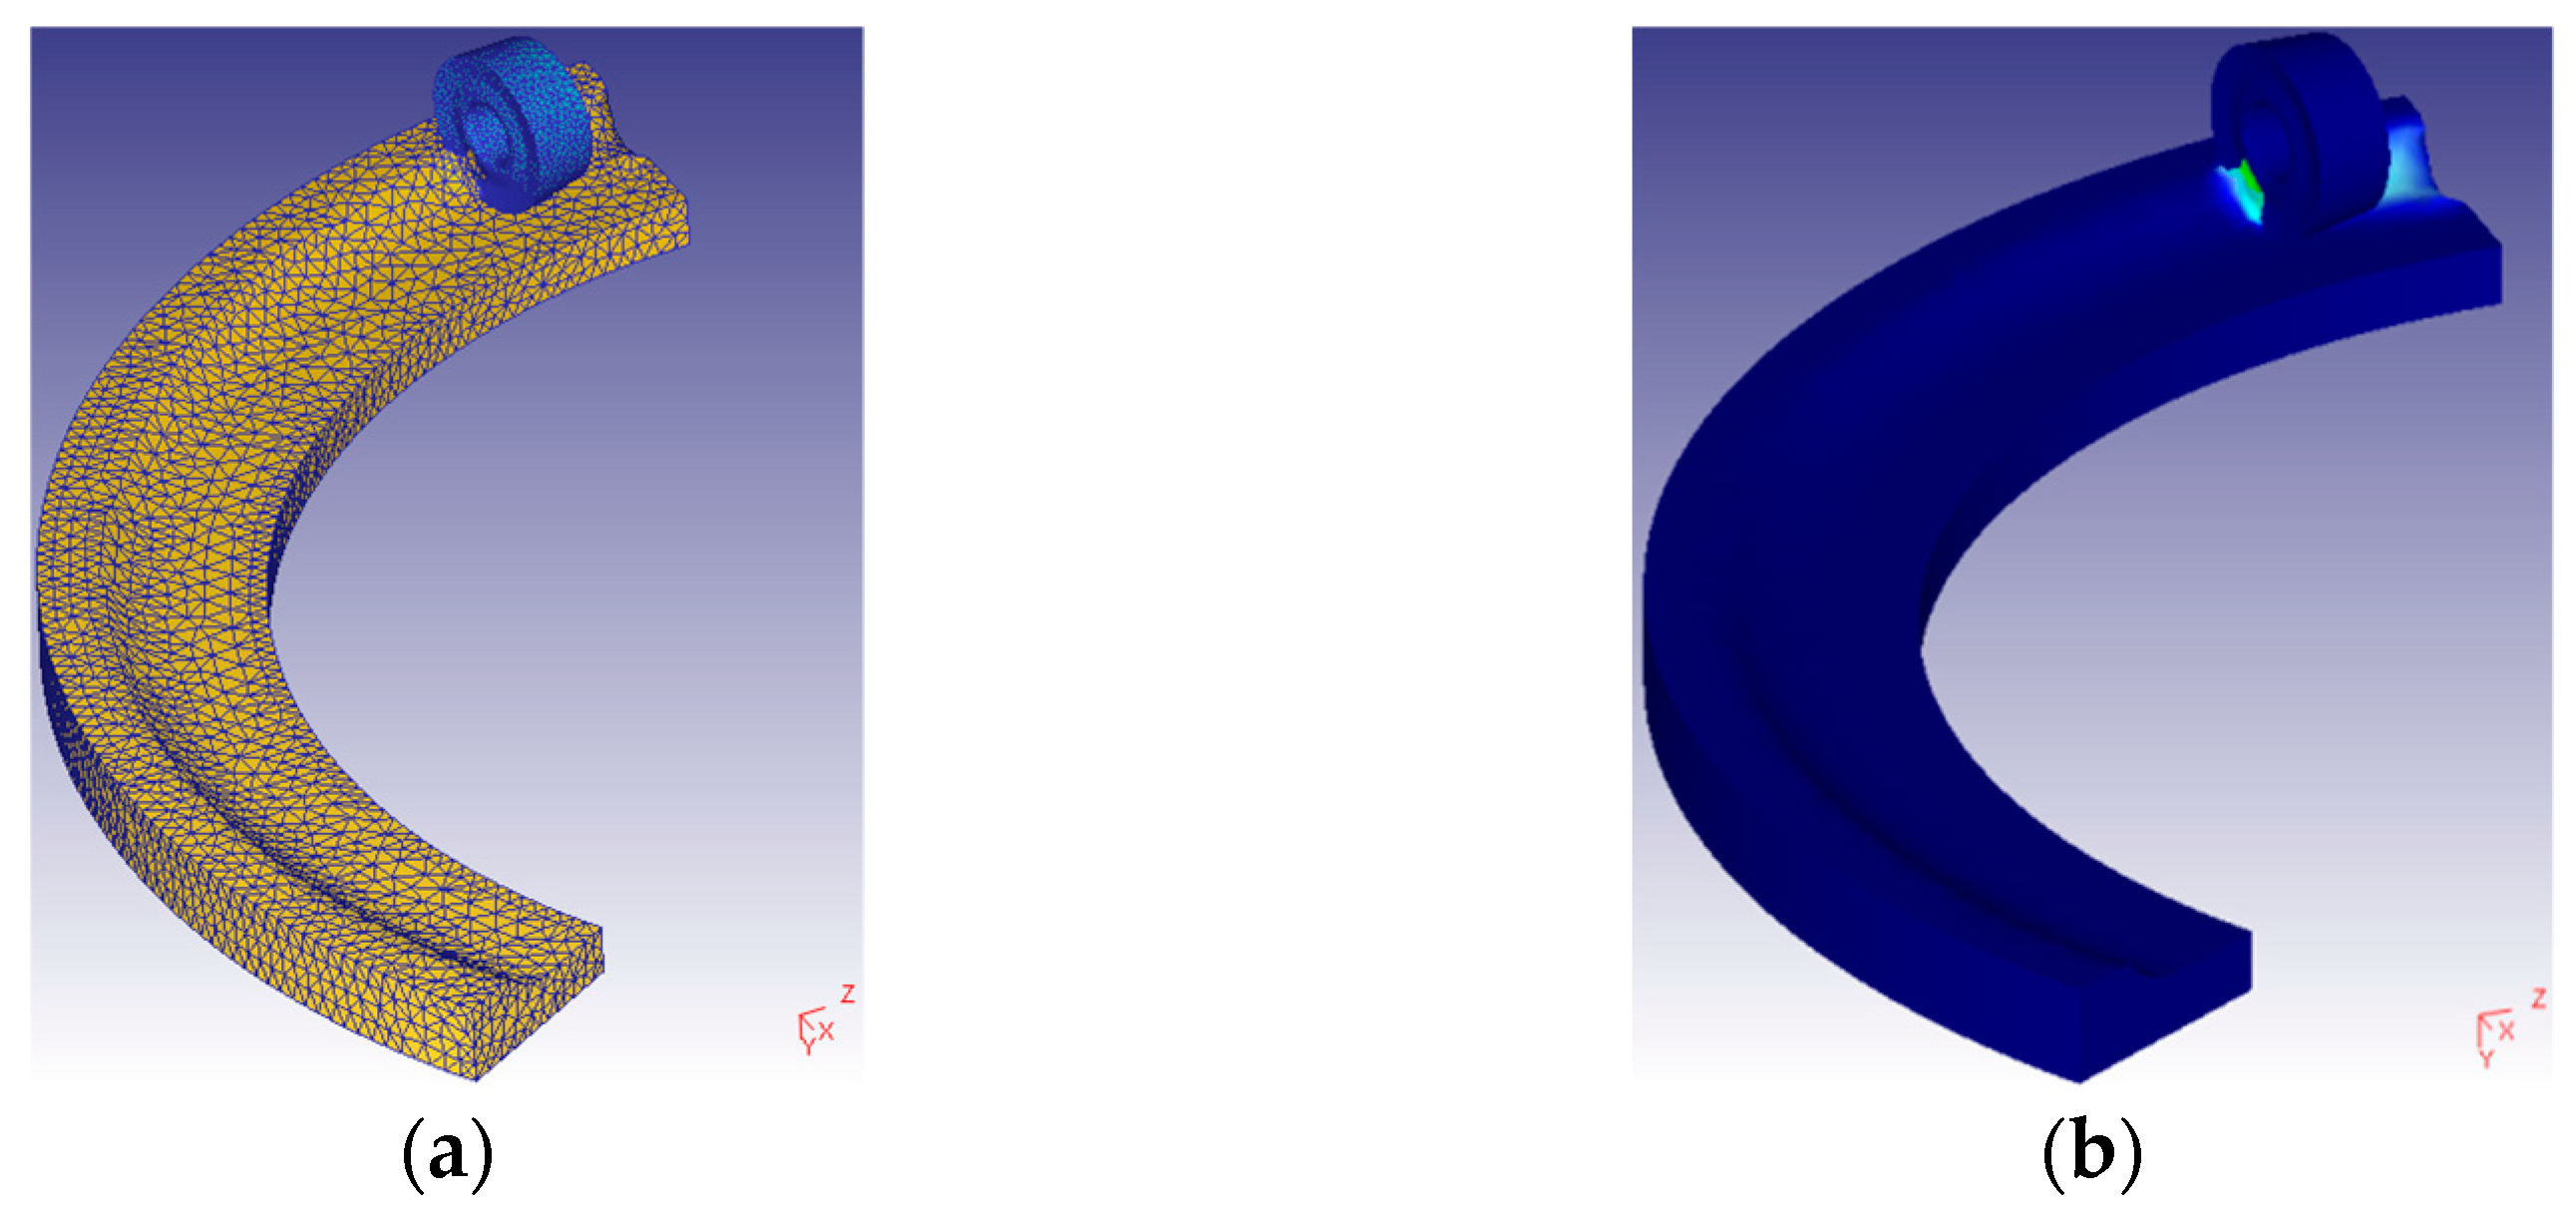
2.3. Simulation Analysis of the Temperature
3. Results and Discussion
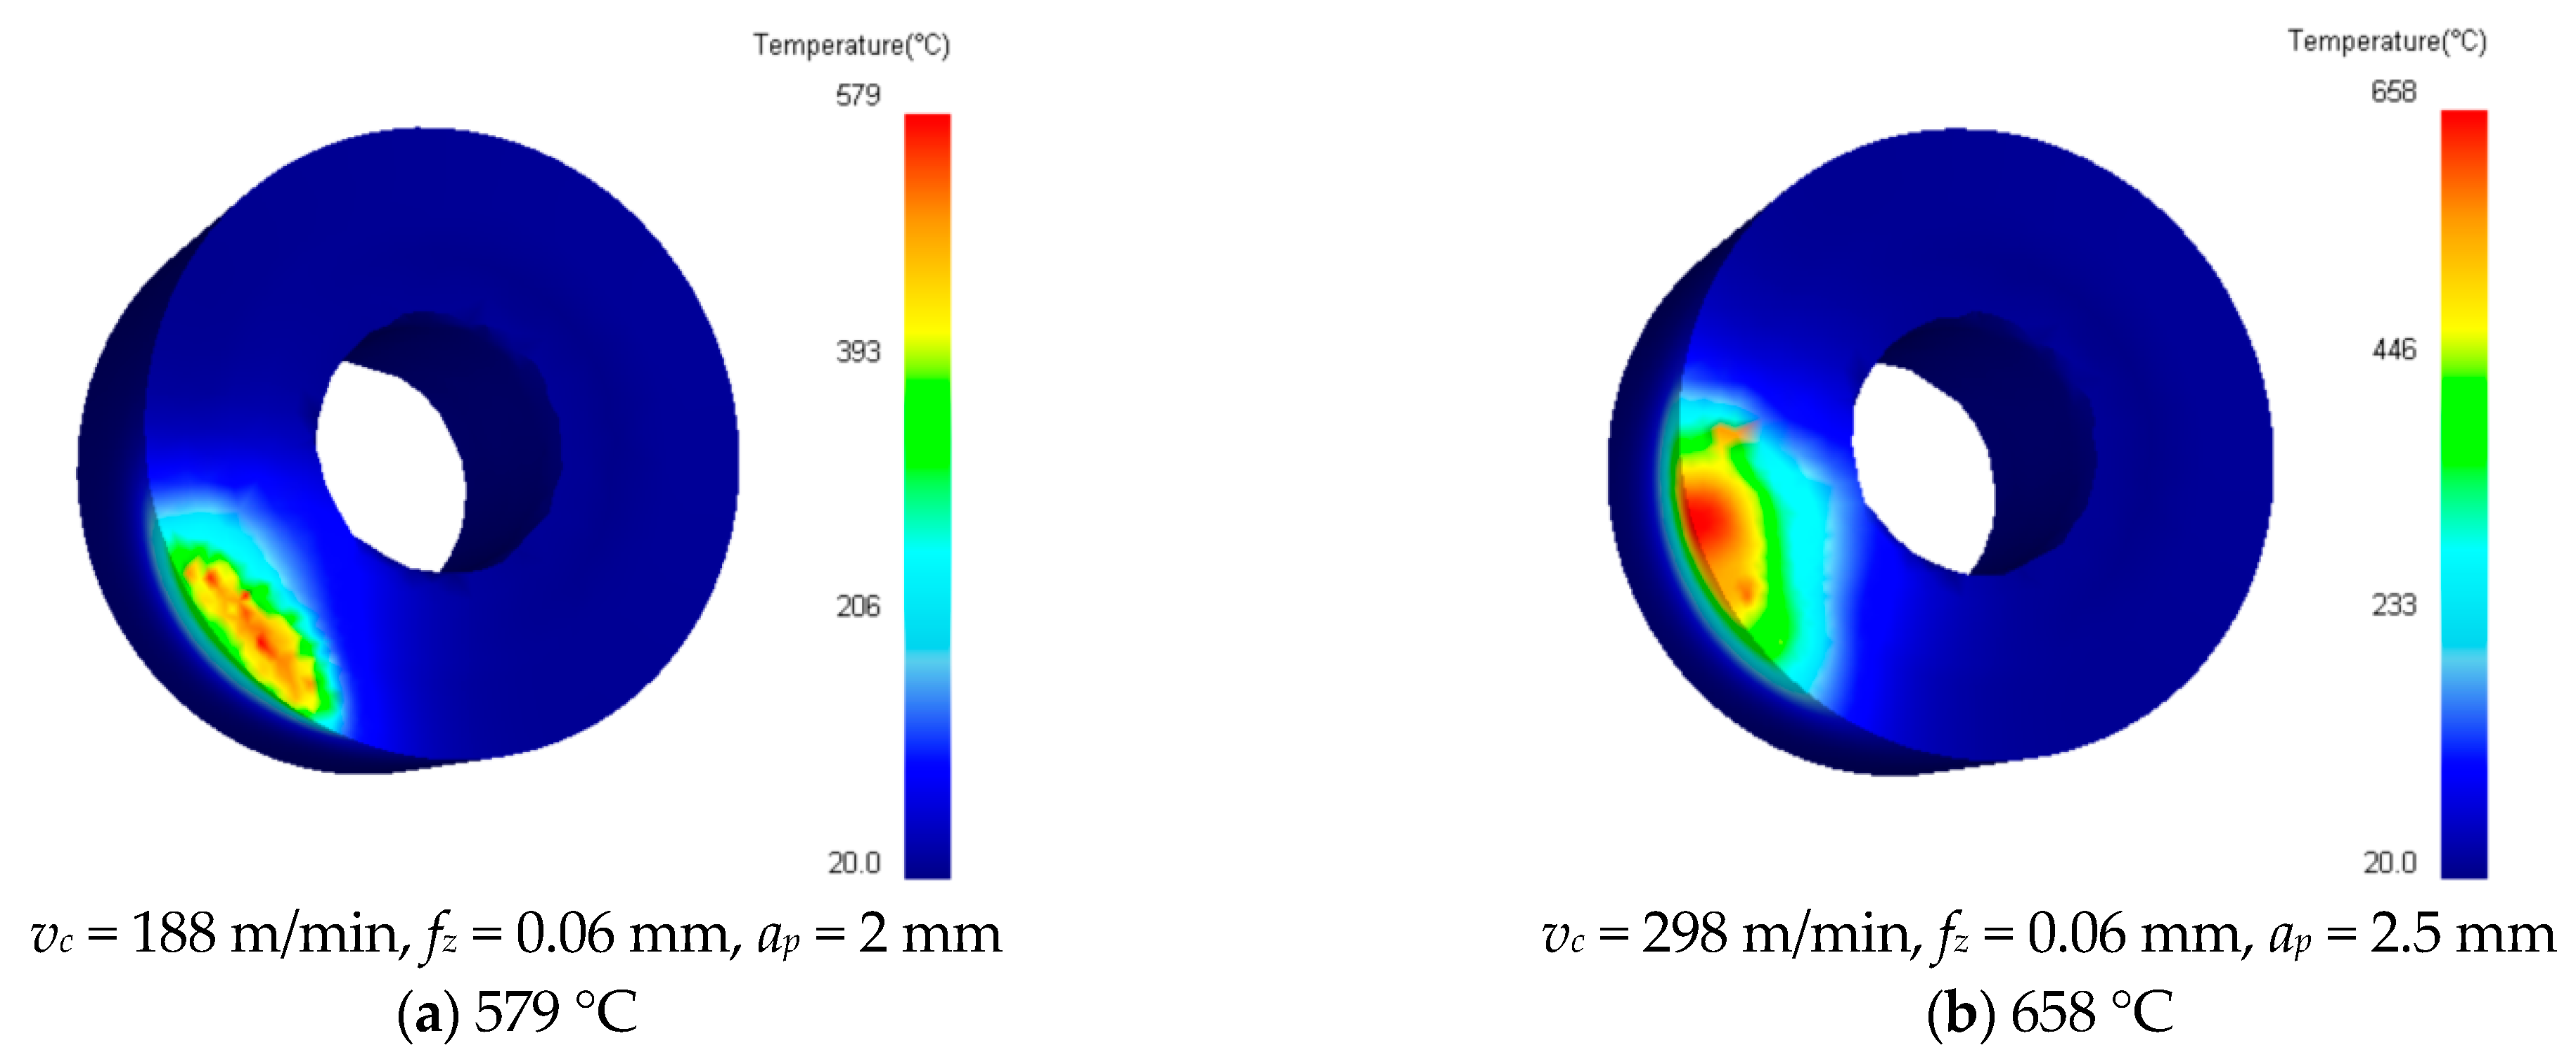
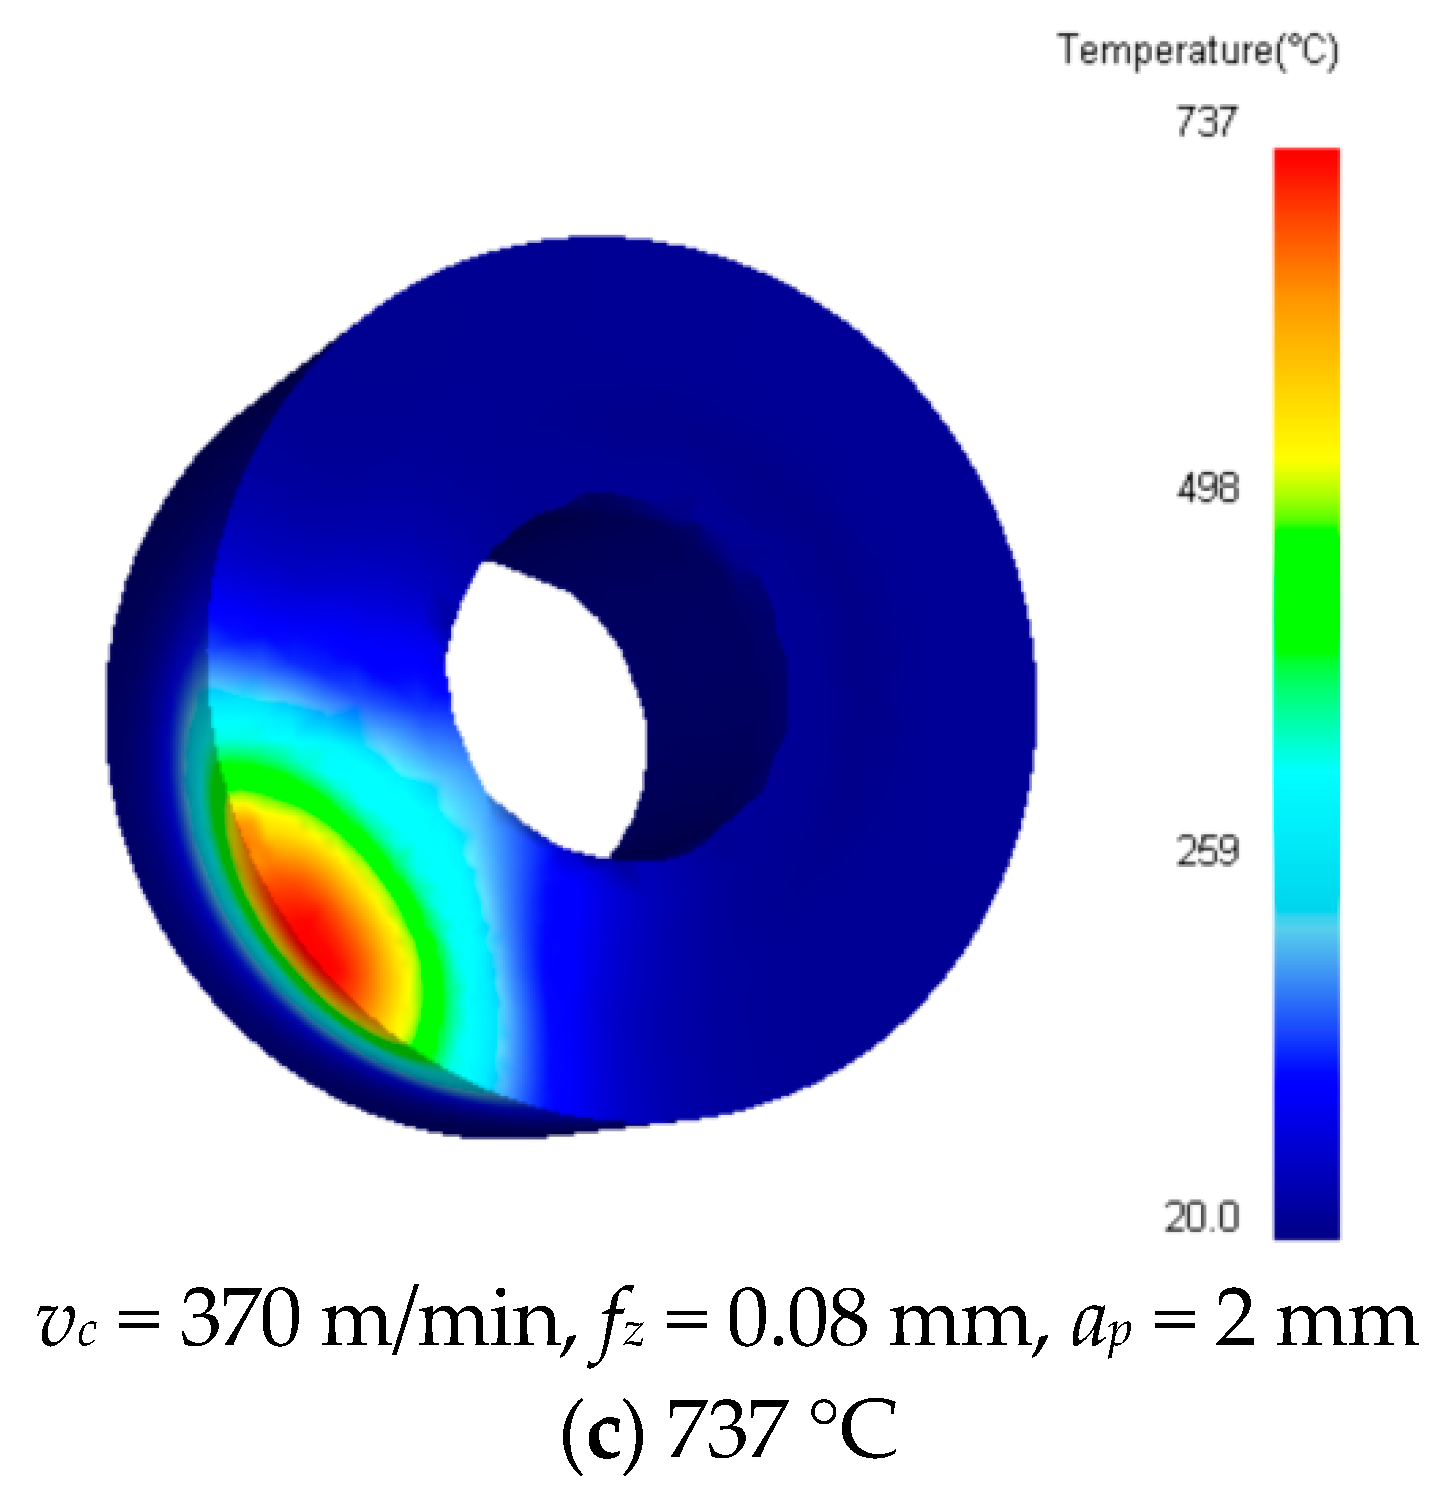
3.1. Simulated and Experimental Results
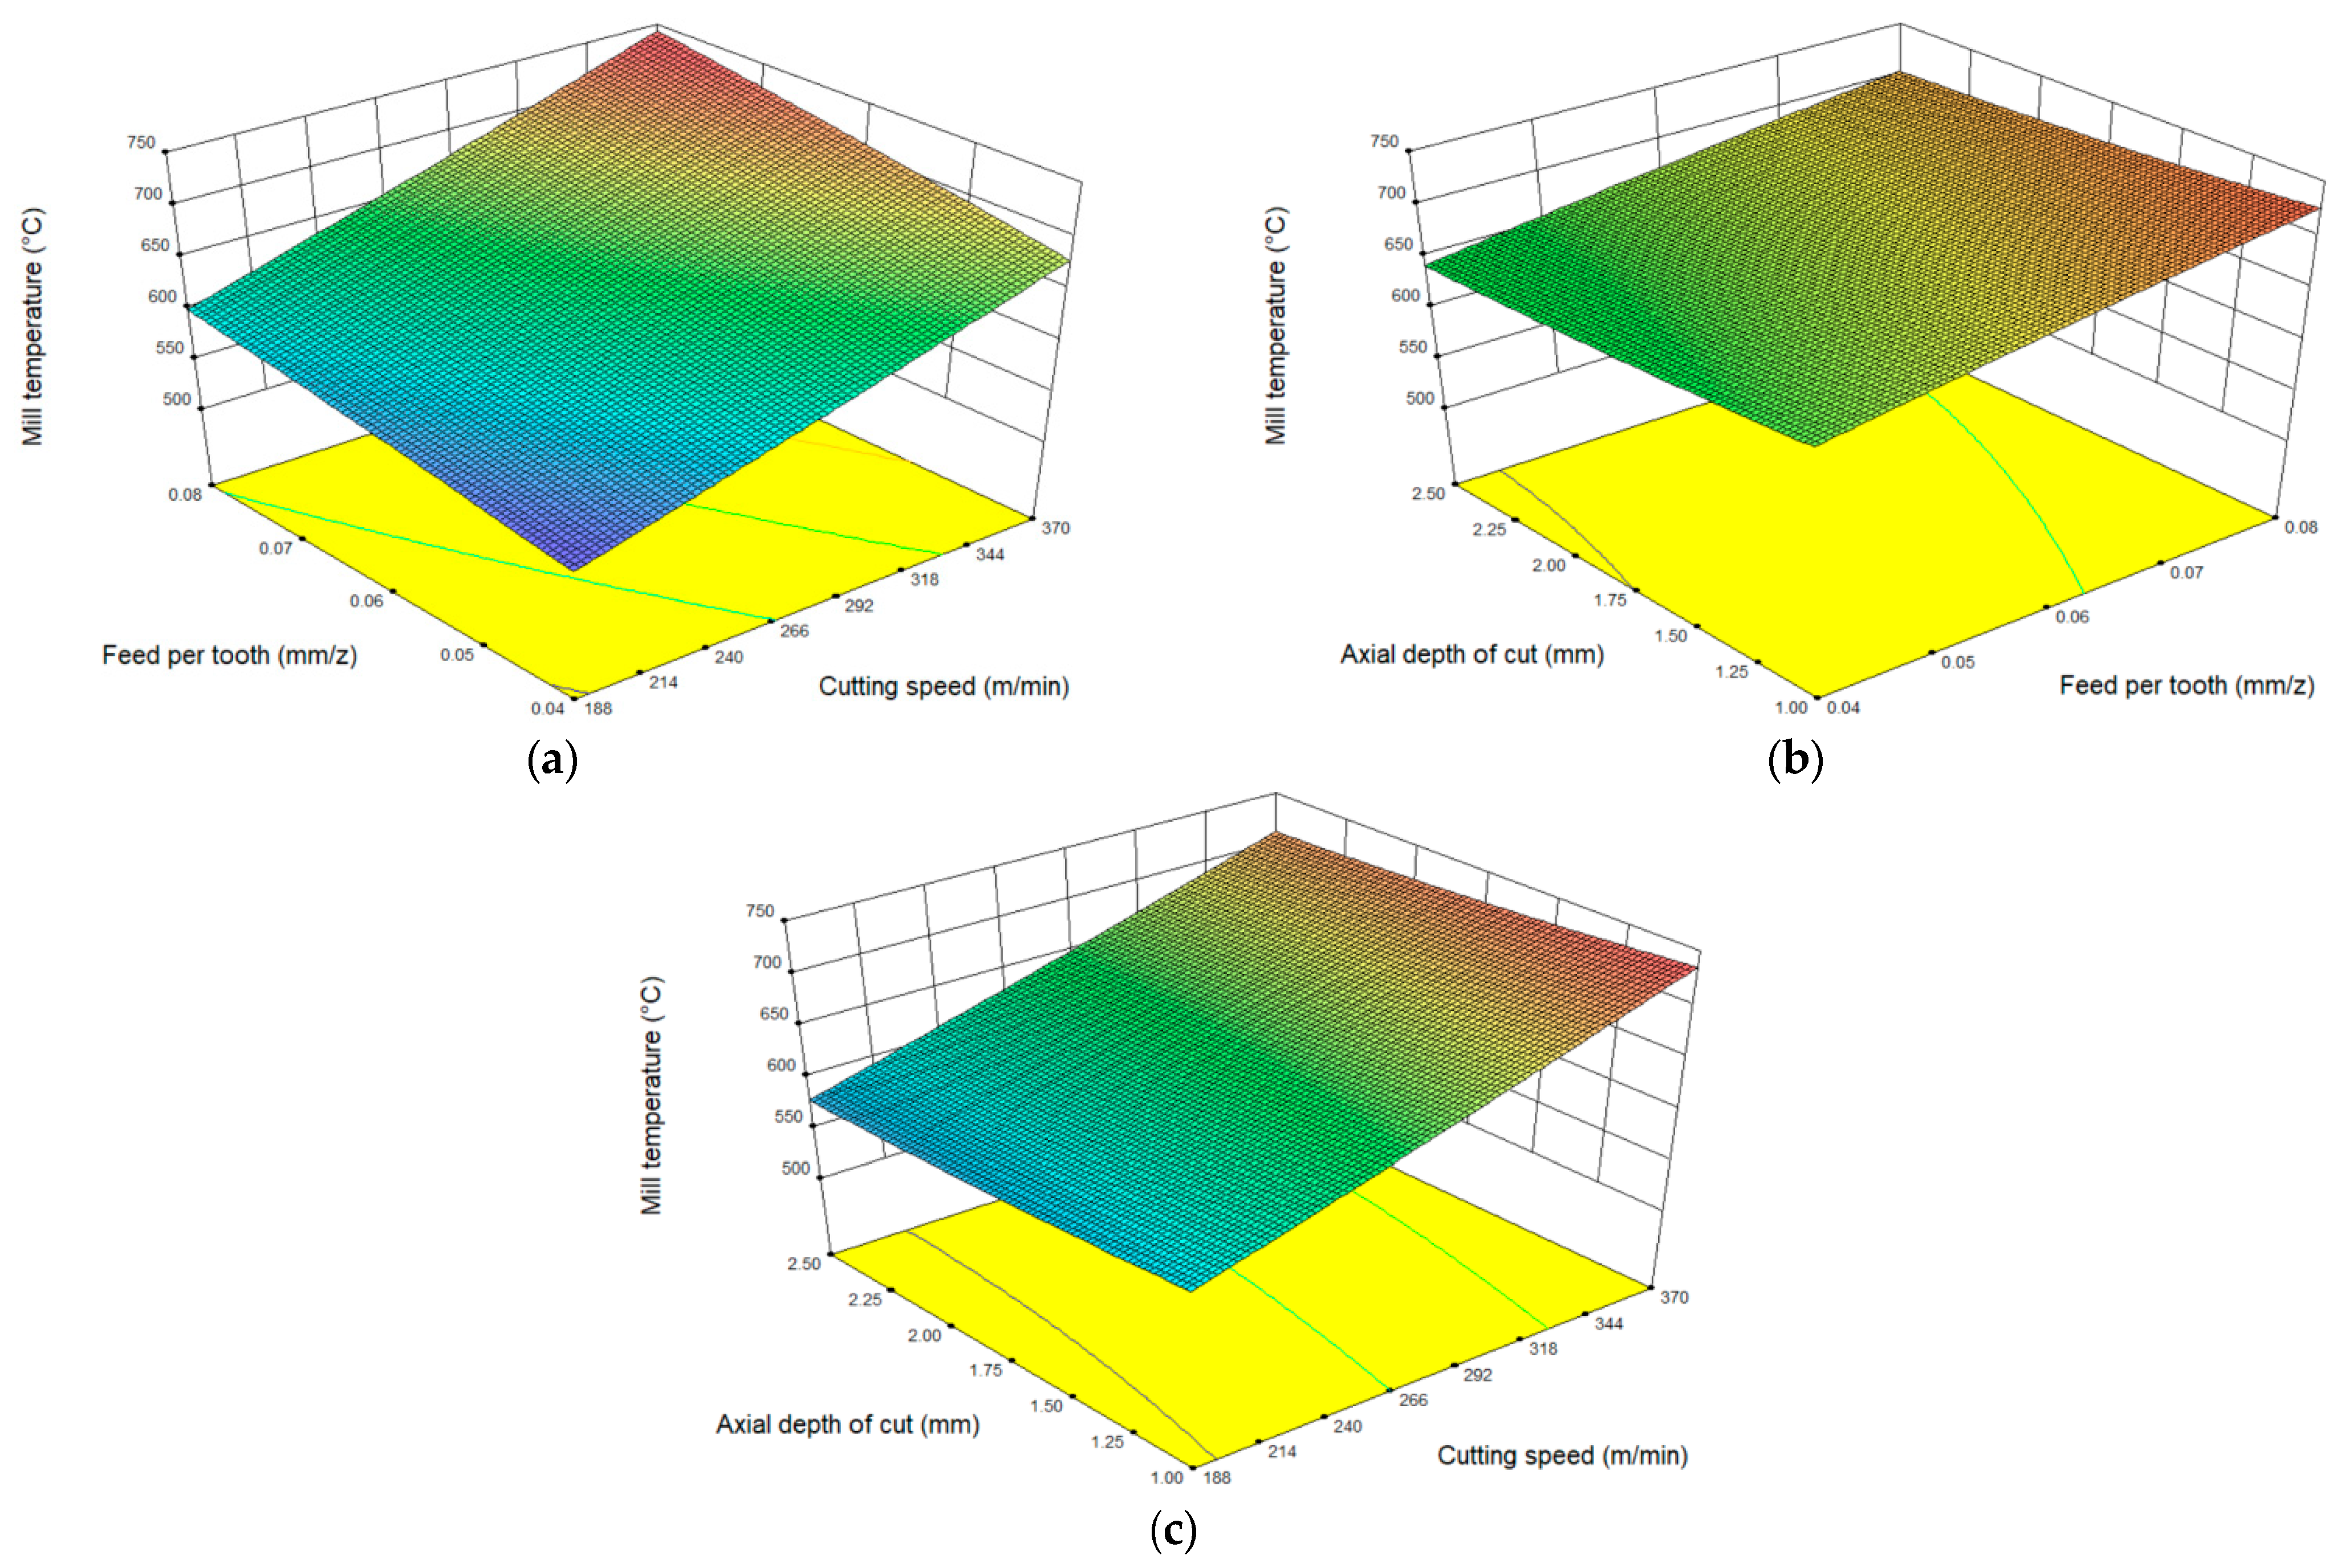
3.2. Influence of Cutting Parameters Interaction on Milling Temperature
3.3. Construction of Mathematical Model for Temperature Prediction
3.4. Significance Test of Temperature Model
3.5. Mathematical Model of Cutting Efficiency
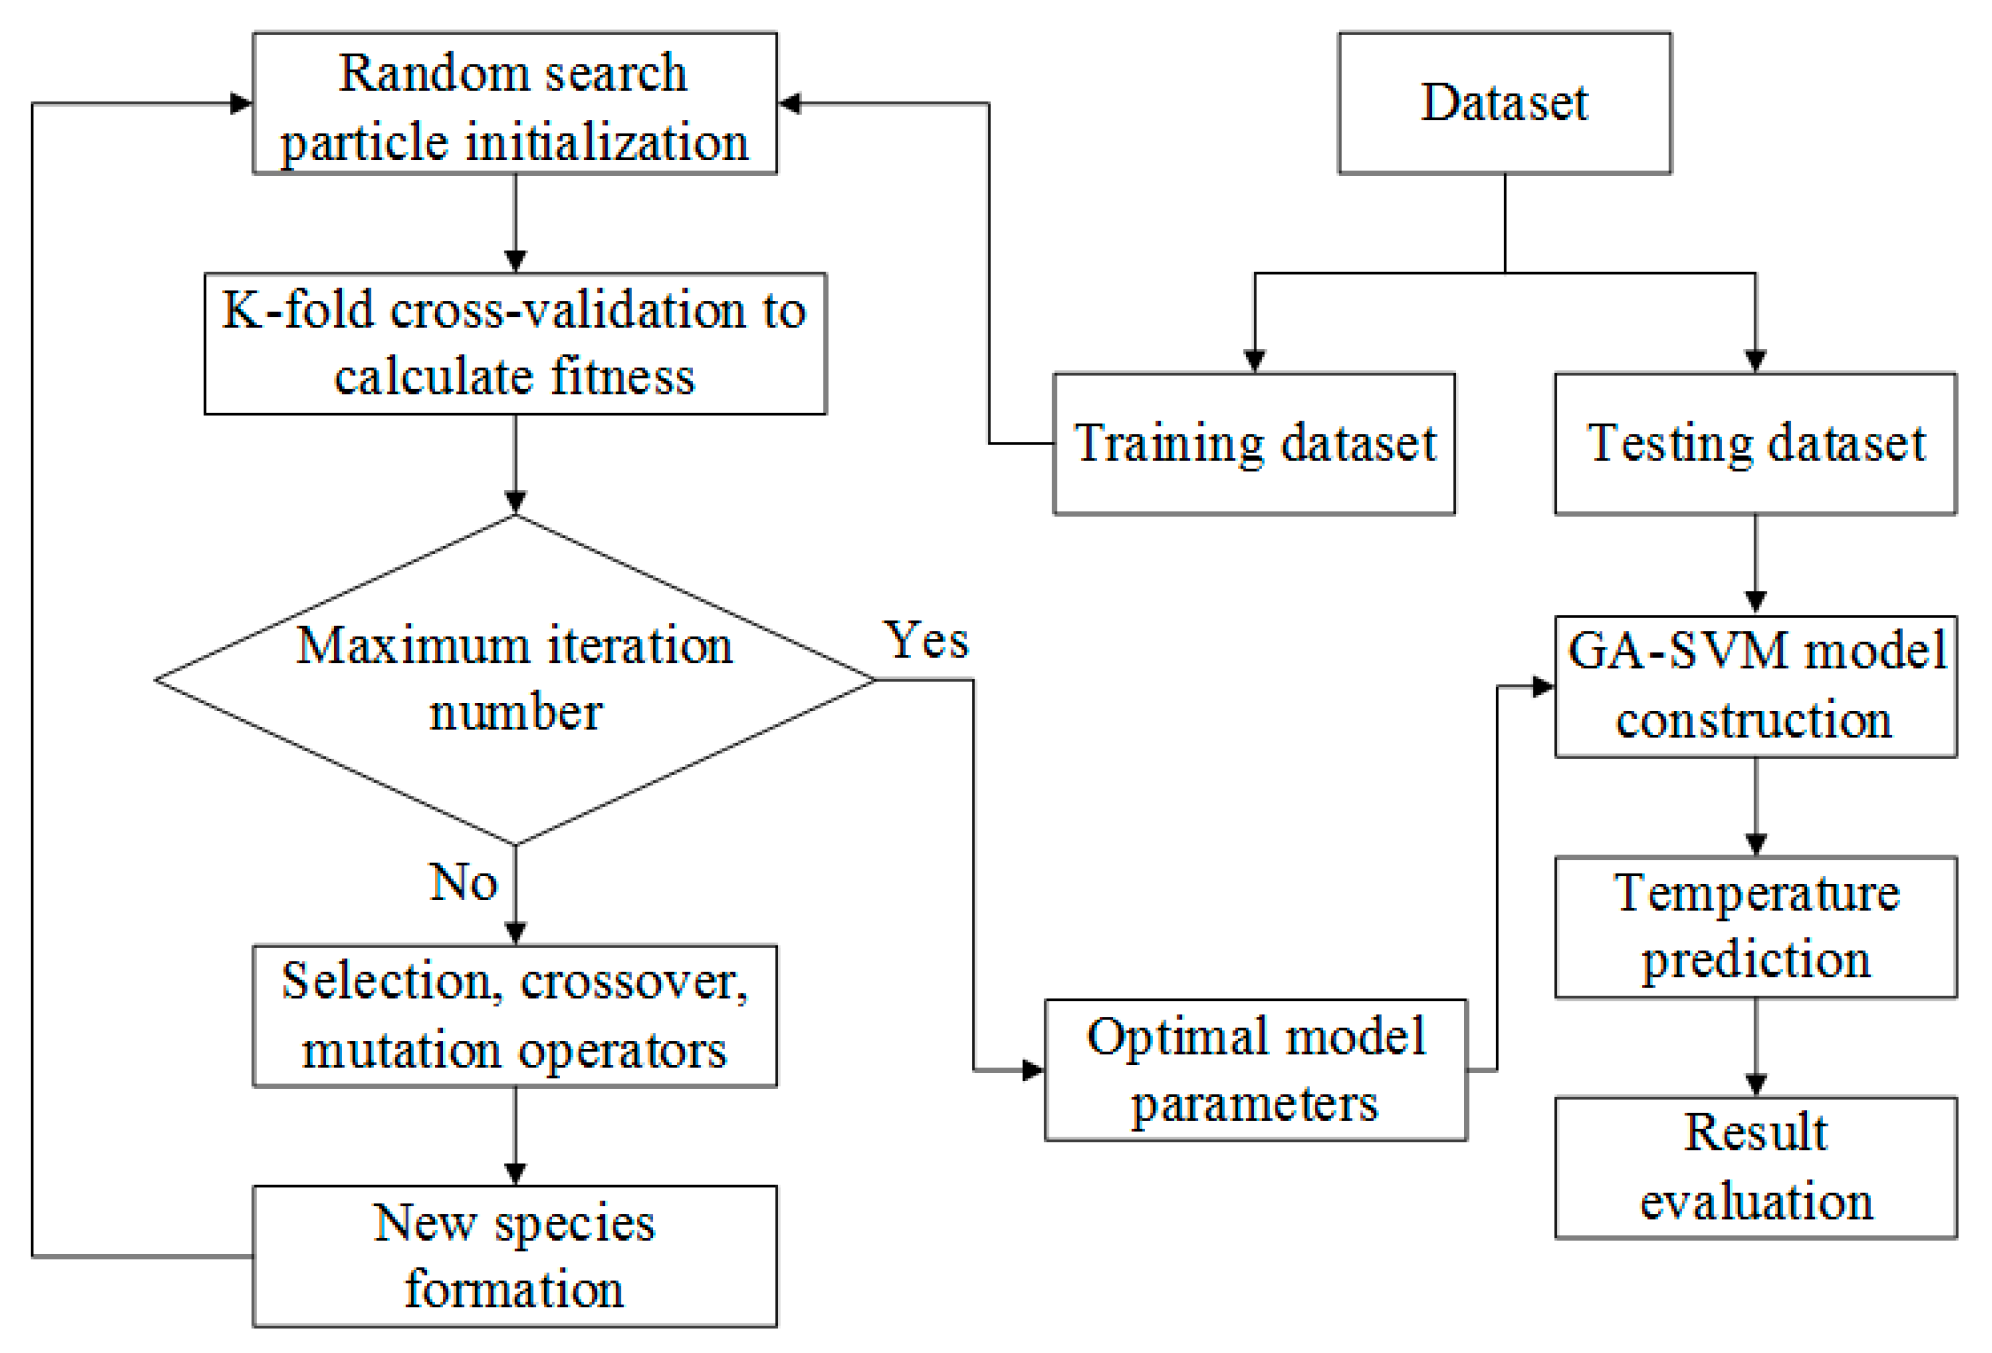
4. Temperature Prediction Based on SVM
4.1. GA-Optimized SVM Model
4.2. Temperature Prediction Based on GA-SVM
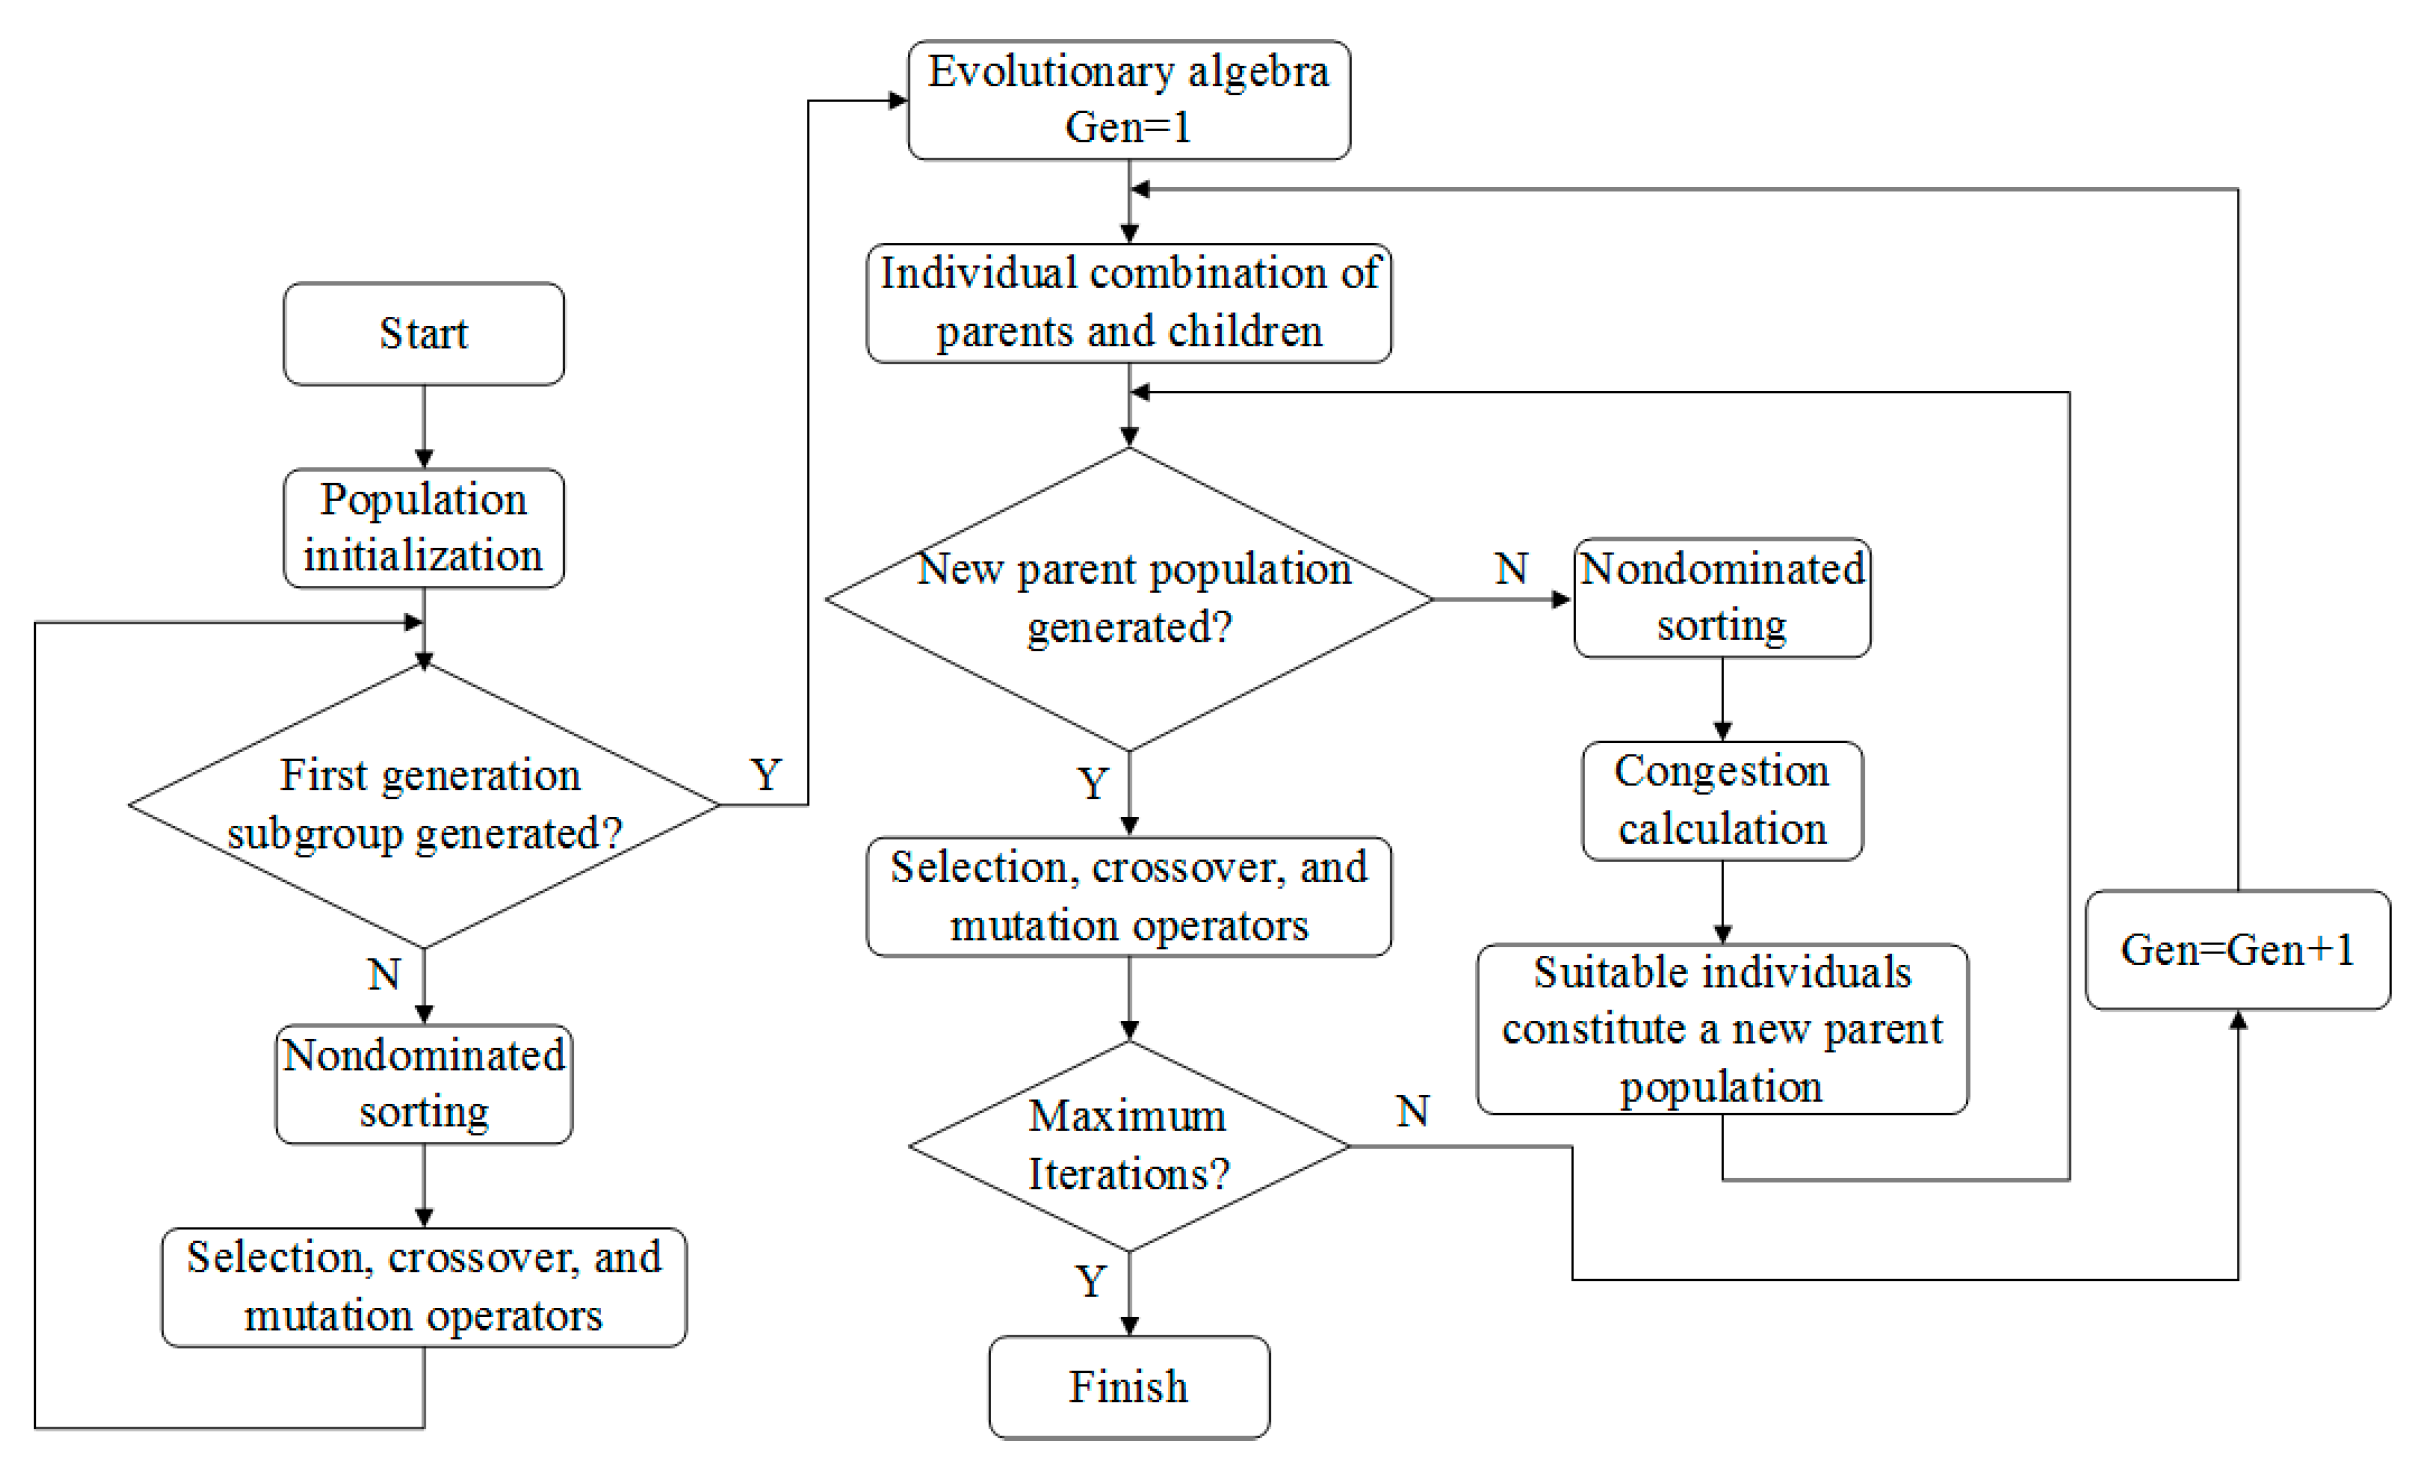
5. Cutting Parameter Optimization Based on NSGA-II Algorithm
5.1. NSGA-II Algorithm
5.2. Construction of Optimization Objective Function and Constraint Conditions
- (1)
- Cutting speed constraints:
- (2)
- Constraints of feed rate per tooth:
- (3)
- Constraints on axial cutting depth:
5.3. Parameter Optimization Results and Discussion
6. Conclusions
- (1)
- Based on the Box-Behnken experimental design criteria in RSM, a series of milling temperature experiments and FE simulations were carried out. The temperature was measured by using the semi-artificial thermocouple fitting equation of 508III steel-NiCr effectively.
- (2)
- Based on the FE simulation results, it was found that the area near the main cutting edge of the rake face produced a lot of friction heat in contact with the chip due to high pressure and serious friction, resulting in a higher temperature. By comparing the temperature experiment with the FE results, it was found that the absolute value of the relative error was within 5%. Results showed that the simulation results were accurate and effective, which verified the reliability of the FE analysis method and provided data support for the validation of parameter optimization effectiveness.
- (3)
- On an experimental basis, the influence of the interaction of cutting parameters on the temperature was analyzed based on RSM. It was found that the temperature increased significantly with the increase in cutting speed and feed rate per tooth, and the temperature changed less with the increase in axial cutting depth, accompanied by a decreasing trend. Based on RSM, a second-order polynomial prediction model for temperature was constructed. The variance and F-test results showed that the temperature regression model constructed had high significance at a 95% confidence level and good effectiveness and reliability.
- (4)
- The SVM method was used for temperature prediction, and the GA-SVM model was established to predict cutting temperature. It was found that the prediction error range was −3.37~5.48%, indicating that the method had certain effectiveness and reliability.
- (5)
- Taking cutting temperature and efficiency as evaluation indicators, the NSGA-II algorithm was used to optimize cutting parameters. The Pareto optimal frontier and 30 groups of Pareto optimal solutions were obtained, and Decision makers can reasonably select processing parameters based on actual processing needs, effectively improving decision-making efficiency.
Author Contributions
Funding
Institutional Review Board Statement
Informed Consent Statement
Data Availability Statement
Conflicts of Interest
References
- He, G.H.; Liu, X.L.; Yan, F.G. Research on the high-efficiency turning tool for rough machining of large hydrogenated cylindrical shell forging. J. Eng. Manuf. 2013, 567, 53–58. [Google Scholar] [CrossRef]
- Cheng, Y.N.; Li, C.Y.; Yuan, Q.H.; Lv, Q.Y.; Liu, L. Experiment and model of cutting force of heavy-duty milling water chamber head material. SN Appl. Sci. 2019, 1, 1571. [Google Scholar] [CrossRef] [Green Version]
- Cheng, Y.N.; Liu, X.L.; Li, Z.J.; Liu, L.; Wang, H.T. Adhering failure of the tool-chip in the process of extremely heavy cutting. J. Mech. Eng. 2012, 48, 169–176. [Google Scholar] [CrossRef]
- Ueda, T.; Suzuki, K.; Shamoto, E. Fundamental study on cutting temperature in high speed cutting of difficult-to-cut materials. In Proceedings of the 20th Machining Innovations Conference for Aerospace Industry 2020 (MIC 2020), Hannover, Germany, 2 December 2020. [Google Scholar]
- Patru, E.N.; Craciunoiu, N.; Panduru, D.; Bica, M. Study on cutting temperature and surface roughness during the milling process of aluminium alloys. IOP Conf. Ser. Earth Environ. Sci. 2018, 172, 012018. [Google Scholar] [CrossRef] [Green Version]
- Bhirud, N.L.; Gawande, R.R. Optimization of process parameters during end milling and prediction of work piece temperature rise. Arch. Mech. Eng. 2017, 64, 328–346. [Google Scholar] [CrossRef] [Green Version]
- Sato, M.; Tamura, N.; Tanaka, H. Temperature variation in the cutting tool in end milling. J. Manuf. Sci. Eng. 2011, 133, 021005. [Google Scholar] [CrossRef]
- Yang, D.P.; Liu, Y.; Ma, F.J.; Sha, Z.H. Simulation study on cutting force and cutting temperature in turning of titanium alloy. IOP Conf. Ser. Mater. Sci. Eng. 2019, 692, 012014. [Google Scholar] [CrossRef]
- Gao, Y.; Sun, R.L.; Chen, Y.N.; Leopold, J. Mechanical and thermal modeling of modulation-assisted machining. Int J. Adv. Manuf. Technol. 2016, 86, 2945–2959. [Google Scholar] [CrossRef]
- Liu, Z.J.; Quan, Y.M.; Liang, L. A wireless system for cutting temperature measurement. Adv. Mater. Res. 2011, 188, 475–480. [Google Scholar] [CrossRef]
- Bi, Y.B.; Fang, Q.; Dong, H.Y.; Ke, Y.L. Research on 3D numerical simulation and experiment of cutting temperature for high-speed milling of aerospace aluminum alloy. J. Mech. Eng. 2010, 46, 160–165. [Google Scholar] [CrossRef]
- Geng, G.S.; Xu, J.H.; Fu, Y.C.; Ge, Y.F.; Chang, C. Study of cutting temperature in high-speed milling of a close alpha titanium alloy. Mech. Sci. Technol. 2006, 25, 329–332. [Google Scholar]
- George, P.; Selvaraj, D.P. Cutting parameter optimization of CNC dry milling process of AISI 410 and 420 grade MSS. Mater. Today Proc. 2021, 42, 897–901. [Google Scholar] [CrossRef]
- Nguyen, V.C.; Nguyen, T.D.; Tien, D.H. Cutting parameter optimization in finishing milling of Ti6Al4V titanium alloy under MQL condition using TOPSIS and ANOVA analysis. Eng. Technol. Appl. Sci. Res. 2021, 11, 6775–6780. [Google Scholar] [CrossRef]
- Santhanakrishnan, M.; Sivasakthivel, P.S.; Sudhakaran, R. Modeling of geometrical and machining parameters on temperature rise while machining Al 6351 using response surface methodology and genetic algorithm. J. Braz. Soc. Mech. Sci. Eng. 2017, 39, 487–496. [Google Scholar] [CrossRef]
- Librantz, A.F.H.; Coppini, N.L.E.; Baptista, A.; Alves, S.; Castello, A.F. Genetic algorithm applied to investigate cutting process parameters influence on workpiece price formation. Mater. Manuf. Process. 2011, 26, 550–557. [Google Scholar] [CrossRef]
- Zain, A.M.; Haron, H.; Sharif, S. Application of GA to optimize cutting conditions for minimizing surface roughness in end milling machining process. Expert. Syst. Appl. 2010, 37, 4650–4659. [Google Scholar] [CrossRef]
- Tao, L.; Chen, H.H.; Zhou, Z.J.; Pan, K.Q. A study on the simulation of cutting temperature and optimization of machining parameters in turning of Inconel 718. Modul. Mach. Tool Autom. Manuf. Tech. 2020, 556, 165–168. [Google Scholar]
- Chen, J.L.; Sun, J.; Li, J.F. Multi-objective optimization of cutting parameters during milling of titanium alloys. Chin. J. Mech. Eng. 2014, 25, 169–173. [Google Scholar]
- Li, B.; Tian, X.; Zhang, M. Modeling and multi-objective optimization of cutting parameters in the high-speed milling using RSM and improved TLBO algorithm. Int J. Adv. Manuf. Technol. 2020, 111, 2323–2335. [Google Scholar] [CrossRef]
- Zhou, W.H. Cutting temperature experiments of milling titanium alloys and development of cutting database interface. Master’s Thesis, Nanjing University of Aeronautics and Astronautics, Nanjing, China, 2009. [Google Scholar]
- Zhang, H.; Zhao, W.Z. Thermal Measurement Instrument. In Chaoxing E-Book; CRC Press: Boca Raton, FL, USA, 2013. [Google Scholar]
- Venkatesan, K.; Ramanujam, R.; Joel, J.; Jeyapandiarajan, P.; Vignesh, M.; Tolia, D.J.; Krishna, R.V. Study of cutting force and surface roughness in machining of Al alloy hybrid composite and optimized using response surface methodology. Procedia Eng. 2014, 97, 677–686. [Google Scholar] [CrossRef] [Green Version]
- García-Nieto, P.J.; García-Gonzalo, E.; Vilán Vilán, J.A.; Robleda, S.A. A new predictive model based on the PSO-optimized support vector machine approach for predicting the milling tool wear from milling runs experimental data. Int J. Adv. Manuf. Technol. 2015, 86, 769–780. [Google Scholar] [CrossRef]
- Liao, X.P.; Zhou, G.; Zhang, Z.K.; Lu, J.; Ma, J.Y. Tool wear state recognition based on GWO-SVM with feature selection of genetic algorithm. Int J. Adv. Manuf. Technol. 2019, 1041, 1051–1063. [Google Scholar] [CrossRef]
- Song, Y.L.; Zou, M.Y.; Chen, X.; Deng, J.Y.; Du, T. Parameter optimization of passive heat supply tower of ground source heat pump based on NSGA-II. Sol. Energy 2019, 190, 453–464. [Google Scholar] [CrossRef]


| Temperature (°C) | Quadratic Fitting Voltage Value (mV) | Cubic Fitting Voltage Value (mV) | Quartic Fitting Voltage Value (mV) | Standard Voltage Value (mV) | Quadratic Fitting Relative Error (%) | Cubic Fitting Relative Error (%) | Quartic Fitting Relative Error (%) |
|---|---|---|---|---|---|---|---|
| 100 | 3.9193 | 4.0363 | 4.0382 | 4.0950 | −4.2906 | −1.4543 | −1.3871 |
| 200 | 8.2088 | 8.0912 | 8.0997 | 8.1370 | 0.8824 | −0.5661 | −0.4584 |
| 300 | 12.4579 | 12.2336 | 12.2406 | 12.2070 | 2.0554 | 0.2174 | 0.2753 |
| 400 | 16.6666 | 16.4348 | 16.4369 | 16.3950 | 1.6566 | 0.2422 | 0.2556 |
| 500 | 20.8350 | 20.6667 | 20.6637 | 20.6400 | 0.9448 | 0.1292 | 0.1148 |
| 600 | 24.9630 | 24.9008 | 24.8947 | 24.9020 | 0.2450 | −0.0048 | −0.0293 |
| 700 | 29.0507 | 29.1087 | 29.1027 | 29.1280 | −0.2654 | −0.0663 | −0.0869 |
| 800 | 33.098 | 33.2621 | 33.2594 | 33.2770 | −0.5379 | −0.0448 | −0.0529 |
| 900 | 37.1049 | 37.3327 | 37.3354 | 37.3250 | −0.5897 | 0.0206 | 0.0279 |
| 1000 | 41.0715 | 41.292 | 41.2998 | 41.2690 | −0.4786 | 0.0557 | 0.0746 |
| 1100 | 44.9977 | 45.1116 | 45.1212 | 45.1080 | −0.2445 | 0.0080 | 0.0293 |
| 1200 | 48.8836 | 48.7633 | 48.7666 | 48.8280 | 0.1139 | −0.1327 | −0.1258 |
| 1300 | 52.7291 | 52.2186 | 52.2021 | 52.3930 | 0.6415 | −0.3340 | −0.3644 |
| Name | Cemented Carbide | 508III Steel |
|---|---|---|
| Elastic modulus (GPa) | 600 | 212 |
| Density (g/cm3) | 14.5 | 7.9 |
| Thermal conductivity (W/(m·K)) | 62.8 | 14.5 |
| Specific heat capacity (kg·K) | 460 | 460 |
| Poisson’s ratio | 0.33 | 0.3 |
| Parameters | Value |
|---|---|
| A | 1766 |
| B | 904 |
| C | 0.001 |
| n | 0.144 |
| m | 0.72 |
| 1 | |
| Troom (°C) | 20 |
| Tmelt (°C) | 1650 |
| Exp. No. | Cutting Speed vc (m/min) | Feed Per Tooth fz (mm/z) | Axial Depth of Cut ap (mm) | Milling Temperature (°C) | ||
|---|---|---|---|---|---|---|
| Experimental Results | Simulated Results | Relative Error | ||||
| 1 | 298 | 0.06 | 2 | 656 | 661 | −0.76% |
| 2 | 370 | 0.06 | 1 | 723 | 728 | −0.69% |
| 3 | 298 | 0.08 | 2.5 | 677 | 693 | −2.31% |
| 4 | 298 | 0.04 | 2.5 | 620 | 610 | 1.64% |
| 5 | 370 | 0.06 | 2.5 | 697 | 706 | −1.27% |
| 6 | 298 | 0.08 | 1 | 693 | 678 | 2.21% |
| 7 | 188 | 0.08 | 2 | 593 | 578 | 2.66% |
| 8 | 298 | 0.06 | 1 | 668 | 686 | −2.62% |
| 9 | 188 | 0.04 | 1 | 553 | 542 | 2.03% |
| 10 | 188 | 0.06 | 2 | 574 | 579 | −0.86% |
| 11 | 298 | 0.06 | 2.5 | 641 | 658 | −2.58% |
| 12 | 370 | 0.04 | 2.5 | 672 | 692 | −2.89% |
| 13 | 298 | 0.04 | 2 | 611 | 620 | −1.45% |
| 14 | 298 | 0.08 | 2 | 681 | 659 | 3.34% |
| 15 | 188 | 0.08 | 2.5 | 594 | 593 | 0.17% |
| 16 | 298 | 0.04 | 1 | 634 | 651 | −2.61% |
| 17 | 370 | 0.08 | 2 | 734 | 737 | −0.41% |
| Variance Analysis | DF | SS | MS | F |
|---|---|---|---|---|
| Regression | 9 | 43,038.49 | 4782.05 | 154.2 |
| Residual | 7 | 217.04 | 31.01 | - |
| Total | 16 | 43,255.53 | - | - |
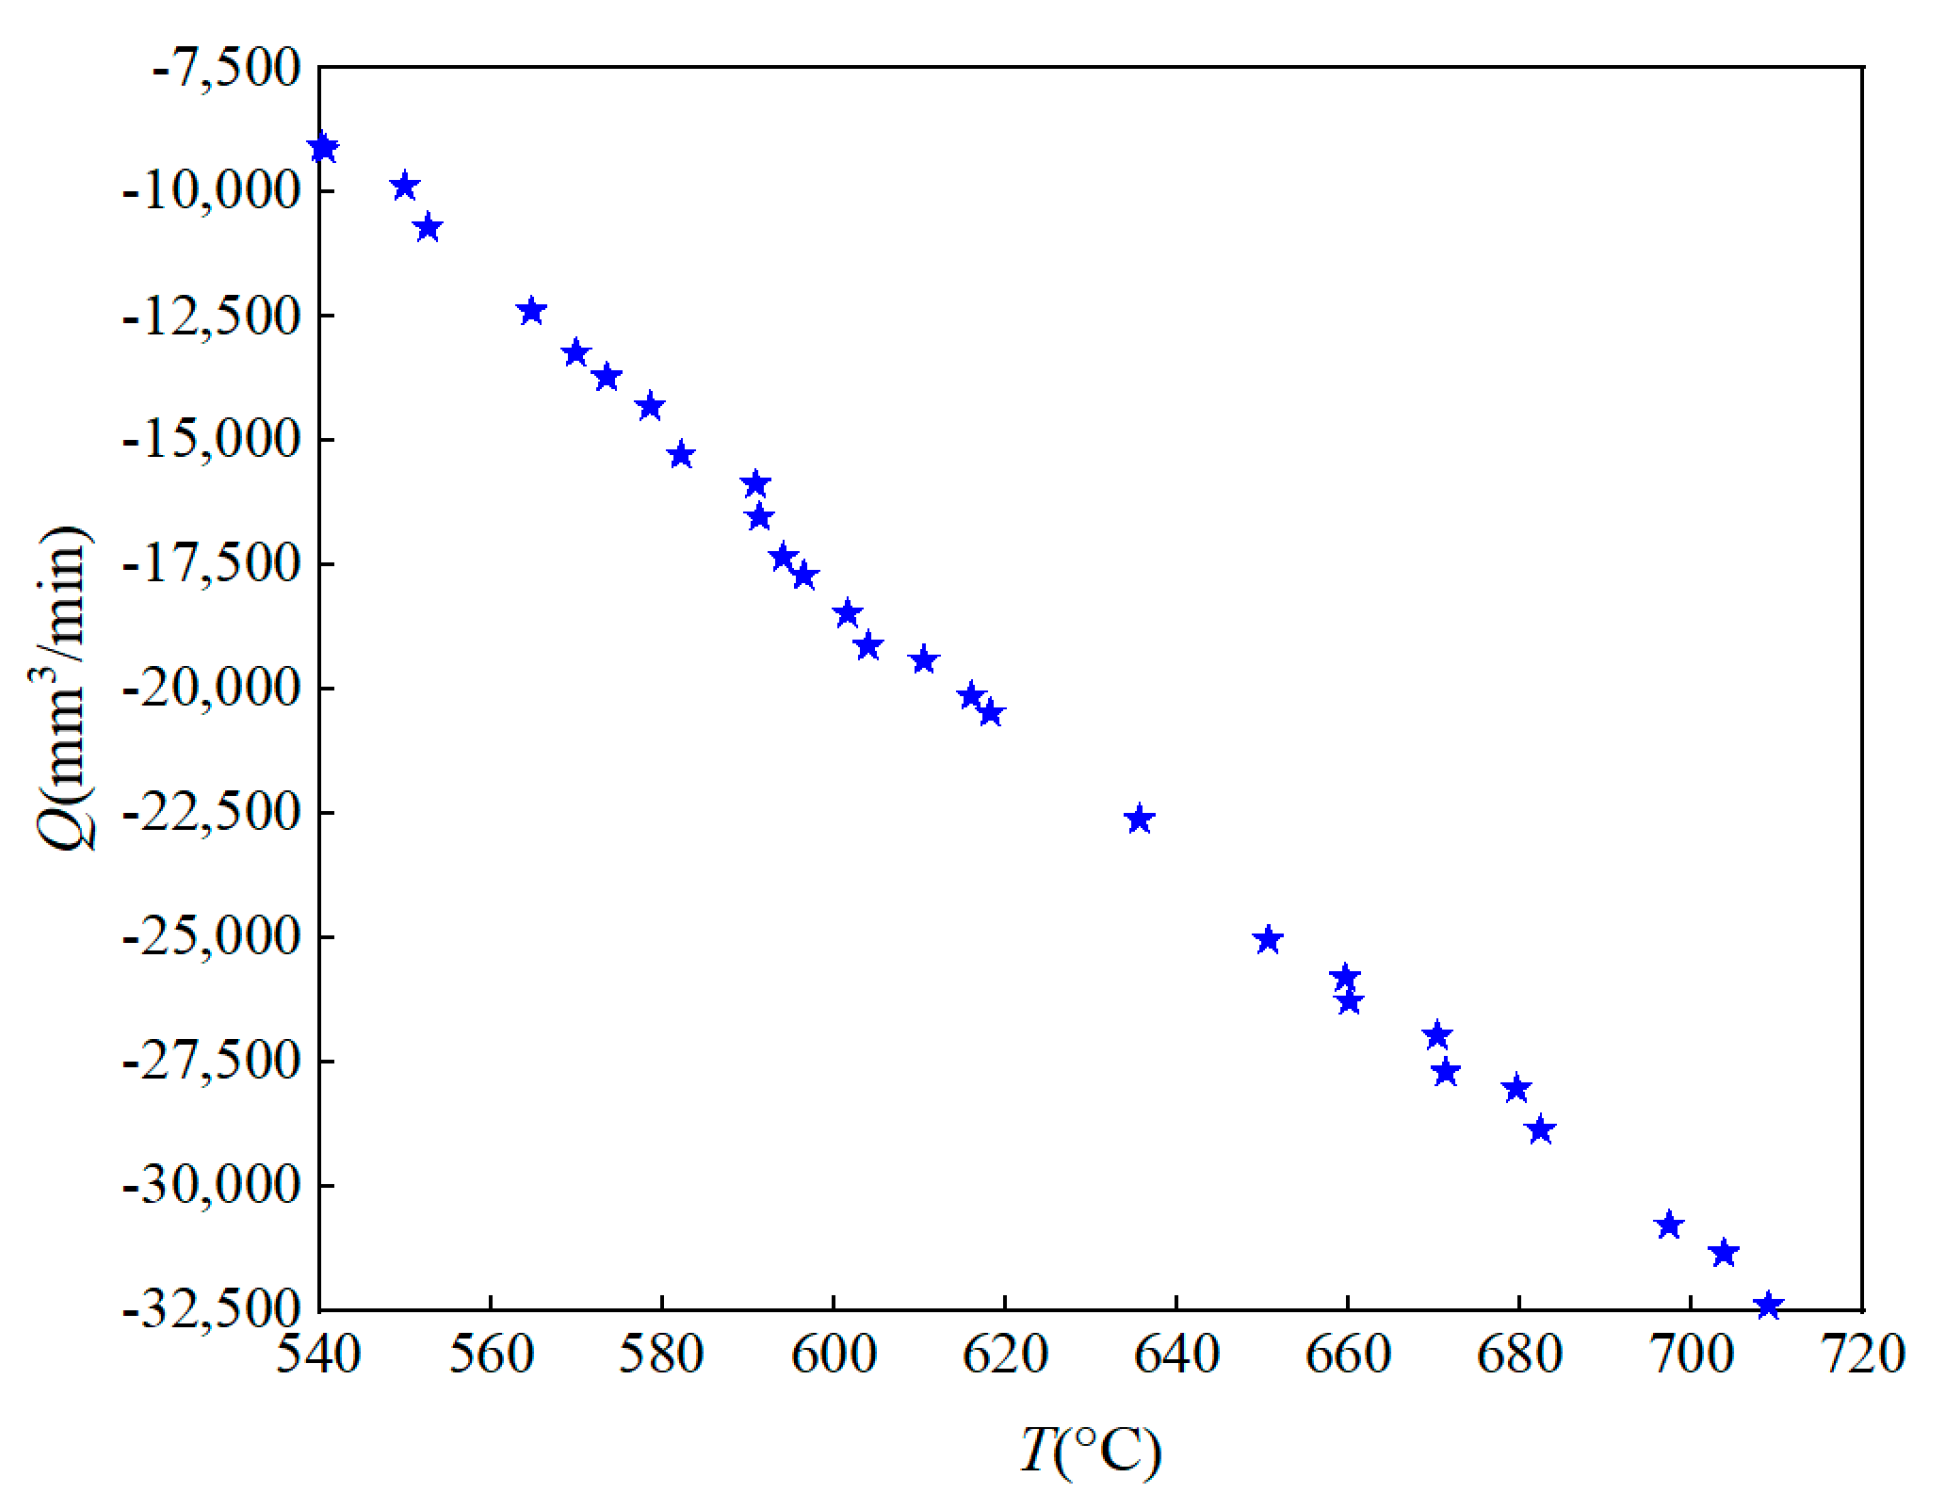
| Number | T (°C) | ||||
|---|---|---|---|---|---|
| A1 | 188.08541 | 0.0406 | 2.48802 | 540.29024 | −9070.72647 |
| A2 | 191.21765 | 0.0583 | 2.48442 | 569.94189 | −13,223.27547 |
| A3 | 251.56217 | 0.07634 | 2.46614 | 635.65477 | −22,611.9388 |
| A4 | 203.50428 | 0.07651 | 2.48388 | 601.58856 | −18,465.67747 |
| A5 | 201.09502 | 0.06932 | 2.48247 | 591.35964 | −16,522.64736 |
| A6 | 295.59058 | 0.07904 | 2.48303 | 671.34076 | −27,698.27075 |
| A7 | 268.83171 | 0.07841 | 2.48765 | 650.66639 | −25,037.65621 |
| A8 | 191.76944 | 0.05446 | 2.48339 | 564.76379 | −12,383.03666 |
Disclaimer/Publisher’s Note: The statements, opinions and data contained in all publications are solely those of the individual author(s) and contributor(s) and not of MDPI and/or the editor(s). MDPI and/or the editor(s) disclaim responsibility for any injury to people or property resulting from any ideas, methods, instructions or products referred to in the content. |
© 2023 by the authors. Licensee MDPI, Basel, Switzerland. This article is an open access article distributed under the terms and conditions of the Creative Commons Attribution (CC BY) license (https://creativecommons.org/licenses/by/4.0/).
Share and Cite
Cheng, Y.; Gai, X.; Guan, R.; Jin, Y.; Lu, M. Temperature Experiment and Parameter Optimization of Cemented Carbide Tool in Milling 508III Steel. Materials 2023, 16, 2833. https://doi.org/10.3390/ma16072833
Cheng Y, Gai X, Guan R, Jin Y, Lu M. Temperature Experiment and Parameter Optimization of Cemented Carbide Tool in Milling 508III Steel. Materials. 2023; 16(7):2833. https://doi.org/10.3390/ma16072833
Chicago/Turabian StyleCheng, Yaonan, Xiaoyu Gai, Rui Guan, Yingbo Jin, and Mengda Lu. 2023. "Temperature Experiment and Parameter Optimization of Cemented Carbide Tool in Milling 508III Steel" Materials 16, no. 7: 2833. https://doi.org/10.3390/ma16072833