Article

Effect of Annealing Temperature on Electrochemical Properties of Zr56Cu19Ni11Al9Nb5 in PBS Solution

1
School of Materials Science and Engineering, Wuhan University of Technology, Wuhan 430070, China
2
Yang Jiang Alloy Laboratory, Yangjiang 529568, China
3
Xiangyang City Liqiang Mechanics Limited Company, Xiangyang 441799, China
*
Author to whom correspondence should be addressed.
Materials 2023, 16(9), 3389; https://doi.org/10.3390/ma16093389
Submission received: 13 February 2023 / Revised: 14 April 2023 / Accepted: 18 April 2023 / Published: 26 April 2023

Abstract

:
The electrochemical properties of as-cast Zr56Cu19Ni11Al9Nb5 metallic glass and samples annealed at different temperatures were investigated using potentiodynamic polarization tests and electrochemical impedance spectroscopy (EIS) in phosphate buffer saline (PBS) solution. It was shown that passivation occurred for the as-cast sample and the samples annealed at 623–823 K, indicating good corrosion resistance. At higher annealing temperature, the corrosion resistance first increased, and then decreased. The sample annealed at 823 K exhibited the best corrosion resistance, with high spontaneous corrosion potential Ecorr at −0.045 VSCE, small corrosion current density icorr at 1.549 × 10⁻⁵ A·cm−2, high pitting potential Epit at 0.165 VSCE, the largest arc radius, and the largest sum of Rf and Rct at 5909 Ω·cm2. For the sample annealed at 923 K, passivation did not occur, with low Ecorr at −0.075 VSCE, large icorr at 1.879 × 10⁻⁵ A·cm−2, the smallest arc radius, and the smallest sum of Rf and Rct at 2173 Ω·cm2, which suggested the worst corrosion resistance. Proper annealing temperature led to improved corrosion resistance due to structural relaxation and better stability of the passivation film, however, if the annealing temperature was too high, the corrosion resistance deteriorated due to the chemical inhomogeneity between the crystals and the amorphous matrix. Optical microscopy and scanning electron microscopy (SEM) examinations indicated that localized corrosion occurred. Results of energy dispersive X-ray spectroscopy (EDS) and X-ray photoelectron spectroscopy (XPS) illustrated that the main corrosion products were ZrO2, CuO, Cu2O, Ni(OH)2, Al2O3, and Nb2O5.

1. Introduction

Zr-based bulk metallic glasses (BMGs) have attracted intense concern due to their high strength, high hardness, large elastic limit, good corrosion resistance, good glass-forming ability (GFA), large critical size, and good biocompatibility [1,2,3,4,5,6]. Corrosion resistance was affected by the chemical composition, microstructure, heat treatment conditions, the types and concentrations of corrosive media, temperature, and so on. With higher Nb content, the corrosion resistance of Zr46Cu30.14−xNbxAg8.36Al8Be7.5 (x = 0, 2, 5, 10) in 0.1 mol/L HCl, 0.5 mol/L NaCl, and 0.5 mol/L H2SO4 solutions was improved due to the promoted oxidation of Zr and thicker oxide film [7]. The electrochemical properties of Zr56.2Ti13.8Nb5.0Cu6.9Ni5.6Be12.5 composite with crystalline dendrites in an amorphous matrix in 1 mol/L NaCl solution showed that corrosion in the amorphous matrix was faster [8]. In 1 mol/L HCl solution, the corrosion resistance is as follows: Zr55Ti4Y1Al10Cu20Ni7Co2Fe1 > Zr50Ti4Y1Al10Cu25Ni7Co2Fe1 > Zr55Ti4Y1Al12Cu18Ni7Co2Fe1 > Zr60Al12Cu28 > Zr60Al10Cu30 > Zr55Al10Cu35 [9]. Zr55Ti4Y1Al10Cu20Ni7Co2Fe1 exhibited the highest corrosion potential Ecorr at −0.420 VSCE, and the smallest corrosion current density icorr at 1.0 × 10⁻⁷ A·cm−2, suggesting the best corrosion resistance. Zr55Al10Cu35 illustrated the lowest Ecorr at −1.165 VSCE, and the largest icorr at 3.0 × 10⁻⁷ A·cm−2, suggesting the worst corrosion resistance. The corrosion resistance is better with higher Ecorr and smaller icorr. Zr55Ti4Y1Al10Cu20Ni7Co2Fe1, Zr50Ti4Y1Al10Cu25Ni7Co2Fe1 and Zr55Ti4Y1Al12Cu18Ni7Co2Fe1 showed higher content of Ti (4 at.%), Ni (7 at.%), and Co (2 at.%) and lower content of Cu (18–25 at.%) than Zr60Al12Cu28, Zr60Al10Cu30, and Zr55Al10Cu35, with better corrosion resistance. Cu decreased the corrosion resistance due to the deterioration of the protection of the film, and Ti, Ni, and Co increased the corrosion resistance because of the enhancement of the protection of the film. The electrochemical properties of Zr52Al10Ni6Cu32 in 0.05–0.5 mol/L NaCl and 0.05–0.5 mol/L NaF solutions indicated that corrosion resistance decreased with higher concentrations of Cl and F [10]. Zr60Fe10Cu20Al10 samples were prepared using selective laser melting with a laser power of 200 W and an exposure time of 40–70 μs, and their corrosion resistance in 3.5 wt.% NaCl solution decreased with the increase in exposure time [11].
Zr-based BMGs showed promising biomedical applications, such as orthopedic and dental device materials [12]. Zr55.8Al19.4Co17.36Cu7.44 exhibited good corrosion resistance in phosphate-buffered saline (PBS) solution, combined with good glass-forming ability, a large critical diameter of 12 mm, a high yield strength of 2 GPa, and a high fracture toughness of 120 MPa·m1/2 [13]. Zr60.5Hf3Al9Fe4.5Cu23 showed good corrosion resistance in PBS solution, a large critical diameter of 10 mm, a high yield strength of 1.64 GPa, a large plastic strain of 4.0%, and good biocompatibility and wear resistance [14]. Zr58.6Al15.4Co18.2Cu7.8 illustrated good corrosion resistance in PBS solution, a large critical diameter of 10 mm, a high yield strength of 1.95 GPa, a large plastic strain of 2.0%, and good antibacterial properties [15]. Zr65−xTixCu20Al10Fe5 (x = 0–8) exhibited better corrosion resistance with higher Ti content, and the mechanical properties were the best with 2% Ti [16]. The corrosion resistance of Zr53Al16Co26M5 (M = Pd, Au and Pt) in PBS solution was the best for Pt due to the increased Zr content and decreased Al content in the passive film, and the worst for Au [17]. Zr45Ti36Fe11Al8 showed better corrosion resistance than commercially pure Ti in PBS solution [18]. Zr55Cu30Ni5Al10 exhibited poorer corrosion resistance than the medical grade ASTM F 75 cast CoCrMo alloy and AISI 316LVM low carbon vacuum re-melted stainless steel alloy in PBS solution at a body temperature of 310 K [19]. Zr40Ti37Co12Ni11, Zr50Ti32Cu13Ag5, Zr46Ti40Ag14, and Zr46Ti43Al11 indicated better corrosion resistance than commercially pure Ti and 316L stainless steel in PBS solution [20,21].
The mechanical properties and the corrosion and electrochemical properties of Zr-based BMGs were affected by annealing conditions, such as annealing temperature and annealing time. Proper annealing led to the formation of nanocrystals in the amorphous matrix, which acted as the initiation sites for shear bands and hindered the propagation of shear bands. Therefore, the shear band density was increased, resulting in improved plasticity [22]. If the annealing temperature was too high or the annealing time was too long, large size crystals were formed in the amorphous matrix, and strength and plasticity decreased due to the stress concentration and formation of microcracks at the interfaces. Zr65Cu17.5Fe10Al7.5 samples were annealed at 573 K, below the glass transition temperature Tg, for 0.5–4 h, and a large plasticity of 7.1%, high hardness of 487 HV, and improved pitting corrosion resistance in 3.5% NaCl solution was obtained for the sample annealed for 1 h, due to the formation of nanocrystals in the amorphous matrix, the reduced free volume, and the increased shear band density [22]. With the increase in annealing time, the plasticity, the hardness, the pit potential Epit, and the passivation region Epit–Ecorr first increased, and then decreased. Zr58Nb3Cu16Ni13Al10 samples were annealed at 523 K, 673 K (lower than Tg), 773 K (higher than the crystallization temperature Tx), and 873 K for 6 h, and at the higher annealing temperature, the corrosion resistance in 1 mol/L H2SO4 solution at 333 K deteriorated [23]. Zr60Cu20Ni8Al7Hf3Ti2 samples were annealed below Tg, and the good corrosion resistance in H2SO4 solution was maintained [24]. Zr50.7Ni28Cu9Al12.3 samples were annealed at 719 K (Tg~Tx), 768 K (>Tx), and 810 K for 30 min, and the electrochemical properties in 0.5 mol/L H2SO4, 1 mol/L NaCl, and 1 mol/L HCl solutions showed that the corrosion resistance was the best for the sample annealed at 768 K due to the proper quantity of ZrO2 nanocrystals in the amorphous matrix [25]. Zr41.2Cu12.5Ni10Ti13.8Be22.5 and Zr57Cu15.4Ni12.6Al10Nb5 samples were annealed at 0.9 Tg for 4 h, and the corrosion resistance in NaCl solution was improved due to the reduced free volume [26]. Zr68Al8Ni8Cu16 samples were annealed at 673 K and 713 K with a crystallinity of 10% and 77%, and the corrosion resistance in 1 mol/L HCl solution decreased at the higher annealing temperature [27]. Zr59Ti6Cu17.5Fe10Al7.5 samples were annealed at 573 K (<Tg) for 0.5–4 h, and the corrosion resistance remained good in PBS solution [28].
The effects of annealing temperature and time on the corrosion and electrochemical properties of Zr-based BMGs and the composites in simulated body fluids, such as PBS solution, were rarely reported, and systematic study was needed. In this work, the corrosion and electrochemical properties of the as-cast Zr56Cu19Ni11Al9Nb5 metallic glass and the samples annealed at different temperatures (<Tg, Tg–Tx, >Tx) in PBS solution were investigated using potentiodynamic polarization tests, electrochemical impedance spectroscopy (EIS), optical microscopy, scanning electron microscopy (SEM), energy dispersive X-ray spectroscopy (EDS), and X-ray photoelectron spectroscopy (XPS). Our findings make contributions to the research and development of Zr-based metallic glass and composites in biomedical applications.

2. Materials and Methods

2.1. Material Preparation

Zr56Cu19Ni11Al9Nb5 metallic glass was prepared using copper-mold suction after the arc-melting of Zr, Cu, Ni, Al, and Nb with high purity under vacuum conditions and filled with Ar. Remelting was carried out 5 times to obtain chemical homogeneity. The samples were cut to a size around 5 mm × 4 mm × 1 mm using a SYJ-160 low speed diamond saw (Shenyang Kejing Automatic Equipment Limited Company, Shenyang, China). The samples were annealed at 623 K (below Tg), 723 K (between Tg and Tx), 823 K (above Tx), and 923 K (far above Tx) for 30 min, and then cooled to room temperature. The sample surfaces were ground using 800, 1200, and 1500 grit sandpaper, polished using 2.5 and 0.5 μm diamond paste, and then cleaned in acetone.

2.2. Tests

Electrochemical tests of the as-cast samples and the annealed samples in PBS solution were performed using a CHI660E electrochemical station (Shanghai CH Instruments, Shanghai, China). Saturated calomel electrode (SCE) was the reference electrode, and the graphite electrode was the counter electrode. The sample was the working electrode. The PBS solution contained 8.0 g/L NaCl, 1.44 g/L Na2HPO4, 0.24 g/L KH2PO4, and 0.20 g/L KCl, and it was prepared using reagent-grade chemicals and deionized water. The electrochemical tests were performed in the open air at room temperature. In potentiodynamic polarization tests and EIS tests, the electrodes were first stabilized in PBS solution at open circuit potential (OCP) for 60 min. In potentiodynamic polarization tests, the potential was scanned from −0.8 VSCE to 0.8 VSCE at the rate of 0.33 mV/s, and auto-sensitivity was set. In EIS tests, alternative current impedance mode was chosen, and the initial potential was set at the OCP. The frequency was in the range of 10−2–105 Hz. The amplitude was 5 mV, and the stabilization period was 2 s. The complex impedance was measured. Zsimpwin software was used to fit the EIS data using the proper equivalent circuit. SH11/YF-III optical microscopy, Zeiss Ultra Plus field emission scanning electron microscopy, X-Max 50× energy dispersive X-ray spectroscopy, and Thermo Scientific ESCALAB 250Xi X-ray photoelectron spectroscopy were used to study the corrosion morphology and corrosion products after the potentiodynamic polarization tests.

3. Results and Discussion

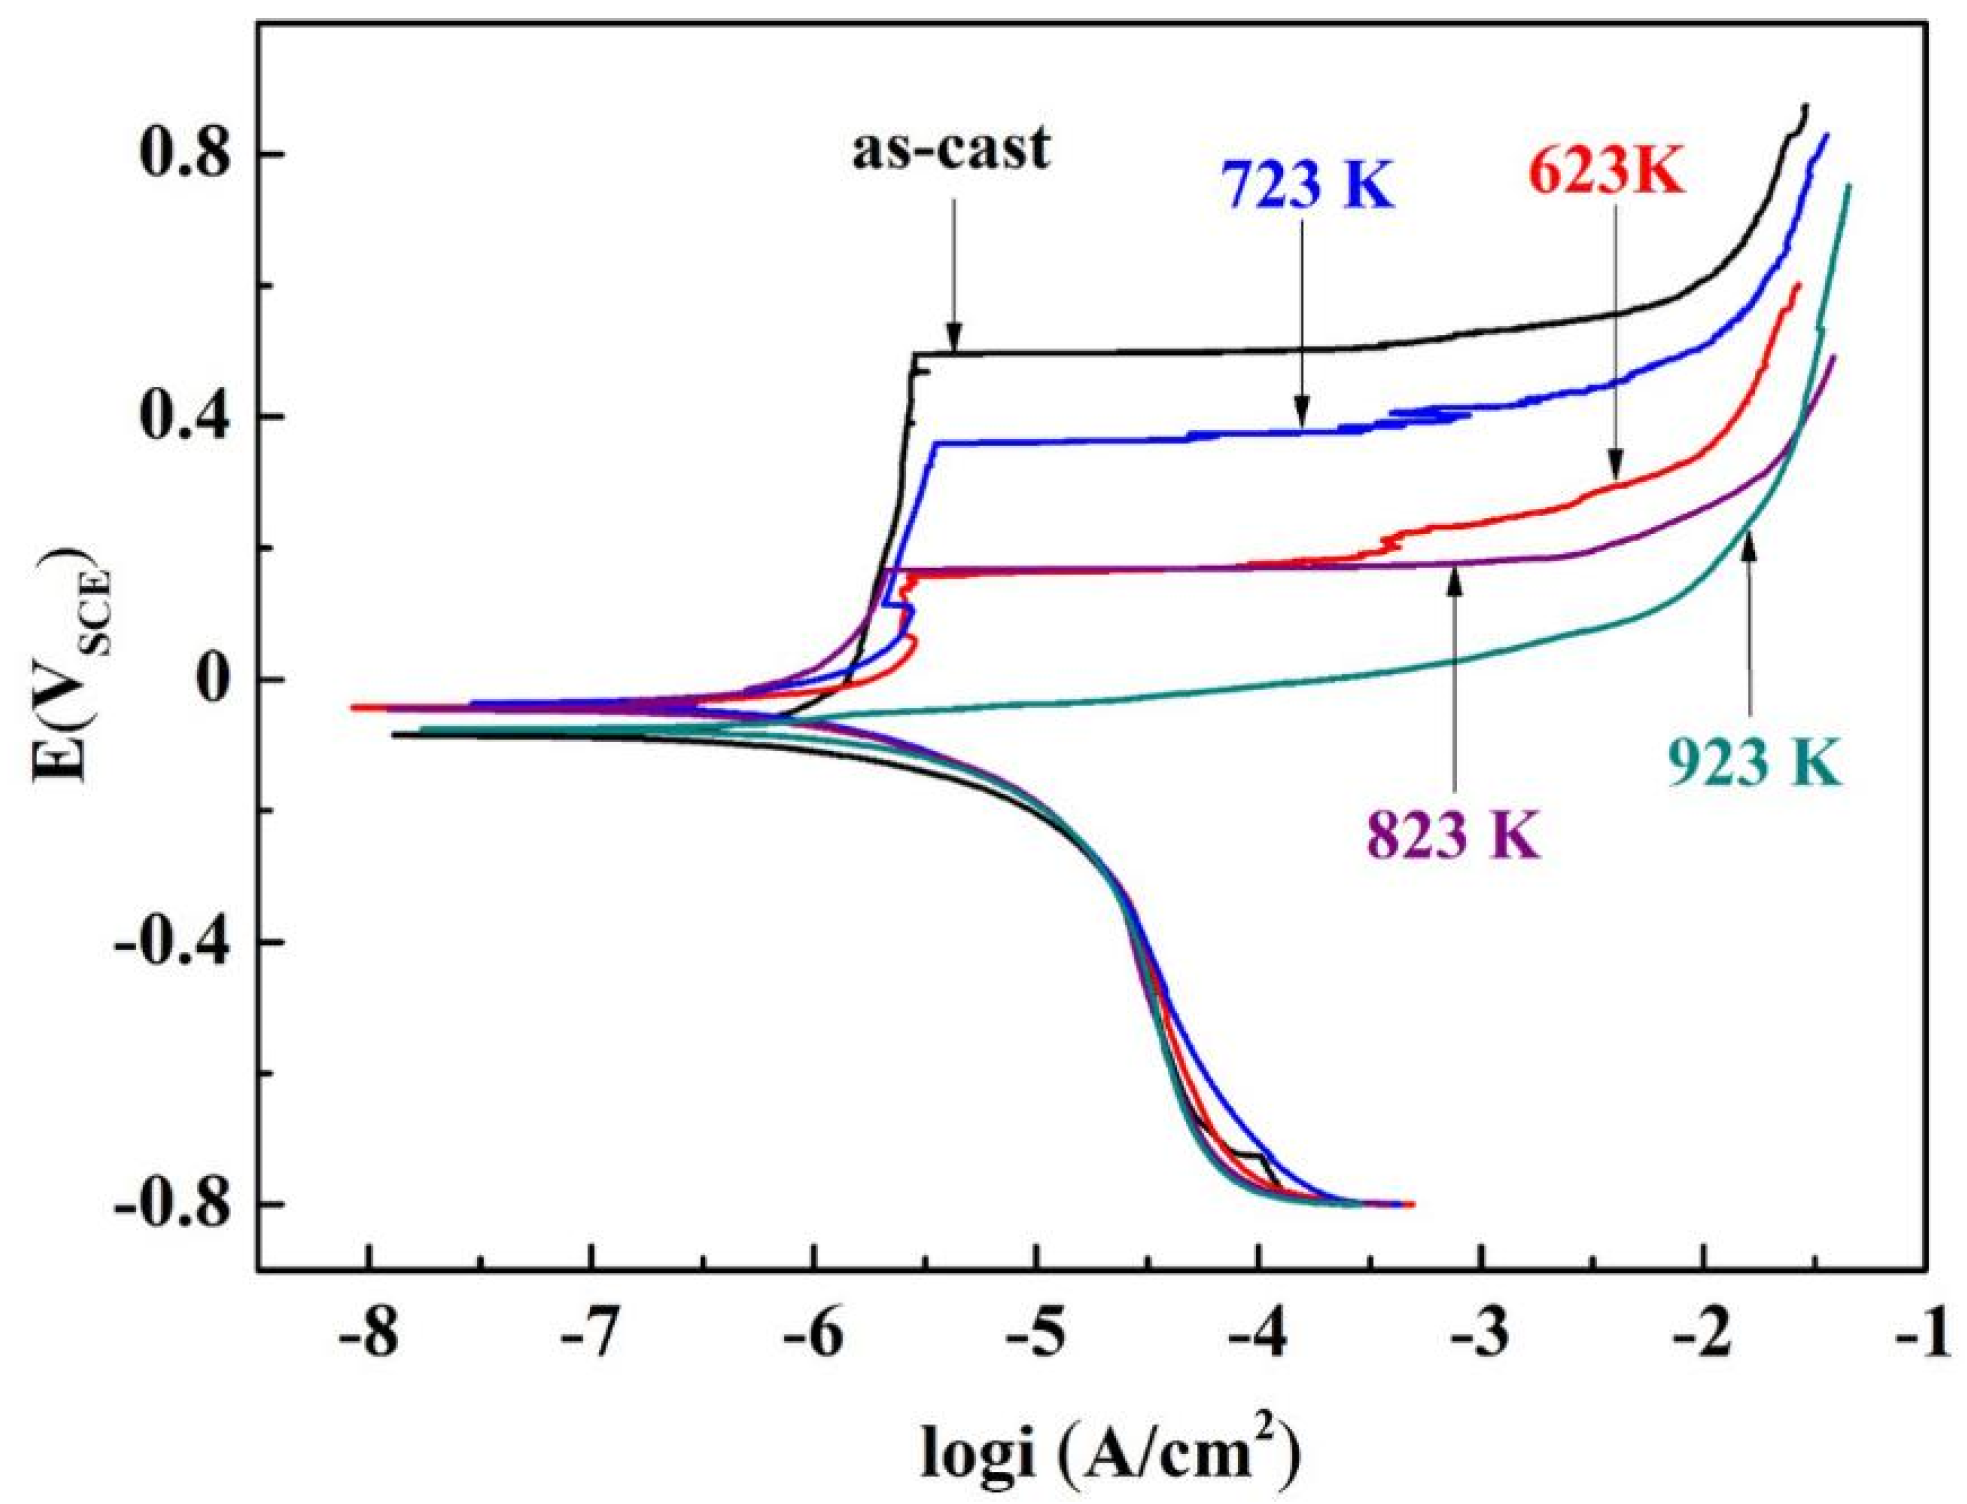
3.1. Electrochemical Tests

Figure 1 shows the potentiodynamic polarization curves for the as-cast Zr56Cu19Ni11Al9Nb5 sample and the samples annealed at 623–923 K in PBS solution, and Table 1 summarizes the obtained electrochemical parameters. Similar trends were observed for the as-cast sample and the samples annealed at 623–823 K, and passivation occurred. With the increase in annealing temperature, the spontaneous corrosion potential Ecorr gradually increased and then decreased, and the corrosion current density icorr gradually decreased and then increased. Corrosion resistance increased with higher Ecorr, higher pitting potential Epit, smaller icorr, and a larger passivation region Epit–Ecorr. For the as-cast sample, Ecorr was the lowest at −0.083 VSCE, the pitting potential Epit was the highest at 0.496 VSCE, and the width of passivation region Epit–Ecorr was the largest at 0.579 V. Passivation occurred for the as-cast sample and the samples annealed at 623 K (below Tg), 723 K (between Tg and Tx), and 823 K (above Tx), indicating good corrosion resistance. For the sample annealed at 623 K, Ecorr was higher at −0.042 VSCE, icorr was smaller at 1.466 × 10⁻⁵ A·cm−2, Epit was lower at 0.157 V, and the passivation region Epit–Ecorr was smaller at 0.199 V, suggesting similar corrosion resistance. For the sample annealed at 723 K, Ecorr was the highest at −0.036 VSCE, and icorr was the smallest at 9.977 × 10⁻⁶ A·cm−2, with a wide passivation region Epit–Ecorr of 0.395 V, indicating excellent corrosion resistance. The sample annealed at 823 K exhibited high Ecorr at −0.045 VSCE, small icorr at 1.549 × 10⁻⁵ A·cm−2, high Epit at 0.165 VSCE, and a wide passivation region Epit–Ecorr of 0.210 V, indicating good corrosion resistance. For the sample annealed at 923 K, icorr was the largest at 1.879 × 10⁻⁵ A·cm−2, and passivation did not occur, indicating the worst corrosion resistance in PBS solution. With the increase in annealing temperature, the corrosion resistance gradually increased and then decreased.
Figure 2 illustrates the Nyquist plots, Bode plots, and the equivalent circuit diagram for the EIS results of the as-cast Zr56Cu19Ni11Al9Nb5 sample and the samples annealed at 623–923 K in PBS solution, and Table 2 shows the fitting parameters. The Nyquist plots exhibit half-circles, which suggest that the control step is the electrochemical reaction accompanied by the transfer of electrons. The Bode plots illustrate two time-constants, with frequencies around 3 Hz and 100 Hz. The maximum phase is reached around 3 Hz. The equivalent circuit diagram as shown in Figure 2c was previously used for the fitting of EIS results of Ni70Cr21Si0.5B0.5P8 and Ni72.65Cr7.3Si6.7B2.15Fe8.2Mo3 glassy alloys in 1–12 mol/L HNO3 solution [29], and EIS results of Zr65Cu17.5Al7.5Ni10−xCox in 3.5% NaCl solution [30]. The passivation film consists of two layers, i.e., the compact inner layer and the porous outer layer. Rs is the solution resistance between the working electrode and the reference electrode. Rf is the film resistance, and Rct is the charge transfer resistance at the interface between the solution and the film. The constant phase element (CPE) represents the capacitance, considering the surface roughness and inhomogeneity. CPE1 and CPE2 are the constant phase elements for the inner layer and outer layer of the passivation film. The CPE impedance is Z C P E = Y 0 1 ω n cos n π 2 j   sin n π 2 . Y0 is the constant, ω is the angular frequency, and n is the parameter between 0 and 1. The sample annealed at 823 K illustrates the largest arc radius and the largest sum of Rf and Rct, 5909 Ω·cm2, indicating the best corrosion resistance in PBS solution. The sample annealed at 923 K illustrates the smallest arc radius and the smallest sum of Rf and Rct, 2173 Ω·cm2, indicating the worst corrosion resistance in PBS solution. With the increasing annealing temperature, the corrosion resistance first increases, and then decreases, which is in agreement with the potentiodynamic polarization results.

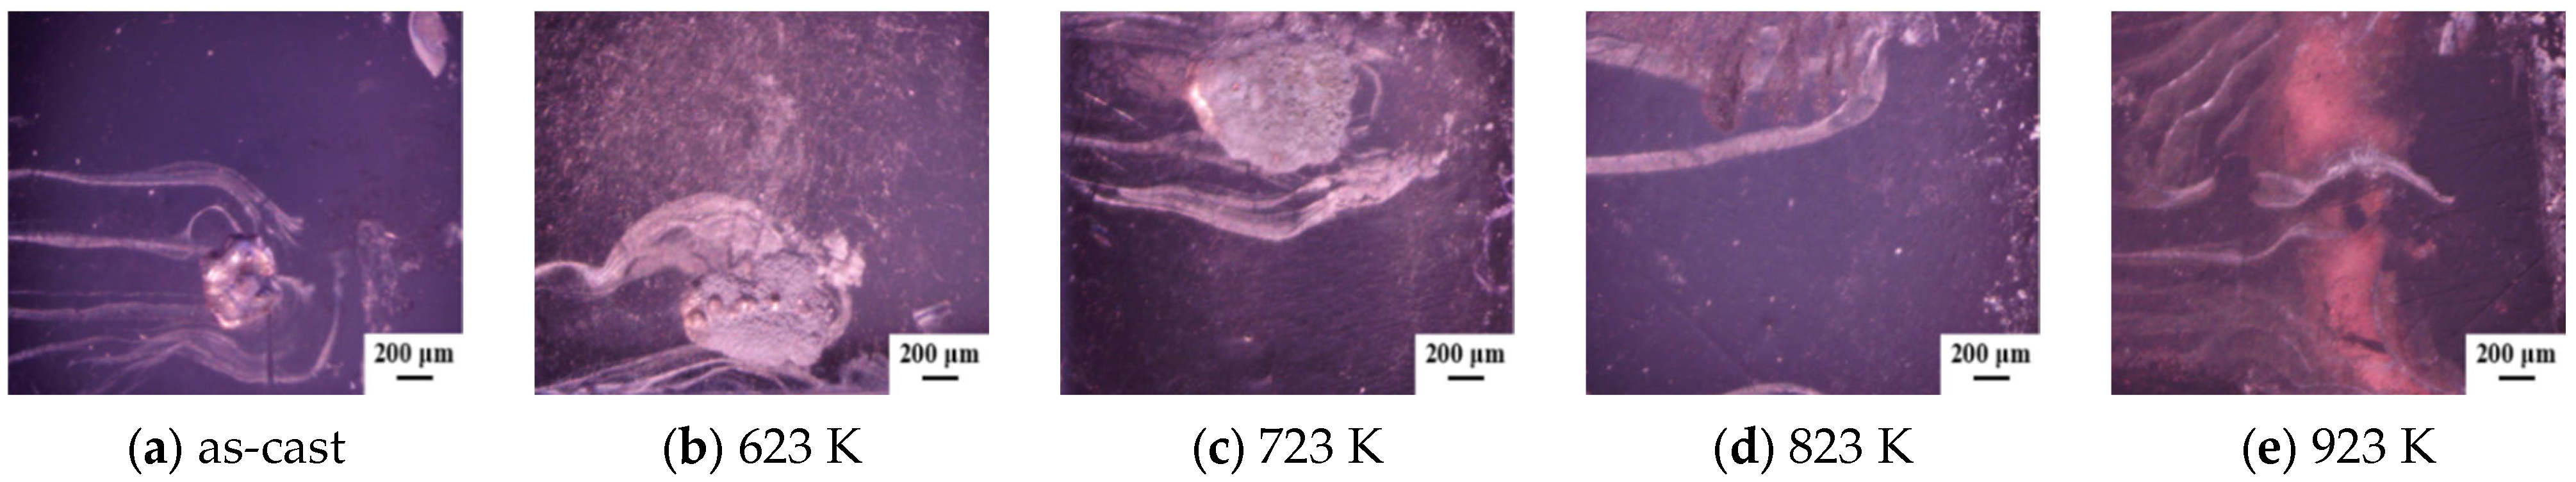
3.2. Optical Microscopy Observation

Figure 3 shows the optical microscopy images of the as-cast Zr56Cu19Ni11Al9Nb5 sample and the samples annealed at 623–923 K after potentiodynamic polarization tests in PBS solution. Obvious localized corrosion occurred for the as-cast sample and the samples annealed at 623 K and 723 K. Minor corrosion was observed in the sample annealed at 923 K. Corrosion was not obvious for the sample annealed at 823 K, suggesting good corrosion resistance.

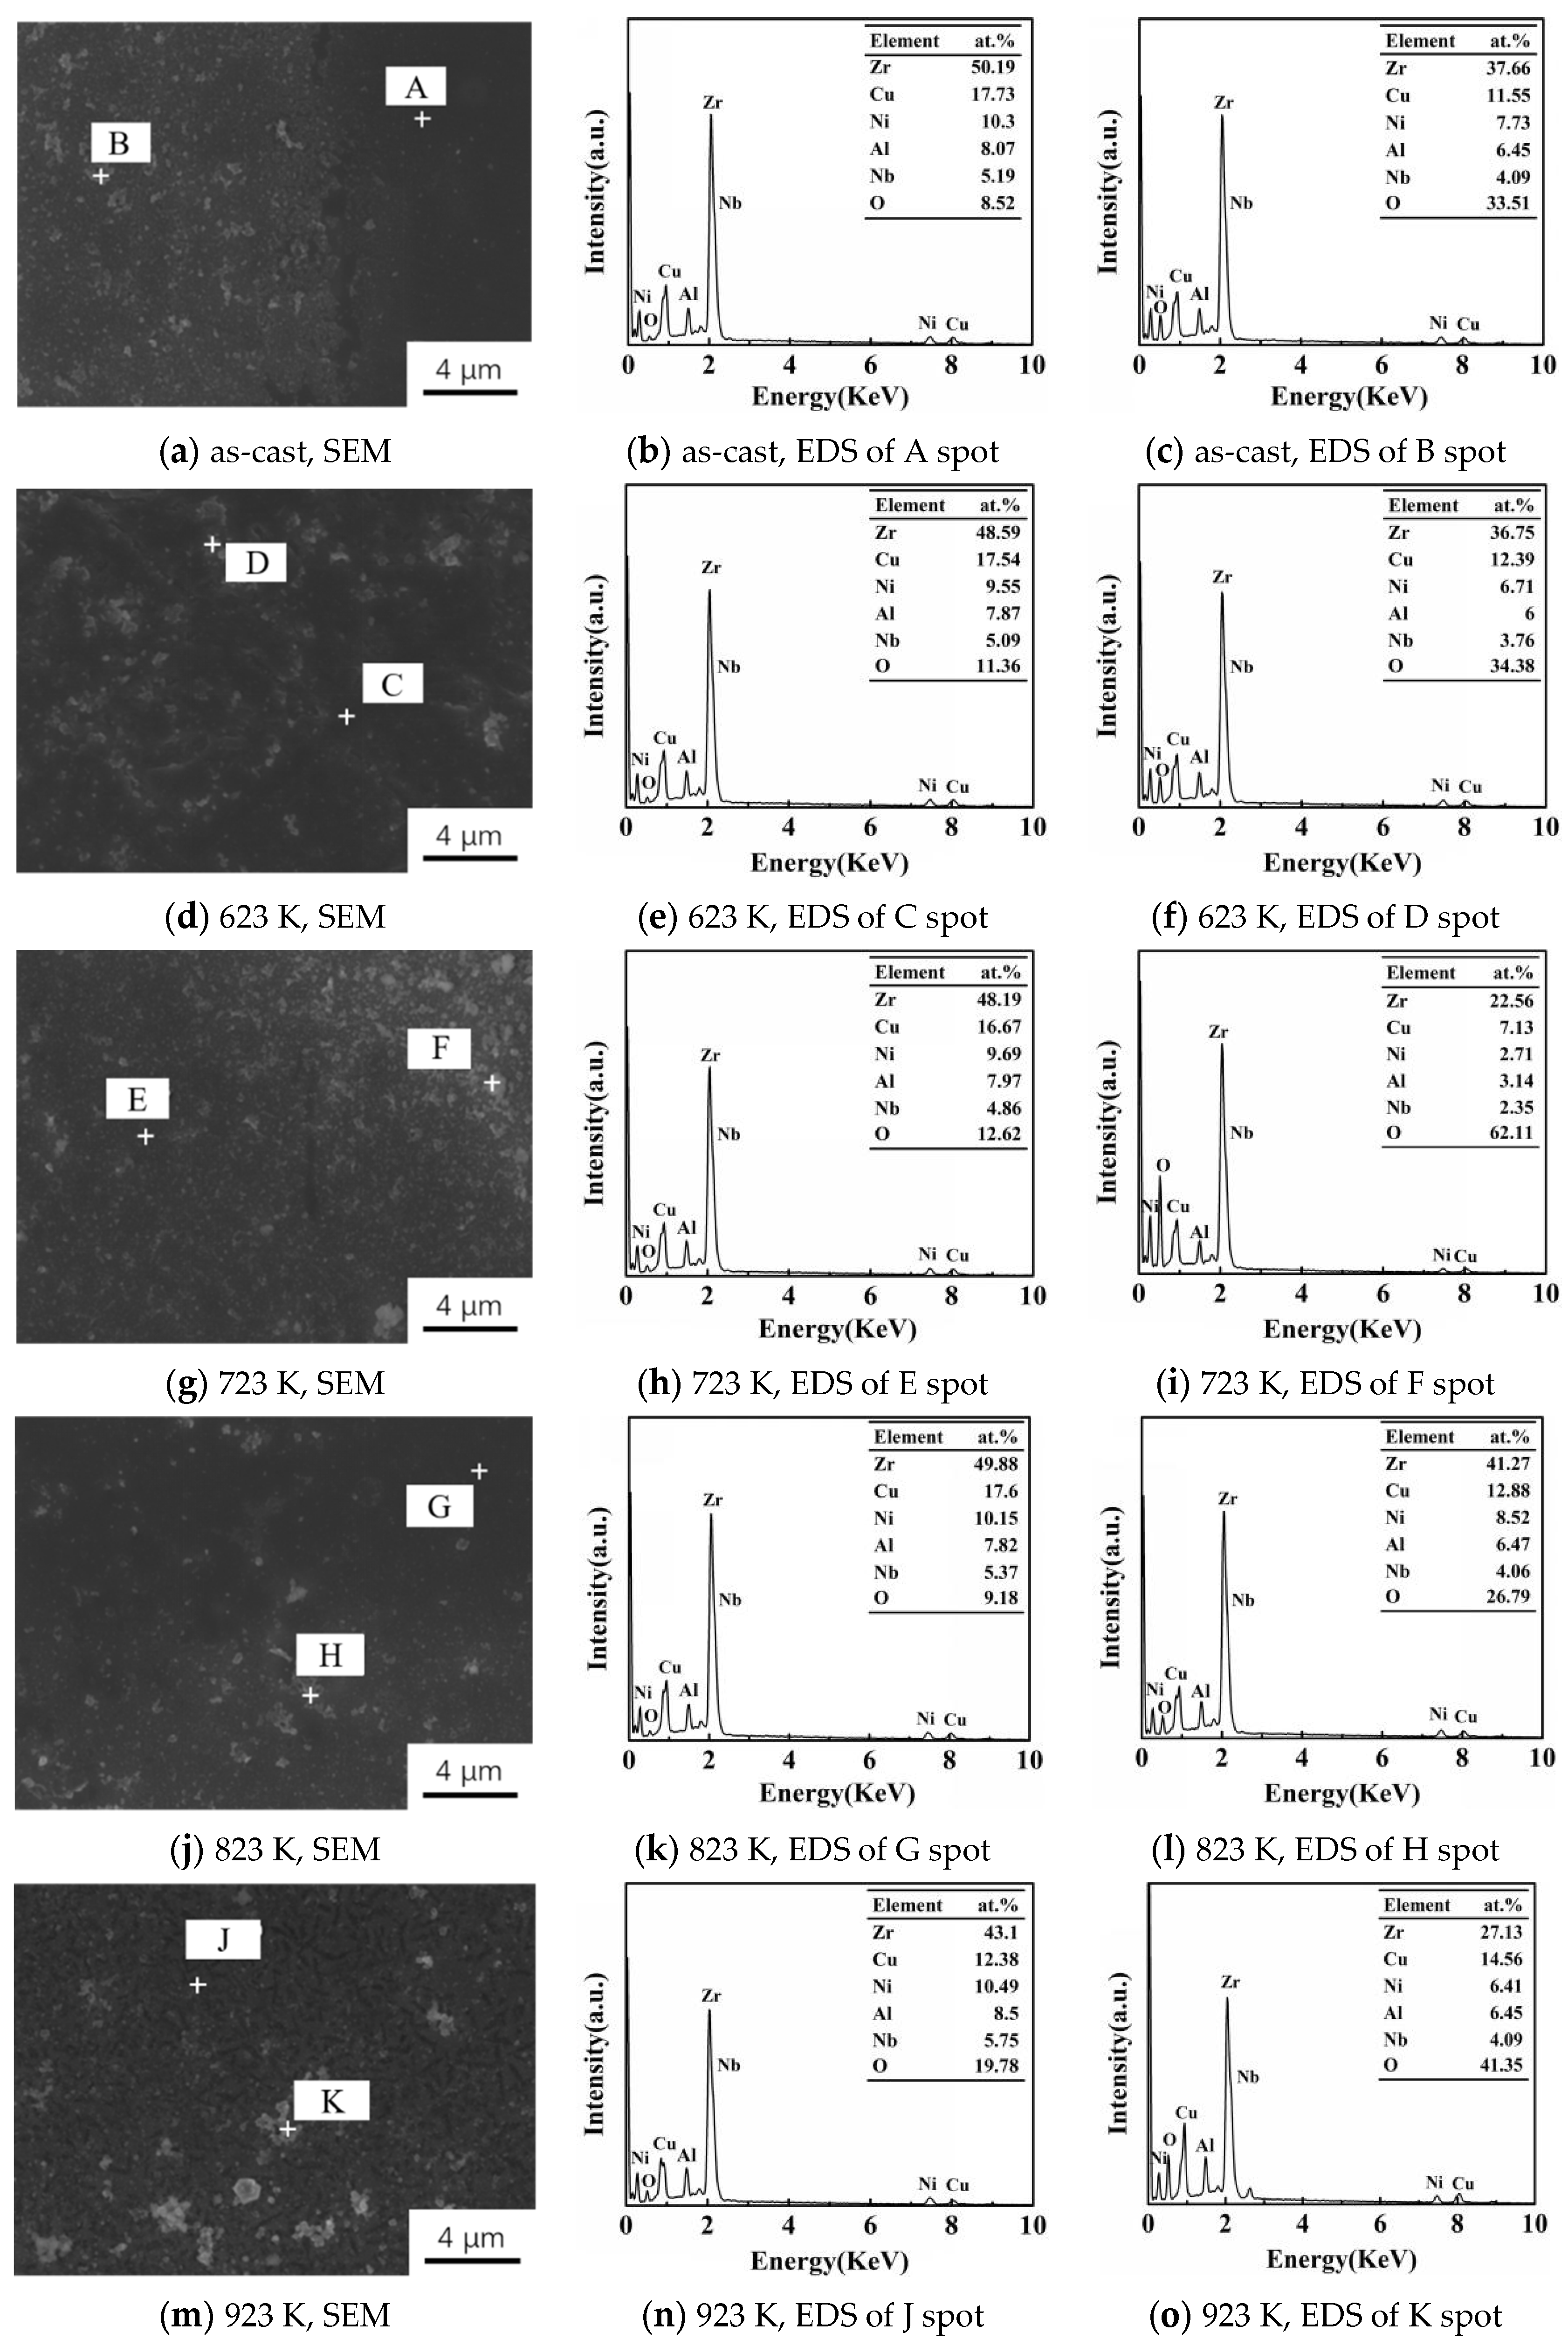
3.3. SEM and EDS Analysis

SEM images and EDS analysis of the as-cast Zr56Cu19Ni11Al9Nb5 sample and the samples annealed at 623–923 K after potentiodynamic polarization tests in PBS solution are shown in Figure 4 and Figure 5. Localized corrosion occurred for all the samples. The weakest corrosion was observed in the sample annealed at 823 K, indicating the best corrosion resistance. Spots A, C, E, G, and J are in the smooth non-corroded area, in which the oxygen content was low, less than 20%, and the content of Zr, Cu, Ni, Al, and Nb was close to the original content. On the other hand, spots B, D, F, H, and K are in the corroded area, in which the oxygen content was higher, and the content of Zr, Cu, Ni, Al, and Nb was lower than the original content.
While annealing below Tg, structural relaxation led to reduced free volume, resulting in improved corrosion resistance [22,26]. When the annealing temperature was slightly above Tx, crystallization occurred, leading to the formation of nanocrystals in the amorphous matrix. The stability of the passivation film was increased, resulting in better corrosion resistance. When the annealing temperature was well above Tx, the size of the crystals increased. Corrosion was susceptible to occurring at the interface between the crystals and amorphous matrix due to the chemical inhomogeneity, leading to reduced corrosion resistance.

3.4. XPS Analysis

Figure 6 shows the XPS analysis of the Zr56Cu19Ni11Al9Nb5 sample annealed at 723 K after the potentiodynamic polarization test in PBS solution. In the spectra, the peaks with binding energy of 182.58 eV and 184.88 eV represented Zr4+ 3d5/2 and Zr4+ 3d3/2. The peaks at 932.91 eV and 934.33 eV indicated Cu+ 2p3/2 and Cu2+ 2p3/2, and the peaks at 952.24 eV and 954.19 eV corresponded to Cu+ 2p1/2 and Cu2+ 2p1/2. The peaks at 856.29 eV and 862.38 eV suggested Ni2+ 2p3/2, and the peaks at 874.12 eV and 879.38 eV indicated Ni2+ 2p1/2. The peaks at 77.17 eV and 77.32 eV represented Al3+ 2p3/2 and Al3+ 2p1/2. The peaks at 198.47 eV and 207.11eV indicated Nb5+ 3d5/2, and the peaks at 200.93 eV and 209.92 eV represented Nb5+ 3d3/2. The peak at 530.95 eV suggested O2−. The corrosion products mainly consist of ZrO2, CuO, Cu2O, Ni(OH)2, Al2O3, and Nb2O5.
Relative to the potential of a standard hydrogen electrode (SHE), the electrode potential of Al/Al3+, Zr/Zr4+, Nb/Nb5+, Ni/Ni2+, Cu/Cu2+, and Cu/Cu+ is −1.662 VSHE, −1.529 VSHE, −1.200 VSHE, −0.250 VSHE, 0.337 VVSH, and 0.521 VSHE. At lower potential, the metal element is more active and is easier to corrode. Al, Zr, and Nb are more active than Ni and Cu, and they are corroded first with the corrosion products of Al2O3, ZrO2, and Nb2O5. Ni and Cu are then corroded with the corrosion products of Ni(OH)2, Cu2O, and CuO. The corrosion products of the Zr56Cu19Ni11Al9Nb5 sample are mainly ZrO2, CuO, Cu2O, Ni(OH)2, Al2O3, and Nb2O5. Passivation occurred due to the formation of oxide film or the adsorption of oxygen atoms or oxygen ions. The Cl ions in PBS solution, which contained 8.0 g/L NaCl, 0.20 g/L KCl, 1.44 g/L Na2HPO4 and 0.24 g/L KH2PO4, caused the localized corrosion of the as-cast and annealed Zr56Cu19Ni11Al9Nb5 samples. According to the oxide-film theory, the Cl ions caused the localized dissolution of the passivation film, leading to localized corrosion. According to the competitive adsorption theory, the localized preferential adsorption of Cl ions hindered the adsorption of oxygen atoms or oxygen ions, resulting in the localized corrosion.

4. Conclusions

Passivation occurred for the as-cast Zr56Cu19Ni11Al9Nb5 metallic glass and the samples annealed at 623 K (below Tg), 723 K (between Tg and Tx), and 823 K (above Tx), indicating good corrosion resistance in PBS solution. Passivation did not occur for the sample annealed at 923 K (far above Tx). With the increase in annealing temperature, the corrosion resistance first increased, and then decreased. The sample annealed at 823 K exhibited high Ecorr at −0.045 VSCE, small icorr at 1.549 × 10⁻⁵ A·cm−2, high Epit at 0.165 VSCE, a wide passivation region Epit–Ecorr of 0.210 V, the largest arc radius, and the largest sum of Rf and Rct, 5909 Ω·cm2, indicating the best corrosion resistance in PBS solution. For the sample annealed at 923 K, passivation did not occur, and the sample illustrated the highest icorr at 1.879 × 10⁻⁵ A·cm−2, the smallest arc radius, and the smallest sum of Rf and Rct, 2173 Ω·cm2, indicating the worst corrosion resistance in PBS solution.
Optical microscopy, SEM, EDS, and XPS analysis showed that localized corrosion occurred for the as-cast Zr56Cu19Ni11Al9Nb5 sample and the samples annealed at 623–923 K. In the non-corroded area, the content of Zr, Cu, Ni, Al, and Nb was close to the original content of the sample. In the corroded area, the content of Zr, Cu, Ni, Al, and Nb was lower than the original content. The main corrosion products are ZrO2, CuO, Cu2O, Ni(OH)2, Al2O3, and Nb2O5.
The proper annealing temperature led to improved corrosion resistance. When the annealing temperature was below Tg, structural relaxation led to reduced free volume, resulting in improved corrosion resistance. When the annealing temperature was slightly above Tx, crystallization started to occur, and the formation of nanocrystals in the amorphous matrix led to improved stability of the passivation film, resulting in better corrosion resistance. However, if the annealing temperature was well above Tx, the size of the crystals increased, and the chemical inhomogeneity led to corrosion at the interface between the crystals and amorphous matrix, resulting in reduced corrosion resistance. Zr56Cu19Ni11Al9Nb5 metallic glass and the samples annealed at the proper temperature are promising candidate materials for biomedical applications.

Author Contributions

Conceptualization, Z.Z.; methodology, Z.Z.; formal analysis, Z.Z., X.Z., X.T., Y.H. and X.Y.; investigation, Z.Z., X.Z., X.T., Y.H. and X.Y.; resources, X.Z., X.T., Y.H., H.H., T.C., Q.Z., X.Y. and Y.G.; writing—original draft preparation, Z.Z., X.Z. and X.Y.; writing—review and editing, Z.Z., X.Z., X.T., Y.H., H.H., T.C., Q.Z., X.Y. and Y.G.; supervision, Z.Z.; funding acquisition, Z.Z., X.Z., X.T. and Y.H. All authors have read and agreed to the published version of the manuscript.

Funding

This research was funded by the National Natural Science Foundation of China (grant number 51502229), the Start-Up Research Foundation of Wuhan University of Technology (grant number 101-40120189), and the National Innovation and Entrepreneurship Training Program for College Students (S202210497045 project funding).

Institutional Review Board Statement

Not applicable.

Informed Consent Statement

Not applicable.

Data Availability Statement

The data presented in this study are available on request from the corresponding authors. The data are not publicly available due to privacy reasons.

Acknowledgments

The authors would like to thank Junwei Wu for help with the sample preparation. They would also like to thank Lei Sun and Shumin Yue for valuable discussion.

Conflicts of Interest

The authors declare no conflict of interest.

References

  1. Cole, K.; Kirk, D.; Singh, C.; Thorpe, S. Optimizing electrochemical micromachining parameters for Zr-based bulk metallic glass. J. Manuf. Process. 2017, 25, 227–234. [Google Scholar] [CrossRef]
  2. Zhang, L.; Huang, H. Micro machining of bulk metallic glasses: A review. Int. J. Adv. Manuf. Technol. 2019, 100, 637–661. [Google Scholar] [CrossRef]
  3. Pan, J.; Ivanov, Y.P.; Zhou, W.H.; Li, Y.; Greer, A.L. Strain-hardening and suppression of shear-banding in rejuvenated bulk metallic glass. Nature 2020, 578, 559–562. [Google Scholar] [CrossRef]
  4. Geng, C.; Huang, B.; Zhang, N.; Yi, J.; Wang, Q.; Jia, Y.; Li, F.; Luan, J.; Hou, X.; Huang, W.; et al. Evolution of local densities during shear banding in Zr-based metallic glass micropillars. Acta Mater. 2022, 235, 118068. [Google Scholar] [CrossRef]
  5. Dhale, K.; Banerjee, N.; Outeiro, J.; Singh, R.K. Investigation of the softening behavior in severely deformed microm-achined sub-surface of Zr-based bulk metallic glass via nanoindentation. J. Non-Cryst. Solids 2022, 576, 121280. [Google Scholar] [CrossRef]
  6. Cai, Z.; Kang, S.; Lv, J.; Zhang, S.; Shi, Z.; Yang, Y.; Ma, M. Effect of adding remelting materials on the properties of die-cast Zr-based amorphous alloy gear castings. J. Non-Cryst. Solids 2022, 581, 121428. [Google Scholar] [CrossRef]
  7. Cao, Q.; Peng, S.; Zhao, X.; Wang, X.; Zhang, D.; Jiang, J. Effect of Nb substitution for Cu on glass formation and corrosion behavior of Zr Cu Ag Al Be bulk metallic glass. J. Alloys Compd. 2016, 683, 22–31. [Google Scholar] [CrossRef]
  8. Ayyagari, A.; Hasannaeimi, V.; Arora, H.; Mukherjee, S. Electrochemical and Friction Characteristics of Metallic Glass Composites at the Microstructural Length-scales. Sci. Rep. 2018, 8, 906. [Google Scholar] [CrossRef]
  9. Chen, C.; Zhang, H.; Fan, Y.; Zhang, W.; Wei, R.; Guan, S.; Wang, T.; Kong, B.; Zhang, T.; Li, F. Crystallization and corrosion resistance of Zr-Ti-Y-Al-Cu-Ni-Co-Fe complex multi-component bulk metallic glasses. Intermetallics 2020, 118, 106688. [Google Scholar] [CrossRef]
  10. Qiu, Z.; Li, Z.; Fu, H.; Zhang, H.; Zhu, Z.; Wang, A.; Li, H.; Zhang, L.; Zhang, H. Corrosion mechanisms of Zr-based bulk metallic glass in NaF and NaCl solutions. J. Mater. Sci. Technol. 2020, 46, 33–43. [Google Scholar] [CrossRef]
  11. Luo, Y.; Xing, L.; Jiang, Y.; Li, R.; Lu, C.; Zeng, R.; Luo, J.; Zhang, P.; Liu, W. Additive Manufactured Large Zr-Based Bulk Metallic Glass Composites with Desired Deformation Ability and Corrosion Resistance. Materials 2020, 13, 597. [Google Scholar] [CrossRef]
  12. Imai, K.; Zhou, X.; Liu, X. Application of Zr and Ti-Based Bulk Metallic Glasses for Orthopaedic and Dental Device Materials. Metals 2020, 10, 203. [Google Scholar] [CrossRef]
  13. Han, K.-M.; Qiang, J.-B.; Wang, Y.-M.; Zhao, B.-B.; Häussler, P. Zr55.8Al19.4(Co1−xCux)24.8 (x = 0–0.8 at.%) bulk metallic glasses for surgical devices applications. J. Iron Steel Res. Int. 2018, 25, 644–649. [Google Scholar] [CrossRef]
  14. Han, K.; Wang, Y.; Qiang, J.; Jiang, H.; Gu, L. Low-cost Zr-based bulk metallic glasses for biomedical devices applications. J. Non-Cryst. Solids 2019, 520, 119442. [Google Scholar] [CrossRef]
  15. Han, K.; Jiang, H.; Wang, Y.; Qiang, J.; Yu, C. Antimicrobial Zr-based bulk metallic glasses for surgical devices applications. J. Non-Cryst. Solids 2021, 564, 120827. [Google Scholar] [CrossRef]
  16. Shi, H.; Zhao, W.; Wei, X.; Ding, Y.; Shen, X.; Liu, W. Effect of Ti addition on mechanical properties and corrosion resistance of Ni-free Zr-based bulk metallic glasses for potential biomedical applications. J. Alloys Compd. 2020, 815, 152636. [Google Scholar] [CrossRef]
  17. Hua, N.; Liao, Z.; Chen, W.; Huang, Y.; Zhang, T. Effects of noble elements on the glass-forming ability, mechanical property, electrochemical behavior and tribocorrosion resistance of Ni- and Cu-free Zr-Al-Co bulk metallic glass. J. Alloys Compd. 2017, 725, 403–414. [Google Scholar] [CrossRef]
  18. Khan, M.M.; Shabib, I.; Haider, W. A combinatorially developed Zr-Ti-Fe-Al metallic glass with outstanding corrosion resistance for implantable medical devices. Scr. Mater. 2018, 162, 223–229. [Google Scholar] [CrossRef]
  19. Tabeshian, A.; Persson, D.; Arnberg, L.; Aune, R. Comparison of the electrochemical behavior of amorphous Zr55Cu30Ni5Al10, stainless steel (316LVM), and CoCrMo(F75) in simulated body fluid with and without addition of protein. Mater. Corros. 2019, 70, 652–660. [Google Scholar] [CrossRef]
  20. Jabed, A.; Rahman, Z.U.; Khan, M.M.; Haider, W.; Shabib, I. Combinatorial development and in-vitro characterization of the quaternary Zr-Ti-X-Y (X-Y = Cu-Ag/Co-Ni) metallic glass for prospective bio-implants. Adv. Eng. Mater. 2019, 21, 1900726. [Google Scholar] [CrossRef]
  21. Jabed, A.; Khan, M.M.; Camiller, J.; Greenlee-Wacker, M.; Haider, W.; Shabib, I. Property optimization of Zr-Ti-X (X = Ag, Al) metallic glass via combinatorial development aimed at prospective biodemidcal application. Surf. Coat. Technol. 2019, 372, 278–287. [Google Scholar] [CrossRef]
  22. Zhou, M.; Hagos, K.; Huang, H.; Yang, M.; Ma, L. Improved mechanical properties and pitting corrosion resistance of Zr65Cu17.5Fe10Al7.5 bulk metallic glass by isothermal annealing. J. Non-Cryst. Solids 2016, 452, 50–56. [Google Scholar] [CrossRef]
  23. Tang, J.; Yu, L.; Qiao, J.; Wang, Y.; Wang, H.; Duan, M.; Chamas, M. Effect of atomic mobility on the electrochemical properties of a Zr58Nb3Cu16Ni13Al10 bulk metallic glass. Electrochim. Acta 2018, 267, 222–233. [Google Scholar] [CrossRef]
  24. Tang, J.; Wang, Y.; Zhu, Q.; Chamas, M.; Wang, H.; Qiao, J.; Zhu, Y.; Normand, B. Passivation behavior of a Zr60Cu20Ni8Al7Hf3Ti2 bulk metallic glass in sulfuric acid solutions. Int. J. Electrochem. Sci. 2018, 13, 6913–6929. [Google Scholar] [CrossRef]
  25. Ge, W.; Li, B.; Axinte, E.; Zhang, Z.; Shang, C.; Wang, Y. Crystallization and Corrosion Resistance in Different Aqueous Solutions of Zr50.7Ni28Cu9Al12.3 Amorphous Alloy and Its Crystallization Counterparts. JOM 2017, 69, 776–783. [Google Scholar] [CrossRef]
  26. Aditya, A.; Wu, H.F.; Arora, H.; Mukherjee, S. Amorphous Metallic Alloys: Pathways for Enhanced Wear and Corrosion Resistance. JOM 2017, 69, 2150–2155. [Google Scholar] [CrossRef]
  27. Hua, N.; Liao, Z.; Wang, Q.; Zhang, L.; Ye, Y.; Brechtl, J.; Liaw, P.K. Effects of crystallization on mechanical behavior and corrosion performance of a ductile Zr68Al8Ni8Cu16 bulk metallic glass. J. Non-Cryst. Solids 2020, 529, 119782. [Google Scholar] [CrossRef]
  28. Shi, H.; Tang, C.; Zhao, X.; Ding, Y.; Ma, L.; Shen, X. Effect of isothermal annealing on mechanical performance and corrosion resistance of Ni-free Zr59Ti6Cu17.5Fe10Al7.5 bulk metallic glass. J. Non-Cryst. Solids 2020, 537, 120013. [Google Scholar] [CrossRef]
  29. Emran, K.M.; Al-Refai, H. Electrochemical and surface investigation of Ni-Cr glassy alloys in nitric acid solution. Int. J. Electrochem. Sci. 2017, 12, 6404–6416. [Google Scholar] [CrossRef]
  30. Zhang, Y.; Yan, L.; Zhao, X.; Ma, L. Enhanced chloride ion corrosion resistance of Zr-based bulk metallic glasses with cobalt substitution. J. Non-Cryst. Solids 2018, 496, 18–23. [Google Scholar] [CrossRef]
Figure 1. The potentiodynamic polarization curves for the as-cast Zr56Cu19Ni11Al9Nb5 sample and the samples annealed at 623–923 K in PBS solution.
Materials 16 03389 g001
Figure 2. The EIS results for the as-cast Zr56Cu19Ni11Al9Nb5 sample and the samples annealed at 623–923 K in PBS solution. (a) Nyquist plots, (b) Bode plots, and (c) the equivalent circuit diagram.
Materials 16 03389 g002
Figure 3. The optical microscopy images of the as-cast Zr56Cu19Ni11Al9Nb5 sample and the samples annealed at 623–923 K after potentiodynamic polarization tests in PBS solution.
Materials 16 03389 g003
Figure 4. SEM images of the as-cast Zr56Cu19Ni11Al9Nb5 sample and the samples annealed at 623–923 K after potentiodynamic polarization tests in PBS solution.
Materials 16 03389 g004
Figure 5. SEM and EDS results of the as-cast Zr56Cu19Ni11Al9Nb5 sample and the samples annealed at 623–923 K after potentiodynamic polarization tests in PBS solution. Spots A, C, E, G, and J are in the smooth non-corroded area, and spots B, D, F, H, and K are in the corroded area.
Materials 16 03389 g005
Figure 6. XPS analysis of the Zr56Cu19Ni11Al9Nb5 sample annealed at 723 K after potentiodynamic polarization test in PBS solution, (a) Zr 3d, (b) Cu 2p, (c) Ni 2p, (d) Al 2p, (e) Nb 3d, and (f) O 1s.
Materials 16 03389 g006
Table 1. The electrochemical parameters obtained from the potentiodynamic polarization curves for the as-cast and annealed Zr56Cu19Ni11Al9Nb5 samples in PBS solution.
Annealing Temperature (K)Ecorr (VSCE)icorr (A/cm2)Epit (VSCE)Epit–Ecorr (V)
As-cast−0.0831.866 × 10−50.4960.579
623−0.0421.466 × 10−50.1570.199
723−0.0369.977 × 10−60.3590.395
823−0.0451.549 × 10−50.1650.210
923−0.0751.879 × 10−5//
Table 2. The EIS fitting results for the as-cast Zr56Cu19Ni11Al9Nb5 sample and the samples annealed at 623–923 K in PBS solution.
Annealing Temperature (K)EIS Fitting Results
Rs
(Ω·cm2)
Y01
−1·cm−2·sn)
n1Rf (Ω·cm2)Y02
−1·cm−2·sn)
n2Rct (Ω·cm2)Rct + Rf (Ω·cm2)
As-cast18.11.25 × 10−40.79236471.88 × 10−40.6962043851
62311.61.56 × 10−40.84652242.71 × 10−40.675925316
72313.01.64 × 10−30.79353031.50 × 10−40.775575360
82311.54.50 × 10−40.5622251.30 × 10−40.91356845909
92312.01.50 × 10−40.91420102.77 × 10−40.6591632173
Disclaimer/Publisher’s Note: The statements, opinions and data contained in all publications are solely those of the individual author(s) and contributor(s) and not of MDPI and/or the editor(s). MDPI and/or the editor(s) disclaim responsibility for any injury to people or property resulting from any ideas, methods, instructions or products referred to in the content.

