
Effect of Local Pressurization on Microstructure and Mechanical Properties of Aluminum Alloy Flywheel Housing with Complex Shape
Abstract
:1. Introduction
2. Experimental Procedures
2.1. Materials
2.2. Methods
2.2.1. Orthogonal Experimental Scheme
2.2.2. Forming Process
2.2.3. Characterizations
3. Results and Discussion
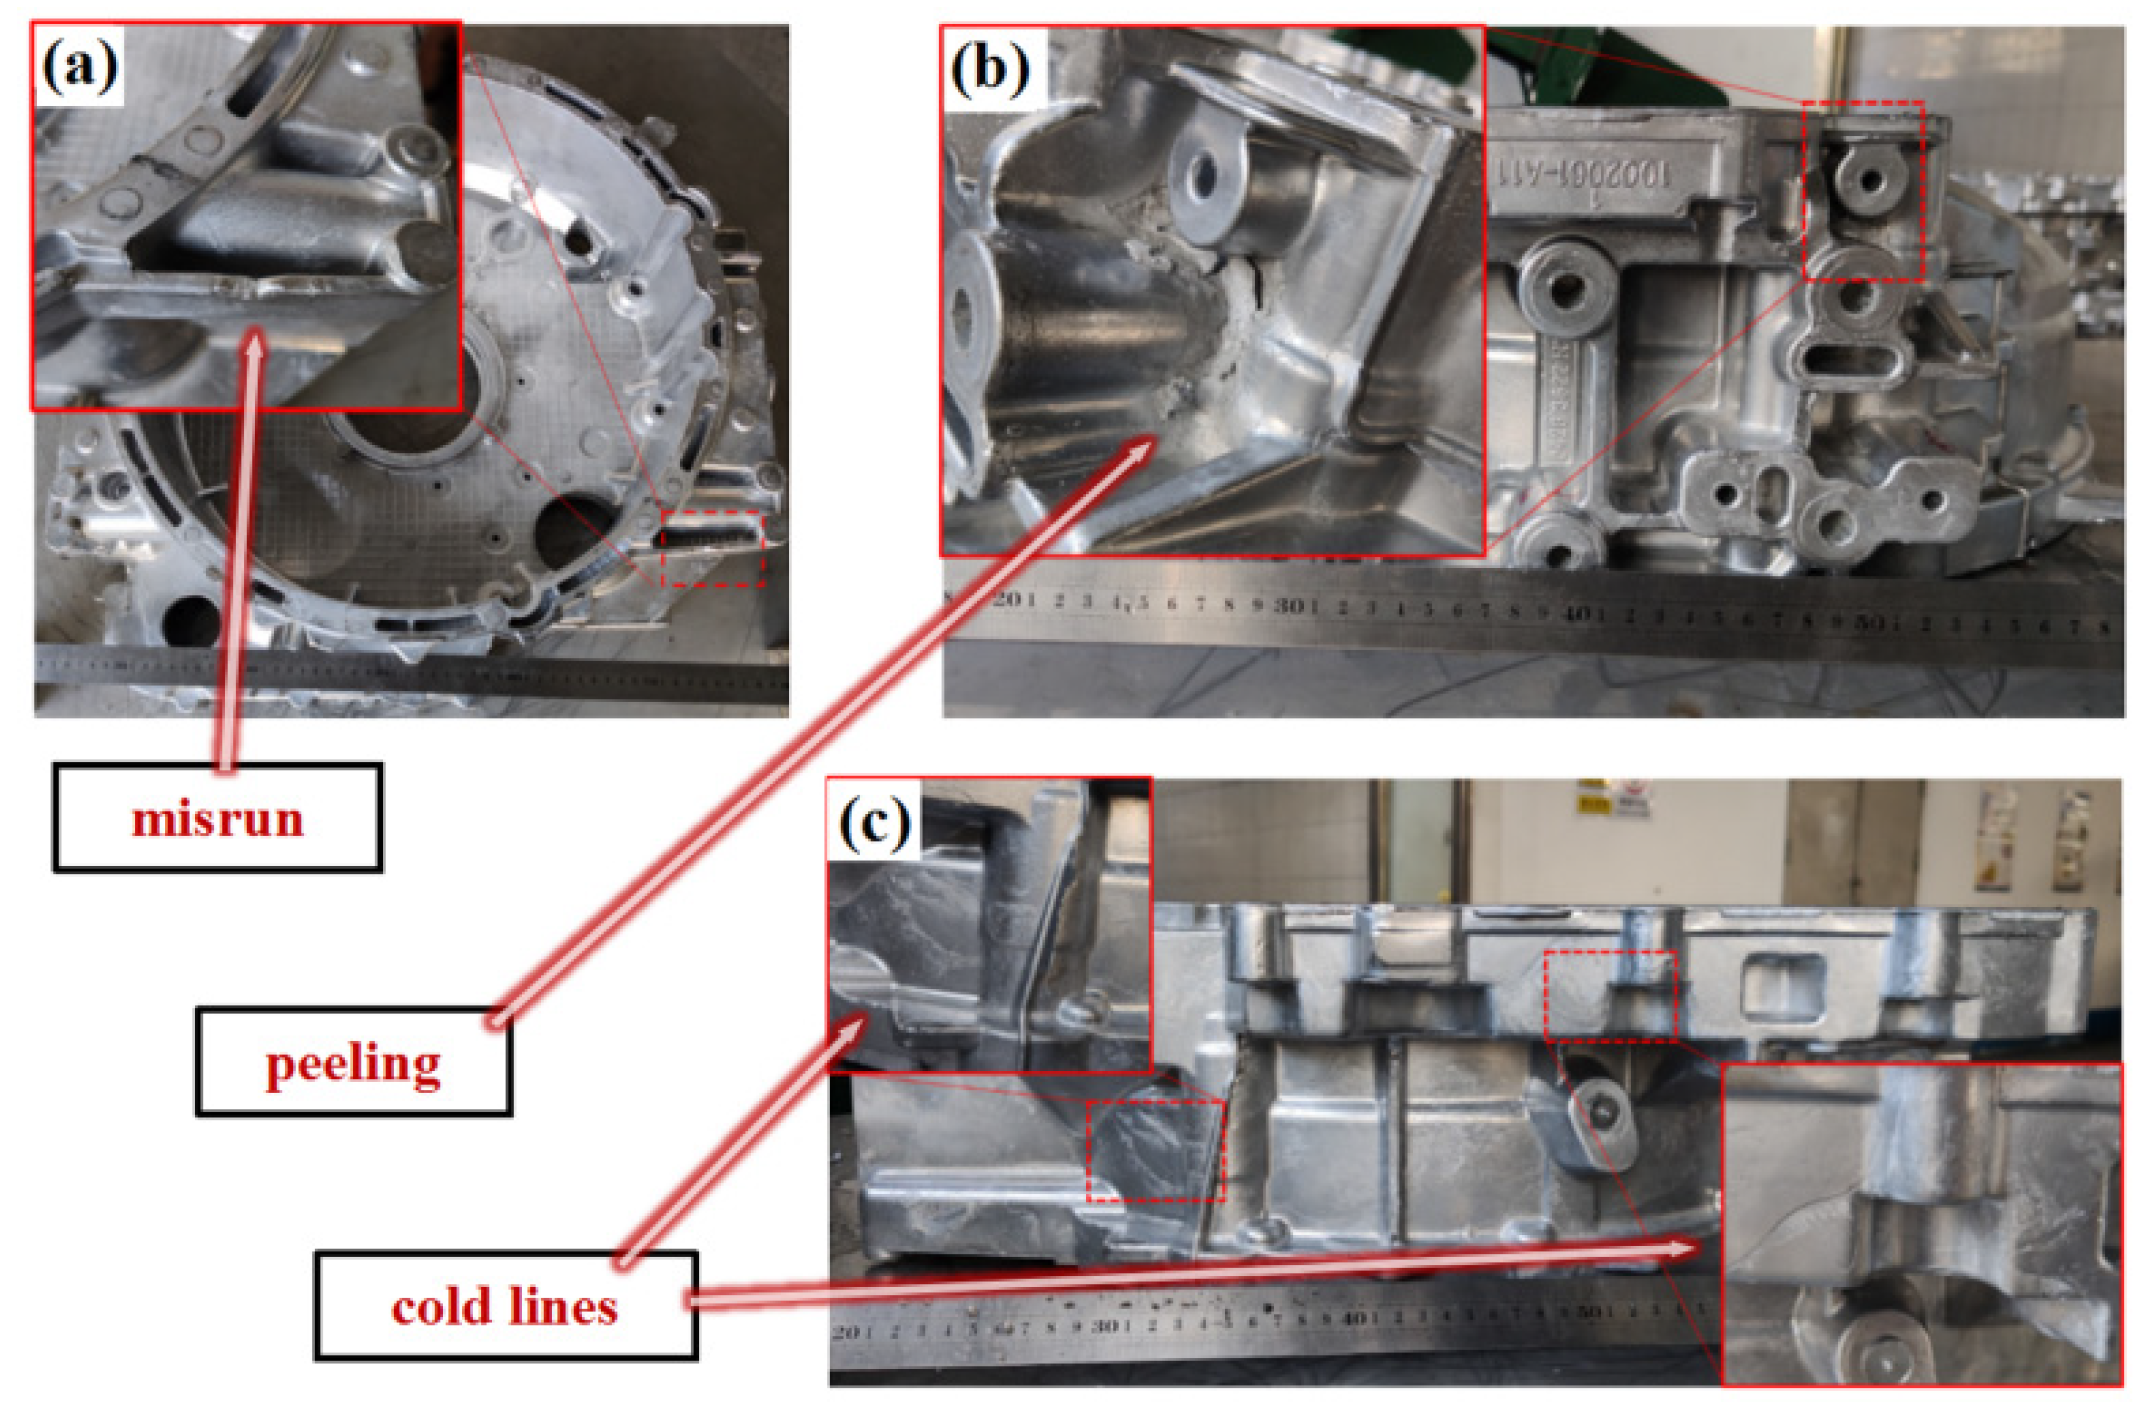
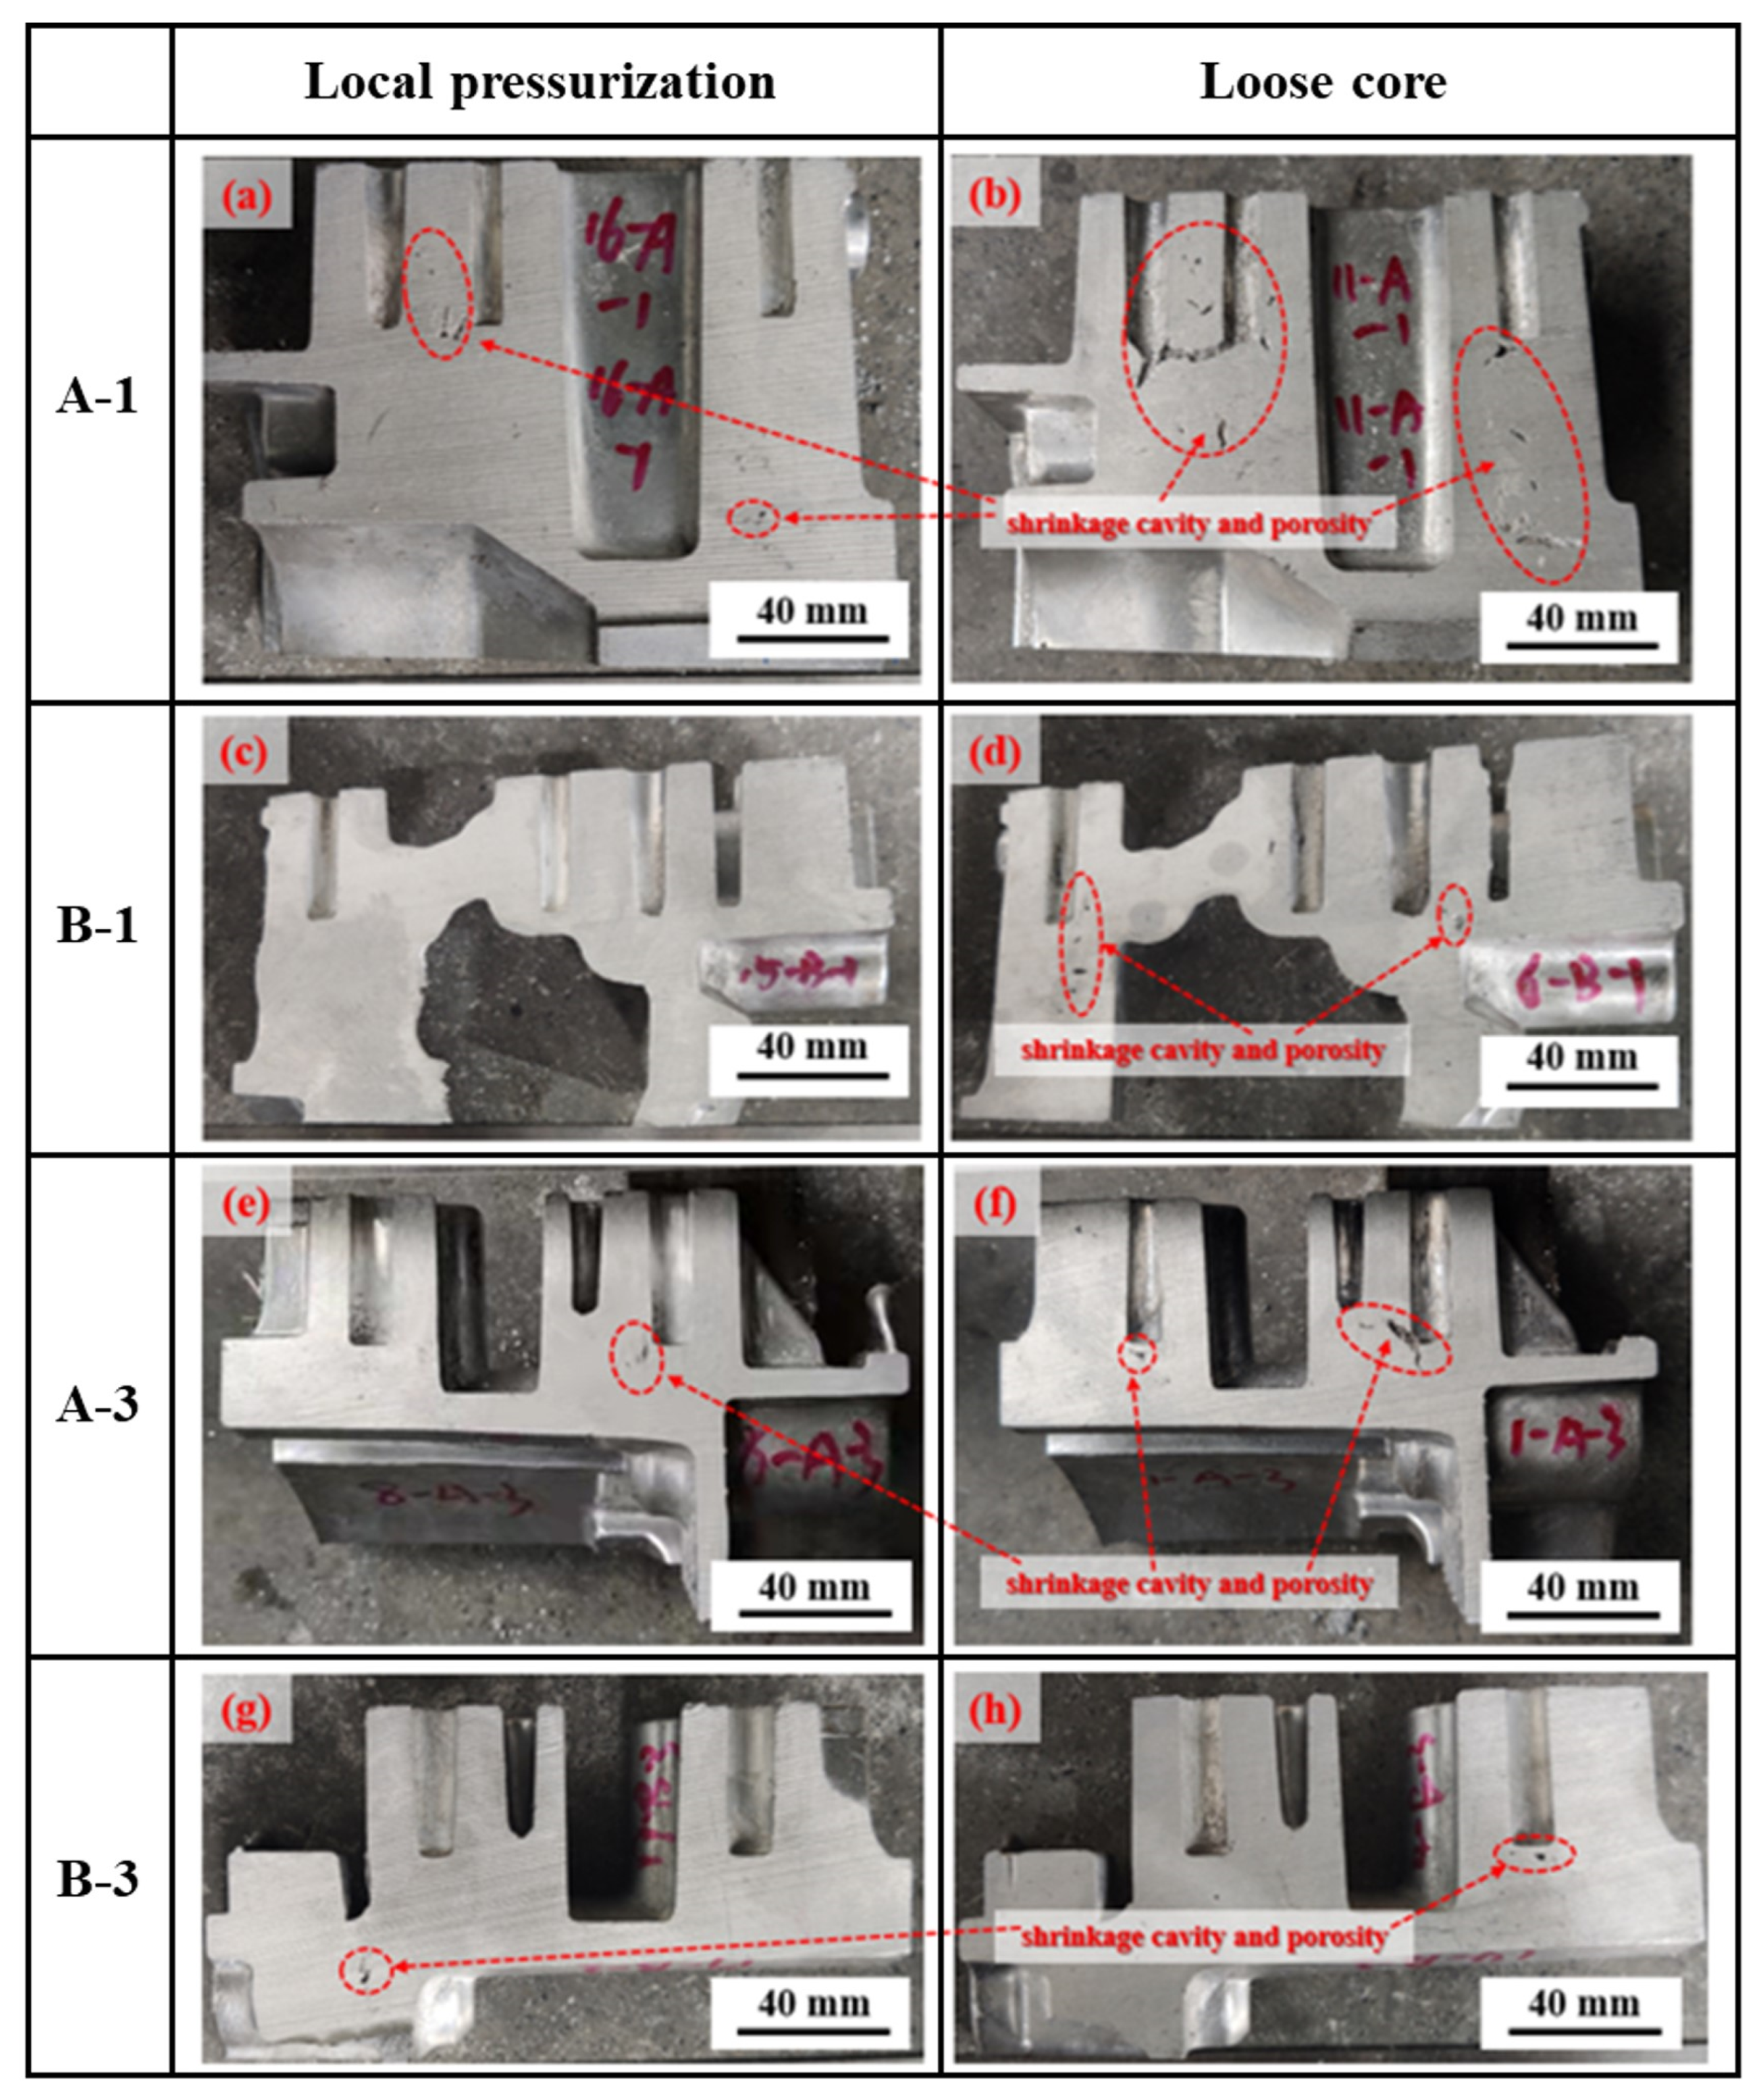
3.1. Surface Quality and Internal Macro-Morphology
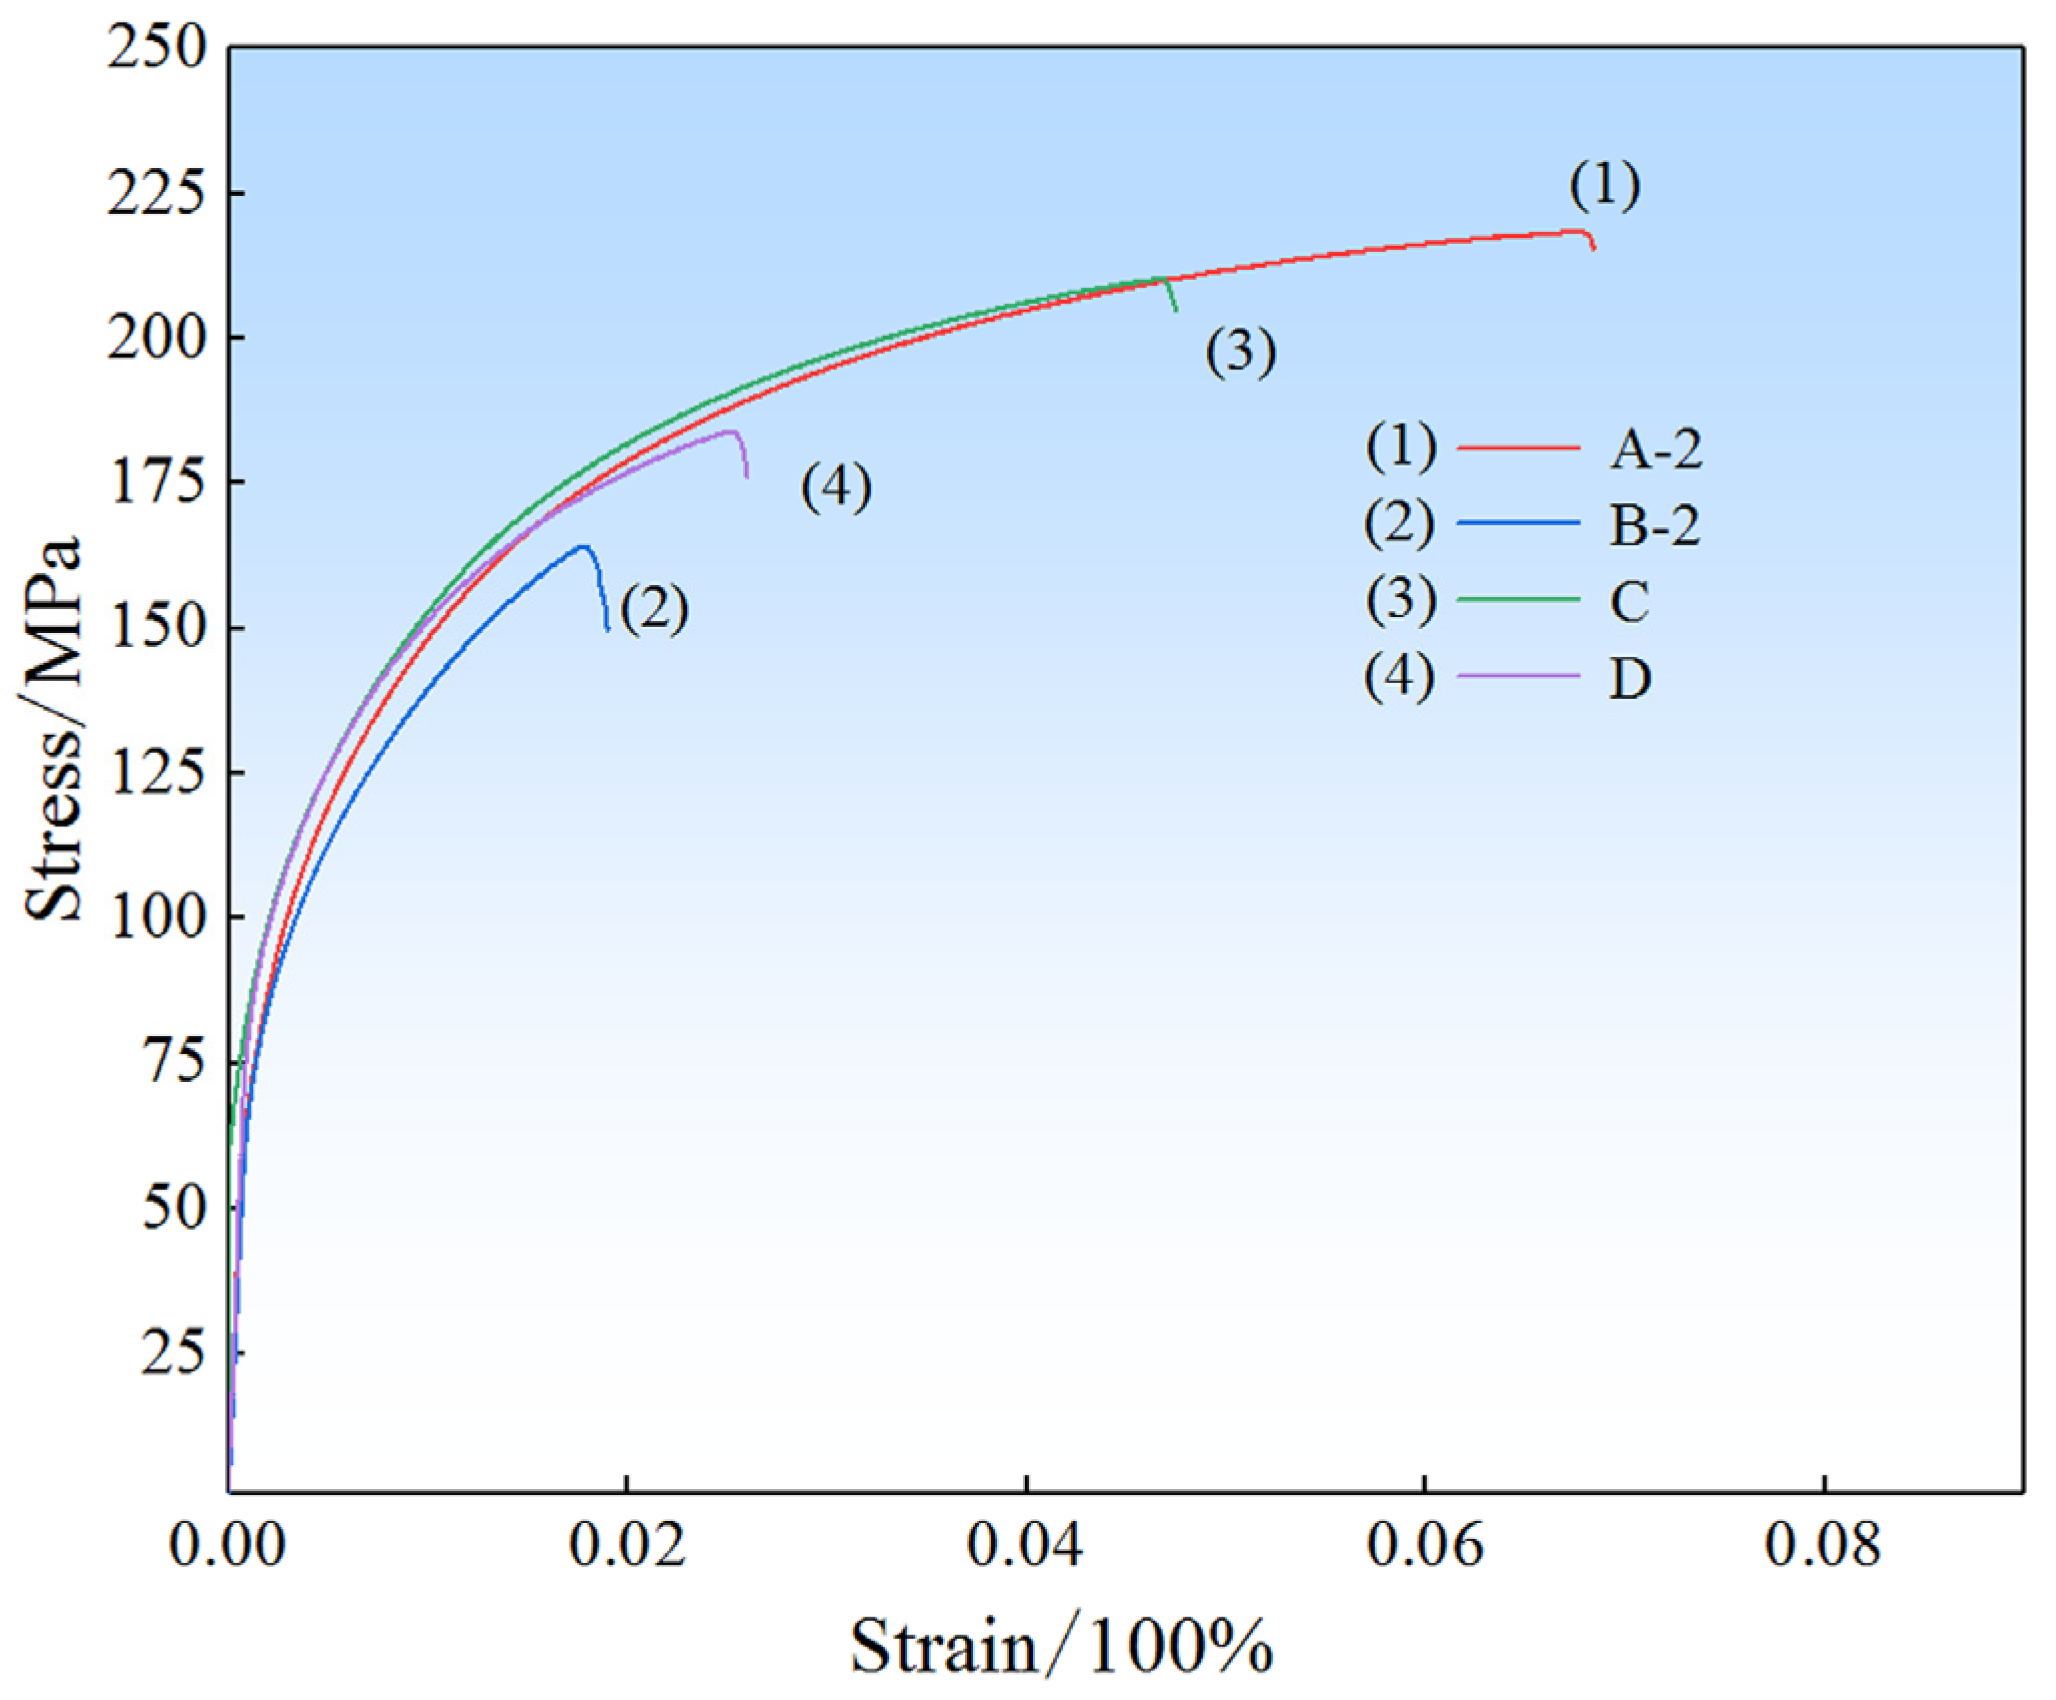
3.2. Mechanical Properties and Fracture Morphology
3.3. Orthogonal Experimental Analysis and Verification
Range Analysis
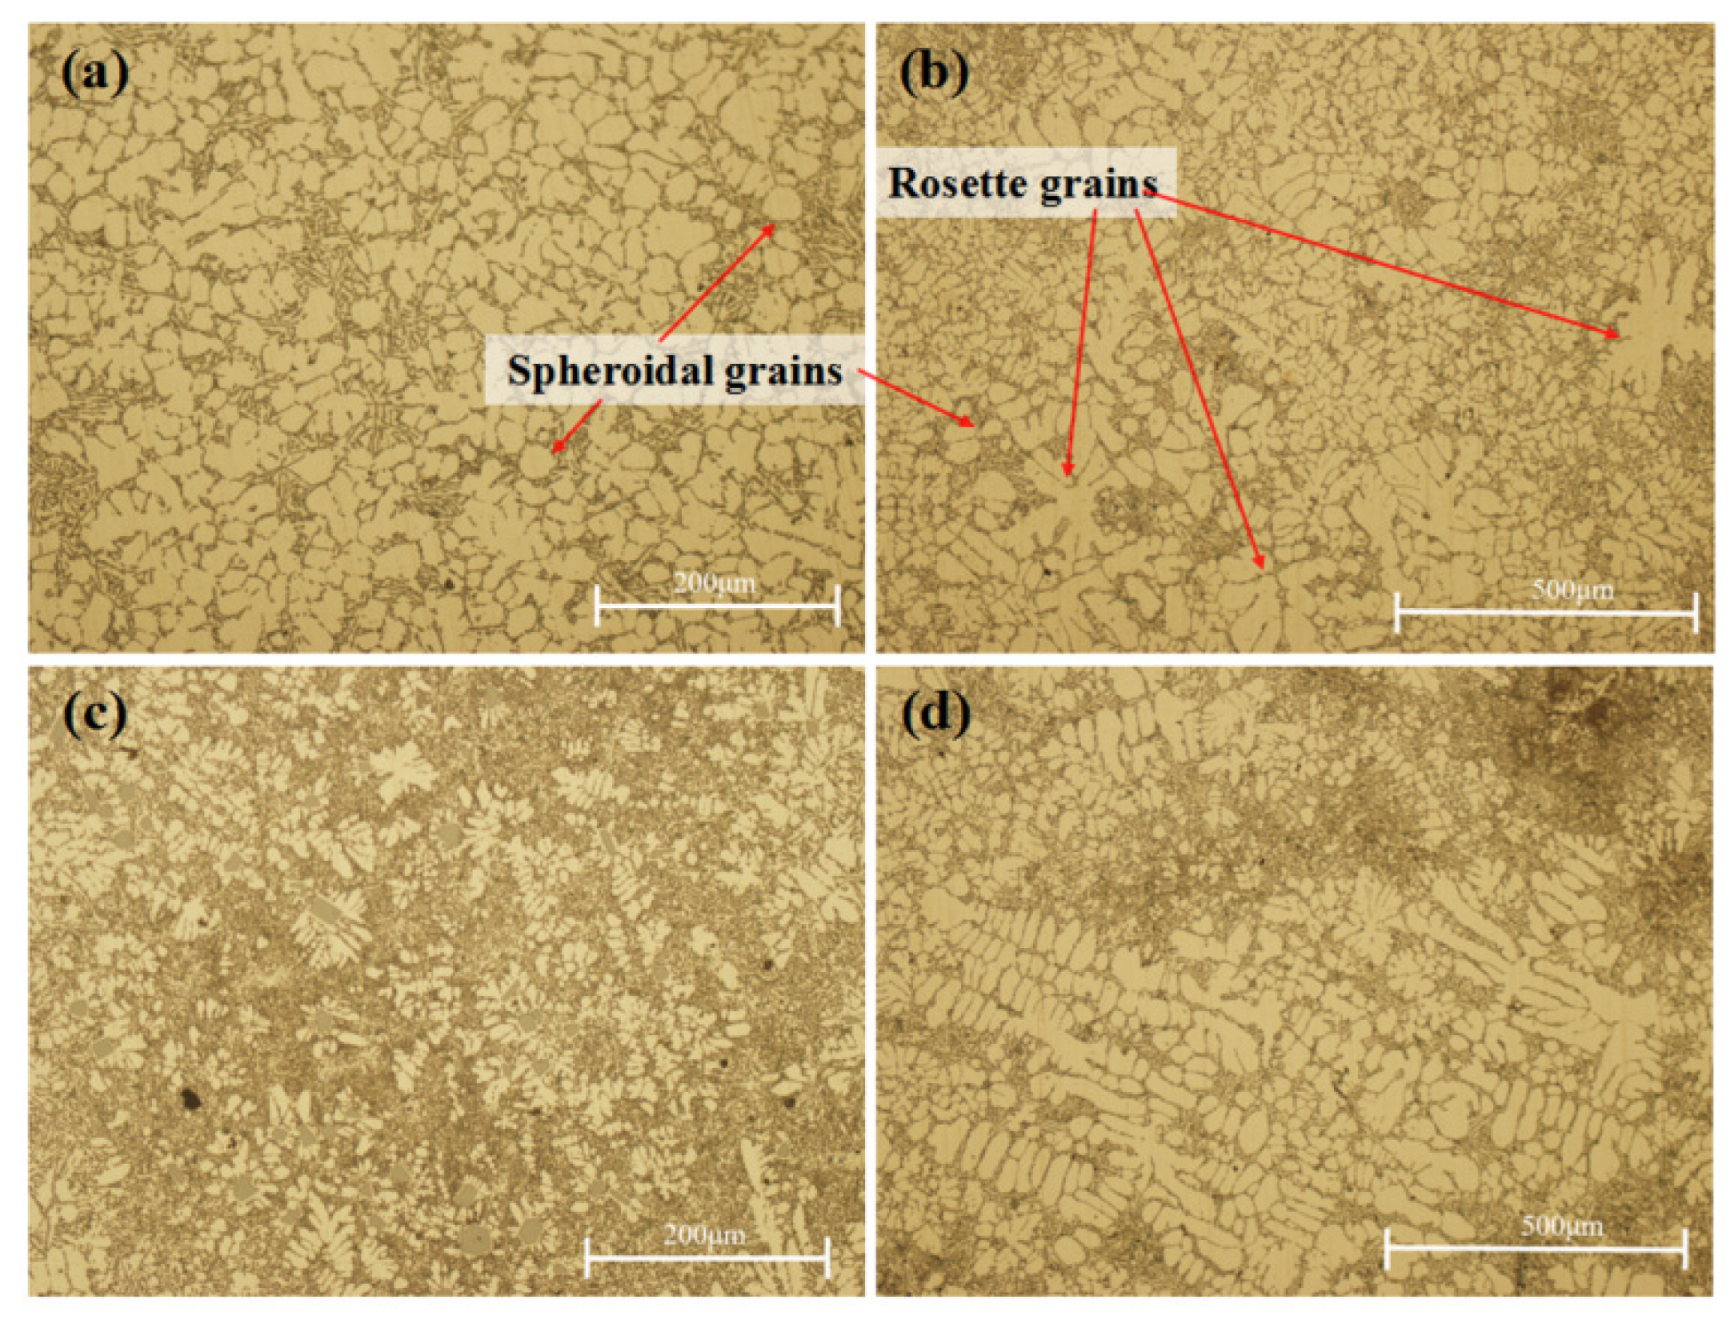
3.4. Microstructure
3.5. Microstructures and Properties at the Positions with Local Pressurization
3.5.1. Mechanical Properties
3.5.2. Zonal Effect of Microstructure
3.5.3. Analysis of Pressurization Effect
- (1)
- Changing the solidification process:
- (2)
- Plastic deformation:

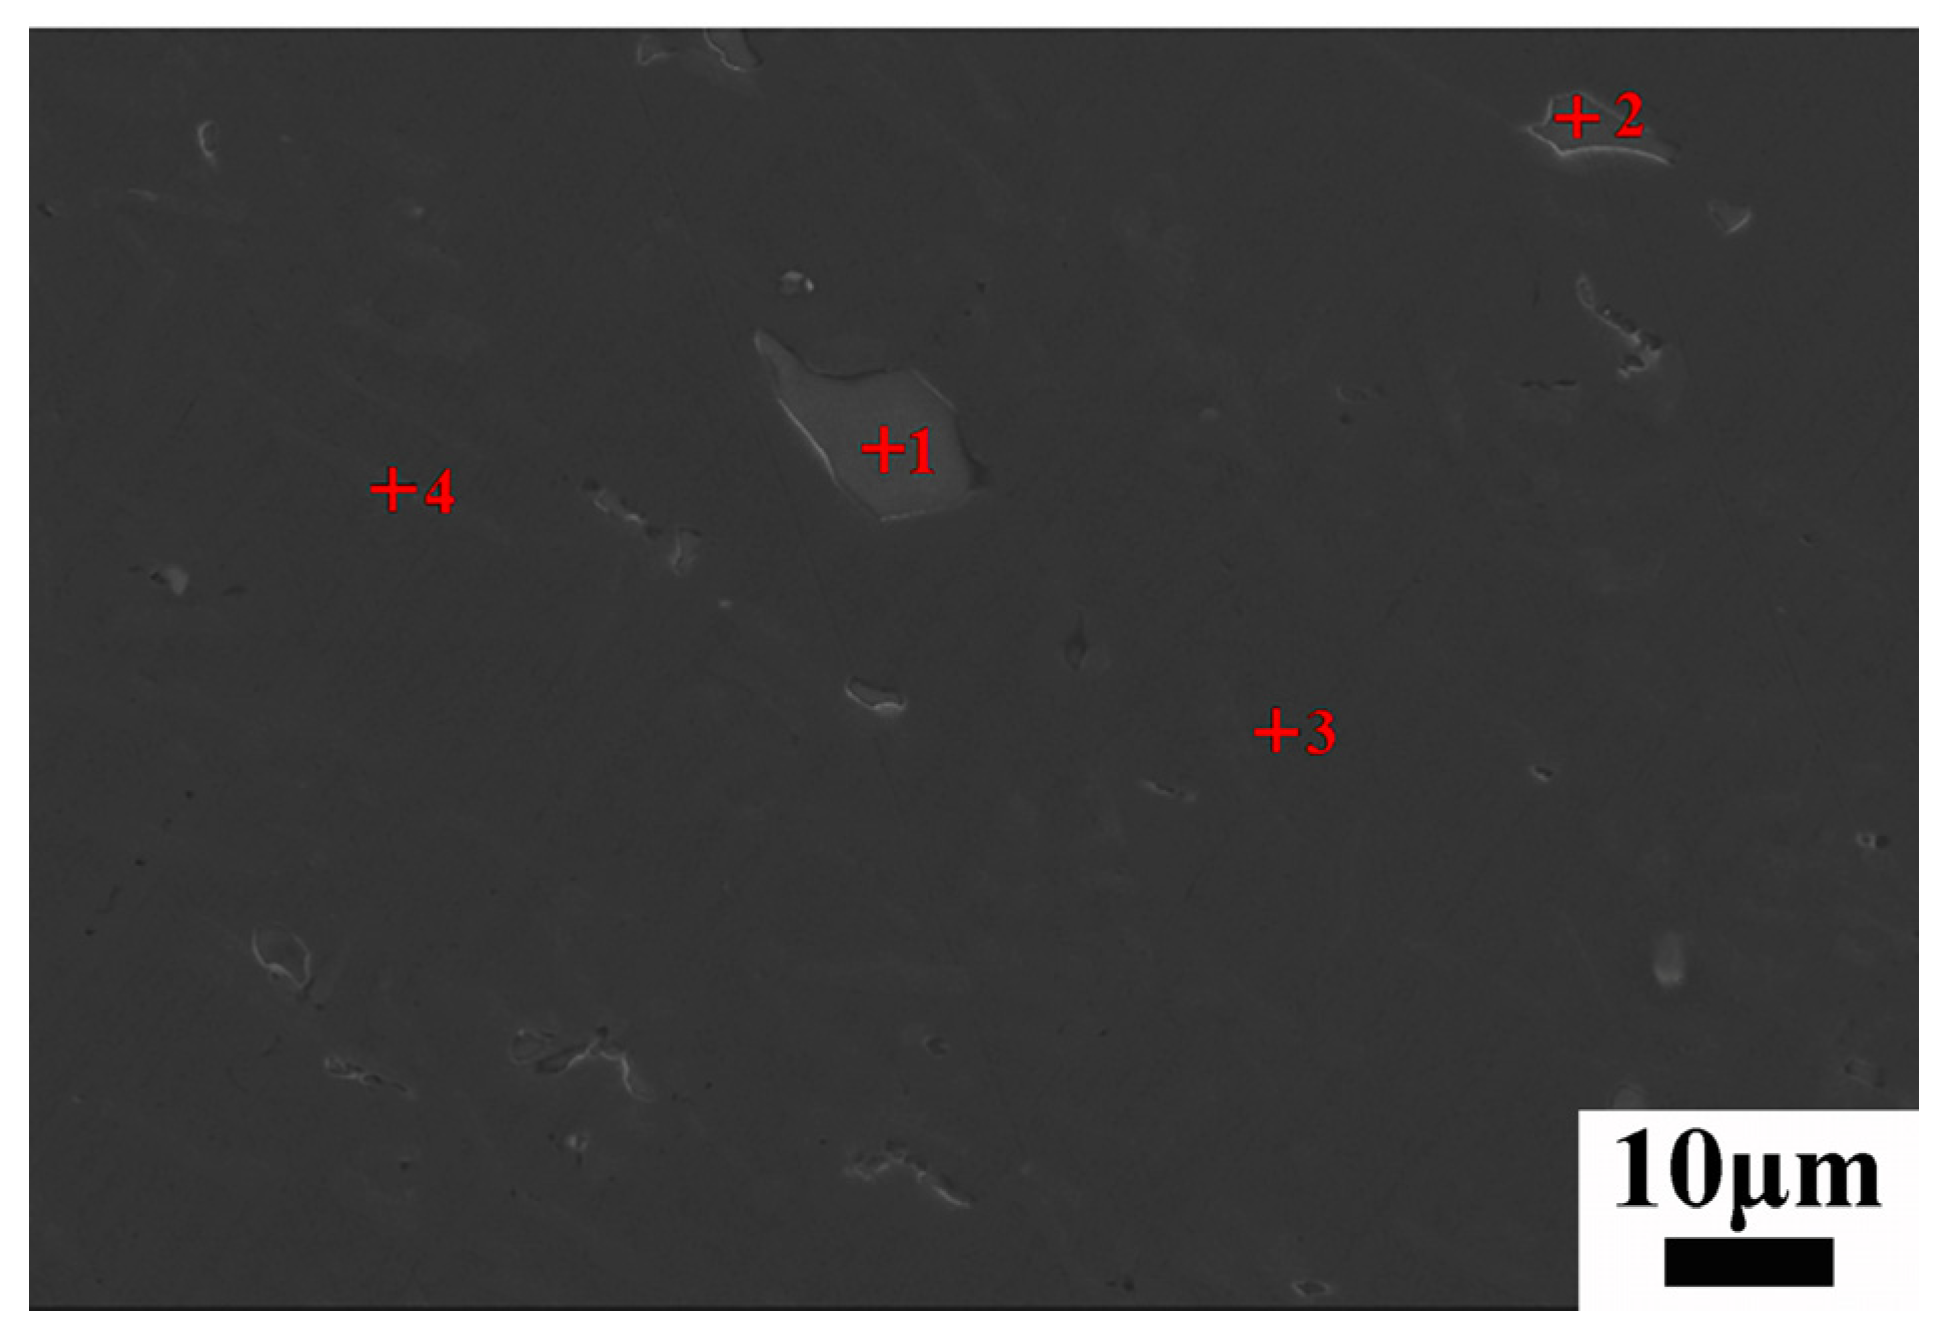
| Points | Al | Si | Mg | Mn | Fe |
|---|---|---|---|---|---|
| 1 | 60.90 | 11.03 | 0.00 | 14.74 | 13.34 |
| 2 | 63.47 | 9.19 | 0.03 | 13.38 | 13.93 |
| 3 | 97.28 | 2.31 | 0.16 | 0.25 | 0.00 |
| 4 | 59.56 | 40.17 | 0.12 | 0.05 | 0.11 |
- (3)
- Forced feeding:
4. Conclusions
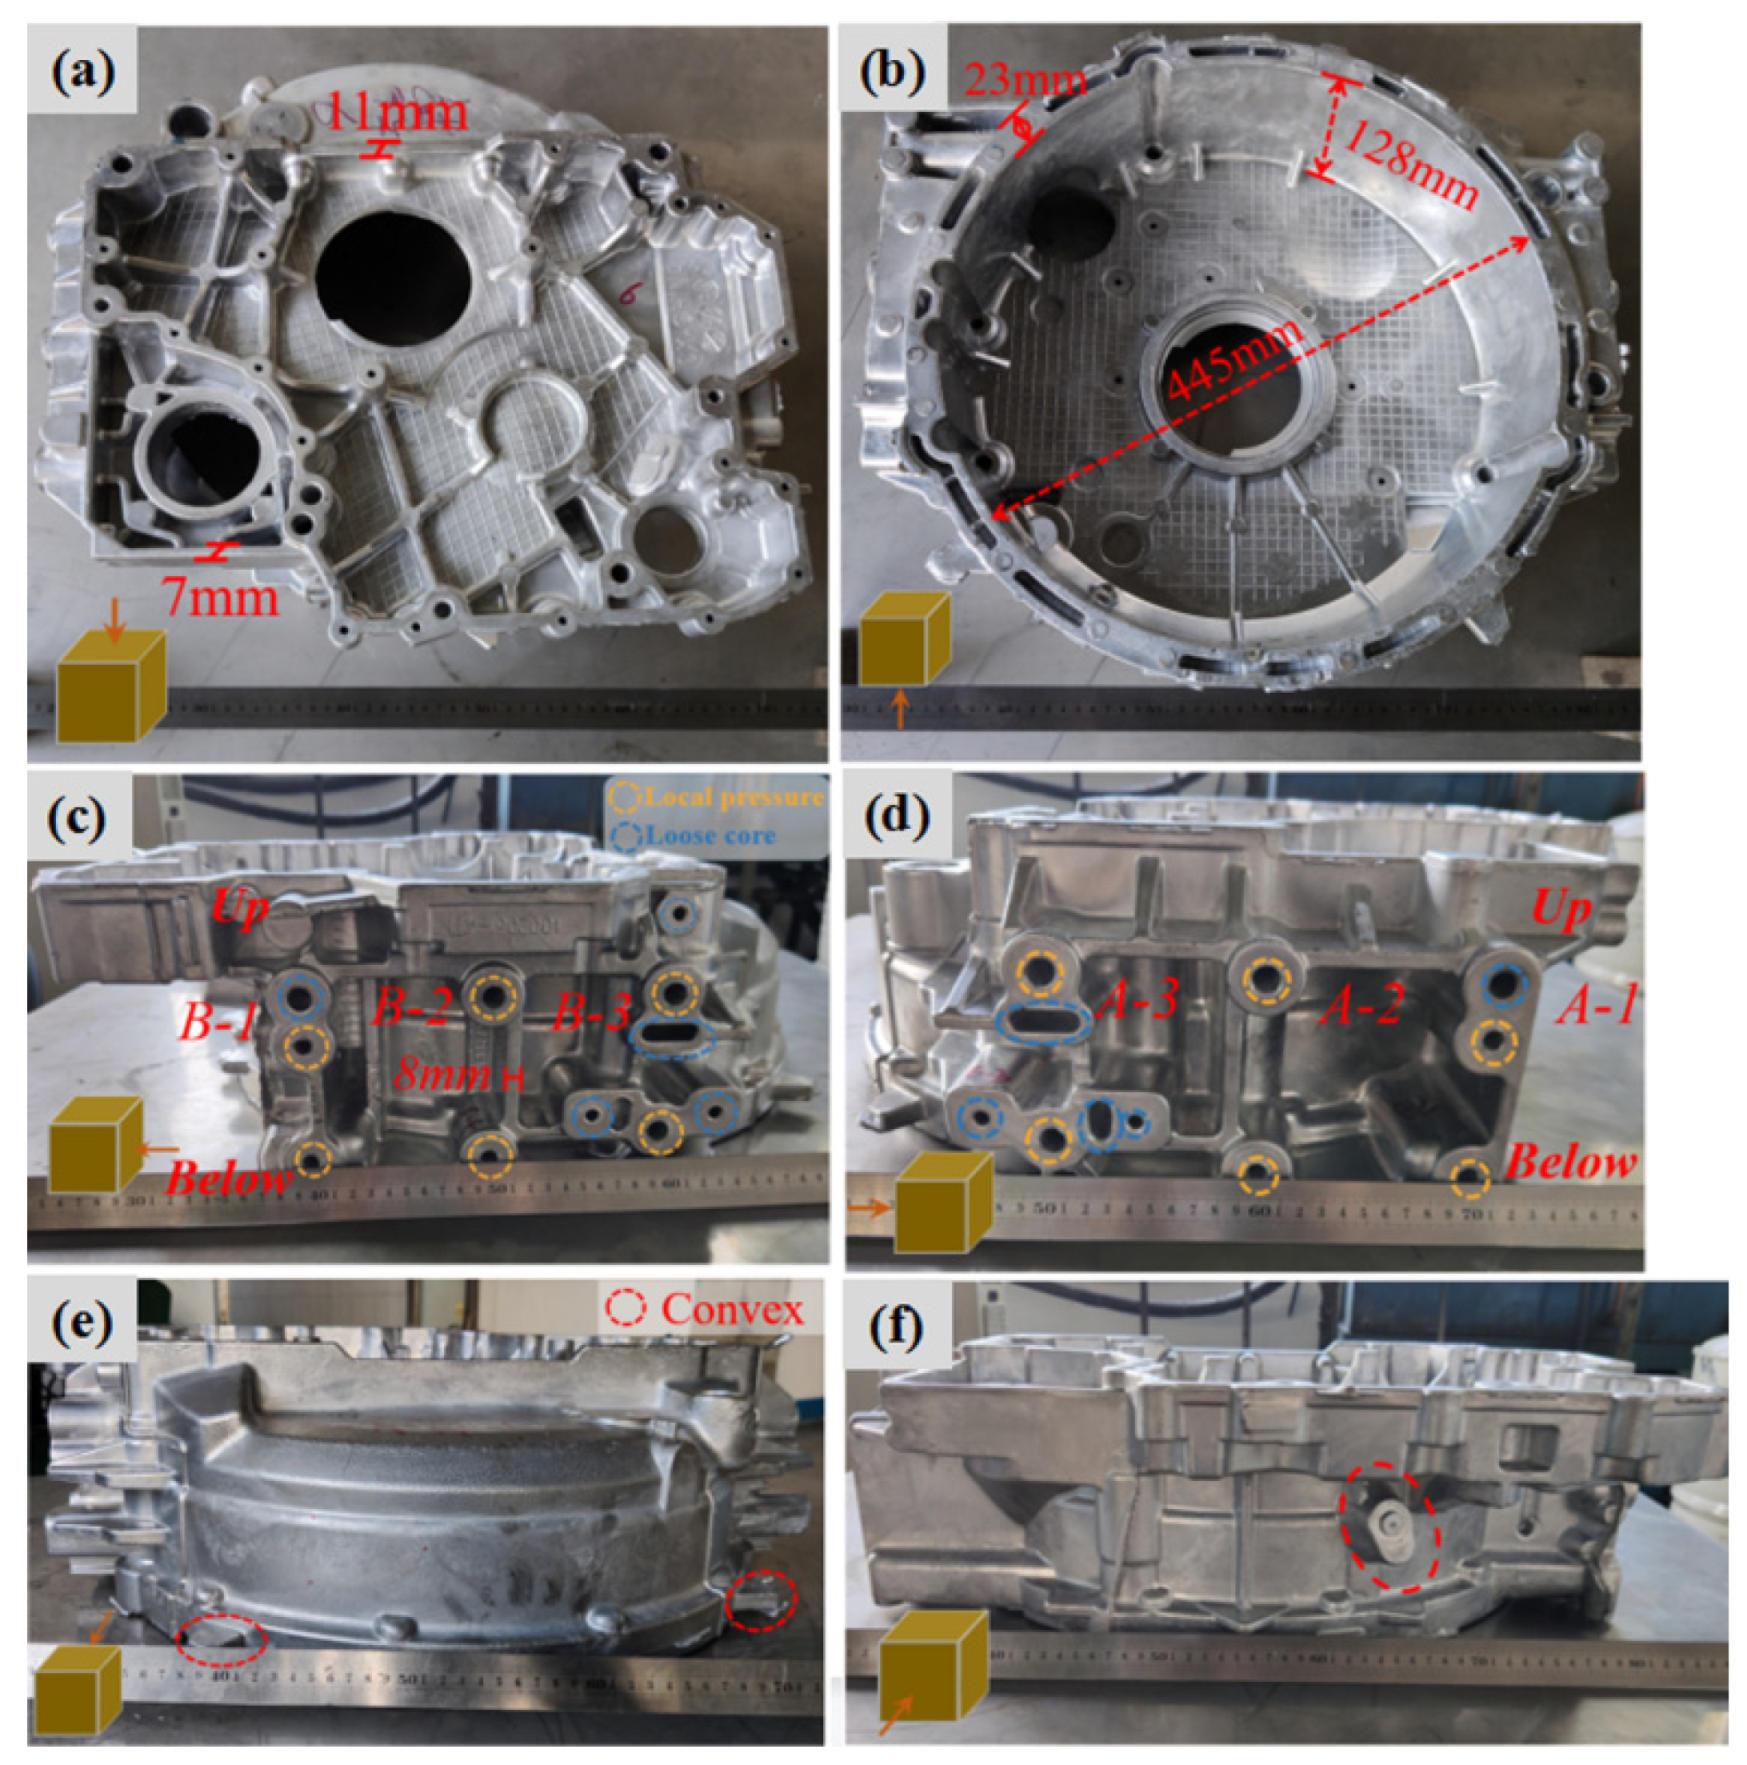
- The surface quality of the formed components was good. The effect of local pressurization for forced feeding on the elimination of the shrinkage cavity and shrinkage porosity was obvious, and the scope and effect of feeding were limited. The longer the distance was from the feeding point, the worse the effect of feeding was.
- Through the analysis, it was determined that the optimum combination of process parameters was a pouring temperature of 650 °C, a specific pressure of 48 MPa, a mold temperature of 220 °C, a local pressurization of 800 MPa, and pressure delay times of 15 s (side A) and 17 s (side B). The ultimate tensile strength, yield strength, and elongation of the formed components according to the validation experiment of the optimum process parameters were 201 MPa, 103 MPa, and 5.1%.
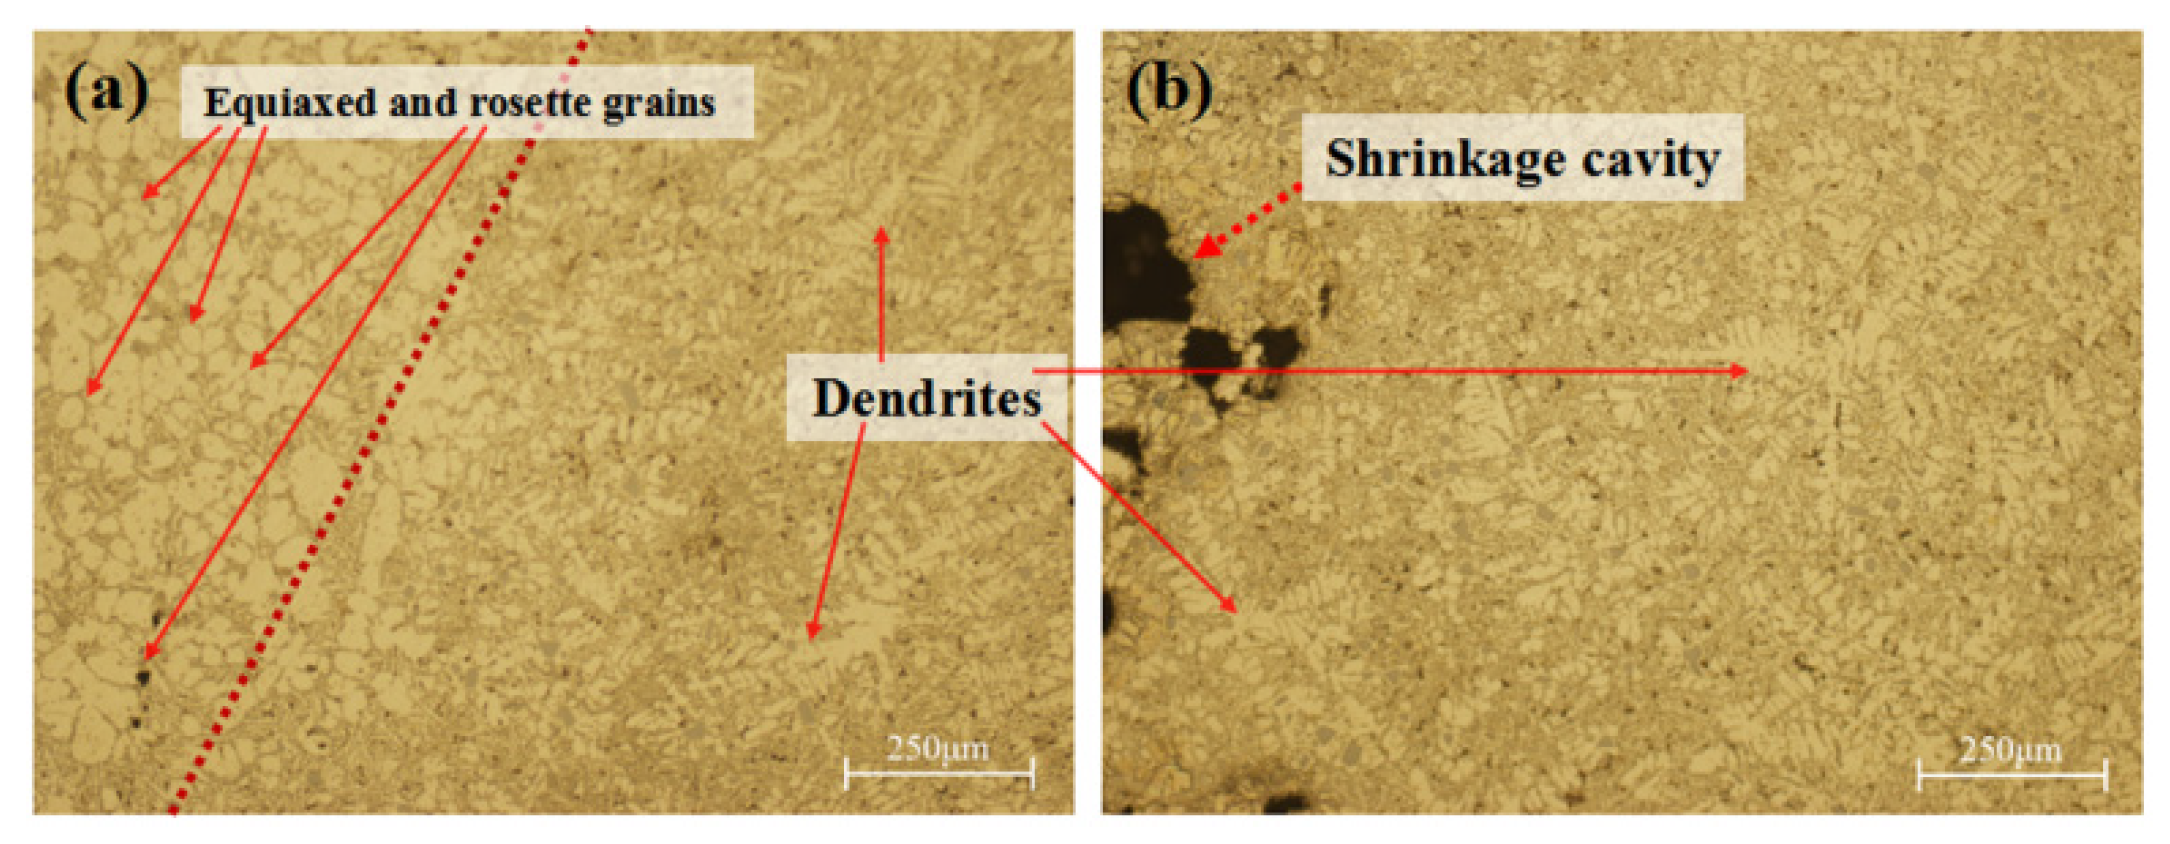
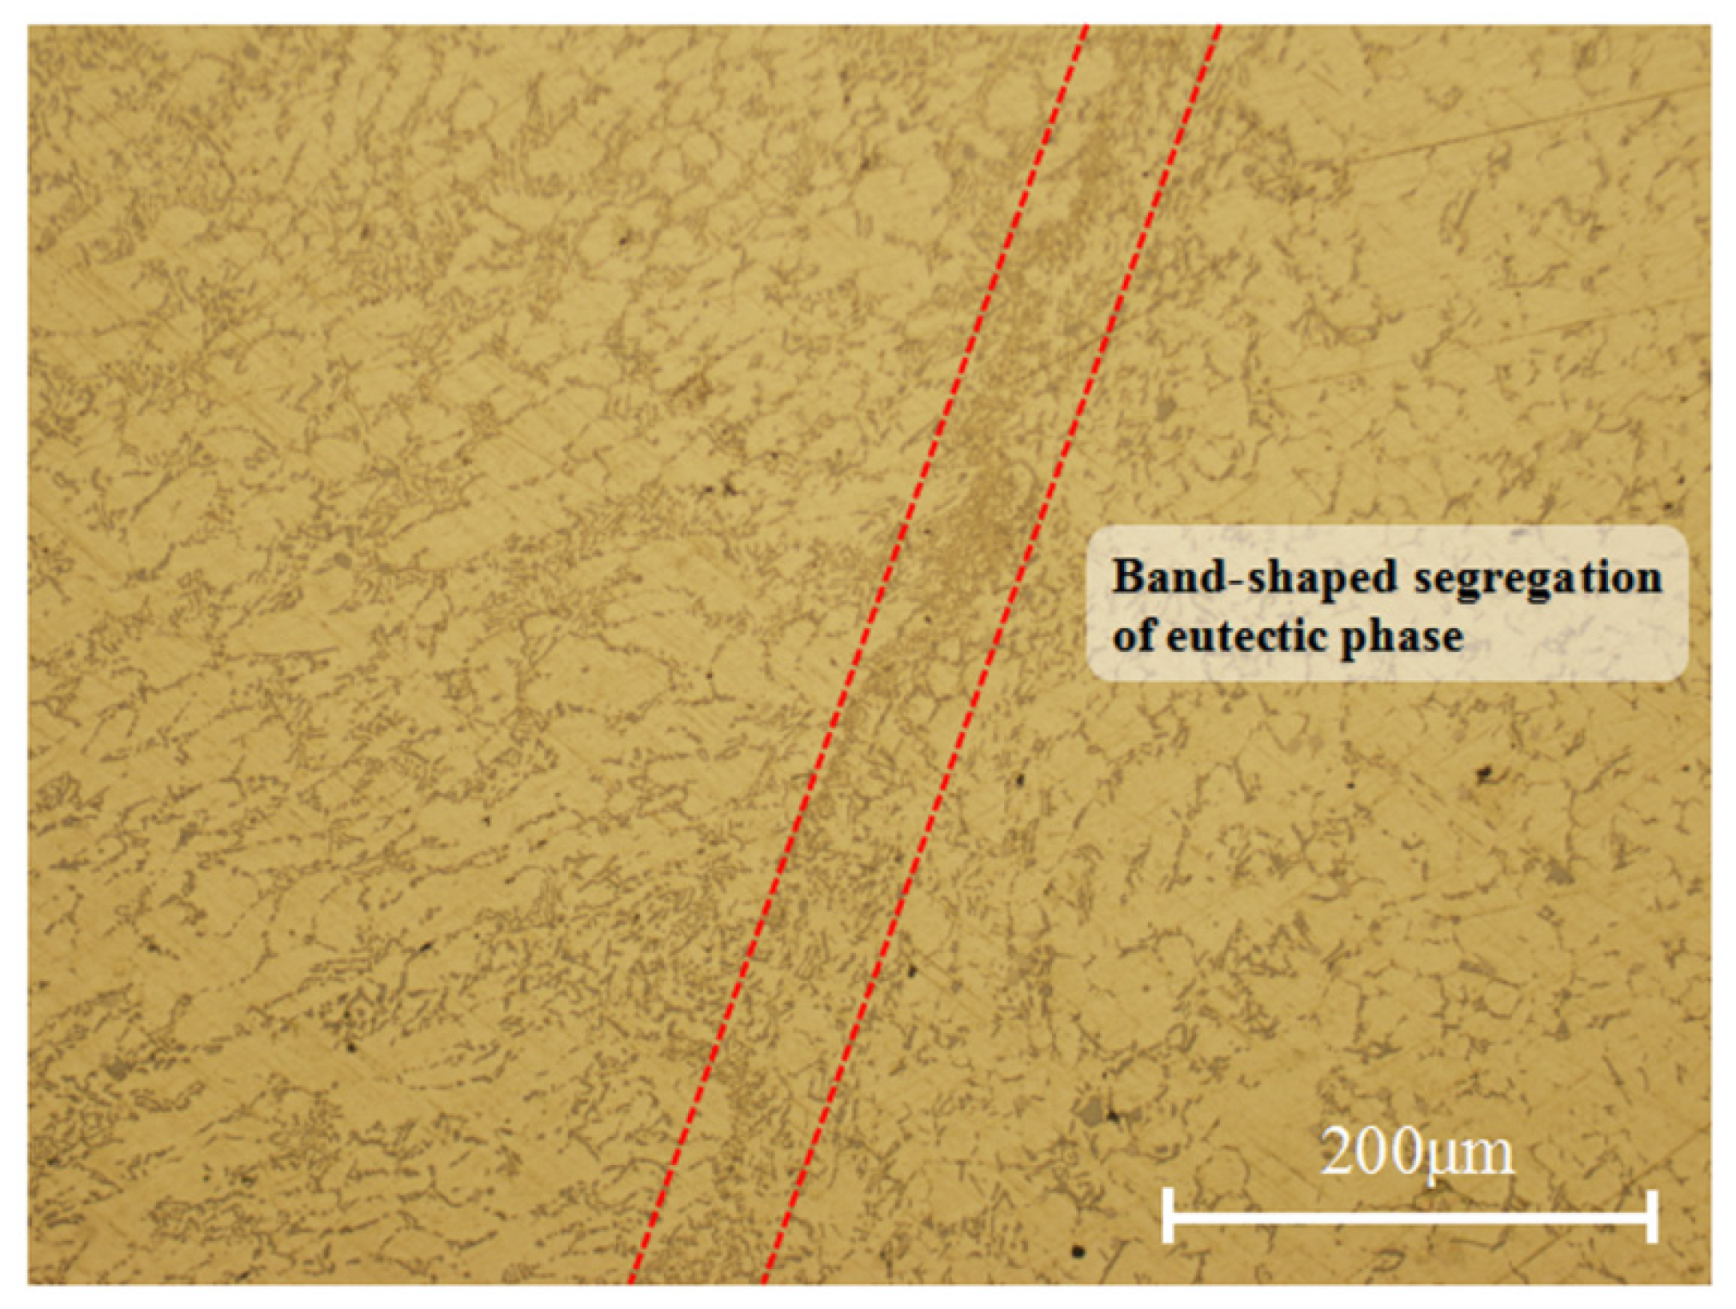
- The grains of primary α-Al were mainly rosette and equiaxed grains; the grains were fine, and the average grain size was about 40 μm. The microstructure of eutectic silicon was acicular, and silicon was prone to segregation under the action of pressure.
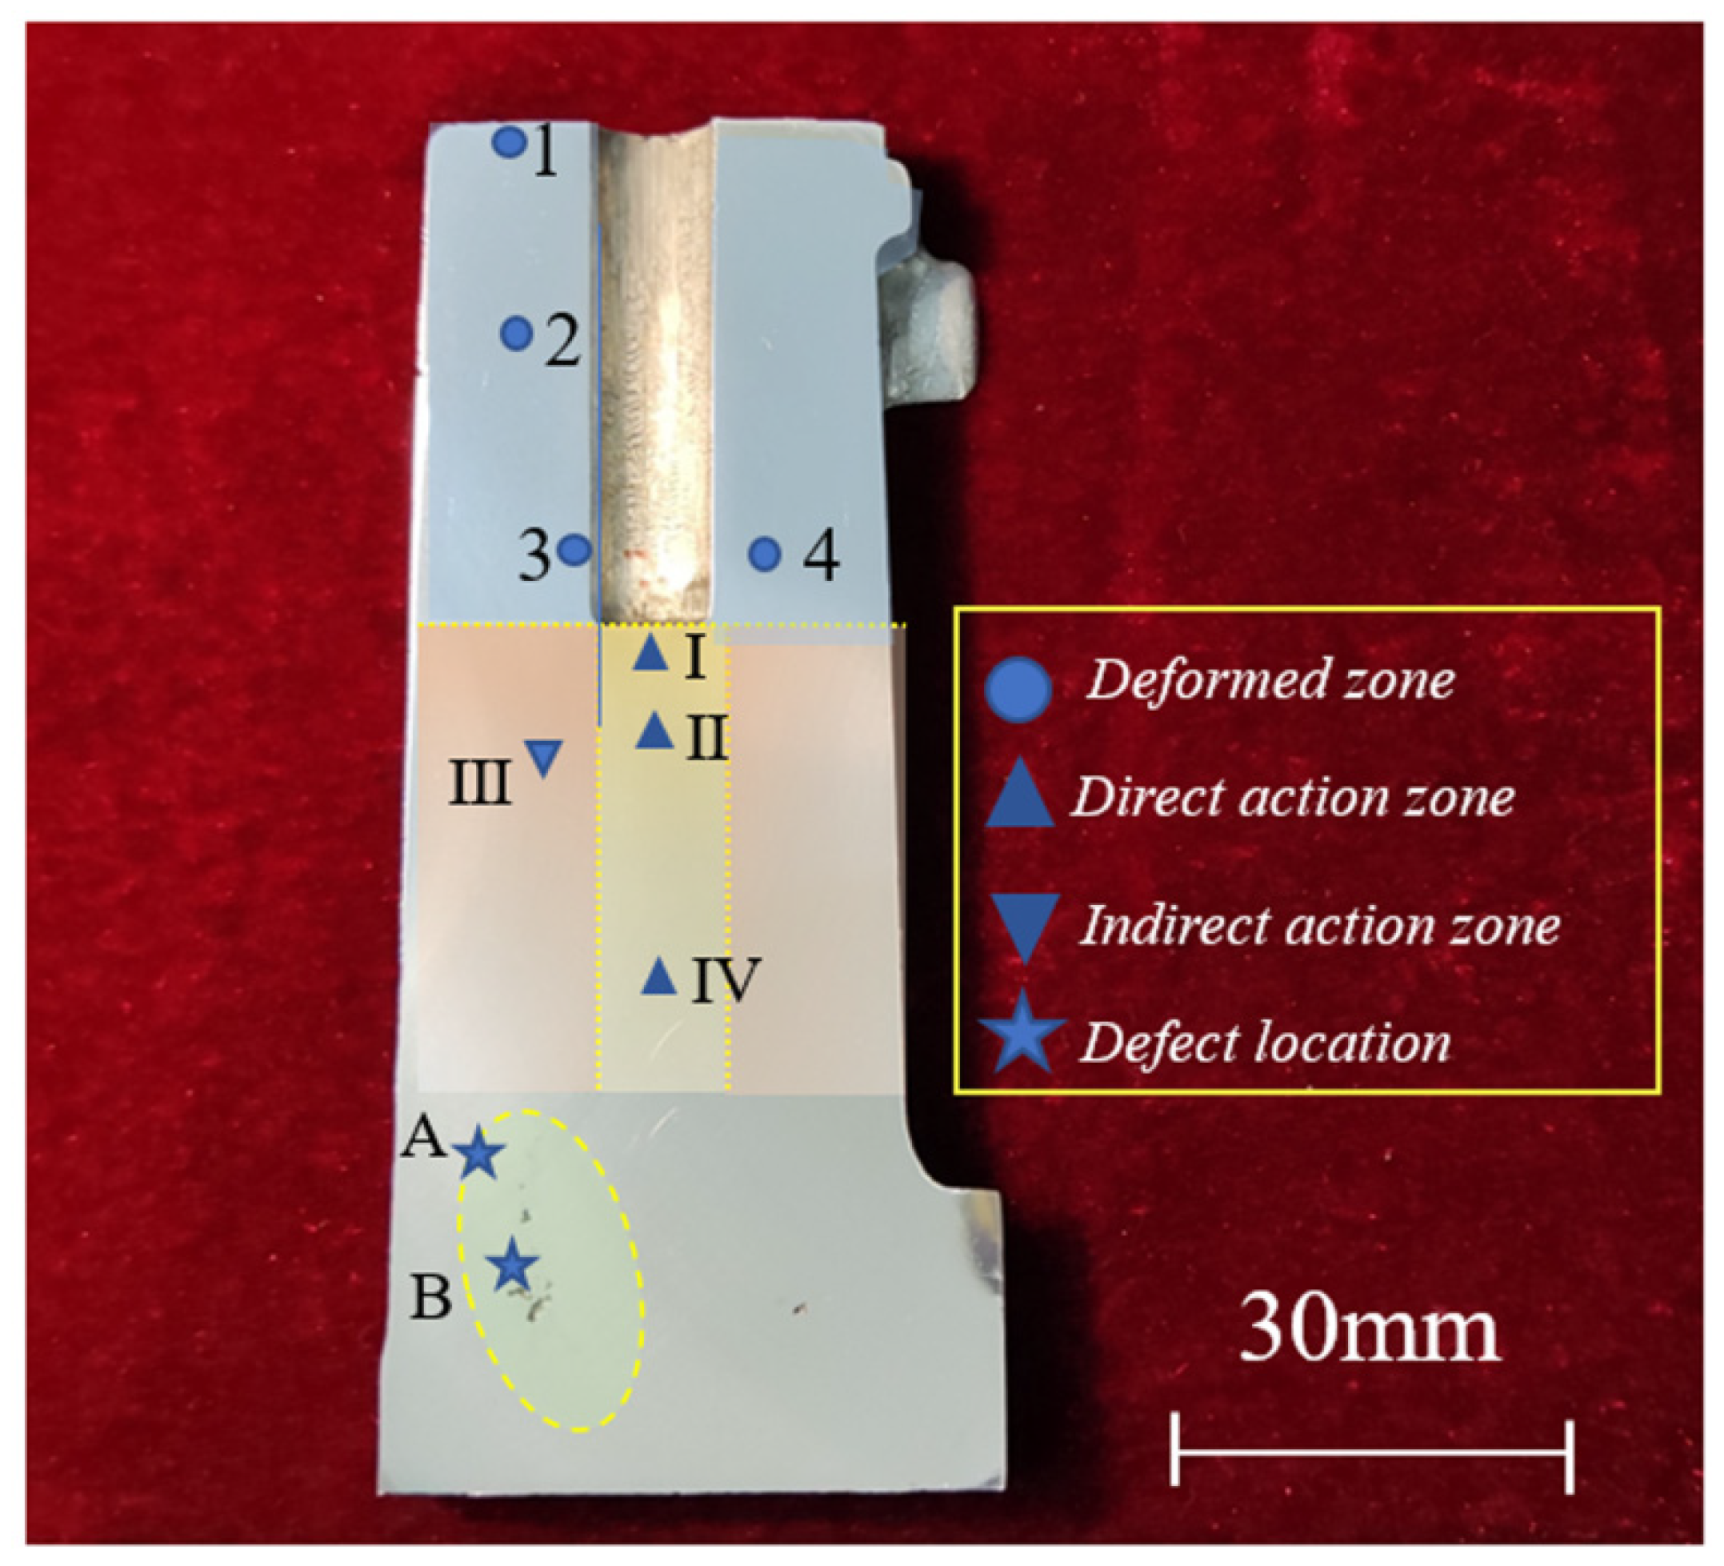
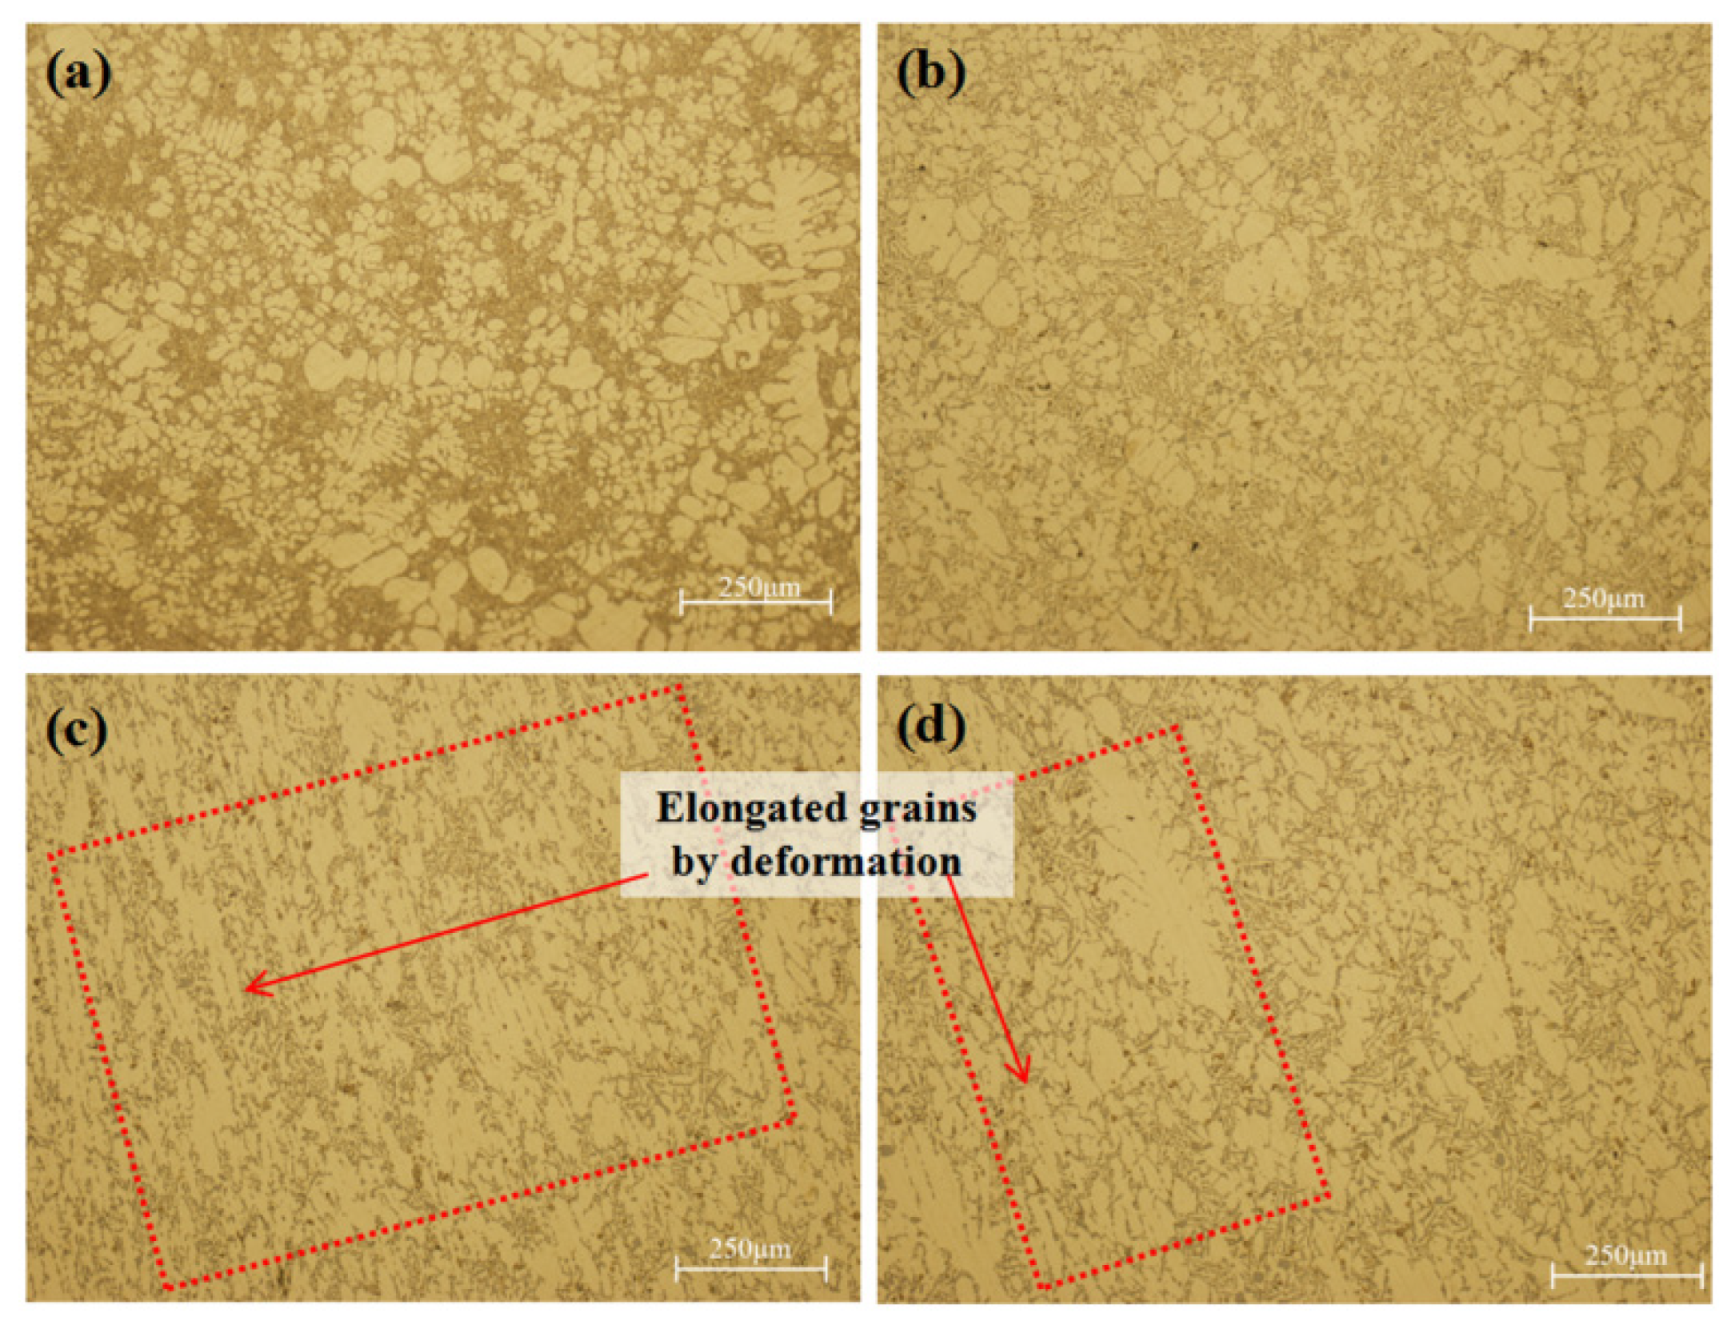
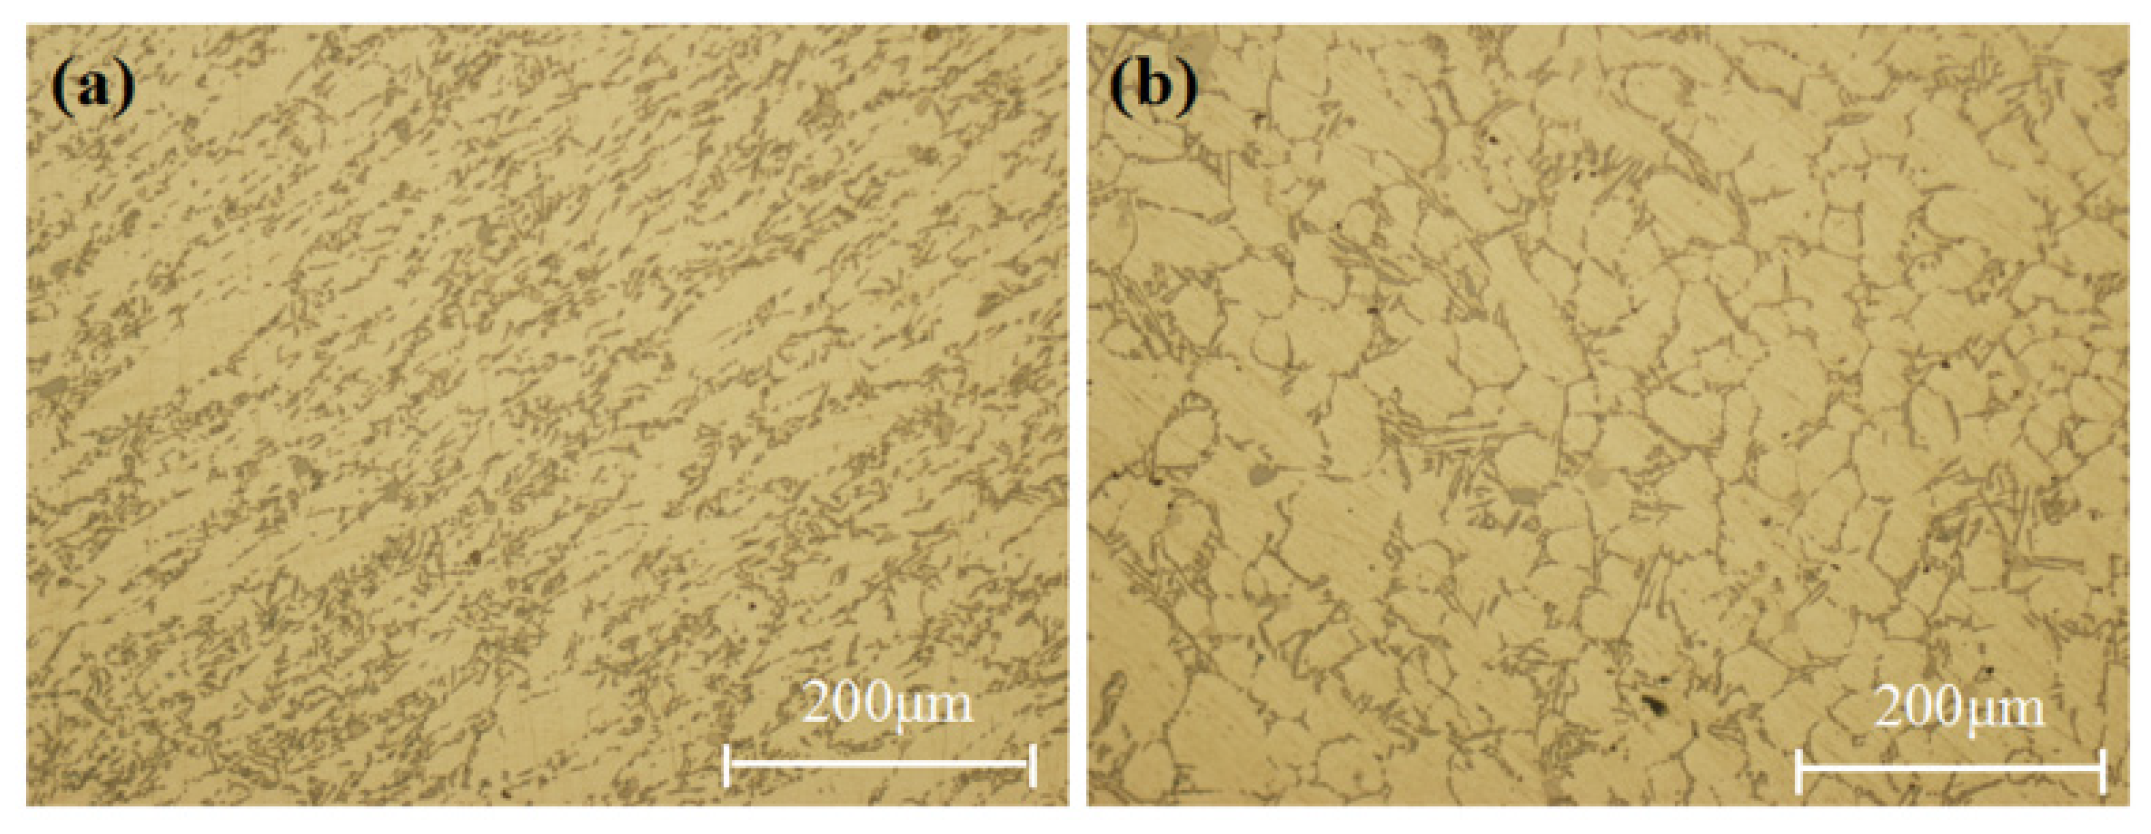
- According to the profile morphology, the positions after local pressurization could be divided into a deformation zone, a direct action zone, and an indirect action zone. The microstructures corresponding to different zones were different. The coexistence of as-cast and plastic deformation microstructures was observed. The effect of local pressurization on microstructures was mainly reflected in changing the solidification process, plastic deformation, and forced feeding. The local quenching caused by pressurization caused constitutional supercooling and then changed the morphology of the grains. Local pressurization caused local plastic deformation, and the grains were elongated. The strengthening element Mg was dispersed, and after plastic deformation, the distribution of Si was disordered. Local forced feeding was achieved by introducing large pressure differences through local pressurization.
Author Contributions
Funding
Data Availability Statement
Conflicts of Interest
References
- Gilmont, B. Automobile Industry Insight; McKinsey Company: Calgary, AB, Canada, 2010; pp. 76–77. [Google Scholar]
- Hirsch, J. Recent development in aluminium for automotive applications. Trans. Nonferr. Met. Soc. China 2014, 24, 1995–2002. [Google Scholar] [CrossRef]
- Miller, W.S.; Zhuang, L.; Bottema, J.; Wittebrood, A.J.; De Smet, P.; Haszler, A.; Vieregge, A. Recent development in aluminium alloys for the automotive industry. Mater. Sci. Eng. A 2000, 280, 37–49. [Google Scholar] [CrossRef]
- Chang, X.; Chen, G.; Sun, W.; Zhang, H.; Chu, G.; Zhang, X.; Han, F.; Zhang, W.; Du, Z. Microstructures, mechanical properties and solidification mechanism of a hot tearing sensitive aluminum alloy asymmetric part fabricated by squeeze casting. J. Alloys Compd. 2021, 886, 161254. [Google Scholar] [CrossRef]
- Kang, C.G.; Seo, P.K.; Jeon, Y.P. Thixo diecasting process for fabrication of thin-type component with wrought aluminum alloys and its formability limitation. J. Mater. Process. Technol. 2005, 160, 59–69. [Google Scholar] [CrossRef]
- Srinivasan, R.; Shrinivasan, B.H.; Prasath, K.J.; Saleth, R.J.; Anandhan, R.D. Experimental investigation of aluminium hybrid metal matrix composites processed through squeeze casting process. Mater. Today Proc. 2020, 27, 1821–1826. [Google Scholar] [CrossRef]
- Souissi, S.; Barhoumi, H.; Amar, M.B.; Elhalouani, F. Microstructure Evolution and Mechanical Properties of the T6 Heat Treated AA6063 Alloy Produced by Squeeze Casting. Phys. Met. Metallogr. 2019, 120, 806–812. [Google Scholar] [CrossRef]
- Ghomashchi, M.R.; Vikhrov, A. Squeeze casting: An overview. J. Mater. Process. Technol. 2000, 101, 1–9. [Google Scholar] [CrossRef]
- Pastirčák, R.; Brůna, M.; Bolibruchová, D. The Influence of Different Wall Thicknesses of the Casting in the Direct Squeeze Casting. Arch. Foundry Eng. 2019, 19, 19–24. [Google Scholar] [CrossRef]
- Dao, V.; Zhao, S.; Lin, W.; Zhang, C. Effect of process parameters on microstructure and mechanical properties in AlSi9Mg connecting-rod fabricated by semi-solid squeeze casting. Mater. Sci. Eng. A 2012, 558, 95–102. [Google Scholar] [CrossRef]
- Wang, Y.; Zhao, S.; Zhang, C. Microstructures and mechanical properties of semi-solid squeeze casting ZL104 connecting rod. Trans. Nonferr. Met. Soc. China 2018, 28, 235–243. [Google Scholar] [CrossRef]
- Li, Y.; Zhang, M.; Zhao, H.; Zhang, W.; Cheng, W. Study on Fabrication of a Large Al-Cu-Mn Wheel with Indirect Squeeze Casting Process. Mater. Sci. Forum. 2006, 532–533, 353–356. [Google Scholar] [CrossRef]
- Li, Y.; Hu, Y.; Zhao, H.; Zhang, W. Vertical Indirect Squeeze Casting Process of an Al-Cu-Mn Alloy Frame Part. Mater. Sci. Forum. 2009, 628–629, 605–610. [Google Scholar] [CrossRef]
- Senthil, P.; Amirthagadeswaran, K.S. Optimization of squeeze casting parameters for non symmetrical AC2A aluminium alloy castings through Taguchi method. J. Mech. Sci. Technol. 2012, 26, 1141–1147. [Google Scholar] [CrossRef]
- Chen, Q.; Zhao, W.; Jiang, J.; Huang, M.; Li, M.; Wang, Y.; Ding, C.; Zou, D. Effect of T6 heat treatment on microstructure and mechanical properties of large-weight aluminum alloy flywheel housing parts formed by local-loading squeeze casting. J. Mater. Res. Technol. 2023, 24, 1612–1625. [Google Scholar] [CrossRef]
- Yin, J.; Lei, Q.; Li, X.; Zhang, X.; Meng, X.; Jiang, Y.; Tian, L.; Zhou, S.; Li, Z. A novel neural network-based alloy design strategy: Gated recurrent unit machine learning modeling integrated with orthogonal experiment design and data augmentation. Acta Mater. 2023, 243, 118420. [Google Scholar] [CrossRef]
- GB/T228.1-2010; Metallic-Tensile Testing—Part 1: Method of Test at Room Temperature. National Standard of the People’s Republic of China: Beijing, China, 2010.
- Hashemi, H.R.; Ashoori, H.; Davami, P. Microstructure and tensile properties of squeeze cast Al-Zn-Mg-Cu alloy. Mater. Sci. Technol. 2001, 17, 639–644. [Google Scholar] [CrossRef]
- Hajjari, E.; Divandari, M. An investigation on the microstructure and tensile properties of direct squeeze cast and gravity die cast 2024 wrought Al alloy. Mater. Des. 2008, 29, 1685–1689. [Google Scholar] [CrossRef]
- El-khair, M.T.A. Microstructure characterization and tensile properties of squeeze-cast AlSiMg alloys. Mater. Lett. 2005, 59, 894–900. [Google Scholar] [CrossRef]
- Qi, M.; Kang, Y.; Xu, Y.; Wulabieke, Z.; Li, J. A novel rheological high pressure die-casting process for preparing large thin-walled Al-Si-Fe-Mg-Sr alloy with high heat conductivity, high plasticity and medium strength. Mater. Sci. Eng. A 2020, 776, 139040. [Google Scholar] [CrossRef]
- Wang, S.; Ji, Z.; Sugiyama, S.; Yanagimoto, J. Formation and Growth Mechanism of Globular Crystal of ADC12 Aluminum Alloy by Near-Liquidus Squeeze Casting. Adv. Mech. Eng. 2014, 6, 358754. [Google Scholar] [CrossRef]
- Chen, Y.; Wu, G.; Liu, W.; Zhang, L.; Zhang, S. Effects of pressure and aging treatment on microstructures and mechanical properties of rheo-squeeze casting Mg-3Nd-0.2Zn-0.4Zr alloy. J. Mater. Res. 2018, 33, 758–771. [Google Scholar] [CrossRef]
- Iwamatsu, M. Nucleation and growth by diffusion under Ostwald-Freundlich boundary condition. J. Chem. Phys. 2014, 140, 64702. [Google Scholar] [CrossRef] [PubMed]
- Pastirčák, R.; Ščury, J.; Brůna, M.; Bolibruchová, D. Effect of Technological Parameters on the AlSi12 Alloy Microstructure During Crystallization Under Pressure. Arch. Foundry Eng. 2017, 17, 75–78. [Google Scholar] [CrossRef]
- Eskin, D.; Du, Q.; Ruvalcaba, D.; Katgerman, L. Experimental study of structure formation in binary Al-Cu alloys at different cooling rates. Mater. Sci. Eng. A 2005, 405, 1–10. [Google Scholar] [CrossRef]
- Maleki, A.; Niroumand, B.; Shafyei, A. Effects of squeeze casting parameters on density, macrostructure and hardness of LM13 alloy. Mater. Sci. Eng. A 2006, 428, 135–140. [Google Scholar] [CrossRef]
- Flemings, M. Solidification Processing; McGraw-Hill Book Company: New York, NY, USA, 1974. [Google Scholar]
- Bhagavath, S.; Gong, Z.; Wigger, T.; Shah, S.; Ghaffari, B.; Li, M.; Marathe, S.; Lee, P.D.; Karagadde, S. Role of the local stress systems on microstructural inhomogeneity during semisolid injection. Acta Mater. 2021, 214, 117015. [Google Scholar] [CrossRef]
- Maleki, A.; Shafyei, A.; Niroumand, B. Effects of squeeze casting parameters on the microstructure of LM13 alloy. J. Mater. Process. Technol. 2009, 209, 3790–3797. [Google Scholar] [CrossRef]
- Lasa, L.; Rodriguez-Ibabe, J.M. Characterization of the dissolution of the Al2Cu phase in two Al–Si–Cu–Mg casting alloys using calorimetry. Mater. Charact. 2002, 48, 371–378. [Google Scholar] [CrossRef]
- Pourfathi, A.; Tavakoli, R. Thermal optimization of secondary cooling systems in the continuous steel casting process. Int. J. Therm. Sci. 2023, 183, 107860. [Google Scholar] [CrossRef]


| Alloy | Si | Mg | Mn | Cr | Al | Fe | Cu | Zn |
|---|---|---|---|---|---|---|---|---|
| AlSi9Mg | 8.79 | 0.194 | 0.246 | 0.03 | Bal. | 0.295 | 0.074 | 0.027 |
| Pouring Temperature/°C | Specific Pressure/MPa | Mold Temperature/°C | Local Specific Pressure/MPa | Pressure Delay Time/s | |
|---|---|---|---|---|---|
| 1 | 650 | 32 | 190 | 0 | 10 (side A); 12 (side B) |
| 2 | 658 | 40 | 210 | 800 | 13 (side A); 15 (side B) |
| 3 | 665 | 48 | 220 | 800 | 15 (side A); 17 (side B) |
| Serial Numbers | Pouring Temperature/°C | Specific Pressure/MPa | Mold Temperature/°C | Local Specific Pressure/MPa | Pressure Delay Time/s |
|---|---|---|---|---|---|
| 1 | 650 | 32 | 190 | 0 | 10 (side A); 12 (side B) |
| 2 | 650 | 40 | 210 | 800 | 13 (side A); 15 (side B) |
| 3 | 650 | 48 | 220 | 800 | 15 (side A); 17 (side B) |
| 4 | 658 | 32 | 190 | 800 | 13 (side A); 15 (side B) |
| 5 | 658 | 40 | 210 | 800 | 15 (side A); 17 (side B) |
| 6 | 658 | 48 | 220 | 0 | 10 (side A); 12 (side B) |
| 7 | 665 | 32 | 210 | 0 | 15 (side A); 17 (side B) |
| 8 | 665 | 40 | 220 | 800 | 10 (side A); 12 (side B) |
| 9 | 665 | 48 | 190 | 800 | 13 (side A); 15 (side B) |
| 10 | 650 | 32 | 220 | 800 | 13 (side A); 15 (side B) |
| 11 | 650 | 40 | 190 | 0 | 15 (side A); 17 (side B) |
| 12 | 650 | 48 | 210 | 800 | 10 (side A); 12 (side B) |
| 13 | 658 | 32 | 210 | 800 | 10 (side A); 12 (side B) |
| 14 | 658 | 40 | 220 | 0 | 13 (side A); 15 (side B) |
| 15 | 658 | 48 | 190 | 800 | 15 (side A); 17 (side B) |
| 16 | 665 | 32 | 220 | 800 | 15 (side A); 17 (side B) |
| 17 | 665 | 40 | 190 | 800 | 10 (side A); 12 (side B) |
| 18 | 665 | 48 | 210 | 0 | 13 (side A); 15 (side B) |
| A-1 | A-2 | B-2 | C | D | |
|---|---|---|---|---|---|
| Ultimate tensile strength/MPa | 177.4 ± 26.8 | 175.0 ± 14.7 | 167.3 ± 13.7 | 179.5 ± 23.7 | 168.7 ± 17.4 |
| Elongation/% | 2.65 ± 1.21 | 2.58 ± 1.03 | 1.56 ± 0.81 | 2.92 ± 1.32 | 2.39 ± 1.15 |
| I/°C | II/MPa | III/°C | IV/MPa | V/s | σb/MPa | δ/% | |
|---|---|---|---|---|---|---|---|
| 1 | 650 | 32 | 190 | 0 | A | 180.7 | 2.33 |
| 2 | 650 | 40 | 210 | 800 | B | 176.3 | 2.95 |
| 3 | 650 | 48 | 220 | 800 | C | 195.3 | 3.13 |
| 4 | 658 | 32 | 190 | 800 | B | 172.7 | 2.50 |
| 5 | 658 | 40 | 210 | 800 | C | 167.0 | 2.29 |
| 6 | 658 | 48 | 220 | 0 | A | 180.3 | 3.12 |
| 7 | 665 | 32 | 210 | 0 | C | 169.3 | 1.65 |
| 8 | 665 | 40 | 220 | 800 | A | 168.7 | 2.54 |
| 9 | 665 | 48 | 190 | 800 | B | 168.7 | 2.13 |
| 10 | 650 | 32 | 220 | 800 | B | 165.3 | 2.24 |
| 11 | 650 | 40 | 190 | 0 | C | 184.7 | 3.50 |
| 12 | 650 | 48 | 210 | 800 | A | 170.3 | 2.46 |
| 13 | 658 | 32 | 210 | 800 | A | 167.0 | 2.33 |
| 14 | 658 | 40 | 220 | 0 | B | 177.3 | 2.83 |
| 15 | 658 | 48 | 190 | 800 | C | 171.0 | 2.39 |
| 16 | 665 | 32 | 220 | 800 | C | 179.5 | 2.86 |
| 17 | 665 | 40 | 190 | 800 | A | 164.5 | 2.99 |
| 18 | 665 | 48 | 210 | 0 | B | 172.2 | 2.50 |
| I | II | III | IV | V | ||
|---|---|---|---|---|---|---|
| Ultimate tensile strength/MPa | K1 | 178.77 | 172.42 | 173.72 | 177.42 | 171.92 |
| K2 | 172.55 | 173.08 | 170.35 | 173.08 | 172.08 | |
| K3 | 170.48 | 176.30 | 177.73 | 171.30 | 177.80 | |
| R | 8.29 | 3.88 | 7.38 | 6.12 | 5.88 | |
| Elongation/% | K1 | 2.77 | 2.32 | 2.64 | 2.66 | 2.63 |
| K2 | 2.58 | 2.85 | 2.36 | 2.62 | 2.53 | |
| K3 | 2.45 | 2.62 | 2.79 | 2.52 | 2.64 | |
| R | 0.32 | 0.53 | 0.43 | 0.14 | 0.11 |
| A-1 | A-2 | B-2 | C | D | Average | |
|---|---|---|---|---|---|---|
| Ultimate tensile strength/MPa | 230.6 | 218.4 | 164.2 | 210.2 | 183.9 | 201.5 |
| Yield strength/MPa | 104.8 | 102.8 | 99.4 | 90.5 | 112.9 | 102.1 |
| Elongation/% | 7.15 | 7.44 | 2.17 | 5.58 | 3.23 | 5.11 |
Disclaimer/Publisher’s Note: The statements, opinions and data contained in all publications are solely those of the individual author(s) and contributor(s) and not of MDPI and/or the editor(s). MDPI and/or the editor(s) disclaim responsibility for any injury to people or property resulting from any ideas, methods, instructions or products referred to in the content. |
© 2023 by the authors. Licensee MDPI, Basel, Switzerland. This article is an open access article distributed under the terms and conditions of the Creative Commons Attribution (CC BY) license (https://creativecommons.org/licenses/by/4.0/).
Share and Cite
Chen, Q.; Ge, N.; Jiang, J.; Huang, M.; Li, M.; Wang, Y.; Dong, J.; Ding, C.; Zou, D. Effect of Local Pressurization on Microstructure and Mechanical Properties of Aluminum Alloy Flywheel Housing with Complex Shape. Materials 2024, 17, 106. https://doi.org/10.3390/ma17010106
Chen Q, Ge N, Jiang J, Huang M, Li M, Wang Y, Dong J, Ding C, Zou D. Effect of Local Pressurization on Microstructure and Mechanical Properties of Aluminum Alloy Flywheel Housing with Complex Shape. Materials. 2024; 17(1):106. https://doi.org/10.3390/ma17010106
Chicago/Turabian StyleChen, Qiang, Ning Ge, Jufu Jiang, Minjie Huang, Mingxing Li, Ying Wang, Jian Dong, Changjie Ding, and Dechao Zou. 2024. "Effect of Local Pressurization on Microstructure and Mechanical Properties of Aluminum Alloy Flywheel Housing with Complex Shape" Materials 17, no. 1: 106. https://doi.org/10.3390/ma17010106