
Research on Compressive Strength of Manufactured Sand Concrete Based on Response Surface Methodology


Abstract
:1. Introduction
2. Experimental Preparation
2.1. Experimental Materials
2.2. Experimental Methods
2.2.1. Methods of Experimental Design
2.2.2. Mix Proportions
2.2.3. Macroscopic Characteristics and Rheological Property Testing
- Macroscopic Characteristics
- 2.
- Rheological Properties
2.2.4. Specimen Preparation
2.2.5. Compressive Strength
3. Results and Discussion
3.1. Macroscopic Features and Rheological Properties
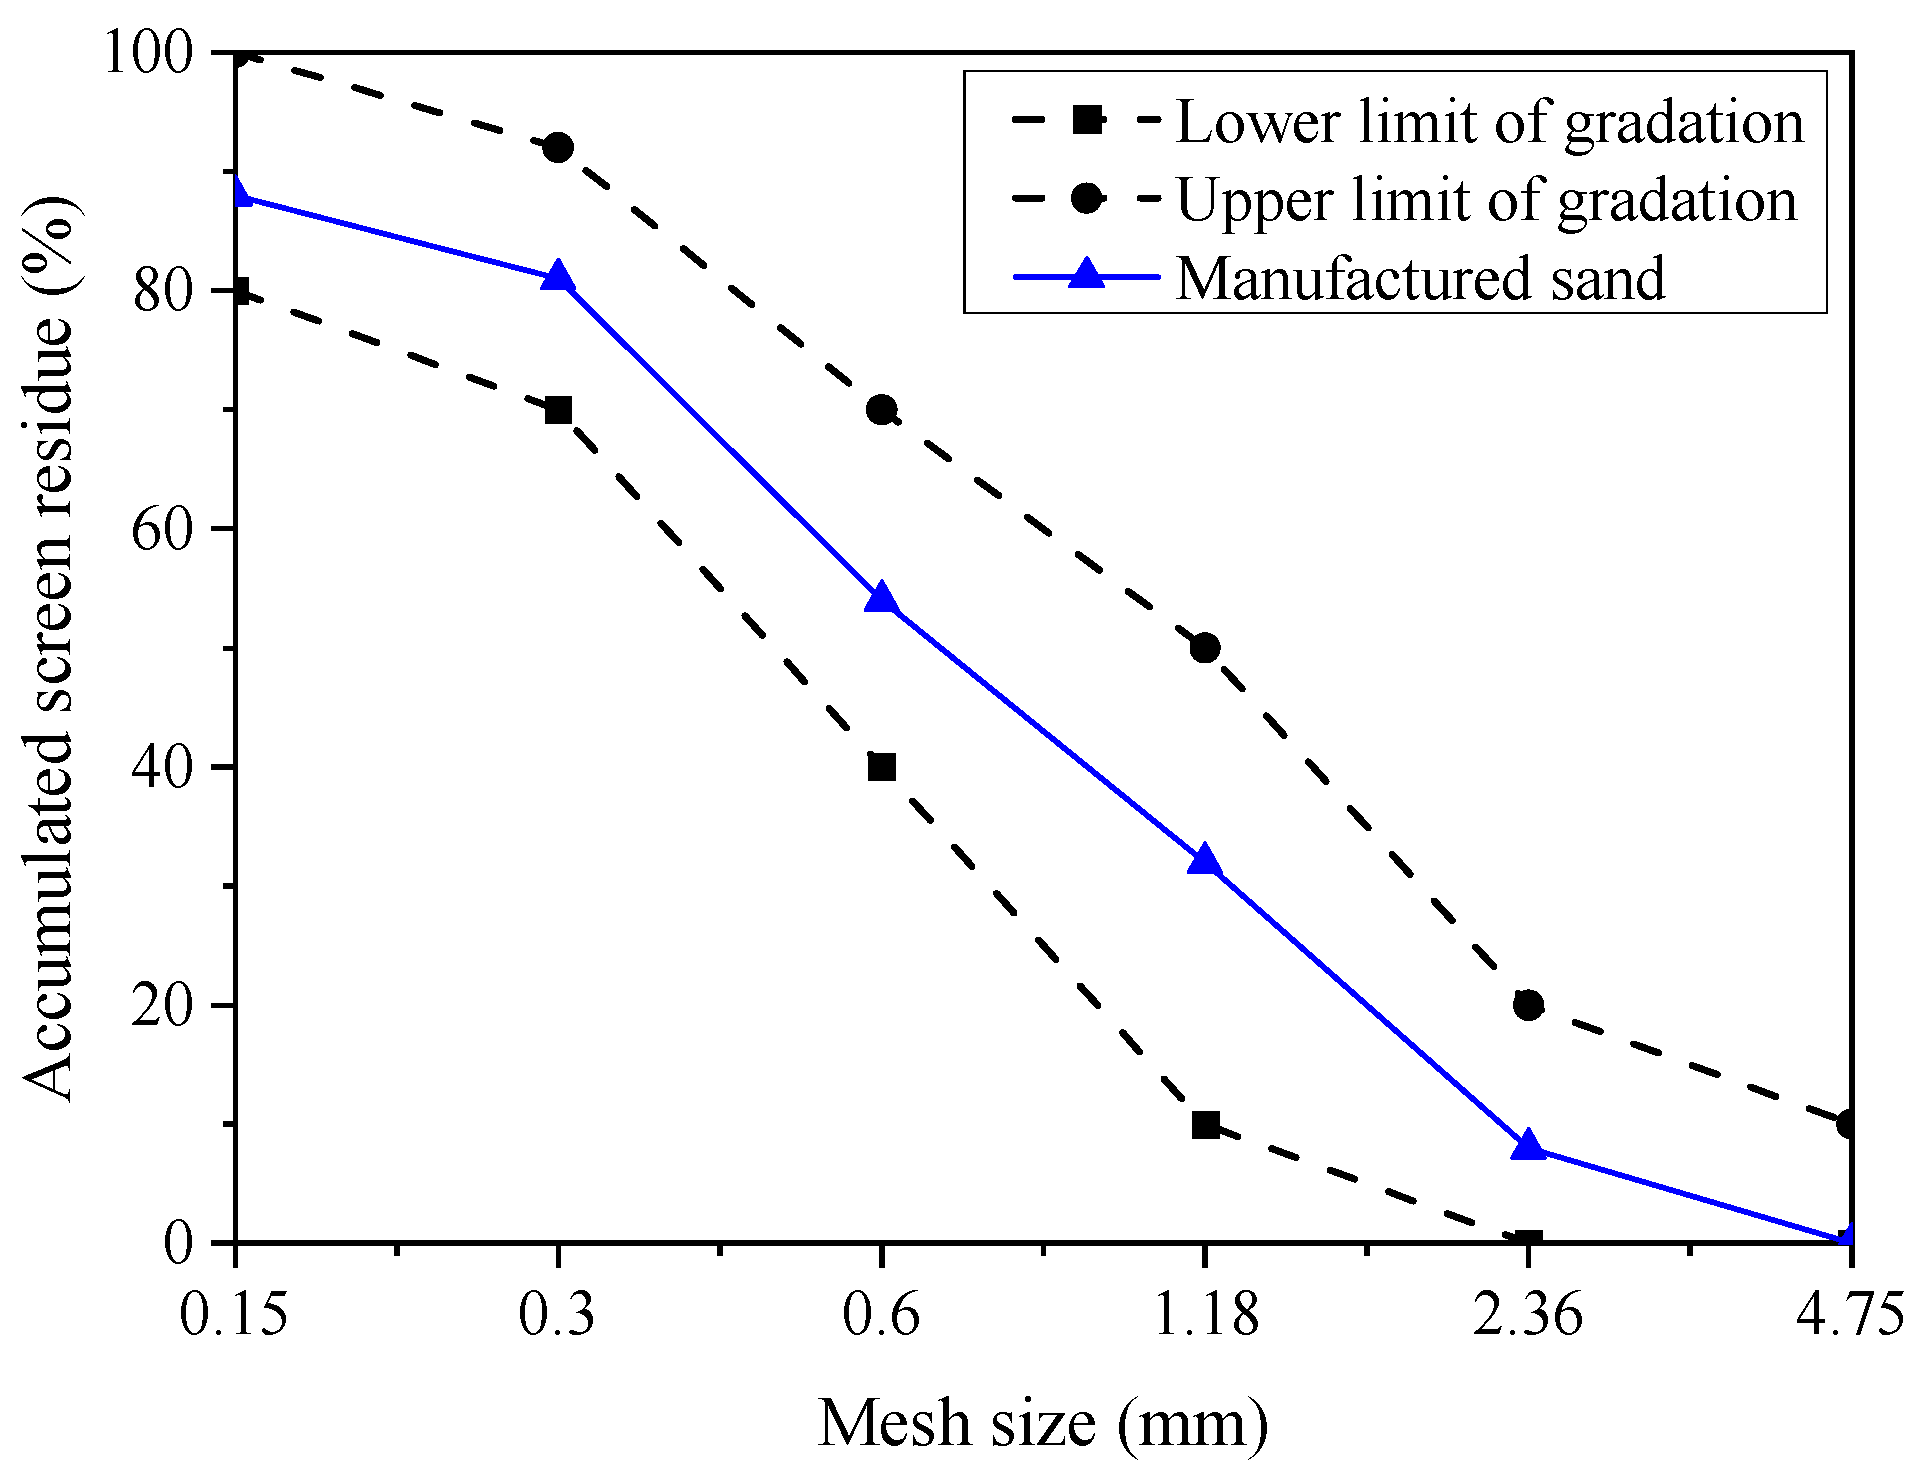
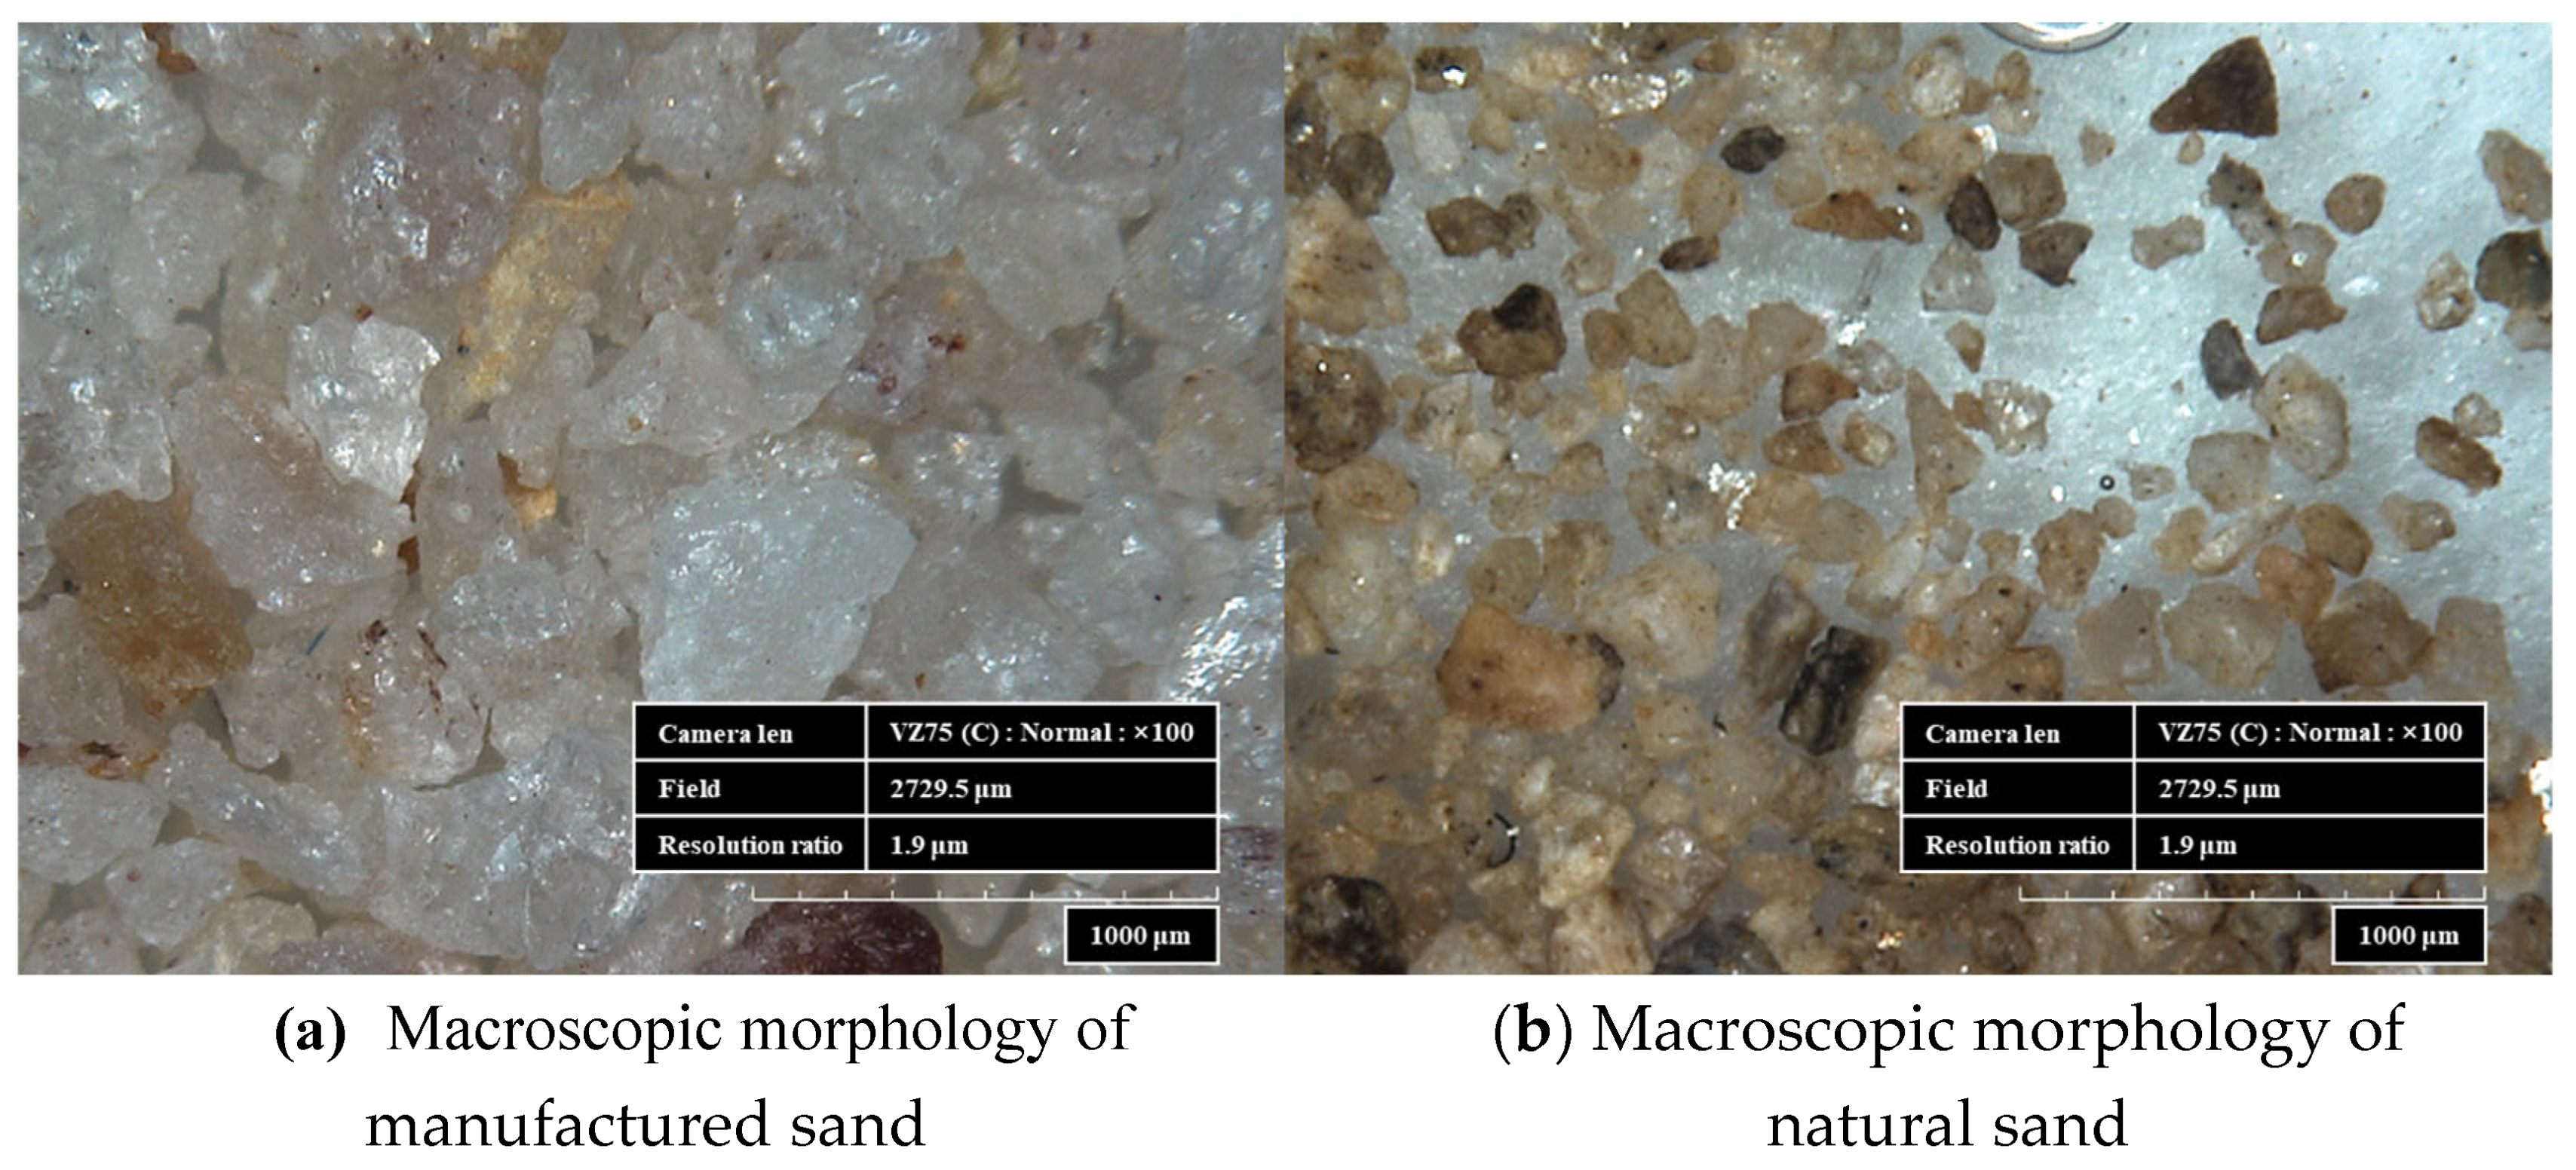
- Macroscopic Features
- 2.
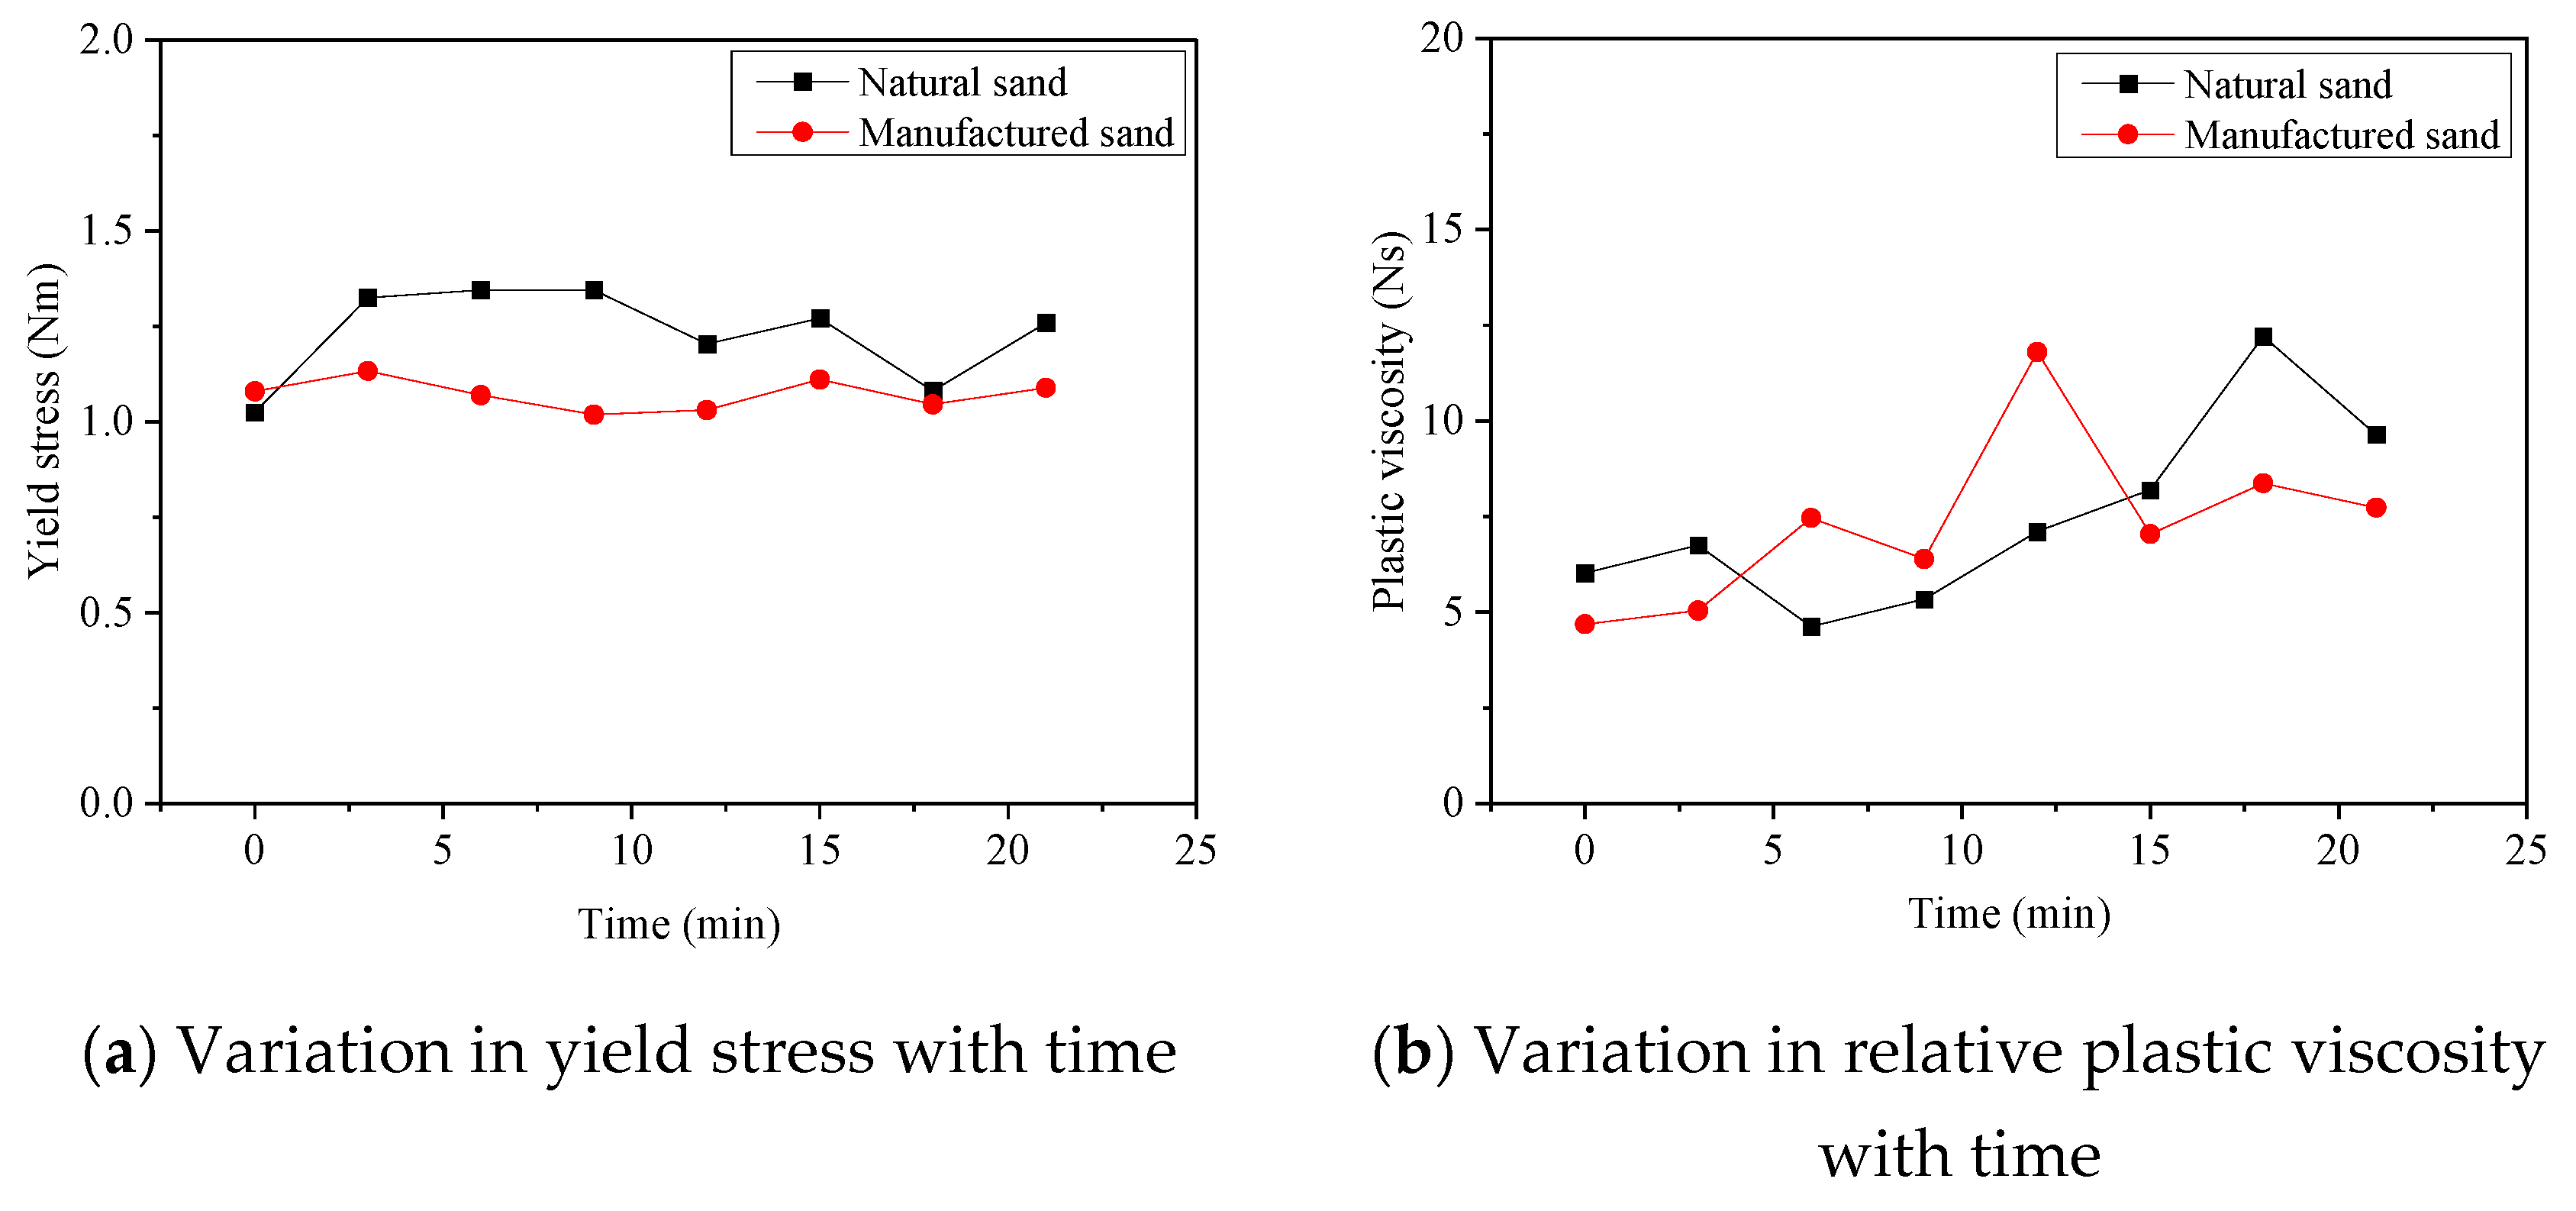
- Rheological Properties
3.2. Compressive Strengths
3.2.1. Box–Behnken Experimental Design and Significance Tests
- Box–Behnken experimental design
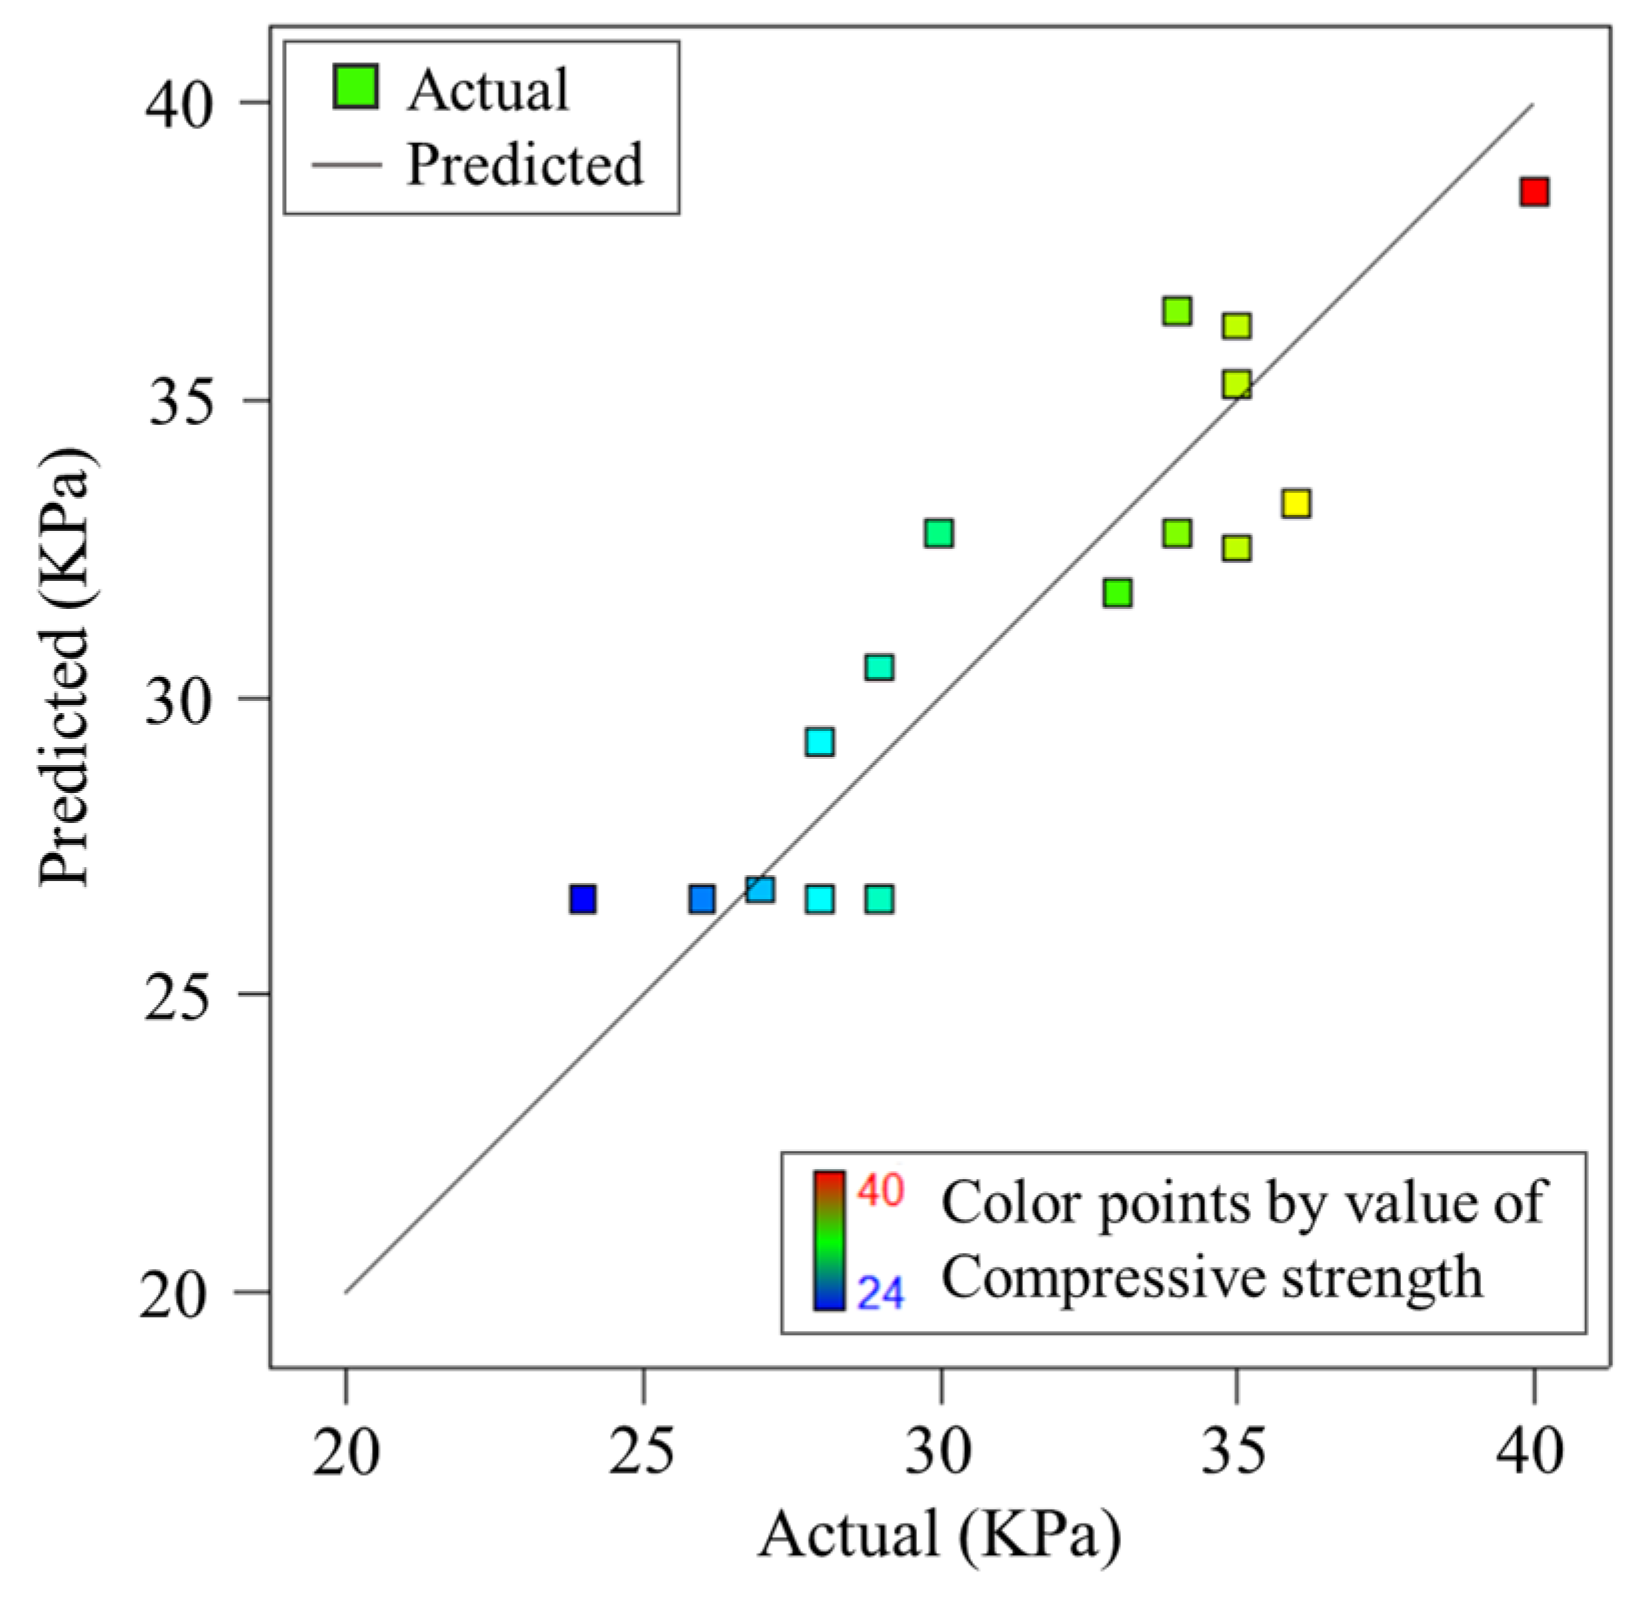
R2 = 0.83
- 2.
- Significance Tests
3.2.2. Response Surface and Contour Analysis
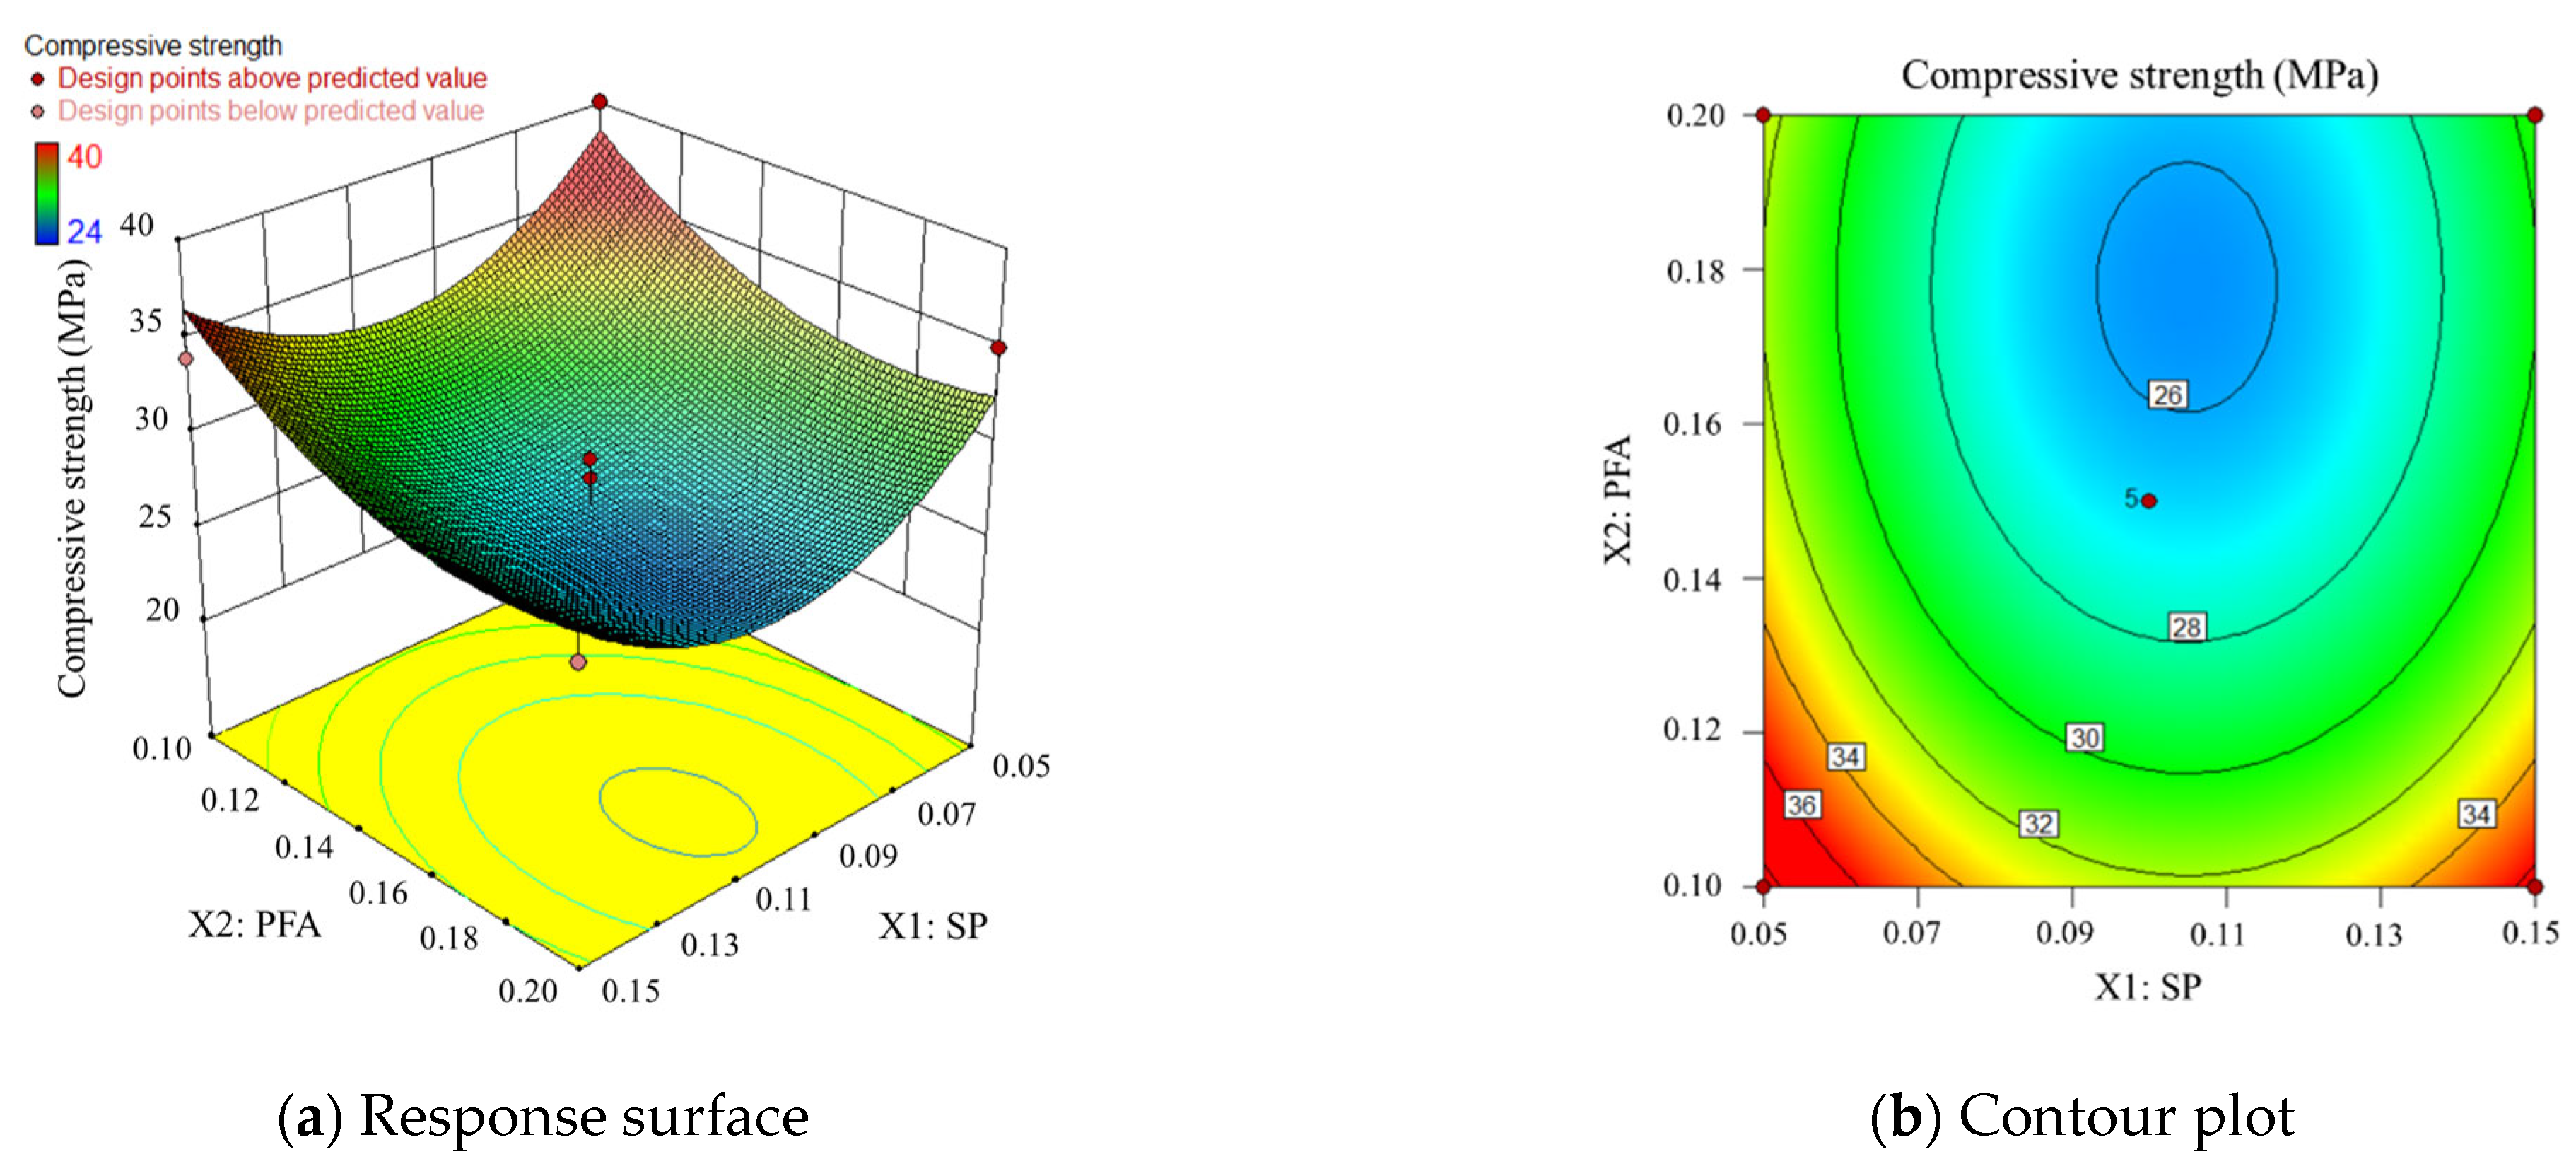
- Compound doping of SP and PFA
- 2.
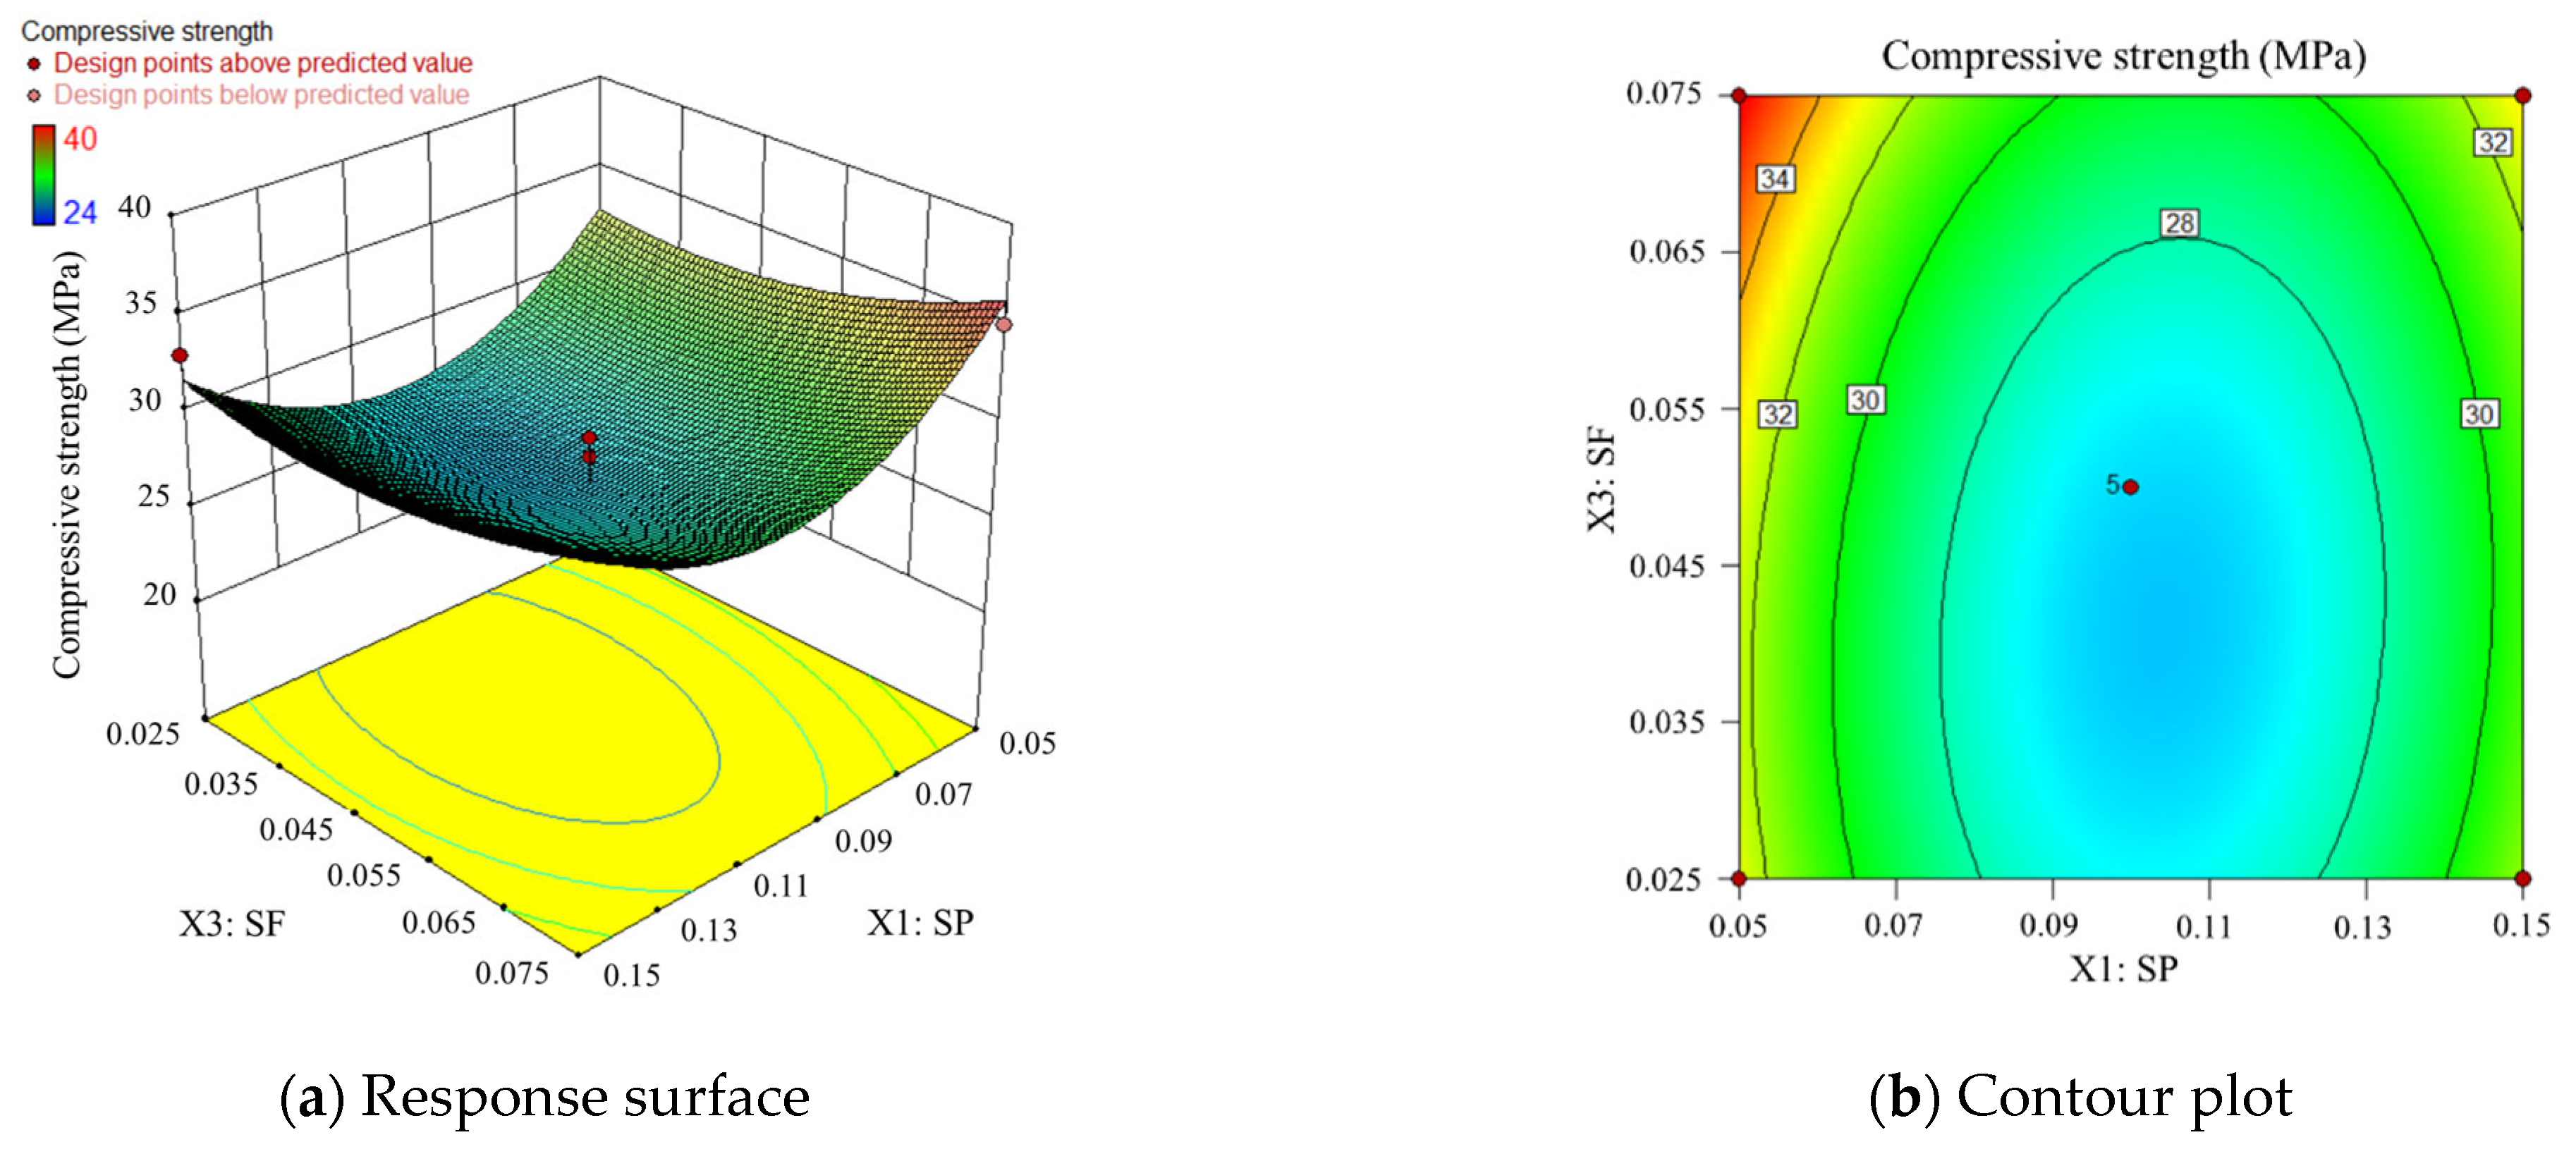
- Compound doping of SP and SF
- 3.
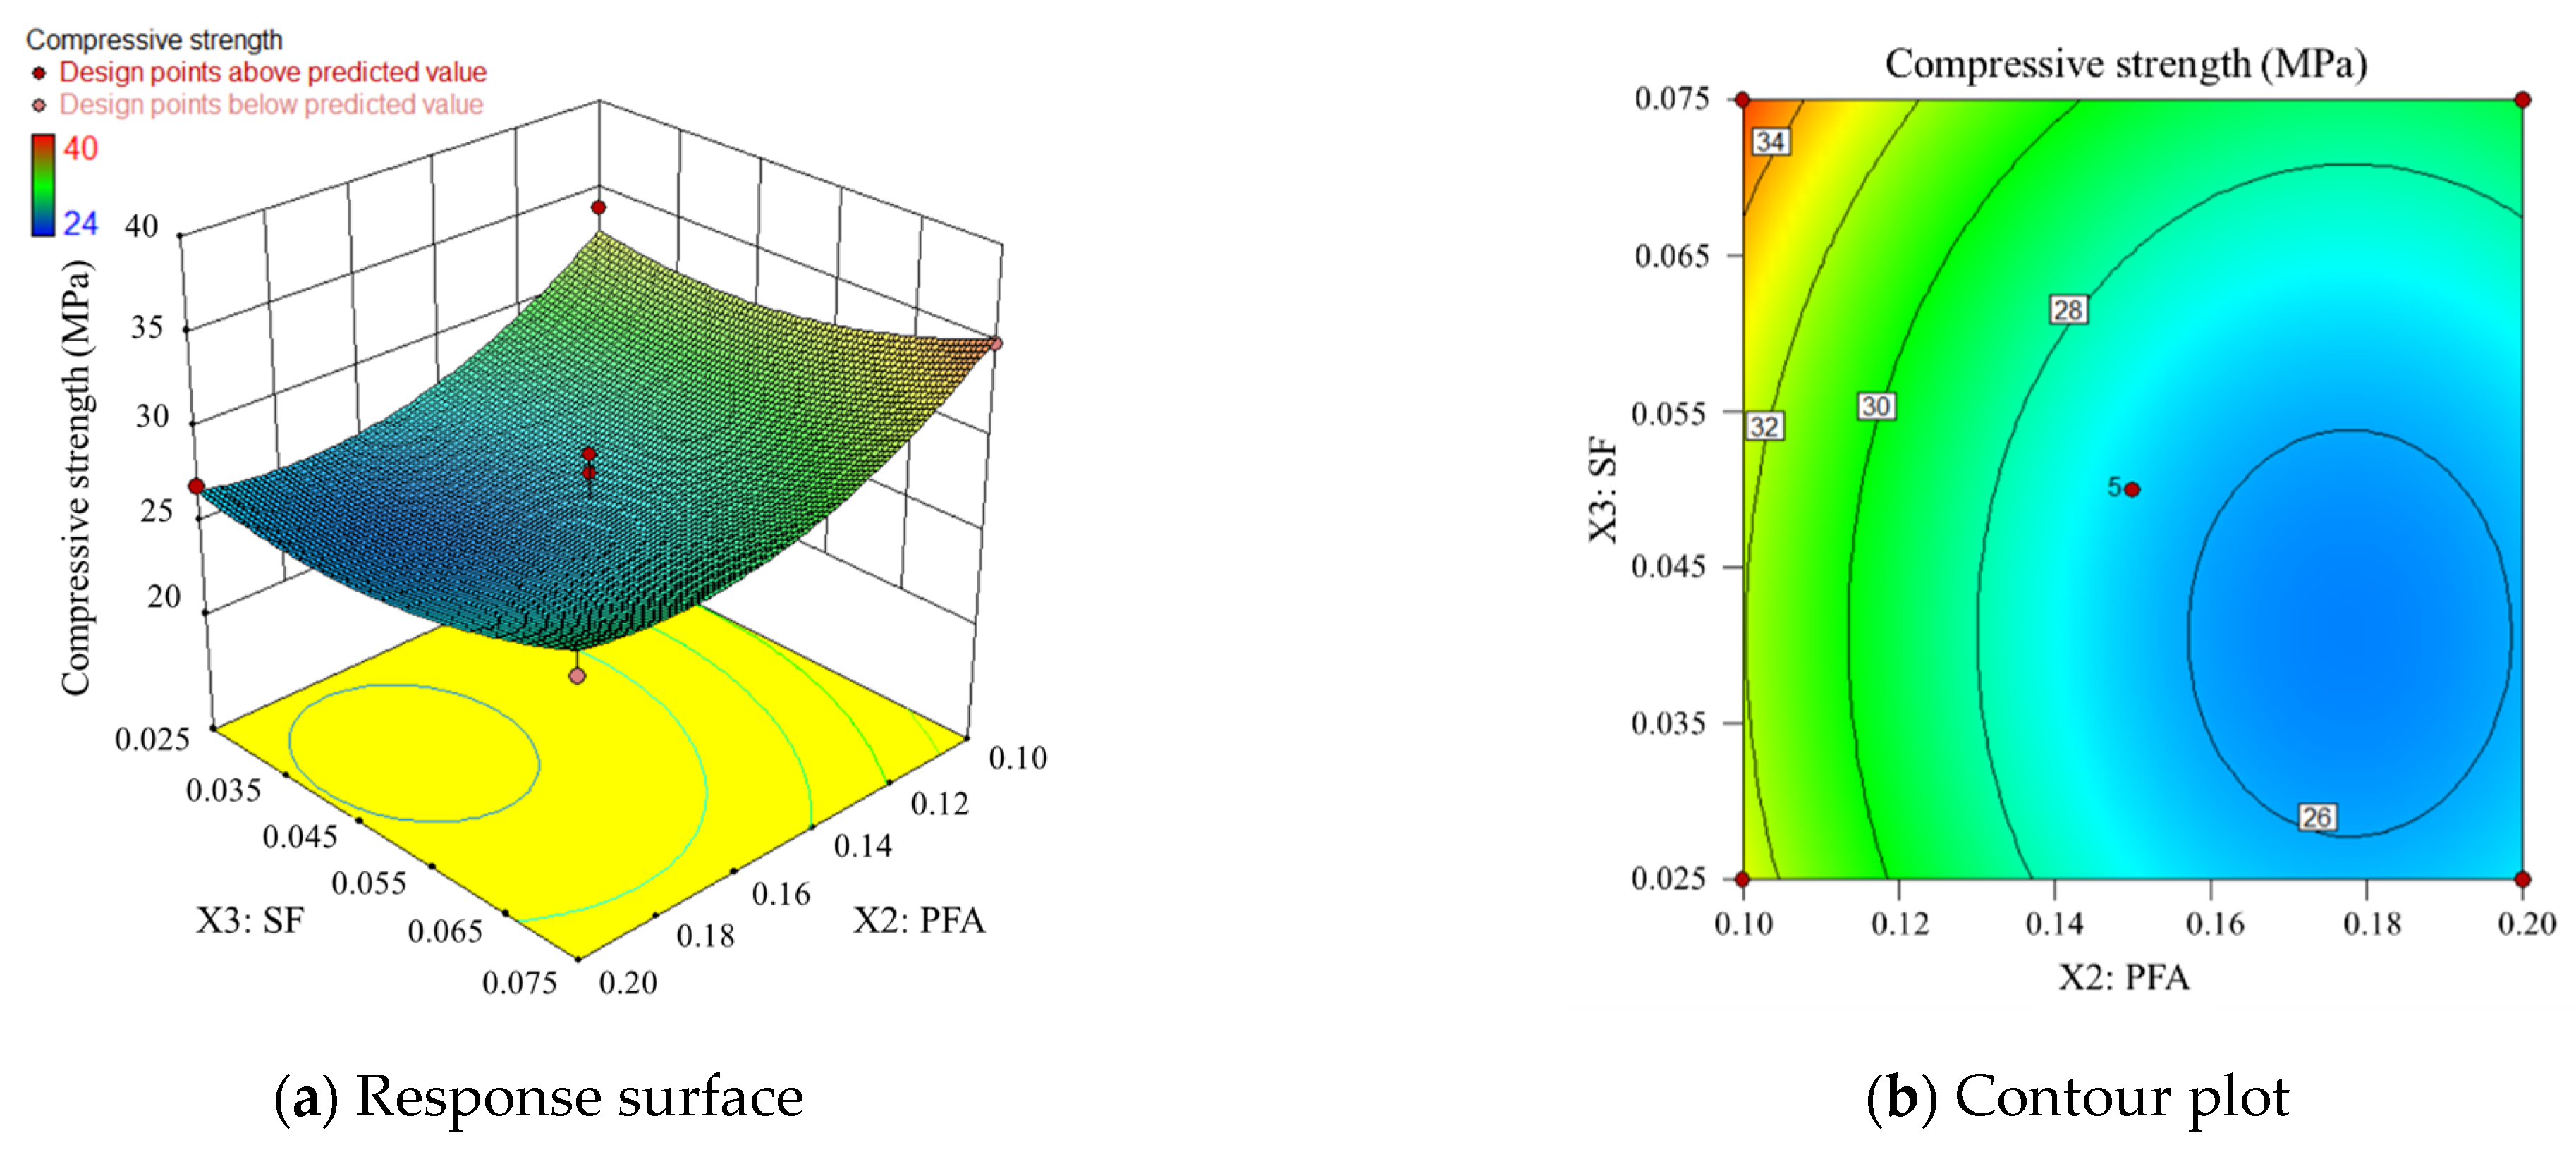
- Compound doping of PFA and SF
4. Conclusions
- The combined use of SP, PFA, and SF improved the particle size distribution of artificial sand, mitigating its angularity and surface roughness shortcomings. This combination acts as a physical water reducer and enhances interparticle lubrication, thereby improving the rheological properties of artificial sand concrete.
- RSM considers random experimental errors, predicting the experimental results within variable ranges. The predictive model obtained from experimental results through RSM is continuous. This study effectively predicts the compressive strength of artificial sand concrete under different admixture levels and provides continuous analysis of various levels of the experiment. The study utilized multiple regression analysis to establish a predictive model for the compressive strength of siliceous artificial sand concrete within the ranges of SP, PFA, and SF, whose contents are 5–15%, 10–20%, and 2.5–7.5% respectively. The multiple correlation coefficient (R2) of the predictive model was 0.83, indicating its high reliability.
- SP had the greatest effect on the compressive strength of mechanism sand concrete and SF had the least effect. For compounding factors, SP and PFA had the most significant effect on the compressive strength of artificial sand concrete, and PFA and SF had the least effect.
- Response surface and contour analyses are performed at SP, PFA, and SF dosages of 10%, 15%, and 5% of the cement weight. With increasing SP, PFA, and SF content, the compressive strength shows a decrease and then an increase. The relative minimum compressive strength is observed when SP content is moderate, SF content is low, and PFA content is high. When SP and PFA content are at their minimum levels and SF content is at its maximum, the compressive strength is relatively highest. However, this study does not determine the optimal content levels for SP, PFA, and SF.
Author Contributions
Funding
Institutional Review Board Statement
Informed Consent Statement
Data Availability Statement
Conflicts of Interest
Abbreviations
| RSM | response surface method |
| SP | stone powder |
| PFA | pulverized fuel ash |
| SF | silicon fume |
References
- Sundaralingam, K.; Peiris, A.; Sathiparan, N. Manufactured Sand as River Sand Replacement for Masonry Binding Mortar. In Proceedings of the Moratuwa Engineering Research Conference (MERCon 2021)/7th International Multidisciplinary Engineering Research Conference, Moratuwa, Sri Lanka, 27–29 July 2021; pp. 403–408. [Google Scholar] [CrossRef]
- Ferrández, D.; Alvarez, M.; Saiz, P.; Zaragoza-Benzal, A. Recovery of mineral wool waste and recycled aggregates for use in the manufacturing processes of masonry mortars. Processes 2022, 10, 830. [Google Scholar] [CrossRef]
- Tamanna, N.; Tuladhar, R.; Sivakugan, N. Performance of recycled waste glass sand as partial replacement of sand in concrete. Constr. Build. Mater. 2020, 239, 117804. [Google Scholar] [CrossRef]
- Chen, L.; Ma, H.; Sun, Z.; Zhang, Y. Flowability of multi-sized mixed particles based on shotcrete aggregates. Powder Technology. 2022, 408, 117760. [Google Scholar] [CrossRef]
- Liu, Y.; Guo, Y.; Li, H.; Wang, H. Experimental study on the effect of recycled aggregate from construction waste on the transportation performance of mine filling paste. Shandong Univ. Sci. Technol. Nat. Sci. 2020, 39, 59–65. [Google Scholar]
- Yin, Y. Research on the Performance and Mix Ratio of Mechanized Sand Concrete; Chongqing University: Chongqing, China, 2017. [Google Scholar]
- Ma, H.; Sun, Z.; Ma, G. Research on compressive strength of manufactured sand concrete based on response surface methodology (RSM). Appl. Sci. 2022, 12, 3506. [Google Scholar] [CrossRef]
- Chen, L.; Sun, Z.; Li, P.; Ma, H.; Pan, G. DEM simulation of the transport of mine concrete by a screw feeder. J. Braz. Soc. Mech. Sci. Eng. 2022, 44, 280. [Google Scholar] [CrossRef]
- Arulmoly, B.; Konthesingha, C.; Nanayakkara, A. Performance evaluation of cement mortar produced with manufactured sand and offshore sand as alternatives for river sand. Constr. Build. Mater. 2021, 297, 123784. [Google Scholar] [CrossRef]
- Murat, O.; Murat, G. Assessment of optimum threshold and particle shape parameter for the image analysis of aggregate size distribution of concrete sections. Opt. Lasers Eng. 2014, 53, 122–132. [Google Scholar] [CrossRef]
- Mundra, S.; Sindhi, P.R.; Chandwani, V.; Nagar, R.; Agrawal, V. Crushed rock sand–An economical and ecological alternative to natural sand to optimize concrete mix. Perspect. Sci. 2016, 8, 345–347. [Google Scholar] [CrossRef]
- Zhang, Q.; Zou, J.; Chi, M.; Jiao, Y.; Yan, X. On the strong mining-induced earthquakes induced by the fracturing of key strata during deep coal mining. Int. J. Geomech. 2023. [Google Scholar]
- Wang, H.; Gao, M.; Gao, Y.; Chen, Q. Experimental study on dynamic characteristics of calcareous sand solidified by polymer. Shandong Univ. Sci. Technol. Nat. Sci. 2021, 40, 56–64. [Google Scholar]
- Martins, P.; Diane, G.; Robert, L. An Investigation into the Use of Manufactured Sand as a 100% Replacement for Fine Aggregate in Concrete. Materials 2016, 9, 440. [Google Scholar] [CrossRef]
- Wang, J.; Xue, C.; Zhang, Y.; Li, Q.; Han, Y.; Qiao, H. Study of Early-Age Hydration, Mechanical Properties Development, and Microstructure Evolution of Manufactured Sand Concrete Mixed with Granite Stone Powder. Materials 2023, 16, 4857. [Google Scholar] [CrossRef] [PubMed]
- Li, T.; Tier, L. Microscopic mechanism analysis of the influence of stone powder with different replacement ratio on concrete performance. Arab. J. Geosci. 2022, 16, 17. [Google Scholar] [CrossRef]
- Meera, M.; Anuj Supravin, K.; Gupta, S. Importance of moisture correction in fine powder materials for concrete. Mater. Today Proc. 2020, 32, 961–967. [Google Scholar] [CrossRef]
- Bentz, D.P.; Ardani, A.; Barrett, T.; Jones, S.Z.; Lootens, D.; Peltz, M.A.; Sato, T.; Stutzman, P.E.; Tanesi, J.; Weiss, W.J. Multi-scale investigation of the performance of limestone in concrete. Constr. Build. Mater. 2015, 75, 1–10. [Google Scholar] [CrossRef]
- Voglis, N.; Kakali, G.; Chaniotakis, E.; Tsivlis, S. Portland-limestone cements. Their properties and hydration compared to those of other composite cements. Cem. Concr. Compos. 2005, 27, 191–196. [Google Scholar] [CrossRef]
- Otman, M.M.E.; Sghaiar, N.; Mohammed, S.; Gamil, M.S.A.; Abdullah, M.Z. Performance of self-compacting concrete incorporating wastepaper sludge ash and pulverized fuel ash as partial substitutes. Case Stud. Constr. Mater. 2022, 17, e01459. [Google Scholar] [CrossRef]
- Kim, D.G.; Lee, S.T. Mechanical Properties of Ternary Blended Cement Concrete Incorporating Pulverized Reject Ash. Collect. Pap. Korean Road Soc. 2021, 23, 43–51. [Google Scholar] [CrossRef]
- Ding, X.; Li, C.; Xu, Y.; Li, F.; Zhao, S. Experimental study on long-term compressive strength of concrete with manufactured sand. Constr. Build. Mater. 2016, 108, 67–73. [Google Scholar] [CrossRef]
- Wang, Q.; Jiang, M.; Xu, G.; Zhao, J.; Zhao, B. The Effect of Machine-made Sand and Stone Powder Content on the Strength of Pumped Concrete. Concrete 2018, 2, 102–106. [Google Scholar]
- Knop, Y.; Peled, A.; Cohen, R. Influences of limestone particle size distributions and contents on blended cement properties. Constr. Build. Mater. 2014, 71, 26–34. [Google Scholar] [CrossRef]
- Li, P.; Brouwers, H.J.H.; Chen, W.; Yu, Q. Optimization and characterization of high-volume limestone powder in sustainable ultra-high performance concrete. Constr. Build. Mater. 2020, 242, 118112. [Google Scholar] [CrossRef]
- Ding, H.; Song, X.; Han, J. The Affection to the Performance of Concrete Cracking of Fly Ash and Slag. Fly Ash Compr. Util. 2016, 6, 29–32. [Google Scholar]
- Peng, Y.; Xiao, J.; Gao, D.; Tang, Y.; Chen, S.; Yang, Z. The effect of stone powder content in machine-made sand on the performance of cement mortar. Concrete 2018, 5, 102–105. [Google Scholar]
- Fu, T.; Liang, J.; Lan, Y.; Xiao, Y.; Wei, J. Effect of Stone Powder Content on Mechanical Properties of Manufactured Sand Concrete. Iran. J. Sci. Technol. Trans. Civ. Eng. 2022, 46, 4255–4264. [Google Scholar] [CrossRef]
- Box, G.E.P.; Behnken, D.W. Some new three level designs for the study of quantitative variables. Technometrics 1960, 2, 455–475. [Google Scholar] [CrossRef]
- Kumar, R. Modified mix design and statistical modelling of lightweight concrete with high volume micro fines waste additive via the Box-Behnken design approach. Cem. Concr. Compos. 2020, 113, 103706. [Google Scholar] [CrossRef]
- Khudhair, M.H.; Al-Anweh, A.M.; Nomaan, M.H.; Berradi, M.; Hsissou, R.; Bekhta, A.; Elyoubi, M.S.; Elharfi, A. Response surface modeling of compressive strength of high performance concrete formulated by a high water reducing and setting accelerating superplasticizer. Box-Behnken experimental design. Chem. Technol. Metall. 2019, 54, 135–144. [Google Scholar]
- GB175-2020; Common Portland Cement. Standards Press of China: Beijing, China, 2020.
- ASTM C150/C150M-22; Standard Specification for Portland Cement. ASTM International: West Conshohocken, PA, USA, 2022.
- JGJ63-2006; Standards of Water for Concrete. China Architecture & Building Press: Beijing, China, 2018.
- GB50086-2015; Technical Code for Engineering of Ground Anchorages and Shotcrete Support. China Planning Press: Beijing, China, 2018.
- Nordin, N.; Abdullah, M.M.A.B.; Fakri, W.M.N.R.W.; Tahir, M.F.M.; Sandu, A.V.; Hussin, K.; Zailani, W.W.A. Exploration on Fly Ash Waste as Global Construction Materials for Dynamics Marketability. Int. Conf. Green Des. Manuf. 2019, 2129, 20143. [Google Scholar] [CrossRef]
- Khan, M.I.; Siddique, R. Utilization of silica fume in concrete: Review of durability properties. Resour. Conserv. Recycl. 2011, 57, 30–35. [Google Scholar] [CrossRef]
- Hamada, H.M.; Abed, F.; Katman, H.Y.B.; Humada, A.M.; Al Jawahery, M.S.; Majdi, A.; Yousif, S.T.; Thomas, B.S. Effect of silica fume on the properties of sustainable cement concrete. J. Mater. Res. Technol. 2023, 24, 8887–8908. [Google Scholar] [CrossRef]
- Kansal, C.M.; Goyal, R. Effect of nano silica, silica fume and steel slag on concrete properties. Mater. Today Proc. 2021, 45, 4535–4540. [Google Scholar] [CrossRef]
- GB/T50081-2019; Standard for Test Methods of Concrete Physical and Mechanical Properties. China Architecture & Building Press: Beijing, China, 2019.
- Xue, D. Determination of uniaxial compressive strength of intact rock. Shandong Univ. Sci. Technol. Nat. Sci. 2020, 39, 28–36. [Google Scholar]
- Altuki, R.; Ley, M.T.; Cook, D.; Jagan, G.M.; Praul, M. Increasing sustainable aggregate usage in concrete by quantifying the shape and gradation of manufactured sand. Constr. Build. Mater. 2022, 321, 125593. [Google Scholar] [CrossRef]
- Barry, M.; Clément, M.; Rangeard, D.; Jacquet, Y.; Perrot, A. Manufactured crushed sand: Packing fraction prediction and influence on mortar rheology. Mater. Struct. 2023, 56, 139. [Google Scholar] [CrossRef]
- Skare, E.L.; Sheiati, S.; Cepuritis, R.; Mørtsell, E.; Smeplass, S.; Spangenberg, J.; Jacobsen, S. Rheology modelling of cement paste with manufactured sand and silica fume: Comparing suspension models with artificial neural network predictions. Constr. Build. Mater. 2022, 317, 126114. [Google Scholar] [CrossRef]


| Constituents | SiO2 | Al2O3 | Fe2O3 | CaO | MgO | SO3 |
|---|---|---|---|---|---|---|
| Content (wt%) | 20.81 | 4.54 | 3.15 | 64.22 | 2 | 2.5 |
| Constituents | SiO2 | Al2O3 | Fe2O3 | CaO | TiO2 | K2O | MgO |
|---|---|---|---|---|---|---|---|
| Content (wt%) | 32.61 | 24.54 | 3.45 | 4.42 | 0.93 | 0.84 | 0.56 |
| Constituents | SiO2 | Al2O3 | Fe2O3 | CaO | SO3 | K2O | MgO | Na2O |
|---|---|---|---|---|---|---|---|---|
| Content (wt%) | 92.5 | 0.2 | 0.6 | 0.12 | 0.44 | 1.52 | 0.15 | 0.37 |
| Run | Cement | Crushed Stone | Sand | Water | X1 | X2 | X3 |
|---|---|---|---|---|---|---|---|
| Control group | 100% | 150% | 2.25% | 50% | 0 | 0 | 0 |
| 1 | 5% | 10% | 5% | ||||
| 2 | 15% | 10% | 5% | ||||
| 3 | 5% | 20% | 5% | ||||
| 4 | 15% | 20% | 5% | ||||
| 5 | 5% | 15% | 2.5% | ||||
| 6 | 15% | 15% | 2.5% | ||||
| 7 | 5% | 15% | 7.5% | ||||
| 8 | 15% | 15% | 7.5% | ||||
| 9 | 10% | 10% | 2.5% | ||||
| 10 | 10% | 20% | 2.5% | ||||
| 11 | 10% | 10% | 7.5% | ||||
| 12 | 10% | 20% | 7.5% | ||||
| 13 | 10% | 15% | 5% | ||||
| 14 | 10% | 15% | 5% | ||||
| 15 | 10% | 15% | 5% | ||||
| 16 | 10% | 15% | 5% | ||||
| 17 | 10% | 15% | 5% |
| Average Value | Yield Stress (Nm) | Plastic Viscosity (Ns) |
|---|---|---|
| Natural sand | 1.23 | 7.49 |
| Manufactured sand | 1.06 | 7.31 |
| Factors | −1 | 0 | 1 |
|---|---|---|---|
| X1 (SP content) | 0.05 | 0.1 | 0.15 |
| X2 (PFA content) | 0.1 | 0.15 | 0.2 |
| X3 (SF content) | 0.025 | 0.05 | 0.075 |
| Run | X1 | X2 | X3 | Y/Compressive Strength (MPa) |
|---|---|---|---|---|
| Control group | 0 | 0 | 0 | 33 |
| 1 | 5% | 10% | 5% | 40 |
| 2 | 15% | 10% | 5% | 34 |
| 3 | 5% | 20% | 5% | 35 |
| 4 | 15% | 20% | 5% | 29 |
| 5 | 5% | 15% | 2.5% | 30 |
| 6 | 15% | 15% | 2.5% | 33 |
| 7 | 5% | 15% | 7.5% | 35 |
| 8 | 15% | 15% | 7.5% | 36 |
| 9 | 10% | 10% | 2.5% | 34 |
| 10 | 10% | 20% | 2.5% | 27 |
| 11 | 10% | 10% | 7.5% | 35 |
| 12 | 10% | 20% | 7.5% | 28 |
| 13 | 10% | 15% | 5% | 26 |
| 14 | 10% | 15% | 5% | 24 |
| 15 | 10% | 15% | 5% | 26 |
| 16 | 10% | 15% | 5% | 28 |
| 17 | 10% | 15% | 5% | 29 |
| Source | Squares | df | Square | Value | Prob > F | |
|---|---|---|---|---|---|---|
| Model | 264.06 | 9 | 29.34 | 3.82 | 0.0454 | significant |
| X1-SP | 8.00 | 1 | 8.00 | 1.04 | 0.3412 | |
| X2-PFA | 72.00 | 1 | 72.00 | 9.39 | 0.0182 | |
| X3-SF | 12.50 | 1 | 12.50 | 1.63 | 0.2425 | |
| X1 X2 | 5.684 × 10⁻¹⁴ | 1 | 5.684 × 10⁻¹⁴ | 7.410 × 10⁻¹⁵ | 1.0000 | |
| X1 X3 | 1.00 | 1 | 1.00 | 0.13 | 0.7287 | |
| X2 X3 | 5.684 × 10⁻¹⁴ | 1 | 5.684 × 10⁻¹⁴ | 7.410 × 10⁻¹⁵ | 1.0000 | |
| X1 X1 | 113.85 | 1 | 113.85 | 14.84 | 0.0063 | |
| X2 X2 | 30.69 | 1 | 30.69 | 4.00 | 0.0856 | |
| X3 X3 | 12.17 | 1 | 12.17 | 1.59 | 0.2482 | |
| Residual | 53.70 | 7 | 7.67 | |||
| Lack of Fit | 38.50 | 3 | 12.83 | 3.38 | 0.1352 | not significant |
| Pure Error | 15.20 | 4 | 3.80 | |||
| Cor Total | 317.76 | 16 |
Disclaimer/Publisher’s Note: The statements, opinions and data contained in all publications are solely those of the individual author(s) and contributor(s) and not of MDPI and/or the editor(s). MDPI and/or the editor(s) disclaim responsibility for any injury to people or property resulting from any ideas, methods, instructions or products referred to in the content. |
© 2023 by the authors. Licensee MDPI, Basel, Switzerland. This article is an open access article distributed under the terms and conditions of the Creative Commons Attribution (CC BY) license (https://creativecommons.org/licenses/by/4.0/).
Share and Cite
Gao, K.; Sun, Z.; Ma, H.; Ma, G. Research on Compressive Strength of Manufactured Sand Concrete Based on Response Surface Methodology. Materials 2024, 17, 195. https://doi.org/10.3390/ma17010195
Gao K, Sun Z, Ma H, Ma G. Research on Compressive Strength of Manufactured Sand Concrete Based on Response Surface Methodology. Materials. 2024; 17(1):195. https://doi.org/10.3390/ma17010195
Chicago/Turabian StyleGao, Kang, Zhenjiao Sun, Hui Ma, and Guanguo Ma. 2024. "Research on Compressive Strength of Manufactured Sand Concrete Based on Response Surface Methodology" Materials 17, no. 1: 195. https://doi.org/10.3390/ma17010195
APA StyleGao, K., Sun, Z., Ma, H., & Ma, G. (2024). Research on Compressive Strength of Manufactured Sand Concrete Based on Response Surface Methodology. Materials, 17(1), 195. https://doi.org/10.3390/ma17010195