
Comparison of Additively Manufactured Polymer-Ceramic Parts Obtained via Different Technologies
 , , , , , , , and
Abstract
:1. Introduction
2. Materials and Methods
2.1. Materials for the Research
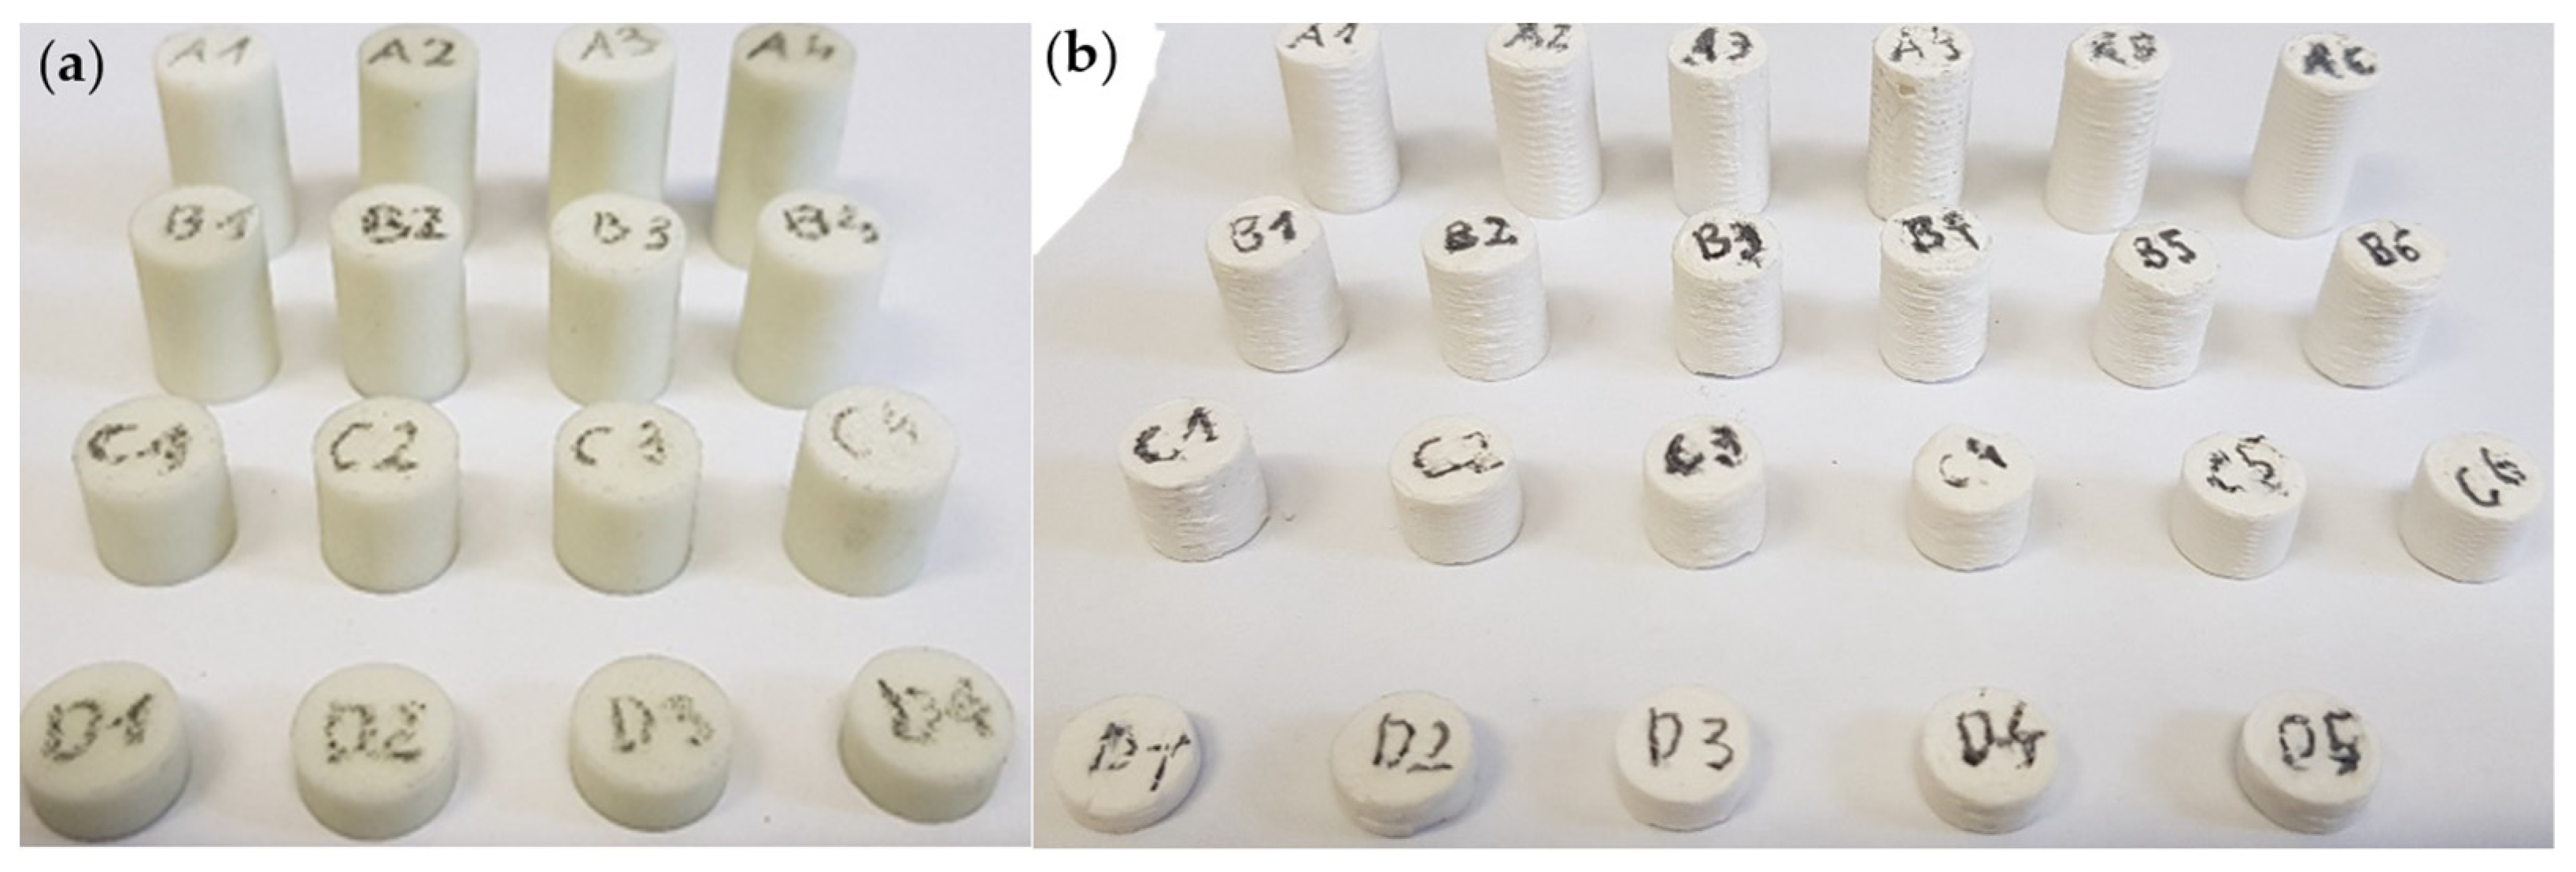
2.2. Manufacturing Process
- Nozzle temperature: 175 °C,
- Layer height: 0.2 mm,
- Nozzle diameter: 0.4 mm,
- Print speed: 5 mm/s,
- Infill density: 100%,
- Number of outer shells: 2.
- Layer thickness: 0.1 mm,
- Resin type: Photopolymer methacrylate resin,
- Laser spot size: 140 μm,
- Exposure time: 15 s,
- Print speed: 50 mm/h.
2.3. Sintering Process
2.4. Testing Methods
- 2θ angle range: 20–100° (for Series 1, 3, and 5); 15–60° (for Series 2 and 4)
- Voltage: 30 kV,
- Current: 15 mA,
- Step size: 0.03°,
- Counting time: 2 s.
3. Results and Discussion
3.1. Density Analysis
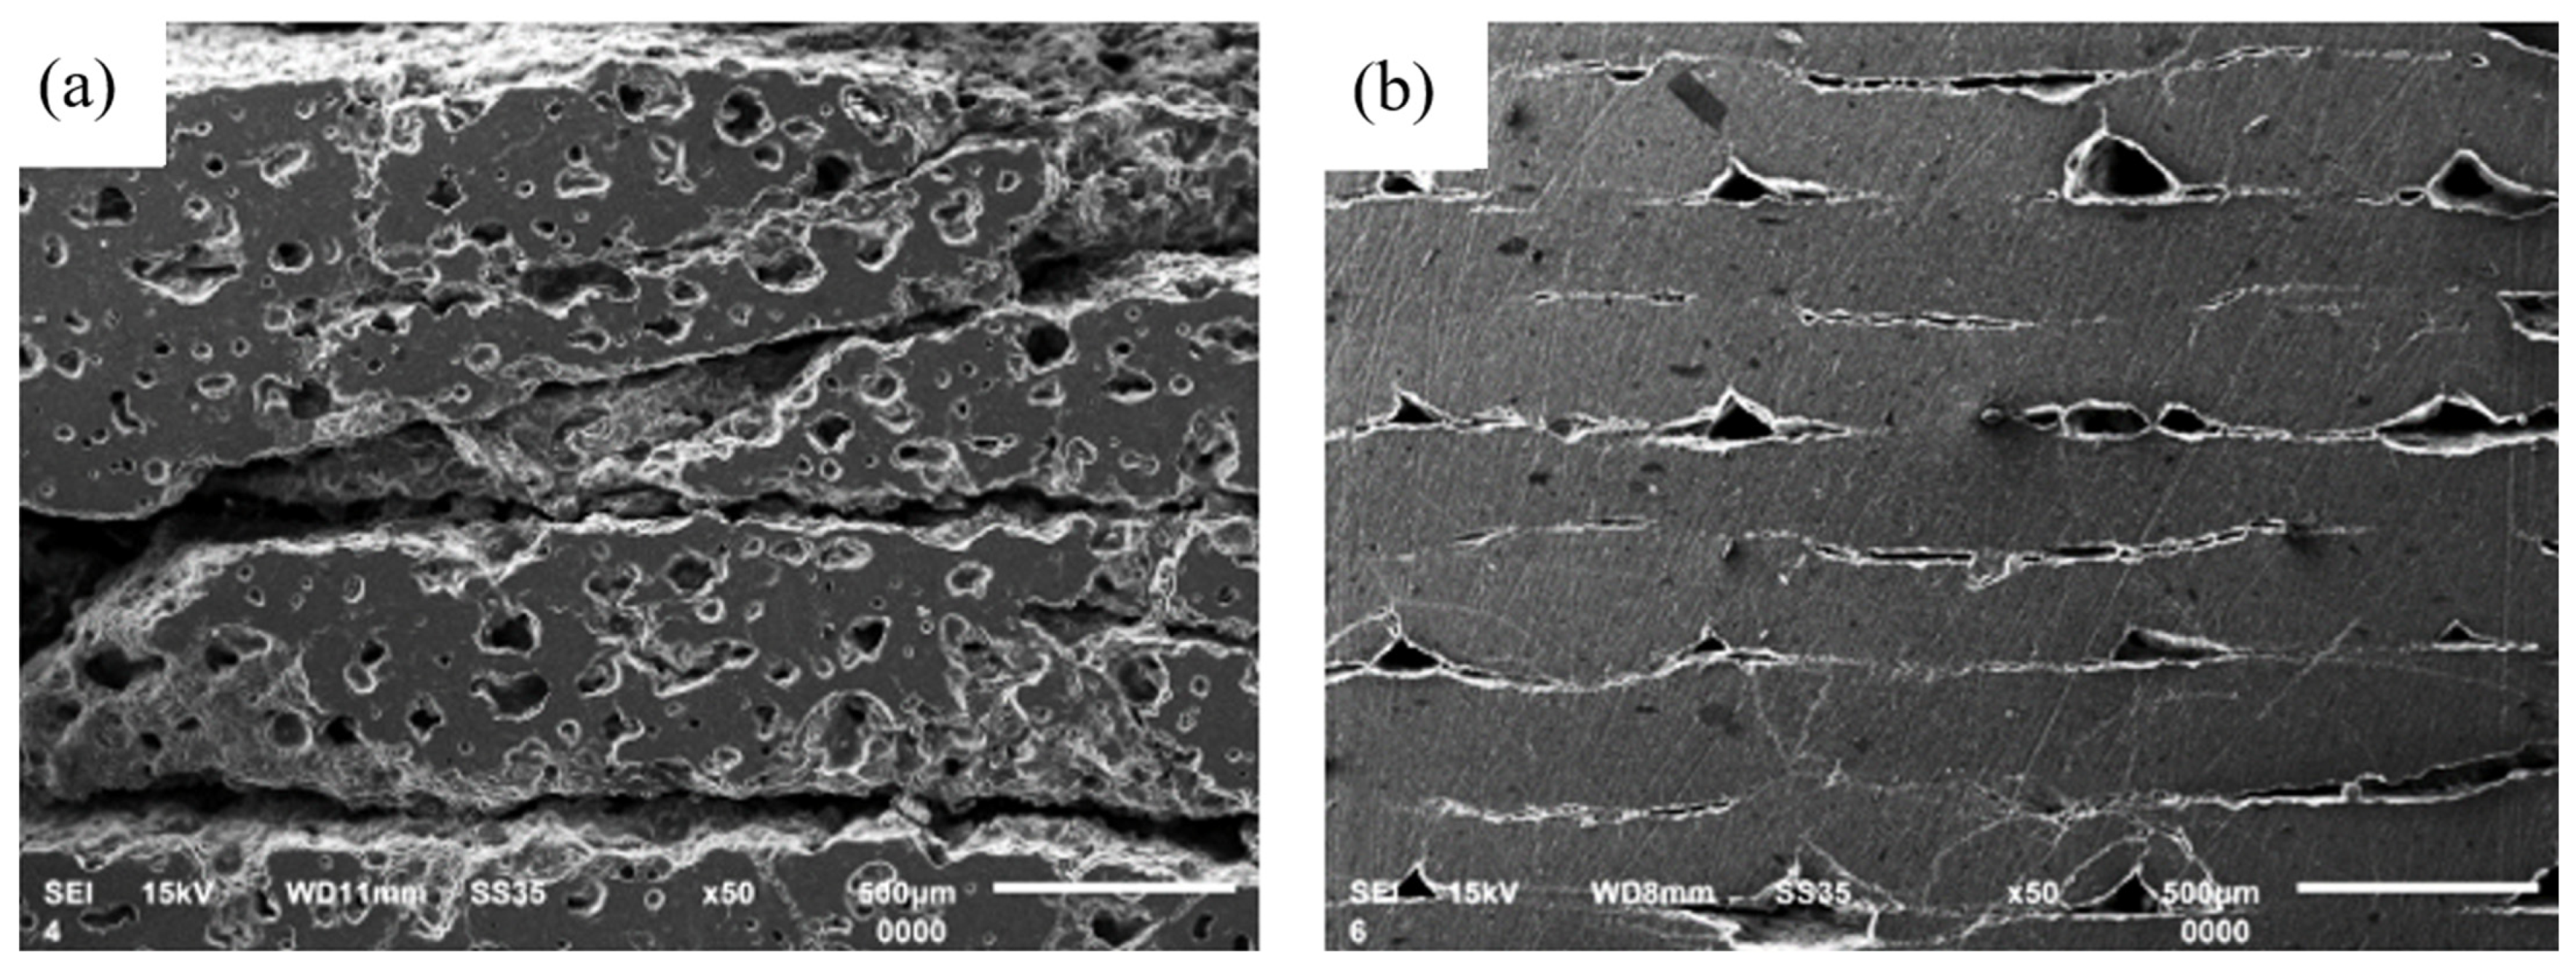
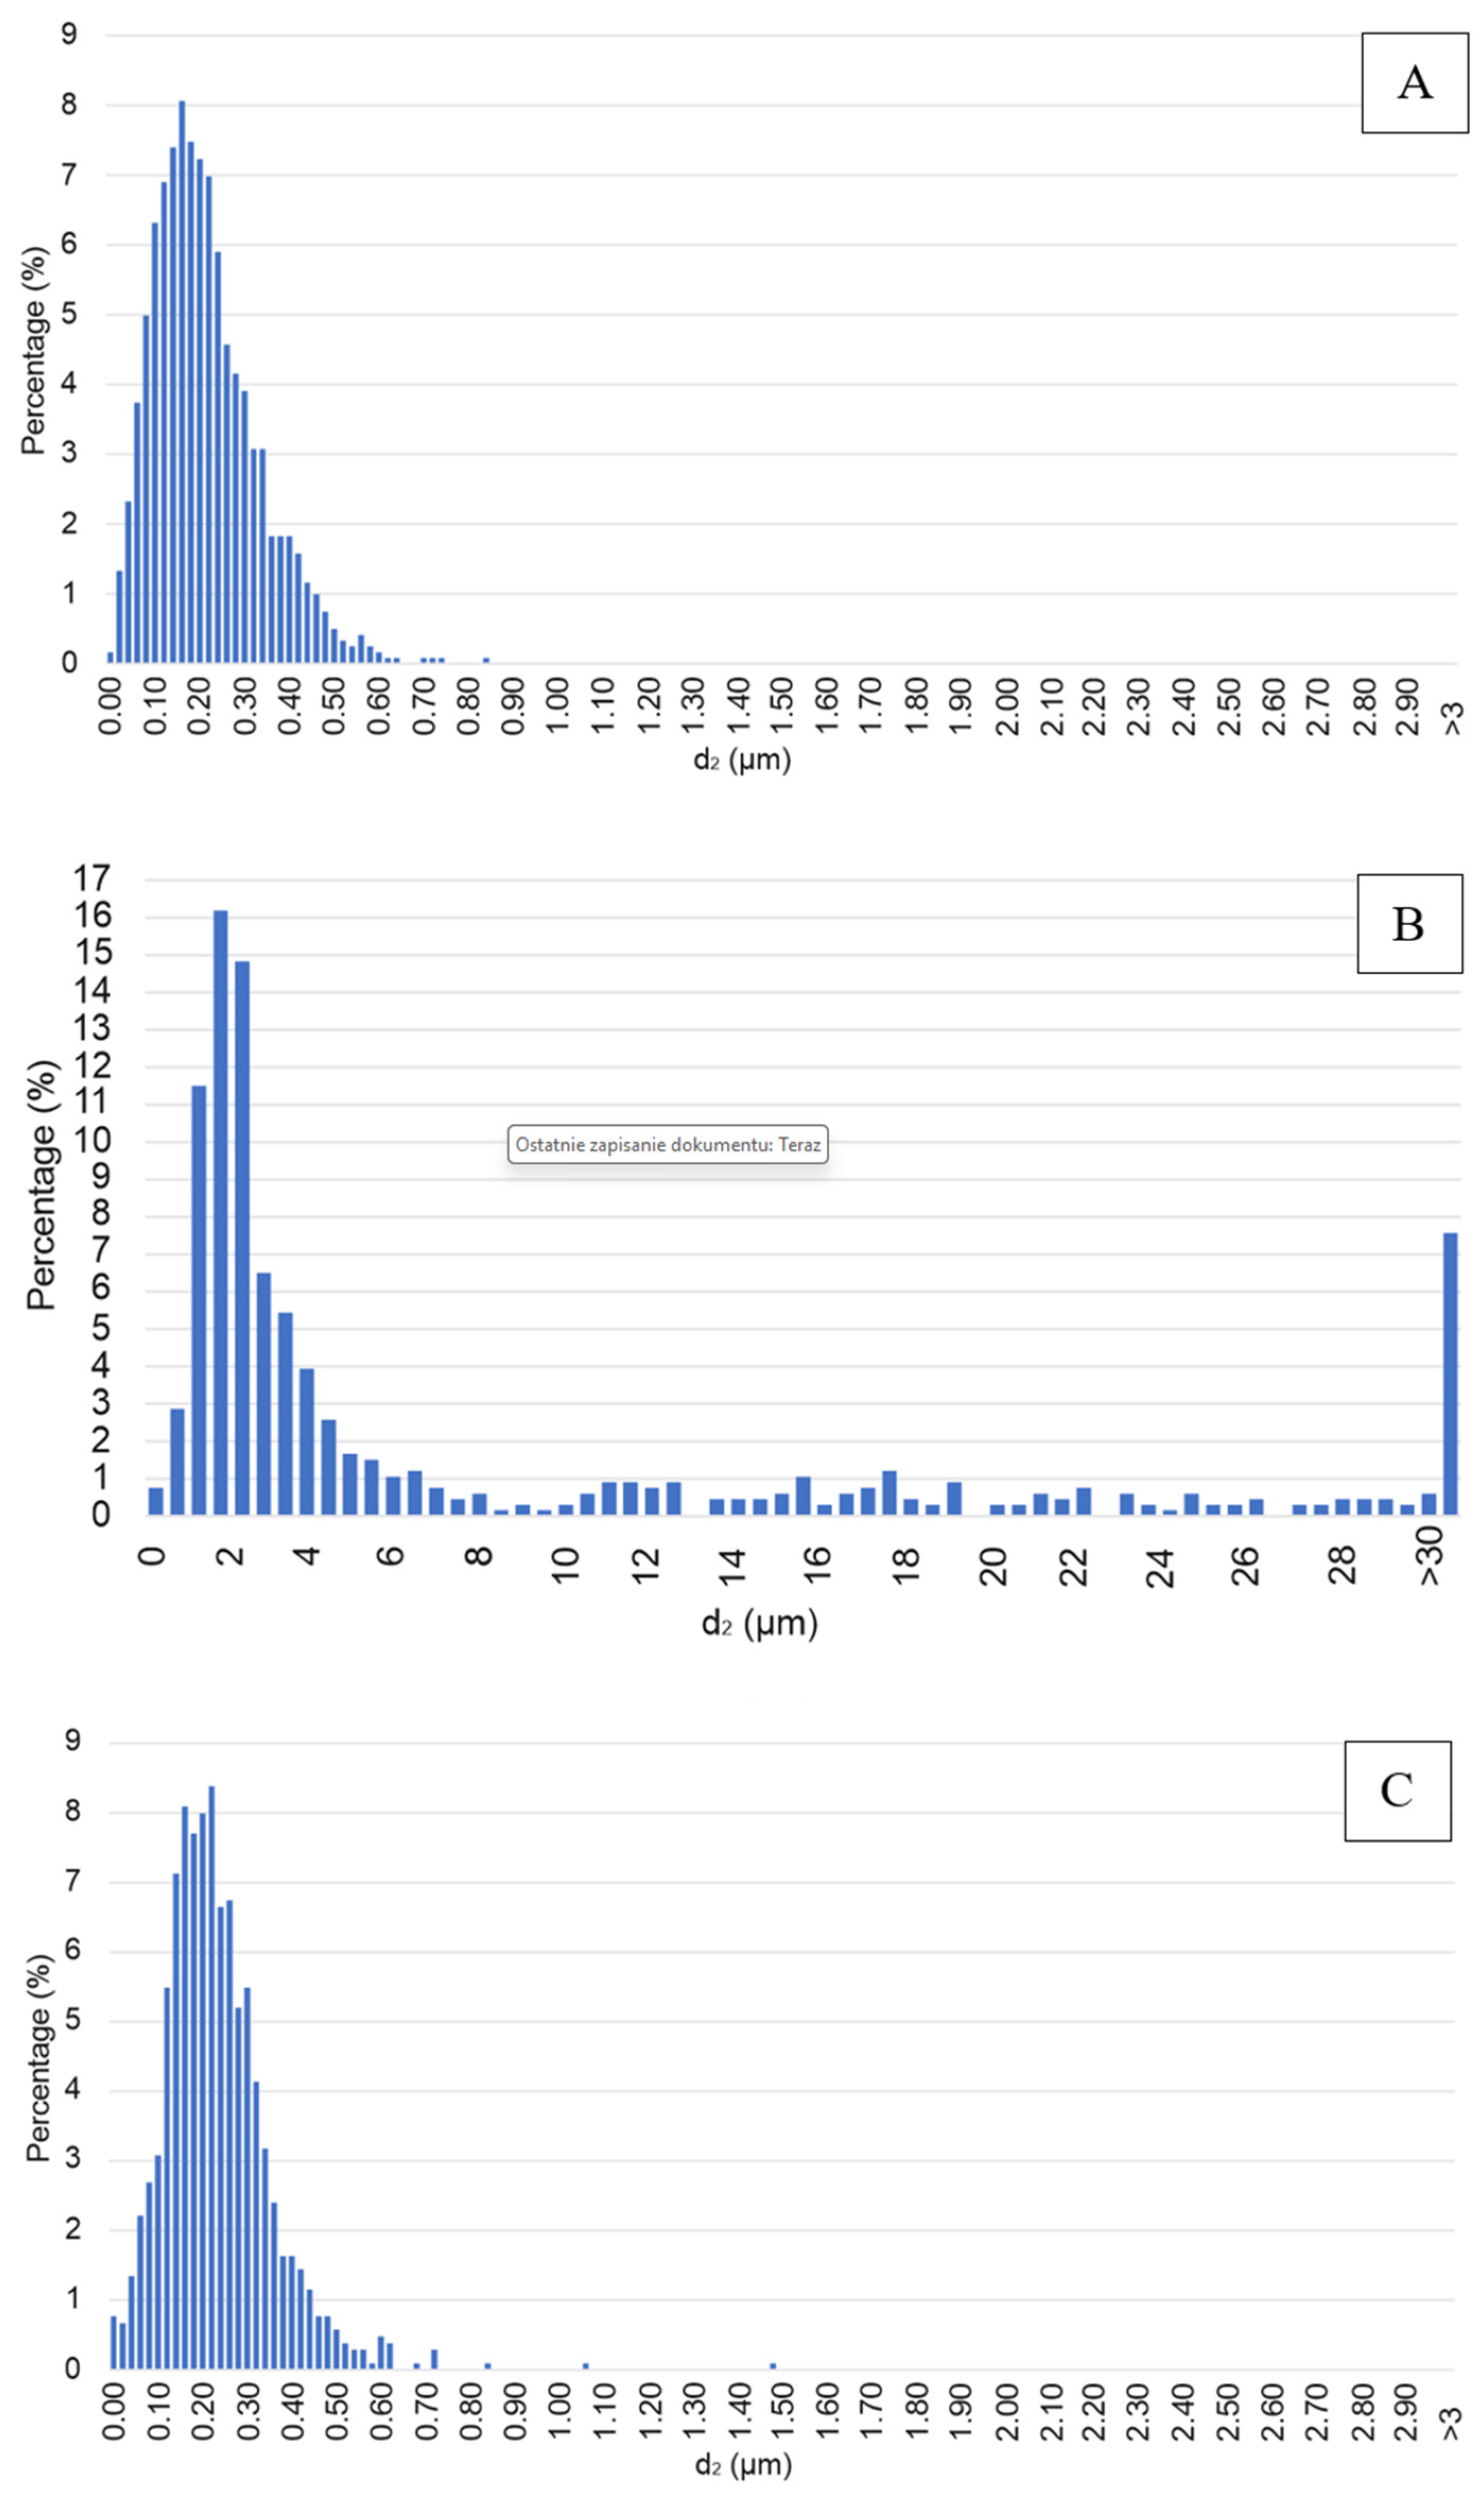
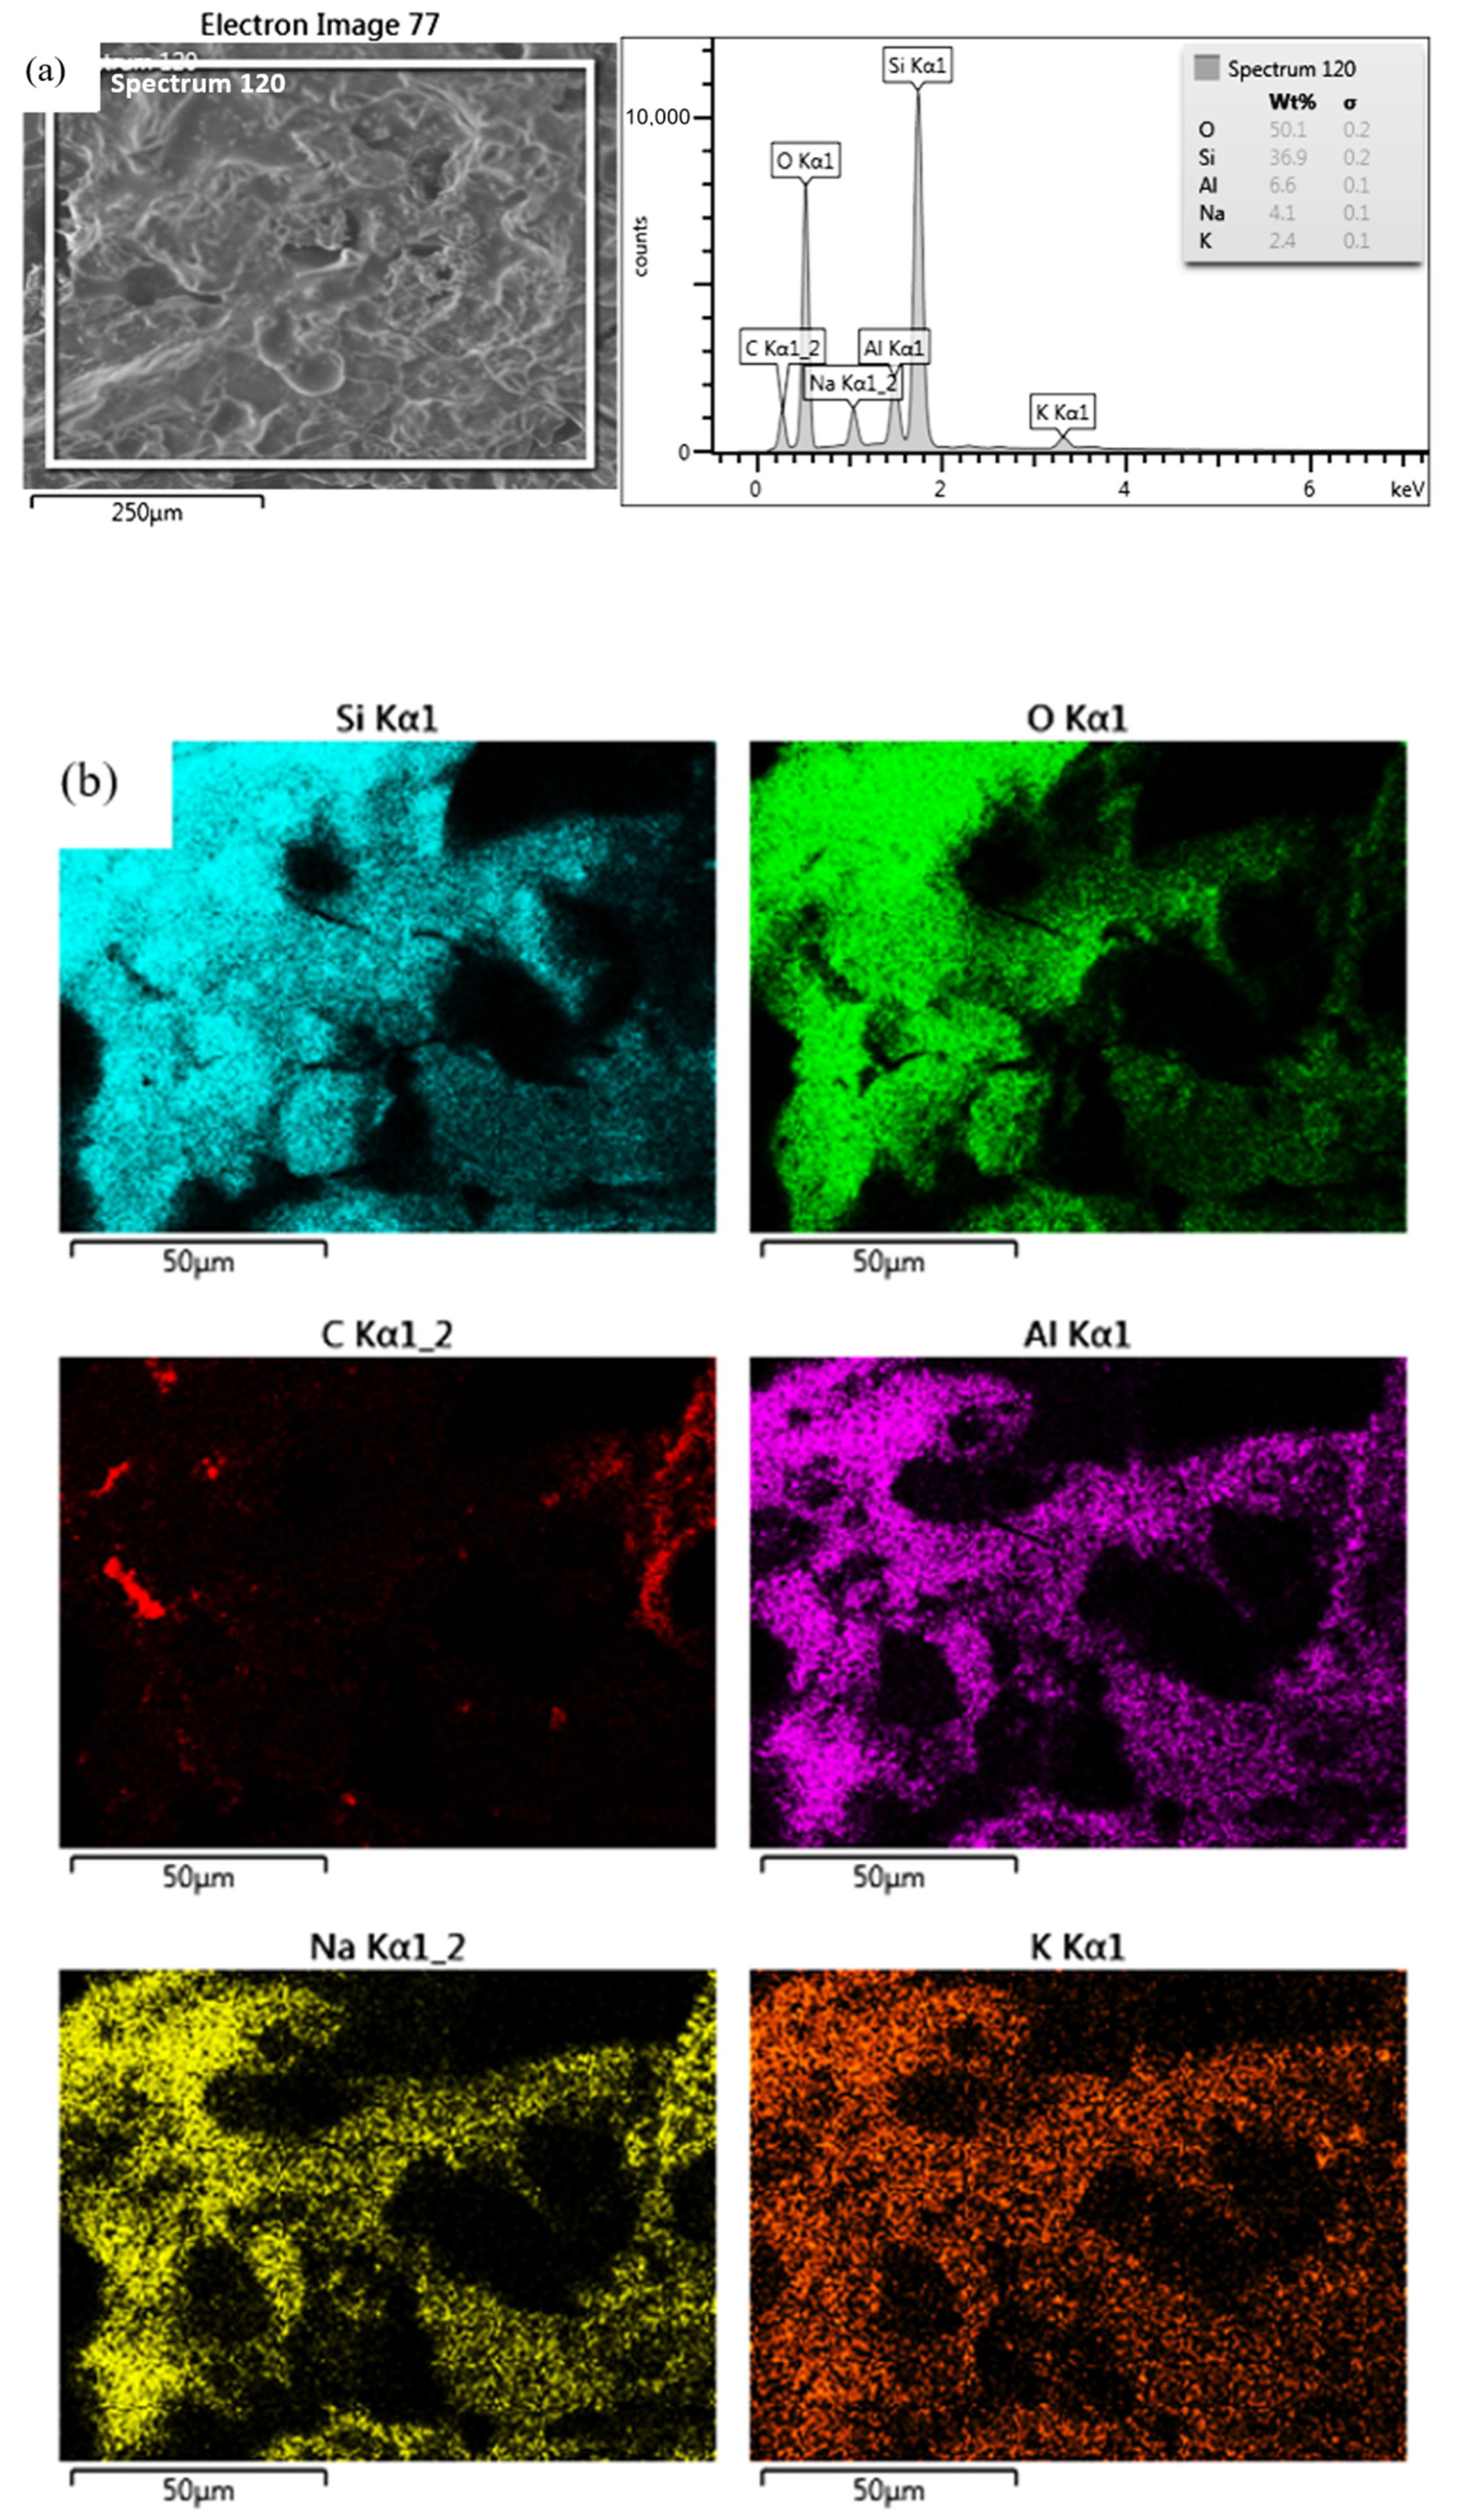
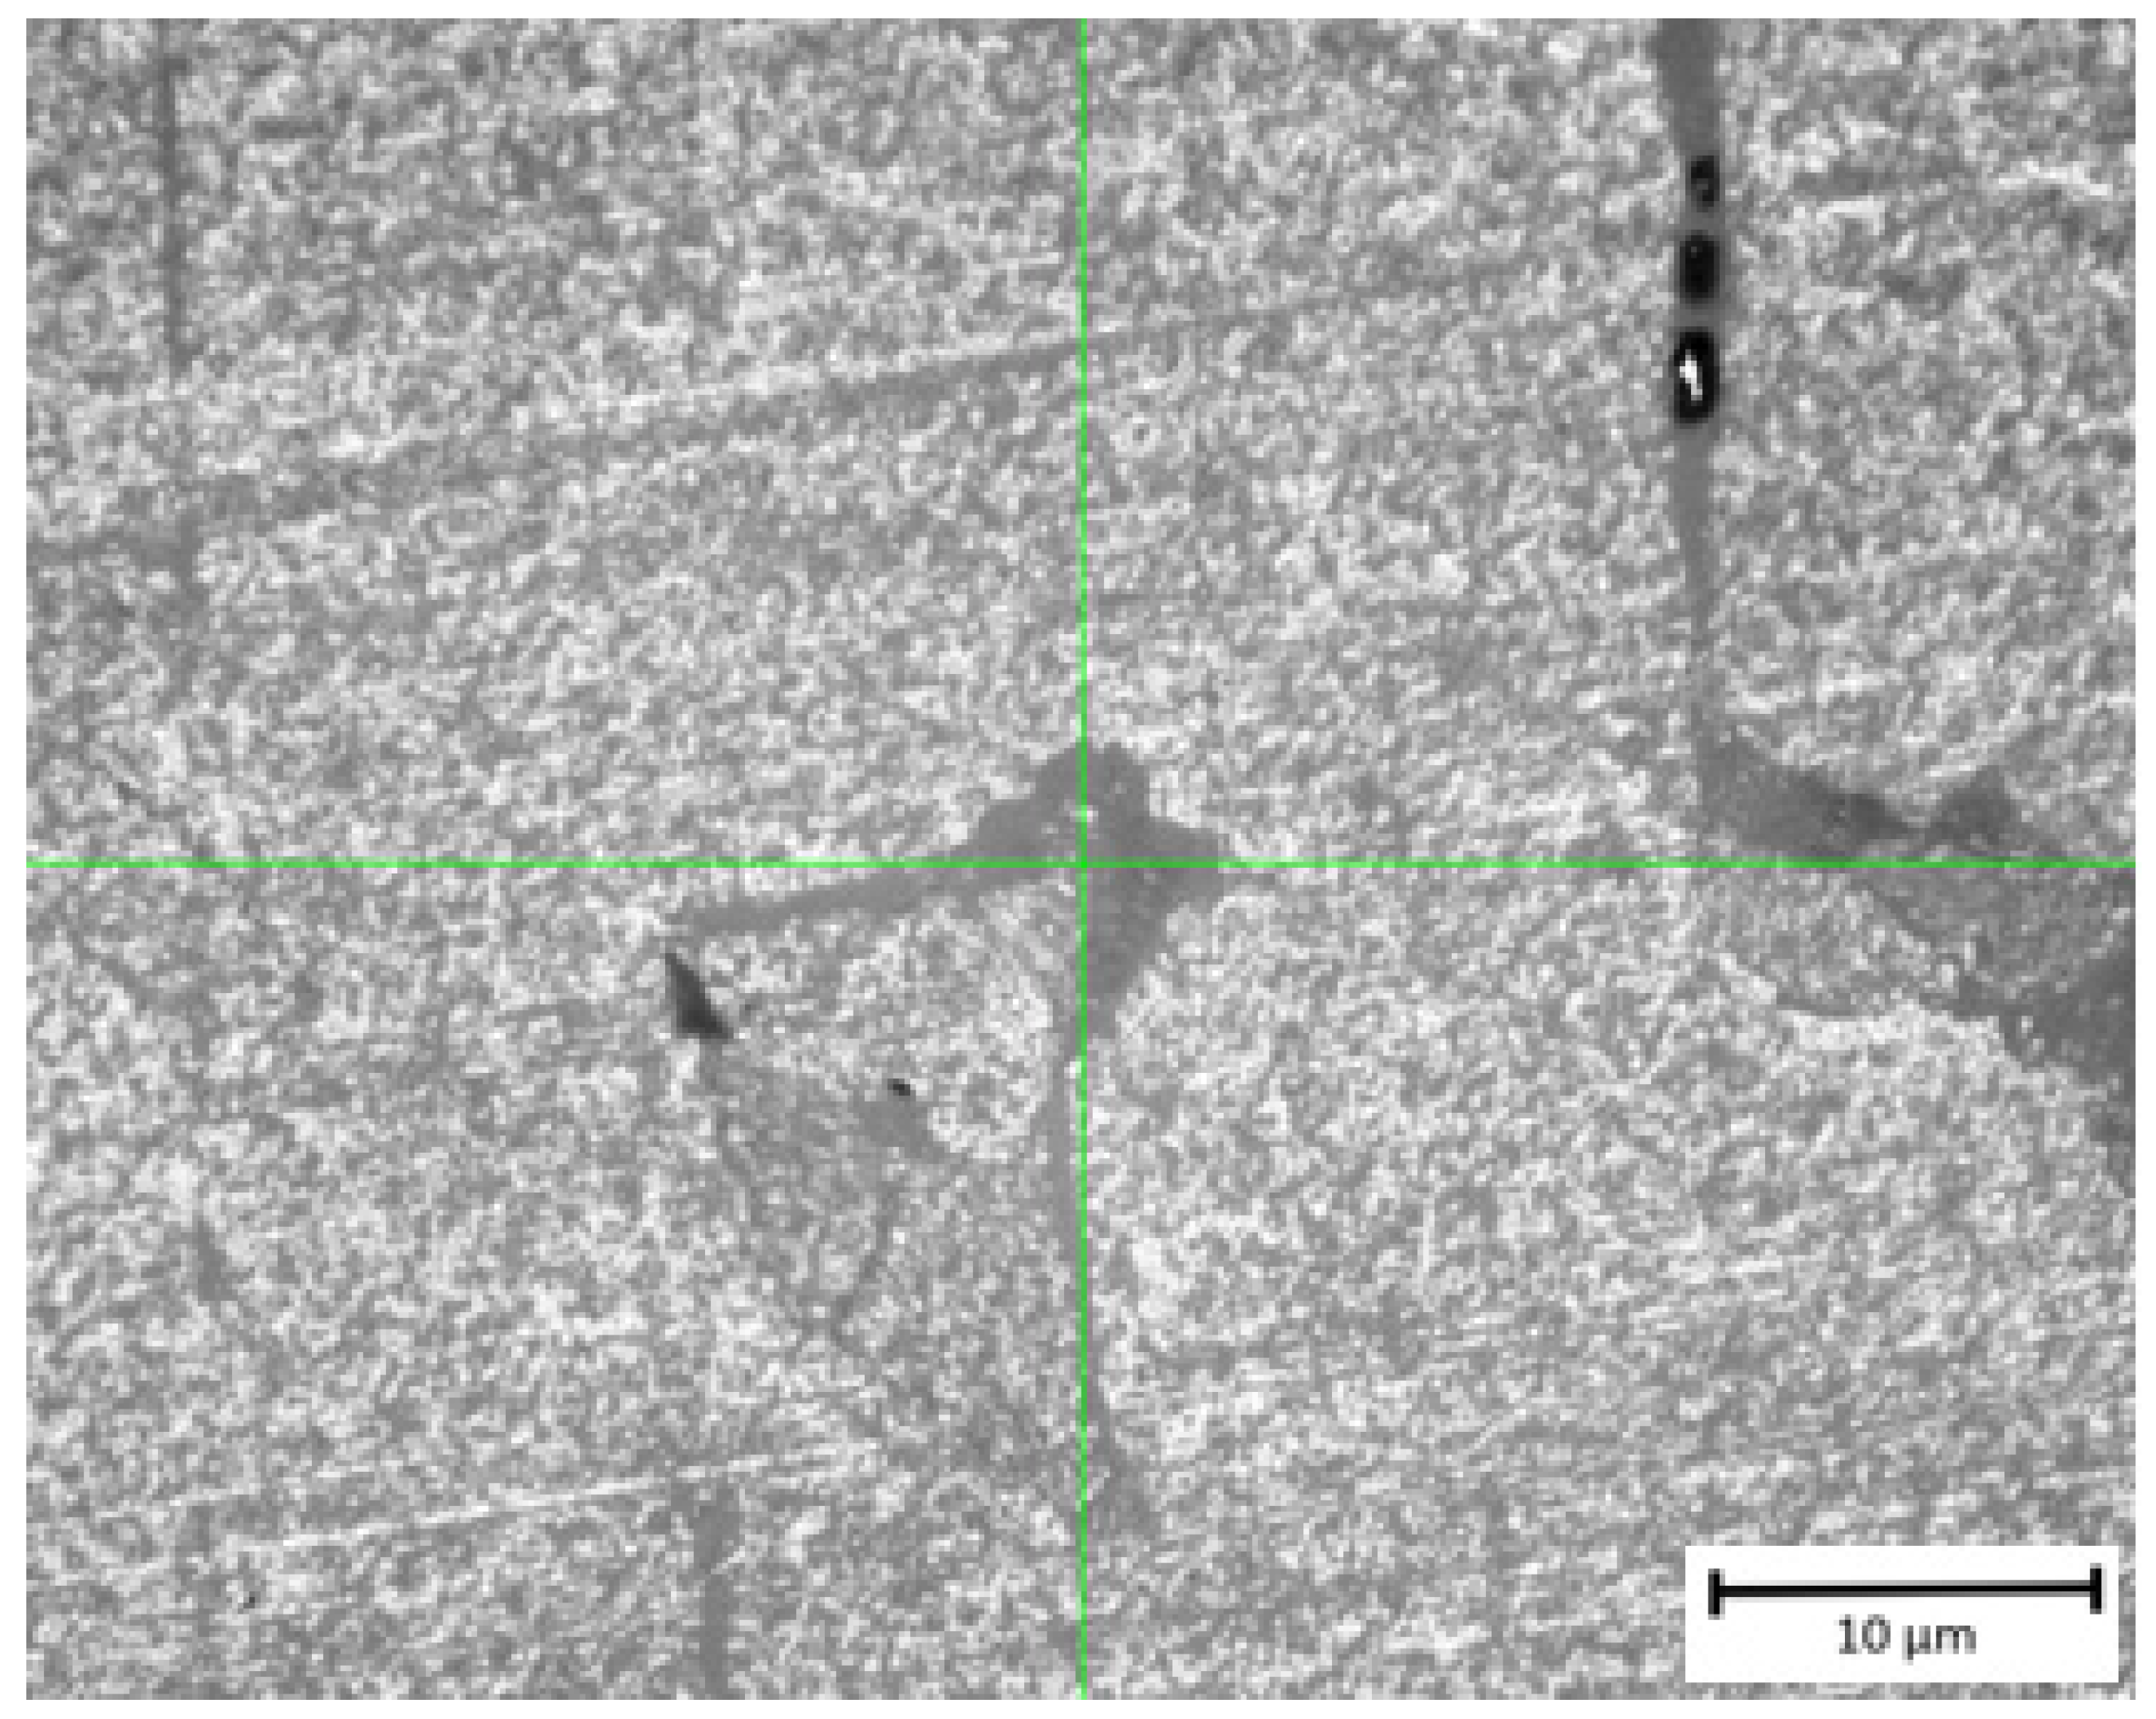
3.2. Microstructural Investigation
3.3. Surface Roughness Analysis
3.4. Hardness Measurement
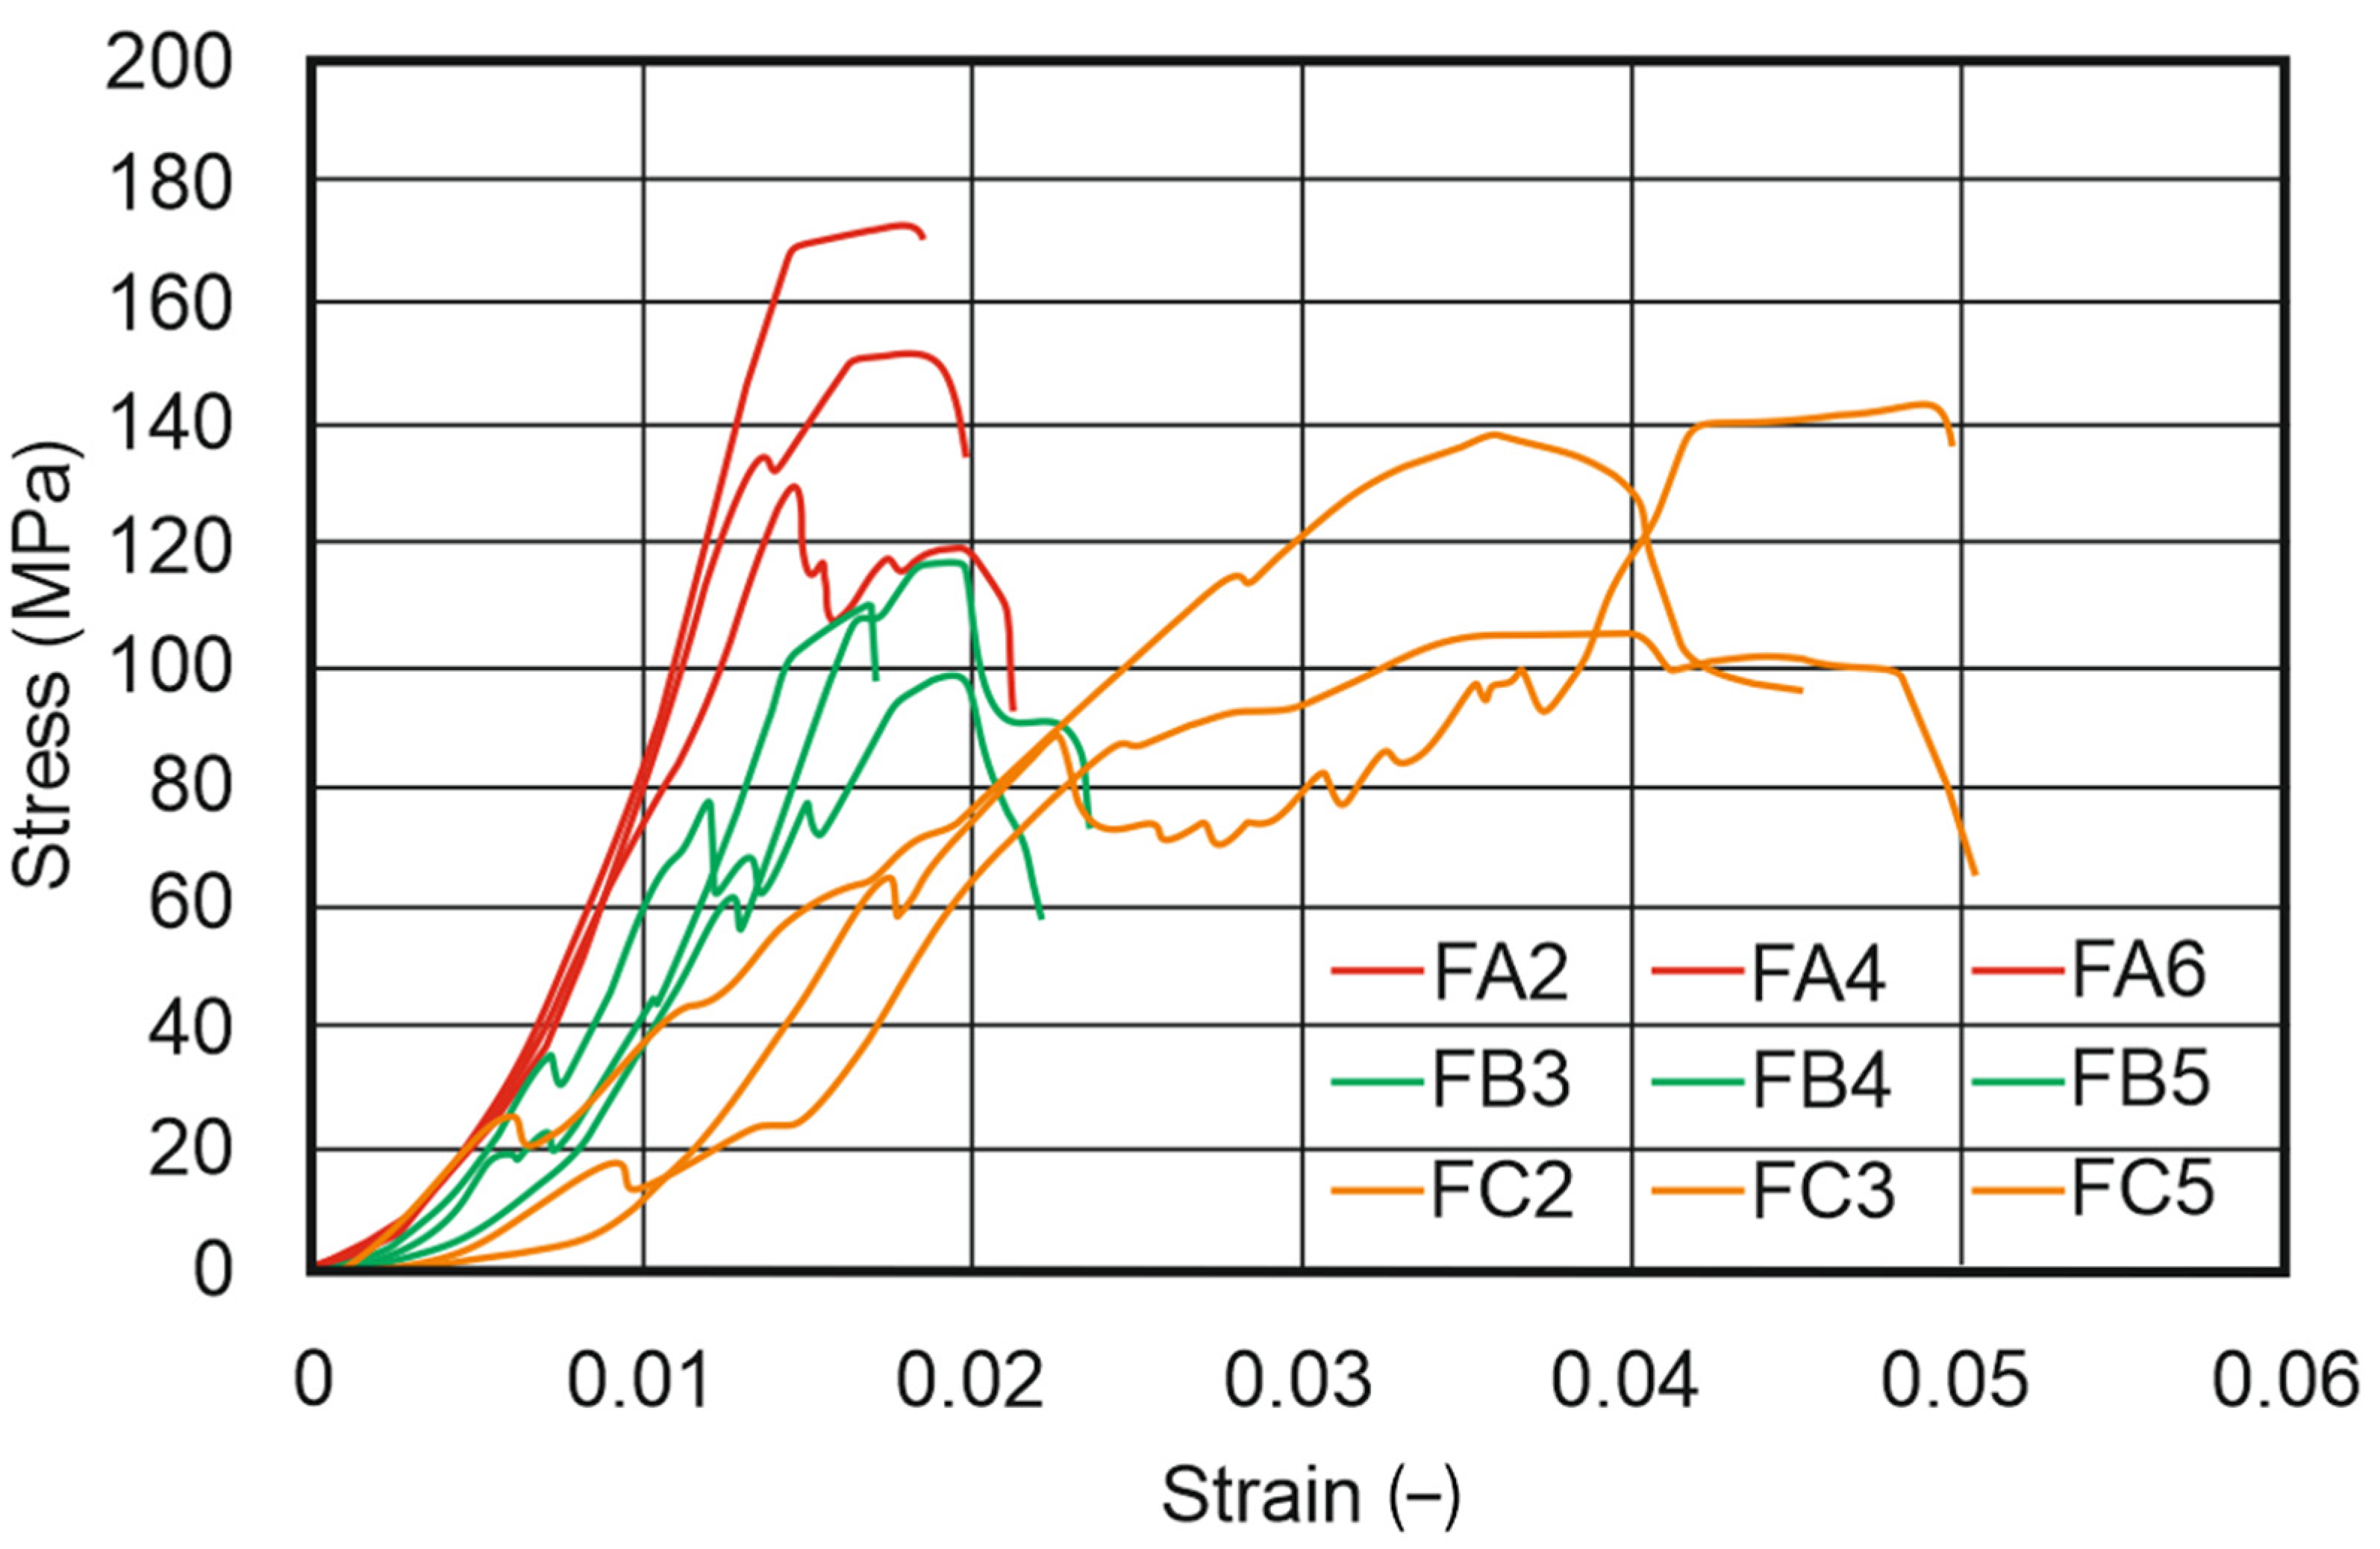
3.5. Compression Test Results
4. Summary
5. Conclusions
- The composites produced using the FDM/FFF technique exhibited similar microstructures before and after heat treatment. The sintering process did not affect the shape of the grains, only their size. Grain size increased with temperature.
- For the SLA manufacturing method, sintering influenced the final microstructure. Specimens after printing displayed irregular grain shapes, but as the temperature increased, the grains fused, forming a solid structure that made it impossible to outline individual grains and measure their size.
- The tested materials exhibited high purity, and sintering did not affect their phase composition. All specimens were single-phase, as confirmed by the results of the diffraction analysis. Minor impurities detected by EDS analysis likely originated from contamination of the furnace.
- Significant shrinkage was not observed in the extracted FDM/FFF specimens, and none of the specimens exceeded the allowable value specified by the manufacturer. The extraction process was successful, enabling further processing without the occurrence of cracks.
- Specimens produced using the SLA technique had significantly higher porosity compared to their FDM/FFF counterparts. Microstructural investigations revealed that, under the same sintering parameters, SLA specimens exhibited much greater porosity than FDM/FFF specimens. The average pore volumes demonstrated that the FDM/FFF-printed specimens had larger voids, but their contribution was not significant enough to affect the final material properties. What is more, porosity decreased with increasing temperature. The porosity of the FDM/FFF specimens was largely dependent on the printing process and parameters such as printing speed and temperature. In the case of the SLA technique, reducing the porosity and improving the functional properties of these elements can be achieved through hot isostatic pressing (HIP).
- With increasing sintering temperature, specimens produced by both methods exhibited significantly higher hardness. However, not all specimens could be subjected to hardness measurements. The FDM/FFF-printed specimens showed the highest hardness, reaching approximately 20 GPa. This value was even greater than the hardness of ceramics produced by conventional methods.
- The FDM/FFF specimens displayed significantly greater roughness compared to those printed using the SLA method. In the case of FDM/FFF, the average roughness decreased with increasing temperature, whereas for SLA, higher sintering temperatures led to increased roughness. In the FDM/FFF technique, higher roughness is inherent to the material formation during manufacturing. This parameter can be reduced by applying finishing processes such as grinding or polishing.
- Compressive strength tests revealed significant brittleness of FDM/FFF specimens in comparison to their SLA-made counterparts. This had a significant effect on the surface quality and stability of compression test curves.
Author Contributions
Funding
Institutional Review Board Statement
Informed Consent Statement
Data Availability Statement
Conflicts of Interest
References
- Bertrand, P.; Bayle, F.; Combe, C.; Goeuriot, P.; Smurov, I. Ceramic components manufacturing by selective laser sintering. Appl. Surf. Sci. 2007, 254, 989–992. [Google Scholar] [CrossRef]
- Xin, J.; Fang, Z.; Yasong, S. Influence of Meso-Scale Material Properties on Macro-Mechanical Behavior of Three-Dimensional Four-Directional Braided Composites under Uniaxial Tensile Load. J. Ceram. Sci. Technol. 2022, 98, 83–98. [Google Scholar] [CrossRef]
- Chen, Q.; Juste, E.; Lasgorceix, M.; Petit, F.; Leriche, A. Binder jetting process with ceramic powders: Influence of powder properties and printing parameters. Open Ceram. 2022, 9, 100218. [Google Scholar] [CrossRef]
- Lu, Z.; Cao, J.; Song, Z.; Li, D.; Lu, B. Research progress of ceramic matrix composite parts based on additive manufacturing technology. Virtual Phys. Prototyp. 2019, 14, 333–348. [Google Scholar] [CrossRef]
- Wang, Z.; Gao, S.; Li, S.; Zhang, W.; Lan, L.; Jiang, Y.; He, B. Research Progress of Laser Addi-tive Manufacturing Nickel-Based Alloy Metal Matrix Composites. Metals 2023, 13, 129. [Google Scholar] [CrossRef]
- Zygmuntowicz, J.; Falkowski, P.; Wachowski, M.; Miazga, A.; Piotrkiewicz, P.; Kaszuwara, W. Microstructure and mechanical properties of Al2O3-Cu-Ni hybrid composites fabricated by slip casting. Process. Appl. Ceram. 2020, 14, 1–8. [Google Scholar] [CrossRef]
- Luh, Y.P.; Chin, C.C.; Iao, H.W. Automated Design of Honeycomb Conformal Cooling Channels for Improving Injection Molding Quality. Prod. Eng. Arch. 2023, 29, 44–57. [Google Scholar] [CrossRef]
- Kandananond, K.; Gustowski, T.; Kurek, W.; Grzejda, R.; Luh, Y.P.; Chin, C.C.; Iao, H.W.; Radek, N. Properties of WC-Co coatings with Al2O3 addition. Prod. Eng. Arch. 2023, 29, 7–13. [Google Scholar] [CrossRef]
- Wachowski, M.; Zygmuntowicz, J.; Kosturek, R.; Śnieżek, L.; Piotrkiewicz, P. Properties of Al2O3/Ti/Ni Composite Obtained by Slip Casting with Different Metal Phase Content. Materials 2022, 15, 6514. [Google Scholar] [CrossRef]
- Johnson, O.T.; Rokebrand, P.; Sigalas, I. Microstructure and Properties of Al2O3–SiC nanomaterials. Proc. World Congr. Eng. 2014, 2, 3–6. [Google Scholar]
- Piotrkiewicz, P.; Zygmuntowicz, J.; Miazga, A.; Wachowski, M. The Al2O3-Cu-Cr composites—Microstructure and selected properties. In Proceedings of the 13th Conference for Young Scientists in Ceramics, CYSC 2019, Novi Sad, Serbia, 13–16 October 2019; pp. 124–125. [Google Scholar]
- Dufaud, O.; Corbel, S. Stereolithography of PZT ceramic suspensions. Rapid Prototyp. J. 2002, 8, 83–90. [Google Scholar] [CrossRef]
- Manière, C.; Kerbart, G.; Harnois, C.; Marinel, S. Modeling sintering anisotropy in ceramic stereolithography of silica. Acta Mater. 2020, 182, 163–171. [Google Scholar] [CrossRef]
- Bove, A.; Calignano, F.; Galati, M.; Iuliano, L. Photopolymerization of Ceramic Resins by Stereolithography Process: A Review. Appl. Sci. 2022, 12, 3591. [Google Scholar] [CrossRef]
- Hinczewski, C.; Corbel, S.; Chartier, T. Ceramic suspensions suitable for stereolithography. J. Eur. Ceram. Soc. 1998, 18, 583–590. [Google Scholar] [CrossRef]
- Tsetsekou, A.; Agrafiotis, C.; Leon, I.; Milias, A. Optimization of the rheological properties of alumina slurries for ceramic processing applications Part II: Spray-drying. J. Eur. Ceram. Soc. 2001, 21, 493–506. [Google Scholar] [CrossRef]
- Brady, G.A.; Halloran, J.W. Differential photo-calorimetry of photopolymerizable ceramic suspension. J. Mater. Sci. 1998, 33, 4551–4560. [Google Scholar] [CrossRef]
- Chartier, T.; Chaput, C.; Doreau, F.; Loiseau, M. Stereolithography of structural complex ceramic parts. J. Mater. Sci. 2002, 37, 3141–3147. [Google Scholar] [CrossRef]
- Jang, K.J.; Kang, J.H.; Fisher, J.G.; Park, S.W. Effect of the volume fraction of zirconia suspensions on the microstructure and physical properties of products produced by additive manufacturing. Dent. Mater. 2019, 35, e97–e106. [Google Scholar] [CrossRef]
- Nötzel, D.; Eickhoff, R.; Pfeifer, C.; Hanemann, T. Printing of zirconia parts via fused filament fabrication. Materials 2021, 14, 5467. [Google Scholar] [CrossRef]
- Gao, Y.; Ding, J. Low solid loading; low viscosity, high uniform shrinkage ceramic resin for stereolithography based additive manufacturing. Procedia Manuf. 2020, 48, 749–754. [Google Scholar] [CrossRef]
- Esteves, A.V.M.; Martins, M.I.; Soares, P.; Rodrigues, M.A.; Lopes, M.A.; Santos, J.D. Additive manufacturing of ceramic alumina/calcium phosphate structures by DLP 3D printing. Mater. Chem. Phys. 2022, 276, 125417. [Google Scholar] [CrossRef]
- Tan, K.H.; Chua, C.K.; Leong, K.F.; Cheah, C.M.; Cheang, P.; Bakar, M.S.A.; Cha, S.W. Scaffold development using selective laser sintering of polyetheretherketone-hydroxyapatite biocomposite blends. Biomaterials 2003, 24, 3115–3123. [Google Scholar] [CrossRef] [PubMed]
- Gao, C.; Yang, B.; Hu, H.; Liu, J.; Shuai, C.; Peng, S. Enhanced sintering ability of biphasic calcium phosphate by polymers used for bone scaffold fabrication. Mater. Sci. Eng. C 2013, 33, 3802–3810. [Google Scholar] [CrossRef] [PubMed]
- Clare, A.T.; Chalker, P.R.; Davies, S.; Sutcliffe, C.J.; Tsopanos, S. Selective laser sintering of barium titanate-polymer composite films. J. Mater. Sci. 2008, 43, 3197–3202. [Google Scholar] [CrossRef]
- Shuai, C.; Yang, B.; Peng, S.; Li, Z. Development of composite porous scaffolds based on poly(lactide-co- glycolide)/nano-hydroxyapatite via selective laser sintering. Int. J. Adv. Manuf. Technol. 2013, 69, 51–57. [Google Scholar] [CrossRef]
- Liu, J.; Zhang, B.; Yan, C.; Shi, Y. The effect of processing parameters on characteristics of selective laser sintering dental glass-ceramic powder. Rapid Prototyp. J. 2010, 16, 138–145. [Google Scholar] [CrossRef]
- Zhu, L.; Wang, S.; Pan, H.; Yuan, C.; Chen, X. Research on remanufacturing strategy for 45 steel gear using H13 steel powder based on laser cladding technology. J. Manuf. Process. 2020, 49, 344–354. [Google Scholar] [CrossRef]
- Delgado, J.; Ciurana, J.; Rodríguez, C.A. Influence of process parameters on part quality and mechanical properties for DMLS and SLM with iron-based materials. Int. J. Adv. Manuf. Technol. 2012, 60, 601–610. [Google Scholar] [CrossRef]
- Tang, H.H. Direct laser fusing to form ceramic parts. Rapid Prototyp. J. 2002, 8, 284–289. [Google Scholar] [CrossRef]
- Ma, J.; Li, J.; Tang, R.Y.; Li, W.Z.; Chen, Q.Y. Effects of porous Al2O3/SiO2 on hydrogen storage capacities of NaAlH4-Tm2O3 system. Zhongguo Youse Jinshu Xuebao/Chin. J. Nonferrous Met. 2012, 22, 1659–1666. [Google Scholar]
- Chen, Z.; Li, Z.; Li, J.; Liu, C.; Lao, C.; Fu, Y.; Liu, C.; Li, Y.; Wang, P.; He, Y. 3D printing of ceramics: A review. J. Eur. Ceram. Soc. 2019, 39, 661–687. [Google Scholar] [CrossRef]
- Shahzad, K.; Deckers, J.; Kruth, J.P.; Vleugels, J. Additive manufacturing of alumina parts by indirect selective laser sintering and post processing. J. Mater. Process. Technol. 2013, 213, 1484–1494. [Google Scholar] [CrossRef]
- Deckers, J.P.; Shahzad, K.; Cardon, L.; Rombouts, M.; Vleugels, J.; Kruth, J.P. Shaping ceram-ics through indirect selective laser sintering. Rapid Prototyp. J. 2016, 22, 544–558. [Google Scholar] [CrossRef]
- Grossin, D.; Montón, A.; Navarrete-Segado, P.; Özmen, E.; Urruth, G.; Maury, F.; Maury, D.; Frances, C.; Tourbin, M.; Lenormand, P.; et al. A review of additive manufacturing of ce-ramics by powder bed selective laser processing (sintering / melting): Calcium phosphate, silicon carbide, zirconia, alumina, and their composites. Open Ceram. 2021, 5, 100073. [Google Scholar] [CrossRef]
- Shishkovsky, I.; Yadroitsev, I.; Bertrand, P.; Smurov, I. Alumina-zirconium ceramics synthesis by selective laser sintering/melting. Appl. Surf. Sci. 2007, 254, 966–970. [Google Scholar] [CrossRef]
- Kandananond, K. Surface Roughness Reduction in A Fused Filament Fabrication (FFF) Process using Central Composite Design Method. Prod. Eng. Arch. 2022, 28, 157–163. [Google Scholar] [CrossRef]
- Zheng, L.; Yang, F.; Shen, H.; Hu, X.; Mochizuki, C.; Sato, M.; Wang, S.; Zhang, Y. The effect of composition of calcium phosphate composite scaffolds on the formation of tooth tissue from human dental pulp stem cells. Biomaterials 2011, 32, 7053–7059. [Google Scholar] [CrossRef]
- Li, W.; Ghazanfari, A.; Leu, M.C.; Landers, R.G. Extrusion-on-demand methods for high solids loading ceramic paste in freeform extrusion fabrication. Virtual Phys. Prototyp. 2017, 12, 193–205. [Google Scholar] [CrossRef]
- Eliaz, N. Corrosion of metallic biomaterials: A review. Materials 2019, 12, 407. [Google Scholar] [CrossRef]
- Sistiaga, M.L.M.; Nardone, S.; Hautfenne, C.; van Humbeeck, J. Effect of heat treatment of 316 L stainless steel produced by selective laser melting (SLM). In Proceedings of the Solid Freeform Fabrication 2016: Proceedings of the 27th Annual International Solid Freeform Fabrication Symposium—An Additive Manufacturing Conference, SFF 2016, The University of Texas at Austin, Austin, TX, USA, 8–10 August 2016; pp. 558–565. [Google Scholar]
- Anitha, R.; Arunachalam, S.; Radhakrishnan, P. Critical parameters influencing the quality of prototypes in fused deposition modelling. J. Mater. Process. Technol. 2001, 118, 385–388. [Google Scholar] [CrossRef]
- Available online: https://top-seiko.com/pl/works/material-cat/ceramics/alumina/ (accessed on 3 May 2023).
- Available online: https://zadar.pl/filament-ceramiczny-spectrum-175mm-tlenek-glinu-al2o3-1kg (accessed on 3 May 2023).
- Available online: https://formlabs.com/materials/ceramics/ (accessed on 3 May 2023).
- EN 843-4:2005; Advanced Technical Ceramics—Mechanical Properties of Monolithic Ceramics at Room Temperature—Part 4: Vickers, Knoop and Rockwell superficial hardness. CEN: Brussels, Belgium, 2005.
- Michalski, J.; Wejrzanowski, T.; Pielaszek, R.; Konopka, K.; Łojkowski, W.; Kurzydłowski, K.J. Application of image analysis for characterization of powders. Mater. Sci. 2005, 23, 79–86. [Google Scholar]
- Wejrzanowski, T.; Spychalski, W.L.; Rózniatowski, K.; Kurzydłowski, K.J. Image based analysis of complex microstructures of engineering materials. Int. J. Appl. Math. Comput. Sci. 2008, 18, 33–39. [Google Scholar] [CrossRef]
- Bordia, R.K.; Kang, S.J.L.; Olevsky, E.A. Current understanding and future research directions at the onset of the next century of sintering science and technology. J. Am. Ceram. Soc. 2017, 100, 2314–2352. [Google Scholar] [CrossRef]
- Hur, H.; Park, Y.J.; Kim, D.H.; Ko, J.W. Material extrusion for ceramic additive manufacturing with polymer-free ceramic precursor binder. Mater. Des. 2022, 221, 110930. [Google Scholar] [CrossRef]
- Prakapenka, V.P.; Shen, G.; Dubrovinsky, L.S.; Rivers, M.L.; Sutton, S.R. High pressure in-duced phase transformation of SiO2 and GeO2: Difference and similarity. J. Phys. Chem. Solids 2004, 65, 1537–1545. [Google Scholar] [CrossRef]
- Wu, S.; Yang, L.; Wang, C.; Yan, C.; Shi, Y. Si/SiC ceramic lattices with a triply periodic minimal surface structure prepared by laser powder bed fusion. Addit. Manuf. 2022, 56, 102910. [Google Scholar] [CrossRef]
- Moritz, T.; Maleksaeedi, S. Additive manufacturing of ceramic components. Addit. Manuf. Mater. Process. Quantif. Appl. 2018, 11, 105–161. [Google Scholar] [CrossRef]


| Authors | Used AM Technology | Short Description of the Research |
|---|---|---|
| Manière et al. [13] | SLA | A description of anisotropic shrinkage reduction by using post-processing with the use of light-curable resins in the sintering process. Formulation of the relationship between the composition of the ceramic resin and the complexity of the final processing. Ceramic resins used in SLA technology require several components to achieve the desired rheological properties. |
| Bove et al. [14] | SLA | Description of the selection process of an appropriate solvent or dispersant and its influence on the dimensional accuracy and mechanical properties. Employment of various accompanying process parameters in SLA manufacturing (such as resin mixing or drying the printed object). The initial preparatory phase should involve powder drying at a variable temperature of 120 to 200 °C for 6–10 h to remove any remaining moisture. |
| C. Hinczewski et al. [15], A. Tsetsekou et al. [16], G.A. Brady et al. [17], T. Chartier et al. [18], K.J. Jang et al. [19] | SLA | Development of correct proportions of each component of the ceramic resin, including photoinitiators, solvents, dispersants, and ceramic powders. In research works [15,18,19], the authors described additional methods for preparing ceramic suspensions for SLA technology. |
| D. Nötzel et al. [20] | DLP | Using digital light processing (DLP) for production with the use of zirconium oxide and aluminum oxide with a high density of approximately 97–99% and hardness values of 13.1 and 17.5 GPa, respectively, comparable to counterparts obtained using conventional methods. |
| Y. Gao et al. [21] | DLP | Obtaining ceramic structures with very good properties made of aluminum oxide and bioactive glass during the DLP process. Such a material combination allowed for achieving a relative density above 90% and mechanical strength comparable to conventionally processed specimens. |
| Esteves et al. [22] | DLP | Fabrication of 3D ceramic biocomponents with interconnected micro- and macrostructures using DLP from a suspension composed of aluminum oxide powders and hydroxyapatite, which was added to the aluminum oxide to enhance its bioactivity. |
| K.H. Tan et al. [23], C. Gao et al. [24], A.T. Clare et al. [25], C. Shuai et al. [26], J. Liu et al. [27], L. Zhu et al. [28], J. Delgado et al. [29], H.H. Tang [30], J. Ma et al. [31] | SLS | Development of additional binders with lower melting temperatures, which are either coated onto or mixed with the base material. This approach allows the laser beam to heat the surface of the powder bed, causing the binders to melt and creating a glassy binding phase for the ceramic particles. The binder can be organic, such as polymers [23,24,25,26], or inorganic, such as low-melting materials based on glass and metals [27,28,29,30,31]. |
| Z. Chen et al. [32] | SLS | Using additional post-processing, which involves high-temperature sintering, evaporated the binder, resulting in ceramic elements. Structural ceramics were almost fully densified to achieve optimal mechanical properties and improve their porosity. The initial attempts to produce 3D ceramic components using the SLS technology were conducted for mixed powder systems based on Al2O3. To decrease the melting point of aluminum oxide, a low-temperature binder was added to the powder in the form of secondary particles of ammonium phosphate NH4H2PO4 (190 °C) and boron oxide B2O3 (460 °C). As a result, 3D ceramic parts with good accuracies were successfully produced. |
| Shahzad et al. [33] | SLS | An AM of aluminum oxide (Al2O3) with additional post-processing in the form of hot isostatic pressing (HIP). By employing a suitable laser exposure strategy during the SLS process, densities of up to 62% at the maximum level were achieved. However, the final density after binder removal and sintering in a furnace increased only 51% of the theoretical density. On the other hand, the use of HIP allowed densities to reach 63–64%. |
| Deckers et al. [34] | SLS | Combination of SLS with HIP and infiltration as techniques to increase the density of Al2O3 ceramics. After the final processing, the volume increased from 34% to 83%, and the final density increased from 63% to 88%. |
| Grossin et al. [35] | SLS | Achieving higher densities in parts by optimizing the particle packing in the powder bed. Two primary factors contributing to powder bed spreading are the flowability and packing density of the powder particles. To control these factors, spherical and densely packed powder particles should be employed. The use of particles with non-uniform shapes can lead to non-uniform regions in the spread layers and reduce flowability and packing density. |
| Bertrand et al. [1] | SLM | AM production of lattice-shaped objects from five types of pure zirconia and yttria powders. It was demonstrated that the use of the smallest possible particle size is required to achieve pure fused ZrO2-Y2O3 layers. The density of the printed elements was relatively low, reaching approximately 56%, and further sintering in a conventional furnace did not increase the object’s density. It was also observed that the laser partially melts the ceramic particles and solidifies the structure. |
| Shishkovsky et al. [36] | SLM | Examination of the microstructure and phase composition of porous ceramics produced using the SLM method. A mixture of yttria-stabilized zirconia (90 wt% ZrO2, 10 wt% Y2O3) and aluminum in a ratio of 4:1 was prepared for the study. The macro- and microstructures of the surfaces of the tested specimens exhibited relatively high density with visible pores and cracks. Moreover, it was demonstrated that laser melting with high irradiation speeds allows for the attainment of a homogeneous structure with an even distribution of stabilizing phases. |
| K. Kandananond [37], L. Zheng et al. [38], W. Li et al. [39] | FDM/FFF | Development of filament production with the use of composite fibers and densely loaded ceramic particles (up to 60% volume) into thermoplastic binders. Obtained material is similar to the conventional FDM/FFF filament, and the printed ceramic parts underwent debinding and sintering to achieve proper densification. The initial application of FDM/FFF for ceramic fabrication was described using binder-filled systems of Al2O3 and Si3N4. |
| N. Eliaz et al. [40] | FDM/FFF | Unsatisfactory sintering densities (75–90%) were observed due to the presence of defects such as void spaces in the sintered elements. Current applications of ceramic FDM/FFF mainly involve the production of bioceramic components and photonic bandgap lattice structures. |
| M.L.M. Sistiaga et al. [41], R. Anitha et al. [42] | FDM/FFF | Analyzes the influence of size and distribution of ceramic particles, fiber dispersions, binders, additives, viscosity, consequently, and the flexibility of continuous fibers on the FDM/FFF process. |
| Chemical Formula and Purity | Al₂O₃ 99.5% | Al₂O₃ 99.9% |
|---|---|---|
| Vickers hardness (GPa) | 18 | 18 |
| Brittle-like cracking resistance (MPa·m0.5) | 4 | 4 |
| Max. usage temperature (°C) | 1300 | 1500 |
| Thermal expansion coefficient (×10−⁶/°C) | 8.5 (at 1000 °C) | 8.8 (at 1000 °C) |
| Thermal conductivity (W/(m·K)) | 30 | 33 |
| Thermal shock resistance (°C) | 200 | 200 |
| Material Type | Al2O3 Filament |
|---|---|
| Content of organic ingredients (% of total mass) | 19.5 |
| Filament density before sintering (g/cm3) | 2.533 |
| Density after sintering (g/cm3) | 3.85–3.96 |
| Vickers hardness (GPa) | 17–20 |
| 3D printing temperature (°C) | from 155 to 170 |
| Printing speed (mm/s) | from 5 to 30 |
| Sintering temperature (°C) | 1540 °C |
| Sintering atmosphere | Air |
| Linear thermal expansion coefficient (10−6K−1) | 8.5 |
| Thermal conductivity (W/mK) | 20–30 |
| Electrical conductivity | insulator |
| Linear shrinkage (%) (X/Y printing direction) | LSX/Y = 19.0 → SF = 1.235 |
| Linear shrinkage (%) (Z printing direction) | LSZ = 21.5 → SF = 1.274 |
| Extraction time (h) | 24 |
| Extraction temperature (°C) | 42 |
| Extraction medium | acetone |
| Maximum weight loss during extraction (%) | 9.8 |
| Ultimate Tensile Strength (MPa) | 5.1 |
| Young’s modulus (GPa) | 1.03 |
| Elongation at break (%) | 1.4 |
| Bending stress at break (MPa) | 10.27 |
| Heat deflection temperature at 1.13 MPa (°C) | 74.4 |
| Young’s Modulus (GPa) | 50 |
| Bending stress at break (MPa) | 33.5 |
| Cold compression strength (MPa) | 72.2 |
| Shear modulus (GPa) | 21.9 |
| Poisson’s ratio | 0.140 |
| Density (g/cm3) | 1.9 |
| Step No. | Heating Time (min) | Temperature (°C) | Total Time (min) |
|---|---|---|---|
| 1 | 0 | 0 | 0 |
| 240 | 240 | 240 | |
| 2 | 480 | 240 | 720 |
| 60 | 300 | 780 | |
| 60 | 300 | 840 | |
| 3 | 333 | 1271 | 1173 |
| 4 | 5 | 1271 | 1178 |
| 5 | 60 | 900 | 1238 |
| 450 | 0 | 1688 |
| Step No. | Start Temperature (°C) | Target Temperature (°C) | Time (min) |
|---|---|---|---|
| 1 | 20 | 1000 | 240 |
| 2 | 1000 | 1540 | 270 |
| 3 | 1540 | 1540 | 120 |
| 4 | 1540 | 20 | (cooled in the furnace) |
| Specimen Description | Material Condition |
|---|---|
| A | Al2O3 produced via FDM/FFF (green part) |
| B | SiO2 produced via SLA (green part) |
| C | Al2O3 produced via FDM/FFF (brown part) |
| D | SiO2 produced via SLA, sintered at 1271 °C (fully ceramic part) |
| E | Al2O3 produced via FDM/FFF, sintered at 1540 °C (fully ceramic part) |
| Specimen Description | True Density (g/cm3) | Average Pore Volume (cm3/g) |
|---|---|---|
| A | 2.576 | 0.5998 ± 0.0006 |
| B | 1.721 | 0.4081 ± 0.0013 |
| C | 2.880 | 0.6416 ± 0.0012 |
| D | 2.306 | 0.5466 ± 0.0014 |
| E | 3.920 | 0.7351 ± 0.0004 |
| Specimen Description | Average Grain Size (μm) |
|---|---|
| A | 0.18 |
| B | 2.00 |
| C | 0.24 |
| D | n/a |
| E | 0.50 |
| Amount of Elements (Wt %) | ||||||
|---|---|---|---|---|---|---|
| Specimen Description | Al | O | Ca | Si | Na | K |
| A | 57.2 | 42.8 | n/a | n/a | n/a | n/a |
| B | 10.3 | 52.9 | n/a | 30.8 | 4.4 | 1.5 |
| C | 58.4 | 41.6 | n/a | n/a | n/a | n/a |
| D | 6.6 | 50.1 | n/a | 36.9 | 4.1 | 2.4 |
| E | 53.6 | 45.2 | 1.2 | n/a | n/a | n/a |
| Parameter | Value | Image |
|---|---|---|
| Specimen Series A | 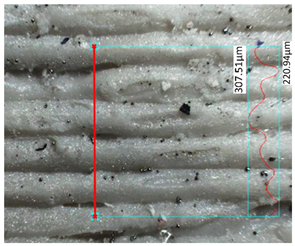 | |
| Measured profile length [μm] | 1214.43 | |
| Measured profile height [μm] | 86.57 | |
| Rz [μm] | 89.41 | |
| Ra [μm] | 13.98 | |
| Specimen Series B | 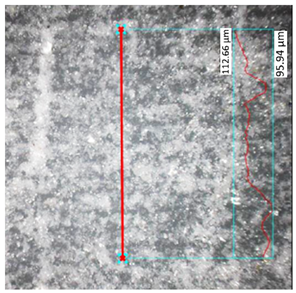 | |
| Measured profile length [μm] | 1285.22 | |
| Measured profile height [μm] | 16.73 | |
| Rz [μm] | 11.97 | |
| Ra [μm] | 2.31 | |
| Specimen Series C | 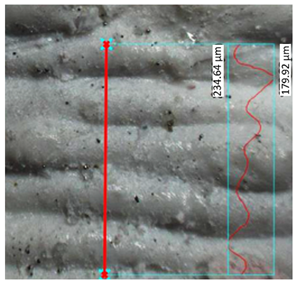 | |
| Measured profile length [μm] | 1112.69 | |
| Measured profile height [μm] | 54.73 | |
| Rz [μm] | 48.24 | |
| Ra [μm] | 8.32 | |
| Specimen Series D | 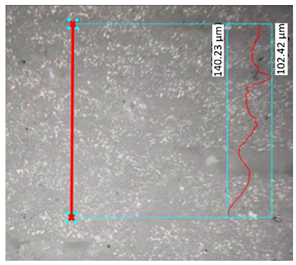 | |
| Measured profile length [μm] | 957.83 | |
| Measured profile height [μm] | 37.80 | |
| Rz [μm] | 22.15 | |
| Ra [μm] | 3.91 | |
| Specimen Series E | 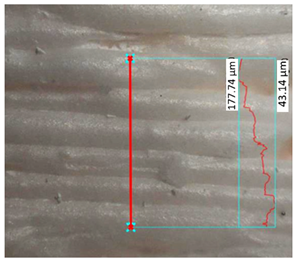 | |
| Measured profile length [μm] | 1028.61 | |
| Measured profile height [μm] | 134.59 | |
| Rz [μm] | 66.43 | |
| Ra [μm] | 9.71 | |
| Specimen Series Number | Indentation Load | Average Hardness (GPa) |
|---|---|---|
| 4 | HV1 | 3.207 ± 0.783 |
| 5 | HV5 | 19.73 ± 0.683 |
| SLA (Specimen Series 4) | FDM/FFF (Specimen Series 5) | ||||||
|---|---|---|---|---|---|---|---|
| Rc [MPa] | Ec [GPa] | eRc [-] | Rc [MPa] | Ec [GPa] | εRc [-] | ||
| SA4 | 19.227 | 1.883 | 0.016 | FA2 | 151.841 | 9.37 | 0.019 |
| SA5 | 19.100 | 1.976 | 0.023 | FA4 | 168.502 | 19.379 | 0.014 |
| Average | 19.1635 | 1.9295 | 0.0195 | FA6 | 130.053 | 10.937 | 0.015 |
| Std. dev. | 0.0635 | 0.0465 | 0.0035 | Average | 150.132 | 13.229 | 0.016 |
| SB2 | 20.024 | 1.652 | 0.029 | Std. dev. | 15.743 | 4.396 | 0.002 |
| SB4 | 21.324 | 1.411 | 0.029 | FB3 | 116.248 | 6.009 | 0.018 |
| Average | 20.674 | 1.5315 | 0.029 | FB4 | 101.932 | 13.432 | 0.015 |
| Std. dev. | 0.650 | 0.1205 | 0.000 | FB5 | 98.336 | 12.410 | 0.019 |
| SC2 | 28.206 | 1.358 | 0.035 | Average | 105.505 | 10.617 | 0.017 |
| SC3 | 28.345 | 1.558 | 0.033 | Std. dev. | 7.737 | 3.285 | 0.002 |
| Average | 28.2755 | 1.458 | 0.034 | FC2 | 105.703 | 9.506 | 0.040 |
| Std. dev. | 0.0695 | 0.1 | 0.001 | FC3 | 137.102 | 7.181 | 0.041 |
| SD1 | 82.28 | 1.08 | 0.93 | FC5 | 138.181 | 5.603 | 0.036 |
| SD2 | 84.71 | 1.089 | 0.087 | Average | 126.995 | 7.430 | 0.039 |
| Average | 83.495 | 1.0845 | 0.5085 | Std. dev. | 15.062 | 1.603 | 0.002 |
| Std. dev. | 1.215 | 0.0045 | 0.4215 | ||||
Disclaimer/Publisher’s Note: The statements, opinions and data contained in all publications are solely those of the individual author(s) and contributor(s) and not of MDPI and/or the editor(s). MDPI and/or the editor(s) disclaim responsibility for any injury to people or property resulting from any ideas, methods, instructions or products referred to in the content. |
© 2024 by the authors. Licensee MDPI, Basel, Switzerland. This article is an open access article distributed under the terms and conditions of the Creative Commons Attribution (CC BY) license (https://creativecommons.org/licenses/by/4.0/).
Share and Cite
Jasik, K.; Kluczyński, J.; Miedzińska, D.; Popławski, A.; Łuszczek, J.; Zygmuntowicz, J.; Piotrkiewicz, P.; Perkowski, K.; Wachowski, M.; Grzelak, K. Comparison of Additively Manufactured Polymer-Ceramic Parts Obtained via Different Technologies. Materials 2024, 17, 240. https://doi.org/10.3390/ma17010240
Jasik K, Kluczyński J, Miedzińska D, Popławski A, Łuszczek J, Zygmuntowicz J, Piotrkiewicz P, Perkowski K, Wachowski M, Grzelak K. Comparison of Additively Manufactured Polymer-Ceramic Parts Obtained via Different Technologies. Materials. 2024; 17(1):240. https://doi.org/10.3390/ma17010240
Chicago/Turabian StyleJasik, Katarzyna, Janusz Kluczyński, Danuta Miedzińska, Arkadiusz Popławski, Jakub Łuszczek, Justyna Zygmuntowicz, Paulina Piotrkiewicz, Krzysztof Perkowski, Marcin Wachowski, and Krzysztof Grzelak. 2024. "Comparison of Additively Manufactured Polymer-Ceramic Parts Obtained via Different Technologies" Materials 17, no. 1: 240. https://doi.org/10.3390/ma17010240