
Exploring Oat Husks as Aggregates in Limestone-Based Composites: Effects of Surface Treatments and Binder Selection on Mechanical Performance

Abstract
:1. Introduction
2. Materials
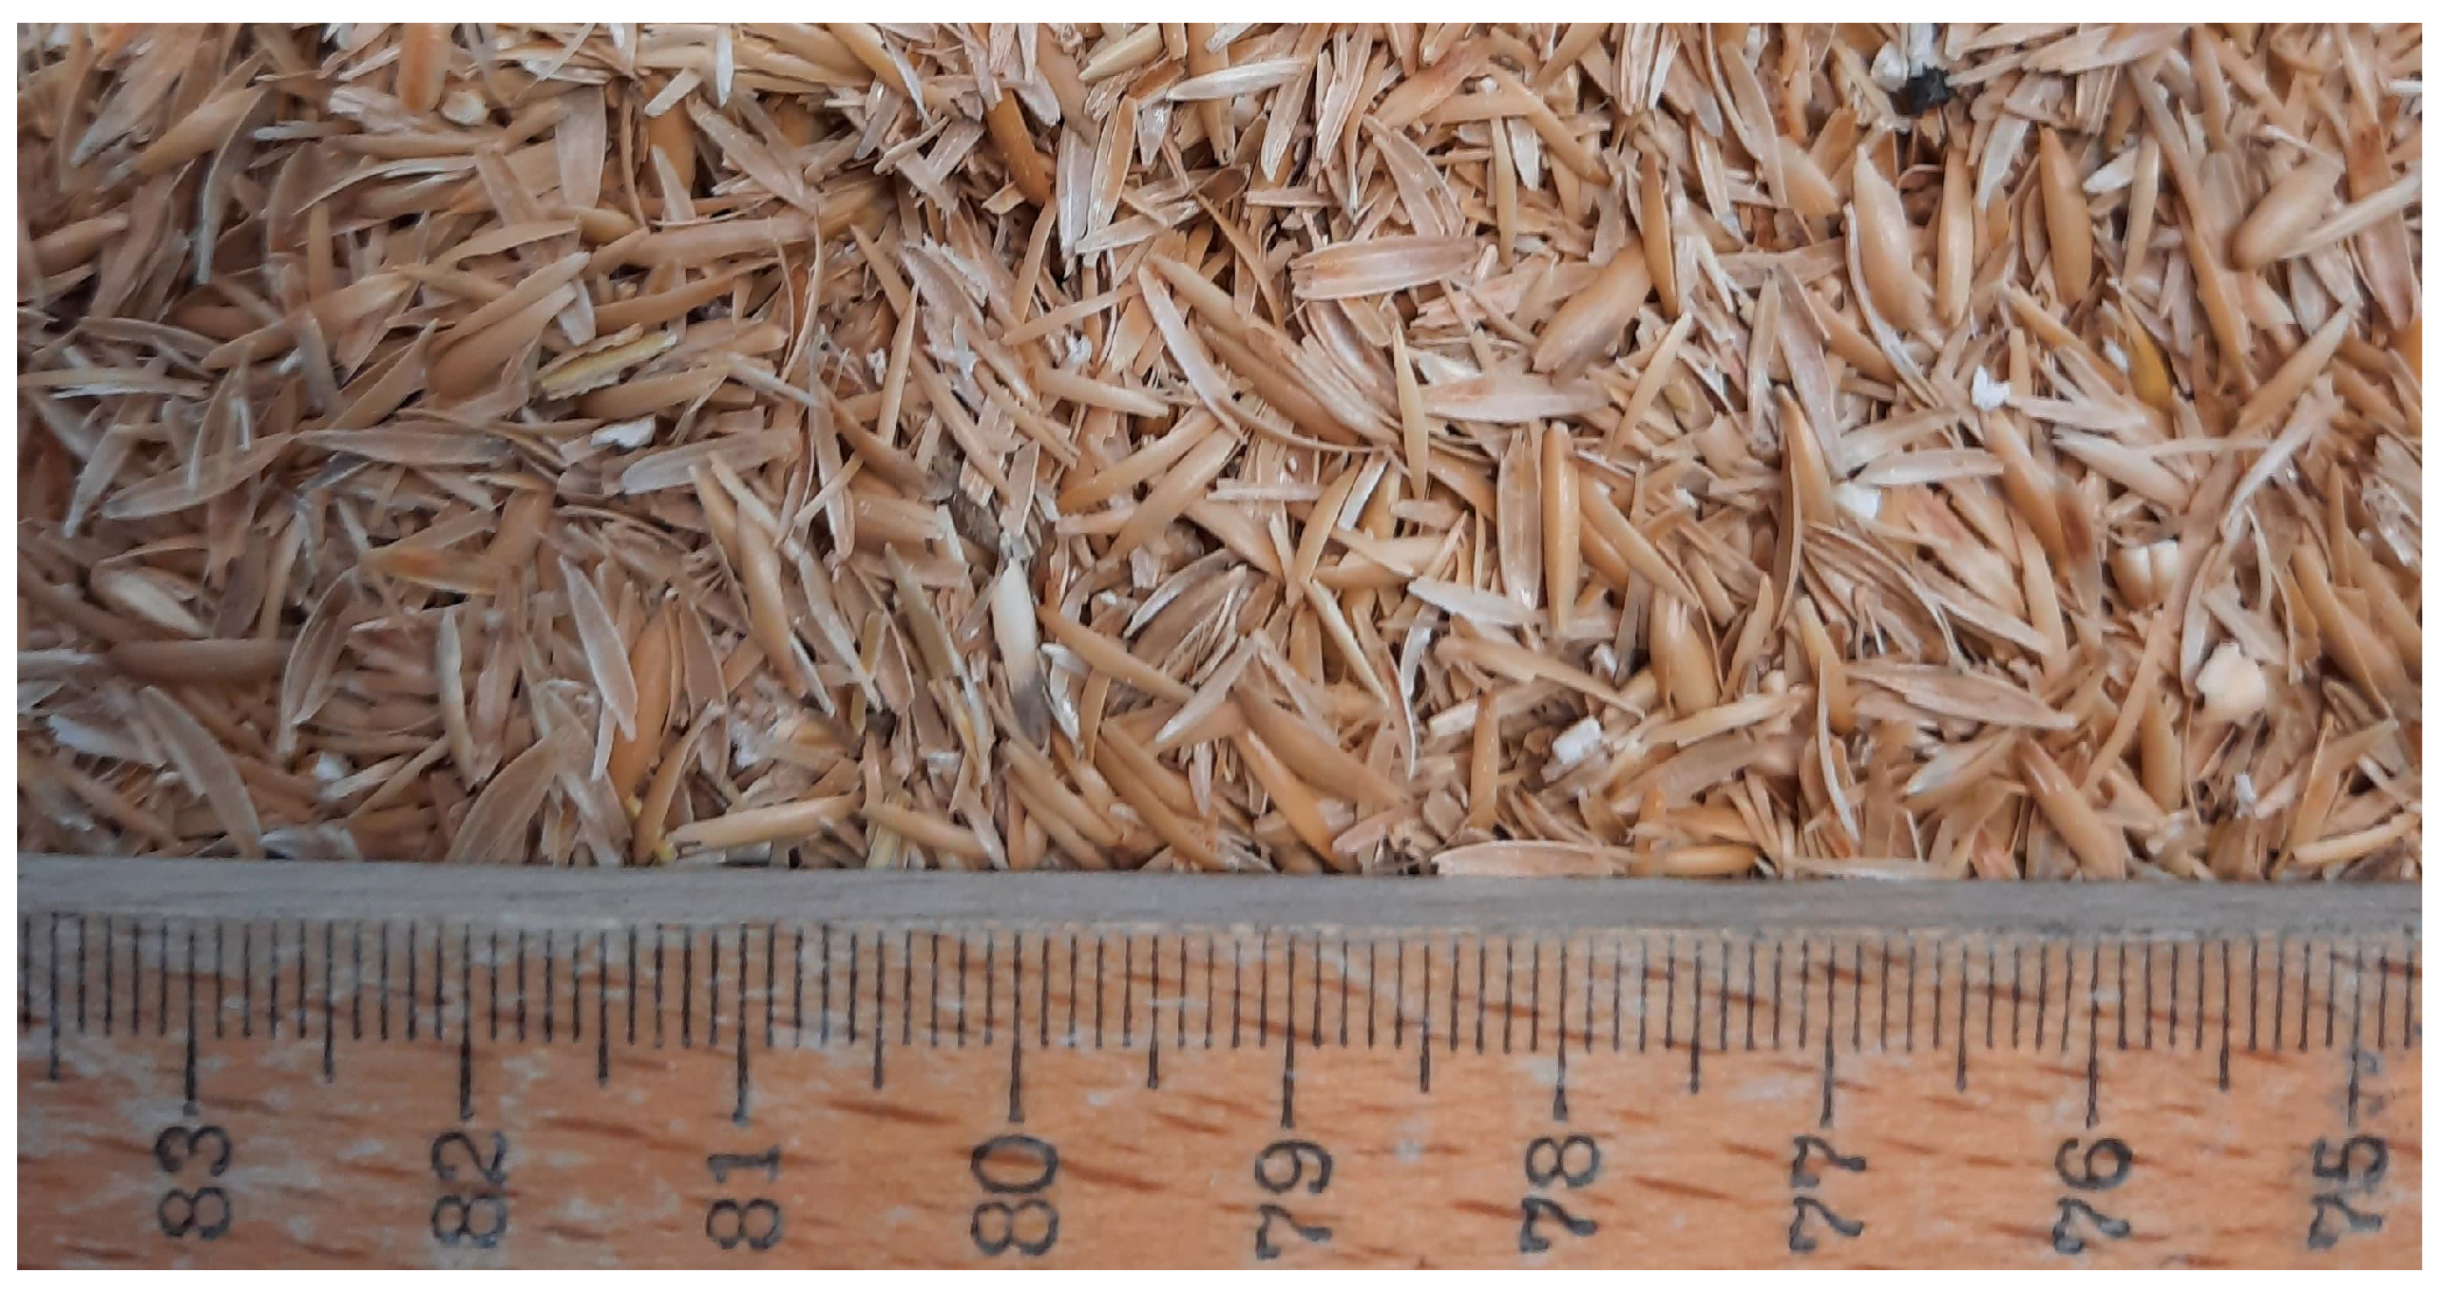
2.1. Oat Husks
2.2. Binders
2.3. Admixtures
2.4. Mineral Aggregates
3. Oat Husk Particle Surface Treatments and Performance Evaluation Procedures
3.1. Surface Treatments
3.1.1. Cold-Water Washing Treatment
3.1.2. Mineral Binder Coating Treatment
3.1.3. Linseed Oil Coating Treatment
3.2. Treatment Confirmation
3.3. Mass Variation after Immersion in Water
3.4. Modifications after Immersion in Alkaline Solution
3.5. Particle/Matrix Interference
3.5.1. Assessment of Cement Setting Time Utilising Leachate Solutions
3.5.2. Modifications after Use in the Cement Matrix
3.6. Aggregates Physical and Morphological Characterisation
3.6.1. Bulk Density
3.6.2. Water Content
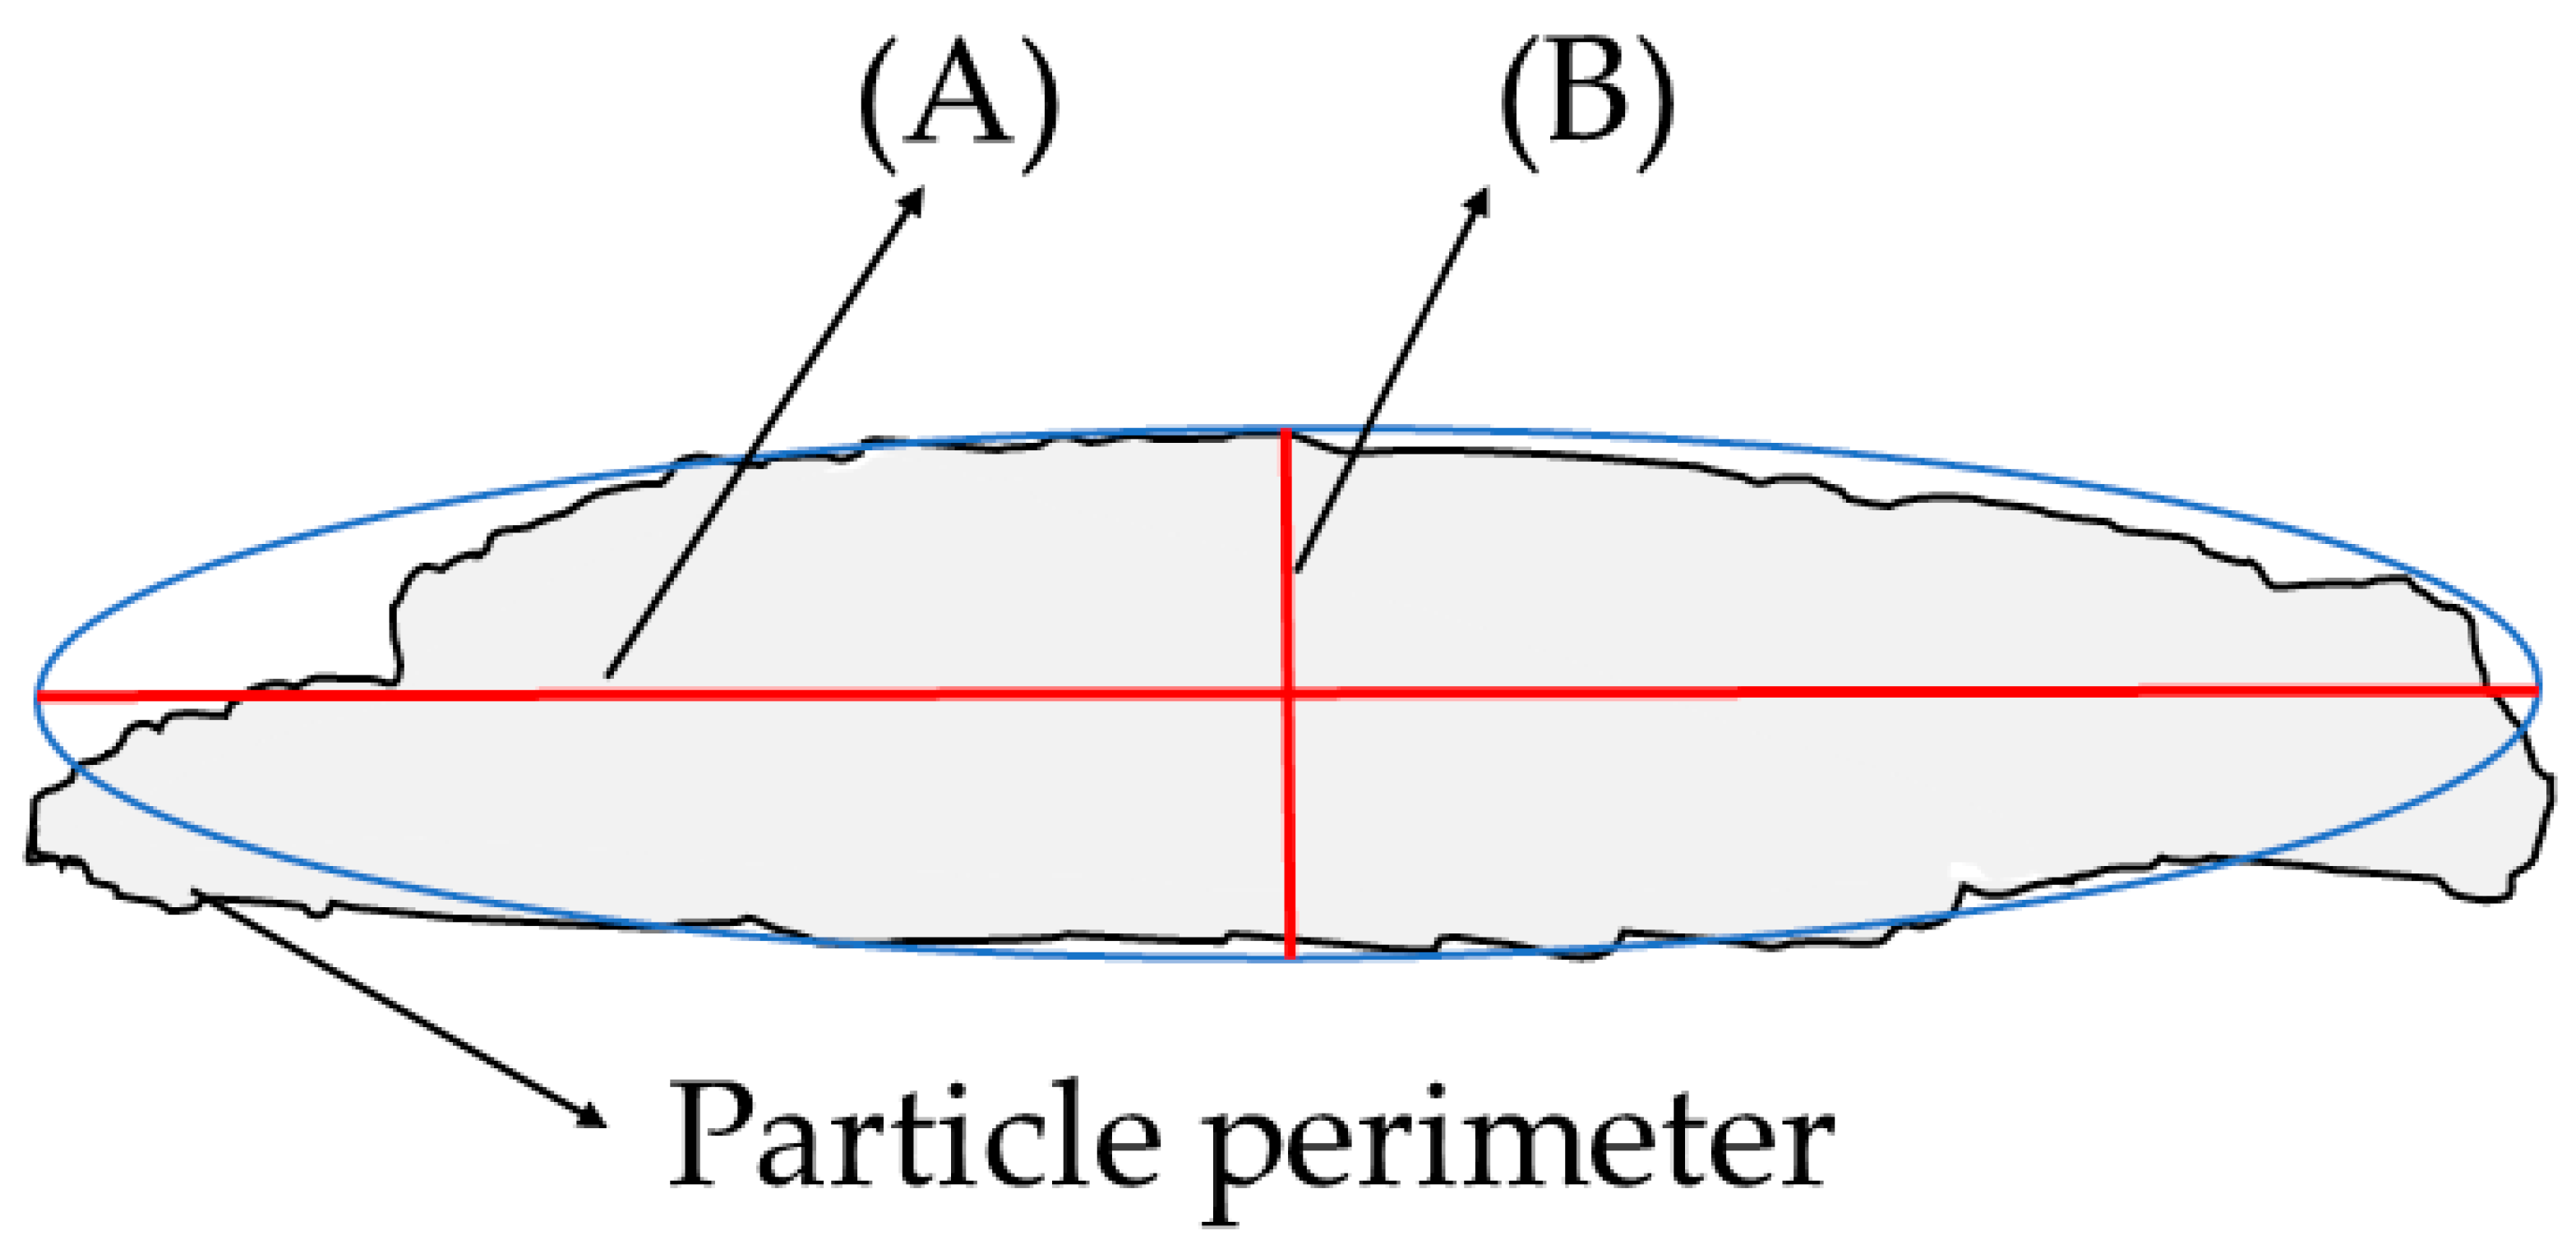
3.6.3. Geometrical Analysis
3.7. Considerations for Statistical Acceptance of Particle Analysis Results
4. Results and Discussion on Particle Surface Treatments and Performance Evaluation
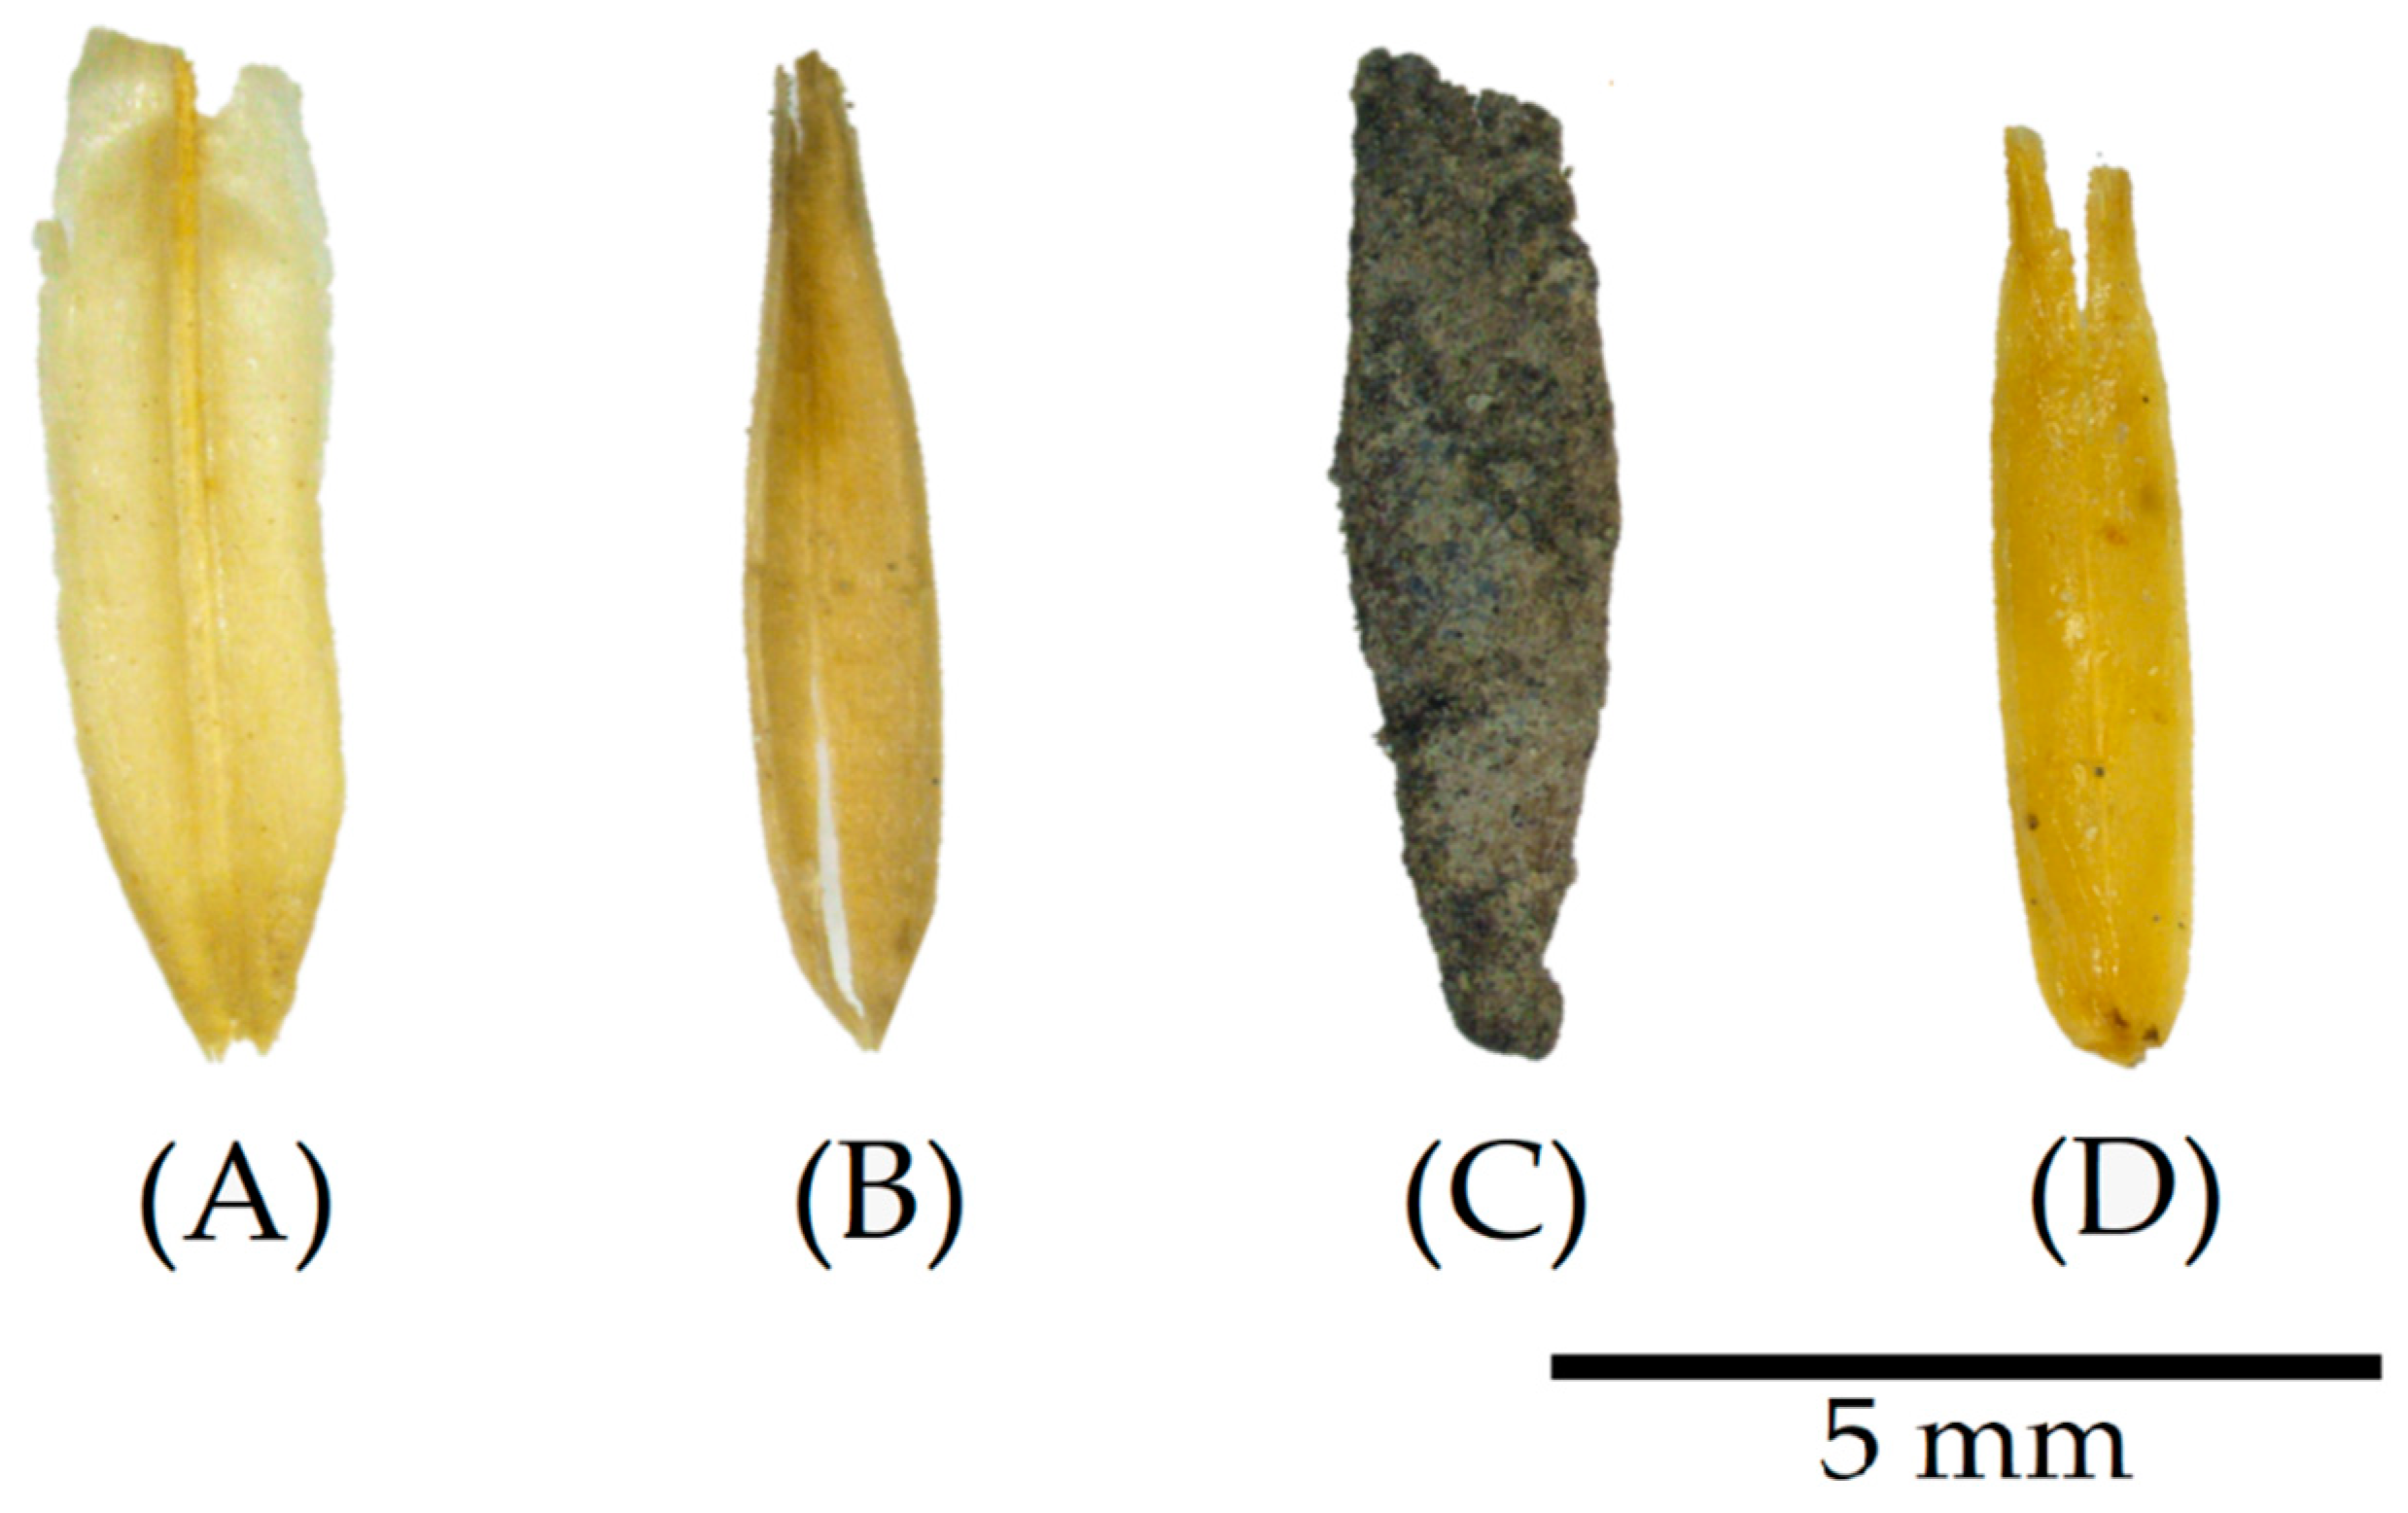
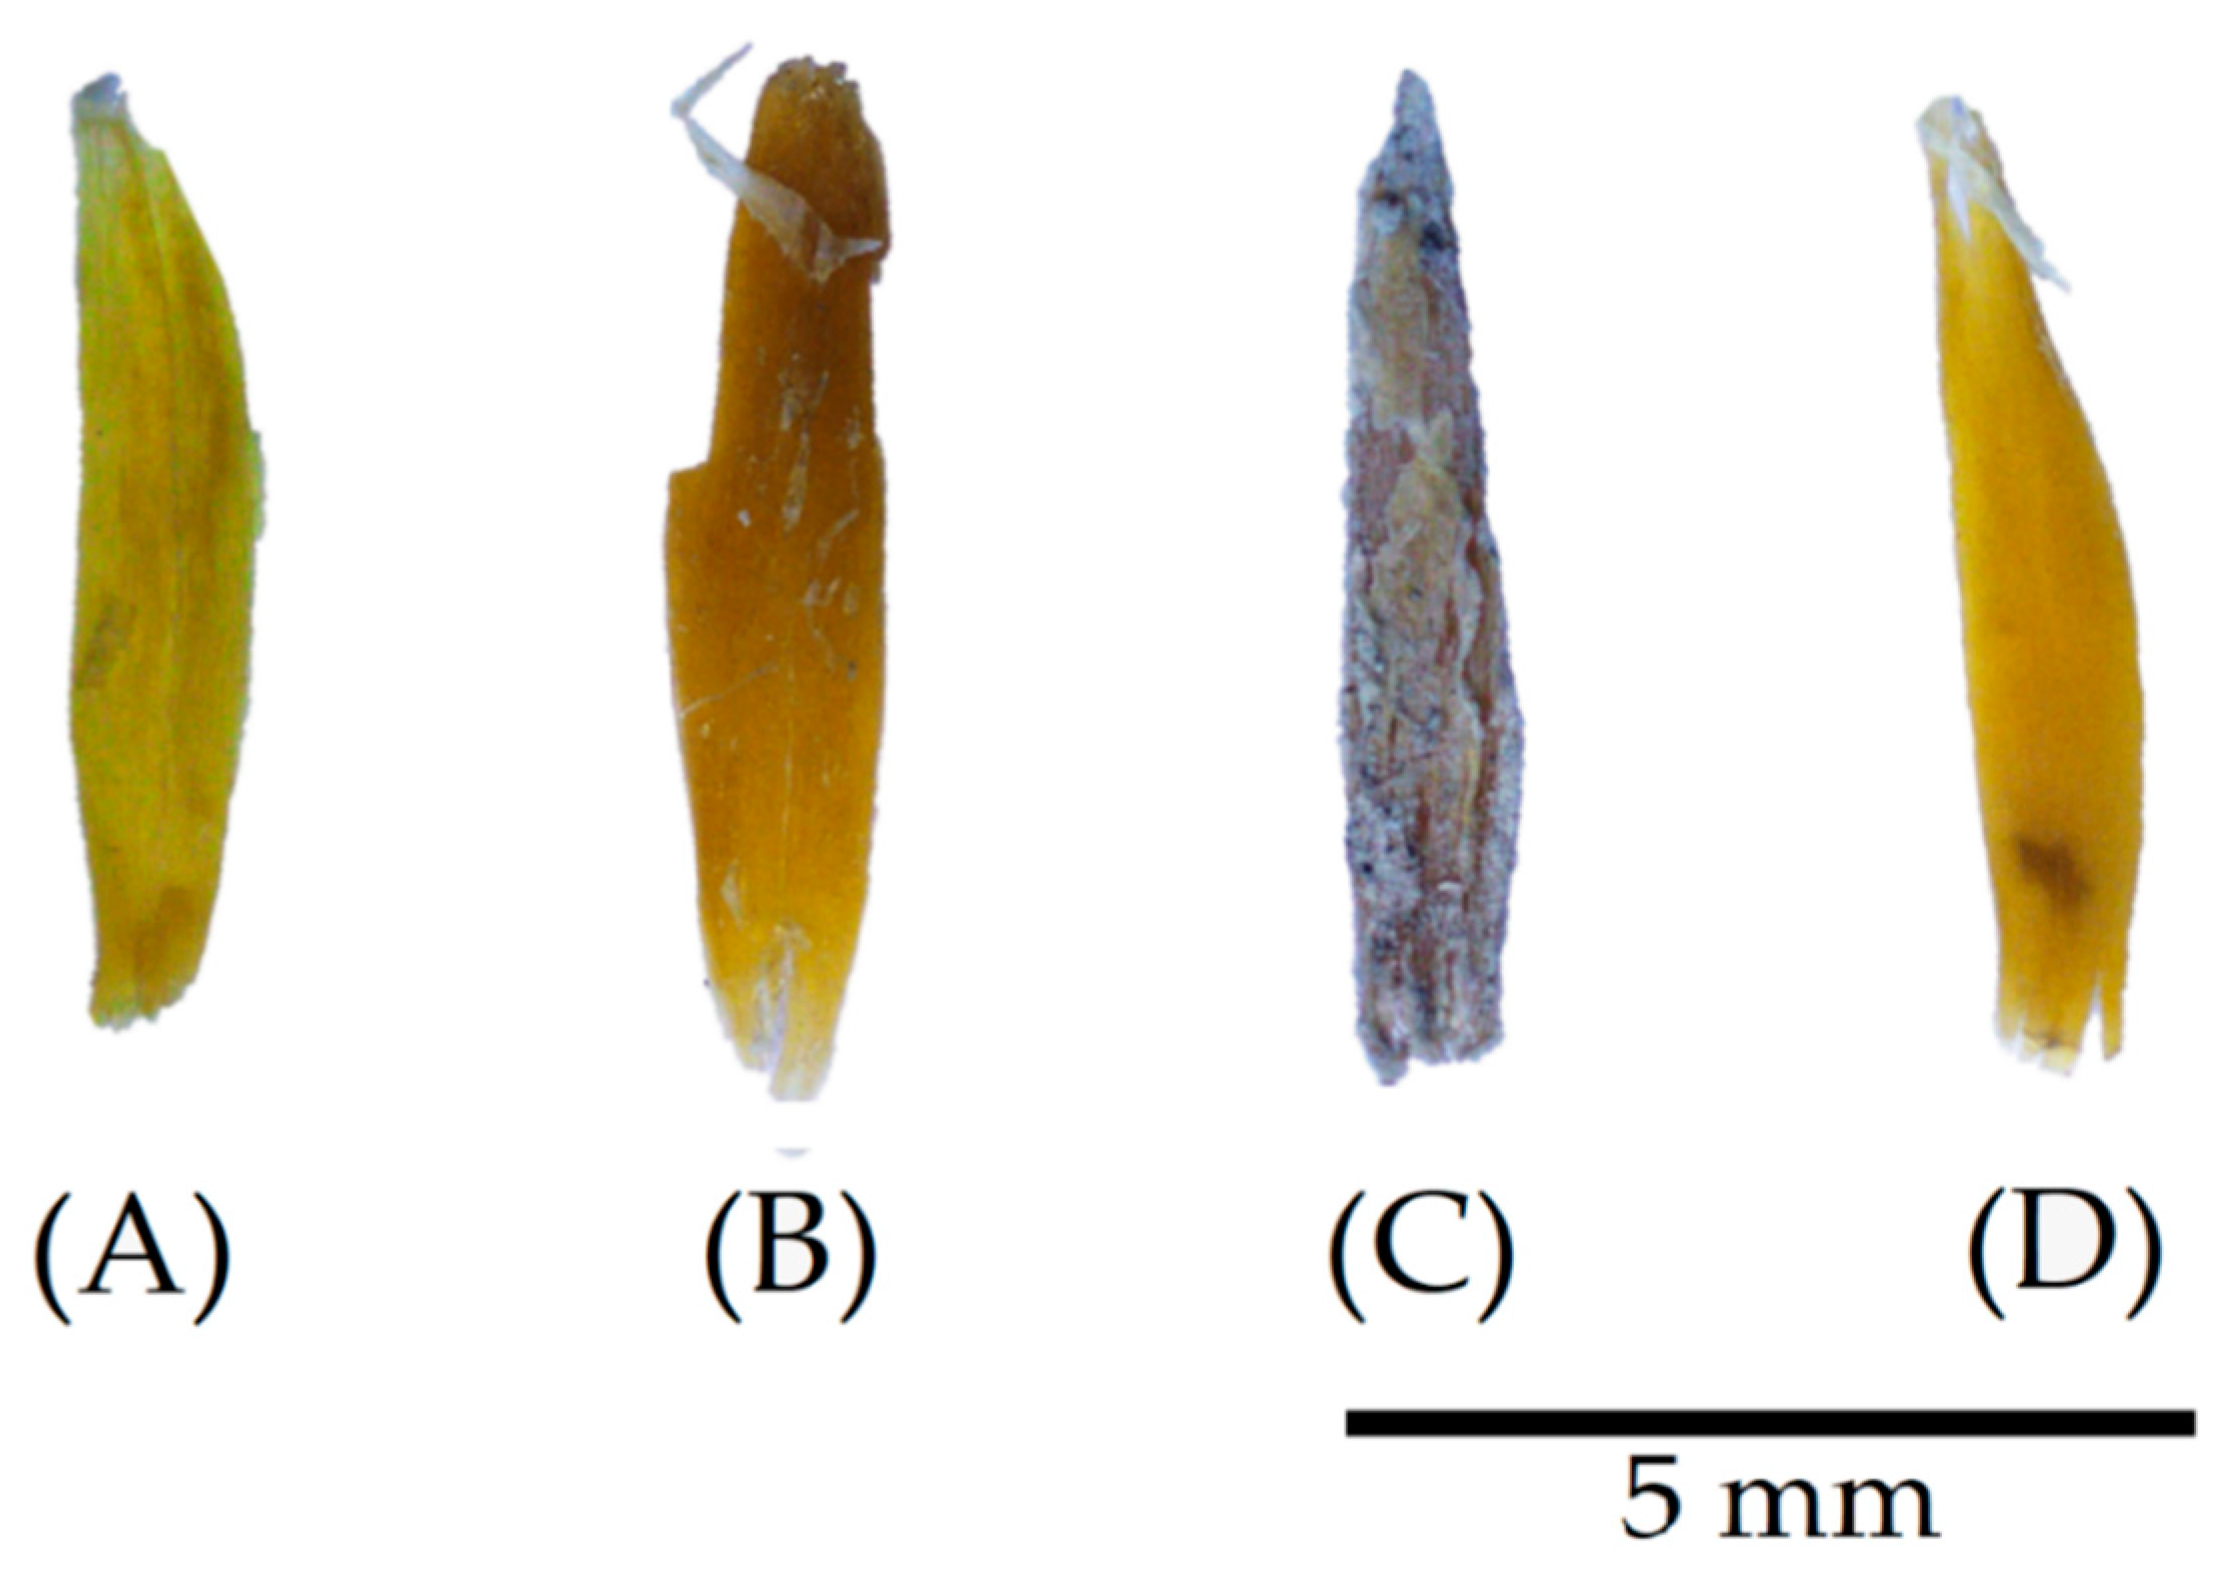
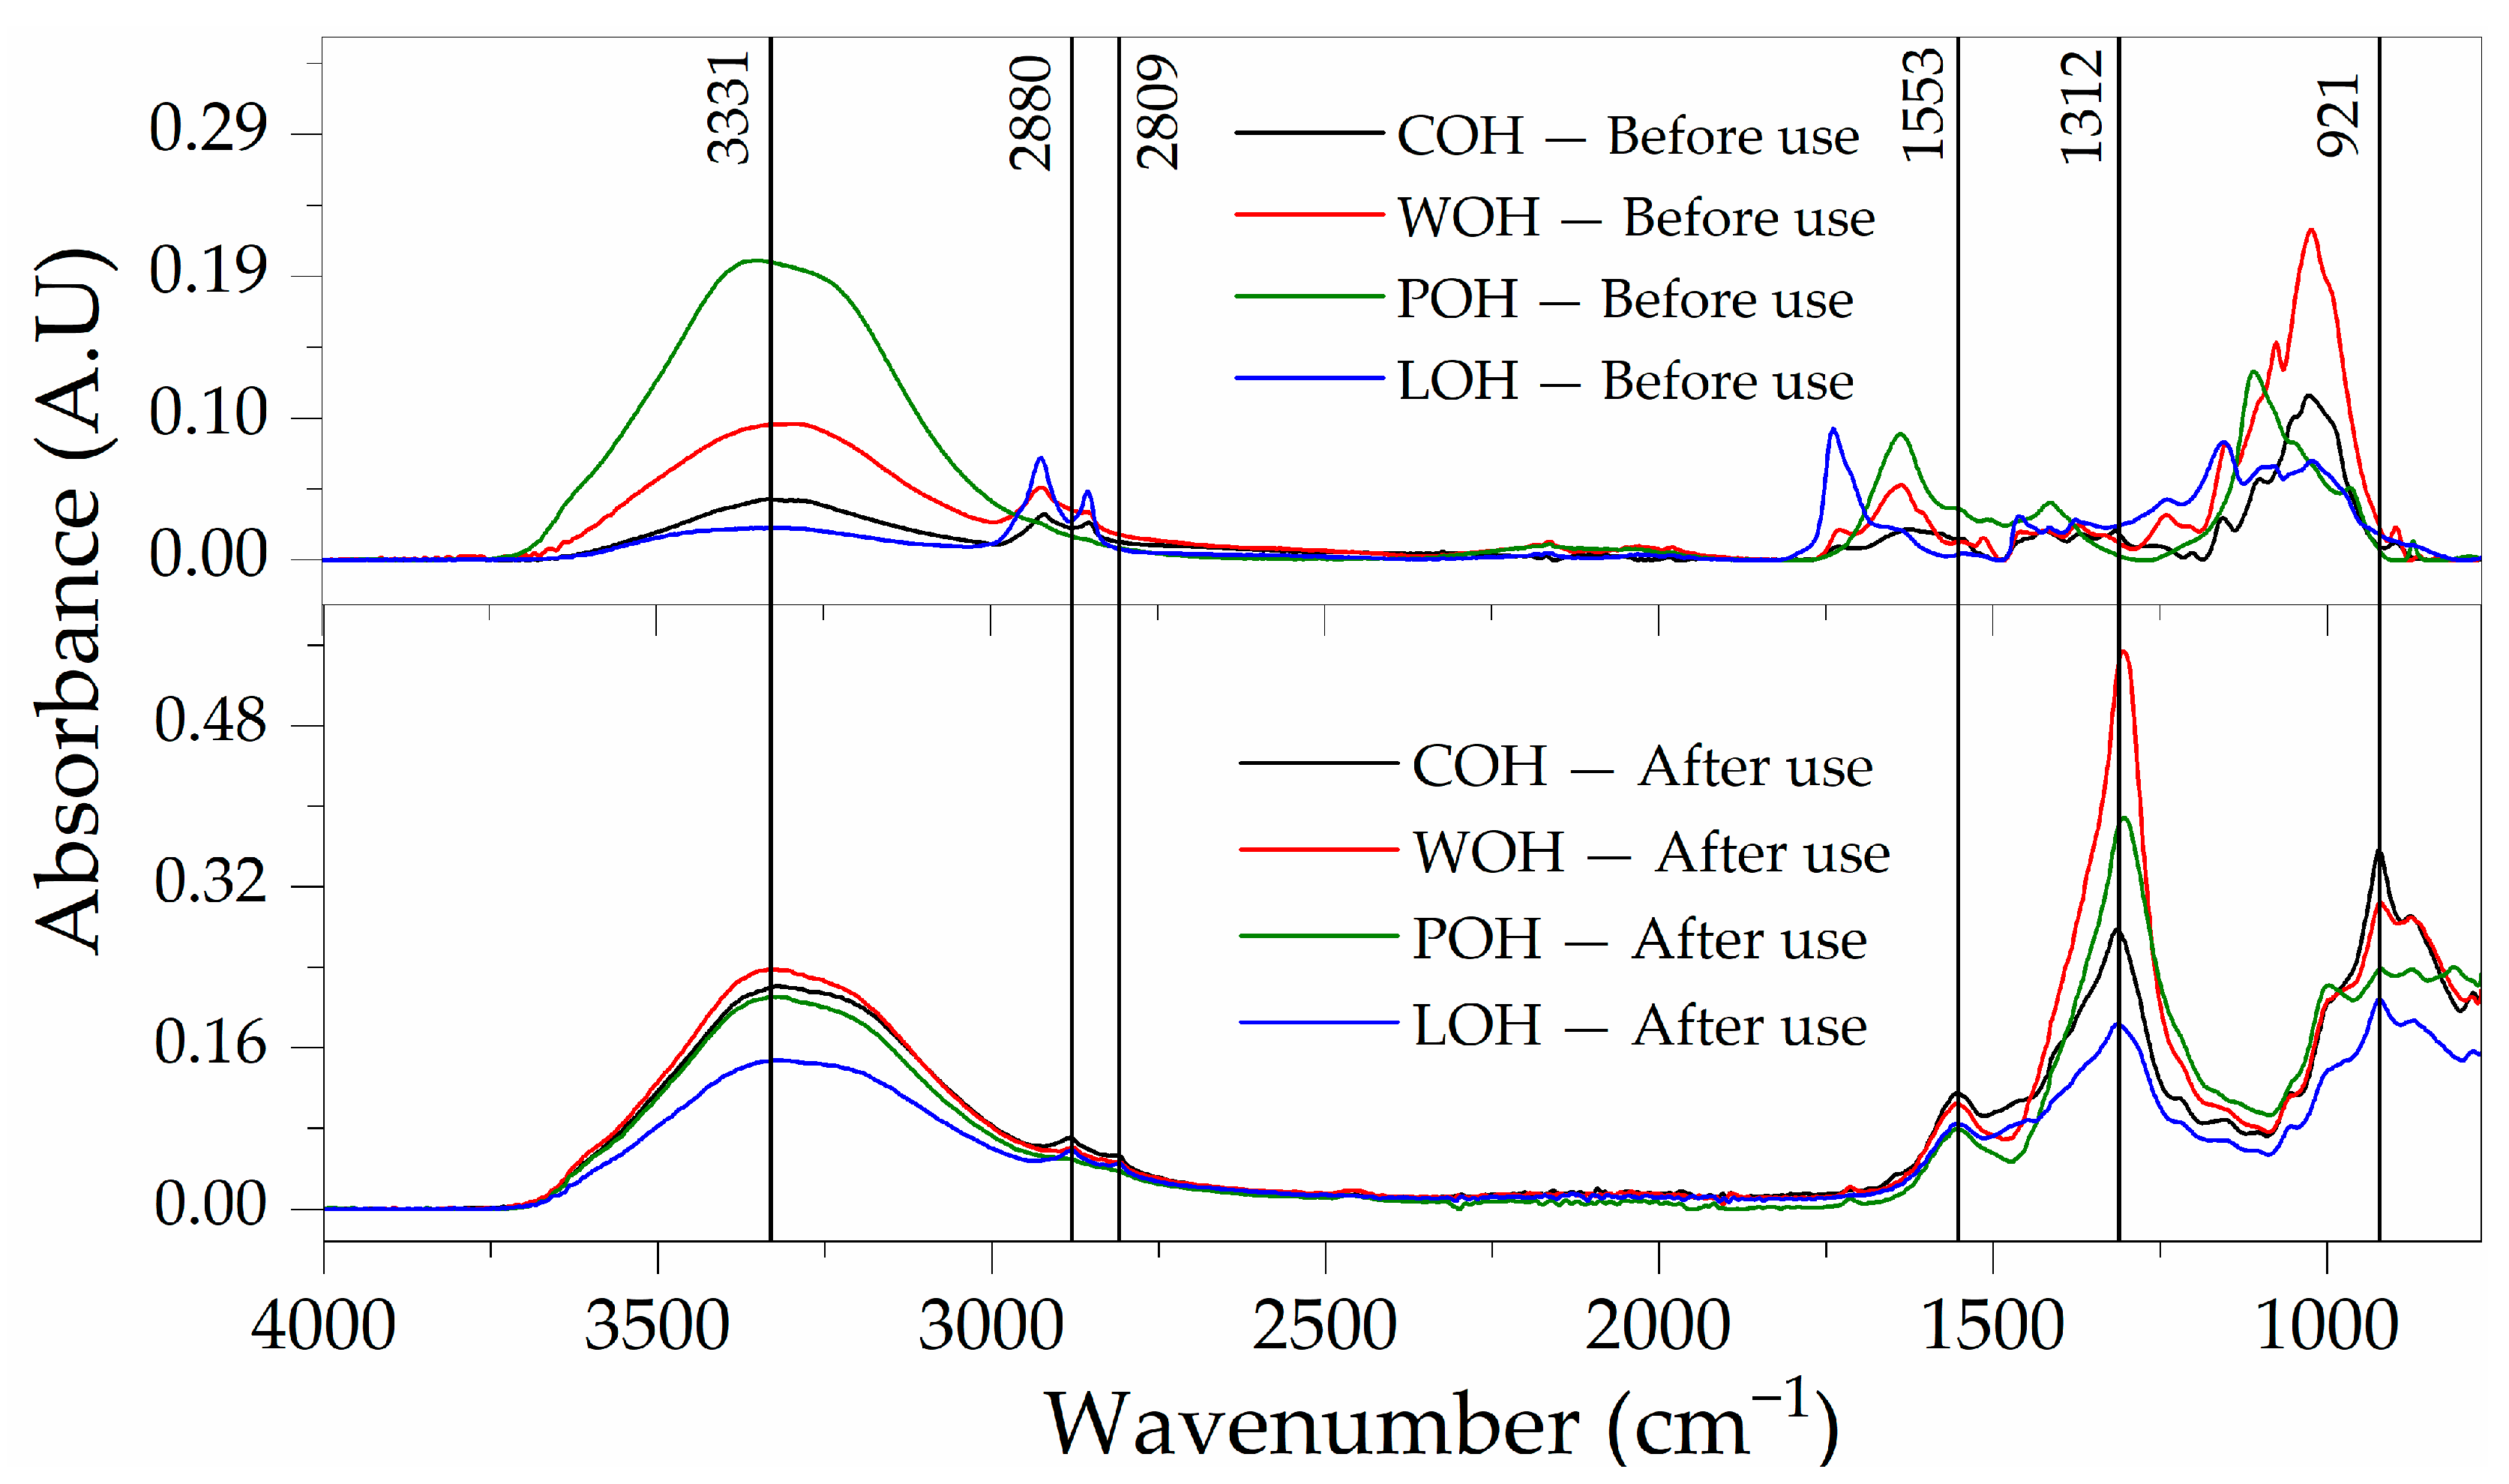
4.1. Surface Treatment Confirmation
4.2. Particle Mass Analysis Post Immersion in Water
4.3. Particle Modification after Immersion in Alkaline Solution
4.4. Particle/Matrix Interference Analysis
4.4.1. Effect of Leachate Solution on Cement Setting Time
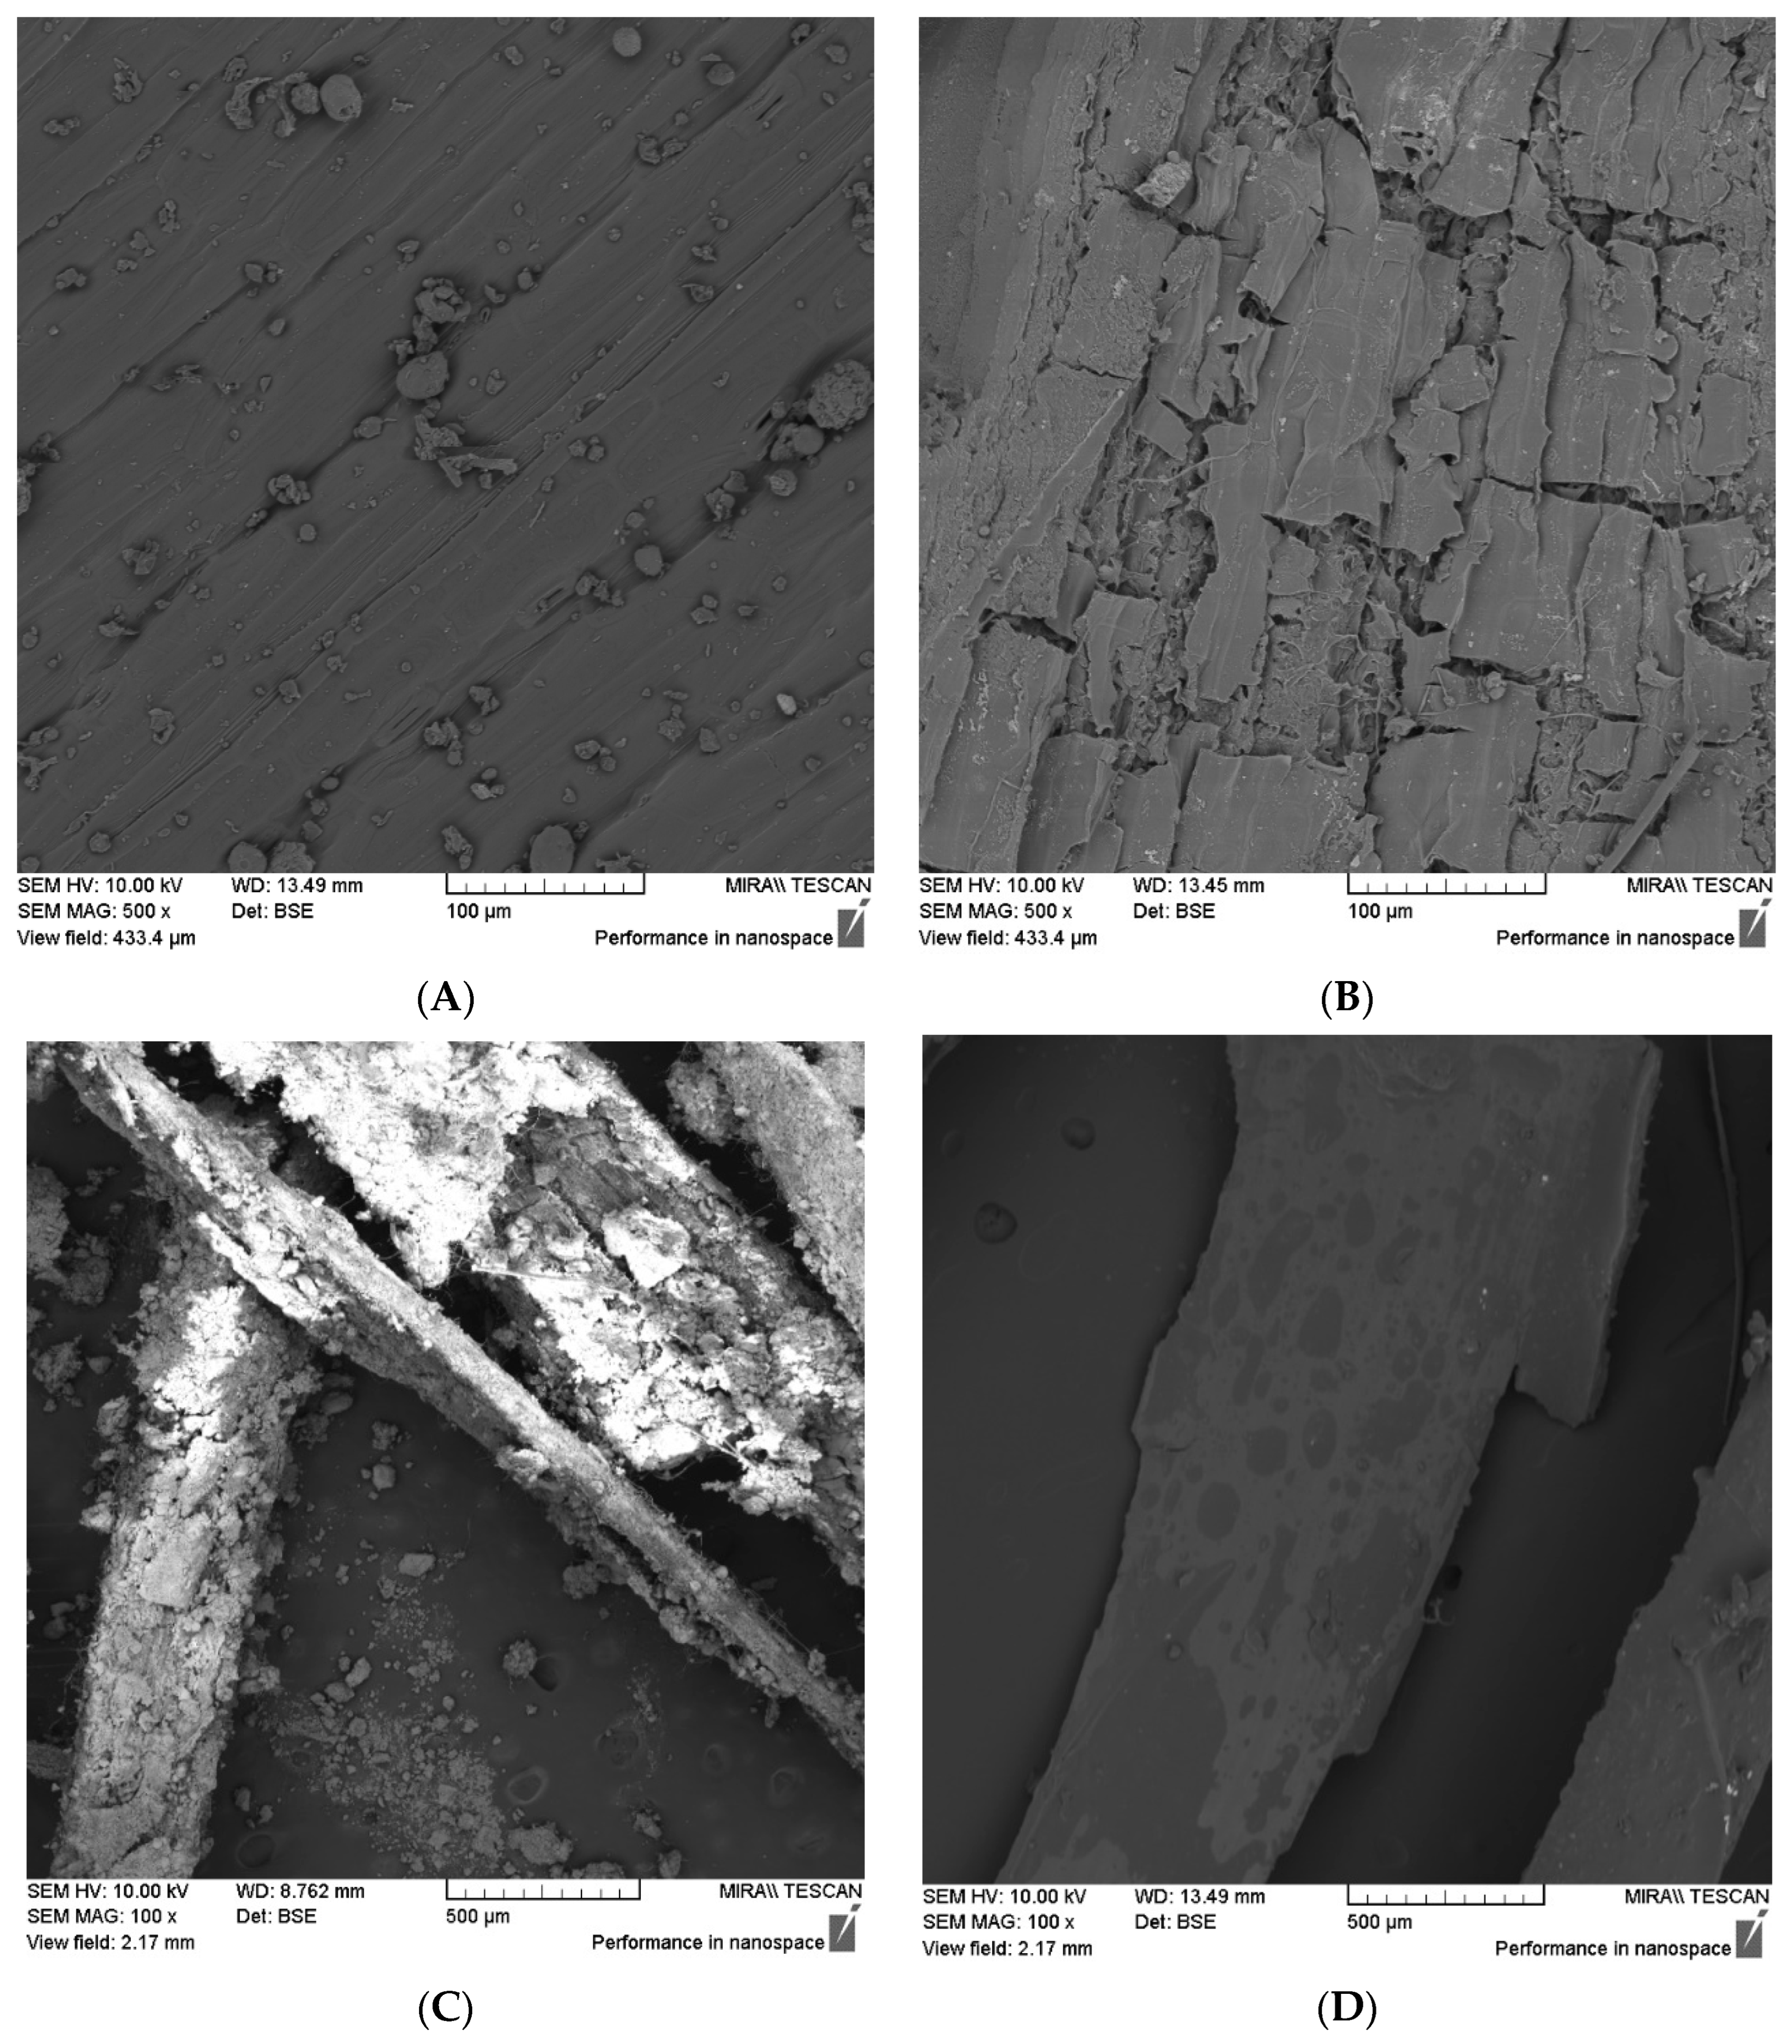
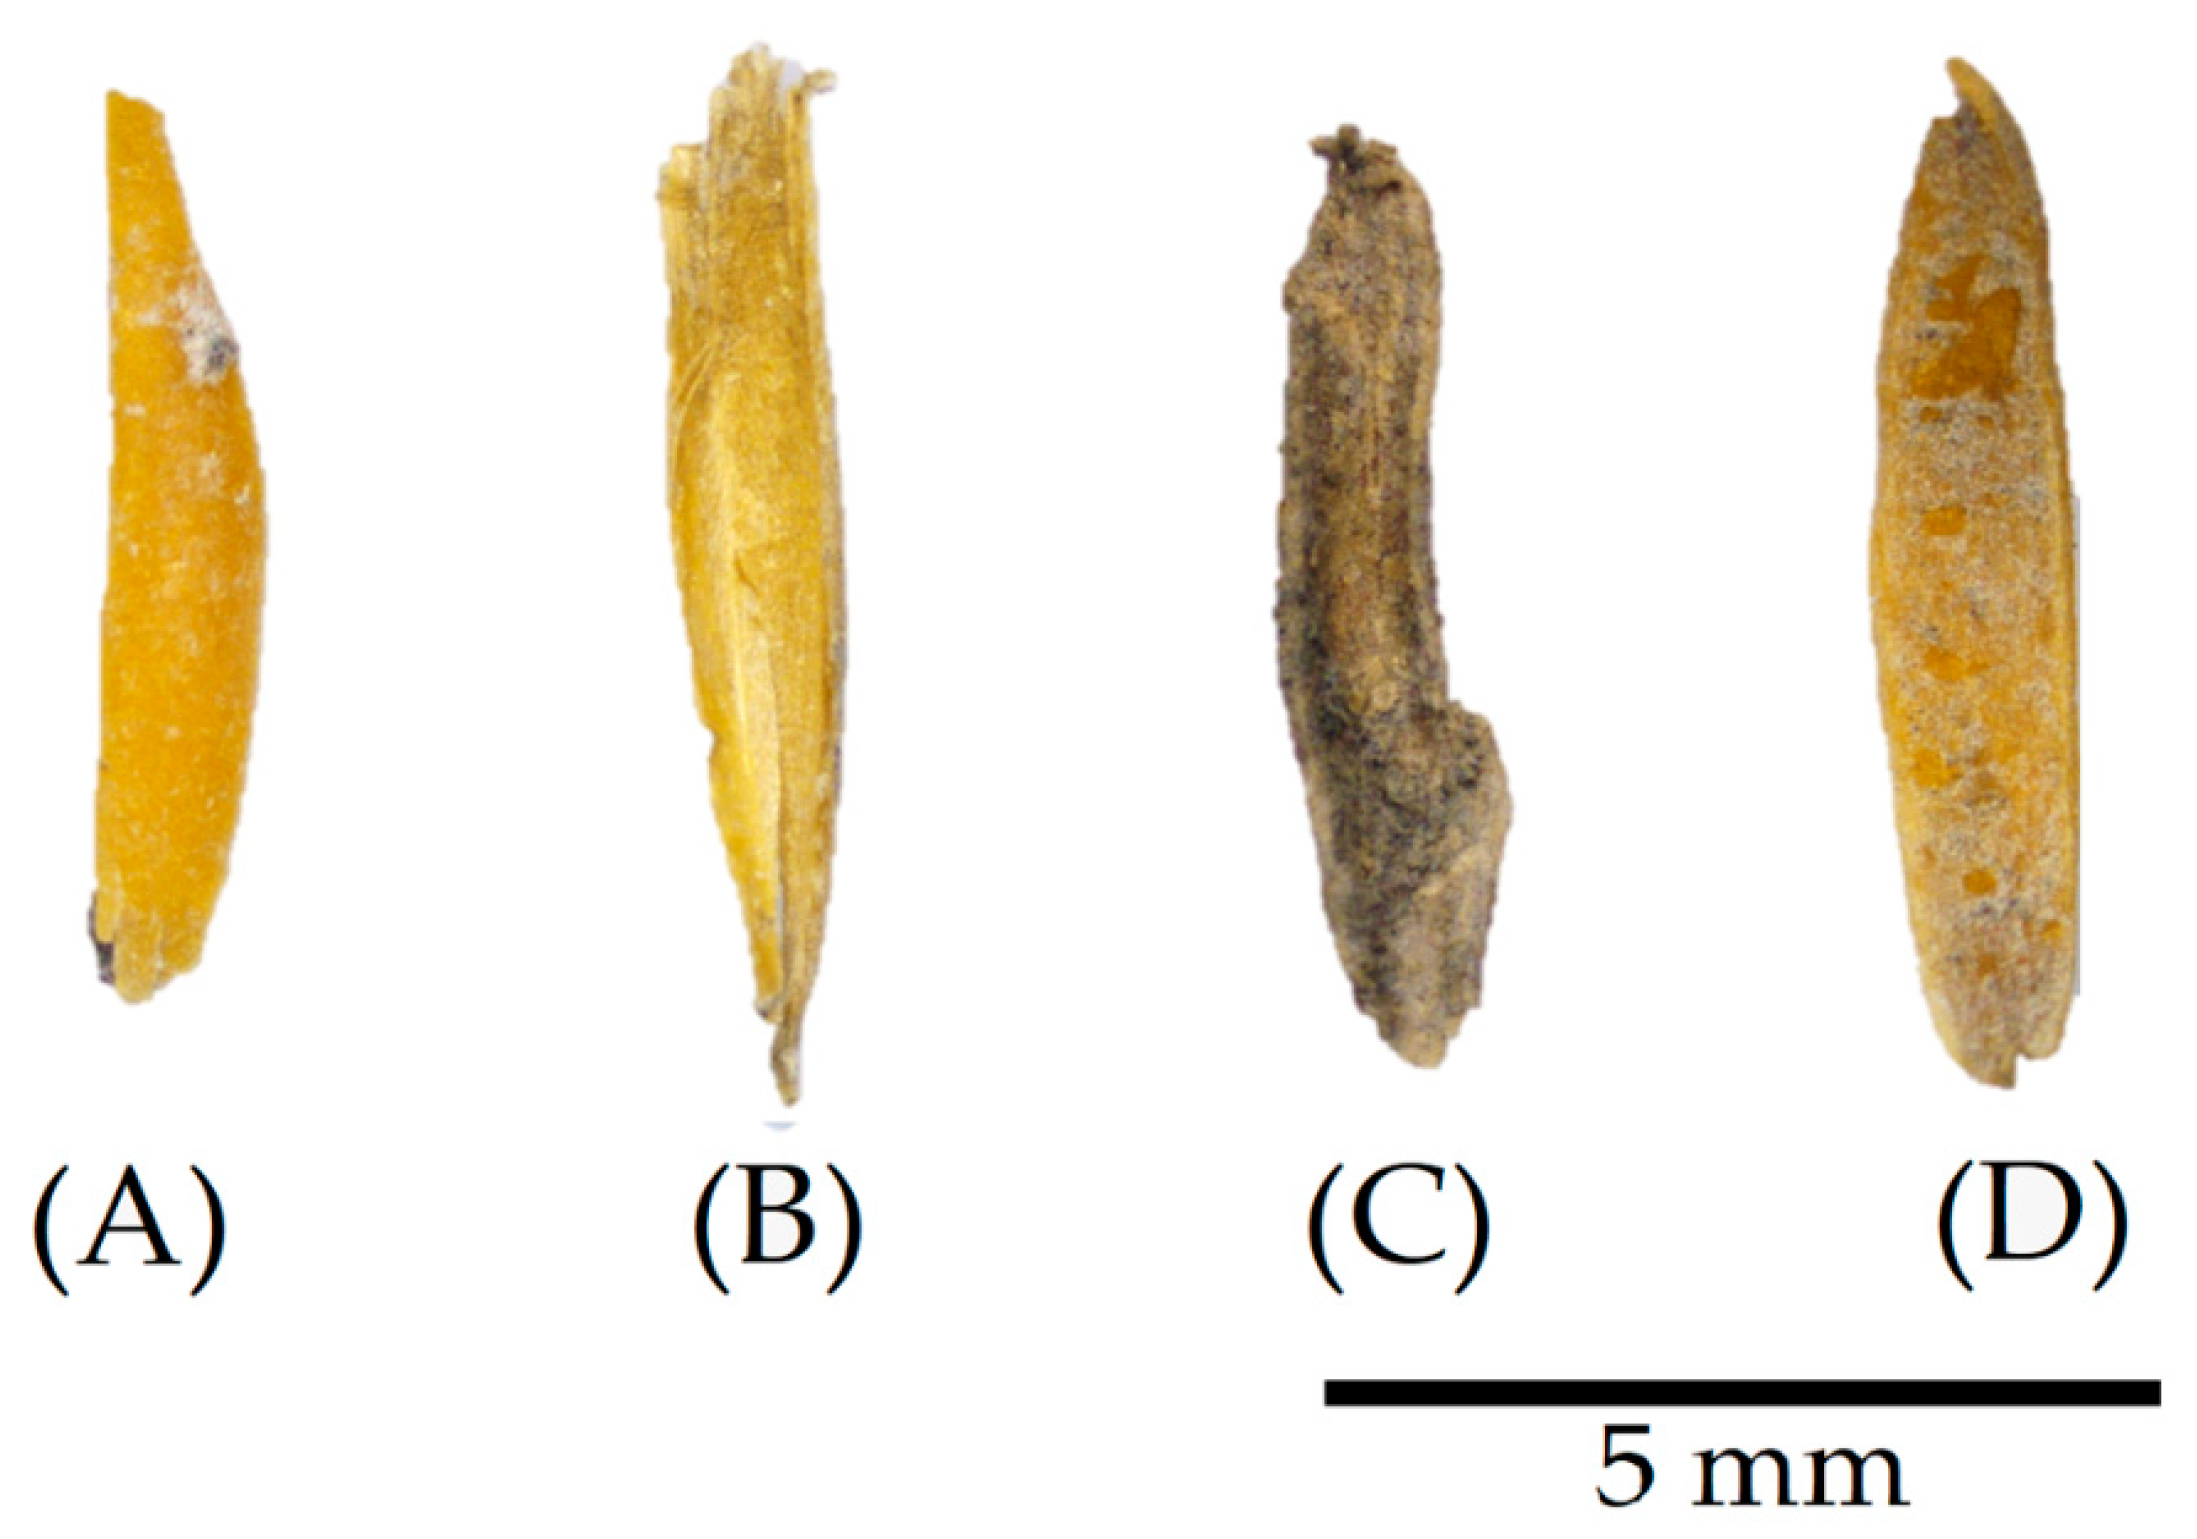
4.4.2. Particle Modification after Use in the Matrix
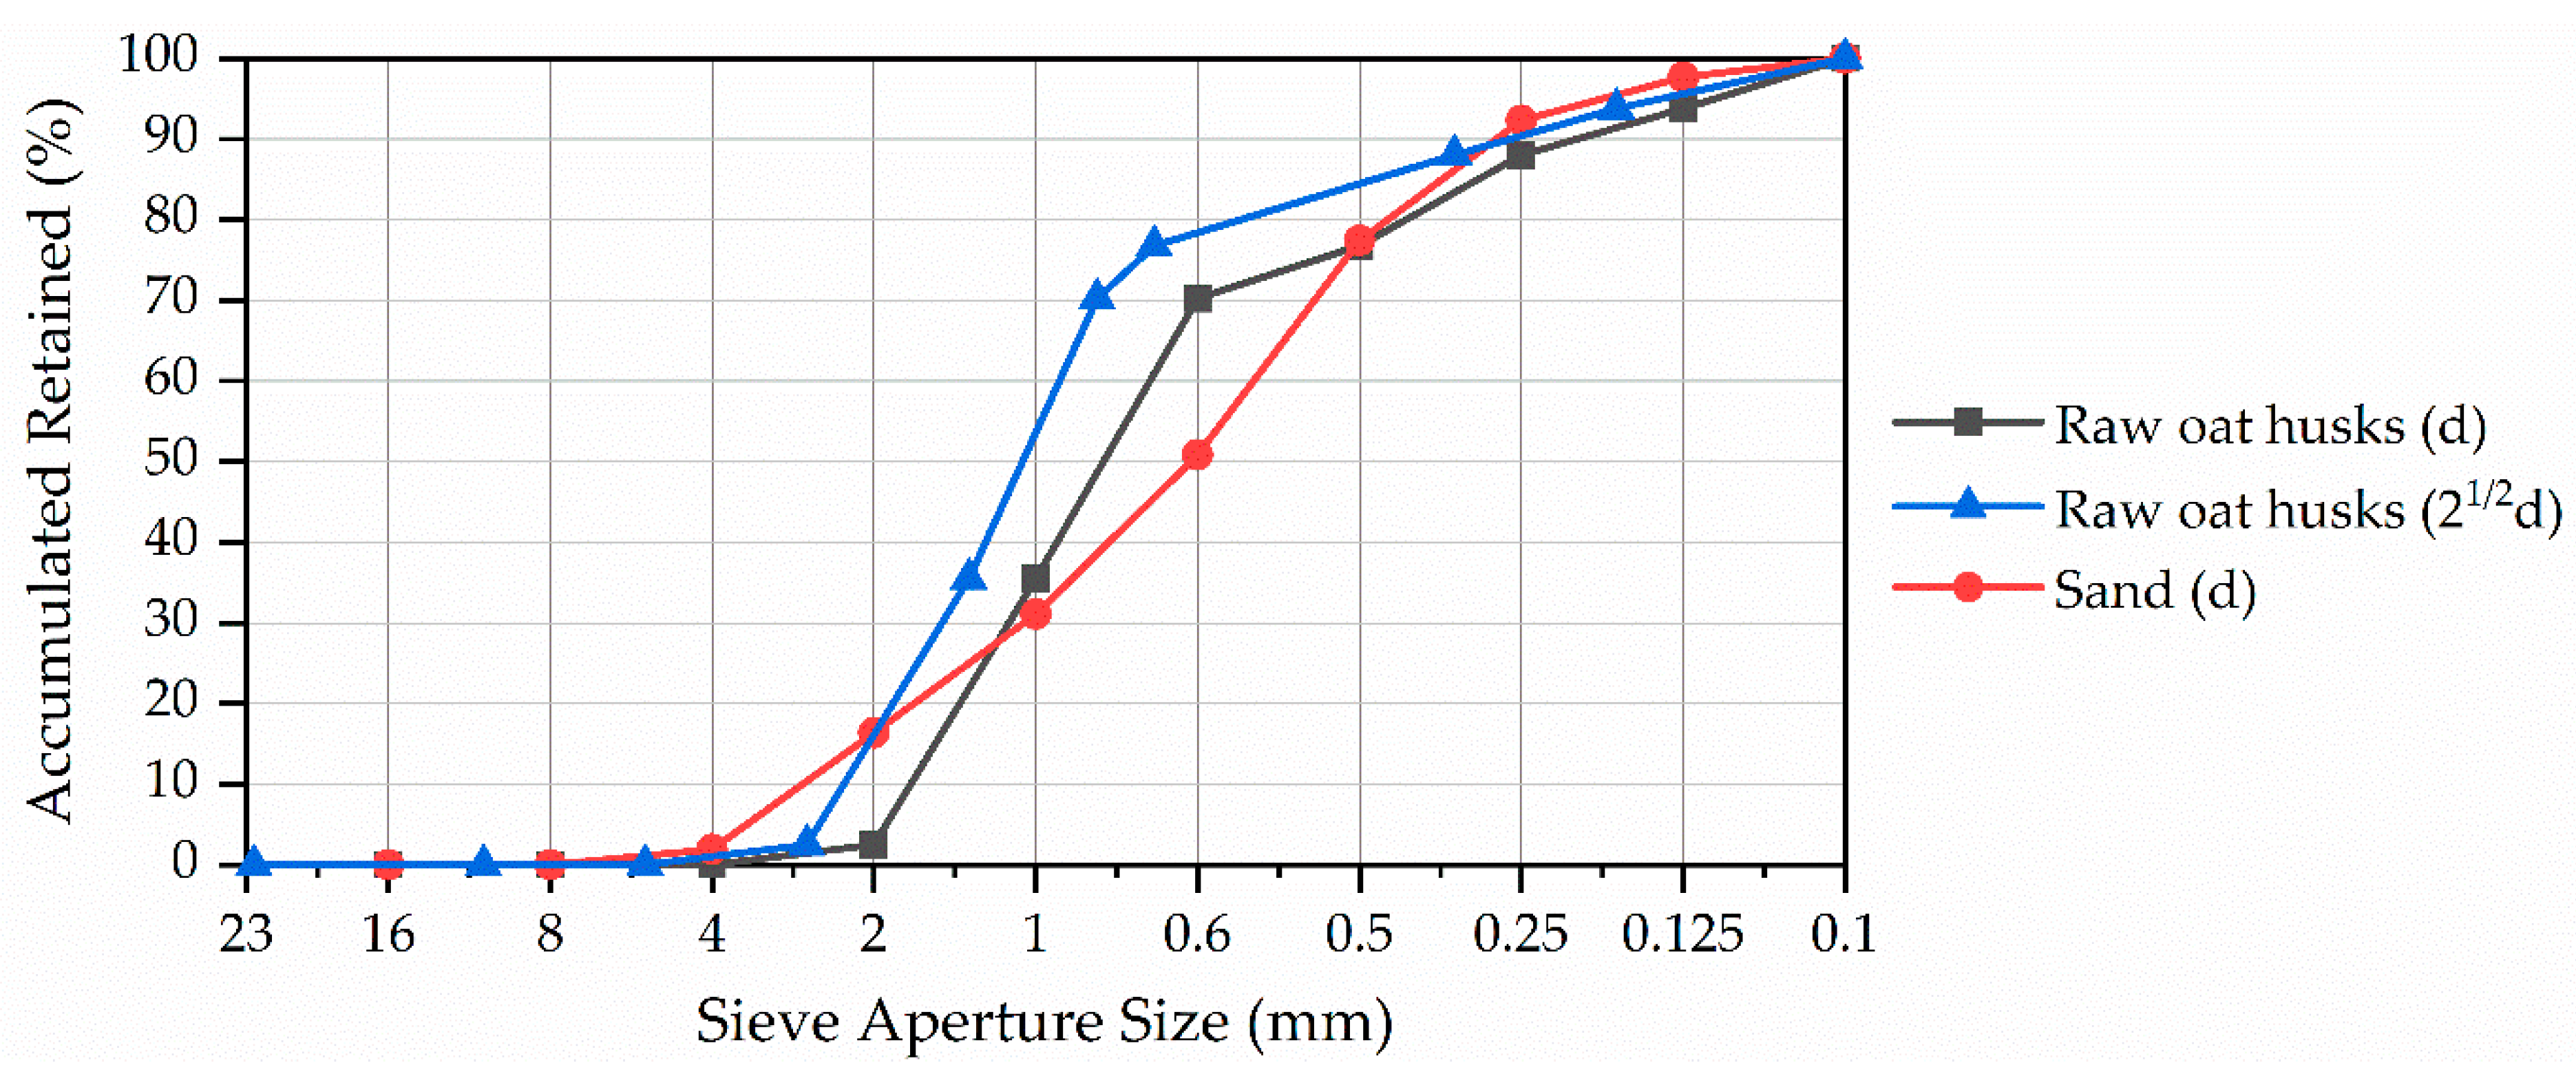
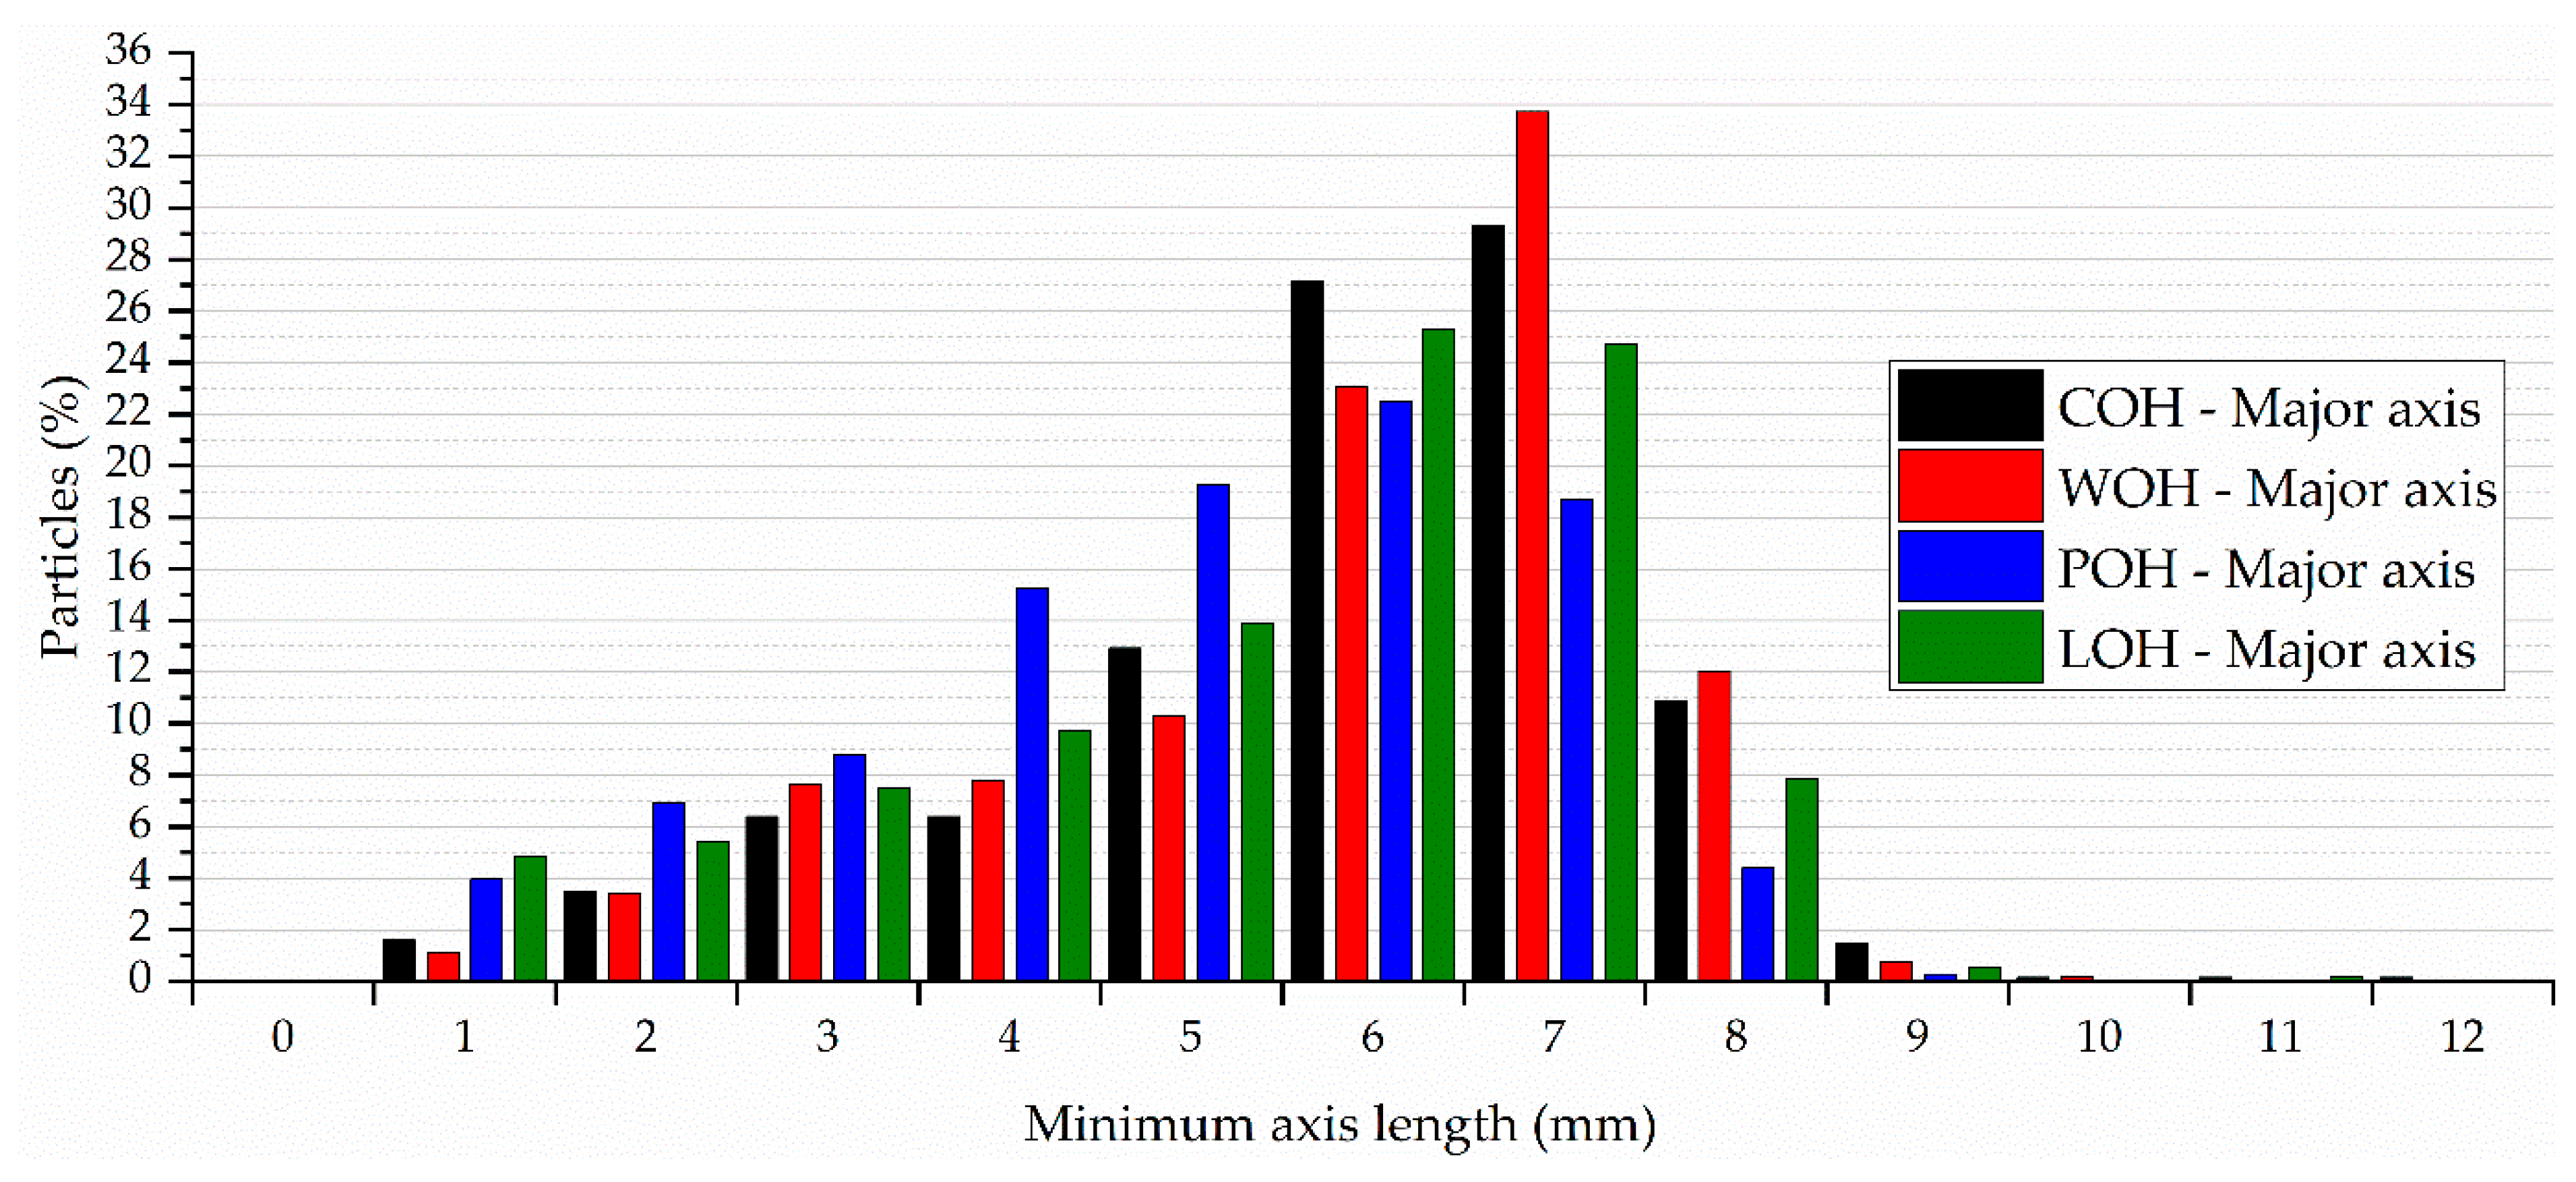
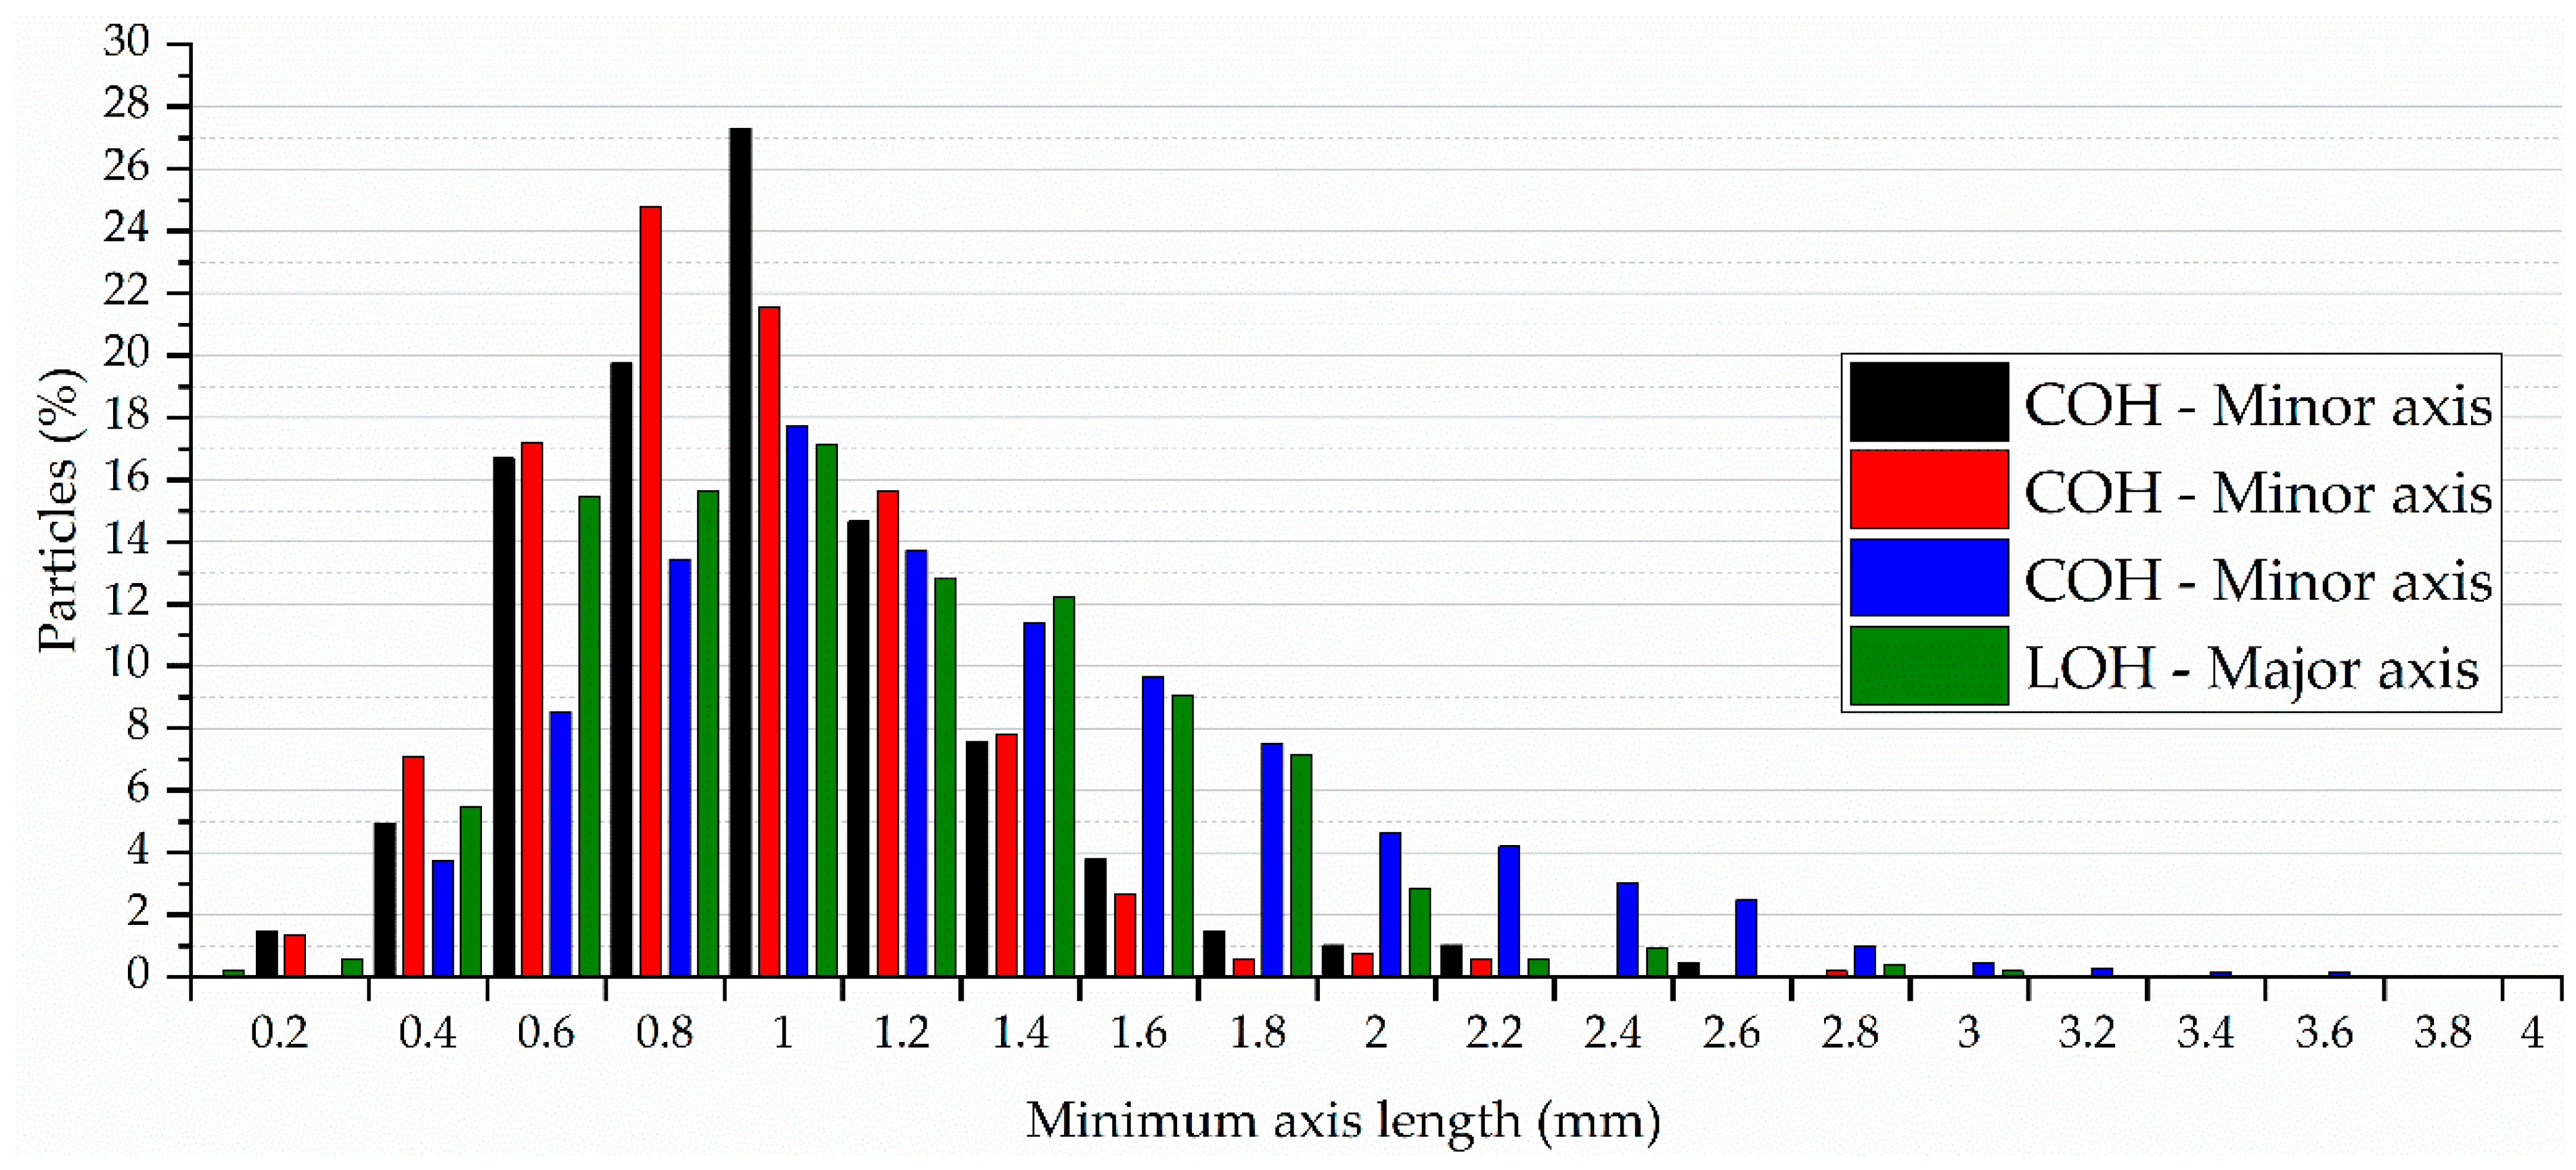
4.5. Aggregate Granulometric Distribution and Bio-Aggregate Physical Characteristics
5. Procedures for Mechanical Analysis of oat Husks as Aggregates in Limestone-Based Composites
5.1. Mixing Procedures and Sample Casting
5.2. Sample Design to Evaluate Surface Treatment Influence
5.3. Sample Design to Evaluate Types and Combinations of Binder Influence
5.4. Sample Design for Assessing Mechanical Performance
5.5. Fresh and Hardened State Mechanical Analysis Methods
5.6. Considerations for Statistical Acceptance of Composite Strength
6. Results and Discussion on Composite Mechanical Analysis
6.1. Surface Treatment Effect
6.2. Binder Type Influence
6.3. Results of Mechanical Tests on Composites in Fresh and Hardened States
7. Conclusions
- Treatments can be effectively carried out on the particles;
- Surface coating (POH and LOH) reduces mass loss during water immersion but increases cement-setting inhibitors;
- Coating (POH and LOH) delays degradation in alkaline solutions but may lead to partial particle degradation and coating removal when used in cement;
- The particles maintain a flat, elongated geometry post-treatment, although their specific density decreases;
- Coating treatment decreases particle water absorption and enhances mortar workability;
- Incorporating a setting accelerator additive enhances composite mechanical behaviour.
Author Contributions
Funding
Institutional Review Board Statement
Informed Consent Statement
Data Availability Statement
Conflicts of Interest
References
- Tkachenko, N.; Tang, K.; McCarten, M.; Reece, S.; Kampmann, D.; Hickey, C.; Bayaraa, M.; Foster, P.; Layman, C.; Rossi, C.; et al. Global Database of Cement Production Assets and Upstream Suppliers. Sci. Data 2023, 10, 696. [Google Scholar] [CrossRef] [PubMed]
- Marvila, M.T.; Rocha, H.A.; de Azevedo, A.R.G.; Colorado, H.A.; Zapata, J.F.; Vieira, C.M.F. Use of Natural Vegetable Fibers in Cementitious Composites: Concepts and Applications. Innov. Infrastruct. Solut. 2021, 6, 180. [Google Scholar] [CrossRef]
- Guo, A.; Sun, Z.; Feng, H.; Shang, H.; Sathitsuksanoh, N. State-of-the-Art Review on the Use of Lignocellulosic Biomass in Cementitious Materials. Sustain. Struct. 2023, 3, 23. [Google Scholar] [CrossRef]
- Elfaleh, I.; Abbassi, F.; Habibi, M.; Ahmad, F.; Guedri, M.; Nasri, M.; Garnier, C. A Comprehensive Review of Natural Fibers and Their Composites: An Eco-Friendly Alternative to Conventional Materials. Results Eng. 2023, 19, 101271. [Google Scholar] [CrossRef]
- European Commission. A Renovation Wave for Europe—Greening Our Buildings, Creating Jobs, Improving Lives. Available online: https://eur-lex.europa.eu/legal-content/EN/TXT/?uri=CELEX%3A52020DC0662 (accessed on 30 August 2023).
- European Parliament. European Parliament Resolution of 14 September 2022 on the New European Bauhaus. Available online: https://policycommons.net/artifacts/11156998/european-parliament-resolution-of-14-september-2022-on-the-new-european-bauhaus-20212255ini/12035769 (accessed on 30 August 2023).
- Viel, M.; Collet, F.; Lanos, C. Development and Characterization of Thermal Insulation Materials from Renewable Resources. Constr. Build. Mater. 2019, 214, 685–697. [Google Scholar] [CrossRef]
- Ehsan Samaei, S.; Berardi, U.; Taban, E.; Soltani, P.; Mohammad Mousavi, S. Natural Fibro-Granular Composite as a Novel Sustainable Sound-Absorbing Material. Appl. Acoust. 2021, 181, 108157. [Google Scholar] [CrossRef]
- Li, Q.; Ibrahim, L.; Zhou, W.; Zhang, M.; Yuan, Z. Treatment Methods for Plant Fibers for Use as Reinforcement in Cement-Based Materials. Cellulose 2021, 28, 5257–5268. [Google Scholar] [CrossRef]
- Bonifacio, A.L.; Archbold, P. Impact of Oat Husk Extracts on Mid-Stage Cement Hydration and the Mechanical Strength of Mortar. Constr. Mater. 2024, 4, 91–109. [Google Scholar] [CrossRef]
- Burrows, V.D. Hulless Oat Development, Applications, and Opportunities. In Oats: Chemistry and Technology, 2nd ed.; Elsevier Inc.: Amsterdam, Switzerland, 2011; pp. 31–50. ISBN 9780128104521. [Google Scholar]
- FAOSTAT. Food and Agriculture Organization of the United Nations. Available online: https://www.fao.org/faostat/en/#data/QCL (accessed on 3 January 2024).
- Hackett, R. A Comparison of Husked and Naked Oats under Irish Conditions. Ir. J. Agric. Food Res. 2018, 57, 1–8. [Google Scholar] [CrossRef]
- Martínez-Toledo, C.; Valdés-Vidal, G.; Calabi-Floody, A.; González, M.E.; Reyes-Ortiz, O. Effect of Biochar from Oat Hulls on the Physical Properties of Asphalt Binder. Materials 2022, 15, 7000. [Google Scholar] [CrossRef]
- Gil Giraldo, G.A.; Mantovan, J.; Marim, B.M.; Kishima, J.O.F.; Mali, S. Surface Modification of Cellulose from Oat Hull with Citric Acid Using Ultrasonication and Reactive Extrusion Assisted Processes. Polysaccharides 2021, 2, 218–233. [Google Scholar] [CrossRef]
- Varanda, L.D.; do Nascimento, M.F.; Christoforo, A.L.; Silva, D.A.L.; Lahr, F.A.R. Oat Hulls as Addition to High Density Panels Production. Mater. Res. 2013, 16, 1355–1361. [Google Scholar] [CrossRef]
- Bonifacio, A.L.; Archbold, P. The Effect of Calcination Conditions on Oat Husk Ash Pozzolanic Activity. Mater. Today Proc. 2022, 65, 622–628. [Google Scholar] [CrossRef]
- Ruviaro, A.S.; dos Santos Lima, G.T.; Silvestro, L.; Barraza, M.T.; Rocha, J.C.; de Brito, J.; Gleize, P.J.P.; Pelisser, F. Characterization and Investigation of the Use of Oat Husk Ash as Supplementary Cementitious Material as Partial Replacement of Portland Cement: Analysis of Fresh and Hardened Properties and Environmental Assessment. Constr. Build. Mater. 2023, 363, 129762. [Google Scholar] [CrossRef]
- Welch, R.W.; Hayward, M.V.; Jones, D.I.H. The Composition of Oat Husk and Its Variation Due to Genetic and Other Factors. J. Sci. Food Agric. 1983, 34, 417–426. [Google Scholar] [CrossRef]
- Schmitz, E.; Nordberg Karlsson, E.; Adlercreutz, P. Warming Weather Changes the Chemical Composition of Oat Hulls. Plant Biol. 2020, 22, 1086–1091. [Google Scholar] [CrossRef] [PubMed]
- Wang, L.; Lenorm, H.; Zmamou, H.; Leblanc, N. Effect of Soluble Components from Plant Aggregates on the Setting of the Lime-Based Binder. J. Renew. Mater. 2019, 7, 903–913. [Google Scholar] [CrossRef]
- Aggarwal, L.K.; Singh, J. Effect of Plant Fibre Extractives on Properties of Cement. Cem. Concr. Compos. 1990, 12, 103–108. [Google Scholar] [CrossRef]
- Ferreira, S.R.; Lima PR, L.; Silva, F.A.; Toledo Filho, R.D. Influência de Ciclos Molhagem-Secagem Em Fibras de Sisal Sobre a Aderência Com Matrizes de Cimento Portland Effect of Sisal Fiber Hornification on the Adhesion with Portland Cement Matrices. Matéria 2012, 17, 1024–1034. [Google Scholar]
- Claramunt, J.; Ardanuy, M.; García-Hortal, J.A.; Filho, R.D.T. The Hornification of Vegetable Fibers to Improve the Durability of Cement Mortar Composites. Cem. Concr. Compos. 2011, 33, 586–595. [Google Scholar] [CrossRef]
- Ferreira, S.R.; Silva, F.D.A.; Lima, P.R.L.; Toledo Filho, R.D. Effect of Fiber Treatments on the Sisal Fiber Properties and Fiber-Matrix Bond in Cement Based Systems. Constr. Build. Mater. 2015, 101, 730–740. [Google Scholar] [CrossRef]
- Monreal, P.; Mboumba-Mamboundou, L.B.; Dheilly, R.M.; Quéneudec, M. Effects of Aggregate Coating on the Hygral Properties of Lignocellulosic Composites. Cem. Concr. Compos. 2011, 33, 301–308. [Google Scholar] [CrossRef]
- Page, J.; Khadraoui, F.; Gomina, M.; Boutouil, M. Hydration of Flax Fibre-Reinforced Cementitious Composites: Influence of Fibre Surface Treatments. Eur. J. Environ. Civ. Eng. 2022, 26, 5798–5820. [Google Scholar] [CrossRef]
- Kabir, M.M.; Wang, H.; Lau, K.T.; Cardona, F. Chemical Treatments on Plant-Based Natural Fibre Reinforced Polymer Composites: An Overview. Compos. B Eng. 2012, 43, 2883–2892. [Google Scholar] [CrossRef]
- da Costa Santos, A.C.; Archbold, P. Suitability of Surface-Treated Flax and Hemp Fibers for Concrete Reinforcement. Fibers 2022, 10, 101. [Google Scholar] [CrossRef]
- Forster, A. How Hydraulic Binders Work-Hydraulicity for Beginners and the Hydraulic Lime Family; Love Your Building Publishing: Edinburgh, UK, 2018. [Google Scholar]
- Tronet, P.; Lecompte, T.; Picandet, V.; Baley, C. Study of Lime Hemp Concrete (LHC)—Mix Design, Casting Process and Mechanical Behaviour. Cem. Concr. Compos. 2016, 67, 60–72. [Google Scholar] [CrossRef]
- Stella Mary, F.; Nithambigai, G.; Rameshwaran, P.M. Effect of Binders and Hemp Fibre in Concrete. In Materials Today: Proceedings; Elsevier Ltd.: Amsterdam, The Netherlands, 2020; Volume 46, pp. 3791–3794. [Google Scholar]
- dos Santos, W.J.; Alvarenga, R.d.C.S.S.; Pedroti, L.G.; da Silva, R.C.; Freire, A.S.; de Moraes, B.A.; Carvalho, C.C. Proposta de Método de Dosagem Para Argamassas de Revestimento Com Areia Artificial de Britagem. Ambiente Construído 2018, 18, 225–243. [Google Scholar] [CrossRef]
- Cao, G.; Liu, Y.; Long, S.; Deng, D.; Jiang, S.; Su, H.; Tan, T. Influence of Aggregate Shape on the Flow Properties of Fresh Concrete. Powder Technol. 2023, 415, 118186. [Google Scholar] [CrossRef]
- Ponnada, M.R. Combined Effect of Flaky and Elongated Aggregates on Strength and Workability of Concrete. Int. J. Struct. Eng. 2014, 5, 314–325. [Google Scholar] [CrossRef]
- Amziane, S.; Collet, F.; Lawrence, M.; Magniont, C.; Picandet, V.; Sonebi, M. Recommendation of the RILEM TC 236-BBM: Characterisation Testing of Hemp Shiv to Determine the Initial Water Content, Water Absorption, Dry Density, Particle Size Distribution and Thermal Conductivity. Mater. Struct. 2017, 50, 167. [Google Scholar] [CrossRef]
- BS EN 933-1; Tests for Geometrical Properties of Aggregates. Part 1, Determination of Particle Size Distribution—Sieving Method. British Standards Institution: Loughborough, UK, 2012.
- BS EN 197-1; Cement Composition, Specifications and Conformity Criteria for Common Cements. British Standards Institution: Loughborough, UK, 2011.
- BS EN 459-1; Building Lime—Part 1: Definitions, Specifications and Conformity Criteria. British Standards Institution: Loughborough, UK, 2015.
- BS EN 13139; Aggregates for Mortar. British Standards Institution: Loughborough, UK, 2013.
- De Limoges, U.; Sedan, D.; St, E.; Jérôme, C.; Krausz, P. Etudes Des Interactions Physico-Chimiques Aux Interfaces Fibres de Chanvre/Ciment: Influence Sur Les Propriétés Mécaniques Du Composite; Universite de Limoges: Limoges, France, 2007. [Google Scholar]
- Lazzari, M.; Chiantore, O. Drying and Oxidative Degradation of Linseed Oil. Polym. Degrad. Stab. 1999, 65, 303–313. [Google Scholar] [CrossRef]
- Page, J.; Amziane, S.; Gomina, M. Optimization of the Linseed Oil Treatment of Flax Fibres: Influence on Fresh Properties of Fibre-Reinforced Mortars. Acad. J. Civ. Eng. 2019, 37, 73–79. [Google Scholar] [CrossRef]
- Sumra, Y.; Payam, S.; Zainah, I. The PH of Cement-Based Materials: A Review. J. Wuhan Univ. Technol. Mater. Sci. Ed. 2020, 35, 908–924. [Google Scholar] [CrossRef]
- BS EN 196-3; Methods of Testing Cement—Part 3: Determination of Setting Times and Soundness. British Standards Institution: Loughborough, UK, 2016.
- Wagner, T.; Lipinski, H.-G. IJBlob: An ImageJ Library for Connected Component Analysis and Shape Analysis. J. Open Res. Softw. 2013, 1, e6. [Google Scholar] [CrossRef]
- Takashimizu, Y.; Iiyoshi, M. New Parameter of Roundness R: Circularity Corrected by Aspect Ratio. Prog. Earth Planet. Sci. 2016, 3, 2. [Google Scholar] [CrossRef]
- Sreekala, M.S.; Kumaran, M.G.; Joseph, S.; Jacob, M. Oil Palm Fibre Reinforced Phenol. Formaldehyde Composites: Influence of Fibre Surface Modifications on the Mechanical Performance. Appl. Compos. Mater. 2000, 7, 295–329. [Google Scholar] [CrossRef]
- De Viguerie, L.; Payard, P.A.; Portero, E.; Walter, P.; Cotte, M. The Drying of Linseed Oil Investigated by Fourier Transform Infrared Spectroscopy: Historical Recipes and Influence of Lead Compounds. Prog. Org. Coatings 2016, 93, 46–60. [Google Scholar] [CrossRef]
- Ylmén, R.; Jäglid, U. Carbonation of Portland Cement Studied by Diffuse Reflection Fourier Transform Infrared Spectroscopy. Int. J. Concr. Struct. Mater. 2013, 7, 119–125. [Google Scholar] [CrossRef]
- Dai, D.; Fan, M. Characteristic and Performance of Elementary Hemp Fibre. Mater. Sci. Appl. 2010, 01, 336–342. [Google Scholar] [CrossRef]
- Mollah, M.Y.A.; Yu, W.; Schennach, R.; Cocke, D.L. A Fourier Transform Infrared Spectroscopic Investigation of the Early Hydration of Portland Cement and the Influence of Sodium Lignosulfonate. Cem. Concr. Res. 2000, 30, 267–273. [Google Scholar] [CrossRef]
- Kaeurakova, M.; Ebringerova, A.; Hirsch, J.; Hromadkova, Z. Infrared Study of Arabinoxylans. J. Sci. Food Agric. 1994, 66, 423–427. [Google Scholar] [CrossRef]
- Etale, A.; Onyianta, A.J.; Turner, S.R.; Eichhorn, S.J. Cellulose: A Review of Water Interactions, Applications in Composites, and Water Treatment. Chem. Rev. 2023, 123, 2016–2048. [Google Scholar] [CrossRef] [PubMed]
- Sawsen, C.; Fouzia, K.; Mohamed, B.; Moussa, G. Effect of Flax Fibers Treatments on the Rheological and the Mechanical Behavior of a Cement Composite. Constr. Build. Mater. 2015, 79, 229–235. [Google Scholar] [CrossRef]
- ASTM D6942-03; Standard Test Method for Stability of Cellulose Fibers in Alkaline Environments. American Society for Testing and Materials: West Conshohocken, PA, USA, 2010.
- Chaudhary, S.K.; Kurmaiah, N.; Ghoshal, B.T.; Estimator, H.; Railway, S. Performance of Concrete Exposed to Corrosive Environment. In Proceedings of the National Seminar on Corrosion and Its Prevention; National Metallurgical Laboratory, Jamshedpur, India, 8 December 2021; pp. 34–38. [Google Scholar]
- Friedman, M.; Wolf, R. Chemistry of Soaps and Detergents: Various Types of Commercial Products and Their Ingredients. Clin. Dermatol. 1996, 14, 7–13. [Google Scholar] [CrossRef] [PubMed]
- Tugrul Albayrak, A.; Yasar, M.; Gurkaynak, M.A.; Gurgey, I. Investigation of the Effects of Fatty Acids on the Compressive Strength of the Concrete and the Grindability of the Cement. Cem. Concr. Res. 2005, 35, 400–404. [Google Scholar] [CrossRef]
- Neitzel, N.; Eder, M.; Hosseinpourpia, R.; Walther, T.; Adamopoulos, S. Chemical Composition, Particle Geometry, and Micro-Mechanical Strength of Barley Husks, Oat Husks, and Wheat Bran as Alternative Raw Materials for Particleboards. Mater. Today Commun. 2023, 36, 106602. [Google Scholar] [CrossRef]
- Page, J.; Amziane, S.; Gomina, M.; Djelal, C.; Audonnet, F. Using Linseed Oil as Flax Fibre Coating for Fibre-Reinforced Cementitious Composite. Ind. Crop. Prod. 2021, 161, 113168. [Google Scholar] [CrossRef]
- BS EN 196-1; Methods of Testing Cement Part 1: Determination of Strength. British Standards Institution: Loughborough, UK, 2016.
- Walker, R.; Pavía, S. Moisture Transfer and Thermal Properties of Hemp-Lime Concretes. Constr. Build. Mater. 2014, 64, 270–276. [Google Scholar] [CrossRef]
- BSEN 1015-3; Methods of Test for Mortar for Masonry—Part 3: Determination of Consistence of Fresh Mortar (by Flow Table). British Standards Institution: Loughborough, UK, 2001.
- ACI Committee 214; American Concrete Institute. Guide to Evaluation of Strength Test Results of Concrete; American Concrete Institute: Farmington Hills, MI, USA, 2011; ISBN 9780870314230. [Google Scholar]
- Tavares, L.R.C.; Junior, J.F.T.; Costa, L.M.; da Silva Bezerra, A.C.; Cetlin, P.R.; Aguilar, M.T.P. Influence of Quartz Powder and Silica Fume on the Performance of Portland Cement. Sci. Rep. 2020, 10, 21461. [Google Scholar] [CrossRef]
- Wang, Y.; Lei, L.; Liu, J.; Ma, Y.; Liu, Y.; Xiao, Z.; Shi, C. Accelerators for Normal Concrete: A Critical Review on Hydration, Microstructure and Properties of Cement-Based Materials. Cem. Concr. Compos. 2022, 134, 104762. [Google Scholar] [CrossRef]


| Sample | COH | WOH | POH | LOH |
|---|---|---|---|---|
| Mass removal (%) | 15.44 | 1.85 | 9.38 | 3.40 |
| S.D | 0.0859 | 0.0618 | 0.3099 | 0.2590 |
| Sample | Exposure (Days) | Mass Removed (%) | Standard Deviation | Difference from COH (%) | pH |
|---|---|---|---|---|---|
| COH | 7 | 31.2 | 1.090 | 0.00 | 13 |
| WOH | 7 | 31.6 | 1.116 | 1.21 | 13 |
| POH | 7 | 26.4 | 0.357 | −15.54 | 13 |
| LOH | 7 | 38.1 | 0.846 | 22.17 | 13 |
| COH | 28 | 35.8 | 0.625 | 0.00 | 13 |
| WOH | 28 | 34.7 | 0.497 | −2.89 | 13 |
| POH | 28 | 51.1 | 2.116 | 42.71 | 13 |
| LOH | 28 | 49.7 | 1.037 | 39.02 | 13 |
| Leached Sample | Initial Setting Time | C.I | Final Setting Time | C.I |
|---|---|---|---|---|
| (Hour:Minute:Second) | 95% | (Hour:Minute:Second) | 95% | |
| Control | 02:19:02 | ±00:14:21 | 02:36:59 | ±00:18:18 |
| COH | 02:39:21 | ±00:19:03 | 03:26:48 | ±00:10:32 |
| WOH | 02:23:11 | ±00:12:13 | 03:09:51 | ±00:06:48 |
| POH | 02:58:30 | ±00:19:06 | 03:51:50 | ±00:12:25 |
| LOH | 02:39:17 | ±00:10:12 | 03:35:57 | ±00:16:08 |
| Aggregate | Axis | Dimension | |||
|---|---|---|---|---|---|
| Major (mm) | Minor (mm) | Transversal (mm) | Area (mm2) | Theoretical Volume (mm3) | |
| COH | 6.413 | 1.077 | 0.128 | 5.487 | 0.138 |
| WOH | 6.408 | 1.033 | 0.115 | 5.267 | 0.119 |
| POH | 5.544 | 1.415 | 0.127 | 6.386 | 0.180 |
| LOH | 5.902 | 1.213 | 0.155 | 5.831 | 0.188 |
| Aggregate | Shape Descriptors | ||
|---|---|---|---|
| Circularity (0 to 1) | Aspect Ratio (0 to ∞) | Roundness (0 to 1) | |
| COH | 0.261 | 6.514 | 0.185 |
| WOH | 0.261 | 6.796 | 0.178 |
| POH | 0.297 | 4.43 | 0.282 |
| LOH | 0.313 | 5.632 | 0.236 |
| Aggregate | Bulk Density | Specific Density | Initial Moisture | Water Absorption after 24 h | ||||
|---|---|---|---|---|---|---|---|---|
| kg/m3 | C.V | ratio | C.V | % | C.V | % | C.V | |
| Sand | 1853.17 | 3.94 | 2.56 | 1.11 | 15.72 | 4.53 | 12.30 | 0.73 |
| COH | 236.94 | 3.53 | 1.268 | 3.29 | 8.36 | 0.84 | 57.22 | 2.68 |
| WOH | 235.67 | 2.09 | 1.238 | 2.75 | 14.71 | 0.21 | 103.84 | 2.70 |
| POH | 373.13 | 0.97 | 1.219 | 2.95 | 44.32 | 0.36 | 37.50 | 3.76 |
| LOH | 230.04 | 1.26 | 1.123 | 2.84 | 8.41 | 0.22 | 10.511 | 1.402 |
| Sample | Husk | Sand | COH | WOH | POH | LOH | CEM I | Water | Additional Water | Aggregates /Binder |
|---|---|---|---|---|---|---|---|---|---|---|
| % | kg/m3 | kg/m3 | kg/m3 | kg/m3 | kg/m3 | kg/m3 | kg/m3 | kg/m3 | ratio | |
| Control | 0 | 1252 | 0 | 0 | 0 | 0 | 417 | 209 | 0 | 3.0 |
| T_COH | 50 | 626 | 80 | 0 | 0 | 0 | 417 | 209 | 46 | 1.7 |
| P_COH | 33 | 839 | 53 | 0 | 0 | 0 | 417 | 209 | 30 | 2.1 |
| P_WOH | 33 | 839 | 0 | 53 | 0 | 0 | 417 | 209 | 30 | 2.1 |
| P_POH | 33 | 839 | 0 | 0 | 83 | 0 | 417 | 209 | 31 | 2.2 |
| P_LOH | 33 | 839 | 0 | 0 | 0 | 51 | 417 | 209 | 5 | 2.1 |
| F_COH | 100 | 0 | 160 | 0 | 0 | 0 | 417 | 209 | 92 | 0.4 |
| F_WOH | 100 | 0 | 0 | 159 | 0 | 0 | 417 | 209 | 91 | 0.4 |
| F_POH | 100 | 0 | 0 | 0 | 252 | 0 | 417 | 209 | 95 | 0.6 |
| F_LOH | 100 | 0 | 0 | 0 | 0 | 155 | 417 | 209 | 16 | 0.4 |
| Sample | Husk | Sand | COH | CEM I | SiO2 | Ca(OH)2 | NHL 5 | Water | Additional Water | Aggregates /Binder |
|---|---|---|---|---|---|---|---|---|---|---|
| % | kg/m3 | kg/m3 | kg/m3 | kg/m3 | kg/m3 | kg/m3 | kg/m3 | kg/m3 | ratio | |
| C_RHPC | 0 | 1252 | 0 | 417 | 0 | 0 | 0 | 209 | 0 | 3.0 |
| C_RHPC_SiO2 | 0 | 1252 | 0 | 376 | 24 | 0 | 0 | 209 | 0 | 3.1 |
| C_RHPC_Ca(OH)2 | 0 | 0 | 0 | 129 | 0 | 370 | 167 | 644 | 0 | 0.0 |
| C_Ca(OH)2_SiO2 | 0 | 0 | 0 | 0 | 73 | 370 | 167 | 644 | 0 | 0.0 |
| P_RHPC | 33 | 1252 | 0 | 417 | 0 | 0 | 0 | 209 | 30 | 2.1 |
| P_RHPC_SiO2 | 33 | 839 | 53 | 376 | 24 | 0 | 0 | 209 | 30 | 2.2 |
| P_RHPC_Ca(OH)2 | 33 | 0 | 53 | 129 | 0 | 370 | 167 | 644 | 30 | 0.1 |
| P_Ca(OH)2_SiO2 | 33 | 0 | 53 | 0 | 73 | 370 | 167 | 644 | 30 | 0.1 |
| F_RHPC | 100 | 0 | 160 | 417 | 0 | 0 | 0 | 209 | 92 | 0.4 |
| F_RHPC_SiO2 | 100 | 0 | 160 | 376 | 24 | 0 | 0 | 209 | 92 | 0.4 |
| F_RHPC_Ca(OH)2 | 100 | 0 | 160 | 129 | 0 | 370 | 167 | 644 | 92 | 0.2 |
| F_Ca(OH)2_SiO2 | 100 | 0 | 160 | 0 | 73 | 370 | 167 | 644 | 92 | 0.2 |
| Sample | Sand | COH | CEM I | Water | Additional Water | Additive |
|---|---|---|---|---|---|---|
| A_B_C | kg/m3 | kg/m3 | kg/m3 | kg/m3 | kg/m3 | kg/m3 |
| 45_0_0 | 1252 | 0 | 417 | 188 | 0 | 0 |
| 45_0_12 | 1252 | 0 | 417 | 138 | 0 | 50 |
| 45_0_20 | 1252 | 0 | 417 | 104 | 0 | 83 |
| 45_50_0 | 626 | 80 | 417 | 188 | 46 | 0 |
| 45_50_12 | 626 | 80 | 417 | 138 | 46 | 50 |
| 45_50_20 | 626 | 80 | 417 | 104 | 72 | 83 |
| 45_100_0 | 0 | 160 | 417 | 188 | 92 | 0 |
| 45_100_12 | 0 | 160 | 417 | 138 | 91 | 50 |
| 45_100_20 | 0 | 160 | 417 | 104 | 144 | 83 |
| 50_0_0 | 1252 | 0 | 417 | 209 | 0 | 0 |
| 50_0_12 | 1252 | 0 | 417 | 159 | 0 | 50 |
| 50_0_20 | 1252 | 0 | 417 | 125 | 0 | 83 |
| 50_50_0 | 626 | 80 | 417 | 209 | 46 | 0 |
| 50_50_12 | 626 | 80 | 417 | 159 | 46 | 50 |
| 50_50_20 | 626 | 80 | 417 | 125 | 72 | 83 |
| 50_100_0 | 0 | 160 | 417 | 209 | 92 | 0 |
| 50_100_12 | 0 | 160 | 417 | 159 | 91 | 50 |
| 50_100_20 | 0 | 160 | 417 | 125 | 144 | 83 |
| 60_0_0 | 1252 | 0 | 417 | 250 | 0 | 0 |
| 60_0_12 | 1252 | 0 | 417 | 200 | 0 | 50 |
| 60_0_20 | 1252 | 0 | 417 | 167 | 0 | 83 |
| 60_50_0 | 626 | 80 | 417 | 250 | 46 | 0 |
| 60_50_12 | 626 | 80 | 417 | 200 | 46 | 50 |
| 60_50_20 | 626 | 80 | 417 | 167 | 72 | 83 |
| 60_100_0 | 0 | 160 | 417 | 250 | 92 | 0 |
| 60_100_12 | 0 | 160 | 417 | 200 | 91 | 50 |
| 60_100_20 | 0 | 160 | 417 | 167 | 144 | 83 |
| Sample | husk | Slump | Specific Gravity | Rc, 28 Days | Rf, 28 Days | ||||||||
|---|---|---|---|---|---|---|---|---|---|---|---|---|---|
| % | mm | C.D (%) | S.D | g/cm3 | C.D (%) | S.D | MPa | C.D (%) | S.D | MPa | C.D (%) | S.D | |
| Standard | 137 | 0.202 | |||||||||||
| Control | 0 | 141 | +3.3 | 2.621 | 2.19 | 0.007 | 48.59 | 2.720 | 10.28 | 0.685 | |||
| T_COH | 50 | 144 | +5.3 | 1.966 | 1.71 | −21.9 | 0.003 | 9.96 | −79.5 | 0.705 | 3.67 | −64.3 | 0.464 |
| P_COH | 33 | 132 | −3.4 | 2.621 | 3.87 | +76.4 | 1.715 | 11.19 | −77.0 | 0.687 | 4.15 | −59.6 | 0.389 |
| P_WOH | 33 | 77 | −43.9 | 1.099 | 2.75 | +25.6 | 0.037 | 10.60 | −78.2 | 0.644 | 3.60 | −65.0 | 0.384 |
| P_POH | 33 | 161 | +17.6 | 3.807 | 3.41 | +55.5 | 1.289 | 12.55 | −74.2 | 0.829 | 4.37 | −57.5 | 0.189 |
| P_LOH | 33 | 173 | +26.5 | 3.490 | 3.26 | +48.6 | 0.702 | 14.79 | −69.6 | 0.911 | 4.08 | −60.3 | 0.291 |
| F_COH | 100 | 106 | −22.1 | 1.291 | 1.30 | −40.9 | 0.023 | 0.35 | −99.3 | 0.051 | 0.26 | −97.5 | 0.068 |
| F_WOH | 100 | 85 | −37.7 | 0.617 | −0.33 | −115.3 | 0.015 | 0.26 | −99.5 | 0.047 | 0.09 | −99.1 | 0.050 |
| F_POH | 100 | 176 | +28.7 | 4.052 | 1.38 | −37.1 | 0.376 | 2.01 | −95.9 | 0.242 | 0.40 | −96.1 | 0.376 |
| F_LOH | 100 | 158 | +15.5 | 3.519 | 1.41 | −35.7 | 0.038 | 1.46 | −97.0 | 0.233 | 0.96 | −90.7 | 0.038 |
| Sample | RHPC | RHPC_ SiO2 | RHPC_Ca(OH)2 | Ca(OH)2_SiO2 |
|---|---|---|---|---|
| pH | 12.29 | 12.45 | 12.48 | 12.47 |
| Sample | Husk | Slump | Specific Gravity | Rc, 28 Days | Rf, 28 Days | ||||||||
|---|---|---|---|---|---|---|---|---|---|---|---|---|---|
| % | mm | C.D (%) | S.D | g/cm3 | C.D (%) | S.D | MPa | C.D (%) | S.D | MPa | C.D (%) | S.D | |
| Standard | 0 | 137 | 0.202 | ||||||||||
| C_RHPC | 0 | 141 | +3.3 | 2.621 | 2.19 | 0.007 | 48.59 | 2.720 | 10.28 | 0.685 | |||
| C_RHPC_SiO2 | 0 | 113 | −17.4 | 1.341 | 2.12 | −3.2 | 0.007 | 53.64 | +10.4 | 1.276 | 9.16 | −10.9 | 0.744 |
| C_RHPC_Ca(OH)2 | 0 | 212 | +55.0 | 2.796 | 1.05 | −52.3 | 0.026 | 0.82 | −98.3 | 0.047 | 0.60 | −94.1 | 0.052 |
| C_Ca(OH)2_SiO2 | 0 | 185 | +35.2 | 1.056 | 1.09 | −50.3 | 0.014 | 1.10 | −97.7 | 0.065 | 0.05 | −99.5 | 0.024 |
| P_RHPC | 33 | 132 | −3.4 | 2.621 | 3.87 | +76.4 | 1.715 | 11.19 | −77.0 | 0.687 | 4.15 | −59.6 | 0.389 |
| P_RHPC_SiO2 | 33 | 98 | −28.1 | 0.466 | 2.04 | −4.1 | 0.270 | 20.35 | −62.1 | 1.574 | 4.84 | −47.2 | 0.573 |
| P_RHPC_Ca(OH)2 | 33 | 105 | −23.2 | 0.850 | 1.42 | +35.2 | 0.015 | 0.91 | +10.1 | 0.052 | 0.16 | −74.2 | 0.008 |
| P_Ca(OH)2_SiO2 | 33 | 100 | −26.9 | 0.490 | 1.56 | +43.2 | 0.037 | 0.45 | −59.4 | 0.047 | 5.06 | +10,372.6 | 0.552 |
| F_RHPC | 100 | 106 | −22.1 | 1.291 | 1.30 | −40.9 | 0.023 | 0.35 | −99.3 | 0.051 | 0.26 | −97.5 | 0.068 |
| F_RHPC_SiO2 | 100 | 82 | −40.2 | 0.493 | 1.44 | −32.0 | 0.054 | 0.36 | −99.3 | 0.047 | 0.27 | −97.1 | 0.084 |
| F_RHPC_Ca(OH)2 | 100 | 91 | −33.3 | 0.446 | 1.11 | +6.1 | 0.029 | 0.23 | −72.2 | 0.051 | 0.13 | −78.8 | 0.006 |
| F_Ca(OH)2_SiO2 | 100 | 85 | −37.9 | 0.535 | 1.38 | +26.2 | 0.030 | 0.35 | −67.9 | 0.032 | 0.09 | +83.3 | 0.017 |
| Sample | Husk | Slump | Specific Gravity | Rc, 28 Days | Rf, 28 Days | ||||||||
|---|---|---|---|---|---|---|---|---|---|---|---|---|---|
| Units | % | mm | C.D (%) | S.D | g/cm3 | C.D (%) | S.D | MPa | C.D (%) | S.D | MPa | C.D (%) | S.D |
| Standard | 137 | 0.202 | |||||||||||
| 45_0_0 | 0 | 106 | −22.1 | 1.291 | 2.23 | 0.001 | 51.92 | 2.224 | 7.93 | 0.898 | |||
| 45_0_12 | 0 | 114 | −16.7 | 3.504 | 2.24 | +0.3 | 0.005 | 57.46 | +10.7 | 2.837 | 9.06 | +14.2 | 0.735 |
| 45_0_20 | 0 | 109 | −20.0 | 0.681 | 2.25 | +0.3 | 0.004 | 53.02 | +2.1 | 2.129 | 7.36 | −7.2 | 0.419 |
| 45_50_0 | 50 | 116 | −15.4 | 2.482 | 1.77 | +0.6 | 0.006 | 9.30 | −82.1 | 0.926 | 3.49 | −56.0 | 0.184 |
| 45_50_12 | 50 | 115 | −16.0 | 2.654 | 1.75 | −20.8 | 0.108 | 17.50 | −66.3 | 1.012 | 5.05 | −36.4 | 0.159 |
| 45_50_20 | 50 | 128 | −6.6 | 3.985 | 1.76 | −21.4 | 0.113 | 17.21 | −66.9 | 1.145 | 5.21 | −34.4 | 0.456 |
| 45_100_0 | 100 | 87 | −36.3 | 5.394 | 1.69 | −21.2 | 0.026 | 0.33 | −99.4 | 0.032 | 0.21 | −97.4 | 0.022 |
| 45_100_12 | 100 | 85 | −37.7 | 2.351 | 1.50 | −24.1 | 0.010 | 1.64 | −96.8 | 0.183 | 0.79 | −90.1 | 0.158 |
| 45_100_20 | 100 | 82 | −40.1 | 1.611 | 1.46 | −34.8 | 0.018 | 2.33 | −95.5 | 0.351 | 0.93 | −88.3 | 0.079 |
| 50_0_0 | 0 | 131 | −4.1 | 2.621 | 2.19 | 0.007 | 48.59 | 2.720 | 10.11 | 0.717 | |||
| 50_0_12 | 0 | 149 | +9.1 | 5.650 | 2.21 | +0.9 | 0.004 | 52.59 | +8.2 | 2.550 | 11.09 | +9.7 | 1.259 |
| 50_0_20 | 0 | 173 | +26.9 | 2.804 | 2.22 | +0.9 | 0.003 | 48.77 | +0.4 | 2.265 | 10.15 | +0.4 | 1.089 |
| 50_50_0 | 50 | 144 | +5.3 | 1.966 | 1.71 | +1.4 | 0.003 | 9.96 | −79.5 | 0.705 | 3.67 | −63.7 | 0.464 |
| 50_50_12 | 50 | 144 | +5.5 | 6.058 | 1.80 | −21.9 | 0.026 | 16.40 | −66.2 | 0.515 | 4.38 | −56.7 | 0.993 |
| 50_50_20 | 50 | 150 | +9.7 | 3.790 | 1.74 | −17.8 | 0.034 | 14.08 | −71.0 | 0.666 | 4.69 | −53.6 | 0.073 |
| 50_100_0 | 100 | 106 | −22.1 | 1.291 | 1.51 | −20.8 | 0.013 | 0.35 | −99.3 | 0.051 | 0.26 | −97.4 | 0.068 |
| 50_100_12 | 100 | 112 | −17.8 | 1.208 | 1.30 | −31.0 | 0.023 | 3.16 | −93.5 | 0.441 | 1.67 | −83.5 | 0.308 |
| 50_100_20 | 100 | 109 | −20.0 | 0.681 | 1.31 | −40.1 | 0.010 | 4.08 | −91.6 | 0.740 | 2.06 | −79.6 | 0.392 |
| 60_0_0 | 0 | 227 | +66.2 | 1.888 | 2.19 | 0.008 | 45.77 | 2.048 | 8.41 | 0.839 | |||
| 60_0_12 | 0 | 231 | +68.8 | 3.797 | 2.21 | +0.6 | 0.003 | 47.38 | +3.5 | 1.027 | 9.09 | +8.1 | 0.499 |
| 60_0_20 | 0 | 236 | +73.0 | 2.837 | 2.17 | +0.6 | 0.085 | 43.71 | −4.5 | 1.536 | 7.77 | −7.6 | 0.580 |
| 60_50_0 | 50 | 188 | +37.9 | 0.748 | 1.63 | −1.0 | 0.005 | 4.92 | −89.2 | 0.241 | 1.61 | −80.9 | 0.269 |
| 60_50_12 | 50 | 201 | +46.9 | 3.831 | 1.61 | −25.6 | 0.002 | 7.33 | −84.0 | 0.357 | 2.47 | −70.6 | 0.473 |
| 60_50_20 | 50 | 204 | +49.2 | 3.350 | 1.63 | −26.4 | 0.022 | 7.72 | −83.1 | 0.816 | 2.80 | −66.7 | 0.245 |
| 60_100_0 | 100 | 88 | −35.5 | 0.448 | 1.67 | −25.7 | 0.046 | 0.59 | −98.7 | 0.086 | 0.57 | −93.2 | 0.072 |
| 60_100_12 | 100 | 91 | −33.2 | 3.469 | 1.50 | −24.1 | 0.009 | 1.64 | −96.4 | 0.139 | 0.99 | −88.2 | 0.313 |
| 60_100_20 | 100 | 92 | −32.8 | 2.230 | 1.48 | −32.7 | 0.017 | 2.43 | −94.7 | 0.516 | 1.08 | −87.2 | 0.359 |
Disclaimer/Publisher’s Note: The statements, opinions and data contained in all publications are solely those of the individual author(s) and contributor(s) and not of MDPI and/or the editor(s). MDPI and/or the editor(s) disclaim responsibility for any injury to people or property resulting from any ideas, methods, instructions or products referred to in the content. |
© 2024 by the authors. Licensee MDPI, Basel, Switzerland. This article is an open access article distributed under the terms and conditions of the Creative Commons Attribution (CC BY) license (https://creativecommons.org/licenses/by/4.0/).
Share and Cite
Bonifacio, A.L.; Archbold, P. Exploring Oat Husks as Aggregates in Limestone-Based Composites: Effects of Surface Treatments and Binder Selection on Mechanical Performance. Materials 2024, 17, 2588. https://doi.org/10.3390/ma17112588
Bonifacio AL, Archbold P. Exploring Oat Husks as Aggregates in Limestone-Based Composites: Effects of Surface Treatments and Binder Selection on Mechanical Performance. Materials. 2024; 17(11):2588. https://doi.org/10.3390/ma17112588
Chicago/Turabian StyleBonifacio, Alysson Larsen, and Paul Archbold. 2024. "Exploring Oat Husks as Aggregates in Limestone-Based Composites: Effects of Surface Treatments and Binder Selection on Mechanical Performance" Materials 17, no. 11: 2588. https://doi.org/10.3390/ma17112588