
The Effects of Hot Isostatic Pressing (HIP) and Heat Treatment on the Microstructure and Mechanical Behavior of Electron Beam-Melted (EBM) Ti–6Al–4V Alloy and Its Susceptibility to Hydrogen

 , , , ,
Abstract
:1. Introduction
2. Materials and Methods
2.1. EBM of Ti–6Al–4V and Secondary Processes
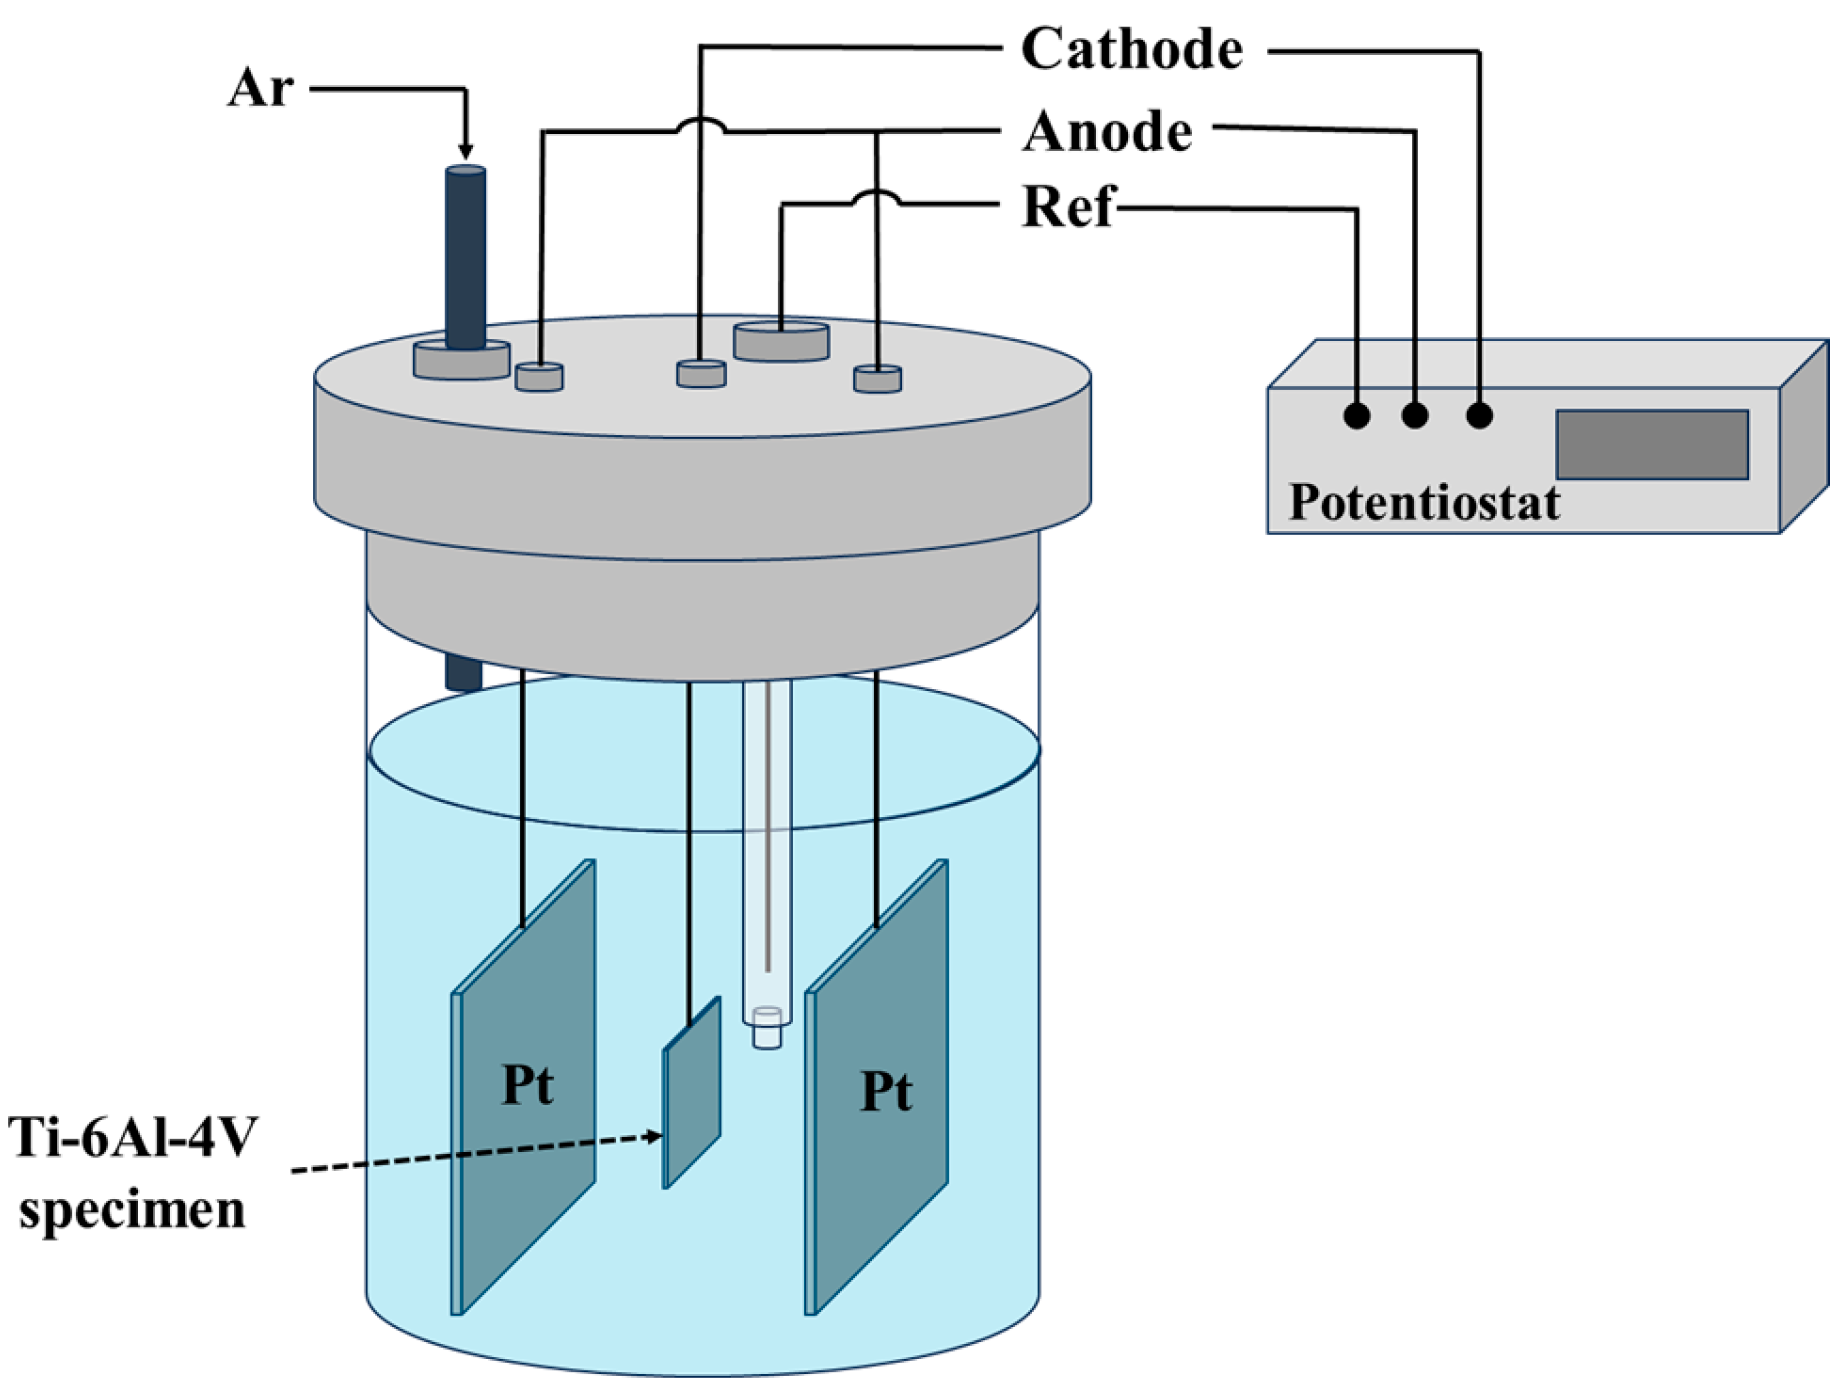
2.2. Electrochemical Charging (Hydrogenation)
2.3. Material Characterization
2.3.1. Chemical Composition and Density
2.3.2. Microstructural Analysis by Scanning Electron Microscopy (SEM) and X-ray Diffraction (XRD)
2.3.3. Thermal Desorption Analyses
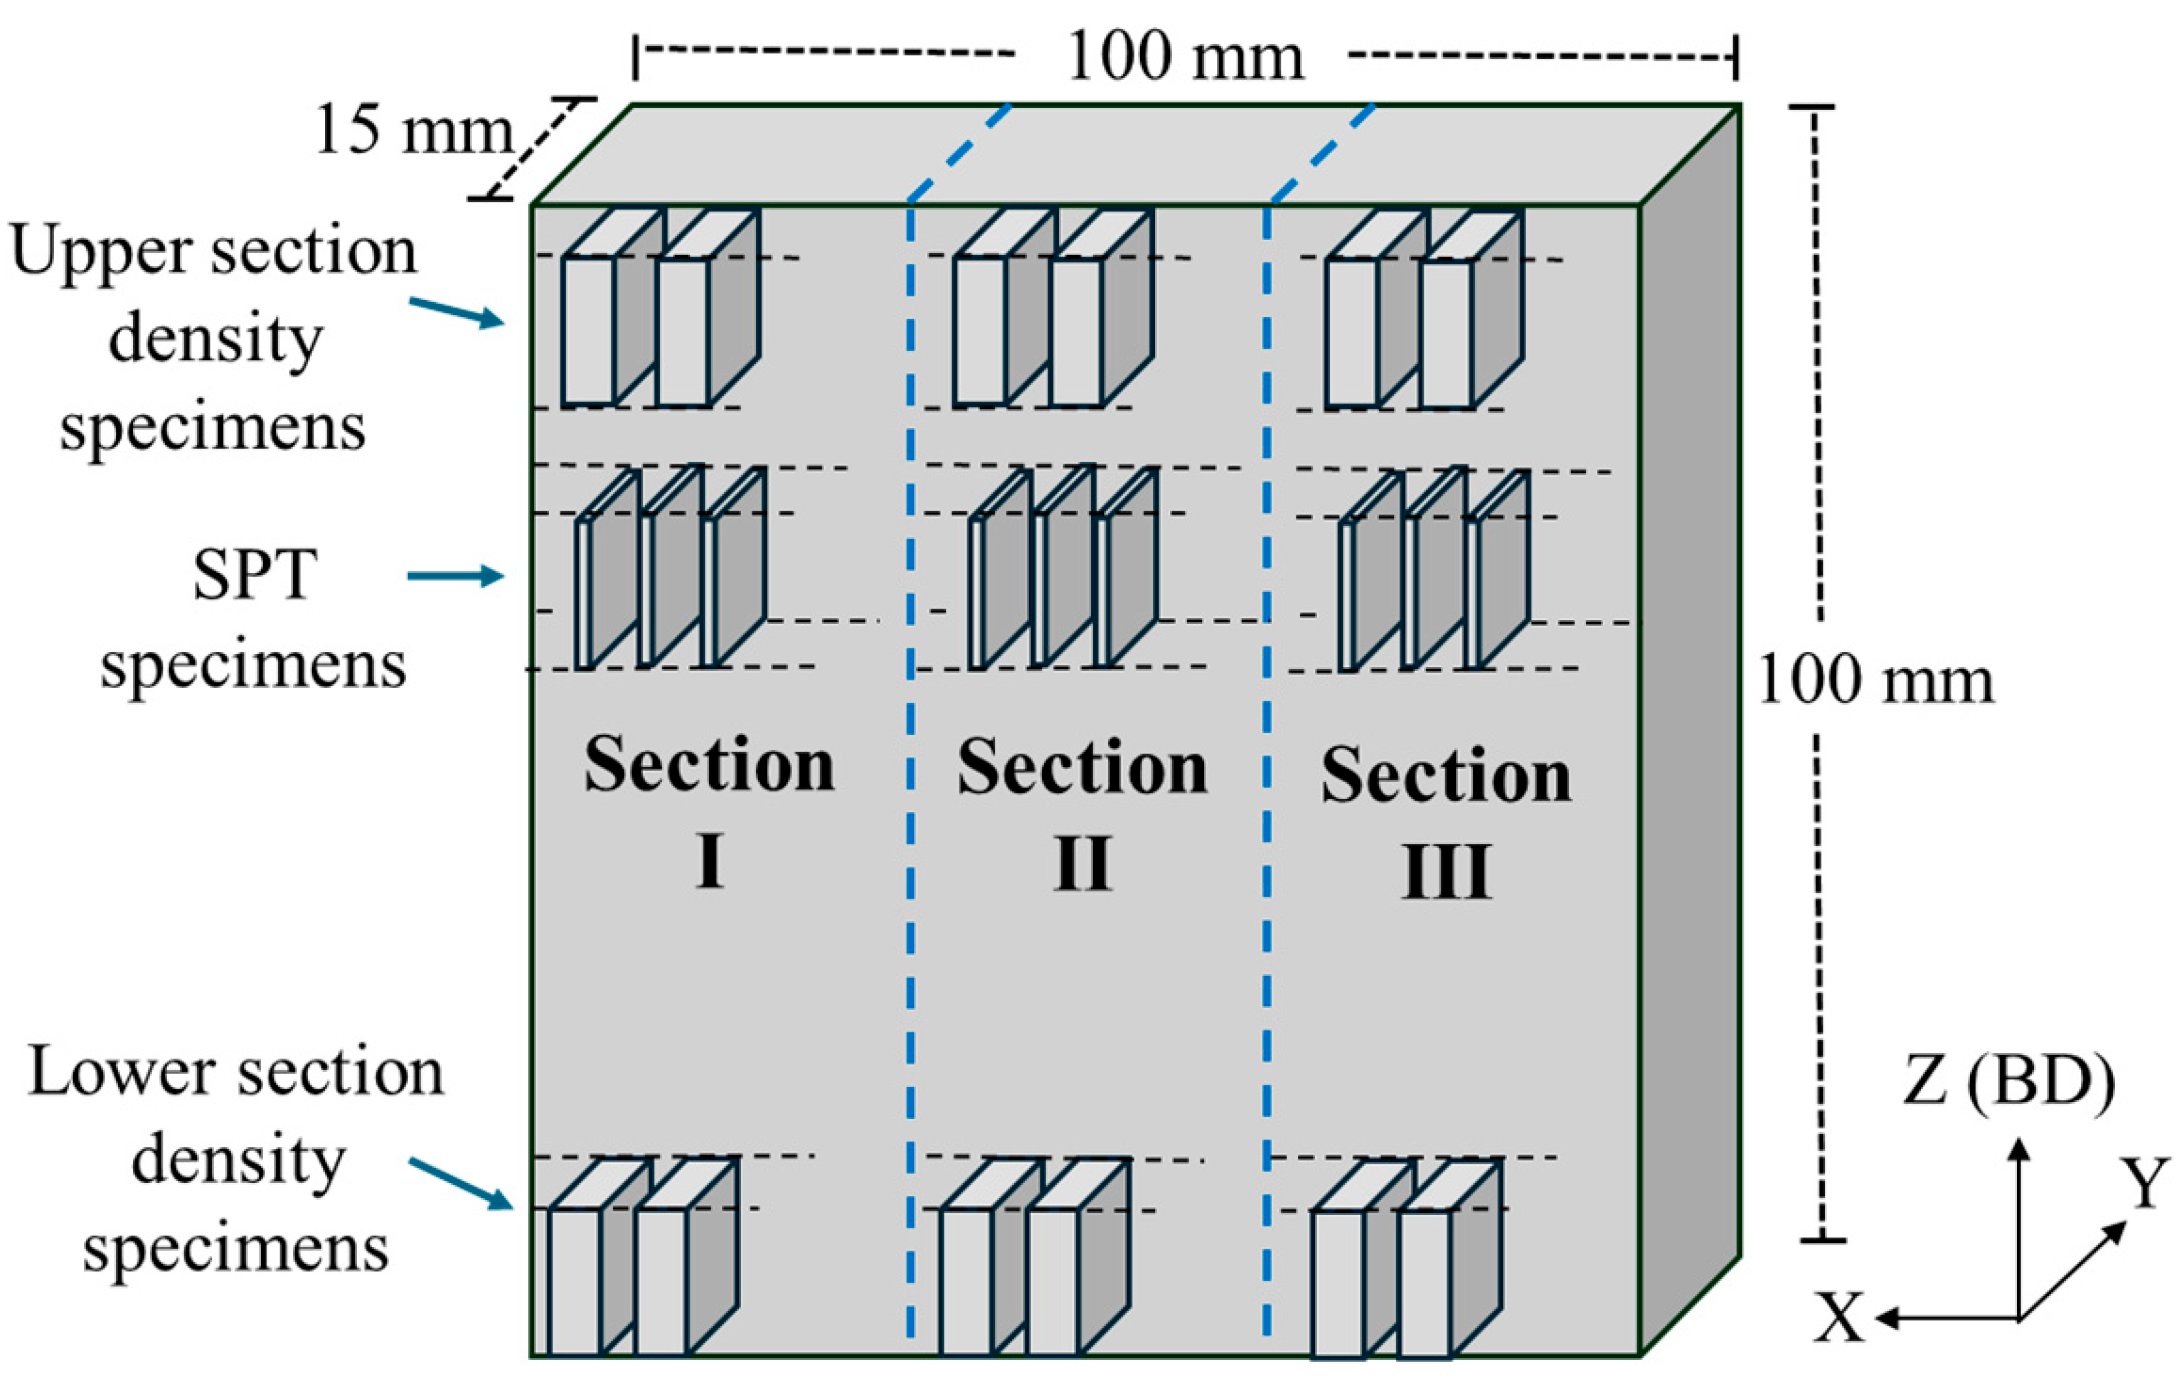
2.3.4. Mechanical Testing by SPT
3. Results and Discussion
3.1. Chemical Composition and Density
3.2. Microstructure
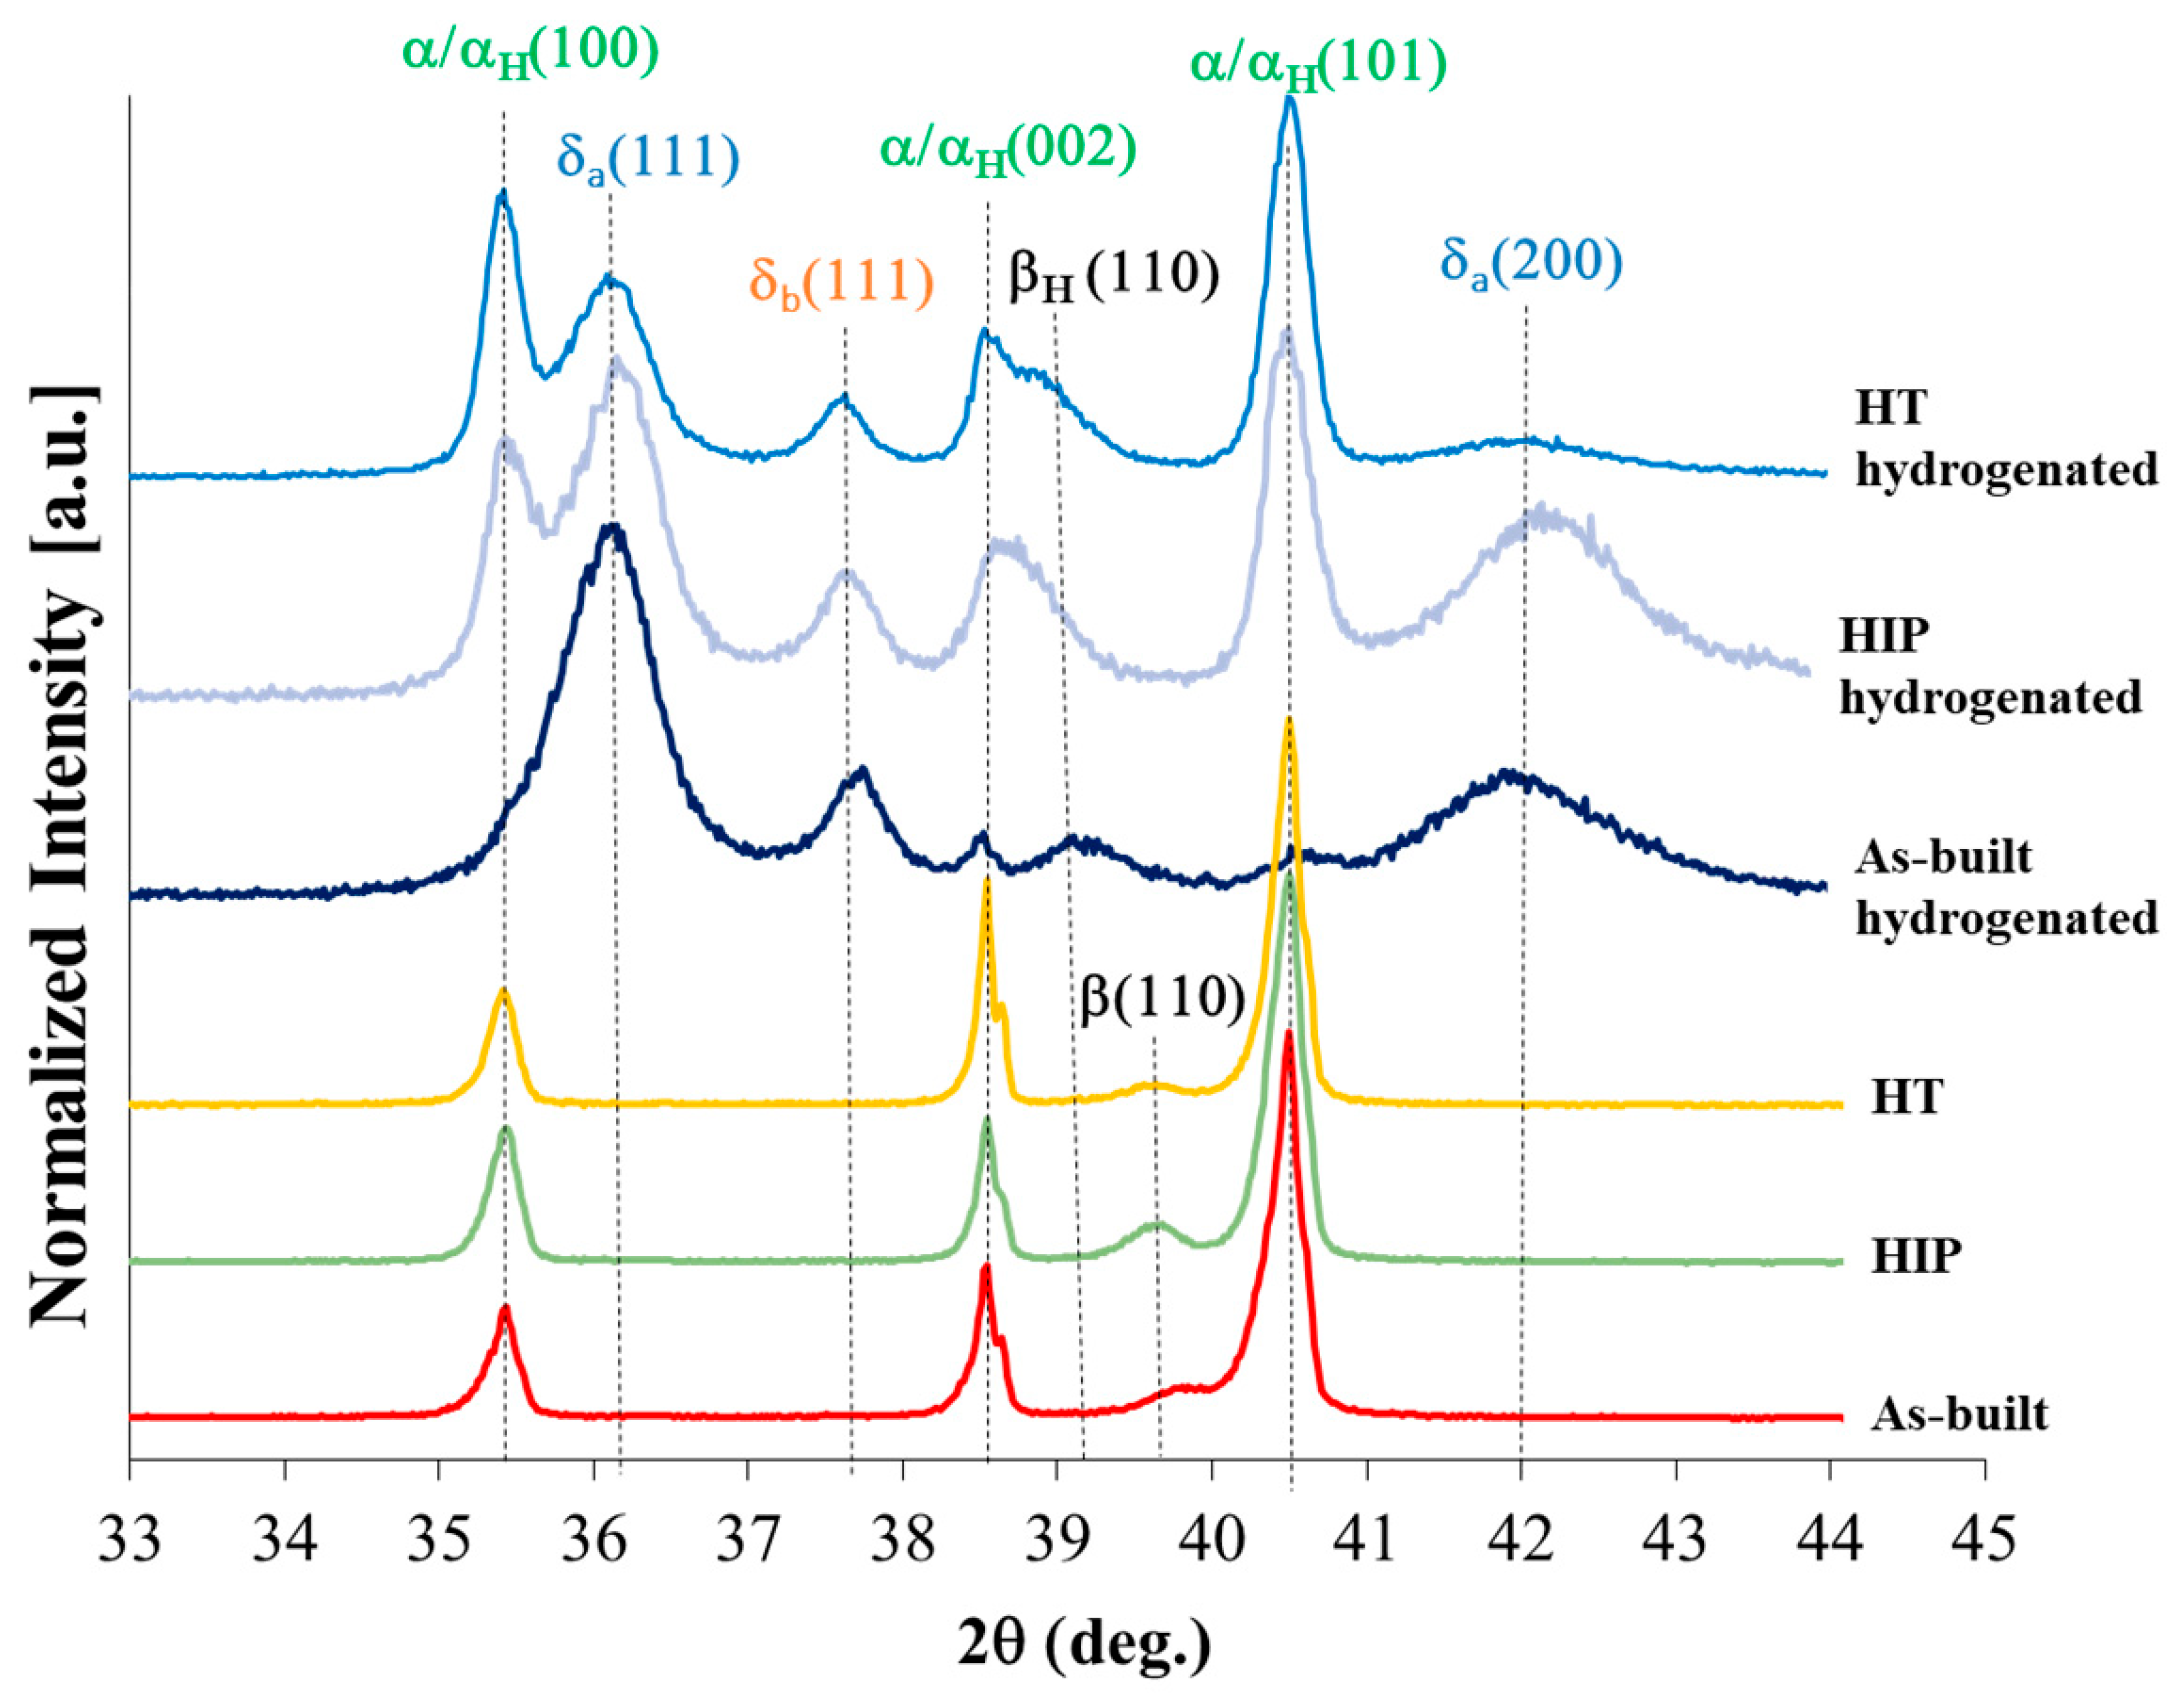
3.3. XRD Phase Analysis
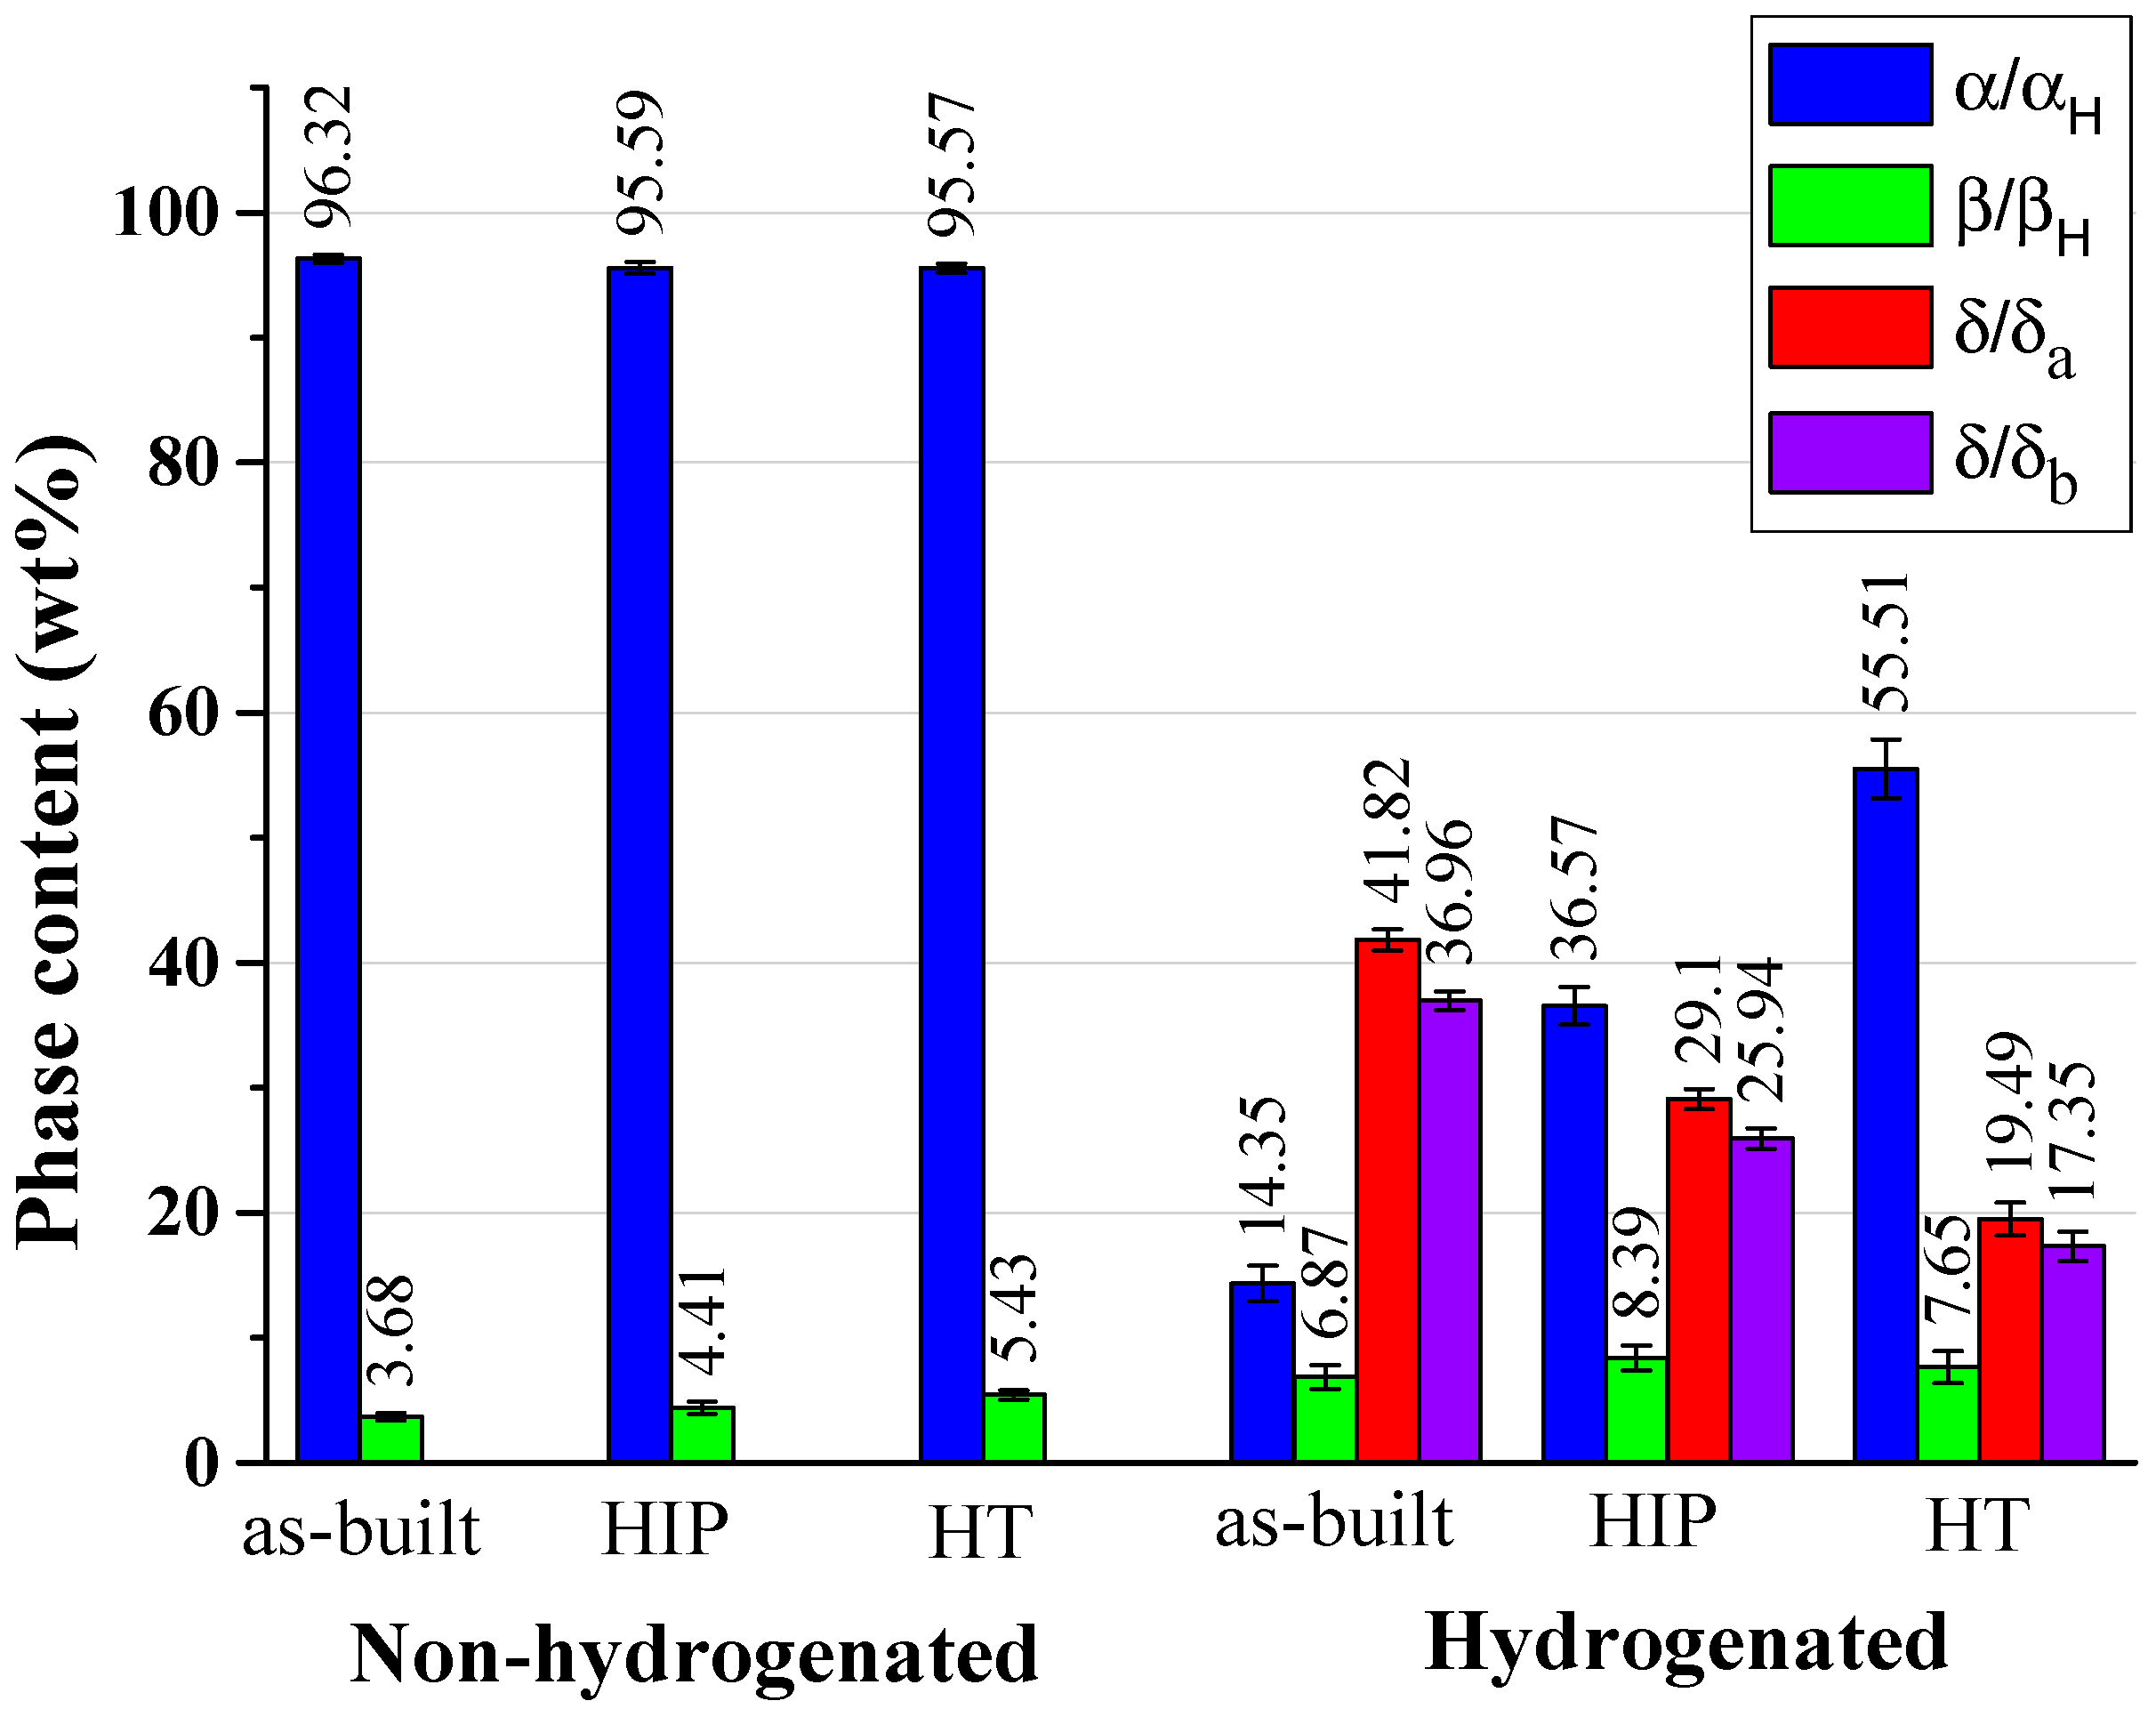
Phase Content and Lattice Parameter
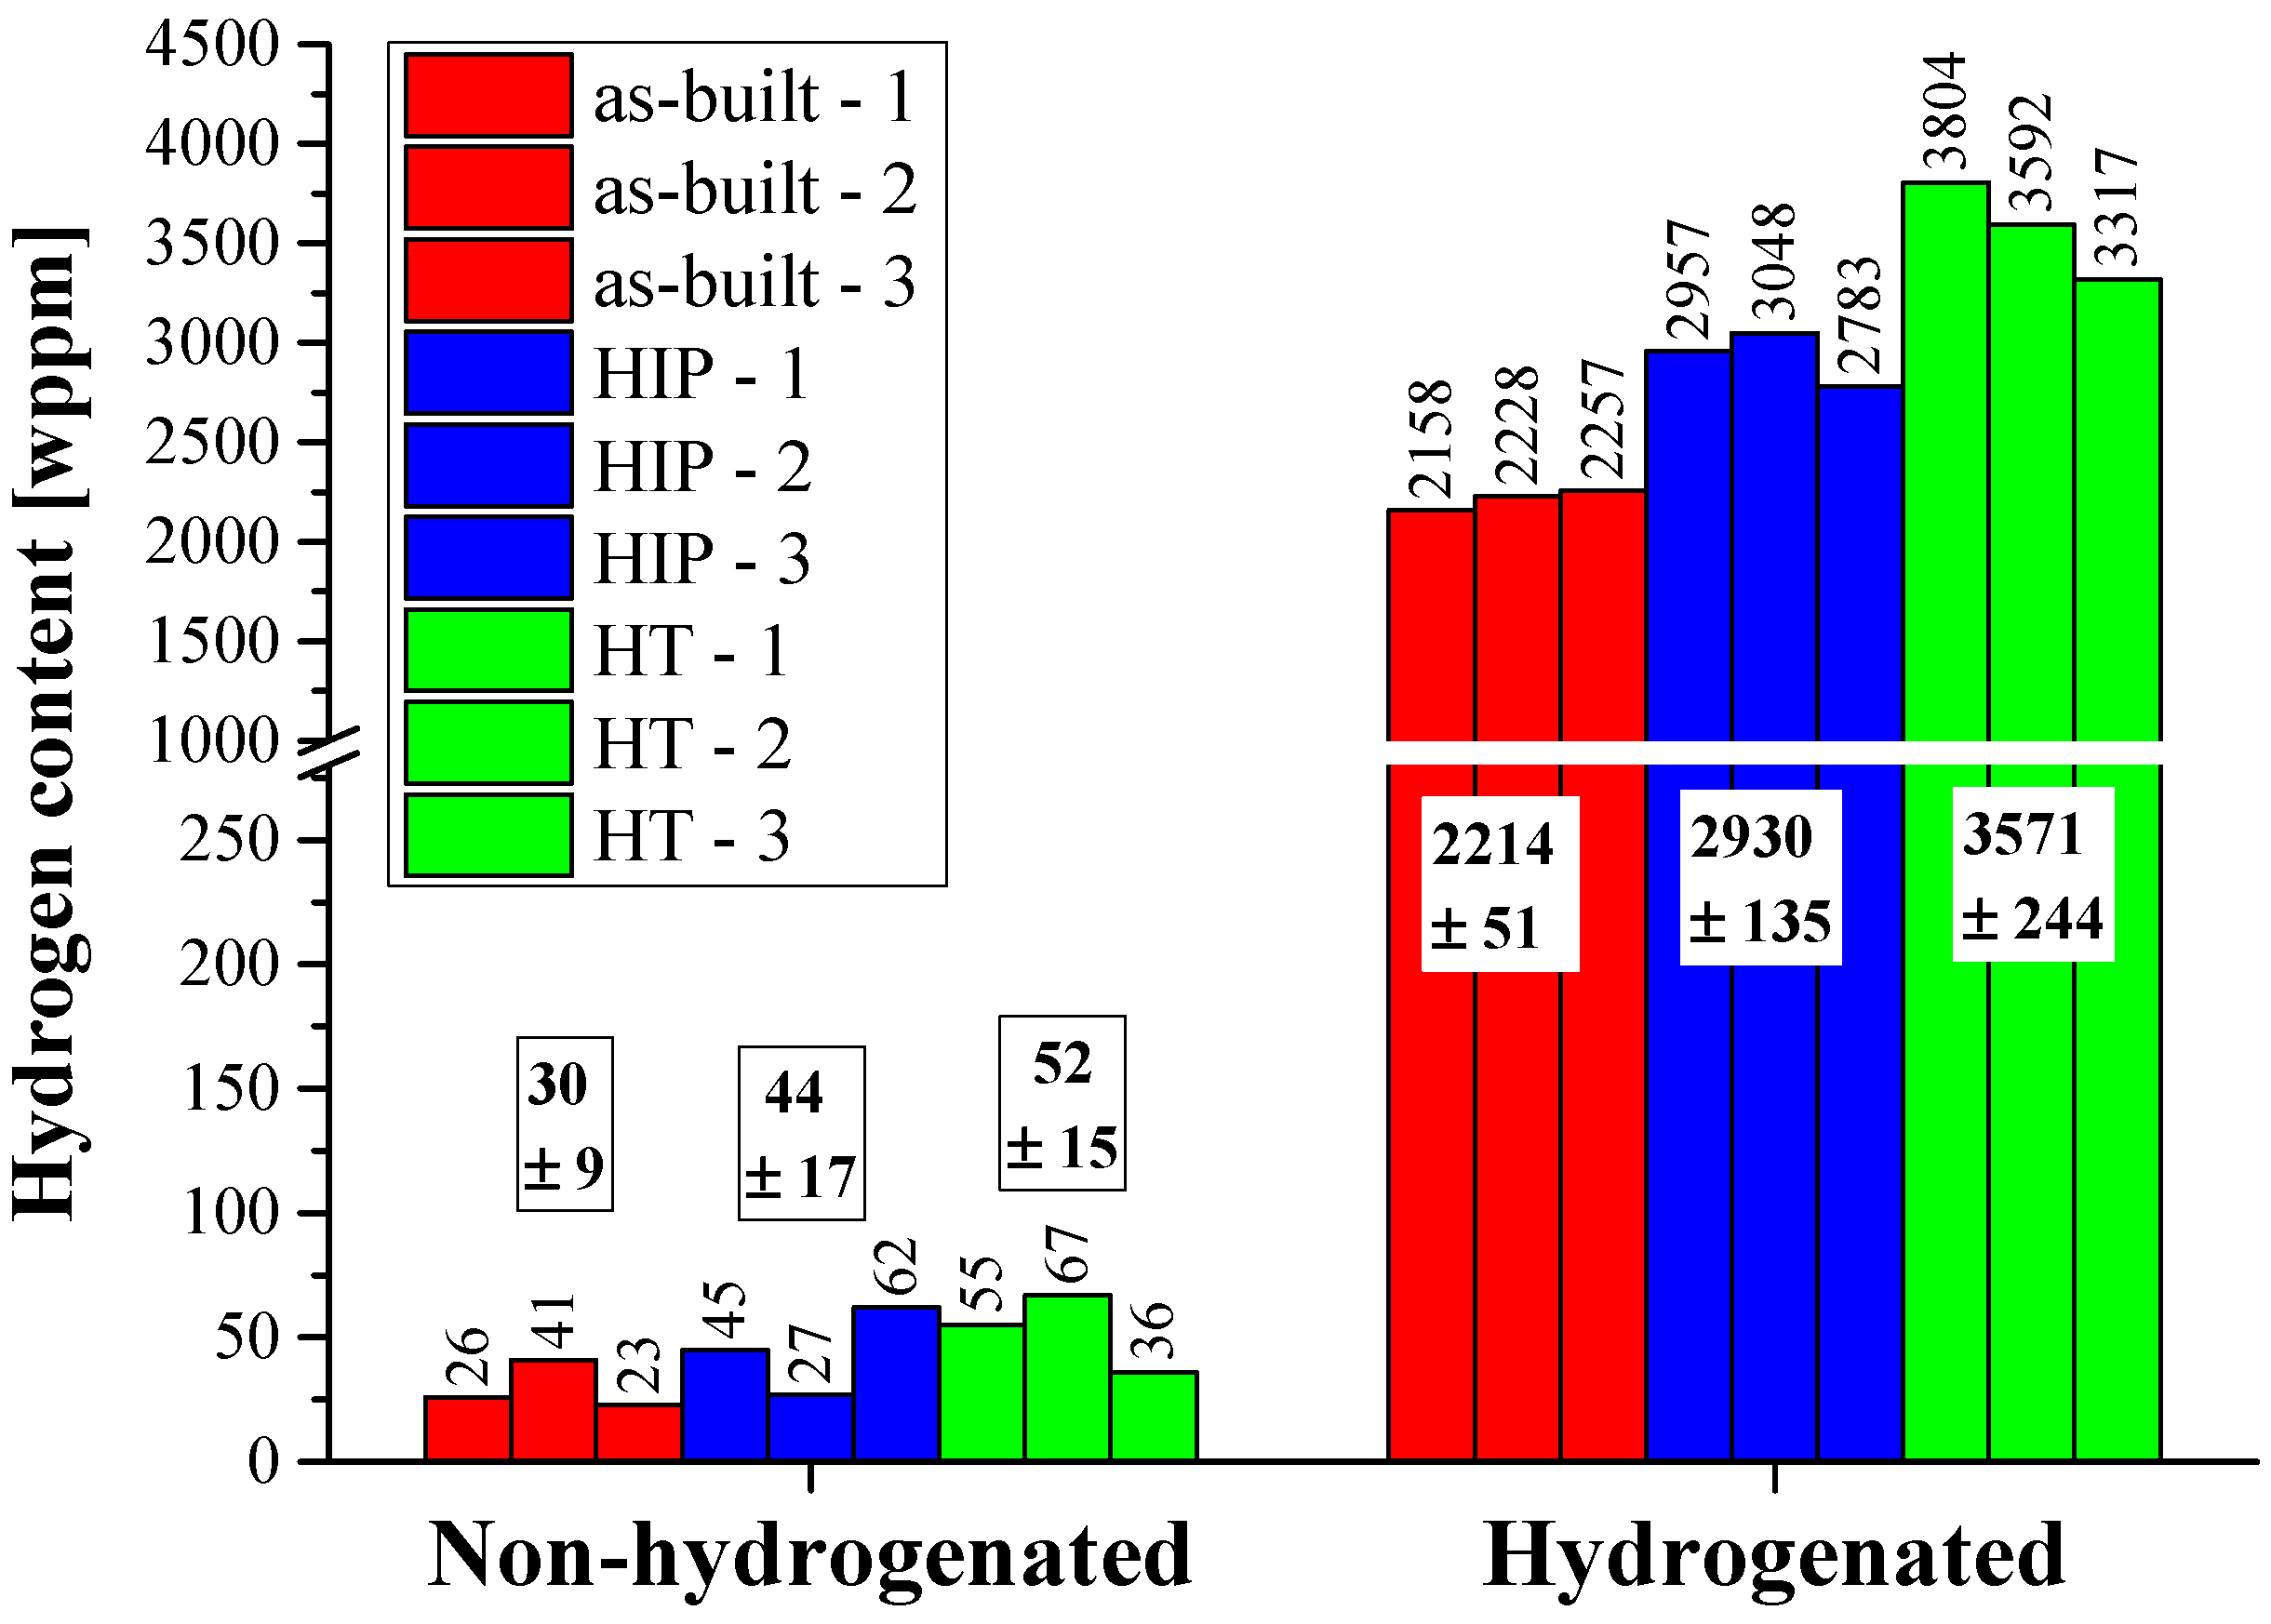
3.4. TPD Analysis
3.5. SPT Curves
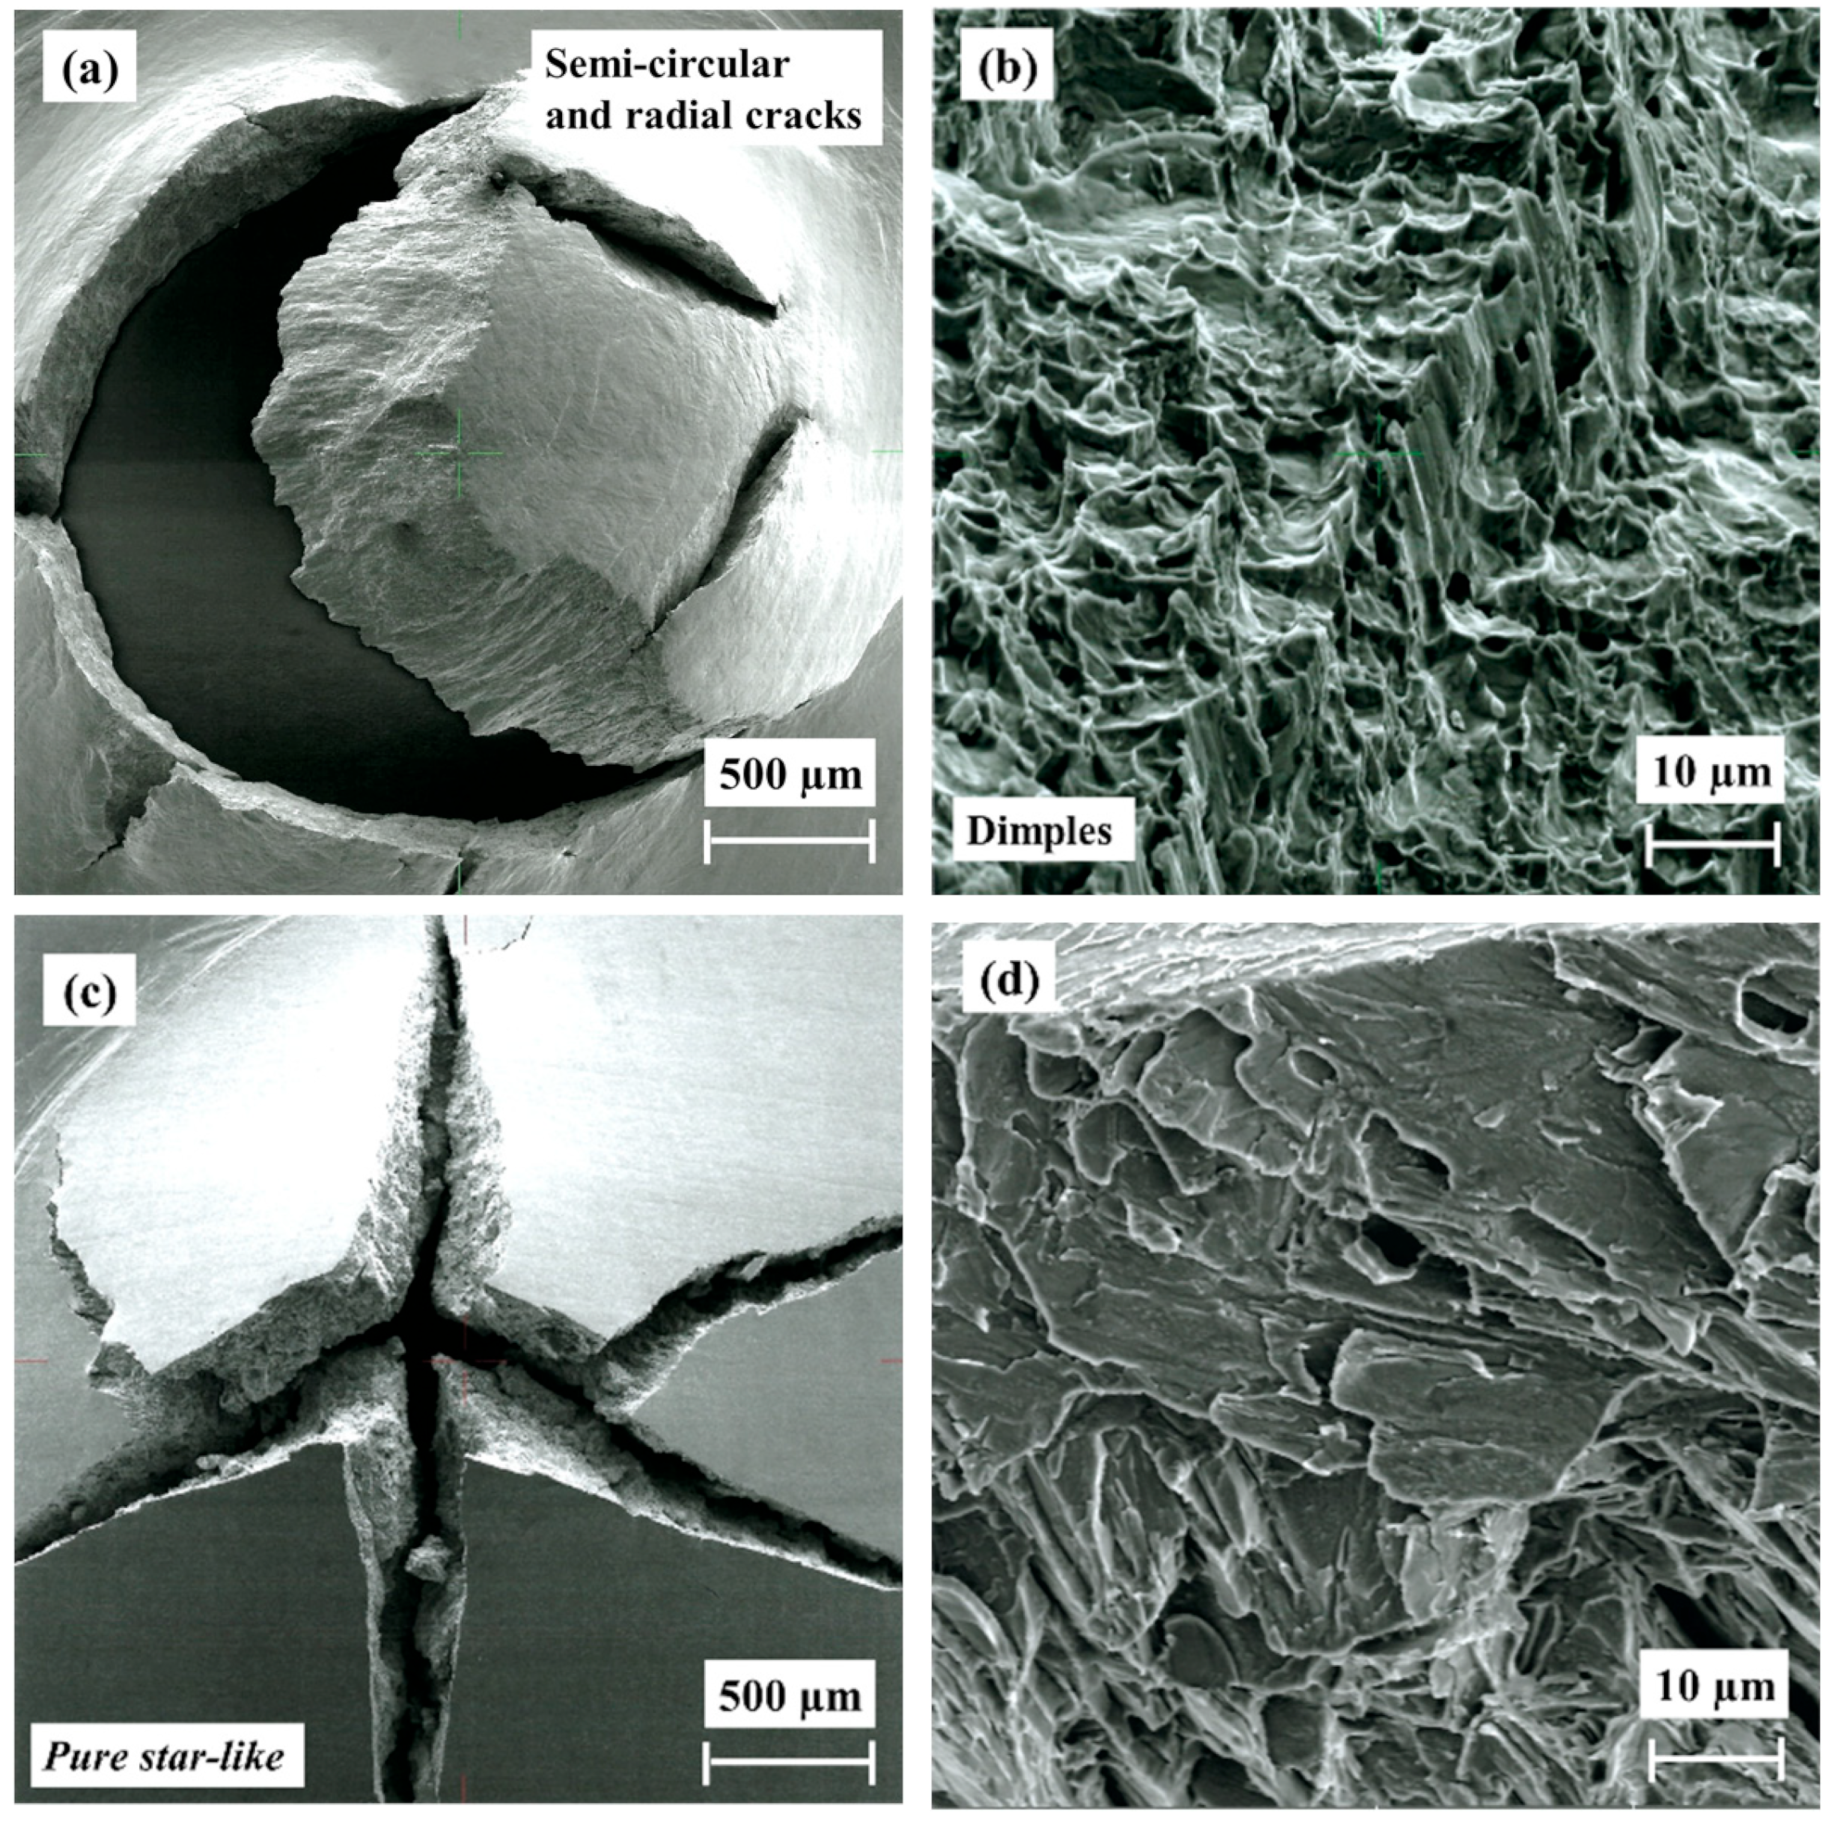
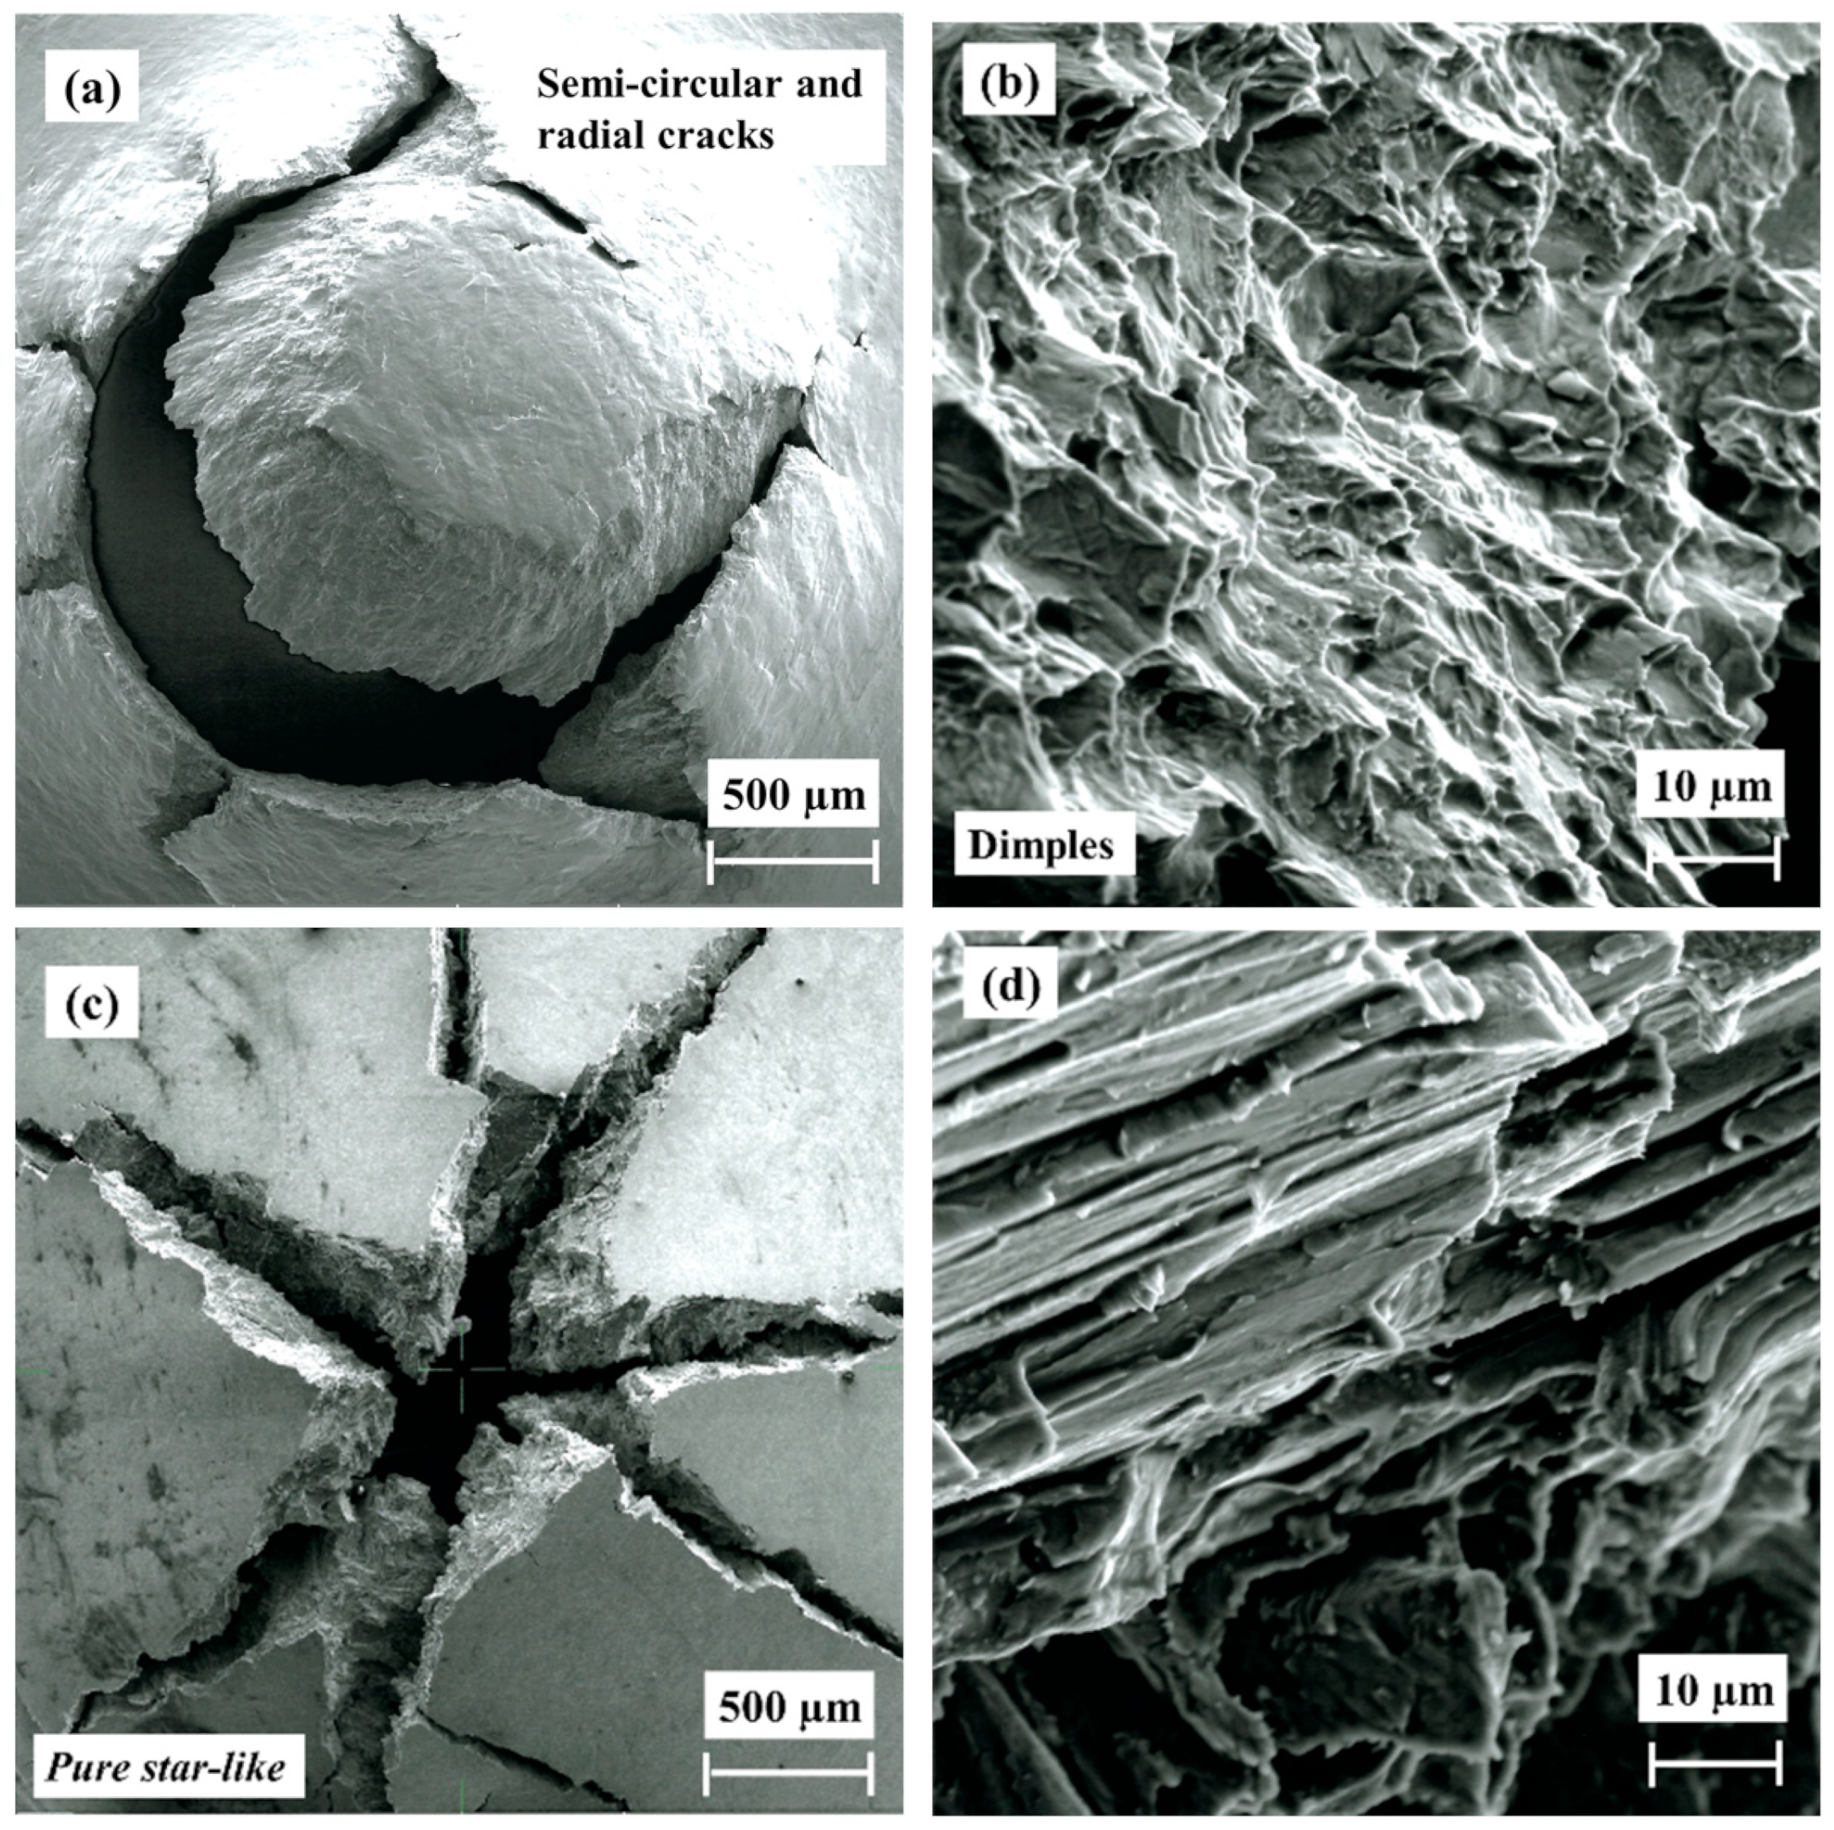
3.6. Fractography
4. Conclusions
- Secondary processes after EBM, such as HIP for 2 h at a temperature of 920 °C and a pressure of 120 MPa, or HT for 2 h in vacuum at a temperature of 1000 °C, change the β-phase morphology from discontinuous Widmanstätten to a more continuous β-phase morphology.
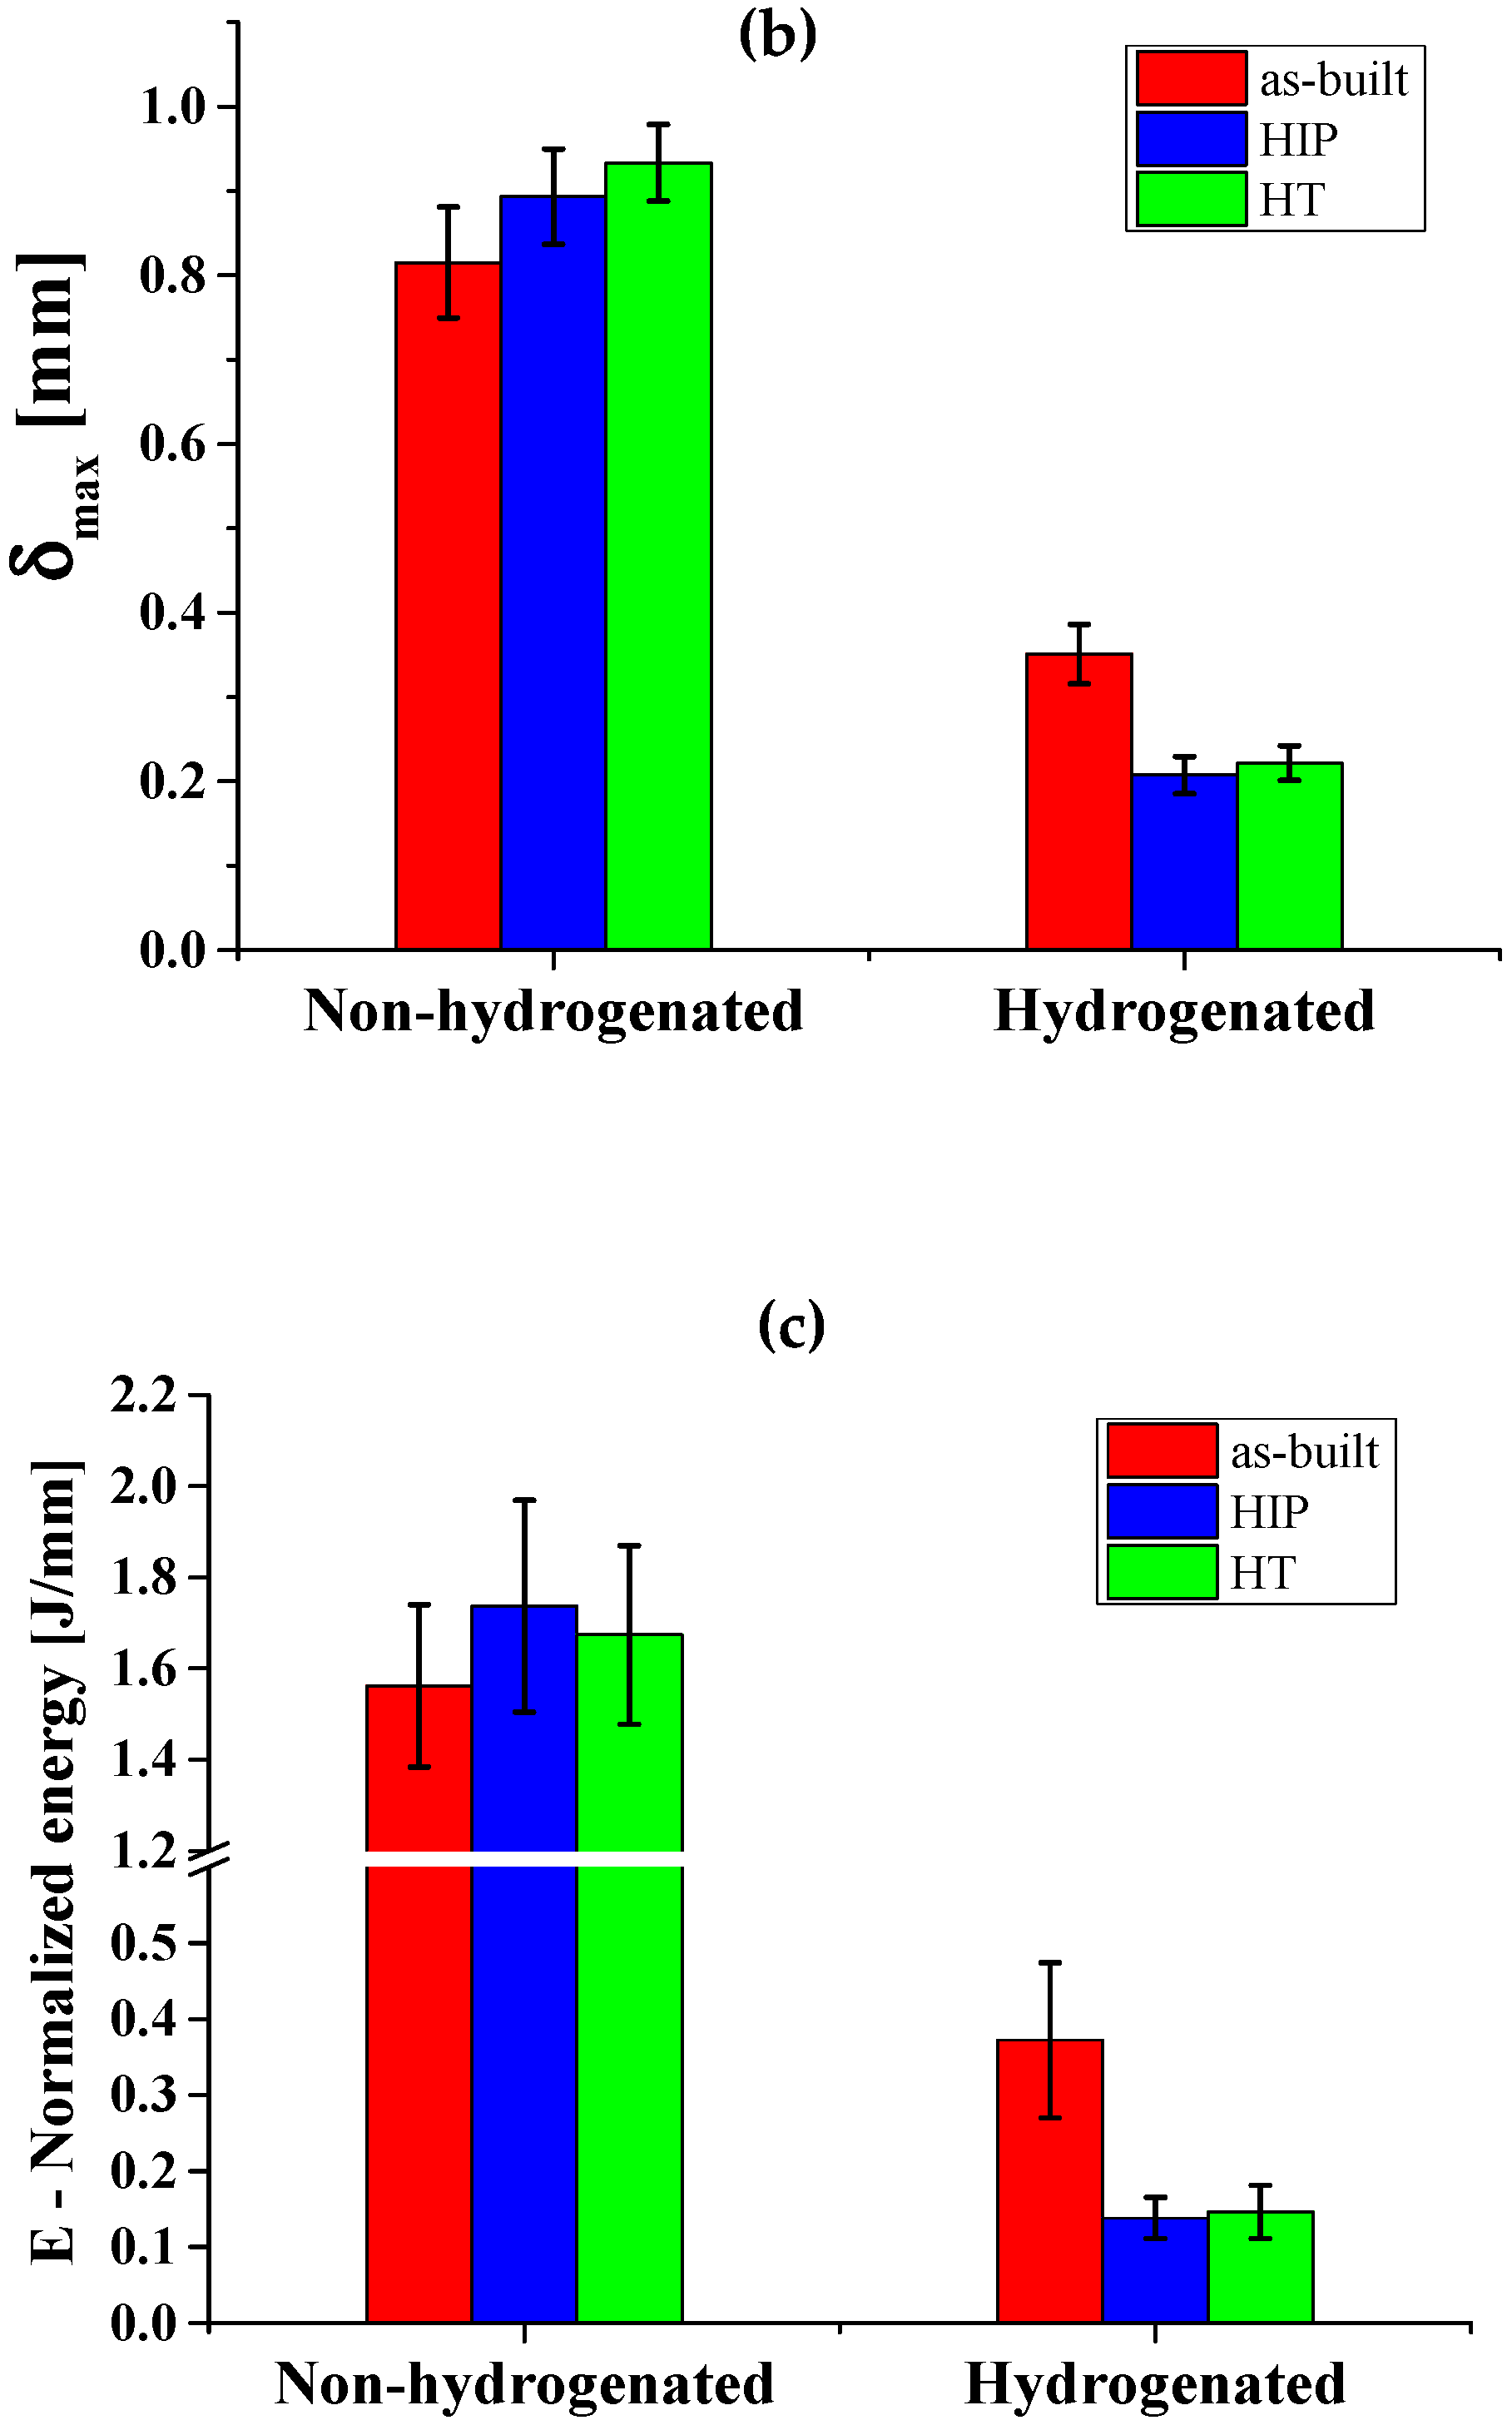
- All three alloy conditions (as-built, HIP, and HT) exhibit a similar mechanical behavior in their non-hydrogenated state.
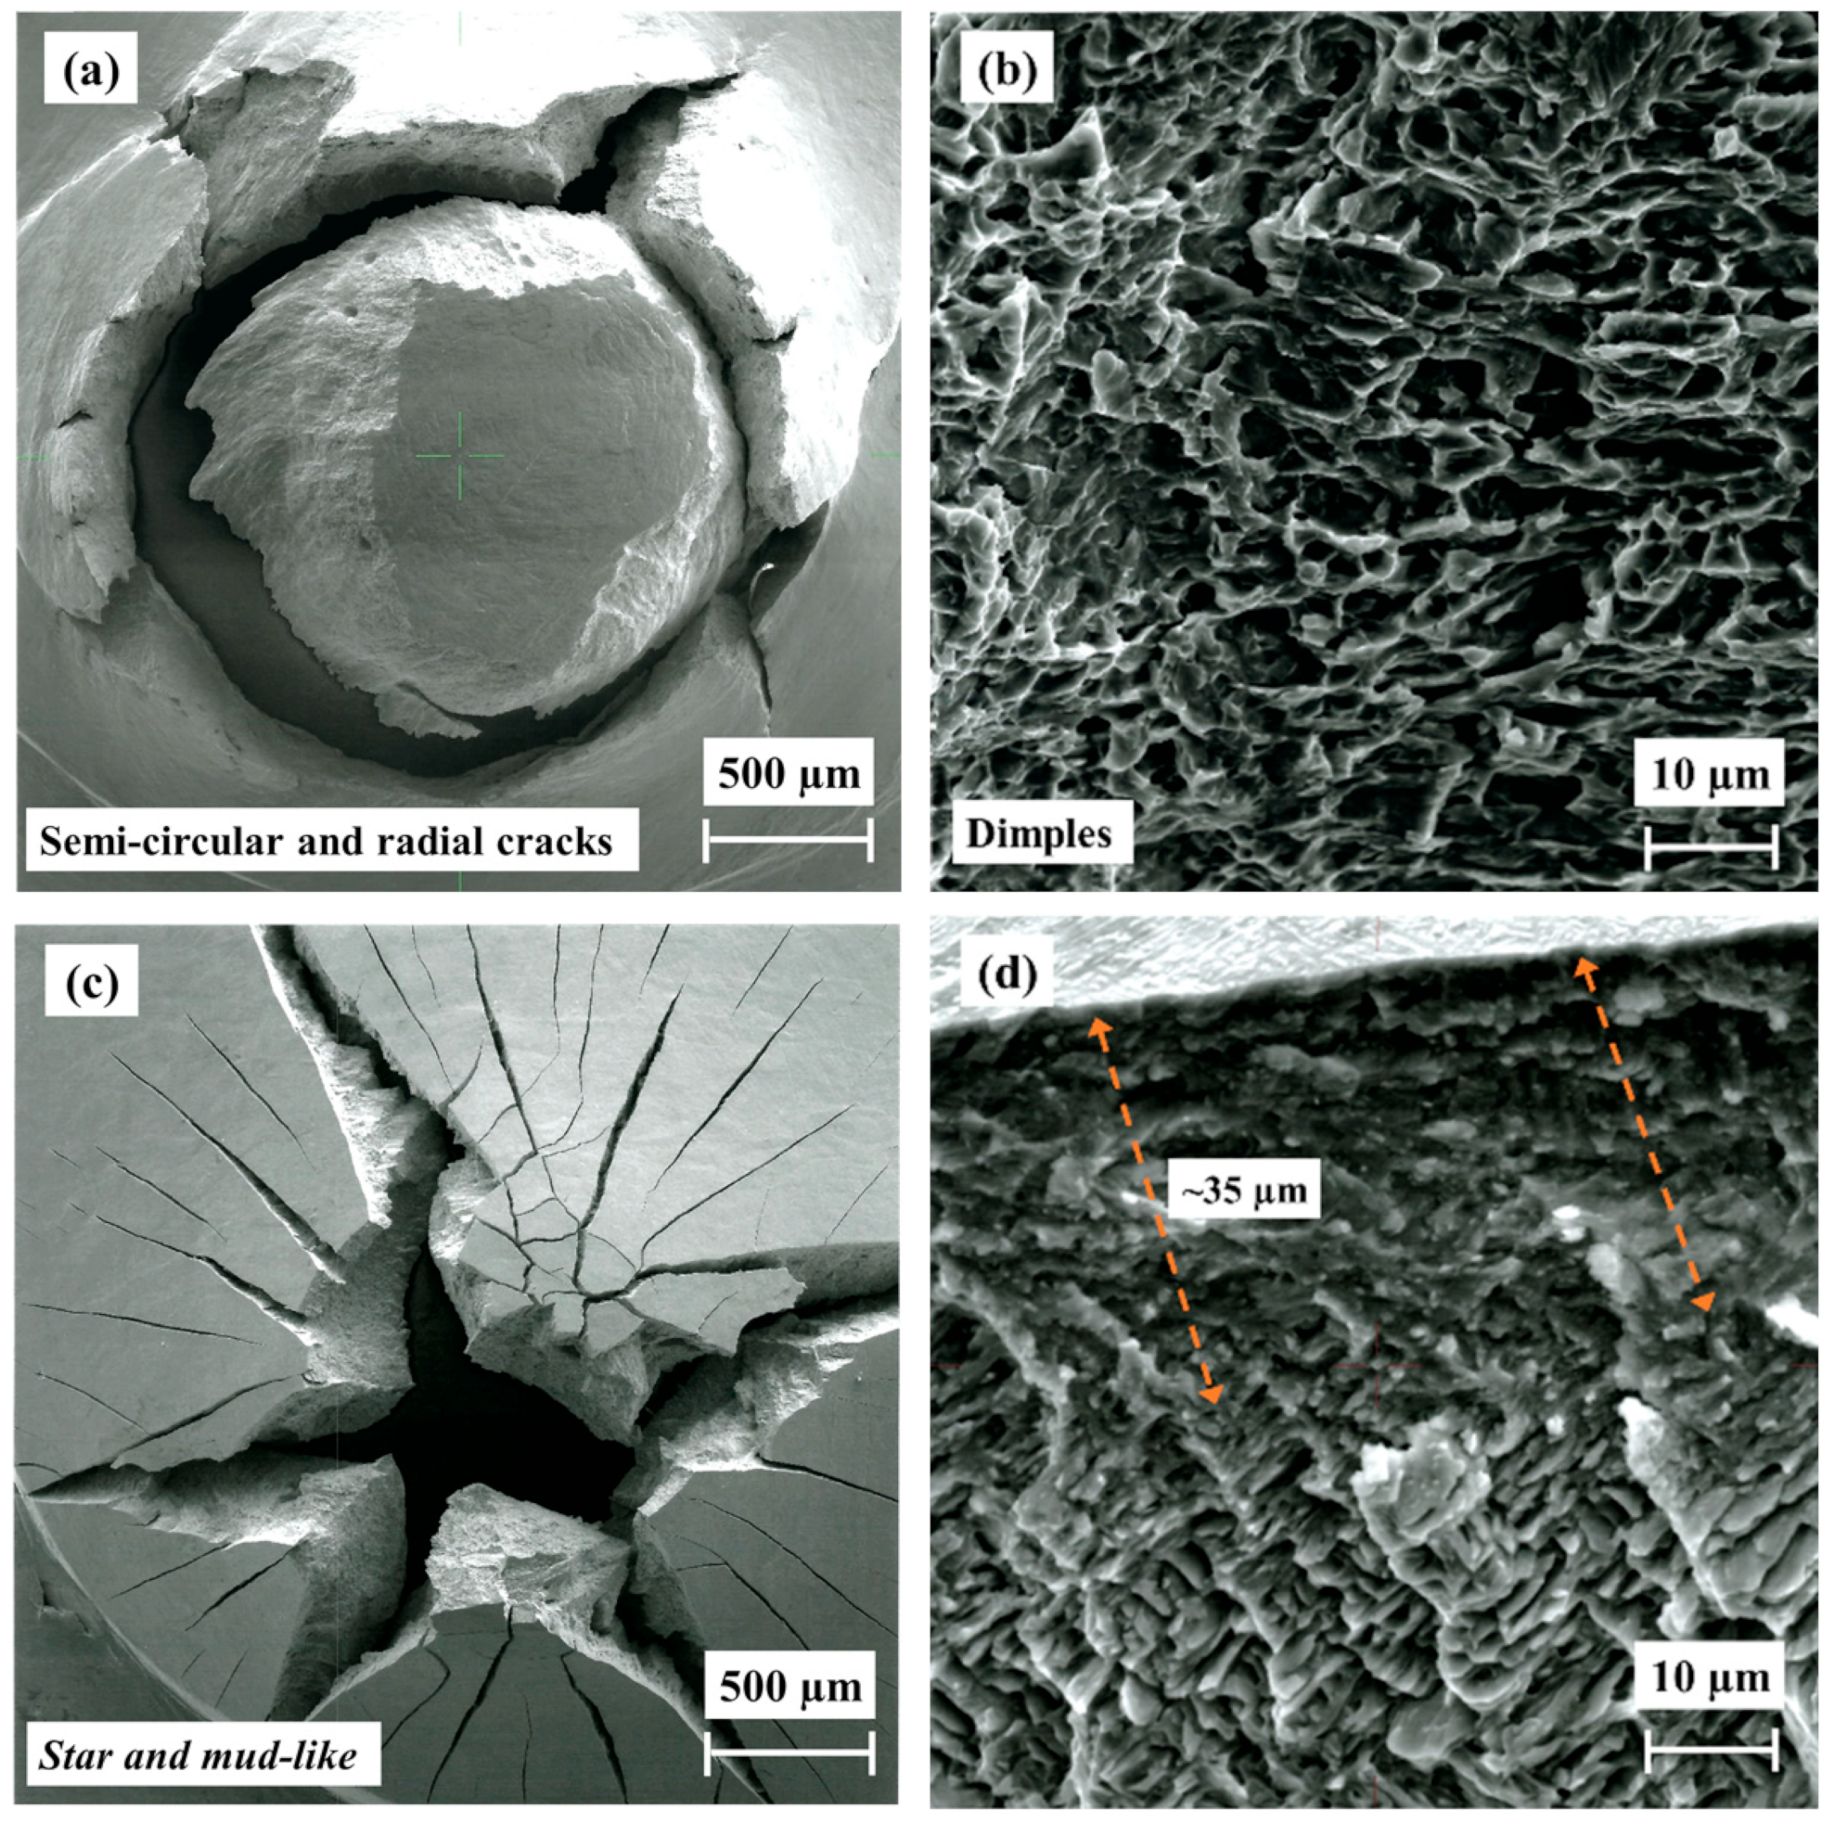
- The fracture morphology of the hydrogenated HIP and HT alloys is similar, showing a pure brittle fracture with star-like morphology, while the as-built alloy shows a star-like and mud crack morphology due to the higher concentration of brittle hydrides in the outer surface.
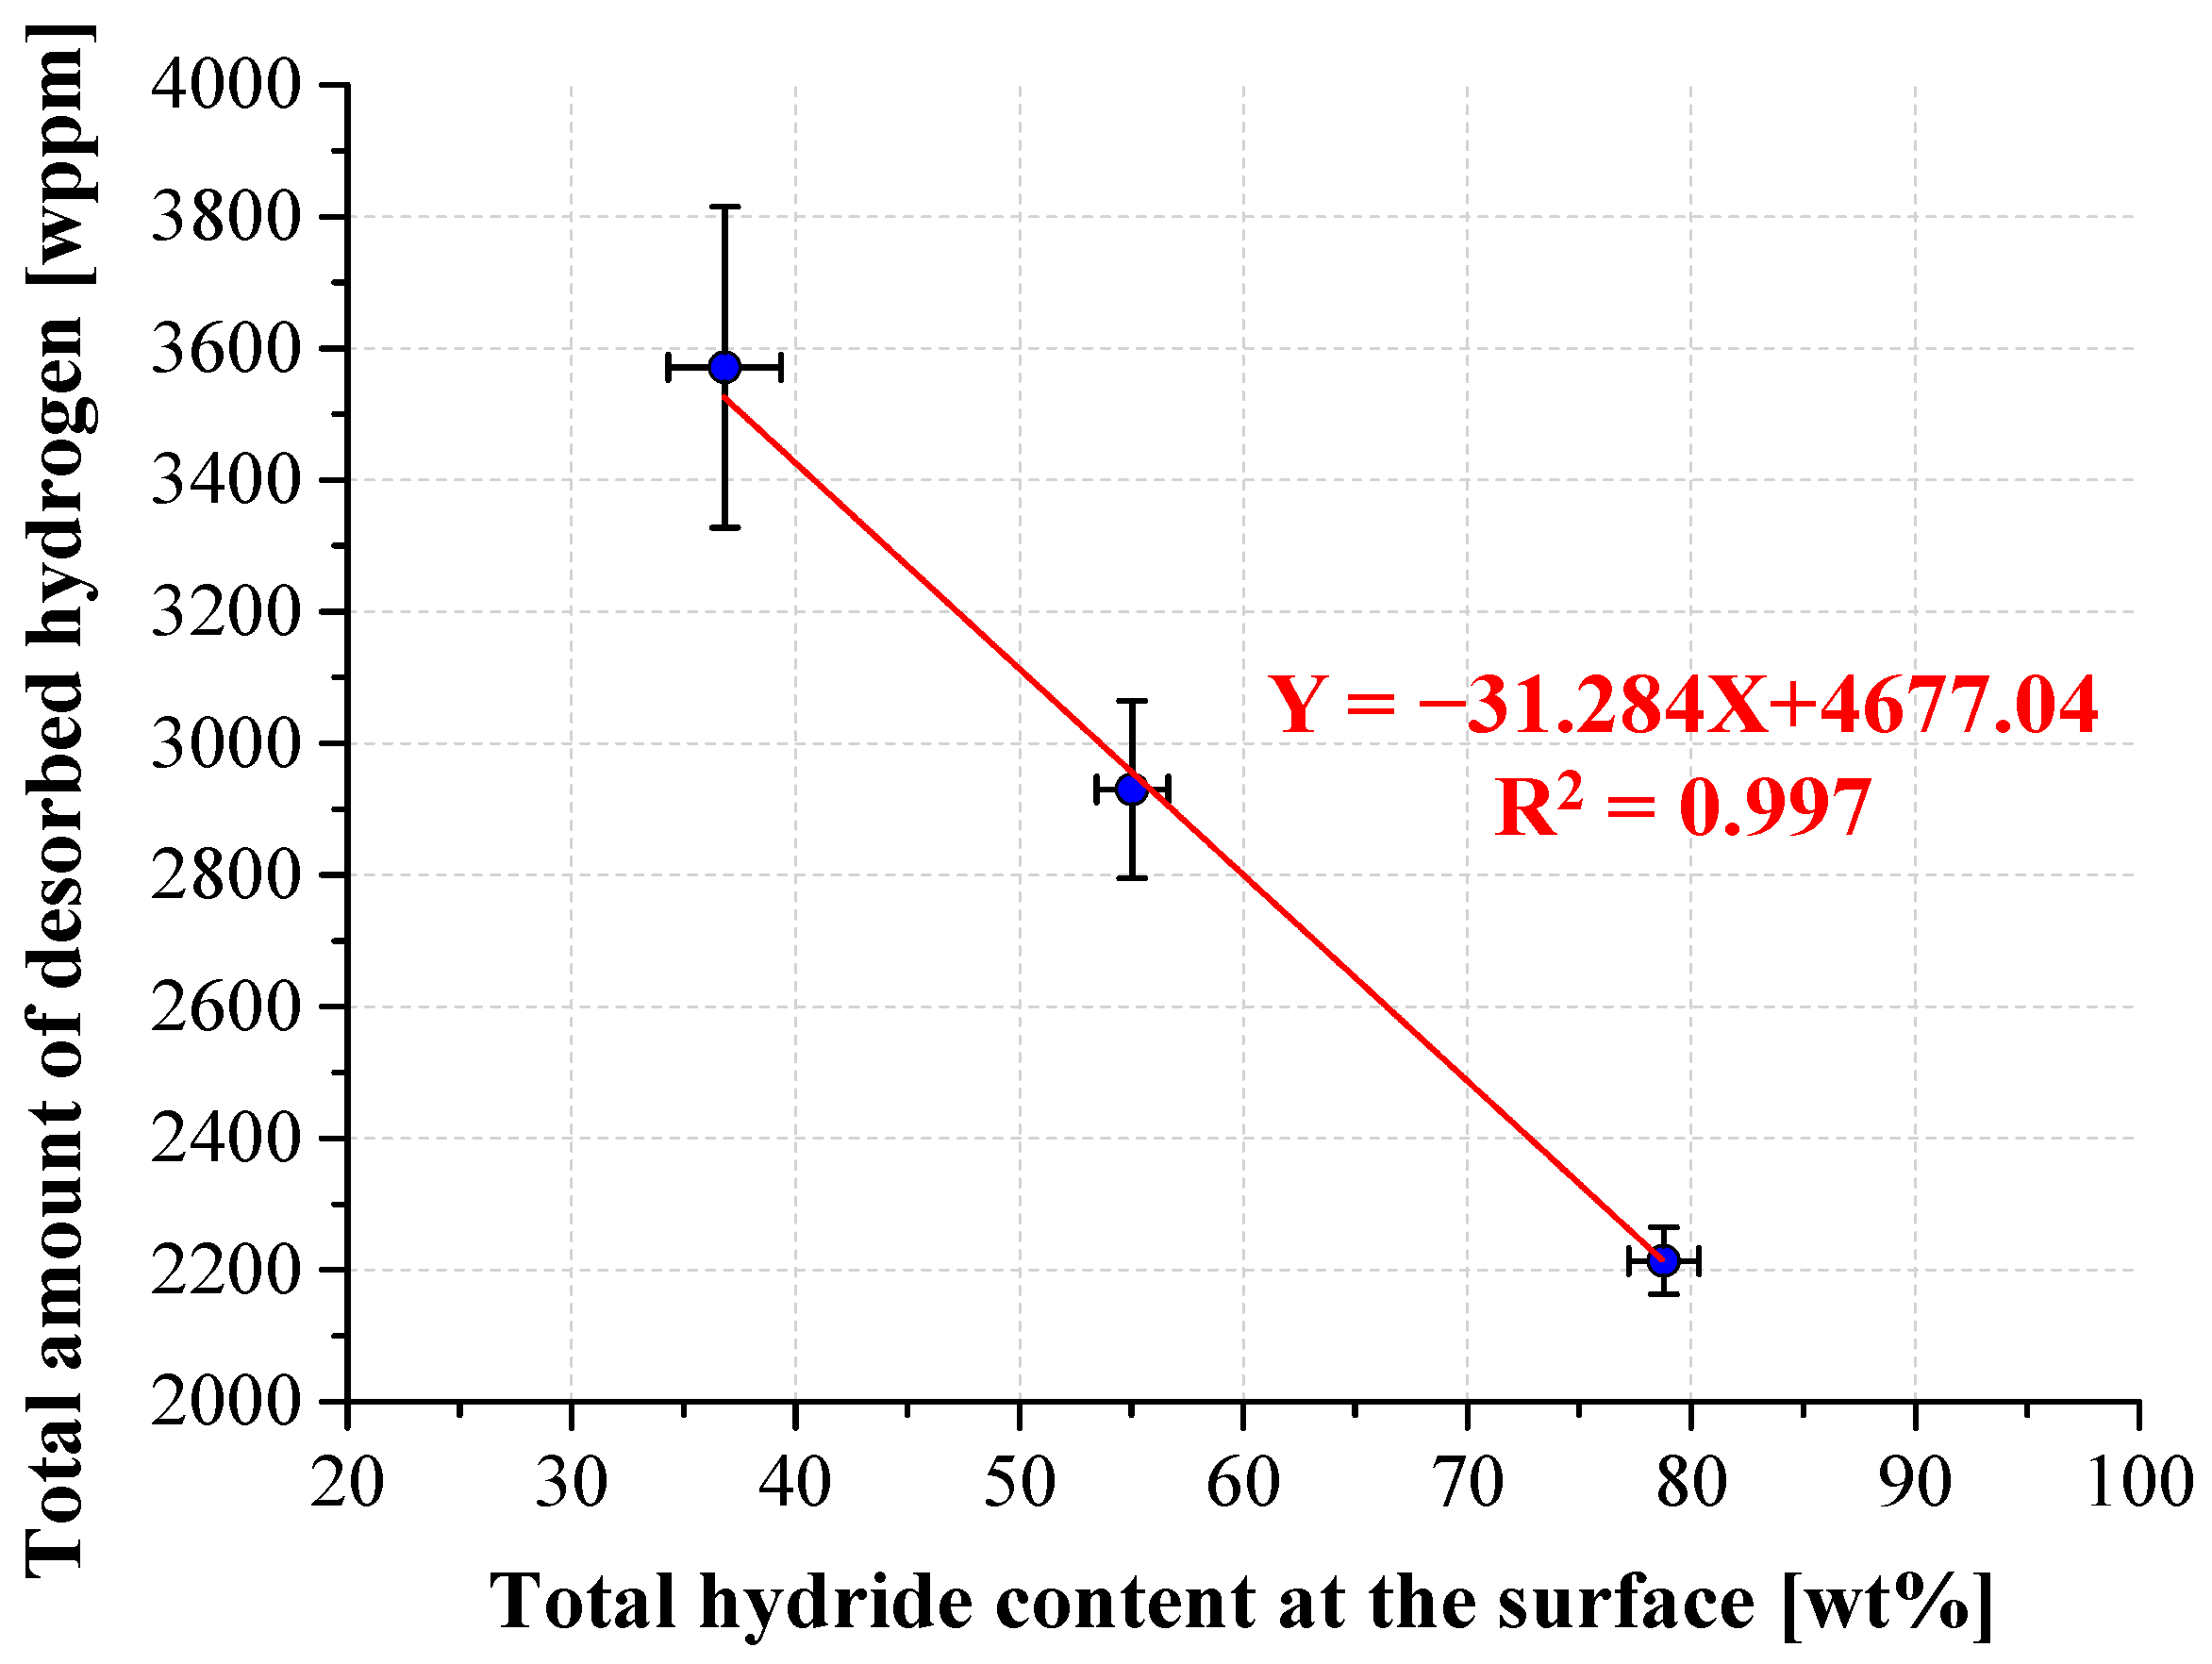
- Thermal/thermomechanical secondary processes of EBM Ti–6Al–4V alloy that promote an increase in the continuous β-phase morphology prior to EC are likely to make the alloy more susceptible to hydrogen embrittlement. The continuous β-phase morphology prevents hydride layer formation on the alloy’s surface, therefore enhancing hydrogen penetration into the bulk and increasing the alloy’s susceptibility to hydrogen embrittlement, compared to the as-built condition.
- In applications involving EBM Ti–6Al–4V alloys in electrochemical hydrogen environments, including biomedical and aircraft applications, it is advisable to apply specific secondary treatment process parameters that prevent the increase of continuous β-phase morphology.
Author Contributions
Funding
Institutional Review Board Statement
Informed Consent Statement
Data Availability Statement
Acknowledgments
Conflicts of Interest
References
- Boyer, R.R. An overview on the use of titanium in the aerospace industry. Mater. Sci. Eng. A 1996, 213, 103–114. [Google Scholar] [CrossRef]
- Eliaz, N. Corrosion of Metallic Biomaterials: A Review. Materials 2019, 12, 407. [Google Scholar] [CrossRef] [PubMed]
- Leyens, C.; Peters, M. Titanium and Titanium Alloys: Fundamentals and Applications; WILEY-VCH Verlag GmbH & Co. KGaA: Weinheim, Germany, 2003. [Google Scholar]
- Eliezer, D.; Eliaz, N.; Senkov, O.N.; Froes, F.H. Positive effects of hydrogen in metals. Mater. Sci. Eng. A 2000, 280, 220–224. [Google Scholar] [CrossRef]
- Paramore, J.D.; Fang, Z.Z.; Dunstan, M.; Sun, P.; Butler, B.G. Hydrogen-enabled microstructure and fatigue strength engineering of titanium alloys. Sci. Rep. 2017, 7, 41444. [Google Scholar] [CrossRef] [PubMed]
- Ding, R.; Guo, Z.X.; Wilson, A. Microstructural evolution of a Ti–6Al–4V alloy during thermomechanical processing. Mater. Sci. Eng. A 2002, 327, 233–245. [Google Scholar] [CrossRef]
- Kohn, D.H.; Ducheyne, P. Microstructural refinement of β-sintered and Ti–6Al–4V porous-coated by temporary alloying with hydrogen. J. Mater. Sci. 1991, 26, 534–544. [Google Scholar] [CrossRef]
- Lütjering, G. Influence of processing on microstructure and mechanical properties of (α+β) titanium alloys. Mater. Sci. Eng. A 1998, 243, 32–45. [Google Scholar] [CrossRef]
- Ma, H.Y.; Wang, J.C.; Qin, P.; Liu, Y.J.; Chen, L.Y.; Wang, L.Q.; Zhang, L.C. Advances in additively manufactured titanium alloys by powder bed fusion and directed energy deposition: Microstructure, defects, and mechanical behavior. J. Mater. Sci. Technol. 2024, 183, 32–36. [Google Scholar] [CrossRef]
- Lu, W.Q.; Liu, Y.J.; Wu, X.; Liu, X.C.; Wang, J.C. Corrosion and passivation behavior of Ti–6Al–4V surfaces treated with high-energy pulsed laser: A comparative study of cast and 3D-printed specimens in a NaCl solution. Surf. Coat. Technol. 2023, 470, 129849. [Google Scholar] [CrossRef]
- Madhavadas, V.; Srivastava, D.; Chadha, U.; Raj, S.A.; Sultan, M.T.H.; Shahar, F.S.; Shah, A.U.M. A review on metal additive manufacturing for intricately shaped aerospace components. CIRP J. Manuf. Sci. Technol. 2022, 39, 18–36. [Google Scholar] [CrossRef]
- Zhai, Y.; Galarraga, H.; Lados, D.A. Microstructure, static properties, and fatigue crack growth mechanisms in Ti–6Al–4V fabricated by additive manufacturing: LENS and EBM. Eng. Fail. Anal. 2016, 69, 3–14. [Google Scholar] [CrossRef]
- Kok, Y.; Tan, X.P.; Wang, P.; Nai, M.L.S.; Loh, N.H.; Liu, E.; Tor, S.B. Anisotropy and heterogeneity of microstructure and mechanical properties in metal additive manufacturing: A critical review. Mater. Des. 2018, 139, 565–586. [Google Scholar] [CrossRef]
- Svetlizky, D.; Zheng, B.; Vyatskikh, A.; Das, M.; Bose, S.; Bandyopadhyay, A.; Schoenung, J.M.; Lavernia, E.D.; Eliaz, N. Laser-based directed energy deposition (DED-LB) of advanced materials. Mater. Sci. Eng. A 2022, 840, 142967. [Google Scholar] [CrossRef]
- Lewandowski, J.J.; Seifi, M. Metal additive manufacturing: A review of mechanical properties. Ann. Rev. Mater. Res. 2016, 46, 151–186. [Google Scholar] [CrossRef]
- Stavropoulos, P.; Foteinopoulos, P.; Stavridis, J.; Bikas, H. Increasing the industrial uptake of additive manufacturing processes: A training framework. Adv. Ind. Manuf. Eng. 2023, 6, 100110. [Google Scholar] [CrossRef]
- Abu-Issa, A.; López, M.; Pickett, C.; Escarcega, A.; Arrieta, E.; Murr, L.; Wicker, R.; Ahlfors, M.; Godfrey, D.; Medina, F. Effects of altered hot isostatic pressing treatments on the microstructures and mechanical performance of electron beam melted Ti–6Al–4V. J. Mater. Res. Technol. 2020, 9, 8735–8743. [Google Scholar] [CrossRef]
- Ganor, Y.I.; Tiferet, E.; Vogel, S.; Brown, D.; Chonin, M.; Pesach, A.; Hajaj, A.; Garkun, A.; Samuha, S.; Shneck, R.; et al. Tailoring Microstructure and Mechanical Properties of Additively-Manufactured Ti6Al4V Using Post Processing. Materials 2021, 14, 658. [Google Scholar] [CrossRef] [PubMed]
- Pushilina, N.S.; Stepanova, E.N.; Kudiiarov, V.N.; Laptev, R.S.; Syrtanov, M.S. Heat treatment of the Ti–6Al–4V alloy manufactured by electron beam melting. AIP Conf. Proc. 2019, 2167, 020290. [Google Scholar]
- Illsley, H.; Lancaster, R.J.; Hurst, R.; Jeffs, S.; Baxter, G. Mechanical property characterisation of electron beam melted (EBM) Ti–6Al–4V via small punch tensile testing. Key Eng. Mater. 2017, 734, 51–60. [Google Scholar] [CrossRef]
- Eliaz, N.; Gileadi, E. Physical Electrochemistry: Fundamentals, Techniques, and Applications, 2nd ed.; Wiley-VCH: Weinheim, Germany, 2019. [Google Scholar]
- Madina, V.; Azkarate, I. Compatibility of materials with hydrogen. Particular case: Hydrogen embrittlement of titanium alloys. Int. J. Hydrogen Energy 2009, 34, 5976–5980. [Google Scholar] [CrossRef]
- Lulu-Bitton, N.; Sabatani, E.; Rosen, B.A.; Kostirya, N.; Agronov, G.; Tiferet, E.; Eliaz, N.; Navi, N.U. Mechanical behavior of electrochemically hydrogenated electron beam melting (EBM) and wrought Ti–6Al–4V using small punch test. Int. J. Hydrogen Energy 2022, 47, 6388–6403. [Google Scholar] [CrossRef]
- Lulu-Bitton, N.; Navi, N.U.; Rosen, B.A.; Haroush, S.; Sabatani, E.; Eretz-Kdosha, Y.; Agronov, G.; Eliaz, N. The influence of gaseous hydrogen charging on the microstructural and mechanical behavior of electron beam melted and wrought Ti–6Al–4V alloys using the small punch test. Int. J. Hydrogen Energy 2023, 48, 34077–34093. [Google Scholar] [CrossRef]
- Fukai, Y. (Ed.) Metal-Hydrogen System Under Extended p, T Conditions. In The Metal-Hydrogen System: Basic Bulk Properties; Springer: Berlin/Heidelberg, Germany, 2005; pp. 91–145. [Google Scholar]
- Luo, L.; Su, Y.; Guo, J.; Fu, H. Formation of titanium hydride in Ti–6Al–4V alloy. J. Alloys Compd. 2006, 425, 140–144. [Google Scholar] [CrossRef]
- Liu, H.J.; Zhou, L.; Liu, P.; Liu, Q.W. Microstructural evolution and hydride precipitation mechanism in hydrogenated Ti–6Al–4V alloy. Int. J. Hydrogen Energy 2009, 34, 9596–9602. [Google Scholar] [CrossRef]
- Pushilina, N.; Syrtanov, M.; Kashkarov, E.; Murashkina, T.; Kudiiarov, V.; Laptev, R.; Lider, A.; Koptyug, A. Influence of Manufacturing Parameters on Microstructure and Hydrogen Sorption Behavior of Electron Beam Melted Titanium Ti–6Al–4V Alloy. Materials 2018, 11, 763. [Google Scholar] [CrossRef] [PubMed]
- Pushilina, N.; Panin, A.; Syrtanov, M.; Kashkarov, E.; Kudiiarov, V.; Perevalova, O.; Laptev, R.; Lider, A.; Koptyug, A. Hydrogen-induced phase transformation and microstructure evolution for Ti–6Al–4V parts produced by electron beam melting. Metals 2018, 8, 301. [Google Scholar] [CrossRef]
- Kim, J.; Tasan, C.C. Microstructural and micro-mechanical characterization during hydrogen charging: An in situ scanning electron microscopy study. Int. J. Hydrogen Energy 2019, 44, 6333–6343. [Google Scholar] [CrossRef]
- Kim, J.; Plancher, E.; Tasan, C.C. Hydrogenation-induced lattice expansion and its effects on hydrogen diffusion and damage in Ti–6Al–4V. Acta Mater. 2020, 188, 686–696. [Google Scholar] [CrossRef]
- Kim, J.; Kang, J.; Tasan, C.C. Hydride formation in Ti6Al4V: An in situ synchrotron X-ray diffraction study. Scr. Mater. 2021, 193, 12–16. [Google Scholar] [CrossRef]
- Okamoto, H. H-Ti (hydrogen-titanium). J. Phase Equilibria Diffus. 2011, 32, 174. [Google Scholar] [CrossRef]
- Wu, T.I.; Wu, J.K. Effects of electrolytic hydrogenating parameters on structure and composition of surface hydrides of CP-Ti and Ti–6Al–4V alloy. Mater. Chem. Phys. 2002, 74, 5–12. [Google Scholar] [CrossRef]
- Sun, P.; Fang, Z.Z.; Koopman, M.; Paramore, J.; Chandran, K.S.R.; Ren, Y.; Lu, J. An experimental study of the (Ti–6Al–4V)–xH phase diagram using in situ synchrotron XRD and TGA/DSC techniques. Acta Mater. 2015, 84, 29–41. [Google Scholar] [CrossRef]
- Silverstein, R.; Eliezer, D. Hydrogen trapping in 3D-printed (additive manufactured) Ti–6Al–4V. Mater. Charact. 2018, 144, 297–304. [Google Scholar] [CrossRef]
- Zhang, H.; Leygraf, C.; Wen, L.; Huang, F.; Chang, H.; Jin, Y. The formation of hydride and its influence on Ti–6Al–4V alloy fracture behavior. Int. J. Hydrogen Energy 2023, 48, 36169–36184. [Google Scholar] [CrossRef]
- Pushilina, N.S.; Kudiiarov, V.N.; Syrtanov, M.S.; Kashkarov, E.B. Effect of the beam current during the electron-beam melting of titanium alloy Ti–6Al–4V on the structural features and phase transitions in gas-phase hydrogenation. J. Surf. Investig. X-ray Synchrotron Neutron Tech. 2019, 13, 429–433. [Google Scholar] [CrossRef]
- Bilgin, G.M.; Esen, Z.; Akın, Ş.K.; Dericioglu, A.F. Optimization of the mechanical properties of Ti–6Al–4V alloy fabricated by selective laser melting using thermohydrogen processes. Mater. Sci. Eng. A 2017, 700, 574–582. [Google Scholar] [CrossRef]
- Metalnikov, P.; Eliezer, D.; Ben-Hamu, G.; Tal-Gutelmacher, E.; Gelbstein, Y.; Munteanu, C. Hydrogen embrittlement of electron beam melted Ti–6Al–4V. J. Mater. Res. Technol. 2020, 9, 16126–16134. [Google Scholar] [CrossRef]
- Navi, N.U.; Tenenbaum, J.; Sabatani, E.; Kimmel, G.; Ben David, R.; Rosen, B.A.; Barkay, Z.; Ezersky, V.; Tiferet, E.; Ganor, Y.I.; et al. Hydrogen effects on electrochemically charged additive manufactured by electron beam melting (EBM) and wrought Ti–6Al–4V alloys. Int. J. Hydrogen Energy 2020, 45, 25523–25540. [Google Scholar] [CrossRef]
- Laptev, R.; Kudiiarov, V.; Pushilina, N. Hydrogen influence on defect structure and mechanical properties of EBM Ti–6Al–4V. Mater. Today Proc. 2019, 19, 2084–2088. [Google Scholar] [CrossRef]
- Gaddam, R.; Åkerfeldt, P.; Pederson, R.; Antti, M.L. Influence of hydrogen environment on the mechanical properties of cast and electron beam melted Ti–6Al–4V. In Proceedings of the 12th World Conference on Titanium, Beijing, China, 19–24 June 2011; Social Sciences Academic Press: Beijing, China, 2012; pp. 1885–1888. [Google Scholar]
- Metalnikov, P.; Eliezer, D.; Ben-Hamu, G. Hydrogen trapping in additive manufactured Ti–6Al–4V alloy. Mater. Sci. Eng. A 2021, 811, 141050. [Google Scholar] [CrossRef]
- Navi, N.U.; Rosen, B.A.; Sabatani, E.; Tenenbaum, J.; Tiferet, E.; Eliaz, N. Thermal decomposition of titanium hydrides in electrochemically hydrogenated electron beam melting (EBM) and wrought Ti–6Al–4V alloys using in situ high-temperature X-ray diffraction. Int. J. Hydrogen Energy 2021, 46, 30423–30432. [Google Scholar] [CrossRef]
- Brosh, E.; Navi, N.U.; Rosen, B.A.; Eliaz, N. Microvoids in electrochemically hydrogenated titanium-based alloys. Int. J. Hydrogen Energy 2021, 46, 27234–27242. [Google Scholar] [CrossRef]
- Kacenka, Z.; Roudnicka, M.; Ekrt, O.; Vojtech, D. High susceptibility of 3D-printed Ti–6Al–4V alloy to hydrogen trapping and embrittlement. Mater. Lett. 2021, 301, 130334. [Google Scholar] [CrossRef]
- Wu, W.; He, G.; Huang, J.; Zhang, A.; Liu, X.; Ouyang, Z.; Sun, Z.; Guan, L.; Chu, S.; Li, P.; et al. Influence of electrochemically charged hydrogen on mechanical properties of Ti–6Al–4V alloy additively manufactured by laser powder-bed fusion (L-PBF) process. Mater. Sci. Eng. A 2023, 866, 144339. [Google Scholar] [CrossRef]
- Priel, E.; Mittelman, B.; Trabelsi, N.; Lulu-Bitton, N.; Haroush, S.; Kalabukhov, S.; Hayun, S.; Navi, N.U. Small punch testing of Al-TiB2 composites fabricated by spark plasma sintering: A computational and experimental study. J. Compos. Mater. 2022, 56, 3957–3969. [Google Scholar] [CrossRef]
- Haroush, S.; Priel, E.; Moreno, D.; Bussiba, A.; Silverman, I.; Turgeman, A.; Shneck, R.; Gelbstein, Y. Evaluation of the mechanical behavior of the mechanical properties of SS-316L thin foils by small punch testing and finite element analysis. Mater. Des. 2015, 83, 75–84. [Google Scholar] [CrossRef]
- Haroush, S.; Moreno, D.; Bussiba, A.; Silverman, I.; Turgeman, A.; Shneck, R.; Gelbstein, Y. The mechanical behavior of HAVAR foils using the small punch test technique. Materials 2017, 10, 491. [Google Scholar] [CrossRef]
- Bruchhausen, M.; Austin, T.; Holmström, S.; Altstadt, E.; Dymacek, P.; Jeffs, S.; Lacalle, R.; Lancaster, R.; Matocha, K.; Petzova, J. European Standard on Small Punch Testing of Metallic Materials. In Proceedings of the ASME 2017—Pressure Vessels and Piping Conference, Waikoloa, HI, USA, 16–20 July 2017; American Society of Mechanical Engineers Digital Collection, ASME: New York, NY, USA, 2017. [Google Scholar]
- Snir, Y.; Haroush, S.; Danon, A.; Landau, A.; Gelbstein, Y.; Eliezer, D. Metallurgical and hydrogen effects on the small punch tested mechanical properties of PH-13-8Mo stainless steel. Materials 2018, 11, 1966. [Google Scholar] [CrossRef]
- Arroyo, B.; Álvarez, J.A.; Gutiérrez-Solana, F.; Lacalle, R.; González, P. Rate effects on the estimation of fracture toughness by small punch tests in hydrogen embrittlement. J. Strain Anal. Eng. Des. 2019, 54, 390–400. [Google Scholar] [CrossRef]
- Deconinck, L.; Villa Vidaller, M.T.; Bernardo Quejido, E.; Jägle, E.A.; Depover, T.; Verbeken, K. In-situ hydrogen embrittlement evaluation of as-built and heat treated laser powder bed fused Ti–6Al–4V versus conventionally cold rolled Ti–6Al–4V. Addit. Manuf. 2023, 76, 103768. [Google Scholar] [CrossRef]
- ASTM F3301-18a; Standard for Additive Manufacturing—Post Processing Methods—Standard Specification for Thermal Post-Processing Metal Parts Made Via Powder Bed Fusion. ASTM: West Conshohocken, PA, USA, 2018.
- Eliaz, N.; Eliezer, D.; Abramov, E.; Zander, D.; Köster, U. Hydrogen evolution from Zr-based amorphous and quasicrystalline alloys. J. Alloy. Compd. 2000, 305, 272–281. [Google Scholar] [CrossRef]
- Kirchheim, R.; McLellan, R.B. Electrochemical methods for measuring diffusivities of hydrogen in palladium and palladium alloys. J. Electrochem. Soc. 1980, 127, 2419–2425. [Google Scholar] [CrossRef]
- Spierings, A.; Schneider, M.; Eggenberger, R. Comparison of density measurement techniques for additive manufactured metallic Parts. Rapid Prototyp. J. 2011, 17, 380–386. [Google Scholar] [CrossRef]
- Ferreira, T.; Rasband, W. ImageJ User Guide. Available online: http://imagej.nih.gov/ij/docs/guide (accessed on 31 May 2024).
- Danon, A.; Avraham, I.; Koresh, J.E. Temperature programmed desorption-mass spectrometer with supersonic molecular beam inlet system. Rev. Sci. Instrum. 1997, 68, 4359–4363. [Google Scholar] [CrossRef]
- Verbeken, K. Analysing hydrogen in metals: Bulk thermal desorption (TDS) methods. In Gaseous Hydrogen Embrittlement of Materials in Energy Technologies; Gangloff, R.P., Somerday, B.P., Eds.; Woodhead Publishing Limited: Cambridge, UK, 2012; Volume 2, pp. 27–55. [Google Scholar]
- Suwarno, S.; Yartys, V.A. Kinetics of Hydrogen Absorption and Desorption in Titanium. Bull. Chem. React. Eng. Catal. 2017, 12, 312–317. [Google Scholar] [CrossRef]
- Ma, M.; Liang, L.; Wang, L.; Wang, Y.; Cheng, Y.; Tang, B.; Xiang, W.; Tan, X. Phase transformations of titanium hydride in thermal desorption process with different heating rates. Int. J. Hydrogen Energy 2015, 40, 8926–8934. [Google Scholar] [CrossRef]
- Ben David, R.; Finkelstein, Y.; Nativ-Roth, E.; Danon, A.; Cohen, D.; Rabkin, E. The role of surface coarsening and sintering during thermal decomposition of titanium hydride. Int. J. Hydrogen Energy 2019, 44, 6045–6054. [Google Scholar] [CrossRef]
- Zeppelin, F.V.; Haluška, M.; Hirscher, M. Thermal desorption spectroscopy as a quantitative tool to determine the hydrogen content in solids. Thermochim. Acta 2003, 404, 251–258. [Google Scholar] [CrossRef]
- Snir, Y.; Haroush, S.; Dannon, A.; Landau, A.; Eliezer, D.; Gelbstein, Y. Aging condition and trapped hydrogen effects on the mechanical behavior of a precipitation hardened martensitic stainless steel. J. Alloy. Compd. 2019, 805, 509–516. [Google Scholar] [CrossRef]
- ASTM F2924-14; Standard Specification for Additive Manufacturing Titanium-6 Aluminum-4 Vanadium with Powder Bed Fusion. ASTM: West Conshohocken, PA, USA, 2021. Available online: https://webstore.ansi.org/standards/astm/astmf292414 (accessed on 31 May 2024).
- Hayoun, M.; Eliaz, N.; Navi, N.U.; Lulu-Bitton, N.; Shekhter, P.; Sabatani, E. Electrochemical hydrogen permeation in wrought and electron beam melted Ti–6Al–4V alloys. Corros. Sci. 2024, 227, 111760. [Google Scholar] [CrossRef]
- Aucouturier, M. Grain boundary segregations and hydrogen embrittlement. J. Phys. Colloq. 1982, 43, 175–186. [Google Scholar] [CrossRef]
- Koike, J.; Shimoyama, Y.; Ohnuma, I.; Okamura, T.; Kainuma, R.; Ishida, K.; Maruyama, K. Stress-induced phase transformation during superplastic deformation in two-phase Ti–Al–Fe alloy. Acta Mater. 2000, 48, 2059–2069. [Google Scholar] [CrossRef]
- Li, X.; Ma, X.; Zhang, J.; Akiyama, E.; Wang, Y.; Song, X. Review of hydrogen embrittlement in metals: Hydrogen diffusion, hydrogen characterization, hydrogen embrittlement mechanism and prevention. Acta Metall. Sin. (Engl. Lett.) 2020, 33, 759–773. [Google Scholar] [CrossRef]
- Hruška, P.; Čížek, J.; Knapp, J.; Lukáč, F.; Melikhova, O.; Mašková, S.; Havela, L.; Drahokoupil, J. Characterization of defects in titanium created by hydrogen charging. Int. J. Hydrogen Energy 2017, 42, 22557–22563. [Google Scholar] [CrossRef]
- Lucon, E.; Benzing, J.T.; Derimow, N.; Hrabe, N. Small punch testing to estimate the tensile and fracture properties of additively manufactured Ti–6Al–4V. J. Mater. Eng. Perform. 2021, 30, 5039–5049. [Google Scholar] [CrossRef]


| Alloy | Designation | Secondary Process | |
|---|---|---|---|
| HIP | HT | ||
| EBM | As-built | none | none |
| HIP | As-built + HIP | 2 h at 920 °C, 120 MPa [18]; Heating and cooling rates: 4 °C/min | none |
| HT | As-built + HT | none | 2 h at 1000 °C; 10−3 mbar [18] |
| Element | As-Built | HIP | HT |
|---|---|---|---|
| C | 119 ± 6 | 123 ± 14 | 106 ± 15 |
| O | 1528 ± 34 | 1581 ± 9 | 1856 ± 89 |
| H | 48 ± 4 | 83 ± 8 | 71 ± 7 |
| N | 391 ± 41 | 404 ± 52 | 319 ± 74 |
| Total | 2086 ± 85 | 2191 ± 83 | 2352 ± 185 |
| Specimen | α/αH | β/βH | δa | δb |
|---|---|---|---|---|
| Non-hydrogenated as-built | a = 2.924 Å c = 4.668 Å | a = 3.192 Å | - | - |
| Non-hydrogenated HIP | a = 2.925 Å c = 4.669 Å | a = 3.213 Å | - | - |
| Non-hydrogenated HT | a = 2.924 Å c = 4.669Å | a = 3.209 Å | - | - |
| Hydrogenated as-built | a = 2.922 Å, c = 4.682 Å | a = 3.260 Å | a = 4.323 Å | a = 4.148 Å |
| Hydrogenated HIP | a = 2.925 Å, c = 4.666 Å | a = 3.279 Å | a = 4.299 Å | a = 4.137 Å |
| Hydrogenated HT | a = 2.926 Å, c = 4.669 Å | a = 3.278 Å | a = 4.307 Å | a = 4.144 Å |
| Alloy | Pmax [N] | δmax [mm] | E [J/mm] | |
|---|---|---|---|---|
| Non- hydrogenated | EBM | 1327.6 ± 56.8 | 0.815 ± 0.065 | 1.56 ± 0.17 |
| HIP | 1365.6 ± 35.8 | 0.893 ± 0.056 | 1.73 ± 0.23 | |
| HT | 1293.3 ± 45.7 | 0.933 ± 0.045 | 1.67 ± 0.19 | |
| Hydrogenated | EBM | 711.3 ± 50.8 | 0.351 ± 0.035 | 0.37 ± 0.10 |
| HIP | 474.6 ± 39.0 | 0.207 ± 0.022 | 0.13 ± 0.02 | |
| HT | 460.6 ± 43.4 | 0.221 ± 0.020 | 0.14 ± 0.03 |
Disclaimer/Publisher’s Note: The statements, opinions and data contained in all publications are solely those of the individual author(s) and contributor(s) and not of MDPI and/or the editor(s). MDPI and/or the editor(s) disclaim responsibility for any injury to people or property resulting from any ideas, methods, instructions or products referred to in the content. |
© 2024 by the authors. Licensee MDPI, Basel, Switzerland. This article is an open access article distributed under the terms and conditions of the Creative Commons Attribution (CC BY) license (https://creativecommons.org/licenses/by/4.0/).
Share and Cite
Lulu-Bitton, N.; Navi, N.U.; Haroush, S.; Sabatani, E.; Kostirya, N.; Tiferet, E.; Ganor, Y.I.; Omesi, O.; Agronov, G.; Eliaz, N. The Effects of Hot Isostatic Pressing (HIP) and Heat Treatment on the Microstructure and Mechanical Behavior of Electron Beam-Melted (EBM) Ti–6Al–4V Alloy and Its Susceptibility to Hydrogen. Materials 2024, 17, 2846. https://doi.org/10.3390/ma17122846
Lulu-Bitton N, Navi NU, Haroush S, Sabatani E, Kostirya N, Tiferet E, Ganor YI, Omesi O, Agronov G, Eliaz N. The Effects of Hot Isostatic Pressing (HIP) and Heat Treatment on the Microstructure and Mechanical Behavior of Electron Beam-Melted (EBM) Ti–6Al–4V Alloy and Its Susceptibility to Hydrogen. Materials. 2024; 17(12):2846. https://doi.org/10.3390/ma17122846
Chicago/Turabian StyleLulu-Bitton, Noa, Nissim U. Navi, Shlomo Haroush, Eyal Sabatani, Natalie Kostirya, Eitan Tiferet, Yaron I. Ganor, Ofer Omesi, Gennadi Agronov, and Noam Eliaz. 2024. "The Effects of Hot Isostatic Pressing (HIP) and Heat Treatment on the Microstructure and Mechanical Behavior of Electron Beam-Melted (EBM) Ti–6Al–4V Alloy and Its Susceptibility to Hydrogen" Materials 17, no. 12: 2846. https://doi.org/10.3390/ma17122846