1. Introduction
In contemporary manufacturing, numerical simulations have become indispensable tools for sheet metal forming processes, particularly in industries like automotive production. Stamping processes often encounter challenges such as wrinkles, cracks, and thinning, demanding substantial resources and costs for resolution [
1,
2,
3]. Traditional trial-and-error or experimental-based tool design approaches are progressively being supplanted by finite element simulation systems [
4,
5,
6,
7]. Simulation offers a crucial avenue for enhancing product quality, curtailing mold production times, pre-emptively detecting errors before testing [
8], and thereby minimizing defective output rates [
9].
Finite element methodology, coupled with ABAQUS 6.13 software, is harnessed here to investigate the ramifications of the punch and die shaft deflection on both stamping force and the distribution of wall thickness in SECC sheet billets [
10]. In leveraging the Hill model and SECC material’s forming limit curve in numerical simulations, this study predicts two misalignment conditions of punch–mortar interactions—single-axis and multi-axis misalignment. Substantial punch–mortar misalignment is shown to correlate with elevated stamping forces and uneven, thinner cup wall thickness distribution. In previous studies [
11,
12], numerical simulations were utilized to investigate the effects of various process parameters on the fracture height of cylindrical cups fabricated from SECC. Specifically, parameters such as punch corner radius (Rp), die corner radius (Rd), punch/die clearance (Wc), and blank holder force (BHF) were examined in relation to the forming height of cylindrical cups. The research extends to the optimization of forming height, wherein suitable parameters are determined by evaluating the deviation between simulation and experimental outcomes. Additionally, the study proposes the formulation of a precise mathematical equation to forecast fracture height under diverse machining conditions, with a maximum observed deviation of 4.52% between the mathematical model and simulation. A subsequent investigation [
12] analyzed the influence of BHF and limited drawing ratio (Mt) on the formation of cylindrical cups from electrolytically galvanized (SECC) steel billets with a thickness of 0.6 mm. Initial exploratory experiments were conducted to establish the research boundaries of the input parameters. Subsequently, the impact of BHF and Mt on the fracture height of cylindrical cups (H) was assessed. Findings indicate that with a fixed Mt, an increase in BHF from 8 to 12 kN results in a decrease in (H). Conversely, when BHF is fixed and Mt increases from 1.94 to 2.09, the (H) increases. However, as Mt continues to rise to 2.24, the (H) decreases.
Neto et al. [
13] have conducted finite element simulations to assess the influence of stress criteria and the methodologies employed to ascertain their parameters. Stress criteria including von Mises [
14], Hill’48 [
15], and Barlat Yld’91 [
16] are examined in the context of the inverted depth drawing of cylindrical cups. Similarly, Dal and his collaborators [
17] have scrutinized inner wall wrinkles in the cylindrical cup pressing process, using diverse constitutive models for numerical simulations involving AA5042-H2 aluminum alloy. These models encompass yield criteria such as CPB06ex2, Hill’48, BBC2008-8p, and BBC2008-16p, with both isotropic stiffness and von Mises yield criteria.
In another vein, Said and colleagues [
18] have proposed a mathematical model rooted in the plasticity of sheet materials, employing simulation to predict cracks during deep drawing processes. The study introduces a constitutive equation for material anisotropic ductility. Barrera et al. [
19] have studied the EK4 material in deep drawing, initially conducting sheet sample pull tests in rolling, diagonal, and transverse directions. The Hollomon–Coulomb hardness models and the Hill48 model were subsequently evaluated and validated through numerical simulations, aligning with Erichsen technology wherein materials experience a primarily biaxial stress state. The predictions obtained demonstrated commendable agreement when compared to corresponding experimental measurements.
Szewczyk et al. [
20] conducted friction testing using a specially designed friction simulator and performed uniaxial tensile tests to determine the mechanical properties of the specimens. In their study, they used commonly available oils as lubricants, which are relatively inexpensive compared to the specialized lubricants typically used in sheet metal forming for deep drawing processes. Friction analysis using flat die strip drawing tests was primarily performed on samples with cylindrical or circular surfaces. Djordjević et al. [
21] examined a friction model based on the deep drawing process of an AlMg4.5Mn0.7 aluminum alloy sheet sliding between TiN-coated flat contact surfaces under variable drawing forces. Their methodology included analytically predetermined contact pressure functions, allowing for the determination of the relationship between the drawing force and the friction coefficient under various conditions.
The present research employs finite element simulations to meticulously assess and select stress criteria for the accurate prediction of crack heights in cylindrical cups composed of SECC sheets. The central focus lies in scrutinizing diverse stress criteria’s impact on crack height and comparing outcomes with experimental cup height measurements. Specifically, the von Mises, Hill’48R, and Hill’48S stress functions are explored in conjunction with Swift’s hardening law [
22], each assessed across orientations of 0°, 45°, and 90° relative to the rolling direction. Anisotropy parameters for the Hill’48 criterion are determined through two distinct approaches. The first involves utilizing anisotropy values r
0, r
90, and r
45 from three uniaxial tensile tests (0°, 45°, and 90° relative to the rolling direction) alongside the uniaxial yield stress σ
0, as computed via the Hill’48R stress model. The second approach relies on triple stresses σ
0, σ
45, and σ
90, along with the anisotropy coefficient in the tensile direction r
0, as determined by the Hill’48S model. A comparison between simulation and experimental results underscores the effectiveness of the selected stress criteria, with potential applications for a more precise prediction of fracture heights across a diverse range of cylindrical cups, each characterized by distinct technological parameters.
2. Material and Method
The concept of isotropic hardening is fundamental to most analyses of sheet metal forming. Numerous isotropic hardening laws have been developed to accurately characterize the stress–strain behavior of various sheet metals [
23]. The Swift model, in particular, is widely applied and effectively represents the stress–strain response of body-centered cubic (BCC) materials, including iron, stainless steel, and high-strength steel. This study focuses on SECC material, an electro-galvanized cold-rolled steel with a thickness of 0.6 mm, conforming to the Japanese standard JIS G 3313 [
24]. This steel also corresponds to the ST12 grade under the DIN 1623 standard [
25] and is equivalent to the DC01 grade in the EN 10130 standard [
26]. The stress–strain relationship utilized in this study is described by the Swift model, expressed as follows:
where
represents the yield stress and equivalent strain. The material constants
K,
n, and
only are appraised by scrutinizing uniaxial tensile test outcomes on material samples as per the standard procedure.
The determination of material parameters was carried out through conventional uniaxial tensile tests. Experimental stress–strain curves were obtained by measuring the responses along three distinct orientations relative to the rolling direction (RD). The Swift isotropic stiffness model was subsequently developed by fitting the stress–strain curves across all directions, utilizing the coefficients specified in Equation (1). During the numerical simulation process, the material properties of SECC [
10] steel were specified as follows: density (ρ = 7.85 × 10
−6 kg/mm
3), elastic modulus (E = 184 kN/mm
2), and Poisson’s ratio (ν = 0.33). The material parameters (K, n, and
) were derived from uniaxial tensile tests conducted in the rolling direction, resulting in the following values: K = 473.5 MPa,
MPa, and n = 0.226. The anisotropic coefficients, r0, r45, and r90, were determined to be 1.56, 1.21, and 1.8, respectively.
In this study, the anisotropic parameters of the SECC material are assessed using two stress functions: von Mises and Hill’48. The commonly employed isotropic stress function, von Mises stress (Equation (2)), stands as a foundational reference in sheet metal forming analysis.
where
represents the equivalent stress, while
, and
denote the principal stresses along three distinct directions.
For the flat stress case, this is expressed as Equation (3):
For materials characterized by anisotropic properties, the stress–strain curves differ across various directions. The Hill’48 model, acknowledged as the primary anisotropic stress criterion, provides an equivalent stress calculated through Equation (4):
Here,
, and
signify the stress components in the respective directions, and G, F, H, N, L, and M denote the material constants deduced from experimental data. In the case of plane stress (
), Equation (4) is simplified to Equation (5):
Two distinct methods are utilized to determine the anisotropic parameters for the Hill’48 model. The first approach employs anisotropy values (r0, r90, and r45) obtained from uniaxial tensile tests (0°, 45°, and 90° relative to RD), combined with uniaxial yield stress (σ0) calculated using the Hill’48R stress model. The second method is predicated on triple stress values (σ0, σ45, and σ90) and the anisotropy coefficient (r0) calculated using the Hill’48S model. For directions where assessing metal sheet anisotropy proves challenging, parameters defining those properties are assumed isotropic in both Hill’48 approaches, with L and M values set to 1.5.
Alternatively, for the Hill’48 stress criterion operating under flat stress conditions (
), the uniaxial yield stress in the θ direction, aligned with the rolling direction, is defined by Equation (6). Consequently, the prediction of uniaxial anisotropy in the same rolling direction θ is facilitated through the utilization of the stress criterion depicted in Equation (7). The process of determining anisotropy parameters for the Hill’48 stress criterion is rooted in the experimental yield stress and the experimental coefficient of the plastic anisotropy of materials.
Table 1 provides detailed parameters for the Hill’48R and Hill’48S criteria. Notably, the coefficient specified in Equation (5) corresponds to the Hill’48R model, as outlined in Equations (8a)–(8d), maintaining the same values presented in
Table 1.
The determination of anisotropy parameters based on experimental yield stress and experimental coefficients of plastic anisotropy is presented in
Table 1. The approach also involves calculating the Hill’48R and Hill’48S parameters outlined in
Table 1.
The coefficients outlined in Equation (5) are consistent with the Hill’48S model, characterized by Equations (9a)–(9d). These specific parameters are extracted directly from the triaxial yield stress values, namely σ
0, σ
45, and σ
90, along with the equi-biaxial tension stress, σ
b [
27]. Herein, the stress values σ
y and σ
0, are attributed as σ
y = σ
0 = 152.5 MPa and σ
b = 165.2 MPa, respectively. The coefficients G, H, F, and N are ascertained according to the indications laid out in
Table 1.
In light of the coefficients calculated according to the stress models of Hill’48-R and Hill’48S (
Table 1), coefficients
R11,
R22,
R33,
R12,
R13, and
R23 are determined using Equation (10), providing results presented in
Table 2.
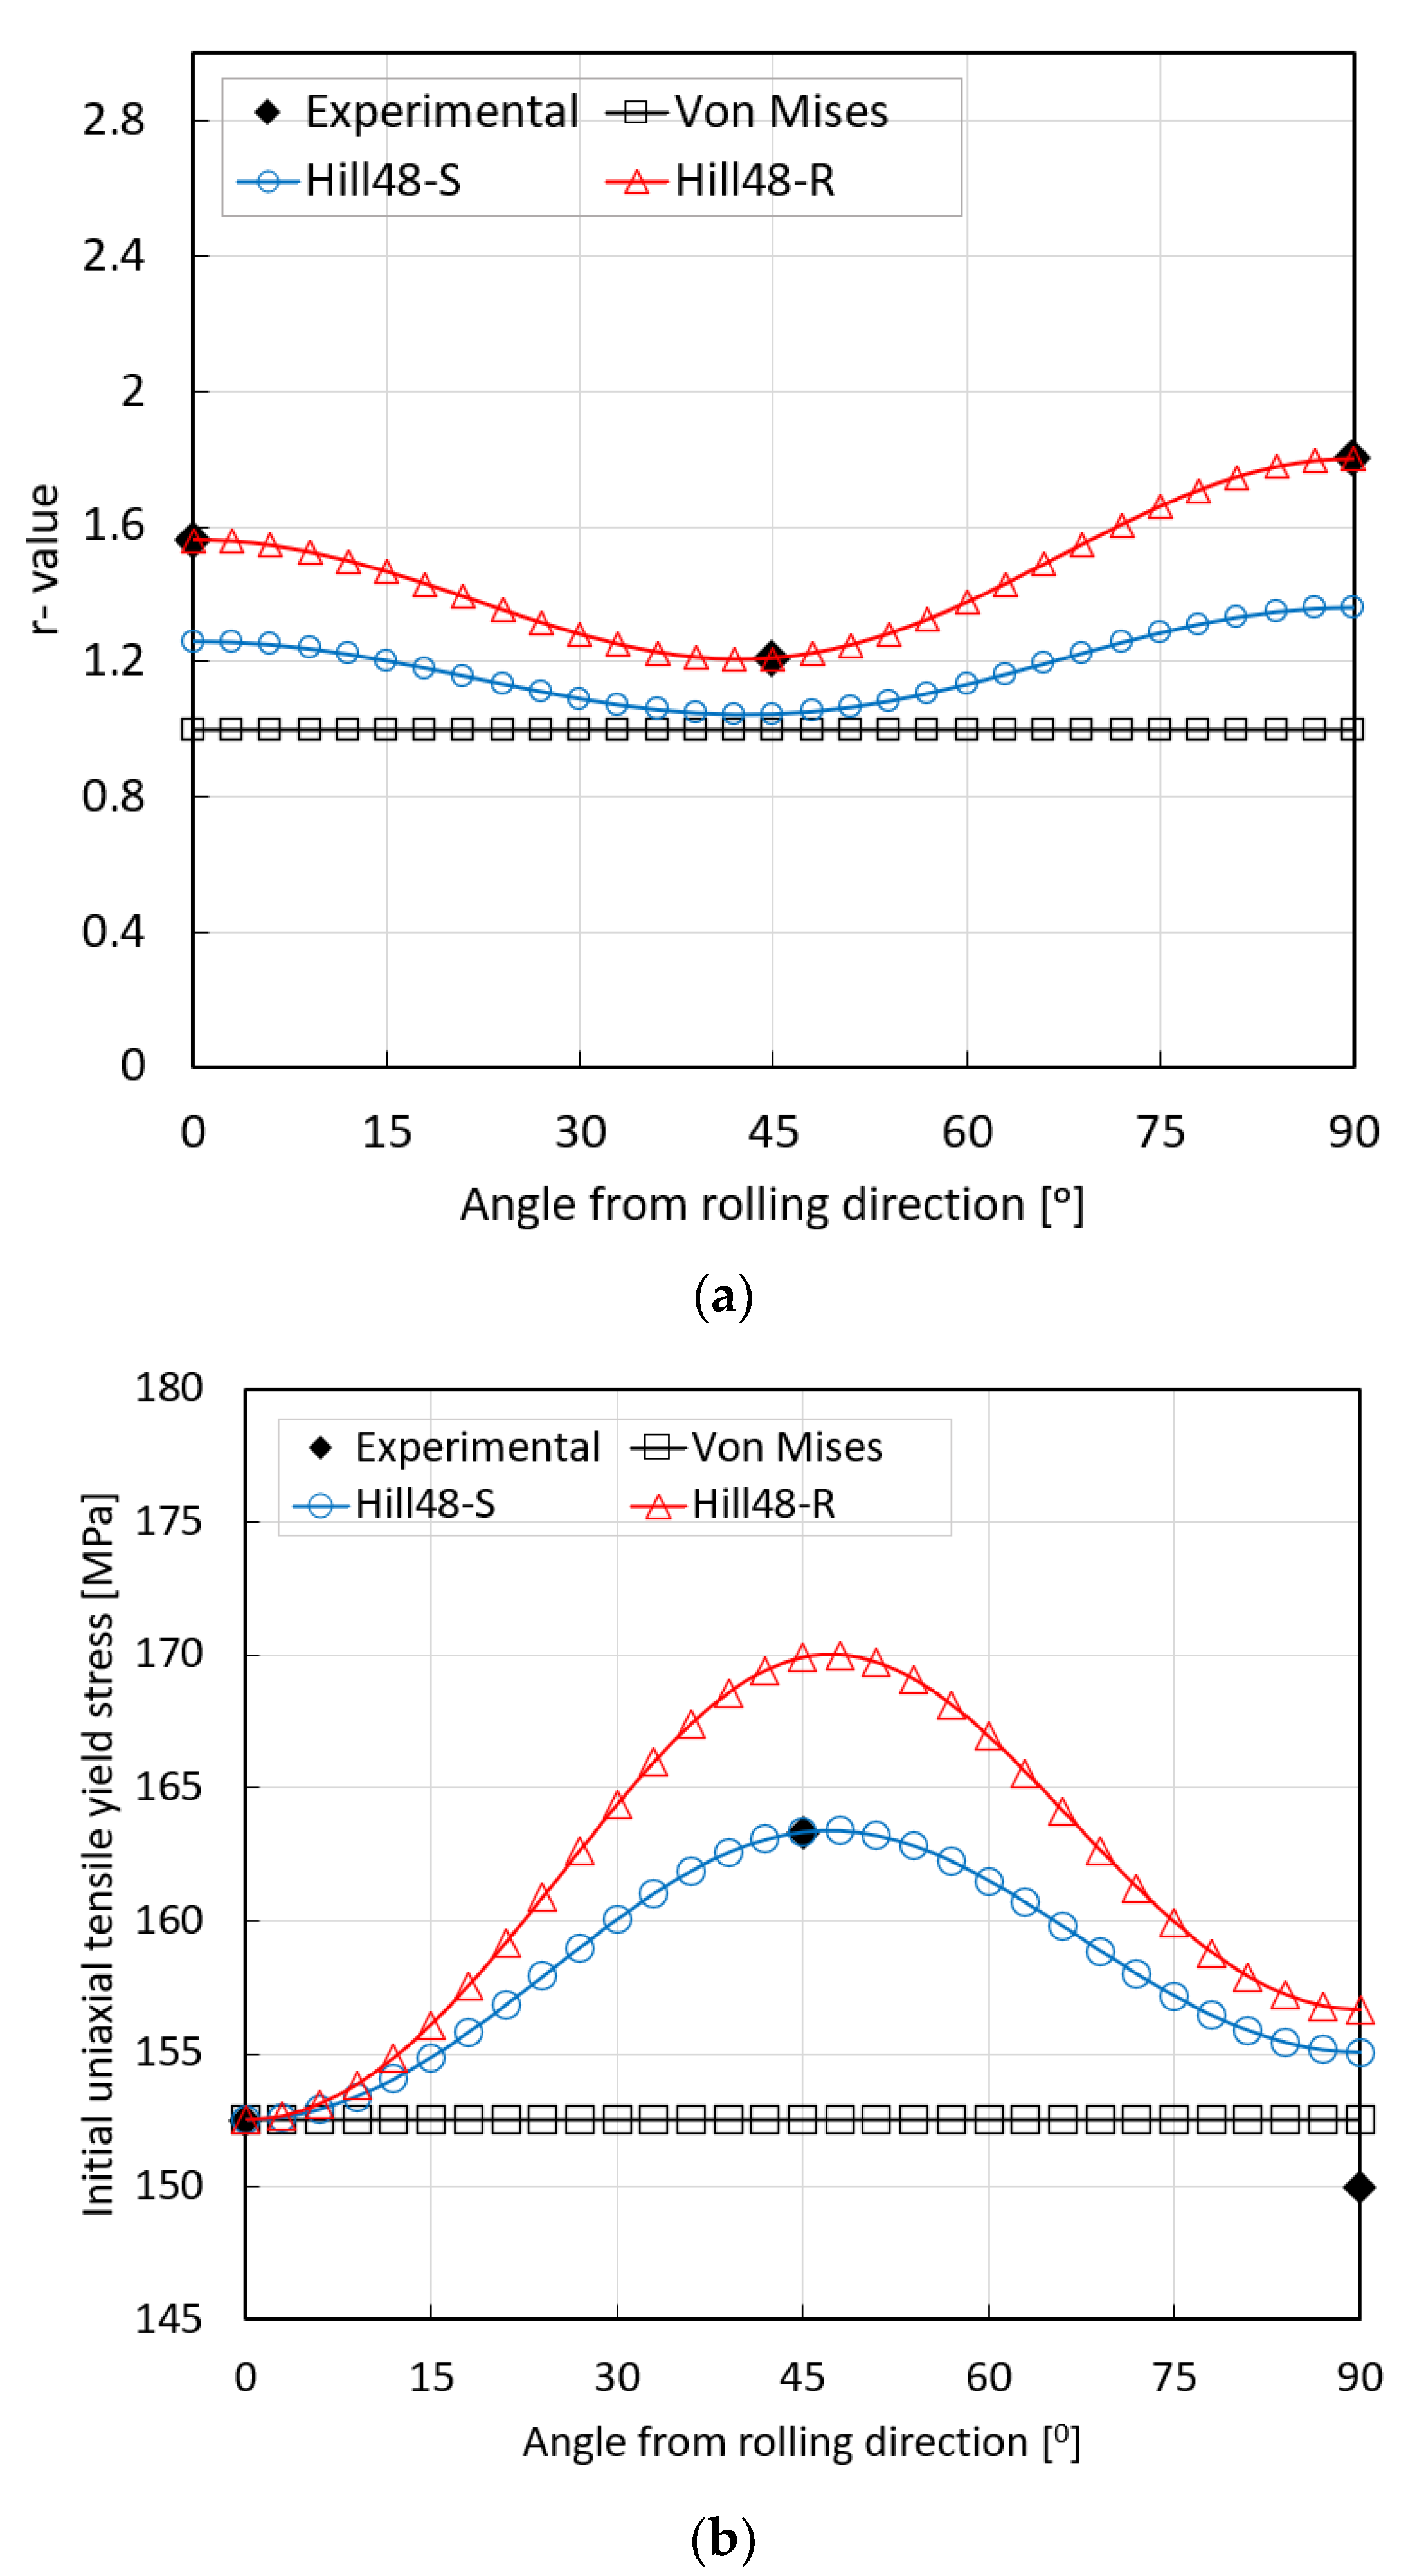
This study critically examines different stress criteria, including von Mises, Hill’48R, and Hill’48S, by comparing them with experimental data. The distribution of uniaxial anisotropy in the plane and the stress distribution in different directions relative to the rolling direction are presented in
Figure 1a,b, respectively. Results indicate the Hill’48R criterion aligns closely with experimental values. In contrast, the Hill’48S model exhibits lower dislocation values in the 90° test direction, with a maximum deviation of 0.44. The von Mises model, inherently isotropic, presents a higher deviation of 0.8.
Figure 1b illustrates that all three stress models converge with the experimental value in the 0° direction. However, for the Hill’48R model, in the 90° direction and the 45° direction relative to the rolling direction, the stress is higher than the experimental value. The Hill’48S model aligns with the experiment in the 0° and 45° directions, while in the 90° direction, it predicts a higher value than the experimental one, deviating by 5.04 MPa. Lastly, the von Mises model forecasts a stress value lower than the experimental value in the 45° direction, with a deviation of 10.83 MPa, and in the 90° direction, the stress value is 2.5 MPa higher than the experimental value.
Figure 2 presents the predicted stress surfaces using different yield criteria for σ
11 and σ
22. The von Mises stress model yields a maximum stress value of 176,053 MPa, the Hill’48R criterion stands at 198,088 MPa, and the Hill’48S criterion reaches 186,609 MPa.
In this preliminary analysis, a rigorous assessment is conducted to validate the accuracy of several critical factors in the context of SECC material behavior. These factors encompass the plasticity model, stress model, and anisotropy coefficient. The primary objective is to ascertain their reliability and fidelity in representing the material’s response under various conditions. To commence this evaluation, particular attention is directed towards the distribution of uniaxial anisotropy within the material plane and the corresponding stress distribution. Notably, the obtained data consistently aligns with the experimental data, particularly when considering the rolling direction at 0°. This alignment serves as a significant validation of the models under investigation. Subsequently, the stress–strain curve derived from Swift’s model, specifically applied to the rolling direction at 0°, is leveraged as a pivotal component in simulating the deep drawing process of cylindrical cups. This strategic choice ensures that the simulation closely mimics real-world conditions, capitalizing on the validated model and the associated anisotropy coefficients. In the context of the deep drawing simulation, the forming height is meticulously examined and compared across three von Mises models: the conventional von Mises model, Hill’48R, and Hill’48S. This comprehensive analysis establishes a clear correlation between the chosen models and their ability to replicate the actual deep drawing process. The results of this preliminary analysis, thus far, demonstrate a noteworthy level of consistency between the simulated outcomes and the corresponding experimental benchmarks. This alignment underscores the utility and reliability of the chosen modeling approaches and their capacity to provide valuable insights into the complex behavior of SECC materials during deep drawing processes.
4. Results and Discussion
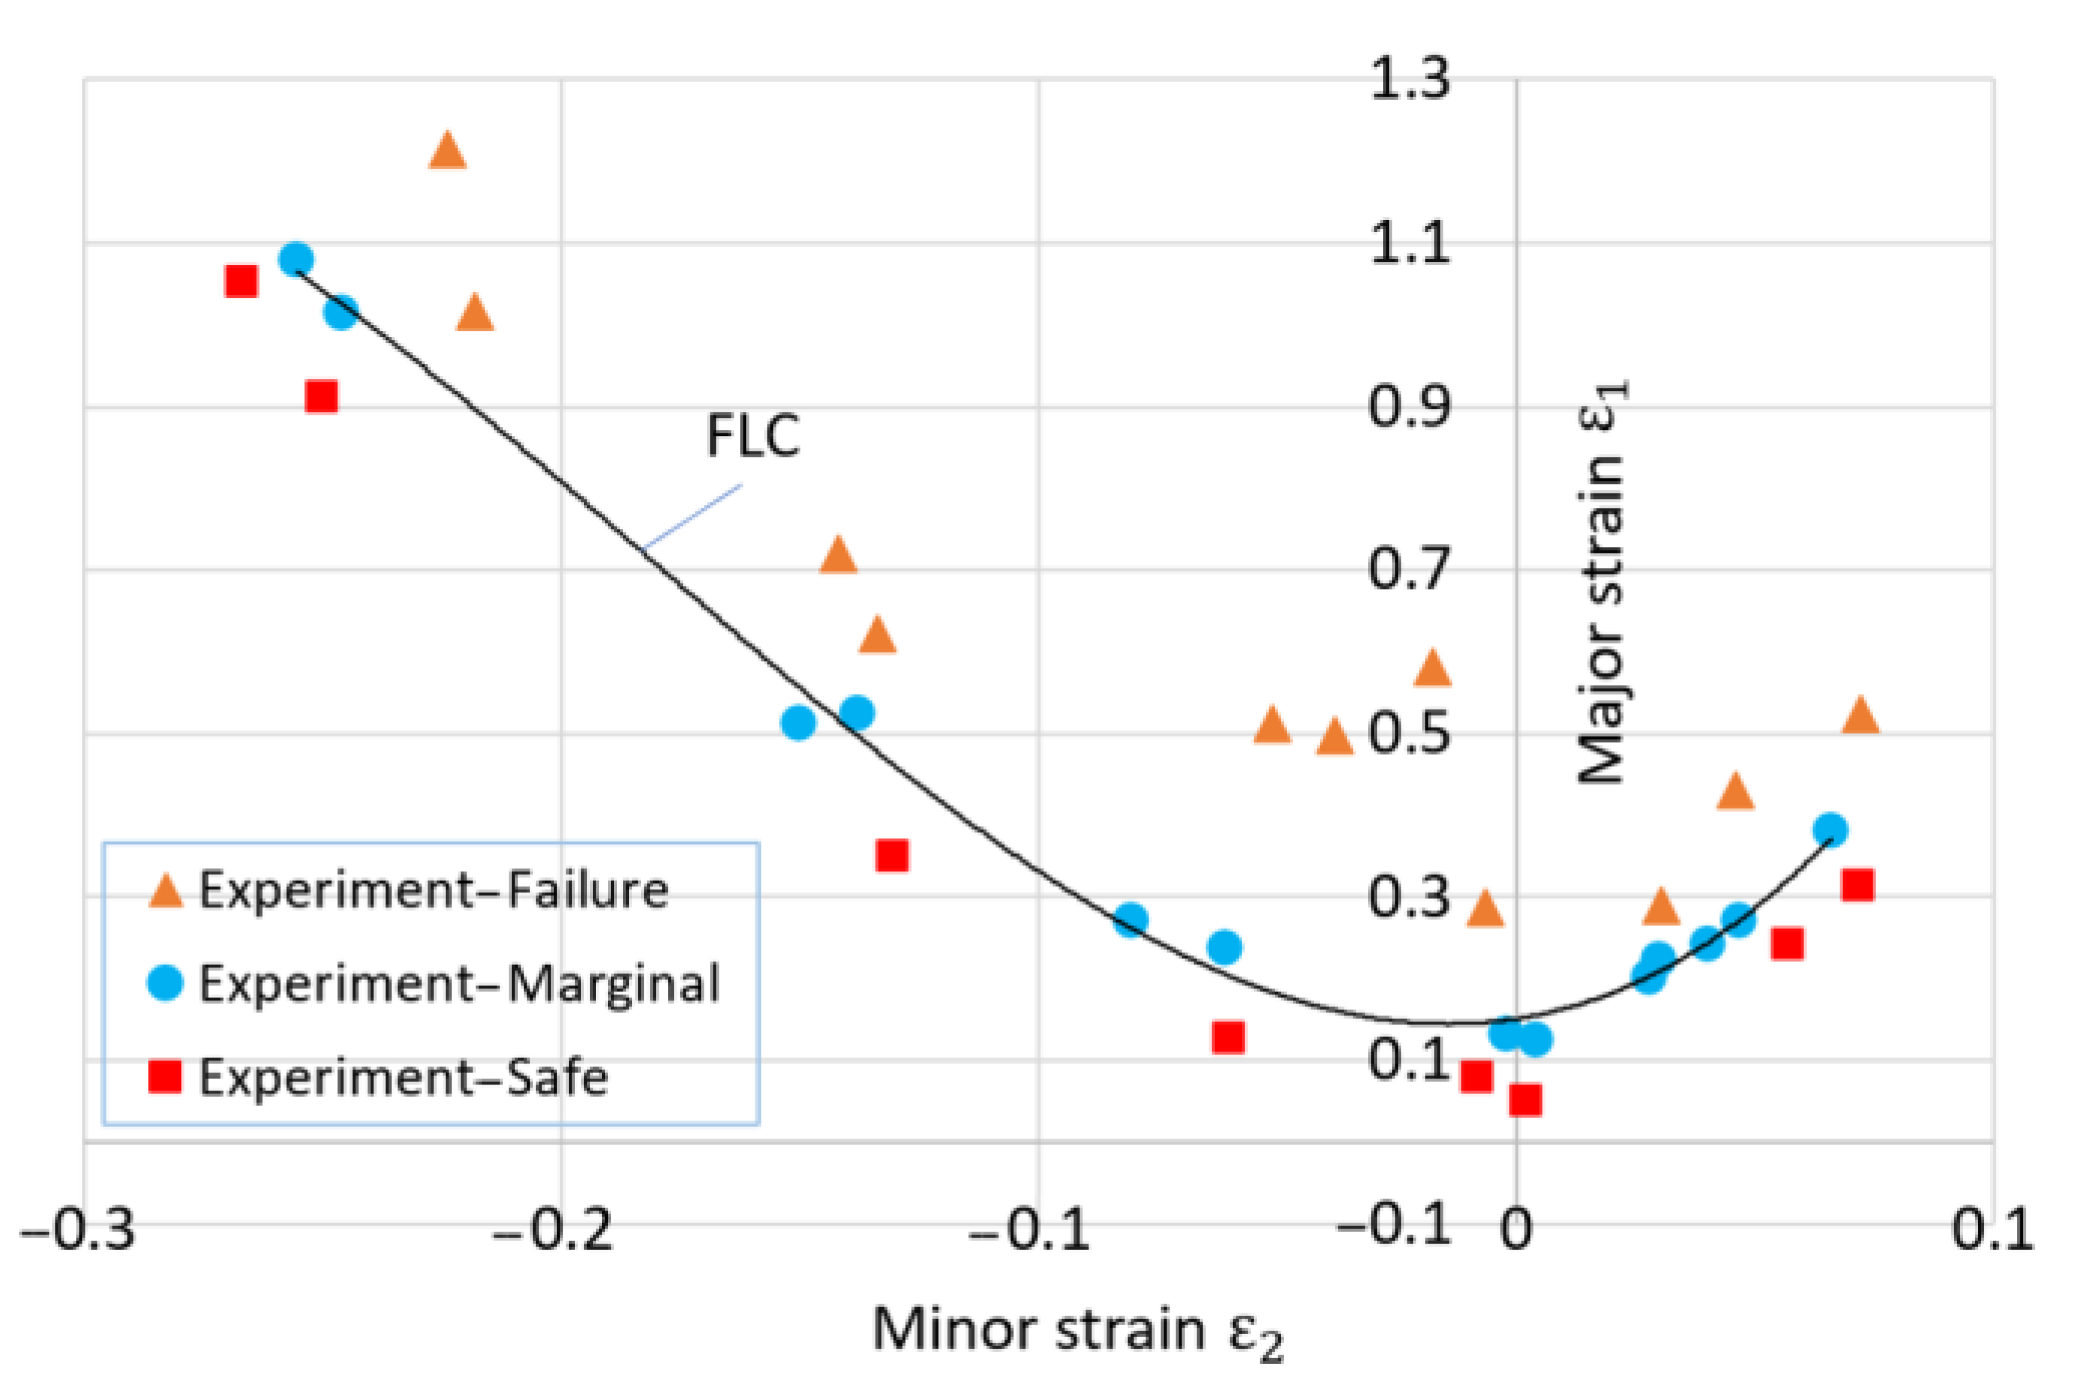
The findings of the finite element simulation, which employs Swift’s hardening law and focuses specifically on the 0-degree rolling direction, coupled with the utilization of stress models including von Mises, Hill’48S, and Hill’48R to predict tear height in the context of deep drawing cylindrical cups, have been subject to rigorous scrutiny. Within the simulations, the damage evolution criterion stands as a pivotal element utilized to simulate material failure and fracture. This criterion is defined by the point where the forming limit curve ductile fracture (FLDCRT) value reaches 1.0, indicating a fracture condition to ascertain fracture height (H) in the FEM simulation. To assess the disparities between simulated and experimental tear heights, we have employed the formulation presented in Equation (11).
Figure 7a–c have been included to visually represent the simulated outcomes using the von Mises stress model, Hill’48S, and Hill’48R, respectively.
Figure 7a vividly illustrates a uniformly rounded rim profile for the cylindrical cup, suggesting isotropic behavior, in accordance with the predictions of the von Mises stress model. On the other hand,
Figure 7b presents a rim profile that initially exhibits a tendency towards an oval shape, hinting at a departure from isotropic behavior. Strikingly,
Figure 7c stands out by showcasing a rim profile that closely resembles that of the experimental cup. This observation underscores the remarkable alignment between the simulated outcome and experimental reality. For a quantitative assessment of forming heights and deviations between the cylindrical cups, a detailed comparison between simulation and experimentation is presented in
Table 3. Notably, it is observed that the discrepancy between the height predicted by the von Mises stress model and the actual tear height observed in the experiment amounts to 10.42%. Conversely, the deviation between the simulated forming height according to the Hill’48S stress model and the experimental height is notably lower at 5.63%. The smallest discrepancy, only 2.14%, corresponds to the Hill’48R model. This comprehensive comparative analysis serves to emphasize a remarkable alignment between the forming height of the cylindrical cup as predicted by the simulation employing the Hill’48R stress model and the experimental results.
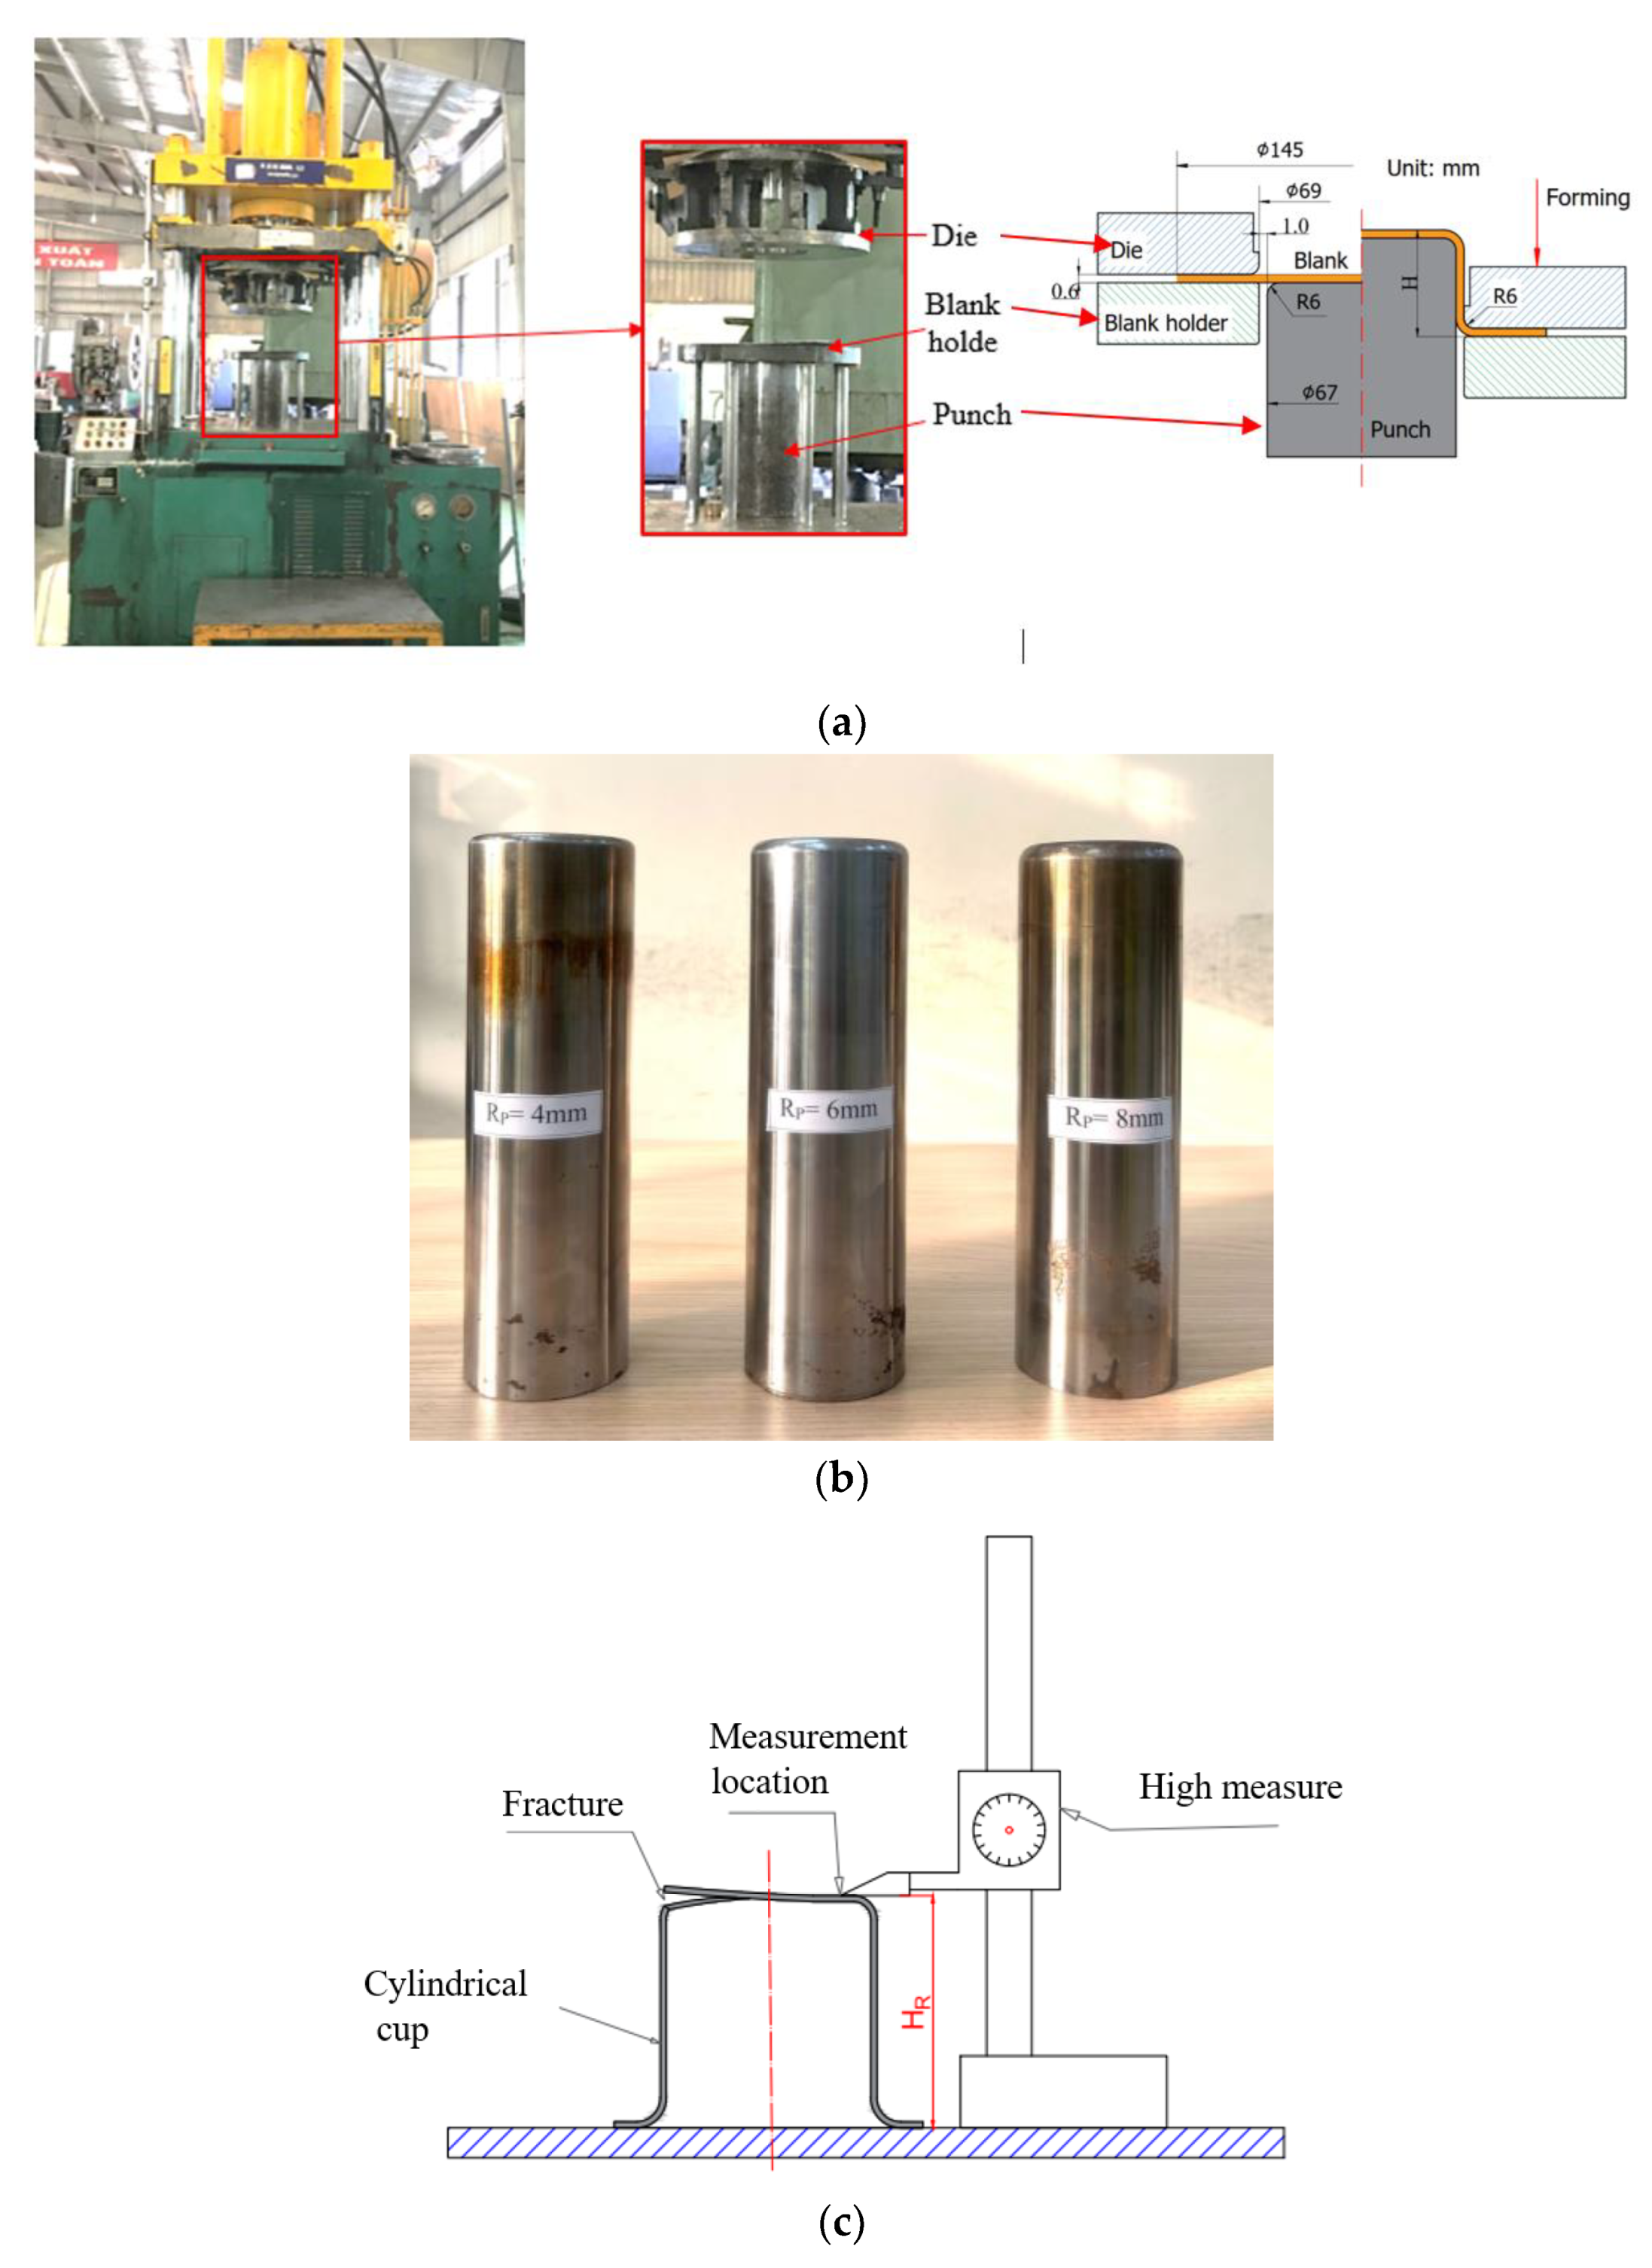
In order to establish the robustness and reliability of the Hill’48R stress model for the numerical simulation of the deep drawing process for cylindrical cups, an extensive verification and confirmation process was conducted. This study aimed to assess the model’s suitability under varying conditions by altering two key parameters: the punch’s corner radius (Rp) and the blank holder force (BHF). It is important to note that all other process parameters remained consistent with previous settings. The deep drawing process underwent thorough simulation and experimentation involving varying punch corner radii and blank holder forces, leading to three distinct scenarios: deep drawing with Rp = 4 mm and BHF = 12 kN, visualized in
Figure 8a; deep drawing with Rp = 6 mm and BHF = 10 kN, as portrayed in
Figure 8b; and deep drawing with Rp = 8 mm and BHF = 14 kN, depicted in
Figure 8c. A meticulous analysis was conducted to scrutinize the outcomes, with a specific emphasis on the resulting forming heights and deviations. These findings have been comprehensively documented in
Table 4, providing a quantitative assessment, and further illustrated in
Figure 9 to offer a graphical representation for clarity and reference. The results of this investigation reveal a strikingly good agreement between the simulated and experimental fracture heights in all three scenarios. The observed deviations are notably low, further confirming the reliability of the Hill’48R stress model. Specifically, when changing the parameters to Rp = 4 mm and BHF = 12 kN, the deviation is found to be 2.77%. In the case of Rp = 6 mm and BHF = 10 kN, the deviation reduces to just 1.25%, demonstrating a high degree of accuracy. Finally, when altering the parameters to Rp = 8 mm and BHF = 14 kN, the deviation remains modest at 3.23%. Crucially, in each of these scenarios, the simulation successfully replicates the cup’s rim profile, mirroring the corresponding experimental outcomes. This consistency and alignment between simulation and experimentation, even when varying the deep stamping process parameters, underpin the conclusion that the Hill’48R stress model is indeed suitable for subsequent simulations involving SECC sheet materials.


