Article

New-Generation Materials for Hydrogen Storage in Medium-Entropy Alloys

1
Faculty of Materials, Metallurgy and Recycling, Technical University of Kosice, Letna 9, 042 00 Kosice, Slovakia
2
Institute of Materials Research, Slovak Academy of Sciences, Watsonova 47, 040 01 Kosice, Slovakia
3
Institut für Nichtklassische Chemie, Permoserstraße 15, 04318 Leipzig, Germany
*
Author to whom correspondence should be addressed.
Materials 2024, 17(12), 2897; https://doi.org/10.3390/ma17122897
Submission received: 12 April 2024 / Revised: 4 June 2024 / Accepted: 10 June 2024 / Published: 13 June 2024
(This article belongs to the Special Issue Future Trends in High-Entropy Alloys (2nd Edition))

Abstract

:
This study presents the design, preparation, and characterization of thirty new medium-entropy alloys (MEAs) in three systems: Al-Ti-Nb-Zr, Al-Ti-Nb-V, and Al-Ti-Nb-Hf. The hardness of the alloys ranged from 320 to 800 HV0.3. Among the alloys studied, Al15Ti40Nb30Zr15 exhibited the highest-reversible hydrogen storage capacity (1.03 wt.%), with an H/M value of 0.68, comparable to LaNi5, but with a reduced density (5.11 g·cm−3) and without rare earth elements. This study further reveals a strong correlation between hardness and hydrogen absorption/desorption; higher hardness is responsible for reduced hydrogen uptake. This finding highlights the interplay between a material’s properties and hydrogen storage behavior in MEAs, and has implications for the development of efficient hydrogen storage materials.

1. Introduction

Hydrogen is widely used as a process gas in industrial applications, such as reduction processes, ammonia production, oil refining, and chemical production, but it is also used, for example, in electrical engineering in the production of semiconductors, contact cleaning, etc. However, hydrogen is also an energy carrier, which means that it can be used to store, transfer, and release energy. Hydrogen plays an important role in the European Union’s (EU) energy and climate strategy [1]. The EU has set ambitious targets to achieve a sustainable, low-carbon, and competitive energy future, in which hydrogen is seen as a key part of this strategy. A significant feature of hydrogen is its environmental friendliness during its combustion with oxygen, enabling hydrogen energy to be harnessed without releasing CO2, a major contributor to air pollution. Thus, it offers a solution for the decarbonization of industrial processes and economic sectors in which a reduction in carbon emissions is urgent but still difficult to achieve. All of this makes hydrogen essential to meet the EU’s commitment to carbon neutrality by 2050. Currently, hydrogen, as an energy carrier, represents only a small fraction of the EU’s global energy mix, which the European community intends to significantly change in its strategy in the coming years. Its production, which today is almost exclusively from fossil fuels, especially from natural gas or coal, and which leads to the annual release of 70 to 100 million tons of CO2 in the EU, will undergo a significant change. In order for hydrogen to contribute to carbon neutrality, it is therefore necessary to significantly change the way it is initially obtained and, at the same time, to expand its use in industry and transport in order to decarbonize various sectors. As part of its strategy, the EU has set an ambitious target of producing at least 6 gigawatts (GW) of electrolyzers to produce hydrogen from renewable energy sources by 2024, and 40 GW of electrolyzers by 2030 [2]. These targets are intended to support the rapid development of the hydrogen economy and create the market conditions for hydrogen to be used a clean fuel and energy carrier. By achieving this EU goal, it is assumed that the share of hydrogen in Europe’s energy mix will increase from the current amount of less than 2% to 13–14% by 2050. In terms of use, the EU’s ambition is to replace fossil fuels with hydrogen in carbon-intensive industrial processes, such as the steel and chemical industries, reducing greenhouse gas emissions and further strengthening the global competitiveness of these industries [3,4].
The primary techniques for hydrogen storage consist of both physical and chemical methods. The physical approaches involve compressing hydrogen, turning it into a liquid, employing cryo-compression, or adsorbing it physically. Conversely, the chemical methods rely on metal hydrides, complex hydrides, liquid organic hydrides, and caster hydrides [5].
Metal hydrides originate from the reversible interaction between a metal or alloy capable of hydride formation, or an intermetallic (IMC) compound, and hydrogen gas (H2).
IMCs can encompass AB5 types (e.g., LaNi5, CaNi5) [6], AB2 varieties (e.g., ZrMn2, ZrV2, ZrCr2), AB types (e.g., TiFe [6]), and A2B compounds (e.g., Ti2Ni, Zr2Fe). In a binary IMC, A typically represents a hydride-forming element, while B denotes a transition or non-transition metal/element that does not typically form a stable hydride under standard conditions.
Most IMC hydrides exhibit reversible hydrogen storage capacities that are practically achievable and typically do not surpass 2 wt.% H. For instance, AB5 hydrides generally achieve around 1.5 wt.% H, AB2 hydrides about 1.8 wt.% H, and BCC alloys approximately 2.0 wt.% H. Consequently, extensive investigations have been conducted on light metal hydrides, like MgH2 [7] and AlH3, for hydrogen storage purposes. Despite their notable gravimetric capacities, reaching 7.6 wt.% H for MgH2 and 10.1 wt.% H for AlH3, these materials are beset by other limitations. For instance, MgH2 requires elevated working temperatures [8], while AlH3 synthesis directly necessitates kbar H2 pressures and high temperatures [9].
The identification of metal hydrides suitable for efficient hydrogen storage was proclaimed in the late 1960s, coinciding with the emergence of intermetallic hydrides of the AB5 configuration, where A represents a rare earth metal and B stands for Ni or Co. Notably, compounds like LaNi5 have demonstrated remarkable efficacy as chemically reversible reservoirs for hydrogen gas.
Solid-state hydrogen storage stands out as a highly promising method. Particularly noteworthy within this domain are alloys, which have emerged as leading materials for hydrogen storage due to their advantageous cost, safety features, and operational parameters, notably their high energy density per unit volume. For instance, a widely employed commercial hydrogen storage alloy found in nickel–metal hydride batteries is the AB5 alloy, characterized by a CaCu5 crystal structure. Nonetheless, conventional alloys encounter numerous challenges in hydrogen storage. Each alloy exhibits a unique set of strengths and weaknesses, and their collective performance still falls short of the targets set by the EU. However, a promising avenue lies in a novel class of alloy materials known as medium-entropy alloys (MEAs) [10].
Regarding complex hydrides, over the last twenty years, research endeavors have progressively directed attention towards solid-state materials incorporating complexes of light elements, such as boron, aluminum, and nitrogen. These complexes, including (BH4) [9], [AlH4] [8], (AlH6)3−, (NH2), and (NH)2−, are coordinated with one or more metals [11].
Among the various categories of multiprincipal element alloys (MPEAs/HEAs), there has been notable attention given to refractory alloys featuring a bcc lattice, along with substitutions involving lightweight elements.
Within the entire chain of hydrogen production, from renewable sources, to storage, to use in industry or in the conversion of fuel cells into electricity, this work focuses on the possible storage of hydrogen in metal alloys. In particular, the development of new alloys (medium-entropy alloys), which ensures high compression and volume density by binding hydrogen in the metal lattice, is the focus of this research activity. Alloys with moderate entropy values, ranging from 1.0 R to 1.5 R, have gained increasing interest among researchers [12,13]. This growing interest stems from their remarkable characteristics, including their impressive mechanical properties [13,14], strong corrosion resistance [15,16], and notable structural stability [17]. The mixing entropy effect in these alloys typically leads to the formation of single-phase structures, such as Face-Centered Cubic (FCC), Body-Centered Cubic (BCC), and Hexagonal Closed Packed (HCP) [18]. An “excellent” step forward in this direction is represented by the publication of M. Sahlberg et al.’s paper, entitled “Superior hydrogen storage in high entropy alloys” [18]. In this study, the authors investigated the hydrogenation of a high-entropy alloy in a TiVZrNbHf solid solution with a BCC structure, and found that it was possible to absorb an extremely large amount of hydrogen (2.7 wt.% hydrogen). The amount of hydrogen corresponded to an H/M ratio of 2.5, and set a world record for volumetric energy density of 219 kg H/m3 [16,19].
Certain systems, like TiVNbTa, TiVZrNb, and TiVZrNbHf, have exhibited phase separation phenomena during the cycling of hydrogen absorption and desorption [20,21], particularly under the elevated temperatures typically required for hydrogen desorption from hydrides [22].
In recent examinations, the absorption characteristics of hydrogen in the Zr-deficient TiVZrNb alloy, featuring a non-equimolar composition, have been scrutinized to enhance procedural synthesis and cycling performance. This alloy crystallizes into a solitary-phase bcc structure, manifesting hydrogen assimilation within a single progression, mirroring the behavior of the TiVZrNbHf alloy. The utmost hydrogen uptake that has been attained is roughly 1.75 H/M (2.5 wt.% H). The most efficient hydrogen cycling attributes are apparent in the bct hydride variation, demonstrating an analogous capacity (1.8 H/M) achieved via reactive milling. A consistent reversible capacity of approximately 2.0 wt.% H has been noted, and attributed to the lack of disproportionate or irreversible segregation throughout the hydrogenation process [23].
The most auspicious candidates for hydrogen storage consist of bcc MPEAs/HEAs derived from refractory metals, possessing a VEC ≥ 5.0, coupled with substantial lattice distortion and undergoing single-phase transitions throughout the hydrogenation process.
For instance, leveraging these findings, TiVCrNbH8 (VEC = 5) emerges as a viable candidate for solid-state hydrogen storage. This HEA-based hydride exhibits a reversible hydrogen storage capacity of 1.96 wt.% H at room temperature (RT), and moderate H2 pressures. Notably, it does not necessitate any intricate activation procedures for hydrogen absorption [24].
This research focuses on developing new alloys that offer both low density and high hydrogen storage capacity, without the utilization of rare earth elements.

2. Methodology and Experiments

Alloys AlxTixNbxZrx, AlxTixNbxVx, and AlxTixNbxHfx were produced from pure elements (Al-99.95%, ChemPur (Karlshure, Germany); Ti-99.95%, Alfa Aesar (Haverhill, MA, USA); Nb-99.8%, Alfa Aesar (Haverhill, MA, USA); Zr-99.8%, ChemPur (Karlshure, Germany); V-99.9% ChemPur (Karlshure, Germany); Hf-99.9%, ChemPur (Karlshure, Germany)) by arc melting in a Mini Arc Melting System MAM-1 (Edmund-Bűhler, Bodelshausen, Germany) furnace in an atmosphere of protective gas (Ar with purity 99.999%) [25]. To ensure a clean atmosphere for melting the alloys, a small quantity of titanium was melted in the furnace chamber using the guttering method. This process effectively removed impurities and gas contaminants from the furnace environment. The arc melting of the charge was performed 5 times, with the sample being rotated after each melting. This ensured the homogeneity of the elements in the volume of the alloy.
In the first step, the density of the alloys was determined by the Archimedes method, using precise laboratory scales Kern ABT 120-4M (Merck Life Science spol. s r.o, Bratislava, Slovakia) with a special adapter ABT-A01 (Merck Life Science spol. s r.o, Bratislava, Slovakia) for density measurement.
From the bulk (button-shape) alloys, metallographic cuts were prepared using the standard method of casting in resin, followed by grinding and polishing.
The chemical composition of the prepared alloys was subsequently determined using energy-dispersive X-ray spectroscopy (EDX) with a Tescan Vega 3 LM scanning electron microscope (Tescan, Brno, The Czech Republic) [26].
Microhardness tests HV0.3 were performed on the polished surface using a Wilson-Wolper Tukon 1102 hardness tester (Berg Engineering & Sales Company, Inc., Rolling Meadows, IL, USA), equipped with the Vicker’s type of microindenter. Ten indentations were made during the microhardness tests, and the mean value and standard deviation were calculated from the measurements.
The determination of nanoindentation hardness and elastic modulus were performed by measuring the nanoindentation using a Nano Indenter G200 device (model no. G200) manufactured by Agilent Technologies, Inc. (Chandler, AZ, USA) [27]. The measurement consisted of 30 indentation cycles, each applying a load of 50 mg for 15 s.
Following this step, the bulk alloys were pulverized using a high-energy vibratory mill. Our goal was to produce the material in the simplest possible and most cost-effective way. Therefore, the alloys were remelted five times to ensure sufficient elemental homogeneity of the feedstock, but without homogenization annealing. Some of the alloys were ductile and required a longer time to be pulverized in the vibratory mill, but this time did not exceed 20 min for any of the alloys. An additional density measurement was performed on this powder fraction using a helium pycnometer AccuPyc II 1345 Micromeritics. The results of both methods were, however, very similar, with differences only in the third decimal place.
The phase analysis of the powder samples was conducted using X-ray diffraction on a Philips X Pert Pro diffractometer (Malvern Panalytical, Almelo, The Netherlands). The measurements were performed in the 2θ range of 10° to 100°, with a step of 0.03° and a step time of 25 s. The X-ray wavelength of a copper anode is 1.5406 Å.
Hydrogen absorption and desorption measurements were conducted using a magnetic suspension balance (TA Instruments, New Castle, DE, USA) capable of operating at up to 50 MPa with an accuracy of 0.05%. The experiments were performed on all the samples using the following protocol:
  • A known weight of powder alloy (~1 g per sample) was placed in the reaction chamber of the magnetic suspension balance. The system was sealed and evacuated to a vacuum of <5 Pa.
  • The alloy was then activated by exposure to a low hydrogen pressure of ~100 kPa at room temperature for 1 h to reduce the oxides on the surfaces of the powder particles. To remove the absorbed hydrogen, the sample was then heated to 350 °C in a vacuum of ~2 Pa.
  • Following activation, the first hydrogen absorption measurement was performed by reducing the sample temperature to 200 °C and by filling the reaction chamber with hydrogen to a pressure of 2 MPa. The increase in the sample’s weight due to hydrogen absorption was recorded for 1 h.
  • After the absorption measurement, the reaction chamber was evacuated and the sample was heated to 370 °C, causing the desorption of hydrogen. The weight loss during this process was recorded.
  • A second absorption cycle was conducted under the same conditions as the first.
The measured raw data were further recalculated for the amount of hydrogen absorbed per gram of material by using the typical routines for buoyancy corrections, as stated in [28].

3. Results and Discussion

The following text provides a detailed analysis of the obtained results. Table 1, Table 2 and Table 3 offer a comprehensive overview of the basic physical and chemical properties of the studied materials. These tables include key information such as density, composition, and mechanical properties. On the other hand, Table 4, Table 5 and Table 6 focus on presenting the results related to the thermodynamic properties of these materials, encompassing sorption capacities, and enthalpies. These data are crucial for a deeper understanding of the material properties and their potential industrial applications.
Before preparing the alloys, we employed well-established empirical rules to predict whether the target alloy compositions would fall into the supersaturated solid solution (medium/high entropy) region. To determine this, we calculated the theoretical values for mixing enthalpy, ΔHmix, applying Equation (1) [28].
H m i x = 4 i = 1 , j i n H < i j > m i x c i c j
where ci and cj are the concentrations of elements i and j, and Δ H < i j > m i x is the mixing enthalpy of elements i and j [29], and the differences in atomic sizes, δr, are determined by applying Equation (2) [30].
δ r = i = 1 n c i 1 r i r ¯ 2 · 100 %
where r ¯ is the average atomic radius, and ci is the atomic percentage of the i-th element with atomic radius ri [31,32,33]. All the calculations were performed by our prediction software developed on the MATLAB platform (https://ch.mathworks.com/products/matlab.html, accessed on 13 March 2023), incorporating all required referenced databases. The well-established empirical rules state that a single-phase solid solution (medium/high entropy alloys) is formed in the enthalpy interval −10 <   Δ H < i j > m i x < 5 kJ/mol, as shown in [28].
The numerical outputs of our calculations are presented in Table 4, Table 5 and Table 6. Although the compositions of the alloys do not fall within the regions of highest probability for forming supersaturated solid solutions, previous studies have shown that these alloys can form single phases [34].
Figure 1, Figure 2 and Figure 3 show the graphical representation of the empirical rules, with the plotted Al-Ti-Nb-Zr, Al-Ti-Nb-V, and Al-Ti-Nb-Hf alloys, respectively. Since the alloys do not fall into the region of stability for highly supersaturated solid solutions, according to their thermodynamic parameters, but can nevertheless form them, it can only be stated that they deviate from the most widely used empirical predictive theory for medium- and high-entropy alloys.
Table 1, Table 2 and Table 3 provide data about the fundamental material characteristics of the alloys. The first column lists the targeted composition of each alloy, while the second column presents the actual chemical elemental composition determined by energy-dispersive X-ray spectroscopy (EDS) after alloy production. The actual compositions of the alloys differ from the target compositions by no more than 3 at.%.
The third column provides the density values of the powder alloys, determined by the pycnometric method. The listed values represent the average of ten measurements, supplemented also with standard error estimation.
The density of the alloys in the Al-Ti-Nb-Zr group ranged from 5.31 to 6.11 g/cm3 (Table 1). The lowest density was observed for the Al30Ti35Nb15Zr20 sample, with a value of 5.31 g/cm3. The second group of alloys, consisting of Al-Ti-Nb-V elements, displayed densities ranging from 5.1 to 6.74 g/cm3 (Table 2). Here, the Al25Ti35Nb15V25 alloy exhibited the lowest density of 5.1 g/cm3 among all the investigated alloys, making it a promising candidate for applications in the transportation sector. The last group of investigated alloys, with compositions of Al-Ti-Nb-Hf elements, displayed the highest density values among the produced alloys, ranging from 6.23 to 7.67 g/cm3 (Table 3). The Al30Ti35Nb15Hf20 alloy demonstrated the lowest density of 6.23 g/cm3 in this group (Table 3).
In contrast to other well-studied medium-entropy alloys, our investigated alloys, particularly those from the Al-Ti-Nb-V group, belong to lightened alloys. For example, HEAs based on iron, chromium, manganese, nickel, and aluminum have densities of around 7.5 g·cm−3; alloys based on chromium, cobalt, copper, nickel, and iron reach a value of 7.2 g·cm−3; and alloys based on iron, aluminum, chromium, nickel, and copper have a value of 7.3 g·cm−3 [35,36].
Columns four and five present the microhardness and nanohardness values of the alloys, respectively. The microhardness of the Al-Ti-Nb-Zr alloys range from 353 to 747.8 (Table 1), while those with Al-Ti-Nb-V composition exhibit a range of 320.7 to 500.3 (Table 2). The hardness of the Al-Ti-Nb-Hf composition falls within the range of 347.9 to 801.7 (Table 3). Notably, these alloy systems demonstrate significant hardness variations with minor changes in their chemical composition.
Among the Al-Ti-Nb-Zr alloys, the Al15Ti38Nb23Zr24 sample exhibited the lowest nanohardness value, reaching 4.4 GPa (Table 1). In the Al-Ti-Nb-V group, the Al15Ti40Nb25V20 alloy had the lowest value of 4.3 GPa (Table 2), and within the Al-Ti-Nb-Hf group, the alloy Al15Ti30Nb25Hf30 sample had the lowest nanohardness of 4.2 ± 0.26 GPa (Table 3).
Modern nanohardness measurements also provide, in addition to hardness measurements, valuable information about a material’s elastic modulus E, representing the limit of its elastic deformation as a function of external forces [37,38]. Our measurements revealed that the E values of the Al-Ti-Nb-Zr alloys ranged from 90 to 160 GPa (Table 1); for the Al-Ti-Nb-V alloys, they ranged from 130 to 160 GPa (Table 2); and for the Al-Ti-Nb-Hf alloys, from 110 to 180 GPa (Table 3). These findings indicate that all these alloys possess a significant degree of resistance to elastic deformation (stiffness). For comparison, steels exhibit elastic moduli in the range of 190–210 GPa, titanium alloys in a range from 100 to 120 GPa, and aluminum alloys fall within a 70–80 GPa range [39,40,41].
Figure 4, Figure 5 and Figure 6 depict the X-ray powder diffraction data of the as-prepared alloys (black curves) and after hydrogen exposure (red curves). While most of the as-prepared alloys exhibit a single BCC phase, some exhibit a split main peak and/or an adjacent satellite peak, indicating the presence of additional phases, such as secondary BCC and/or FCC (Face-Centered Cubic).
By a visual comparison, the hydrogen-exposed alloys appear very similar, sometimes identical, to the patterns of the as-prepared state. This could be attributed to either the samples not absorbing any hydrogen, or that they did absorb hydrogen (as will be shown later), but spontaneously released it at ambient conditions. Spontaneous hydrogen desorption is advantageous for storage tank applications, since the amount of absorbed hydrogen can be controlled by adjusting the ambient hydrogen gas pressure, without the need for additional heating of the alloy. However, the XRD patterns of some of the alloys after hydrogenation exhibit a significant change, with the Bragg peaks shifted to the left (i.e., an increase in the unit cell in the crystal lattice). In other samples, completely new Bragg peaks appear, indicating the formation of new hydride phases with different lattice structures.
As is known, the low intensity and broadening (FWHM) of diffraction peaks are manifestations of high internal stresses and small crystallite size. In our opinion, the primary reason for the defective structure, exhibiting a small size of coherently diffracting crystallites, is not milling (as this is rather a breaking of a massive buttons), but rapid heat removal from the melt to the cooled Cu substrate. As can be seen from the XRD patterns, hydrogenation in most cases did not cause a large change in the XRD profile. The small-angle contribution most probably comes from the plexiglass sample holder.
Columns two through five of Table 4, Table 5 and Table 6 provide the thermodynamic parameters for all the prepared alloys, including their mixing enthalpy, mixed atomic radius ratio, mixing entropy, and valence electron concentration.
Column six of Table 4, Table 5 and Table 6 lists the maximum hydrogen absorption capacity of each alloy. These values are expressed in terms of both the weight increase (wt.%) and the number of hydrogen atoms per one metallic atom (H/M ratio, column seven), calculated by using the following Equation (3) [42].
H / M = c w t .   % · M h o s t M H · 100 c w t . % · M H
where cwt.% is the hydrogen capacity in wt.%, MH is the molar mass of hydrogen, and Mhost is the molar mass of the host material or alloy.
The column labeled “Residual” shows the amount of hydrogen that remains in the alloy after desorption (heating to 370 °C in a vacuum for 2 h). The amount of desorbed hydrogen from the alloy is given in column eight, “Desorption”. The value in column no. nine, “Cycle efficiency”, indicates the efficiency of the absorption/desorption cycle, which is expressed as the ratio of the desorption and absorption values multiplied by 100. This value quantifies how well a specific alloy can effectively desorb hydrogen from its volume under the specified testing conditions.
The following can be concluded from the comparison of these values:
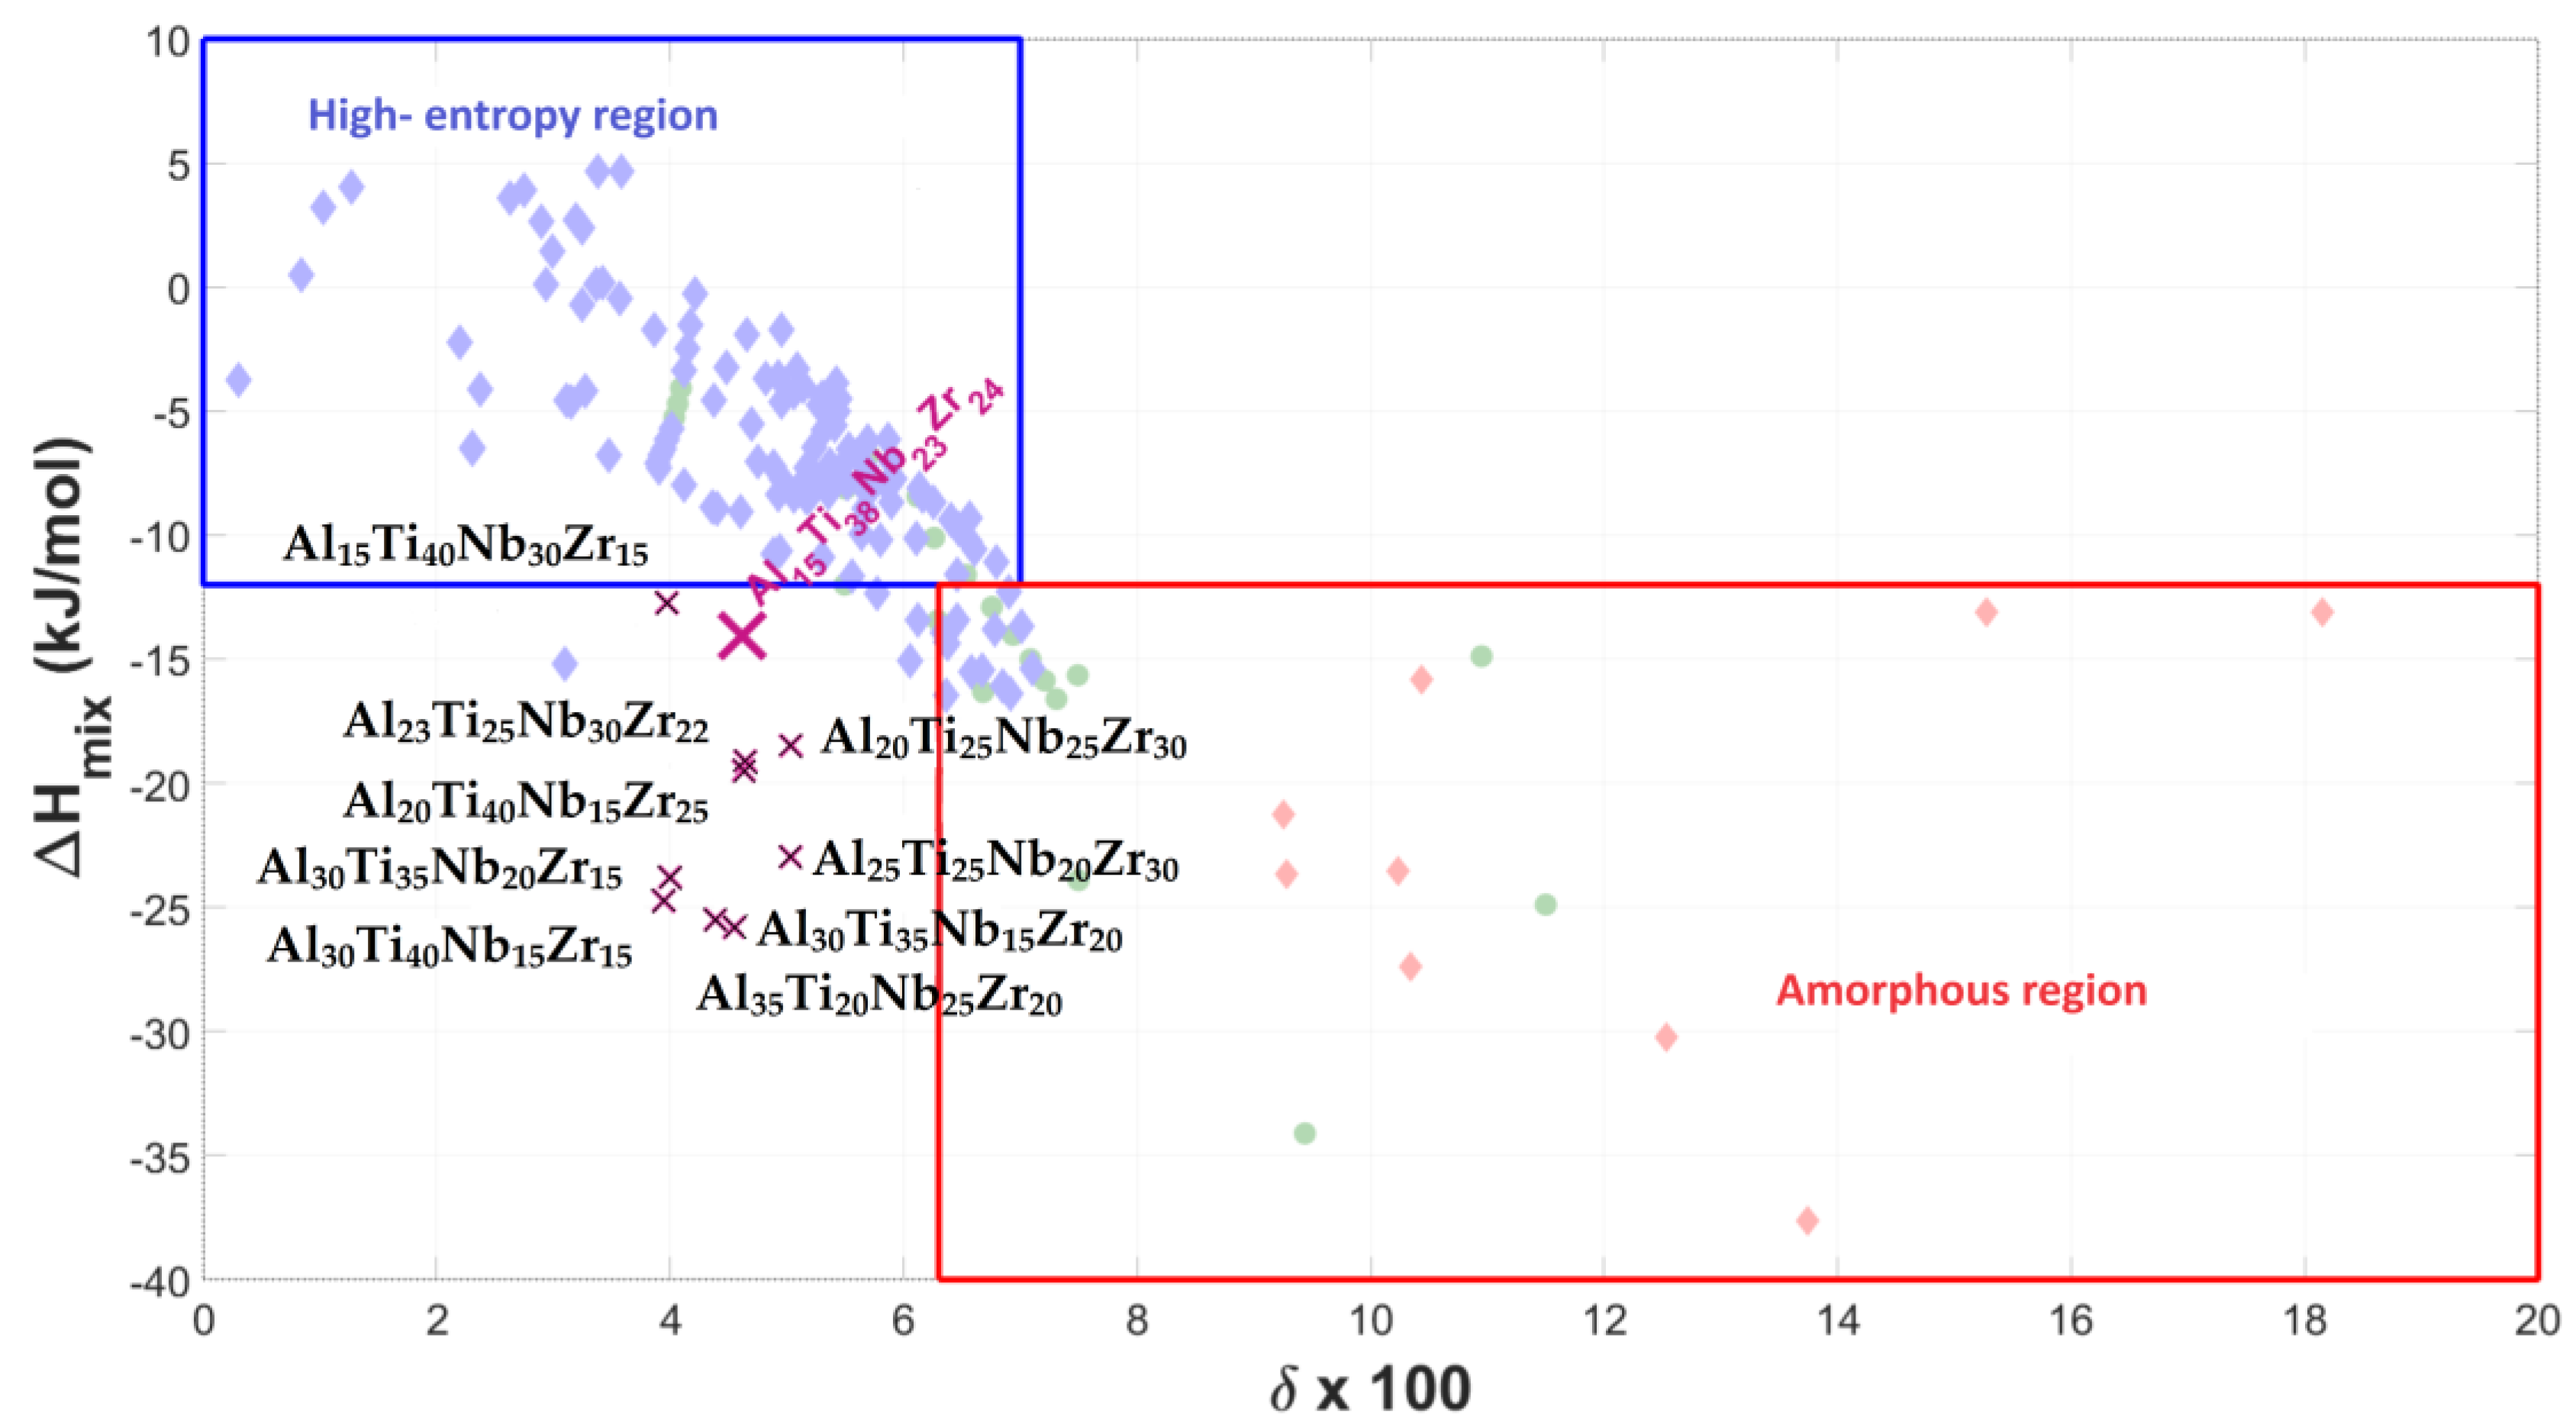
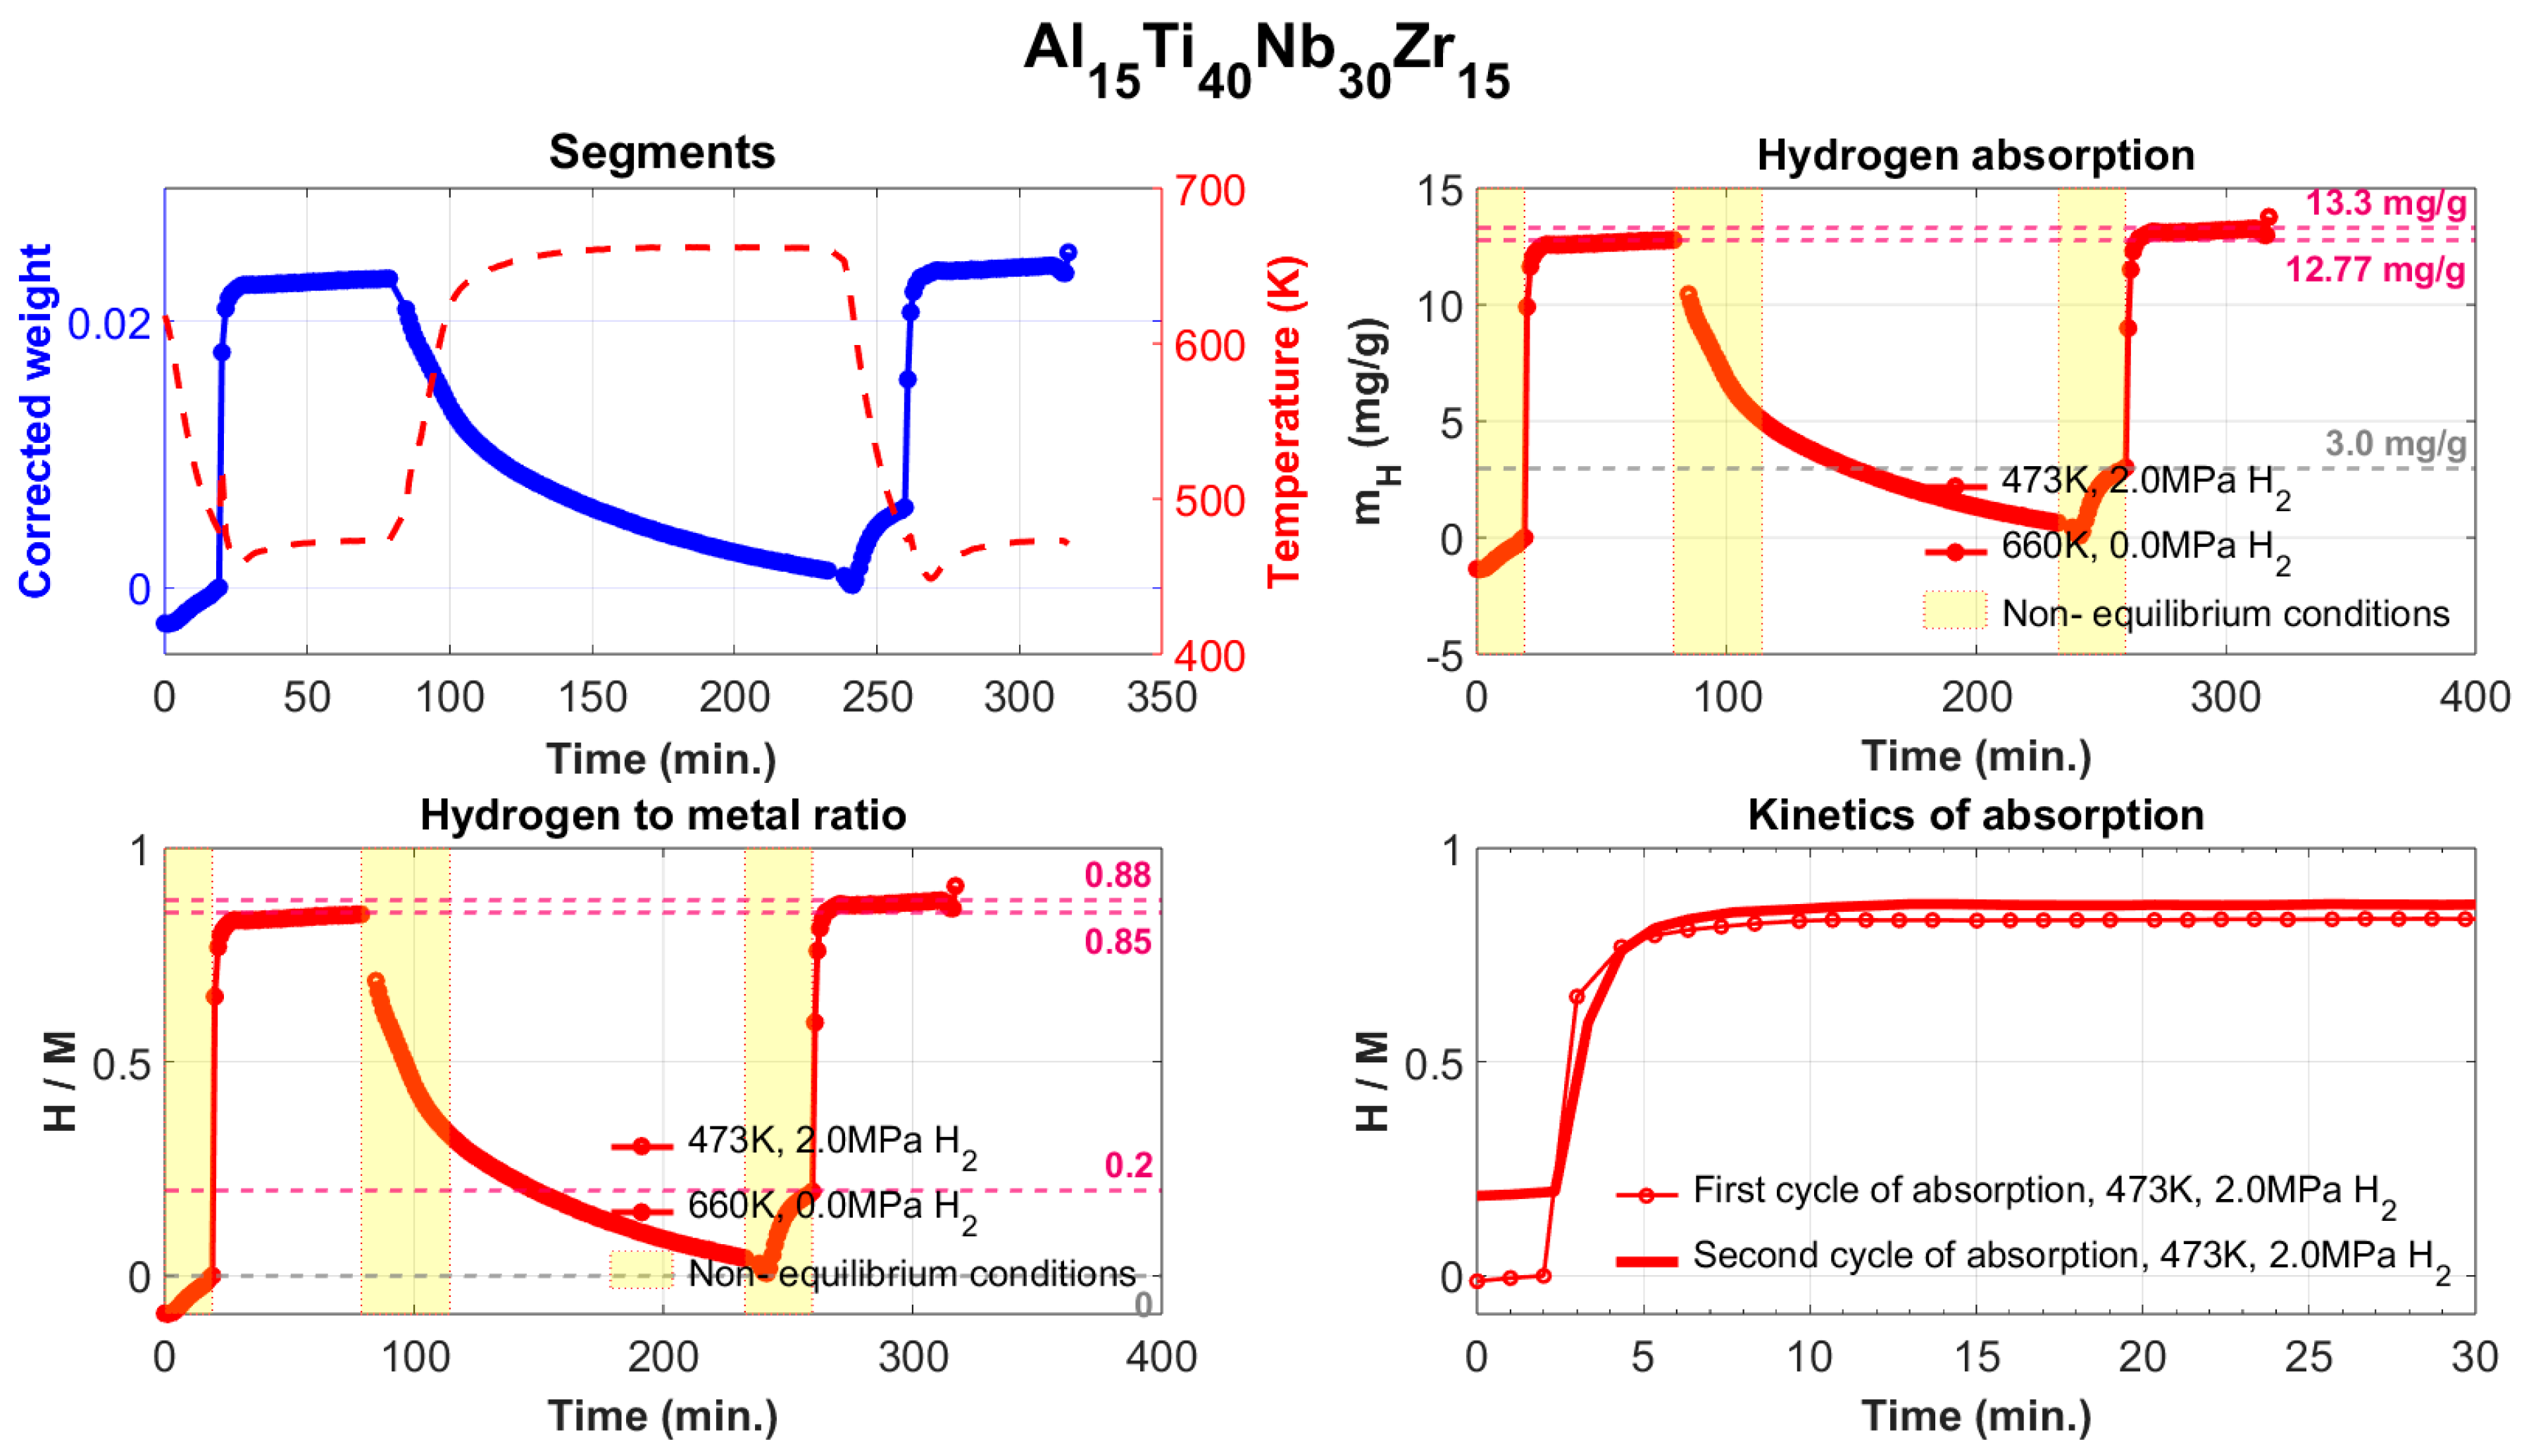
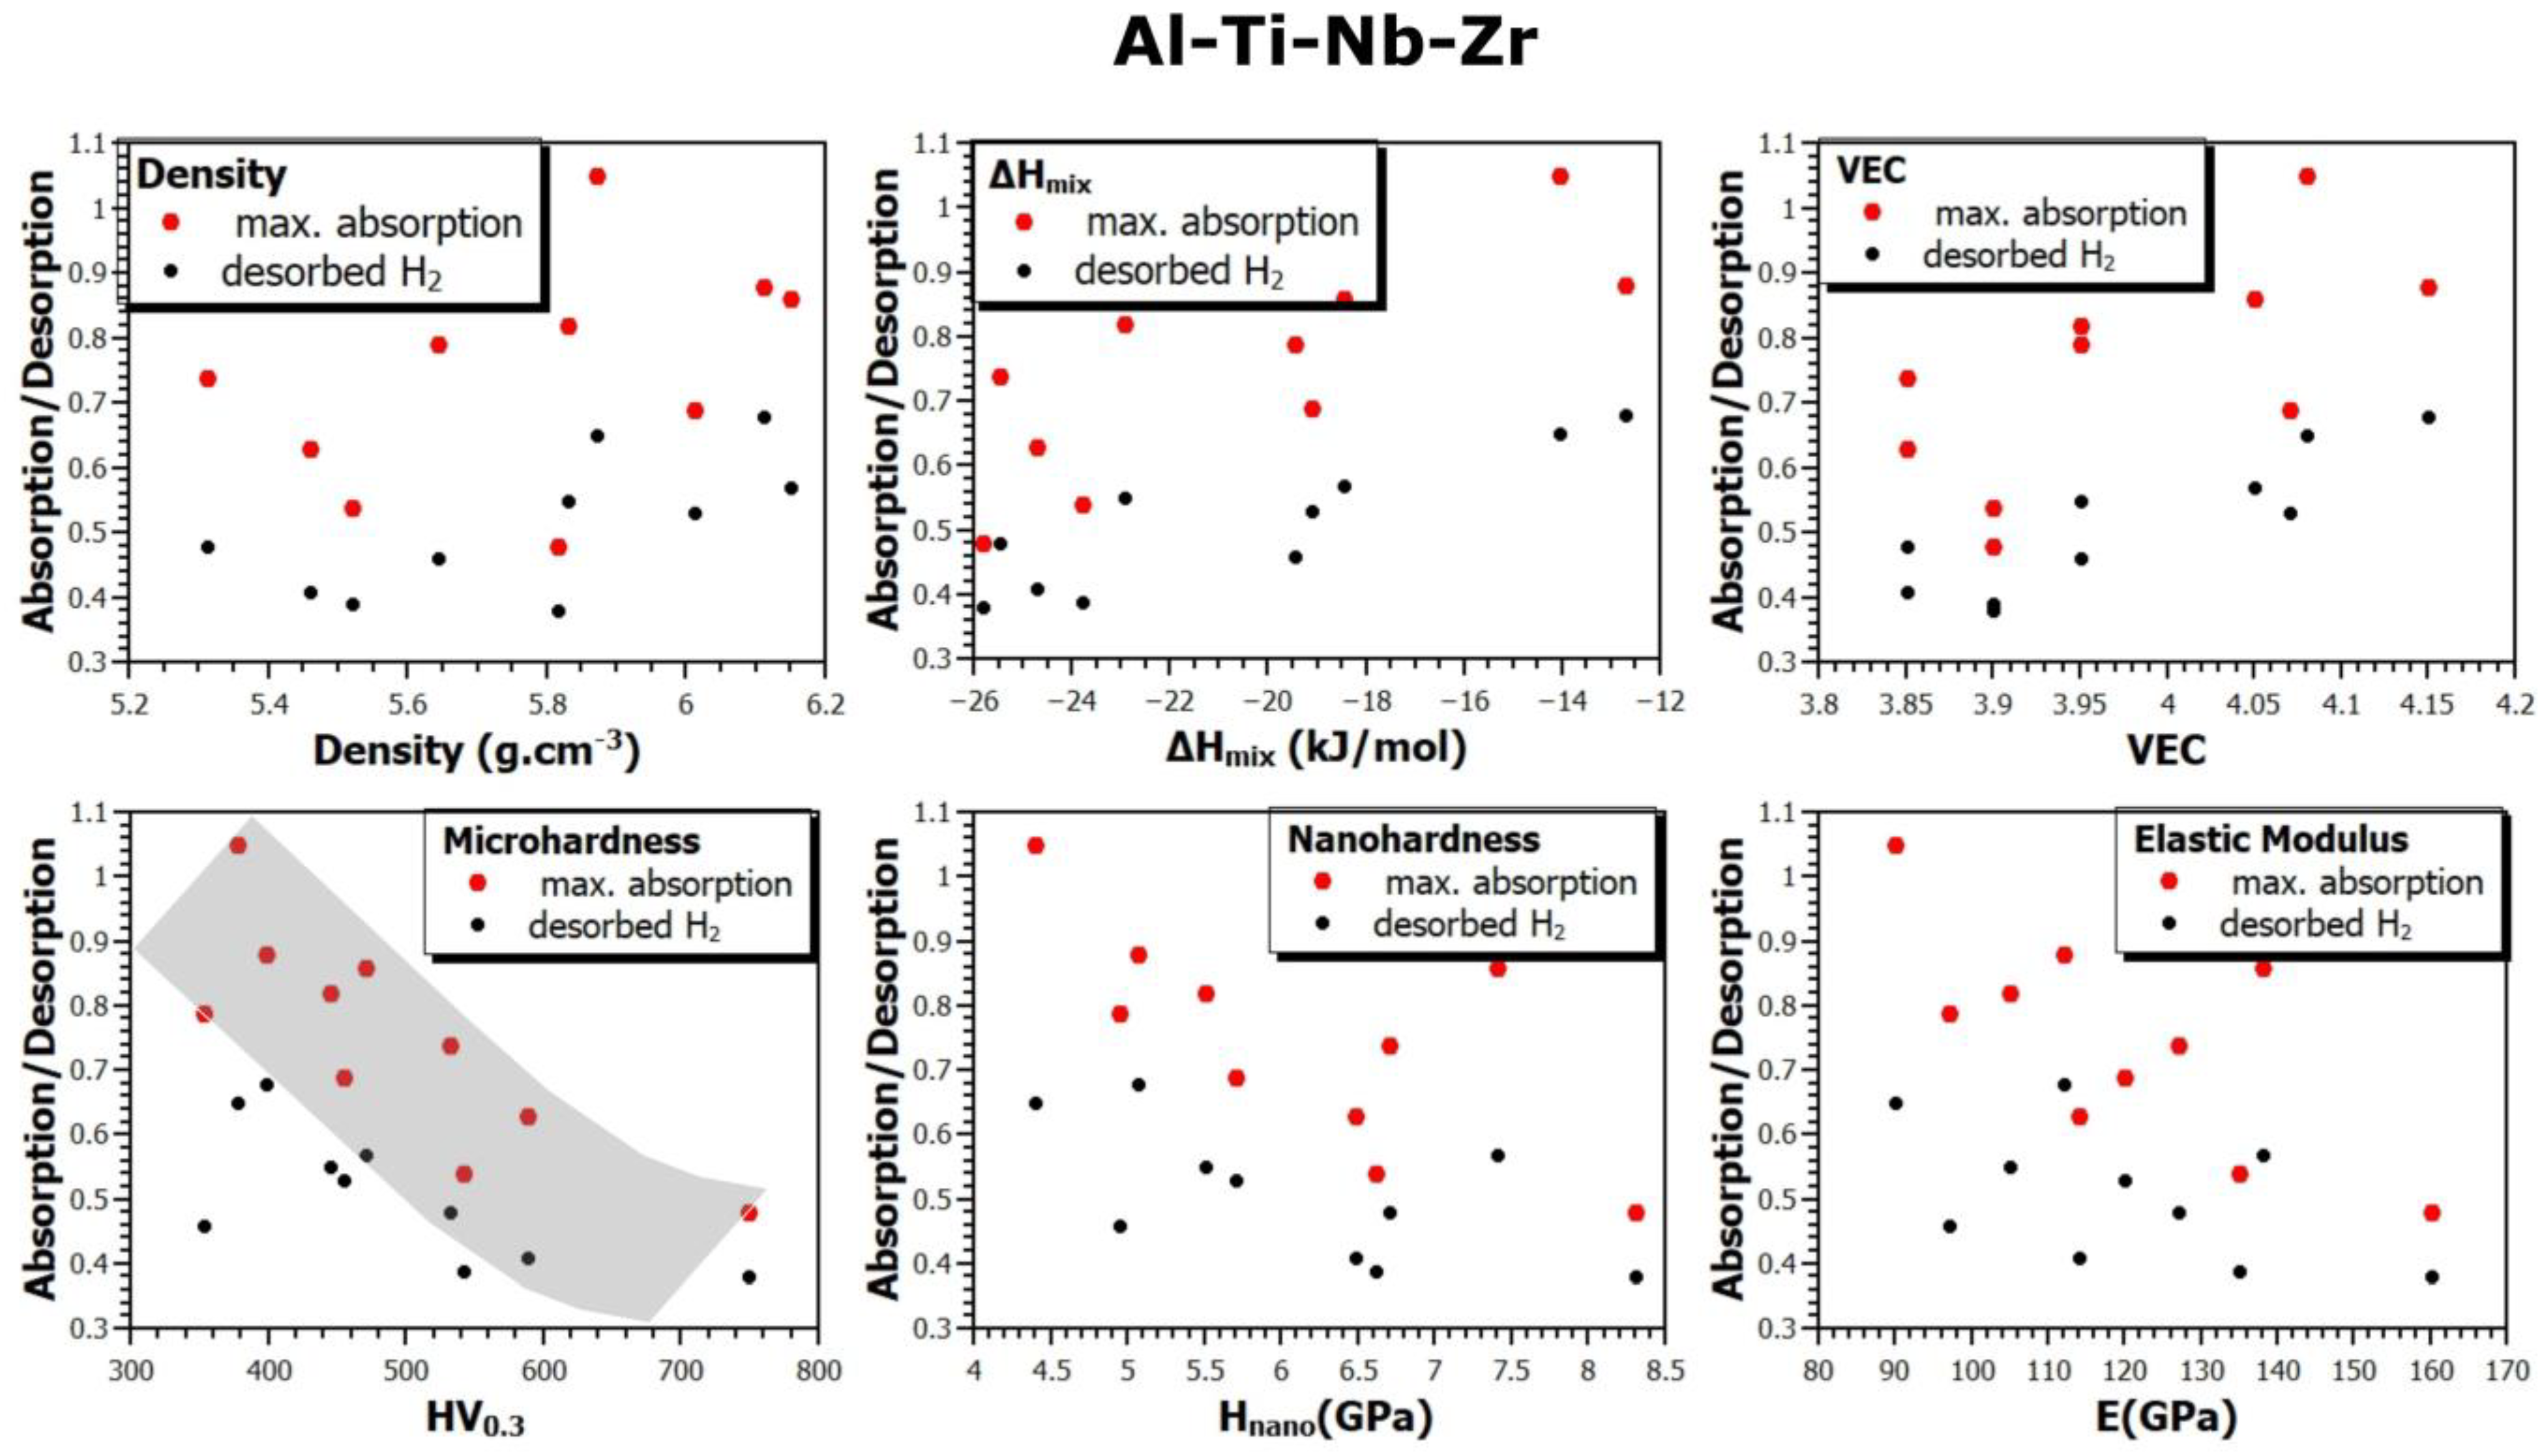
  • The Al15Ti38Nb23Zr24 alloy is the most hydrogen-absorbing alloy in the Al-Ti-Nb-Zr system, with a maximum absorption of 1.61 wt.% (H/M = 1.05). However, after annealing at 370 °C in a vacuum, it still retains up to 0.62 wt.% (H/M = 1.05) of chemically bounded hydrogen, meaning that the amount of reversibly released hydrogen is only 0.99 wt.% (H/M = 0.65). From this perspective, the Al15Ti40Nb30Zr15 alloy is more advantageous, with a maximum reversible release of 1.03 wt.% of hydrogen (H/M = 0.68).
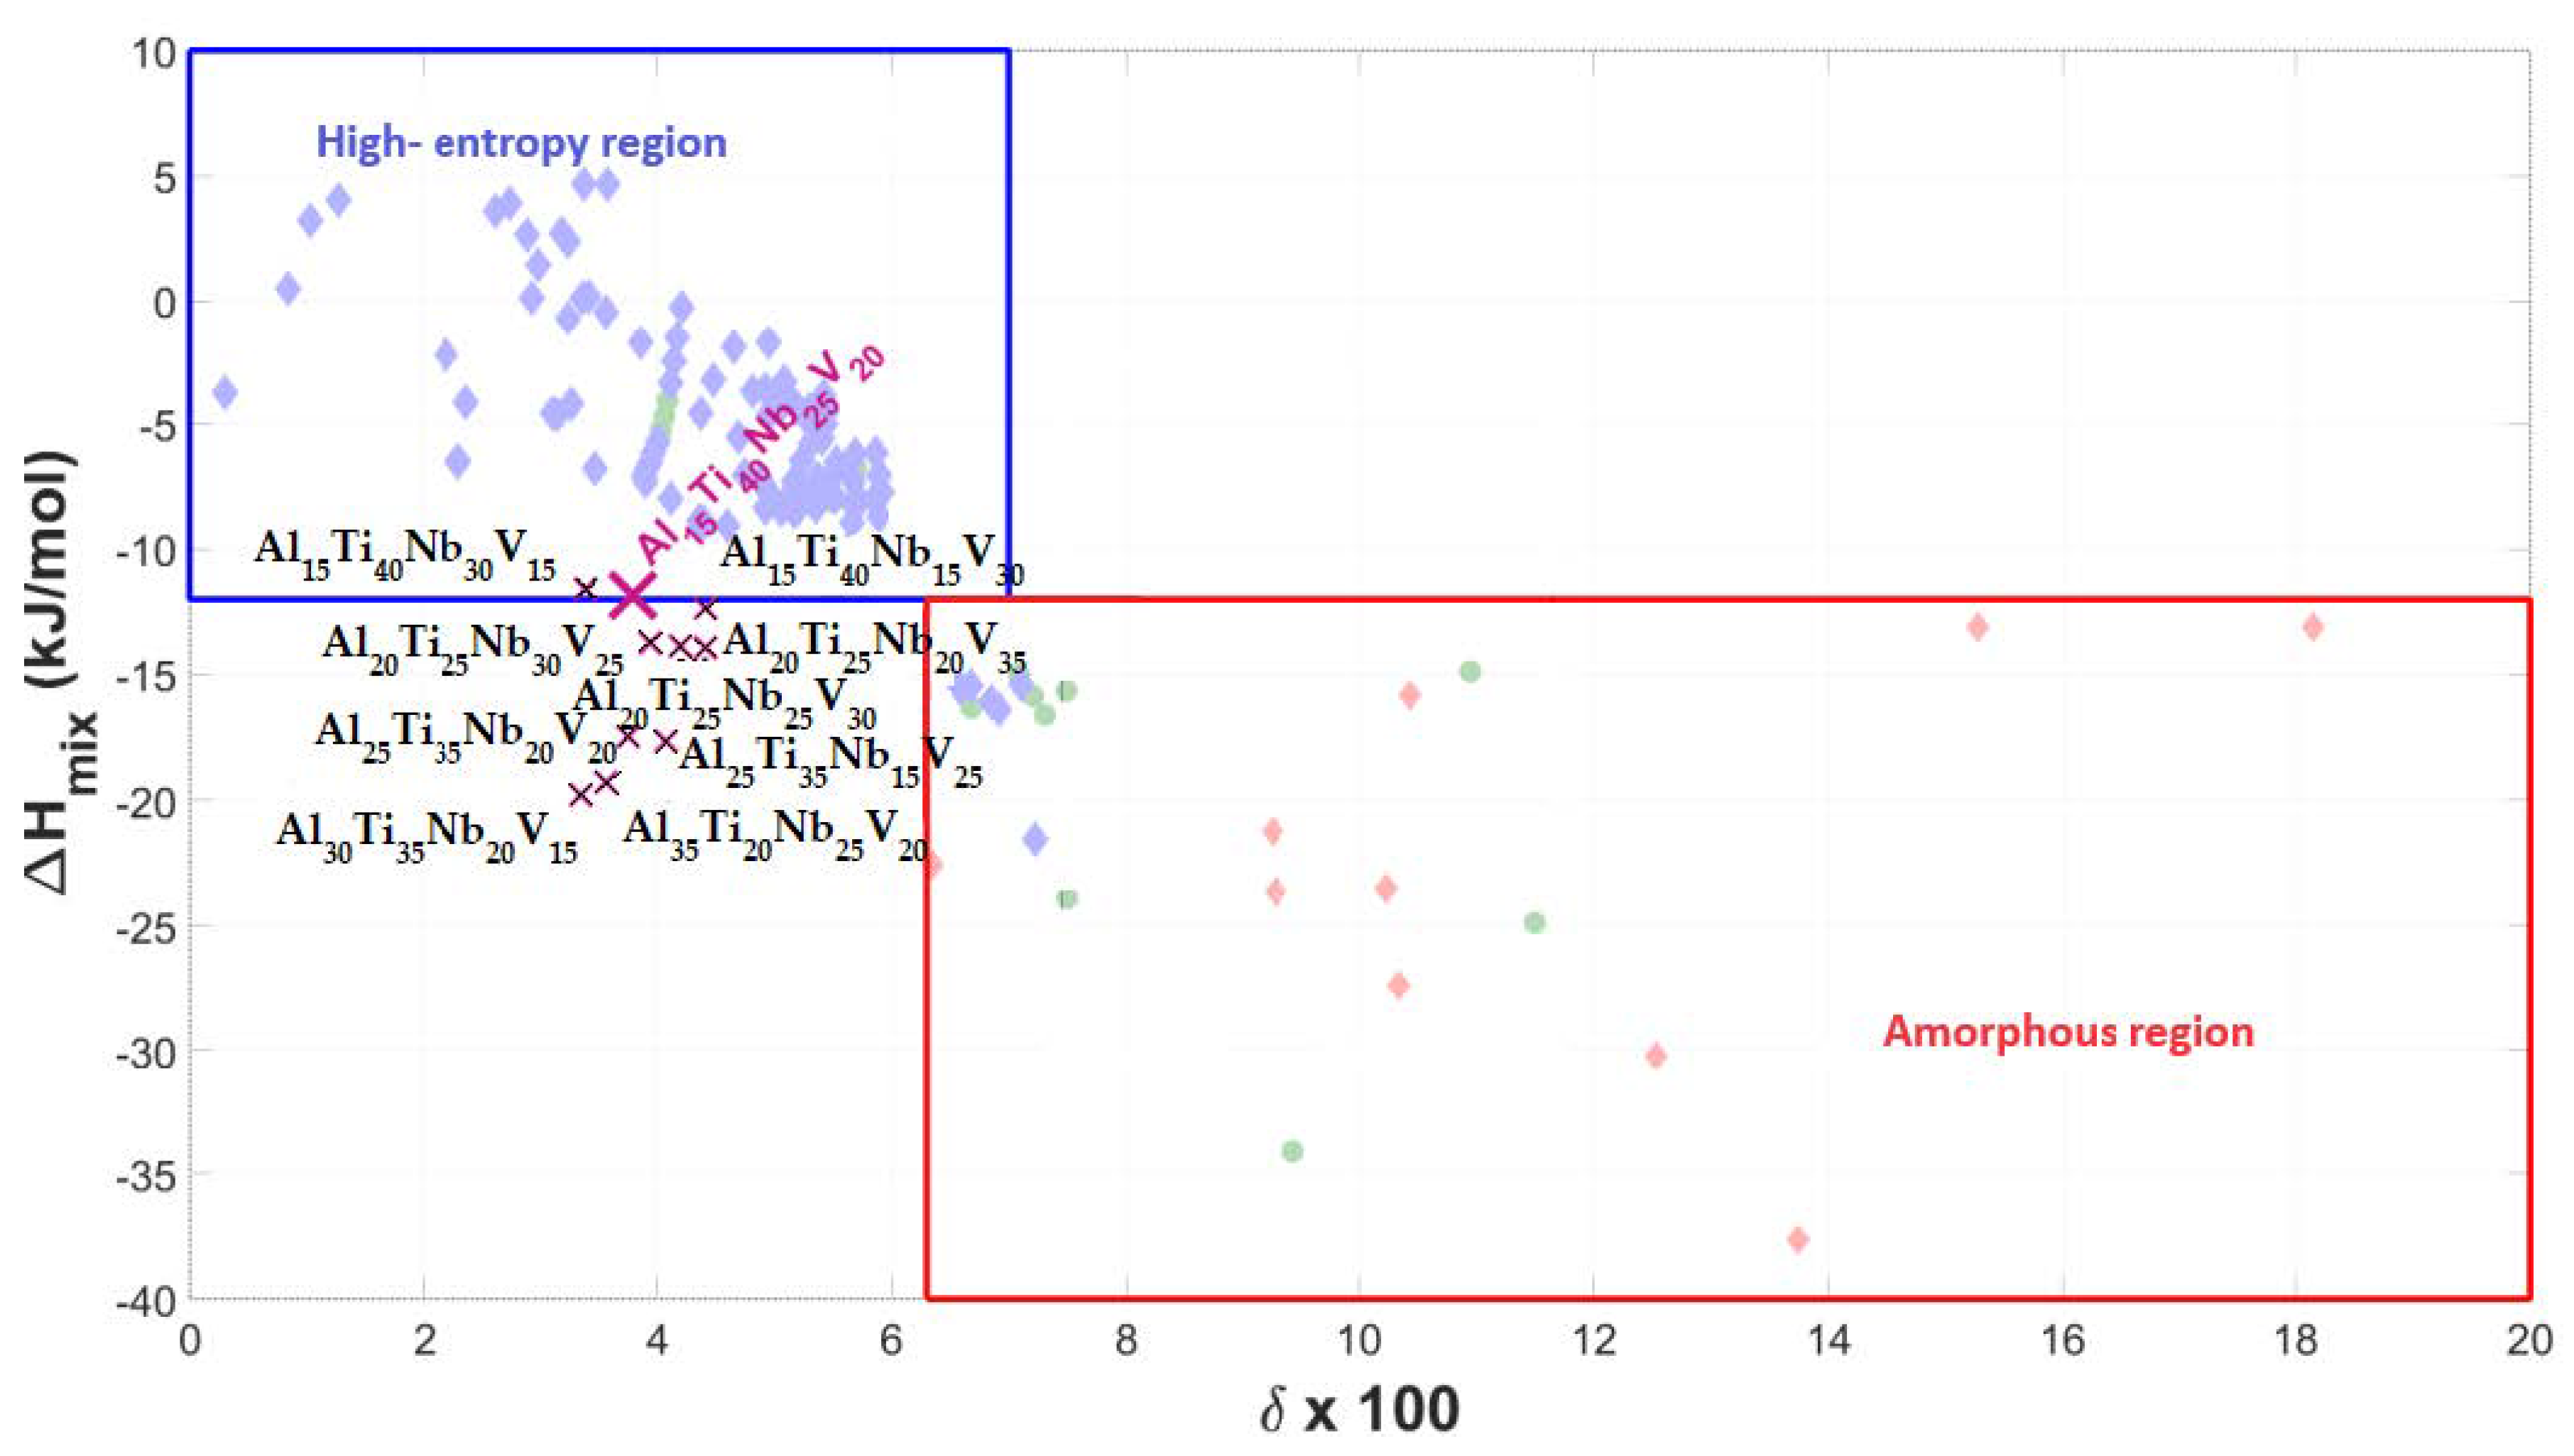
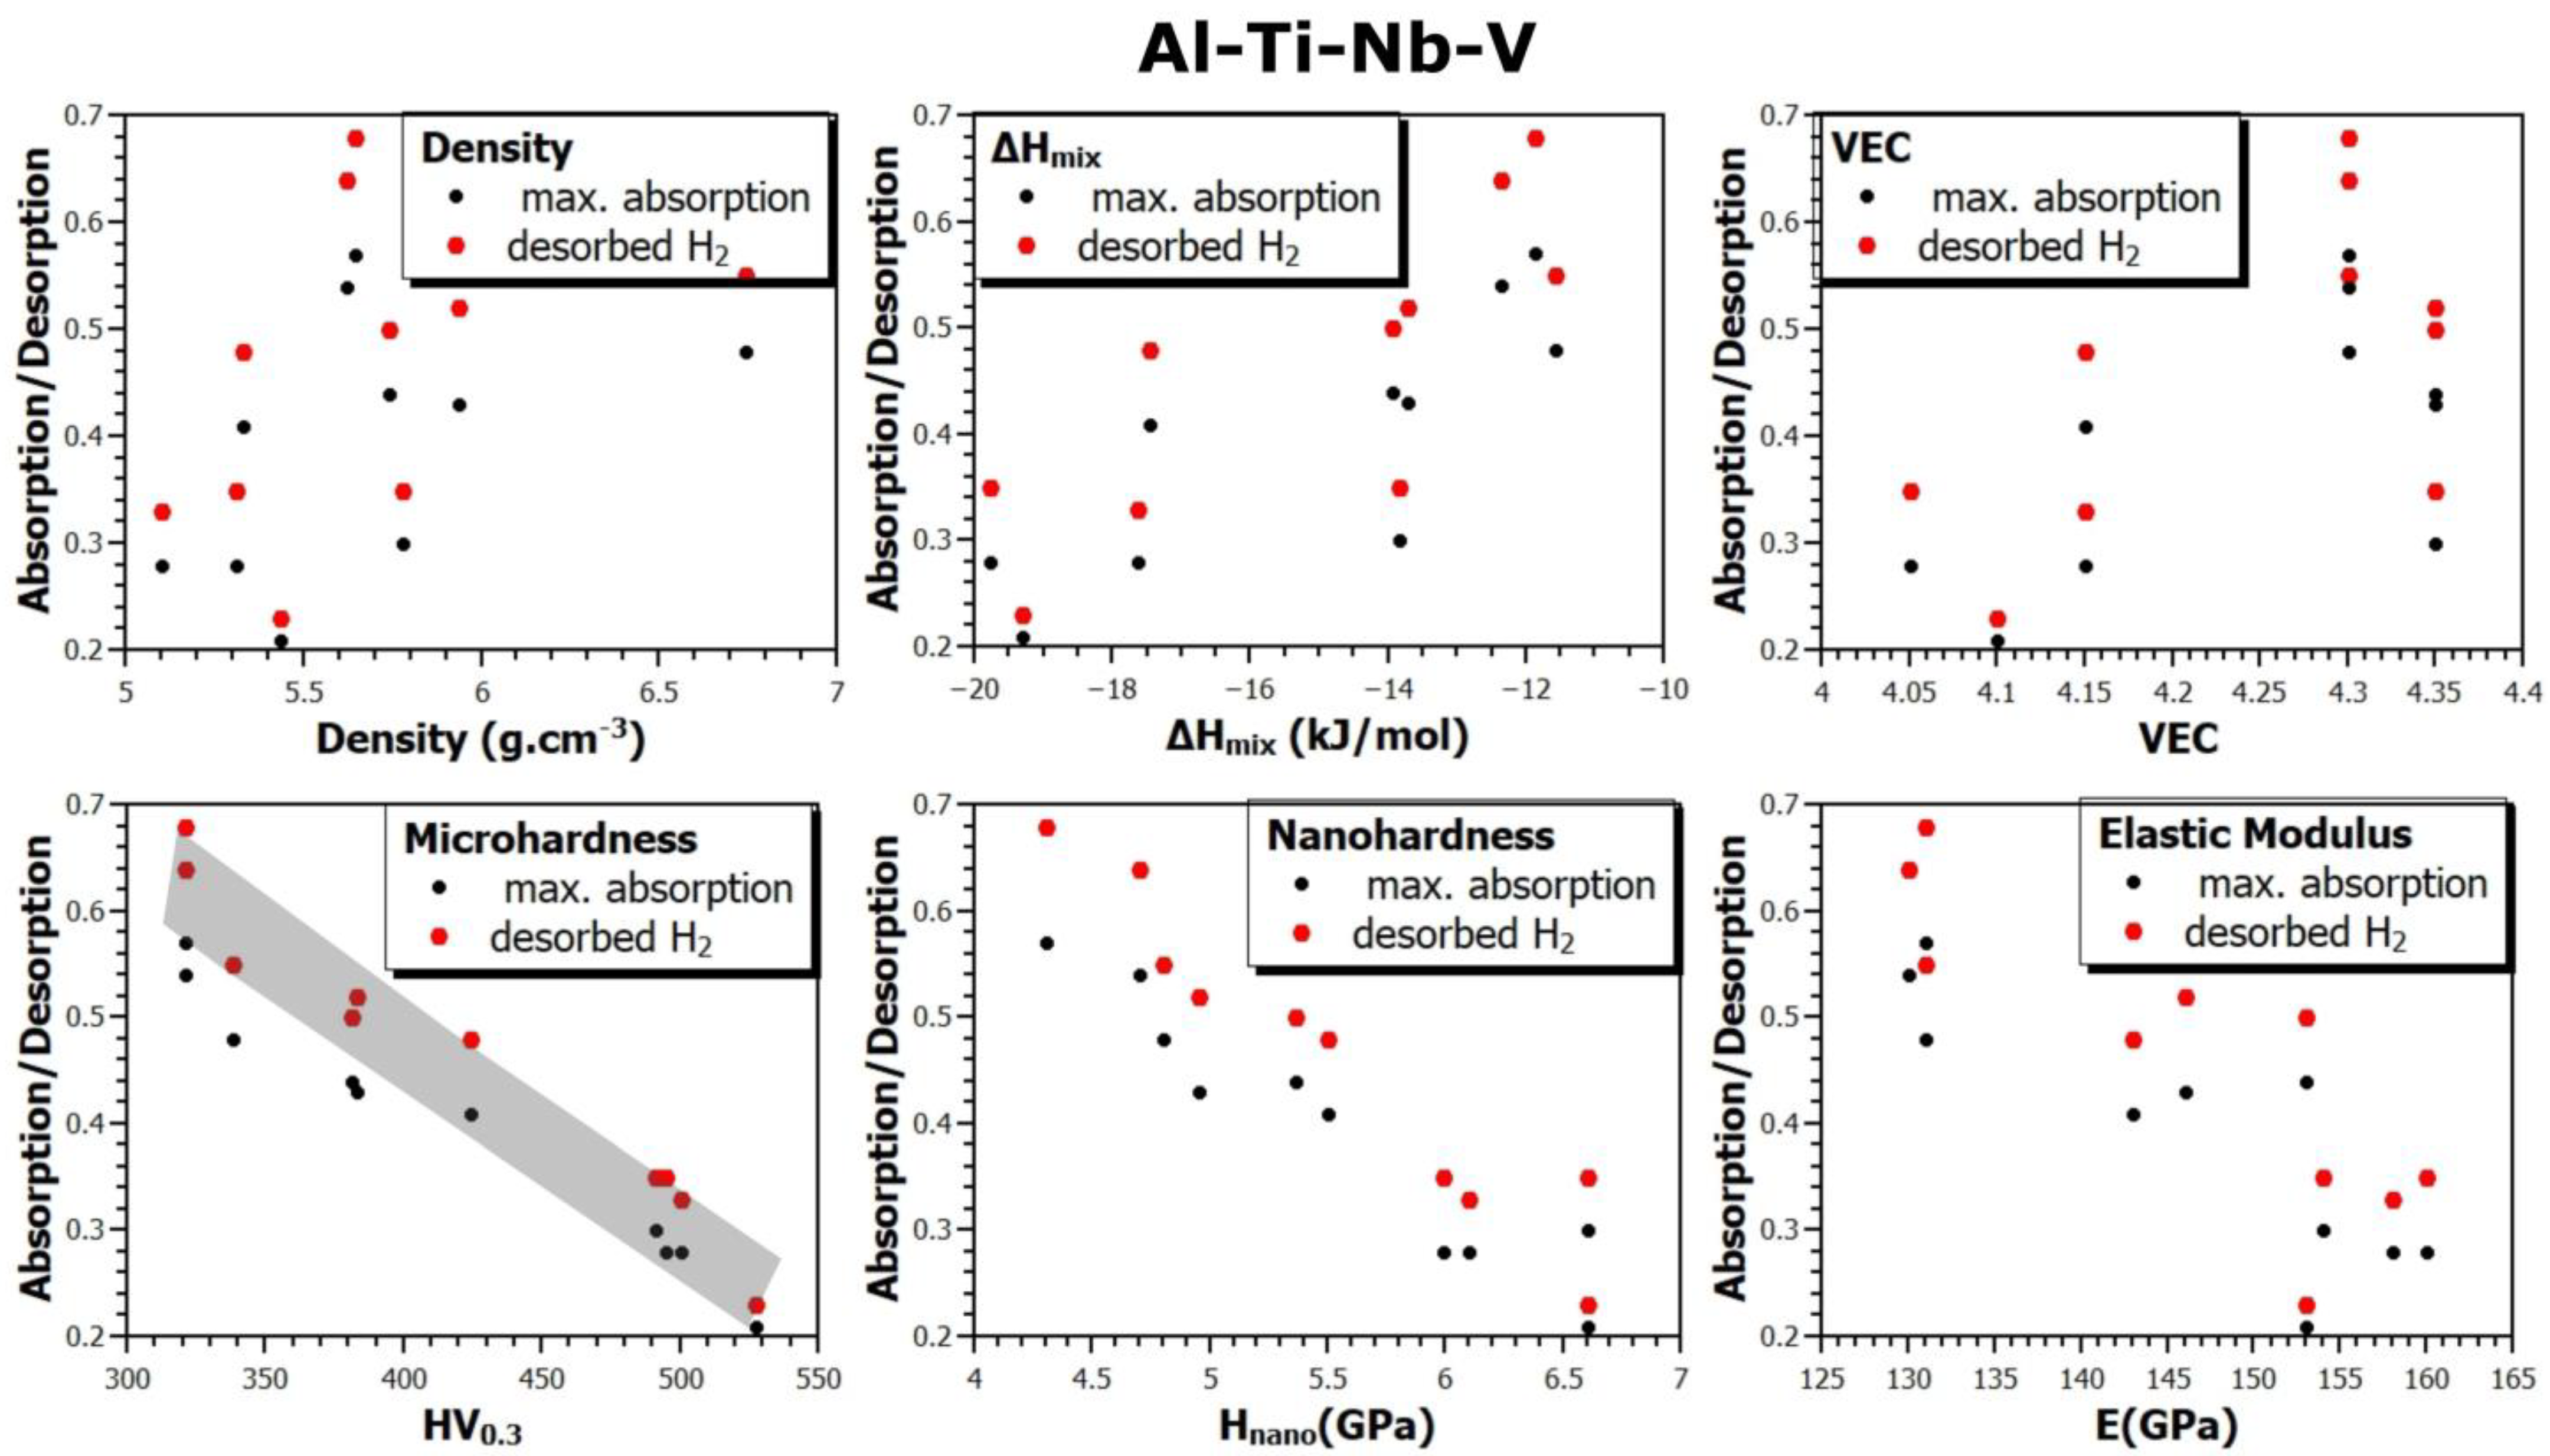
  • In the case of the Al-Ti-Nb-V system, the Al15Ti40Nb25V20 alloy exhibits a maximum capacity of reversibly storable hydrogen of 1.02 wt.% (H/M = 0.57).
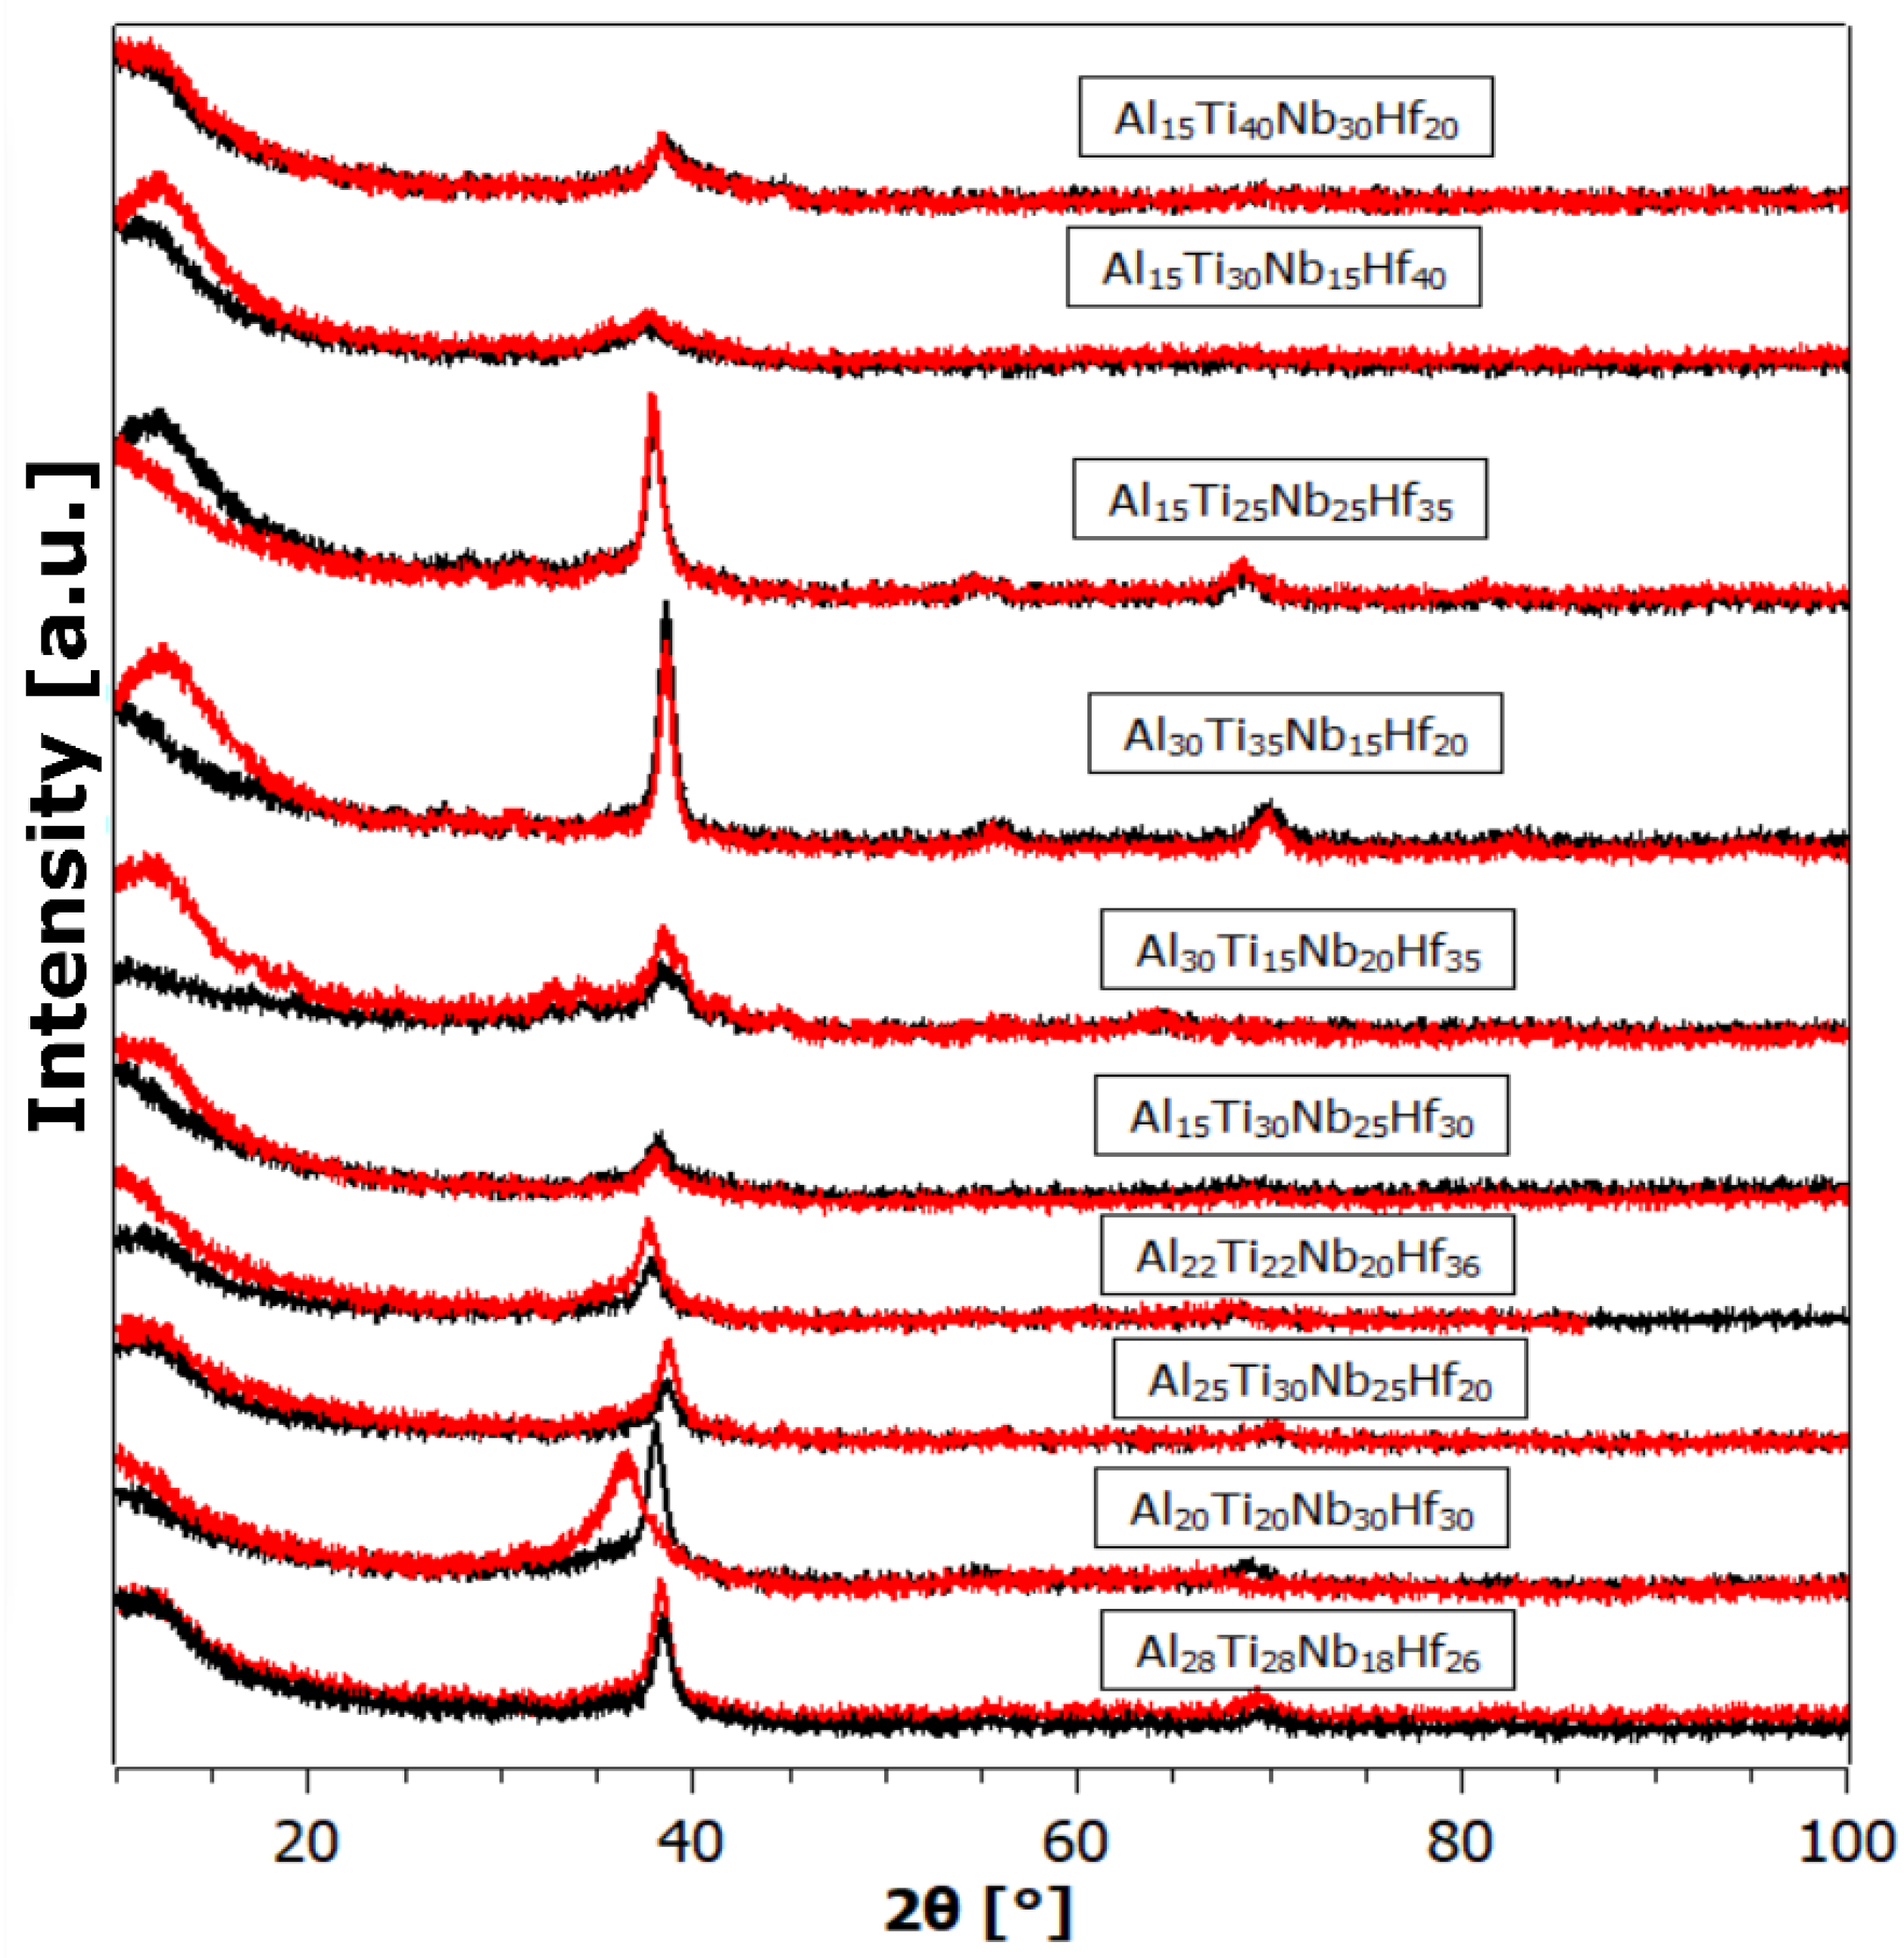
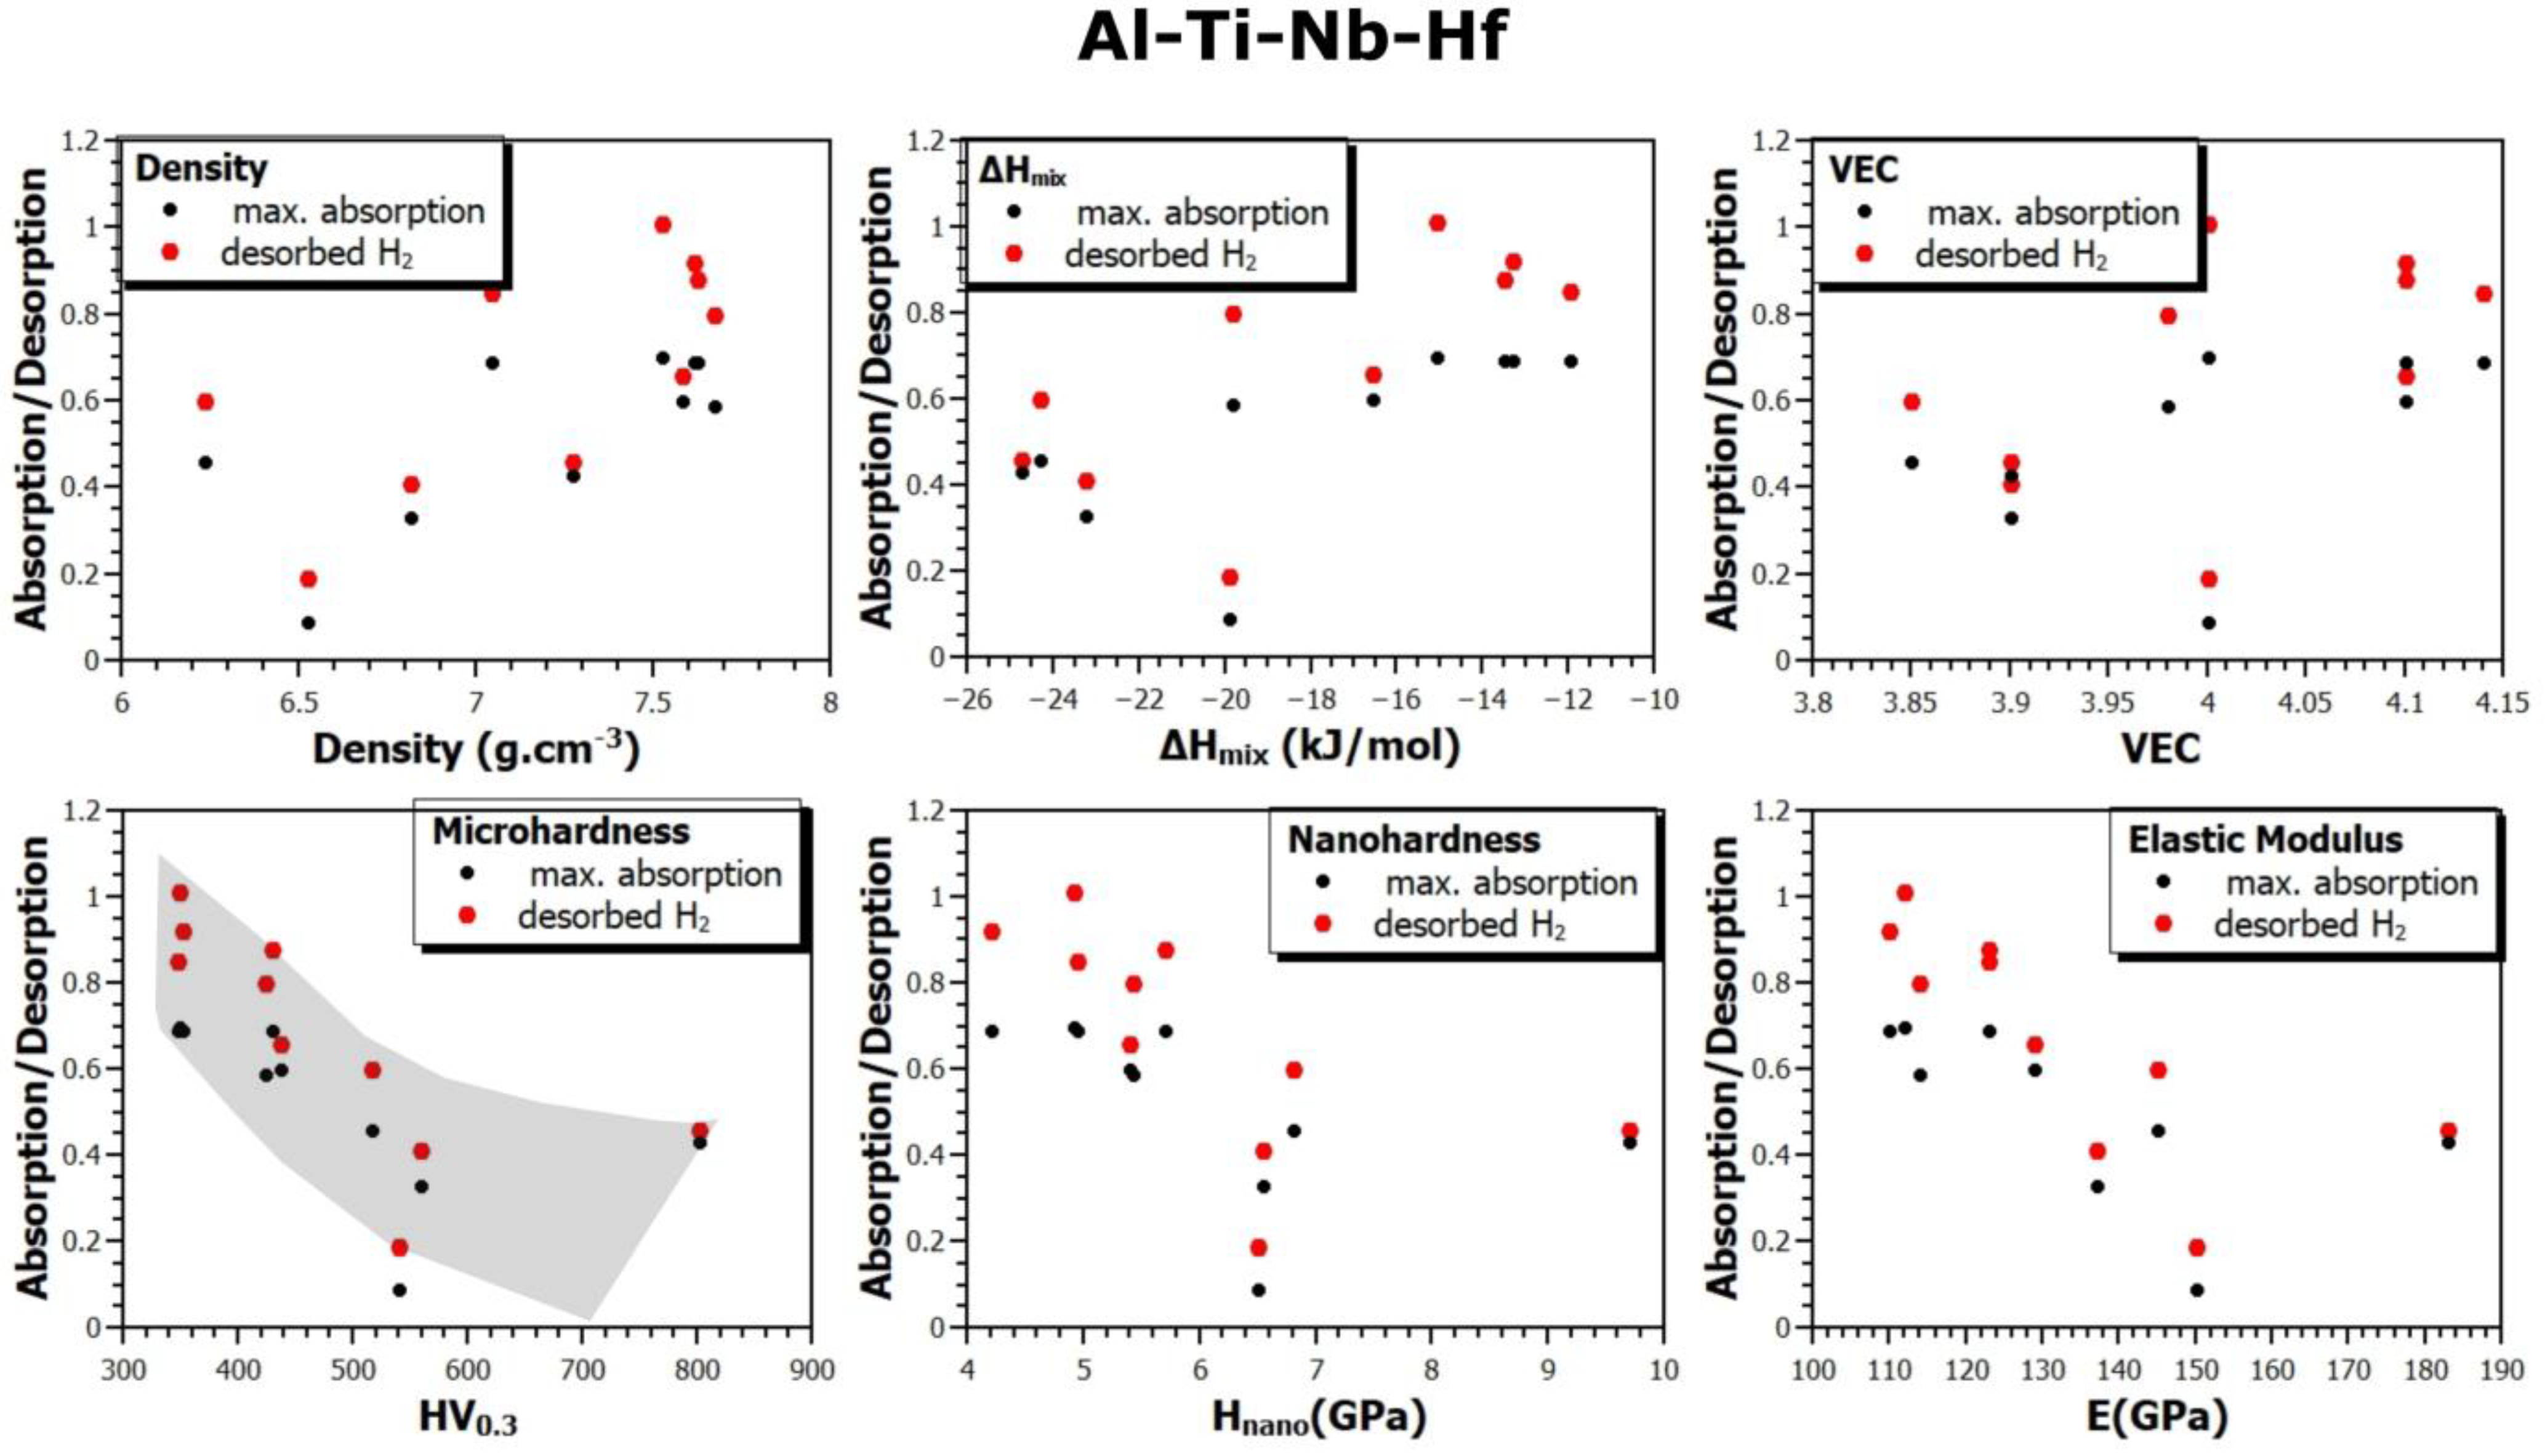
  • In the Al-Ti-Nb-Hf system, the best is the Al15Ti40Nb30Hf20 alloy, which has a maximum capacity of reversibly storable hydrogen of 0.82 wt.% (H/M = 0.69).
  • Considering the densities of the Al15Ti40Nb30Zr15, Al15Ti40Nb25V20, and Al15Ti40Nb30Hf20 alloys (6.11 g·cm−3, 5.646 g·cm−3, and 7.041 g·cm−3, respectively), the most efficient alloy appears to be Al15Ti40Nb30Zr15. It is 8.2% heavier than the vanadium alloy, but it has a significantly higher amount of reversibly storable hydrogen—H/M = 0.68, compared to H/M = 0.57 for the Al15Ti40Nb25V20. The best Hf-containing sample has a very similar amount of reversibly storable hydrogen as the Zr-containing sample, but it is 15.2% heavier.
For a comparison with our results, the most widely used commercial alloy for reversible hydrogen storage today is LaNi5, which can store ~1.2 wt.% of hydrogen at a hydrogen pressure of 2 MPa and temperature of 110 °C (which are approximately the conditions of our experiment) [43].
This corresponds to an H/M = 1.15. The alloy Al15Ti40Nb30Zr15 has a reversible hydrogen storage capacity that is 40% lower than that of LaNi5, but it is 23% lighter and does not contain rare earth elements.
The absorption/desorption measurements for the Al15Ti40Nb30Zr15 sample are shown in Figure 7, where the upper-left quadrant shows in blue the measured change in the sample weight, together with the temperature profile during the absorption and desorption cycles (red curve). The normalized absorption corrected for the hydrogen buoyancy is shown in the upper-right quadrant. Here the yellow-marked areas show the state of the system when it is not in equilibrium (for example, during heating and/or during hydrogen charging of the reaction chamber). The absorption of hydrogen, in the ratio H/M, is shown in the lower-left quadrant. The fourth quadrant compares the absorption kinetics of the first and second cycles. It is necessary to pay attention to a certain phenomenon that was observed in all our samples. The fully saturated state in these alloys is achievable within 3 min under conditions of 2 MPa of H2 and a temperature of 200 °C.
Since this study presents results for a large number of samples (up to 30 alloys, on which different types of measurements were performed), it is possible to verify the correlation between the material and its thermodynamic parameters and its ability to absorb or desorb hydrogen. Figure 8, Figure 9 and Figure 10 show the relationship between the density (ρ), mixing enthalpy (ΔHmix), valence electron concentration (VEC), microhardness (HV0.3), nanohardness (Hin), and elastic modulus (E) and the maximum hydrogen absorption of the alloy, and the amount of desorbed hydrogen from the alloys of all the prepared systems. The gray part indicates the observed trend in the dependencies between individual quantities.
Based on this comparison, several trends can be seen. For example, it seems that both the maximum amount of absorbed hydrogen and the amount of desorbable hydrogen from an alloy (annealed for two hours at 370 °C in vacuum) increases with increasing ΔHmix and VEC values. However, the correlation between these sorption properties and microhardness HV0.3 is very clear. As the microhardness increases, the amount of absorbed and desorbed hydrogen from an alloy decreases. Similarly, but less pronounced, the trend is also observed for Hin and E. To the best of our knowledge, these dependencies have not yet been presented in the scientific literature.

4. Conclusions

In this scientific paper, we reported the design, preparation, and characterization of 30 completely new (unpublished) medium-entropy alloys of three systems: Al-Ti-Nb-Zr, Al-Ti-Nb-V, and Al-Ti-Nb-Hf. The motivation was to verify the hydrogen absorption capacity of lightened alloys having a density below 7.7 g·cm−3. We performed a comprehensive material characterization of all the alloys, including chemical, phase analysis, density hardness, nanohardness, and elastic modulus measurements. All the alloys were also characterized in terms of their hydrogen absorption and desorption abilities. The main conclusions of our work can be summarized in the following points:
  • Despite the fact that empirical rules suggested that the alloys would fall outside the stability range of single-phase solid solutions, most of the alloys are single-phase with a simple BCC structure.
  • The hardness of the Al-Ti-Nb-X alloys (X = Zr, V, or Hf) ranges from 320 to 800 HV0.3 units.
  • The most promising alloy is Al15Ti40Nb30Zr15. It has the highest-reversible hydrogen storage capacity of all the alloys, at 1.03 wt.% of hydrogen, corresponding to and H/M = 0.68. This is 40% lower than the reversible hydrogen storage capacity of LaNi5, but Al15Ti40Nb30Zr15 is 23% lighter and does not contain rare earth elements.
  • Since this work summarizes the results for a relatively large number of alloys produced in the same way, it was possible to verify the correlation between the material, its thermodynamic characteristics, and the sorption properties of these alloys. Among all the verified dependencies, the most pronounced trend shows the influence of hardness (micro and nano) on the absorption or desorption of hydrogen into or from the alloys. With the increasing hardness of the alloys, the amount of absorbed or desorbed hydrogen decreases. This observation is fundamentally understandable. Hardness is a macroscopical property of the strength of interatomic bonds, so it can be assumed that the stronger the bonds, the more difficult it is for hydrogen to penetrate into the volume of the alloy and create a hydride phase there. To our knowledge, this phenomenon has not been reported before, and this article provides experimental evidence for it.

Author Contributions

Conceptualization, D.V. and K.S.; validation, D.V., M.L., J.M. and K.S.; formal analysis, D.V., J.M., M.L., K.G., B.B., P.D. and L.O.; investigation, D.V., K.S., K.K., B.B., P.D. and L.O.; resources, D.V., L.O. and K.K.; data curation, D.V., M.L., J.M. and K.S.; writing—original draft preparation, D.V.; writing—review and editing, D.V., K.S., K.K., M.L., J.M., K.G., B.B., P.D. and L.O.; visualization, D.V.; supervision, D.V., K.S. and L.O.; project administration, D.V., K.K., K.G. and L.O.; funding acquisition, D.V. and K.S. All authors have read and agreed to the published version of the manuscript.

Funding

This work was supported by the Slovak Research and Development Agency under contract nos. APVV-20-0205, APVV-21-0274, APVV-21-0396, and APVV-21-0142. The authors are grateful to the Scientific Grant Agency of the Ministry of Education, Science, Research and Sport of the Slovak Republic and the Slovak Academy of Sciences VEGA, project no. 2/0039/22, and the international project EIG CONCERT-Japan/2021/215/EHSAL. J.M. and M.L. thank the German Academic Exchange Service (Deutscher Akademischer Austauschdienst—DAAD) for financial support (project-ID: 57560249).

Institutional Review Board Statement

Not applicable.

Informed Consent Statement

Not applicable.

Data Availability Statement

The raw data supporting the conclusions of this article will be made available by the authors on request.

Conflicts of Interest

The authors declare no conflicts of interest.

References

  1. Energy Strategy. Available online: https://energy.ec.europa.eu/topics/energy-strategy_en (accessed on 1 December 2023).
  2. European Commission—HyResource. Available online: https://research.csiro.au/hyresource/policy/international/european-commission/ (accessed on 1 December 2023).
  3. European Commission. The Hydrogen Strategy for a Climate-Neutral Europe. Dk, Vol. 53, No. 9, pp. 1689–1699. 2015. Available online: https://energy.ec.europa.eu/system/files/2020-07/hydrogen_strategy_0.pdf/ (accessed on 10 May 2024).
  4. Hassanpouryouzband, A.; Wilkinson, M.; Haszeldine, R.S. Hydrogen energy futures—Foraging or farming? Chem. Soc. Rev. 2024, 53, 2258–2263. [Google Scholar] [CrossRef] [PubMed]
  5. Hassanpouryouzband, A.; Joonaki, E.; Farahani, M.V.; Takeya, S.; Ruppel, C.; Yang, J.; English, N.J.; Schicks, J.M.; Edlmann, K.; Mehrabian, H.; et al. Gas hydrates in sustainable chemistry. Chem. Soc. Rev. 2020, 49, 5225–5309. [Google Scholar] [CrossRef] [PubMed]
  6. Sandrock, G. A panoramic overview of hydrogen storage alloys from a gas reaction point of view. J. Alloys Compd. 1999, 293–295, 877–888. [Google Scholar] [CrossRef]
  7. Liu, Y.; Guo, Y.; Jiang, Y.; Feng, L.; Sun, Y.; Wang, Y. Recent progress in thermodynamic and kinetics modification of magnesium hydride hydrogen storage materials. Mater. Rep. Energy 2024, 4, 100252. [Google Scholar] [CrossRef]
  8. Yartys, V.A.; Lototskyy, M.; Akiba, E.; Albert, R.; Antonov, V.; Ares, J.; Baricco, M.; Bourgeois, N.; Buckley, C.; von Colbe, J.B.; et al. Magnesium based materials for hydrogen based energy storage: Past, present and future. Int. J. Hydrogen Energy 2019, 44, 7809–7859. [Google Scholar] [CrossRef]
  9. Graetz, J.; Reilly, J.; Yartys, V.; Maehlen, J.; Bulychev, B.; Antonov, V.; Tarasov, B.; Gabis, I. Aluminum hydride as a hydrogen and energy storage material: Past, present and future. J. Alloys Compd. 2011, 509 (Suppl. S2), S517–S528. [Google Scholar] [CrossRef]
  10. Advances in Hydrogen Production, Storage and Distribution—Google Knihy. Available online: https://www.sciencedirect.com/book/9780857097682/advances-in-hydrogen-production-storage-and-distribution (accessed on 22 May 2024).
  11. Ley, M.B.; Jepsen, L.H.; Lee, Y.-S.; Cho, Y.W.; von Colbe, J.M.B.; Dornheim, M.; Rokni, M.; Jensen, J.O.; Sloth, M.; Filinchuk, Y.; et al. Complex hydrides for hydrogen storage—New perspectives. Mater. Today 2014, 17, 122–128. [Google Scholar] [CrossRef]
  12. Filho, F.D.C.G.; Ritchie, R.O.; Meyers, M.A.; Monteiro, S.N. Cantor-derived medium-entropy alloys: Bridging the gap between traditional metallic and high-entropy alloys. J. Mater. Res. Technol. 2022, 17, 1868–1895. [Google Scholar] [CrossRef]
  13. Ma, Y.; Wang, Q.; Schweidler, S.; Botros, M.; Fu, T.; Hahn, H.; Brezesinski, T.; Breitung, B. High-entropy energy materials: Challenges and new opportunities. Energy Environ. Sci. 2021, 14, 2883–2905. [Google Scholar] [CrossRef]
  14. Tian, J.; Tang, K.; Wu, Y.; Cao, T.; Pang, J.; Jiang, F. Effects of Al alloying on microstructure and mechanical properties of VCoNi medium entropy alloy. Mater. Sci. Eng. A 2021, 811, 141054. [Google Scholar] [CrossRef]
  15. Schneider, M.; Laplanche, G. Effects of temperature on mechanical properties and deformation mechanisms of the equiatomic CrFeNi medium-entropy alloy. Acta Mater. 2021, 204, 116470. [Google Scholar] [CrossRef]
  16. Pan, Z.; Luo, H.; Zhao, Q.; Cheng, H.; Wei, Y.; Wang, X.; Zhang, B.; Li, X. Tailoring microstructure and corrosion behavior of CoNiVAlx medium entropy alloys via Al addition. Corros. Sci. 2022, 207, 110570. [Google Scholar] [CrossRef]
  17. Fu, A.; Liu, B.; Lu, W.; Liu, B.; Li, J.; Fang, Q.; Li, Z.; Liu, Y. A novel supersaturated medium entropy alloy with superior tensile properties and corrosion resistance. Scr. Mater. 2020, 186, 381–386. [Google Scholar] [CrossRef]
  18. Deng, H.W.; Xie, Z.; Wang, M.; Chen, Y.; Liu, R.; Yang, J.; Zhang, T.; Wang, X.; Fang, Q.; Liu, C.; et al. A nanocrystalline AlCoCuNi medium-entropy alloy with high thermal stability via entropy and boundary engineering. Mater. Sci. Eng. A 2020, 774, 138925. [Google Scholar] [CrossRef]
  19. Zhao, Q.; Luo, H.; Pan, Z.; Wang, X.; Li, X. Effect of hydrogen charging on the corrosion behavior of a body-centered cubic FeCrV medium entropy alloy. Corros. Sci. 2023, 223, 111468. [Google Scholar] [CrossRef]
  20. Nygård, M.M.; Ek, G.; Karlsson, D.; Sahlberg, M.; Sørby, M.H.; Hauback, B.C. Hydrogen storage in high-entropy alloys with varying degree of local lattice strain. Int. J. Hydrogen Energy 2019, 44, 29140–29149. [Google Scholar] [CrossRef]
  21. Nygård, M.M.; Ek, G.; Karlsson, D.; Sørby, M.H.; Sahlberg, M.; Hauback, B.C. Counting electrons—A new approach to tailor the hydrogen sorption properties of high-entropy alloys. Acta Mater. 2019, 175, 121–129. [Google Scholar] [CrossRef]
  22. Zepon, G.; Leiva, D.; Strozi, R.; Bedoch, A.; Figueroa, S.; Ishikawa, T.; Botta, W. Hydrogen-induced phase transition of MgZrTiFe0.5Co0.5Ni0.5 high entropy alloy. Int. J. Hydrogen Energy 2018, 43, 1702–1708. [Google Scholar] [CrossRef]
  23. Montero, J.; Zlotea, C.; Ek, G.; Crivello, J.-C.; Laversenne, L.; Sahlberg, M. TiVZrNb Multi-Principal-Element Alloy: Synthesis Optimization, Structural, and Hydrogen Sorption Properties. Molecules 2019, 24, 2799. [Google Scholar] [CrossRef]
  24. Züttel, A. Materials for hydrogen storage. Mater. Today 2003, 6, 24–33. [Google Scholar] [CrossRef]
  25. Subramaniam, A. Vacuum Arc Melting Unit. Iitc, Vol. Department, No. i, p. 1. 2016. Available online: http://home.iitk.ac.in/~anandh/lab/Arc_Melting.pdf (accessed on 13 March 2023).
  26. TESCAN SEM Solutions for Materials Science|TESCAN. Available online: https://www.tescan.com/product-portfolio/sem/sem-for-materials-science/ (accessed on 30 March 2021).
  27. Keysight Nano Indenter G200—Keysight News Image Library. Available online: https://about.keysight.com/en/newsroom/images/G200/ (accessed on 7 March 2023).
  28. Murty, B.S.; Yeh, J.W.; Ranganathan, S. High—Entropy Alloys, 1st ed.; Elsevier: Amsterdam, The Netherlands, 2014. [Google Scholar] [CrossRef]
  29. Takeuchi, A.; Inoue, A. Classification of Bulk Metallic Glasses by Atomic Size Difference, Heat of Mixing and Period of Constituent Elements and Its Application to Characterization of the Main Alloying Element. Mater. Trans. 2005, 46, 2817–2829. [Google Scholar] [CrossRef]
  30. Guo, S.; Liu, C.T. Phase stability in high entropy alloys: Formation of solid-solution phase or amorphous phase. Prog. Nat. Sci. Mater. Int. 2011, 21, 433–446. [Google Scholar] [CrossRef]
  31. Modern Inorganic Chemistry: Jolly, William L: Free Download, Borrow, and Streaming: Internet Archive. Available online: https://archive.org/details/trent_0116300649799 (accessed on 24 January 2024).
  32. Jia, Y.; Zhang, L.; Li, P.; Ma, X.; Xu, L.; Wu, S.; Jia, Y.; Wang, G. Microstructure and Mechanical Properties of Nb-Ti-V-Zr Refractory Medium-Entropy Alloys. Front. Mater. 2020, 7, 172. [Google Scholar] [CrossRef]
  33. Zhang, Y.; Bu, Z.; Yao, T.; Yang, L.; Li, W.; Li, J. Novel BCC Ti-Al-Nb-Zr medium-entropy alloys with ultrahigh specific strength and ductility. J. Alloys Compd. 2023, 936, 168290. [Google Scholar] [CrossRef]
  34. Cieślak, G.; Dąbrowa, J.; Jawańska, M.; Parzuchowska, A.; Oleszak, D. Microstructure and Mechanical Properties of the Ductile Al–Ti–Mo–Nb–V Refractory High Entropy Alloys. Metall. Mater. Trans. A Phys. Metall. Mater. Sci. 2022, 53, 653–662. [Google Scholar] [CrossRef]
  35. Nagase, T.; Todai, M.; Wang, P.; Sun, S.-H.; Nakano, T. Design and development of (Ti, Zr, Hf)-Al based medium entropy alloys and high entropy alloys. Mater. Chem. Phys. 2022, 276, 125409. [Google Scholar] [CrossRef]
  36. Senkov, O.N.; Senkova, S.V.; Woodward, C.; Miracle, D.B. Low-density, refractory multi-principal element alloys of the Cr–Nb–Ti–V–Zr system: Microstructure and phase analysis. Acta Mater. 2013, 61, 1545–1557. [Google Scholar] [CrossRef]
  37. Kumar, A.; Singh, A.; Suhane, A. Mechanically alloyed high entropy alloys: Existing challenges and opportunities. J. Mater. Res. Technol. 2022, 17, 2431–2456. [Google Scholar] [CrossRef]
  38. Šittner, P.; Heller, L.; Pilch, J.; Curfs, C.; Alonso, T.; Favier, D. Young’s modulus of austenite and martensite phases in superelastic NiTi wires. J. Mater. Eng. Perform. 2014, 23, 2303–2314. [Google Scholar] [CrossRef]
  39. MODUL PRUŽNOSTI—Fyzikální Kabinet FyzKAB. Available online: http://kabinet.fyzika.net/studium/tabulky/modul-pruznosti.php (accessed on 30 May 2023).
  40. Quan, M.; Yan, Z.; Zou, C. Research on the microstructures and mechanical properties of novel Cu-rich CuxNiTiCr (x = 2, 3, 4, 5) medium-entropy alloys. Mater. Charact. 2024, 212, 113961. [Google Scholar] [CrossRef]
  41. Li, N.; Feng, S.; Sun, S.; Wei, R. A novel low-cost medium entropy alloys with excellent mechanical properties via multiple strengthening mechanisms. Intermetallics 2024, 170, 108329. [Google Scholar] [CrossRef]
  42. Azeem, W.; Shahzad, M.K.; Wong, Y.H.; Tahir, M.B. Ab-initio calculations for the study of the hydrogen storage properties of CsXH3 (X= Co, Zn) perovskite-type hydrides. Int. J. Hydrogen Energy 2024, 50, 305–313. [Google Scholar] [CrossRef]
  43. Zhu, Z.; Zhu, S.; Lu, H.; Wu, J.; Yan, K.; Cheng, H.; Liu, J. Stability of LaNi5-xCox alloys cycled in hydrogen—Part 1 evolution in gaseous hydrogen storage performance. Int. J. Hydrogen Energy 2019, 44, 15159–15172. [Google Scholar] [CrossRef]
Figure 1. Graphical representation of phase stability regions for predicting formation of supersaturated solid solutions (medium/high entropy) in Al-Ti-Nb-Zr materials, with representative alloy compositions plotted.
Materials 17 02897 g001
Figure 2. Graphical representation of phase stability regions for predicting formation of supersaturated solid solutions (medium–high entropy) in Al-Ti-Nb-V materials, with representative alloy compositions plotted.
Materials 17 02897 g002
Figure 3. Graphical representation of phase stability regions for predicting formation of supersaturated solid solutions (medium–high entropy) in Al-Ti-Nb-Hf materials, with representative alloy compositions plotted.
Materials 17 02897 g003
Figure 4. The XRD powder pattern of samples from the Al-Ti-Nb-Zr system in the as-prepared state (black) and after hydrogenation (red).
Materials 17 02897 g004
Figure 5. The XRD powder pattern of samples from the Al-Ti-Nb-V system in the as-prepared state (black) and after hydrogenation (red).
Materials 17 02897 g005
Figure 6. The XRD powder pattern of samples from the Al-Ti-Nb-Hf system in the as-prepared state (black) and after hydrogenation (red).
Materials 17 02897 g006
Figure 7. The course of the absorption/desorption measurements of the Al15Ti40Nb30Zr15 alloy.
Materials 17 02897 g007
Figure 8. The relationship between material and thermodynamic parameters and hydrogen absorption and desorption in the Al-Ti-Nb-Zr system.
Materials 17 02897 g008
Figure 9. The relationship between material and thermodynamic parameters and hydrogen absorption and desorption in the Al-Ti-Nb-V system.
Materials 17 02897 g009
Figure 10. The relationship between material and thermodynamic parameters and hydrogen absorption and desorption in the Al-Ti-Nb-Hf system.
Materials 17 02897 g010
Table 1. Chemical composition, density, and mechanical properties of the Al-Ti-Nb-Zr alloys.
AlloyEDX
[at.%]
Density
[g·cm−3]
Microhardness
HV0.3
Nanohardness
[GPa]
Modulus of Elasticity [GPa]
Al30Ti35Nb15Zr20Al30Ti34Nb14Zr225.312 ± 0.009532 ± 936.7 ± 0.7127 ± 10
Al23Ti25Nb30Zr22Al23Ti27Nb28Zr226.011 ± 0.006454 ± 445.7 ± 0.2120 ± 3.7
Al30Ti35Nb20Zr15Al31Ti36Nb20Zr135.52 ± 0.14542 ± 216.61 ± 0.02135 ± 5
Al25Ti25Nb20Zr30Al24Ti26Nb21Zr305.83 ± 0.02444 ± 75.5 ± 0.12105 ± 2
Al15Ti38Nb23Zr24Al16Ti38Nb23Zr235.87 ± 0.012377 ± 94.4 ± 0.1290 ± 3
Al35Ti20Nb25Zr20Al33Ti23Nb24Zr205.815 ± 0.008748 ± 318.3 ± 0.77160 ± 8
Al30Ti40Nb15Zr15Al28Ti38Nb16Zr185.46 ± 0.017588 ± 196.48 ± 0.06114 ± 2
Al20Ti25Nb25Zr30Al21Ti26Nb26Zr276.15 ± 0.019470 ± 1417.4 ± 0.11138 ± 5
Al20Ti40Nb15Zr25Al19Ti41Nb15Zr255.643 ± 0.004353 ± 114.94 ± 0.0897 ± 4
Al15Ti40Nb30Zr15Al14Ti39Nb29Zr186.11 ± 0.02398 ± 215.07 ± 0.12112 ± 3
Table 2. Chemical composition, density, and mechanical properties of the Al-Ti-Nb-V alloys.
AlloyEDX
[at.%]
Density
[g·cm−3]
Microhardness
HV0.3
Nanohardness
[GPa]
Modulus of Elasticity [GPa]
Al25Ti35Nb15V25Al26Ti36Nb13V255.101 ± 0.001500 ± 106.1 ± 0.12158 ± 5
Al20Ti25Nb30V25Al18Ti26Nb30V275.934 ± 0.007383 ± 424.95 ± 0.06146 ± 3
Al30Ti35Nb20V15Al27Ti35Nb22V165.31 ± 0.013495 ± 145.99 ± 0.09160 ± 3
Al20Ti25Nb20V35Al18Ti24Nb22V355.74 ± 0.012381 ± 345.36 ± 0.07153 ± 3
Al15Ti40Nb25V20Al16Ti38Nb23V225.646 ± 0.006321 ± 84.3 ± 0.18131 ± 3
Al35Ti20Nb25V20Al34Ti19Nb25V225.432 ± 0.009527 ± 146.6 ± 0.16153 ± 5
Al20Ti25Nb25V30Al18Ti25Nb27V305.78 ± 0.01491 ± 216.6 ± 0.13154 ± 2
Al25Ti35Nb20V20Al25Ti36Nb19V205.330 ± 0.007424 ± 155.5 ± 0.11143 ± 3
Al15Ti40Nb15V30Al13Ti40Nb15V315.620 ± 0.009321 ± 74.7 ± 0.1130 ± 2
Al15Ti40Nb30V15Al14Ti43Nb29 V156.74 ± 0.012338 ± 184.8 ± 0.09131 ± 3
Table 3. Chemical composition, density, and mechanical properties of the Al-Ti-Nb-Hf alloys.
AlloyEDX
[at.%]
Density
[g·cm−3]
Microhardness
HV0.3
Nanohardness
[GPa]
Modulus of Elasticity
[GPa]
Al28Ti28Nb18Hf26Al28Ti28Nb18Hf266.813 ± 0.007559 ± 156.54 ± 0.09137 ± 6
Al20Ti20Nb30Hf30Al21Ti21Nb30Hf297.58 ± 0.01437 ± 75.4 ± 0.19129 ± 1
Al25Ti30Nb25Hf20Al26Ti31Nb24Hf196.522 ± 0.008540 ± 416.5 ± 0.17150 ± 3
Al22Ti22Nb20Hf36Al22Ti22Nb20Hf367.67 ± 0.02424 ± 455.42 ± 0.04114 ± 4
Al15Ti30Nb25Hf30Al18Ti32Nb23Hf287.612 ± 0.007351 ± 54.2 ± 0.26110 ± 4
Al30Ti15Nb20Hf35Al31Ti16Nb21Hf327.27 ± 0.012801 ± 579.7 ± 1.7183 ± 23
Al30Ti35Nb15Hf20Al30Ti33Nb17Hf206.234 ± 0.008516 ± 86.8 ± 0.1145 ± 4
Al15Ti25Nb25Hf35Al15Ti25Nb27Hf347.622 ± 0.006430 ± 95.7 ± 0.9123 ± 14
Al15Ti30Nb15Hf40Al17Ti31Nb15Hf377.523 ± 0.018349 ± 64.91 ± 0.08112 ± 3
Al15Ti40Nb30Hf20Al14Ti36Nb32Hf197.041 ± 0.008347 ± 54.95 ± 0.09123 ± 2
Table 4. Thermodynamic parameters of Al-Ti-Ni-Zr alloys and hydrogen absorption test results.
AlloyΔHmix
[kJ/mol]
δ × 100ΔSmixVECAbsorption H
[wt.%]/[H/M]
Residual H
[wt.%]/[H/M]
Desorption H
[wt.%]/[H/M]
Cycle
Efficiency
[%]
Al30Ti35Nb15Zr20−25.504.3911.103.851.28/0.740.46/0.260.82/0.4864.86
Al23Ti25Nb30Zr22−19.114.6411.464.071.06/0.690.25/0.160.81/0.5376.91
Al30Ti35Nb20Zr15−23.803.9911.103.900.95/0.540.27/0.150.71/0.3972.22
Al25Ti25Nb20Zr30−22.945.0311.443.951.23/0.820.41/0.270.82/0.5567.07
Al15Ti38Nb23Zr24−14.084.6111.084.081.61/1.050.62/0.400.99/0.6561.90
Al35Ti20Nb25Zr20−25.824.5411.293.900.79/0.480.18/0.100.61/0.3879.16
Al30Ti40Nb15Zr15−24.723.9510.783.851.10/0.630.37/0.220.73/0.4165.08
Al20Ti25Nb25Zr30−18.465.0411.444.051.28/0.860.43/0.290.85/0.5766.28
Al20Ti40Nb15Zr25−19.484.6210.973.951.28/0.790.54/0.330.74/0.4658.23
Al15Ti40Nb30Zr15−12.723.9610.784.151.33/0.880.30/0.201.03/0.6877.27
Table 5. Thermodynamic parameters of Al-Ti-Ni-V alloys and hydrogen absorption test results.
AlloyΔHmix
[kJ/mol]
δ × 100ΔSmixVECAbsorption H
[wt.%]/H/M
Residual H
[wt.%]/H/M
Desorption H
[wt.%]/
H/M
Cycle
Efficiency
[%]
Al25Ti35Nb15V25−17.634.0811.184.150.68/0.330.1/0.050.58/0.2884.85
Al20Ti25Nb30V25−13.723.9411.444.350.88/0.520.15/0.090.73/0.4382.69
Al30Ti35Nb20V15−19.783.3511.104.050.67/0.350.13/0.070.54/0.2880.00
Al20Ti25Nb20V35−13.944.4111.294.350.91/0.500.12/0.060.79/0.4488.00
Al15Ti40Nb25V20−11.863.7910.974.301.23/0.680.21/0.111.02/0.5783.82
Al35Ti20Nb25V20−19.303.5711.284.100.44/0.230.04/0.020.4/0.2191.3
Al20Ti25Nb25V30−13.844.2011.444.350.61/0.350.09/0.050.52/0.385.71
Al25Ti35Nb20V20−17.463.7511.294.150.92/0.480.13/0.070.79/0.4185.42
Al15Ti40Nb15V30−12.364.4010.784.301.2/0.640.19/0.11.01/0.5484.38
Al15Ti40Nb30V15−11.583.3910.784.300.95/0.550.13/0.070.82/0.4827.27
Table 6. Thermodynamic parameters of Al-Ti-Ni-Hf alloys and hydrogen absorption test results.
AlloyΔHmix
[kJ/mol]
δ × 100ΔSmixVECAbsorption H
[wt.%]/H/M
Residual H
[wt.%]/H/M
Desorption H
[wt.%]/
H/M
Cycle
Efficiency [%]
Al28Ti28Nb18Hf26−23.244.1111.413.900.63/0.410.10/0.080.53/0.3380.34
Al20Ti20Nb30Hf30−16.564.3711.364.100.69/0.660.06/0.060.63/0.6090.91
Al25Ti30Nb25Hf20−19.903.8111.444.000.24/0.190.21/0.100.03/0.0947.37
Al22Ti22Nb20Hf36−19.834.4711.273.980.80/0.800.22/0.210.58/0.5973.75
Al15Ti30Nb25Hf30−13.324.2411.254.101.01/0.920.25/0.230.76/0.6975.00
Al30Ti15Nb20Hf35−24.744.5511.103.900.50/0.460.03/0.030.47/0.4393.48
Al30Ti35Nb15Hf20−24.303.7511.103.850.80/0.600.19/0.140.61/0.4676.67
Al15Ti25Nb25Hf35−13.494.4211.184.100.86/0.880.19/0.190.67/0.6978.41
Al15Ti30Nb15Hf40−15.064.3810.784.001.02/1.010.32/0.310.70/0.7069.30
Al15Ti40Nb30Hf20−11.973.6810.974.141.01/0.850.19/0.160.82/0.6981.18
Disclaimer/Publisher’s Note: The statements, opinions and data contained in all publications are solely those of the individual author(s) and contributor(s) and not of MDPI and/or the editor(s). MDPI and/or the editor(s) disclaim responsibility for any injury to people or property resulting from any ideas, methods, instructions or products referred to in the content.

