
Frictional Properties of Soaps with the Addition of Ground Hazelnut Shells


 ,
,  , ,
, , 
Abstract
1. Introduction
2. Materials and Methods
2.1. Research Material
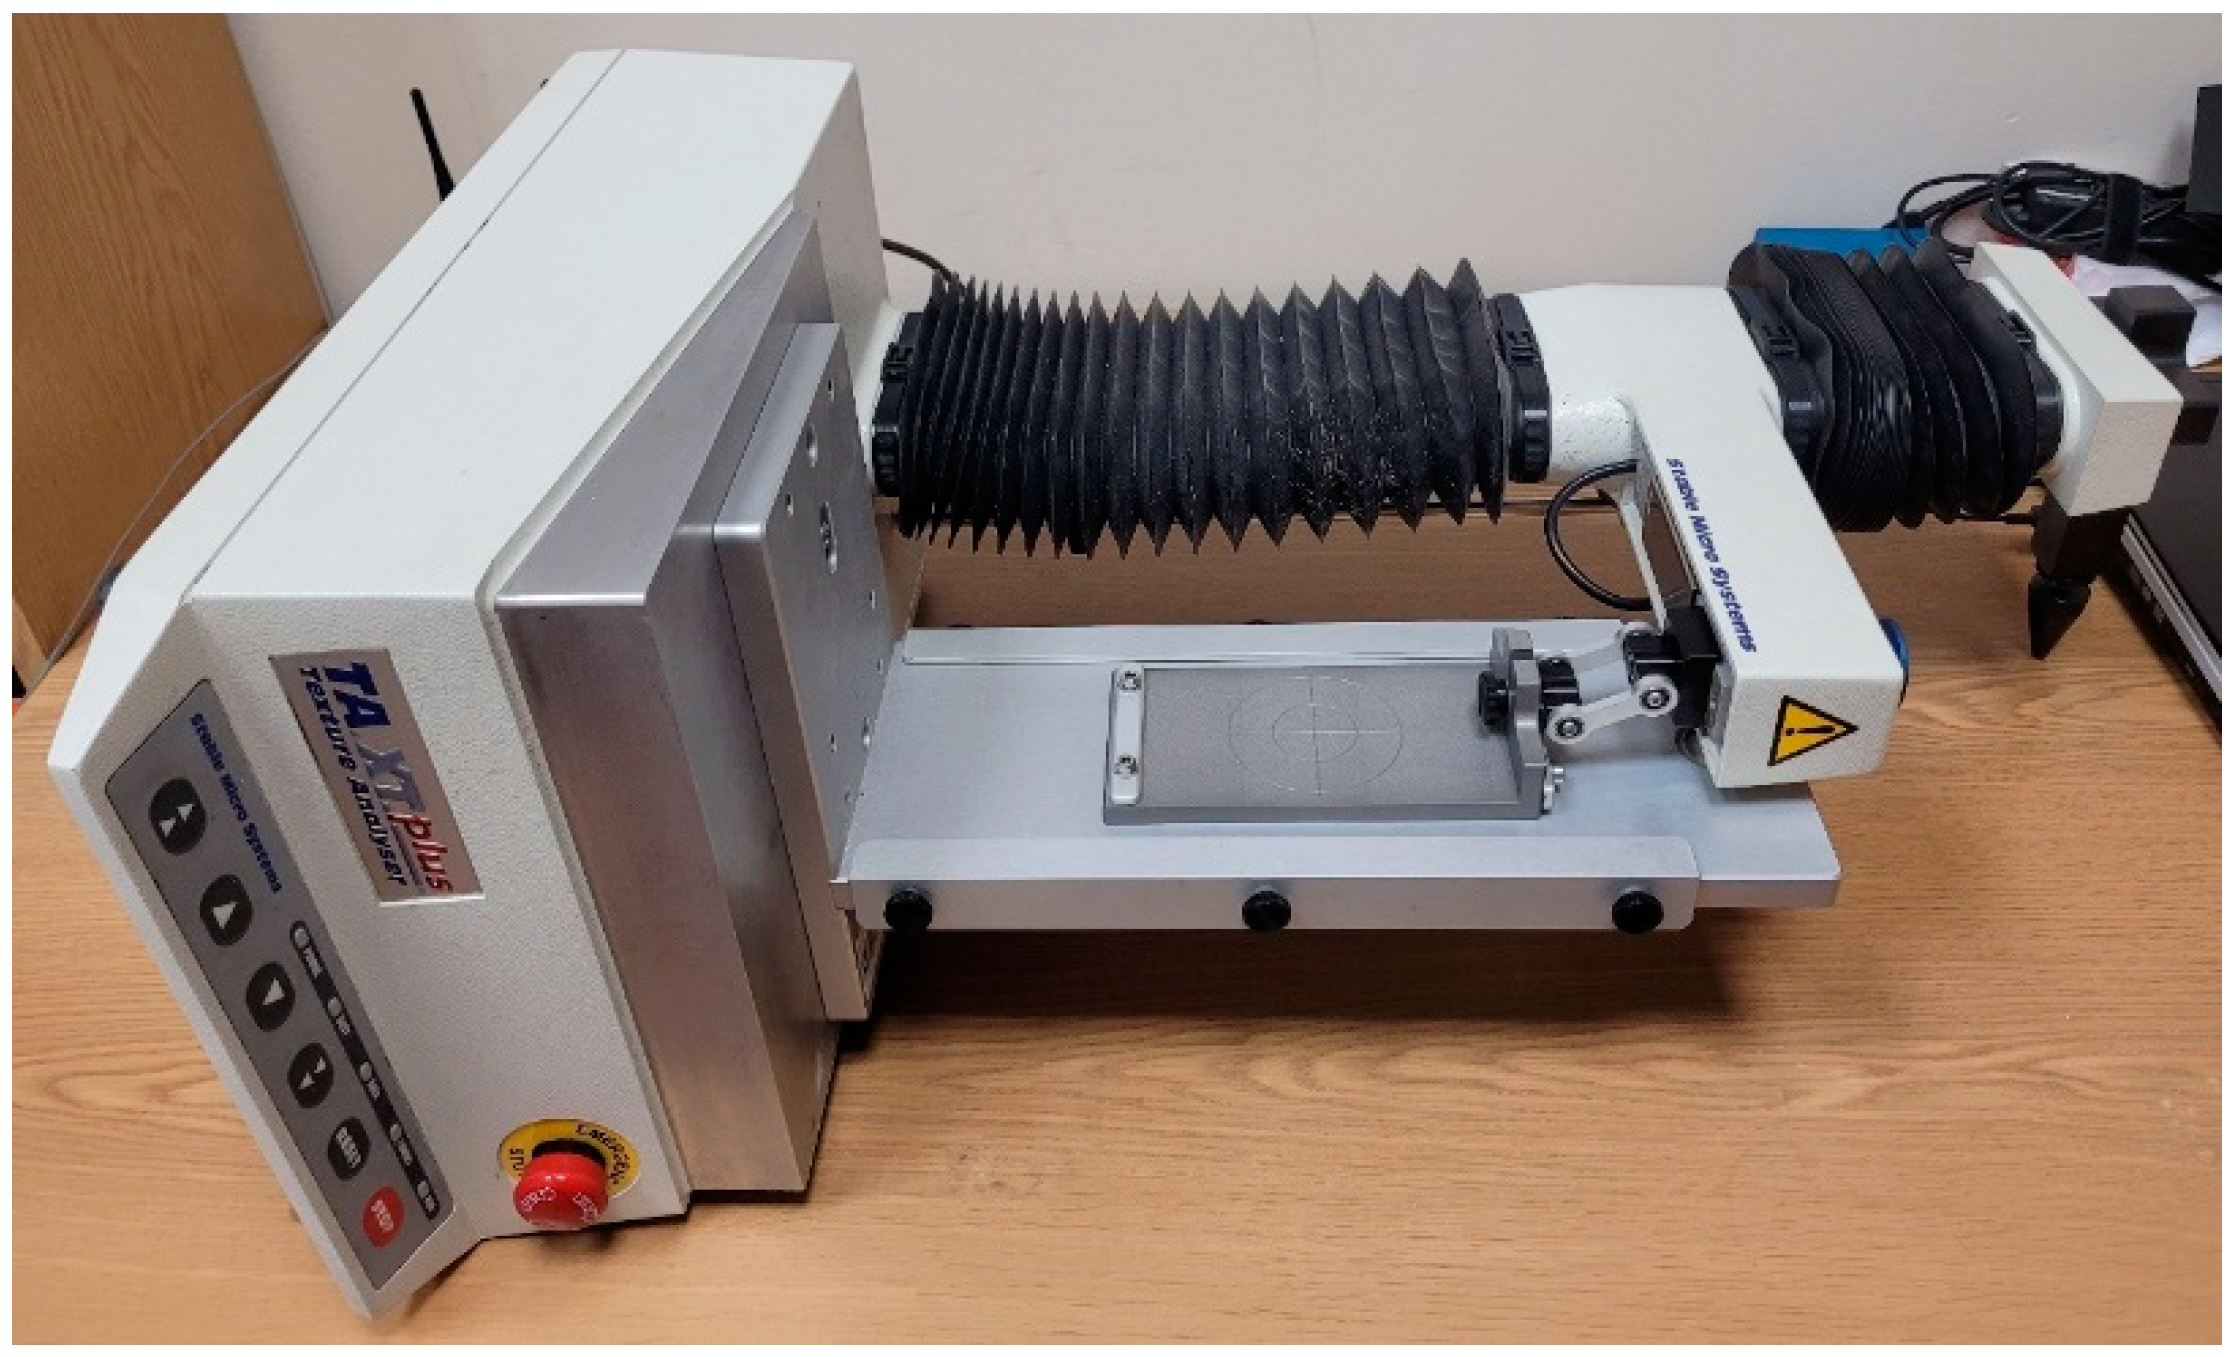
2.2. Friction
2.3. Statistical Analysis
3. Results
4. Discussion
5. Conclusions
Author Contributions
Funding
Institutional Review Board Statement
Informed Consent Statement
Data Availability Statement
Conflicts of Interest
References
- Wojtyło, A.; Ryczkowski, J. The history of soap. Vol. I. Beginnings. Chem. Ind. 2023, 102, 410–415. [Google Scholar] [CrossRef]
- Mussagy, C.U.; Farias, O.F.; Santos-Ebinuma, V.C.; Pereira, J.F.B.; Pessoa, A. Sustainable one-pot platform for the green recovery of carotenoids from Phaffia rhodozyma yeast and their use as natural additives in soap formulation. Environ. Technol. Innov. 2023, 29, 103029. [Google Scholar] [CrossRef]
- Handayania, S.; Artya, I.S.; Budimarwantia, C.; Theresiha, K.; Yuliantib, E.; Khairuddean, M. Preparation and antimicrobial activity analysis of organic soap bar containing gnetum gnemon peel extract. Molekul 2021, 16, 226–234. [Google Scholar] [CrossRef]
- Félix, S.; Araújo, J.; Pires, A.M.; Sousa, A.C. Soap production: A green prospective. Waste Manag. 2017, 66, 190–195. [Google Scholar] [CrossRef] [PubMed]
- Azme, S.N.K.; Yusoff, N.S.I.M.; Chin, L.Y.; Mohd, Y.; Hamid, R.D.; Jalil, M.N.; Zaki, H.M.; Saleh, S.H.; Ahmat, N.; Manan, M.A.F.A.; et al. Recycling waste cooking oil into soap: Knowledge transfer through community service learning. Clean. Waste Syst. 2023, 4, 100084. [Google Scholar] [CrossRef]
- Herva, M.; Neto, B.; Roca, E. Environmental assessment of the integrated municipal solid waste management system in Porto (Portugal). J. Clean. Prod. 2014, 70, 183–193. [Google Scholar] [CrossRef]
- Hoşgün, E.Z.; Bozan, B. Effect of different types of thermochemical pretreatment on the enzymatic hydrolysis and the composition of hazelnut shells. Waste Biomass Valoriz. 2020, 11, 3739–3748. [Google Scholar] [CrossRef]
- López, L.; Rivas, S.; Moure, A.; Vila, C.; Parajó, J.C. Development of Pretreatment Strategies for the Fractionation of Hazelnut Shells in the Scope of Biorefinery. Agronomy 2020, 10, 1568. [Google Scholar] [CrossRef]
- Senol, H. Biogas potential of hazelnut shells and hazelnut wastes in Giresun City. Biotechnol. Rep. 2019, 24, e00361. [Google Scholar] [CrossRef]
- Demirbas, A. Furfural production from fruit shells by acid-catalysed hydrolysis. Energy Source Part A Recover. Util. Environ. Eff 2006, 28, 157–165. [Google Scholar] [CrossRef]
- Puliga, F.; Leonardi, P.; Minutella, F.; Zambonelli, A.; Francioso, O. Valorization of Hazelnut Shells as Growing Substrate for Edible and Medicinal Mushrooms. Horticulturae 2022, 8, 214. [Google Scholar] [CrossRef]
- Ziarati, P.; Moradi, D.; Rodriguez, L.C.; Hochwimmer, B.; Vambol, V.; Vambol, S. Biofortification of Oryza sativa L. With agri-food waste to improve the dietary value of crops. Ecol. Quest. 2022, 33, 47–54. [Google Scholar] [CrossRef]
- Barbu, M.C.; Sepperer, T.; Tudor, E.M.; Petutschnigg, A. Walnut and hazelnut shells: Untapped industrial resources and their suitability in lignocellulosic composites. Appl. Sci. 2020, 10, 6340. [Google Scholar] [CrossRef]
- Ceraulo, M.; La Mantia, F.P.; Mistretta, M.C.; Titone, V. The Use of Waste Hazelnut Shells as a Reinforcement in the Development of Green Biocomposites. Polymers 2022, 14, 2151. [Google Scholar] [CrossRef]
- Cherkashina, N.I.; Pavlenko, Z.V.; Pushkarskaya, D.V.; Denisova, L.V.; Domarev, S.N.; Ryzhikh, D.A. Synthesis and Properties of Polystyrene Composite Material with Hazelnut Shells. Polymers 2023, 15, 3212. [Google Scholar] [CrossRef] [PubMed]
- Fauziati, F. Pemanfaatan Serbuk Arang Cangkang Sawit sebagai Scrub pada Sabun Mandi. J. Ris. Teknol. Ind. 2016, 8, 133. [Google Scholar] [CrossRef]
- Lublin, P.L. Przystawka do Oznaczania Parametrów Tarcia Kinetycznego. Polish Patent W.130067, 18 May 2021. [Google Scholar]
- Mazur, J.; Różyło, R.; Wójcik, M.; Panasiewicz, M.; Zawiślak, K.; Sobczak, P. Development of an Innovative Attachment Determining Friction Parameters for Quality Assessment in Sustainable Processing. Sustainability 2022, 14, 12986. [Google Scholar] [CrossRef]
- Łusiak, P.; Różyło, R.; Mazur, J.; Sobczak, P.; Matwijczuk, A. Evaluation of physical parameters and spectral characterisation of the quality of soaps containing by-products from the food industry. Sci. Rep. 2024, 14, 4687. [Google Scholar] [CrossRef] [PubMed]
- Fonseca, M.A.; Karpe, A.N.; Keerthi, P.; Mendes, R.M. Fruit peel soap and its antibacterial properties in skincare. Int. J. Curr. Pharm. Res. 2019, 11, 17–20. [Google Scholar] [CrossRef]
- Torres, M.D.; Seijo, J. By-products from the chestnut industry used to produce natural potassium soaps: Physicochemical properties. J. Surfactants Deterg. 2016, 19, 381–387. [Google Scholar] [CrossRef]
- Supriadi, Y.; Cahyani, B.D. Formulation and Evaluation of Sappan Wood Extract Transparent Solid Soap with Variations in the Concentration of Glycerin as a Humectant. J. Health Sci. Med. Dev. 2022, 1, 58–67. [Google Scholar] [CrossRef]
- Available online: https://textureanalysisprofessionals.blogspot.com/2015/08/texture-analysis-in-action-friction.html (accessed on 15 January 2024).
- ASTM D1894-14; Standard Test Method for Static and Kinetic Coefficients of Friction of Plastic Film and Sheeting. ASTM International: West Conshohocken, PA, USA, 2016. Available online: www.astm.org/Standards/D1894.htm (accessed on 15 January 2024).
- Bani-Hani, E.H.; Lopez, J.; Mohanan, G. Data on the coefficient of static friction between surfaces coated with different sizes of rubber granules produced from used tires. Data Br. 2019, 22, 940–945. [Google Scholar] [CrossRef] [PubMed]
- Ivković, M.; Djurdjanović, D.; Stamenković, D. The influence of the contact surface roughness on the static friction coefficient. Tribol. Ind. 2000, 22, 41. [Google Scholar]
- Kogut, L.; Etsion, I. A static friction model for elastic-plastic contacting rough surfaces. J. Tribol. 2004, 126, 34–40. [Google Scholar] [CrossRef]
- Simič, R.; Yetkin, M.; Zhang, K.; Spencer, N.D. Importance of Hydration and Surface Structure for Friction of Acrylamide Hydrogels. Tribol. Lett. 2020, 68, 64. [Google Scholar] [CrossRef]
- Dong, Y.; Zhang, C.; Tang, J.Y. Dynamic Frictional Behavior of Microdroplets on PDMS Soft Substrate. J. Tribol. 2021, 41, 619–626. [Google Scholar] [CrossRef]
- Pataky, T.C.; Zatsiorsky, V. Finger Pad Viscoelastic Response to Shear Load. In Proceedings of the ASME 2003 International Mechanical Engineering Congress and Exposition. Advances in Bioengineering, Washington, DC, USA, 15–21 November 2003; p. 347. [Google Scholar] [CrossRef]
- Katsumata, T.; Mizutani, Y.; Todoroki, A.; Matsuzaki, R. A Fundamental Study on Static Strength Improvement of CFRP Bolted Joints by Increasing Friction Force. J. Solid Mech. Mater. Eng. 2010, 4, 711–719. [Google Scholar] [CrossRef]


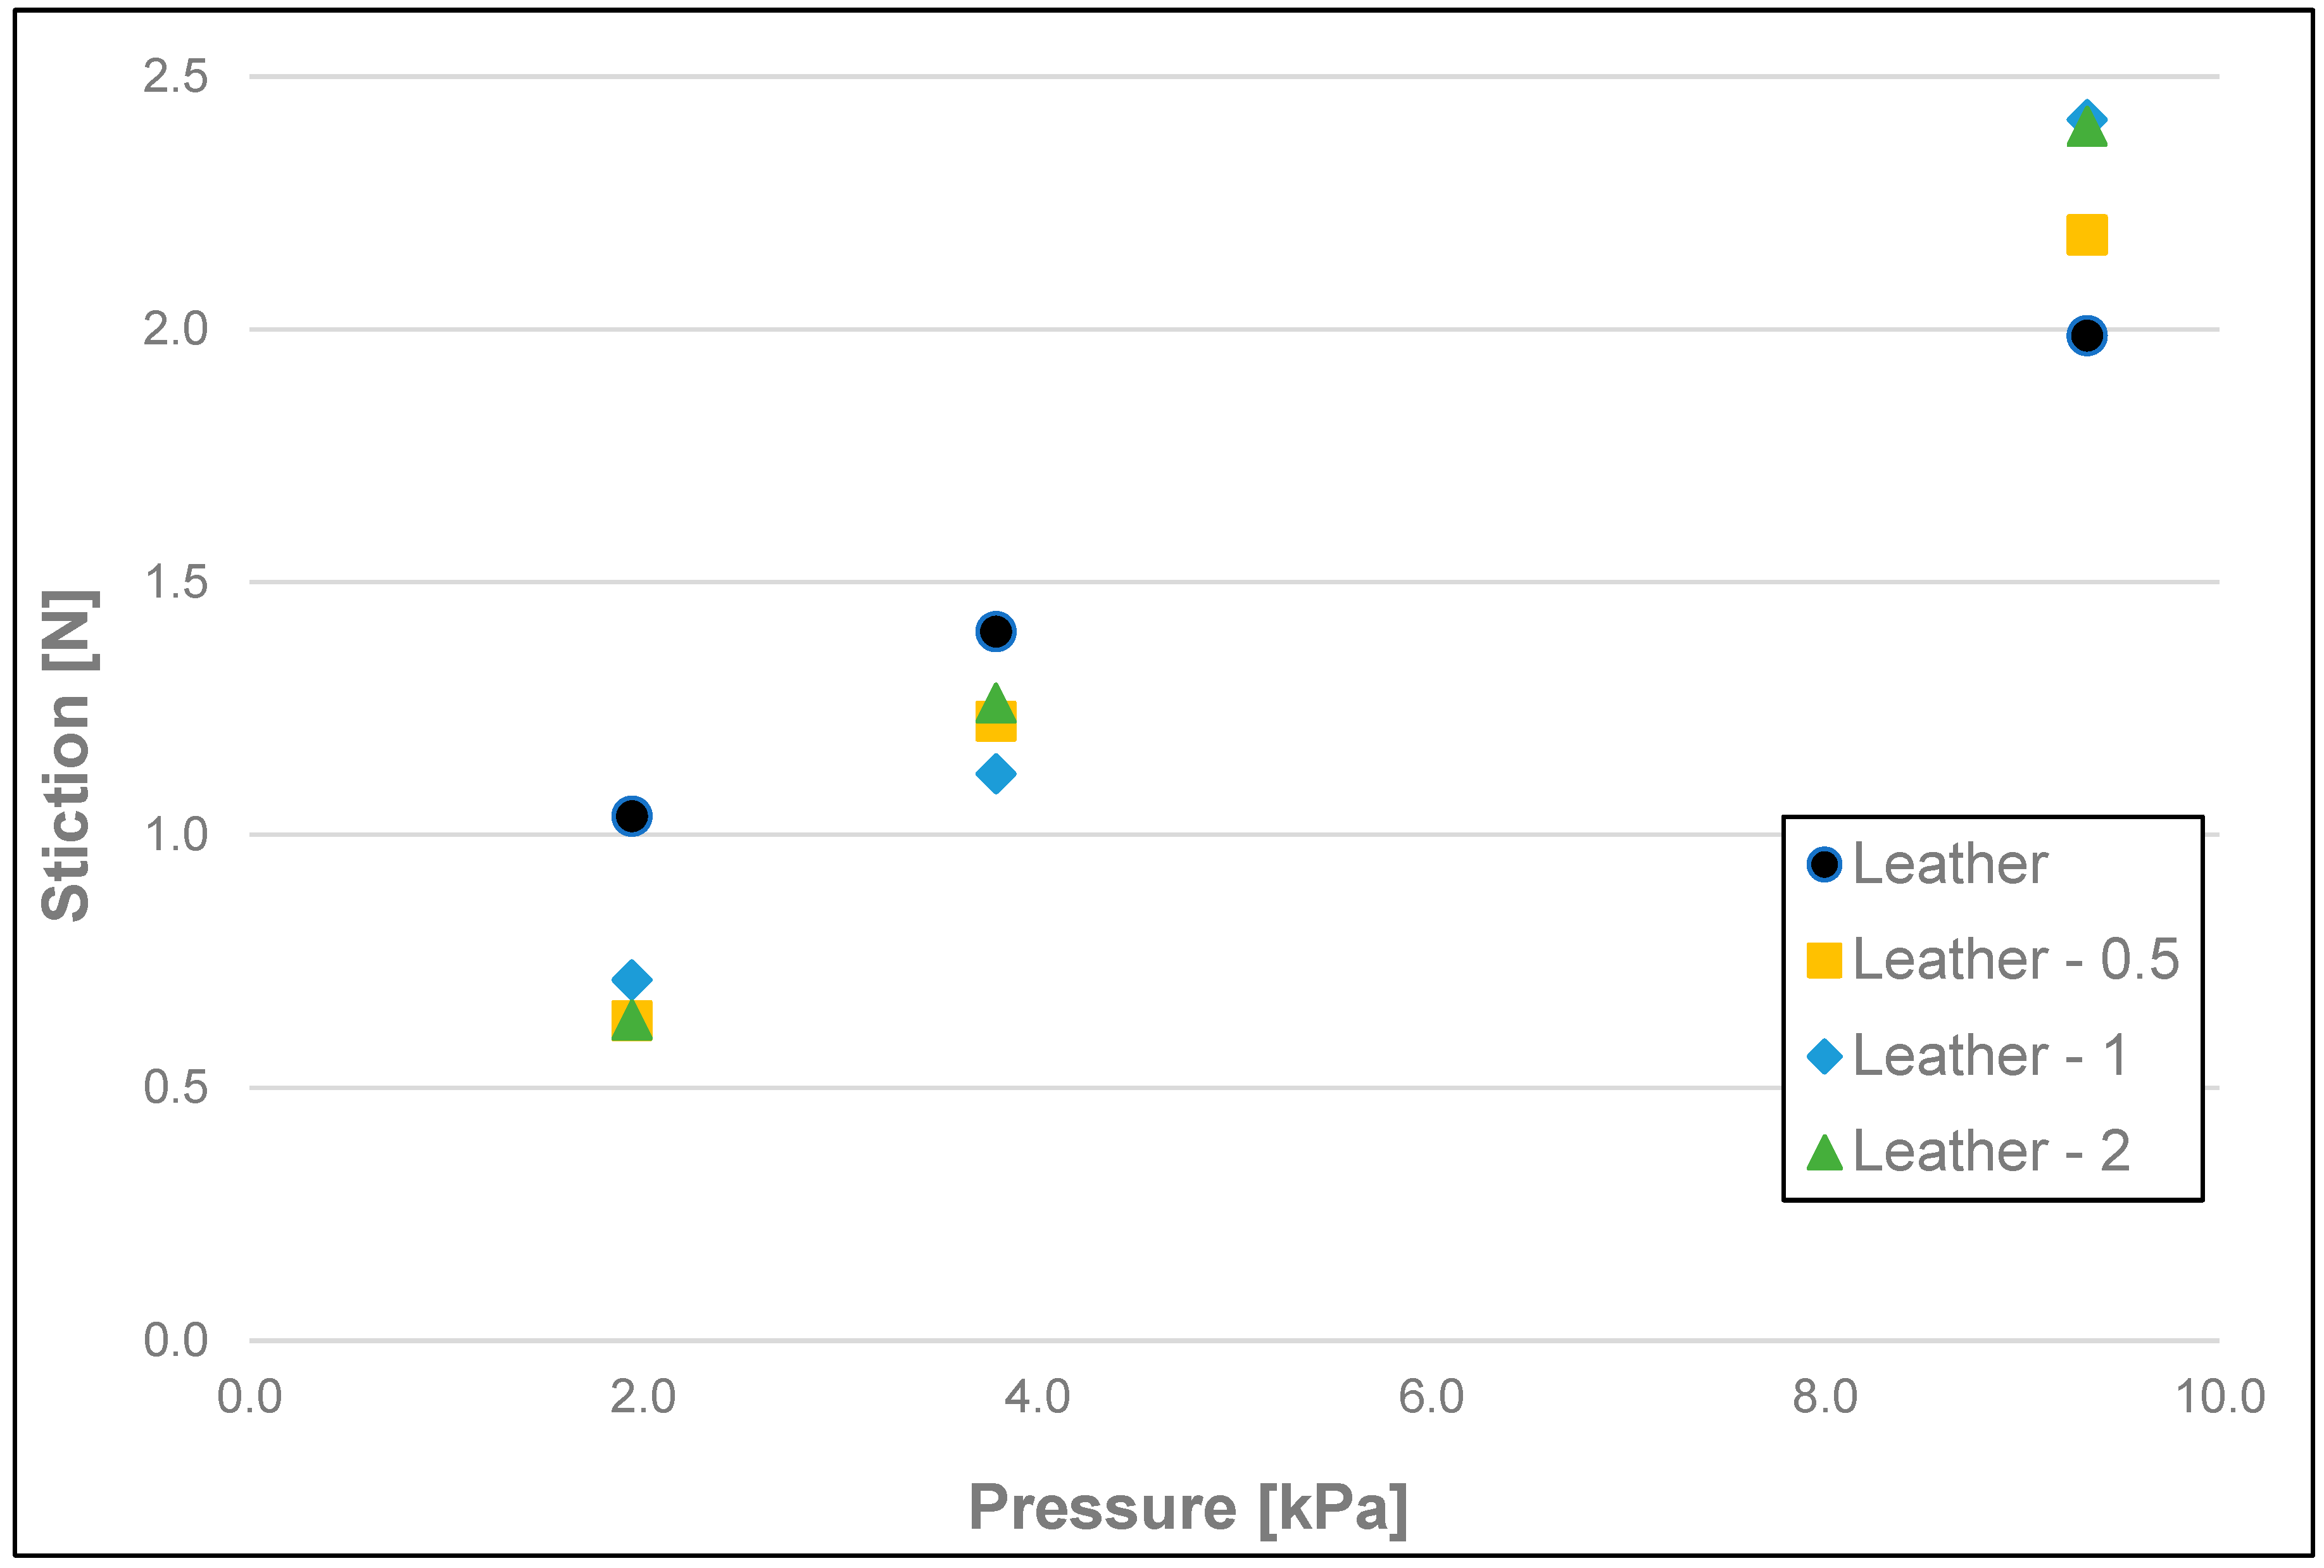
| Surface | Pressure [kPa] | Size Range of Nutshell Particles Added to the Soap [mm] | Min. Stiction [N] | Max. Stiction [N] | Mean Stiction [N] | Stiction S.D. | Homogeneous Group * |
|---|---|---|---|---|---|---|---|
| Leather | 1.94 | - | 0.93 | 1.21 | 1.04 | 0.10 | c, d, e, f |
| <0–0.5 | 0.58 | 0.68 | 0.63 | 0.05 | a, b, c | ||
| <0.5–1 | 0.60 | 0.84 | 0.71 | 0.12 | a, b, c, d | ||
| <1–2 | 0.59 | 0.68 | 0.63 | 0.04 | a, b, c | ||
| 3.79 | - | 1.02 | 1.80 | 1.40 | 0.28 | e, f, g, h, i | |
| <0–0.5 | 1.08 | 1.36 | 1.23 | 0.11 | e, f, g, h | ||
| <0.5–1 | 0.82 | 1.32 | 1.12 | 0.24 | d, e, f, g | ||
| <1–2 | 1.16 | 1.38 | 1.26 | 0.10 | e, f, g, h | ||
| 9.33 | - | 1.66 | 2.40 | 1.99 | 0.32 | j, k, l | |
| <0–0.5 | 1.74 | 2.68 | 2.19 | 0.34 | k, l | ||
| <0.5–1 | 2.07 | 2.81 | 2.42 | 0.27 | l | ||
| <1–2 | 2.17 | 2.61 | 2.40 | 0.17 | l | ||
| Leather + Water | 1.94 | - | 0.39 | 0.48 | 0.43 | 0.04 | a |
| <0–0.5 | 0.36 | 0.50 | 0.42 | 0.07 | a | ||
| <0.5–1 | 0.38 | 0.59 | 0.46 | 0.09 | a | ||
| <1–2 | 0.29 | 0.40 | 0.33 | 0.04 | a | ||
| 3.79 | - | 0.41 | 0.55 | 0.48 | 0.07 | a | |
| <0–0.5 | 0.81 | 1.15 | 0.99 | 0.12 | b, c, d, e | ||
| <0.5–1 | 0.43 | 0.61 | 0.54 | 0.07 | a, b | ||
| <1–2 | 0.59 | 0.95 | 0.72 | 0.14 | a, b, c, d | ||
| 9.33 | - | 0.97 | 1.37 | 1.17 | 0.15 | d, e, f, g | |
| <0–0.5 | 1.44 | 1.70 | 1.55 | 0.11 | g, h, i, j | ||
| <0.5–1 | 1.34 | 1.55 | 1.46 | 0.09 | f, g, h, i | ||
| <1–2 | 1.20 | 1.58 | 1.41 | 0.14 | e, f, g, h, i | ||
| Sandpaper (320) | 1.94 | - | 1.12 | 1.28 | 1.28 | 0.13 | e, f, g, h |
| <0–0.5 | 0.74 | 1.03 | 0.97 | 0.06 | b, c, d, e | ||
| <0.5–1 | 0.77 | 0.88 | 1.18 | 0.15 | d, e, f, g | ||
| <1–2 | 0.70 | 0.90 | 0.99 | 0.15 | b, c, d, e | ||
| 3.79 | - | 1.60 | 2.03 | 1.67 | 0.31 | h, i, j | |
| <0–0.5 | 1.47 | 1.73 | 2.02 | 0.18 | j, k, l | ||
| <0.5–1 | 1.48 | 1.69 | 1.80 | 0.09 | i, j, k | ||
| <1–2 | 1.47 | 1.65 | 1.84 | 0.18 | i, j, k | ||
| 9.33 | - | 2.99 | 3.42 | 4.50 | 0.56 | o | |
| <0–0.5 | 3.50 | 4.06 | 4.83 | 0.32 | o | ||
| <0.5–1 | 3.68 | 3.98 | 3.47 | 0.18 | m | ||
| <1–2 | 3.79 | 4.15 | 3.96 | 0.22 | n |
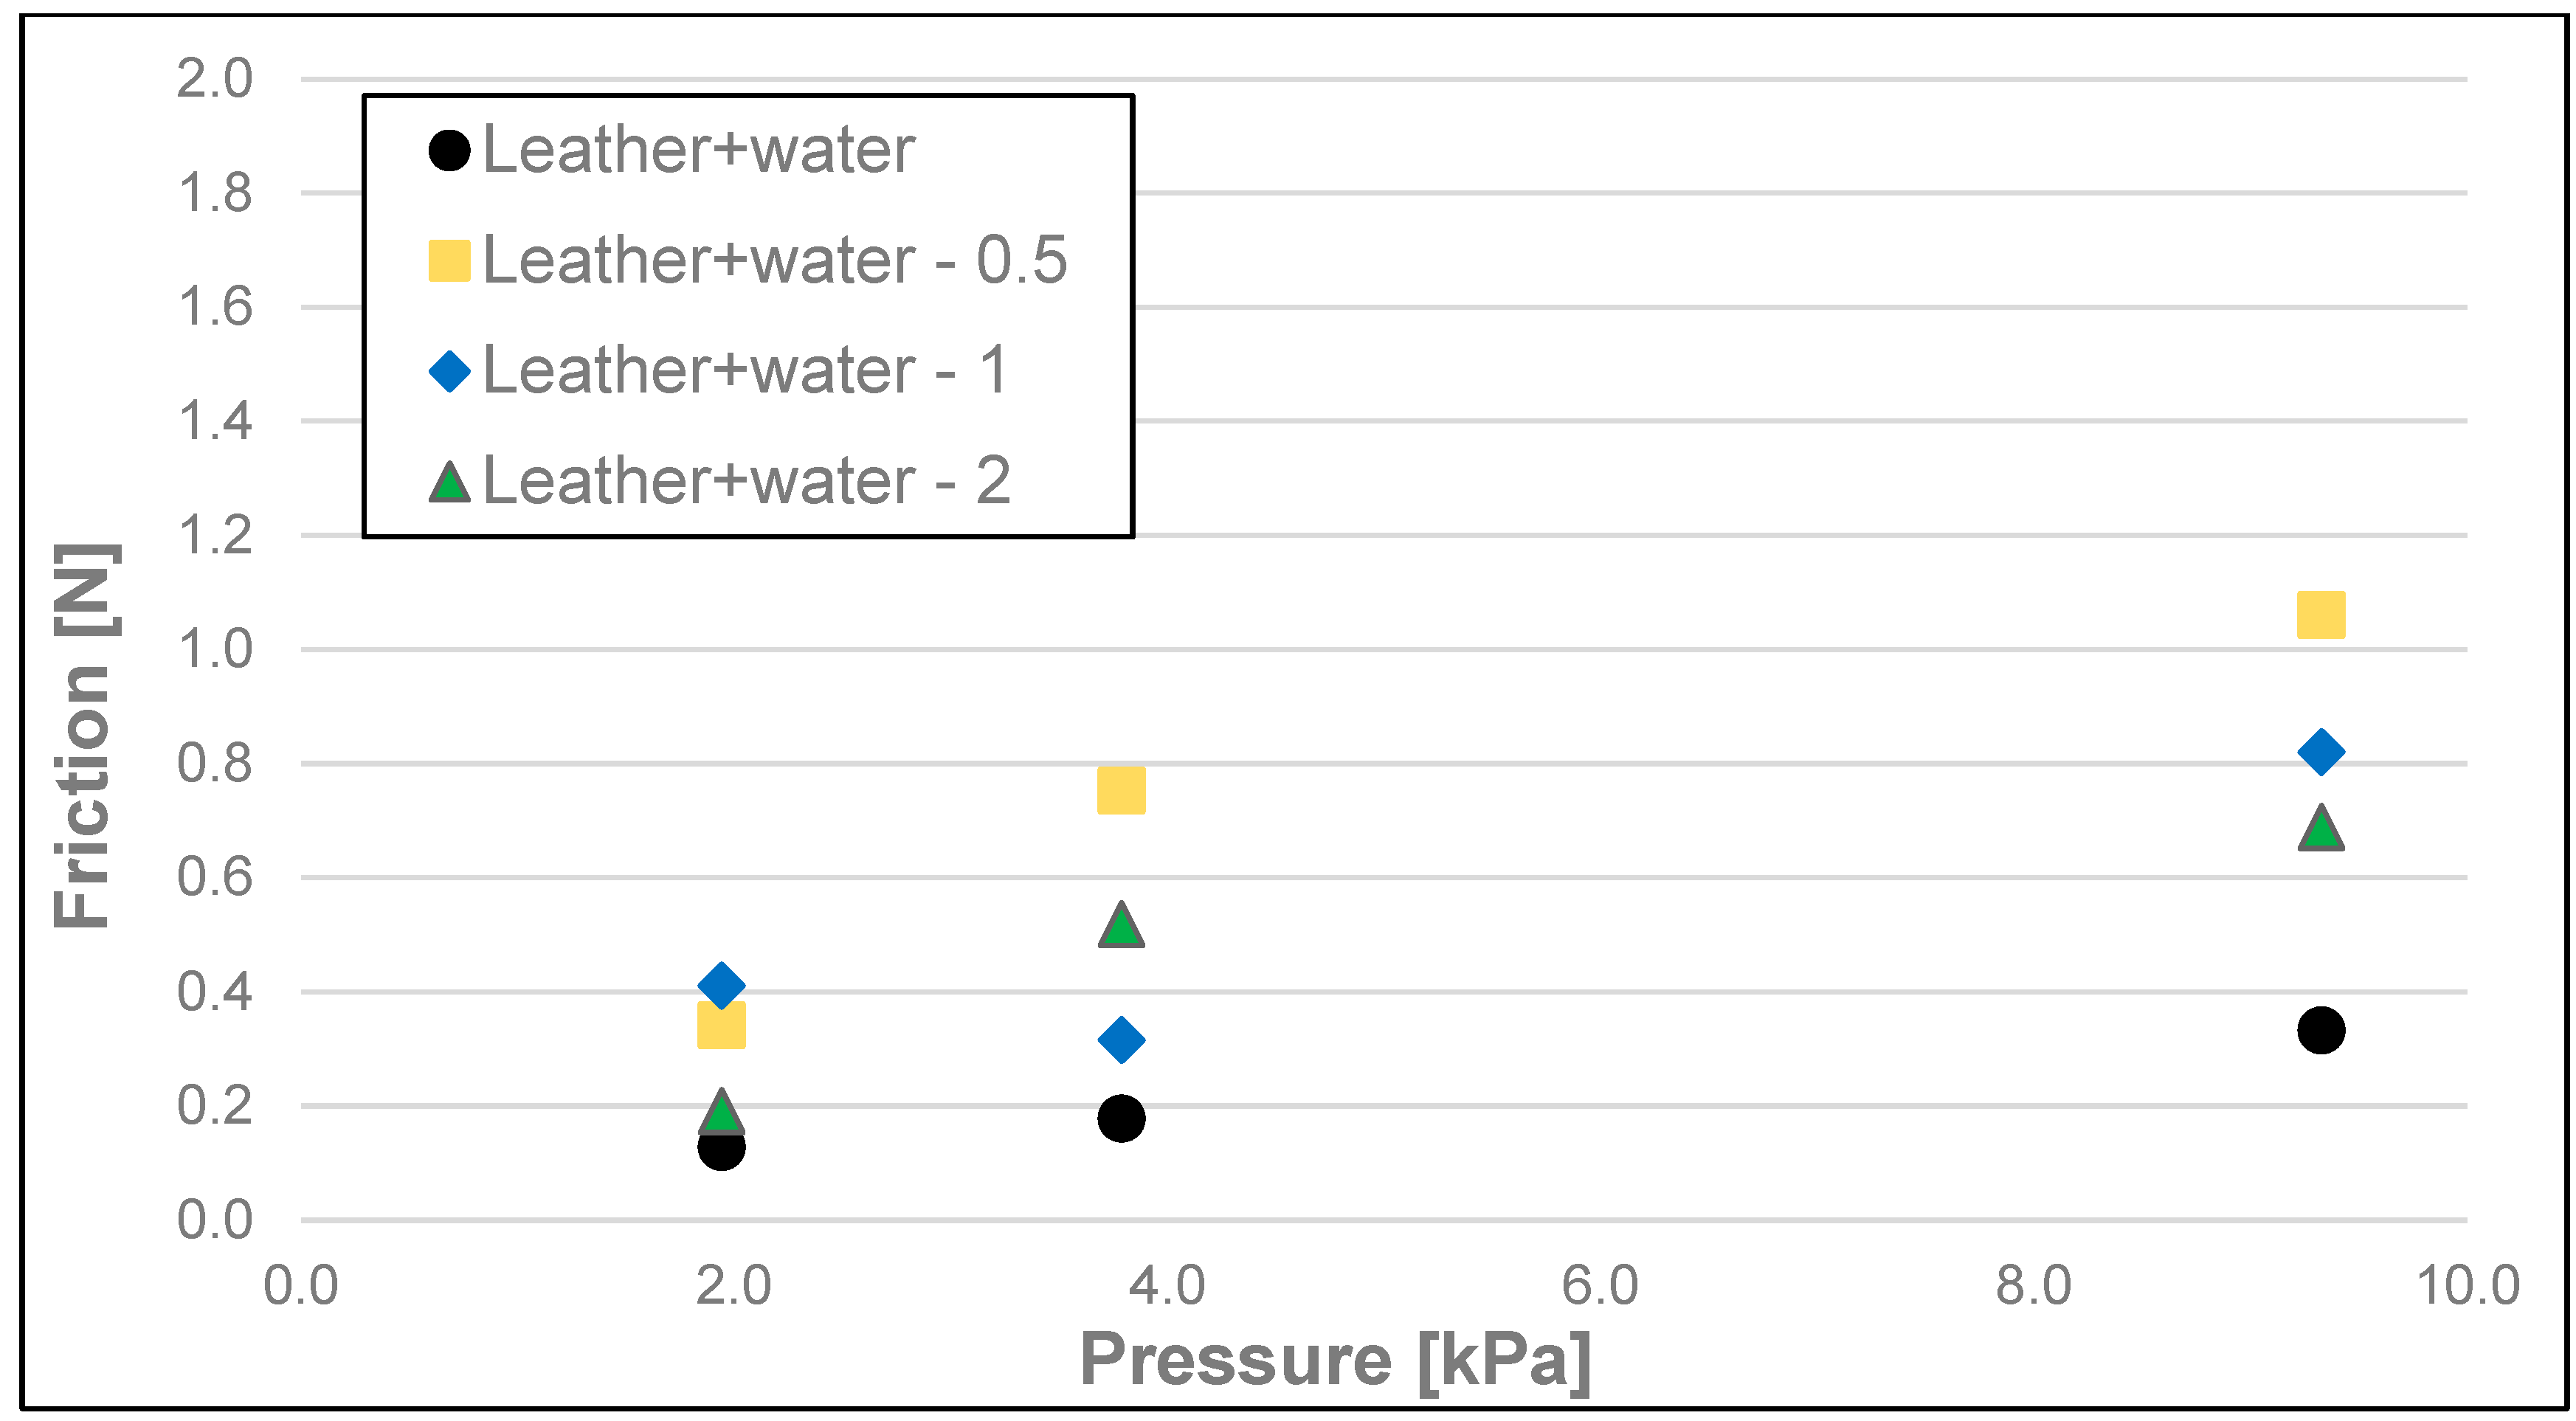
| Surface | Pressure [kPa] | Size Range of Nutshell Particles Added to the Soap [mm] | Min. Friction [N] | Max. Friction [N] | Mean Friction [N] | Friction S.D. | Homogeneous Group * |
|---|---|---|---|---|---|---|---|
| Leather | 1.94 | - | 0.72 | 1.08 | 0.88 | 0.16 | f, g, h, i, j |
| <0–0.5 | 0.53 | 0.63 | 0.56 | 0.04 | c, d, e, f | ||
| <0.5–1 | 0.55 | 0.92 | 0.73 | 0.14 | d, e, f, g | ||
| <1–2 | 0.54 | 0.63 | 0.57 | 0.04 | c, d, e, f | ||
| 3.79 | - | 0.92 | 1.27 | 1.13 | 0.13 | i, j, k, l | |
| <0–0.5 | 0.96 | 1.18 | 1.03 | 0.10 | g, h, i, j, k | ||
| <0.5–1 | 0.86 | 1.31 | 1.06 | 0.23 | h, i, j, k | ||
| <1–2 | 1.05 | 1.26 | 1.16 | 0.09 | j, k, l | ||
| 9.33 | - | 1.04 | 1.58 | 1.32 | 0.20 | k, l, m, n | |
| <0–0.5 | 1.58 | 2.13 | 1.83 | 0.24 | p | ||
| <0.5–1 | 1.39 | 1.56 | 1.50 | 0.07 | m, n, o | ||
| <1–2 | 1.35 | 1.53 | 1.43 | 0.07 | l, m, n | ||
| Leather + Water | 1.94 | - | 0.12 | 0.14 | 0.13 | 0.01 | a |
| <0–0.5 | 0.29 | 0.38 | 0.34 | 0.05 | a, b, c | ||
| <0.5–1 | 0.36 | 0.54 | 0.41 | 0.08 | a, b, c, d | ||
| <1–2 | 0.18 | 0.22 | 0.19 | 0.02 | a, b | ||
| 3.79 | - | 0.16 | 0.20 | 0.18 | 0.02 | a | |
| <0–0.5 | 0.62 | 0.91 | 0.75 | 0.11 | e, f, g, h | ||
| <0.5–1 | 0.20 | 0.41 | 0.32 | 0.08 | a, b, c | ||
| <1–2 | 0.44 | 0.64 | 0.52 | 0.08 | b, c, d, e | ||
| 9.33 | - | 0.31 | 0.36 | 0.33 | 0.03 | a, b, c | |
| <0–0.5 | 0.83 | 1.36 | 1.06 | 0.19 | h, i, j, k | ||
| <0.5–1 | 0.47 | 1.35 | 0.82 | 0.36 | e, f, g, h, i | ||
| <1–2 | 0.56 | 1.00 | 0.69 | 0.18 | d, e, f | ||
| Sandpaper (320) | 1.94 | - | 1.12 | 1.28 | 1.18 | 0.06 | j, k, l, m |
| <0–0.5 | 0.74 | 1.03 | 0.89 | 0.12 | f, g, h, i, j | ||
| <0.5–1 | 0.77 | 0.88 | 0.83 | 0.05 | e, f, g, h, i | ||
| <1–2 | 0.70 | 0.90 | 0.82 | 0.08 | e, f, g, h, i | ||
| 3.79 | - | 1.60 | 2.03 | 1.77 | 0.16 | o, p | |
| <0–0.5 | 1.47 | 1.73 | 1.58 | 0.10 | n, o, p | ||
| <0.5–1 | 1.48 | 1.69 | 1.56 | 0.11 | n, o, p | ||
| <1–2 | 1.47 | 1.65 | 1.53 | 0.07 | n, o, p | ||
| 9.33 | - | 2.99 | 3.42 | 3.22 | 0.17 | q | |
| <0–0.5 | 3.50 | 4.06 | 3.71 | 0.21 | r | ||
| <0.5–1 | 3.68 | 3.98 | 3.84 | 0.13 | r | ||
| <1–2 | 3.79 | 4.15 | 3.89 | 0.14 | r |
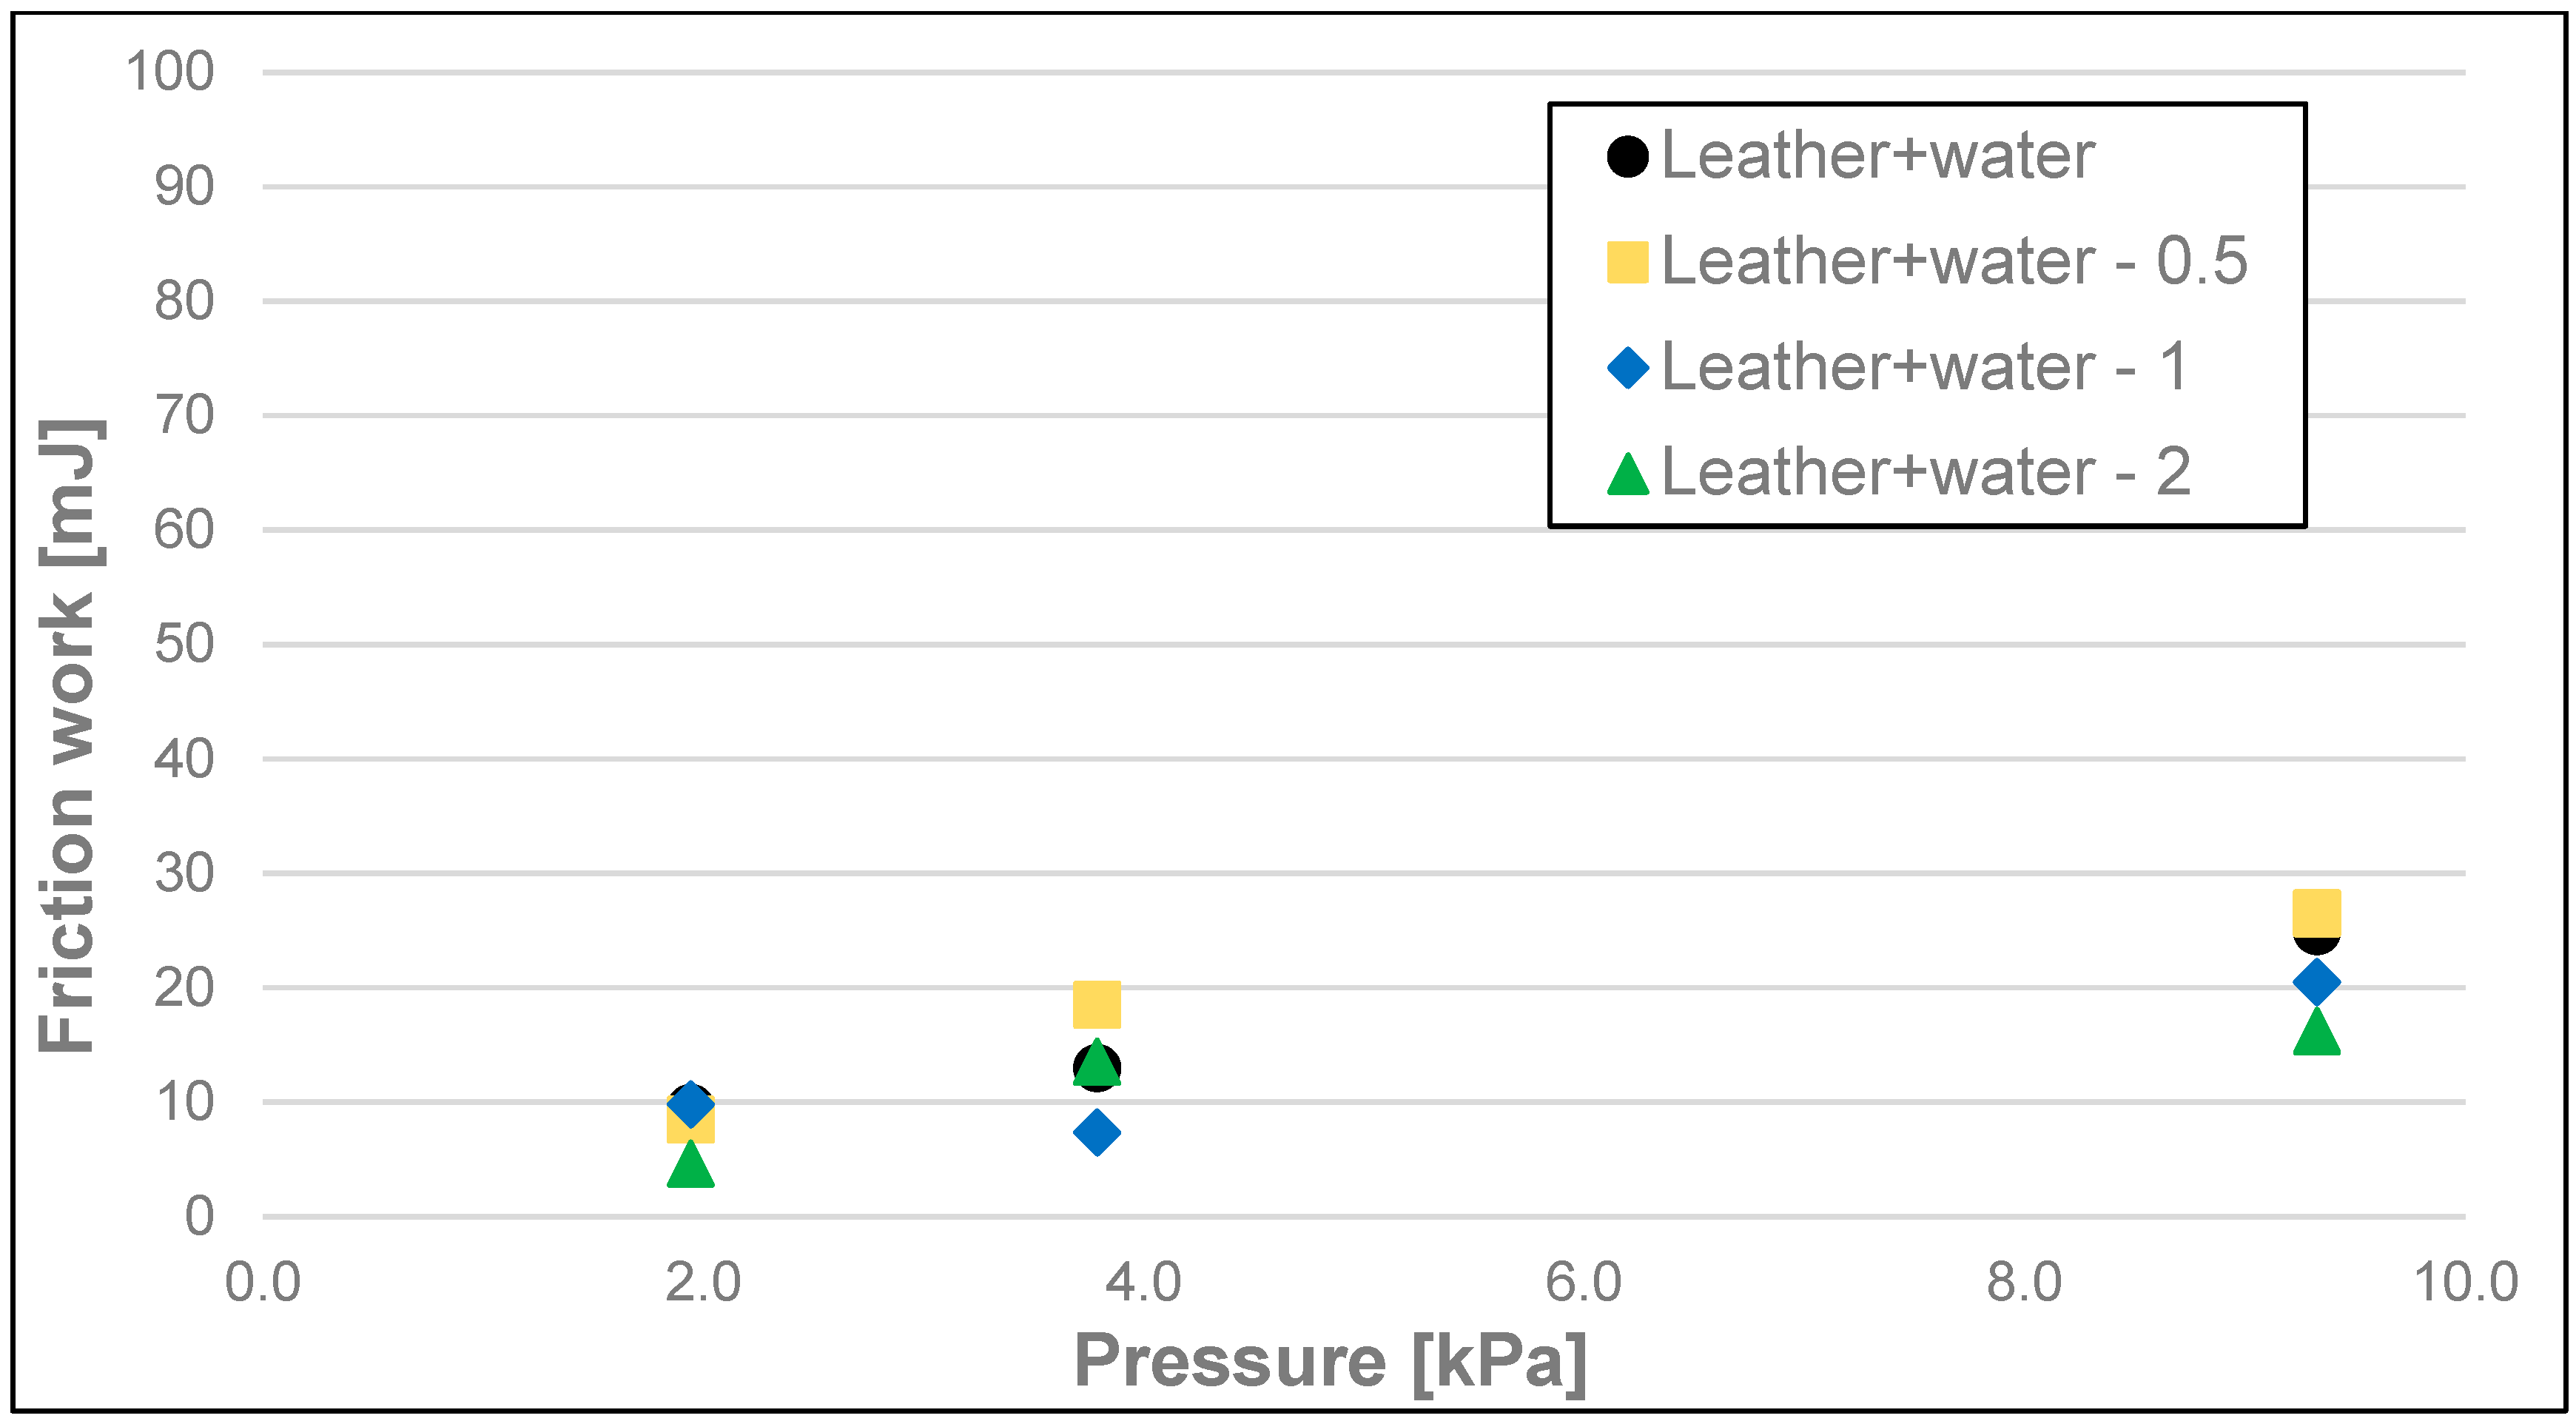
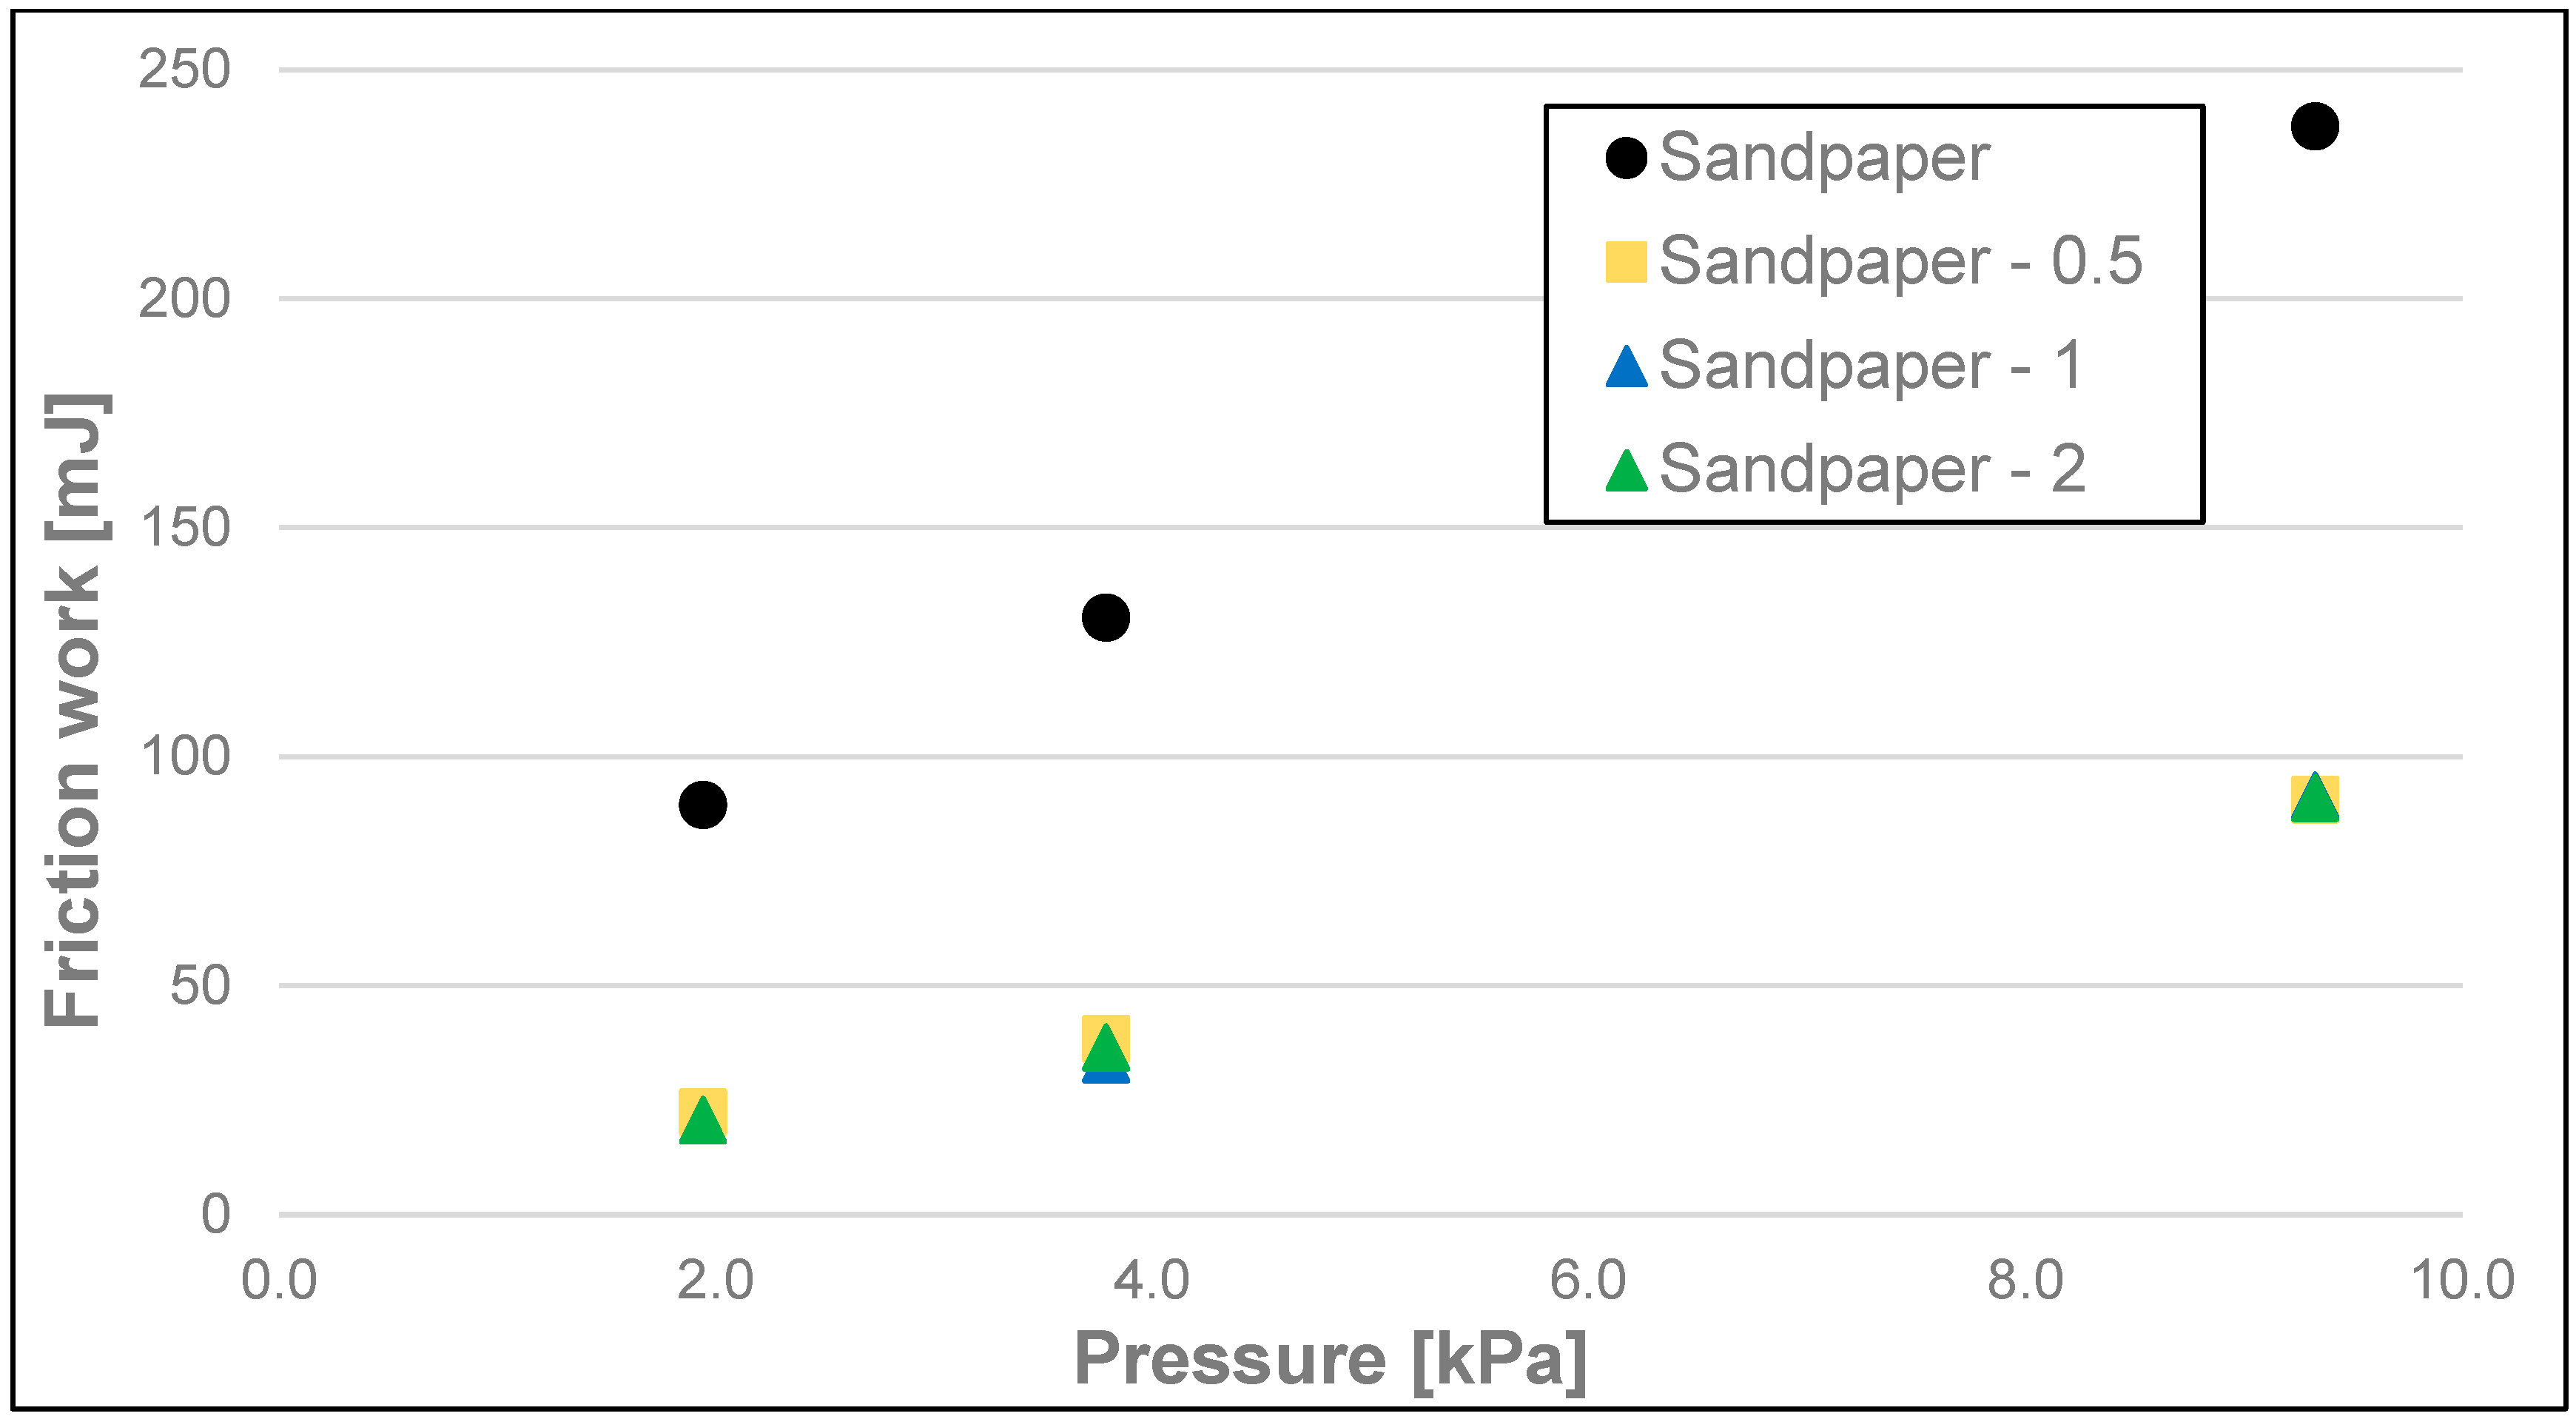
| Surface | Pressure [kPa] | Size Range of Nutshell Particles Added to the Soap [mm] | Min. Friction Work [N] | Max. Friction Work [N] | Mean Friction Work [N] | Friction Work S.D. | Homogeneous Group * |
|---|---|---|---|---|---|---|---|
| Leather | 1.94 | - | 53.72 | 80.75 | 65.64 | 12.37 | j |
| <0–0.5 | 13.40 | 15.78 | 14.19 | 0.96 | a, b, c, d | ||
| <0.5–1 | 13.69 | 23.23 | 18.24 | 3.64 | a, b, c, d, e | ||
| <1–2 | 12.97 | 15.78 | 14.05 | 1.10 | a, b, c, d | ||
| 3.79 | - | 69.21 | 95.02 | 84.89 | 9.87 | k | |
| <0–0.5 | 23.95 | 29.59 | 25.68 | 2.39 | d, e, f, g, h | ||
| <0.5–1 | 22.72 | 40.77 | 29.63 | 7.47 | e, f, g, h | ||
| <1–2 | 26.26 | 31.57 | 29.10 | 2.37 | e, f, g, h | ||
| 9.33 | - | 82.03 | 108.70 | 97.81 | 10.90 | k | |
| <0–0.5 | 37.08 | 56.24 | 45.76 | 7.80 | i | ||
| <0.5–1 | 30.72 | 40.37 | 37.21 | 3.83 | h, i | ||
| <1–2 | 33.74 | 38.21 | 35.80 | 1.74 | g, h, i | ||
| Leather + Water | 1.94 | - | 9.24 | 9.92 | 9.52 | 0.30 | a, b, c |
| <0–0.5 | 7.00 | 9.61 | 8.51 | 1.21 | a, b, c | ||
| <0.5–1 | 9.09 | 11.37 | 9.83 | 0.90 | a, b, c | ||
| <1–2 | 4.08 | 5.47 | 4.67 | 0.53 | a | ||
| 3.79 | - | 11.86 | 15.19 | 13.01 | 1.32 | a, b, c, d | |
| <0–0.5 | 15.42 | 21.32 | 18.53 | 2.13 | a, b, c, d, e | ||
| <0.5–1 | 4.31 | 10.14 | 7.39 | 2.67 | a, b | ||
| <1–2 | 11.02 | 18.84 | 13.55 | 3.17 | a, b, c, d | ||
| 9.33 | - | 22.92 | 27.03 | 24.96 | 1.93 | d, e, f, g, h | |
| <0–0.5 | 20.68 | 33.94 | 26.53 | 4.82 | d, e, f, g, h | ||
| <0.5–1 | 11.82 | 33.84 | 20.52 | 9.07 | b, c, d, e, f | ||
| <1–2 | 11.53 | 25.07 | 16.22 | 5.48 | a, b, c, d, e | ||
| Sandpaper (320) | 1.94 | - | 79.41 | 98.46 | 89.52 | 7.73 | k |
| <0–0.5 | 19.56 | 25.73 | 22.40 | 2.78 | c, d, e, f, g | ||
| <0.5–1 | 19.18 | 21.89 | 20.66 | 1.24 | b, c, d, e, f | ||
| <1–2 | 18.48 | 22.39 | 20.73 | 1.52 | b, c, d, e, f | ||
| 3.79 | - | 117.60 | 149.36 | 130.44 | 12.78 | l | |
| <0–0.5 | 31.86 | 43.36 | 38.38 | 4.20 | h, i | ||
| <0.5–1 | 27.87 | 42.29 | 33.97 | 7.24 | f, g, h, i | ||
| <1–2 | 29.97 | 40.17 | 36.57 | 3.89 | g, h, i | ||
| 9.33 | - | 226.81 | 248.20 | 237.71 | 8.55 | m | |
| <0–0.5 | 83.73 | 101.44 | 90.67 | 7.03 | k | ||
| <0.5–1 | 80.84 | 99.57 | 91.52 | 8.15 | k | ||
| <1–2 | 78.60 | 103.68 | 91.05 | 10.74 | k |
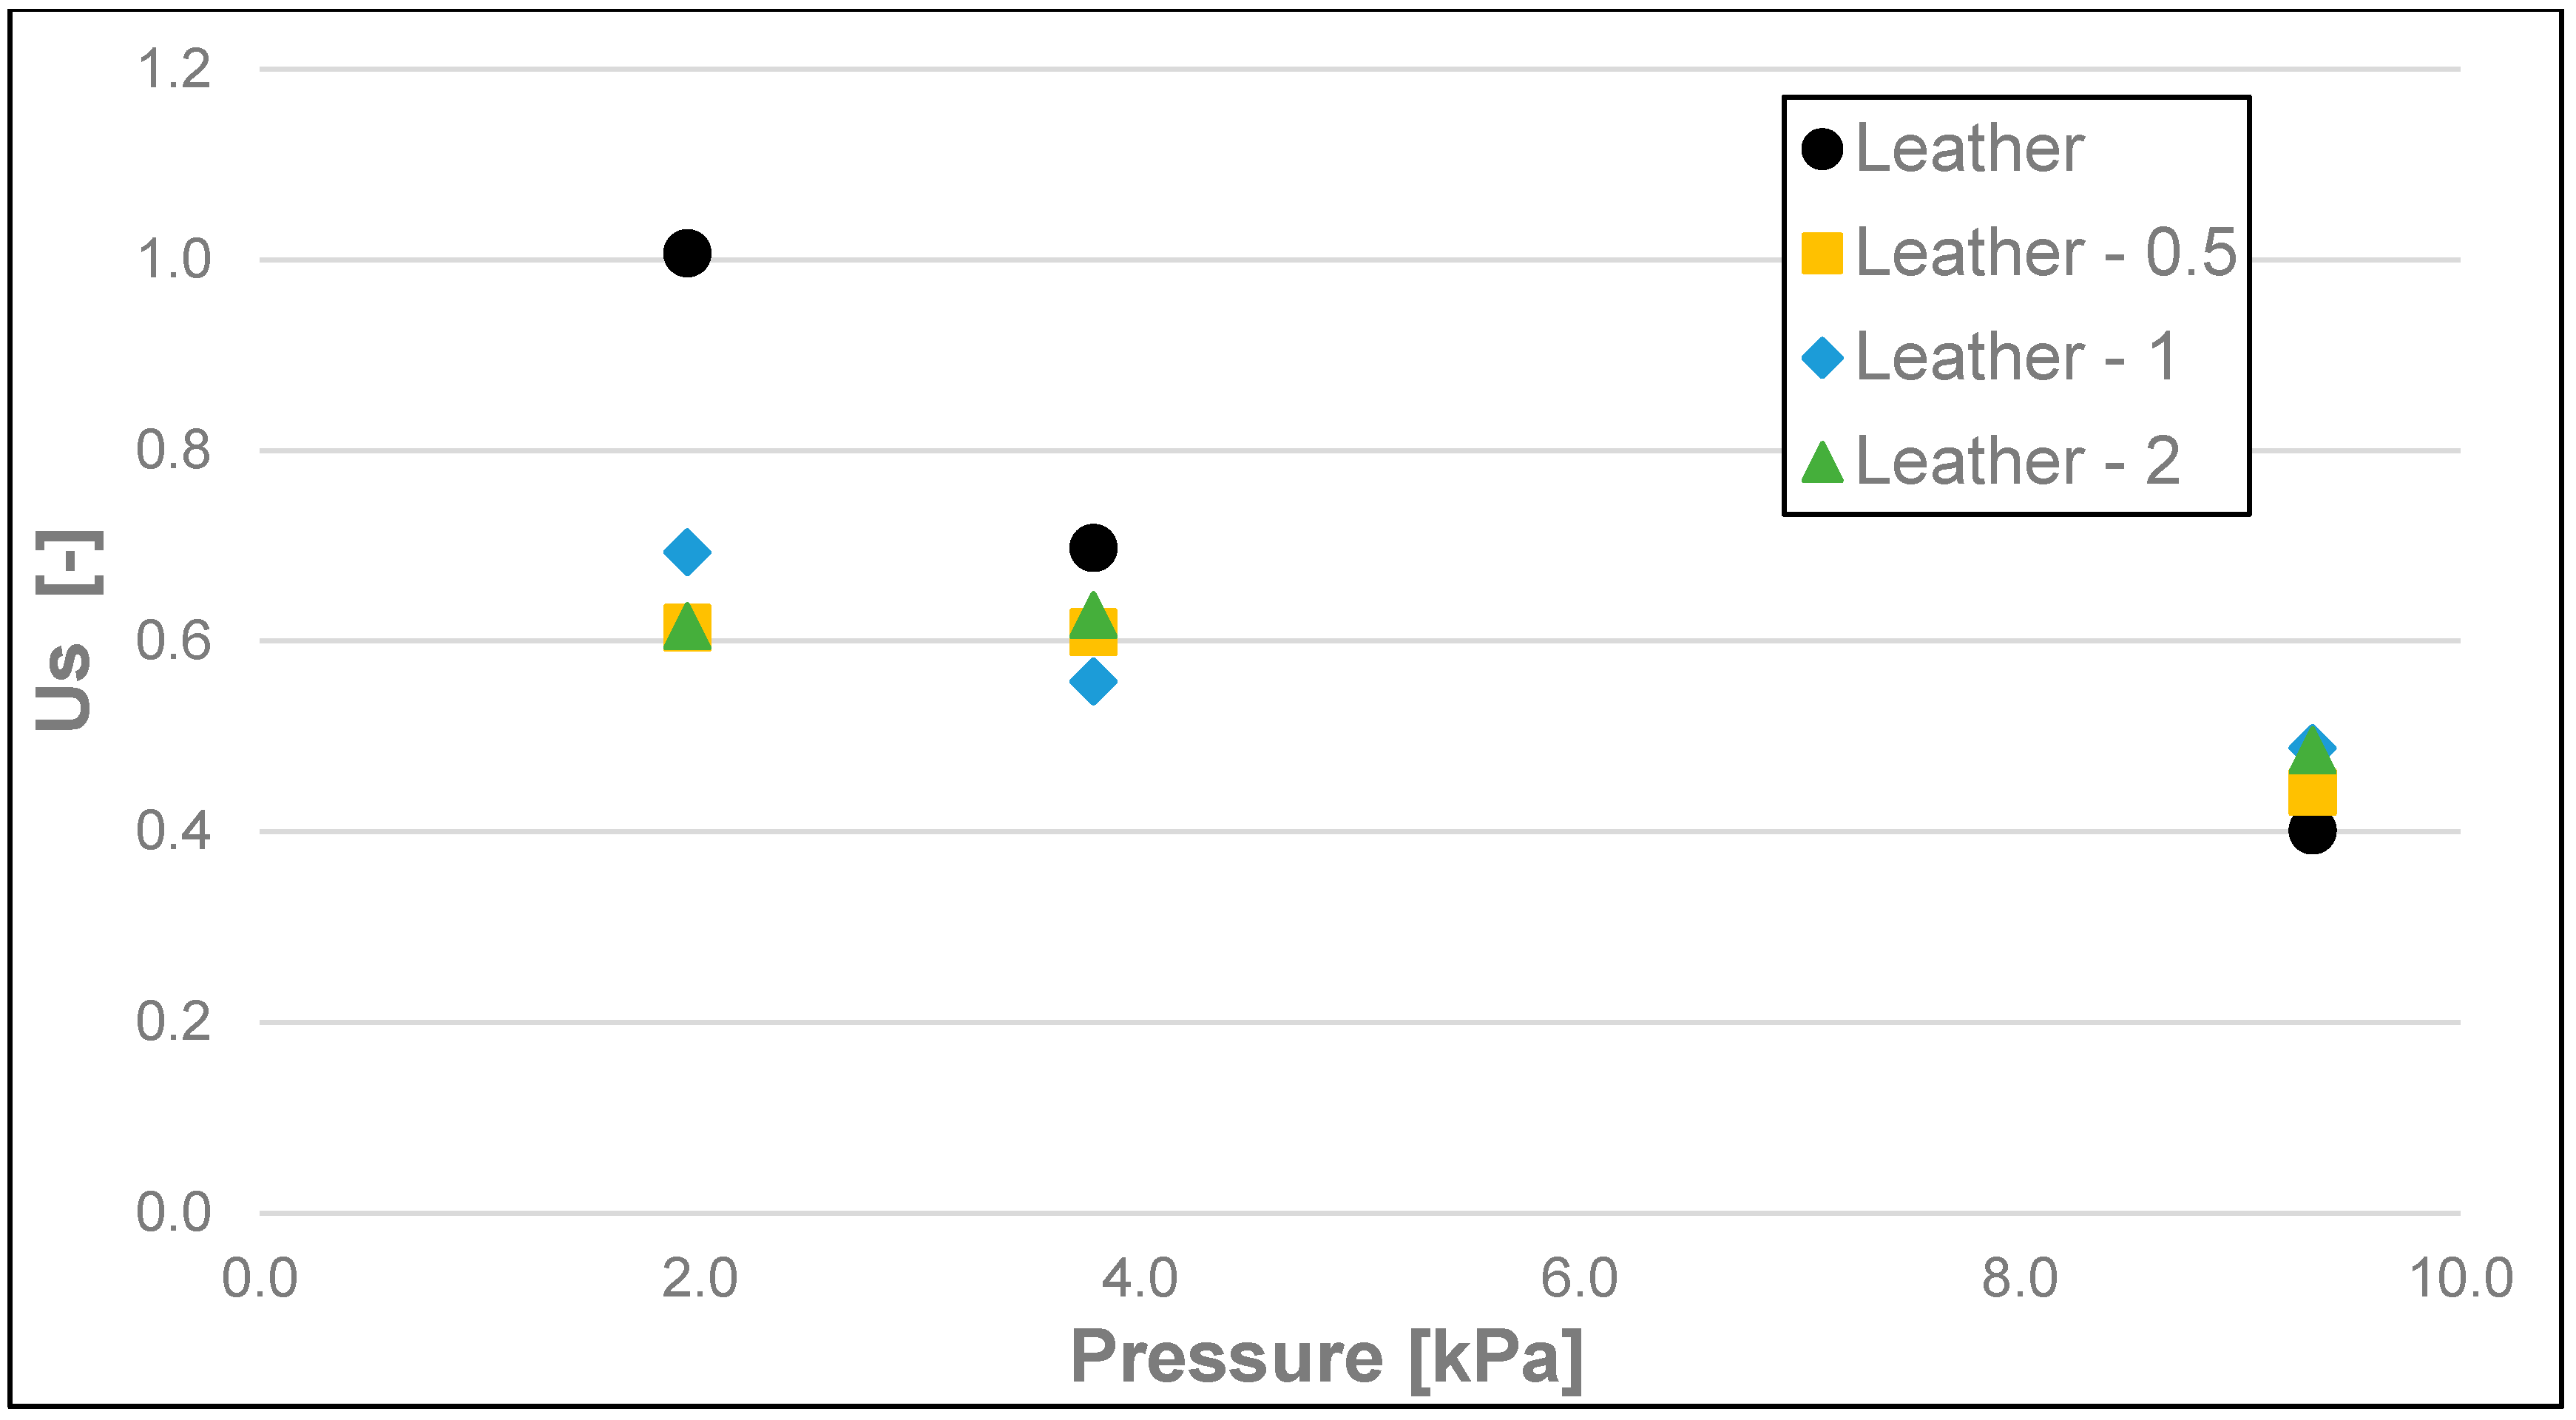
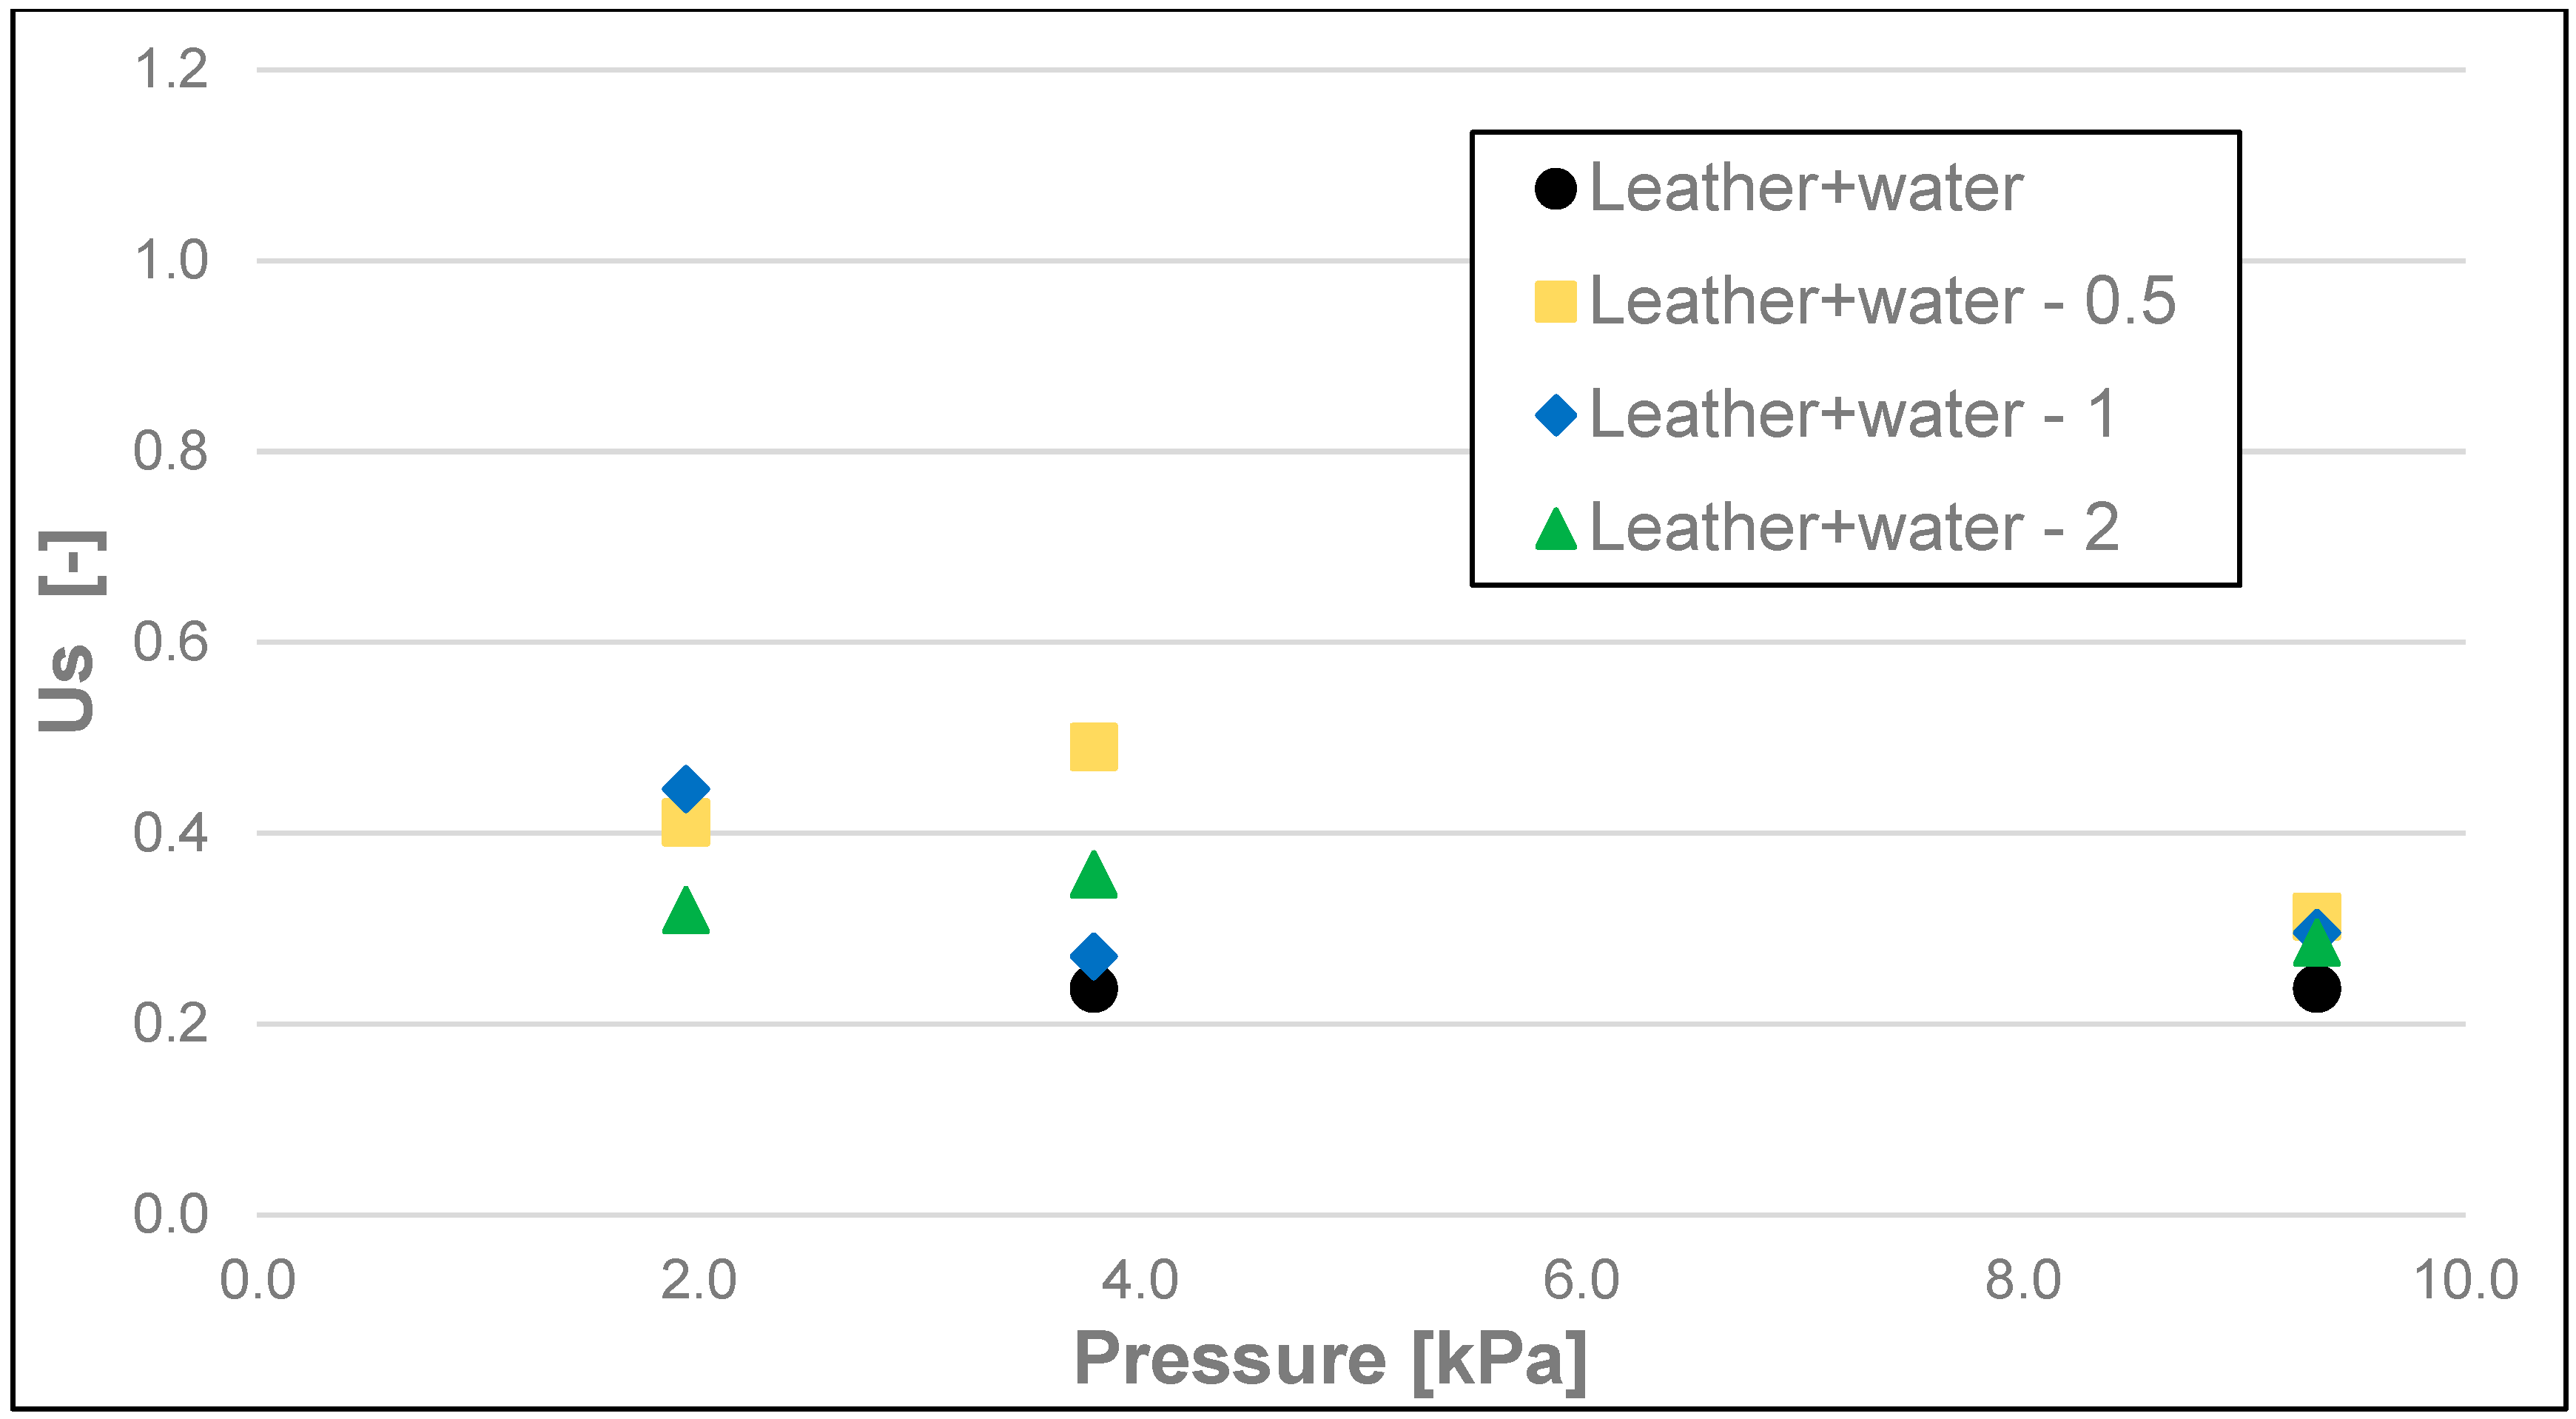
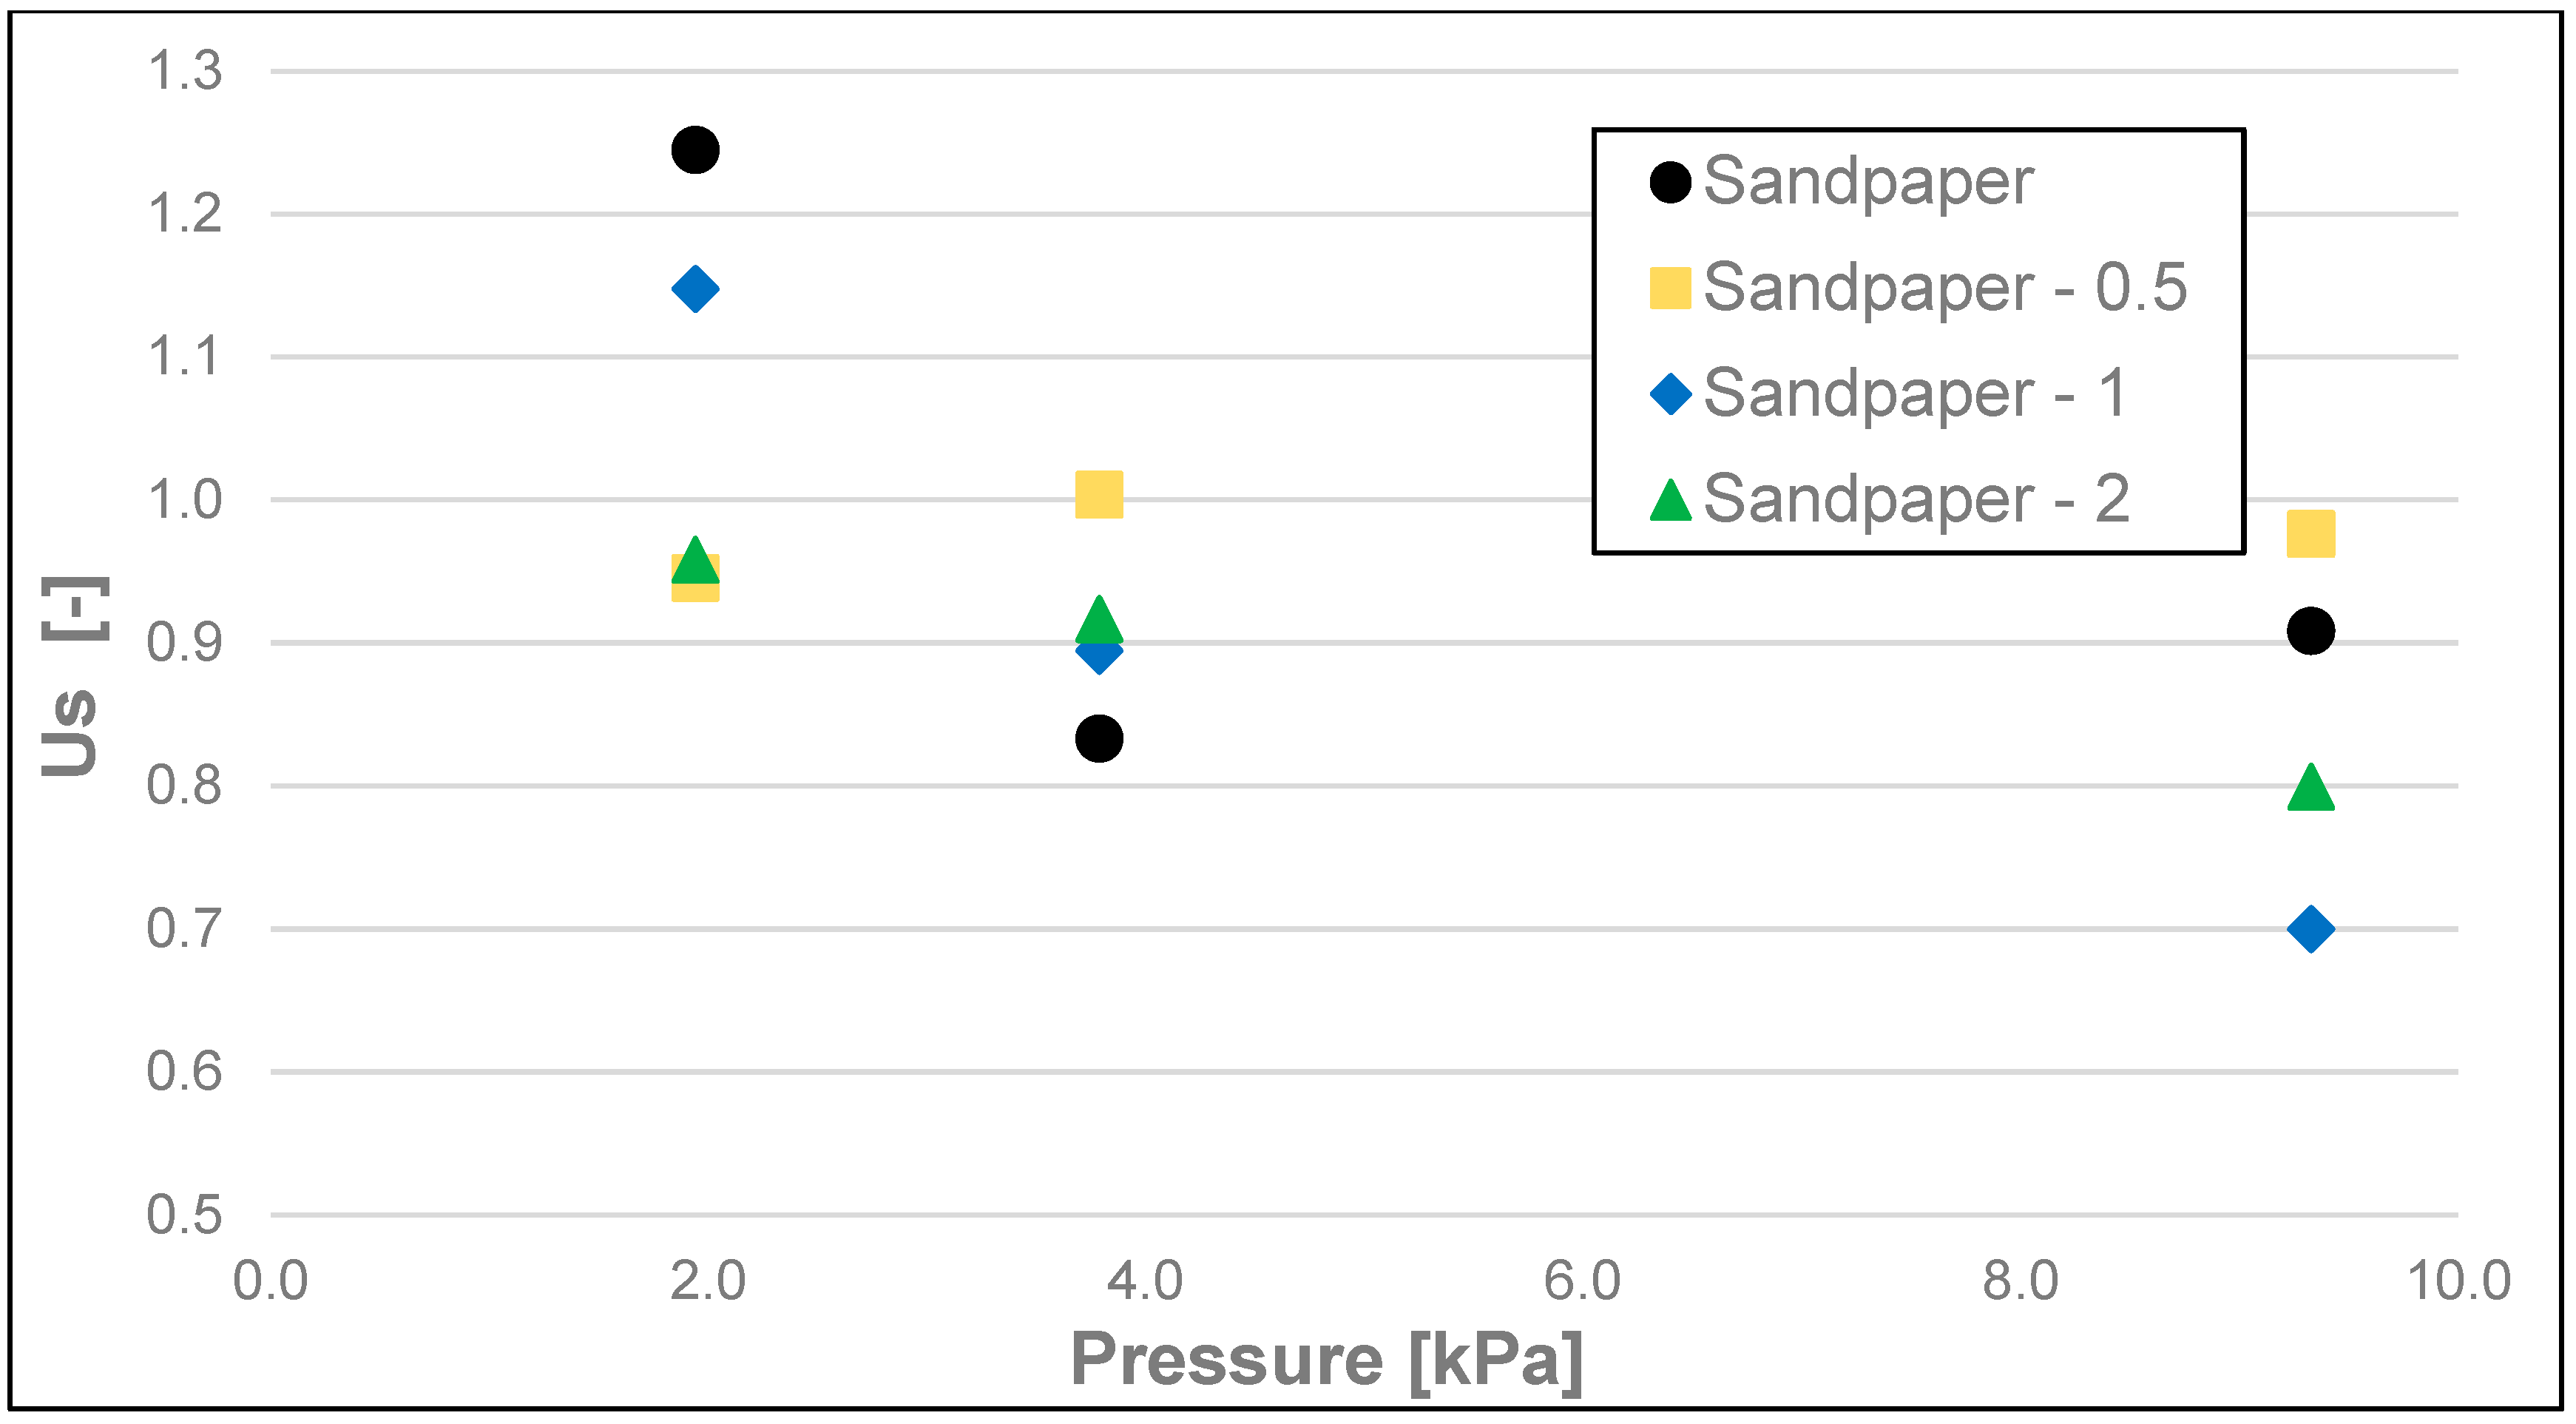
| Surface | Pressure [kPa] | Size Range of Nutshell Particles Added to the Soap [mm] | Min. Us | Max. Us | Mean Us | Us S.D. | Homogeneous Group * |
|---|---|---|---|---|---|---|---|
| Leather | 1.94 | - | 0.90 | 1.17 | 1.01 | 0.10 | l, m |
| <0–0.5 | 0.57 | 0.66 | 0.61 | 0.04 | f, g, h | ||
| <0.5–1 | 0.58 | 0.82 | 0.69 | 0.11 | g, h, i | ||
| <1–2 | 0.57 | 0.66 | 0.62 | 0.04 | f, g, h | ||
| 3.79 | - | 0.51 | 0.90 | 0.70 | 0.14 | g, h, i | |
| <0–0.5 | 0.54 | 0.68 | 0.61 | 0.05 | e, f, g, h | ||
| <0.5–1 | 0.41 | 0.66 | 0.56 | 0.12 | d, e, f, g | ||
| <1–2 | 0.57 | 0.69 | 0.63 | 0.05 | f, g, h | ||
| 9.33 | - | 0.34 | 0.48 | 0.40 | 0.06 | a, b, c, d | |
| <0–0.5 | 0.35 | 0.54 | 0.44 | 0.07 | b, c, d, e, f | ||
| <0.5–1 | 0.42 | 0.57 | 0.49 | 0.05 | c, d, e, f | ||
| <1–2 | 0.44 | 0.53 | 0.49 | 0.03 | c, d, e, f | ||
| Leather + Water | 1.94 | - | 0.37 | 0.46 | 0.42 | 0.04 | a, b, c, d, e |
| <0–0.5 | 0.35 | 0.49 | 0.41 | 0.07 | a, b, c, d | ||
| <0.5–1 | 0.37 | 0.58 | 0.45 | 0.09 | b, c, d, e, f | ||
| <1–2 | 0.28 | 0.39 | 0.32 | 0.04 | a, b, c | ||
| 3.79 | - | 0.20 | 0.27 | 0.24 | 0.03 | a | |
| <0–0.5 | 0.41 | 0.57 | 0.49 | 0.06 | c, d, e, f | ||
| <0.5–1 | 0.22 | 0.30 | 0.27 | 0.04 | a, b | ||
| <1–2 | 0.30 | 0.47 | 0.36 | 0.07 | a, b, c | ||
| 9.33 | - | 0.20 | 0.28 | 0.24 | 0.03 | a | |
| <0–0.5 | 0.29 | 0.34 | 0.31 | 0.02 | a, b, c | ||
| <0.5–1 | 0.27 | 0.31 | 0.30 | 0.02 | a, b, c | ||
| <1–2 | 0.24 | 0.32 | 0.29 | 0.03 | a, b | ||
| Sandpaper (320) | 1.94 | - | 1.09 | 1.37 | 1.24 | 0.12 | n |
| <0–0.5 | 0.85 | 0.98 | 0.95 | 0.05 | k, l | ||
| <0.5–1 | 0.92 | 1.34 | 1.15 | 0.15 | m, n | ||
| <1–2 | 0.81 | 1.16 | 0.96 | 0.15 | k, l, m | ||
| 3.79 | - | 0.64 | 1.02 | 0.83 | 0.16 | i, j, k, l | |
| <0–0.5 | 0.91 | 1.11 | 1.00 | 0.09 | l, m | ||
| <0.5–1 | 0.86 | 0.95 | 0.89 | 0.05 | j, k, l | ||
| <1–2 | 0.83 | 1.04 | 0.92 | 0.09 | k, l | ||
| 9.33 | - | 0.77 | 1.01 | 0.91 | 0.11 | k, l | |
| <0–0.5 | 0.87 | 1.03 | 0.98 | 0.07 | k, l, m | ||
| <0.5–1 | 0.65 | 0.74 | 0.70 | 0.04 | g, h, i, j, | ||
| <1–2 | 0.75 | 0.84 | 0.80 | 0.05 | h, i, j, k |
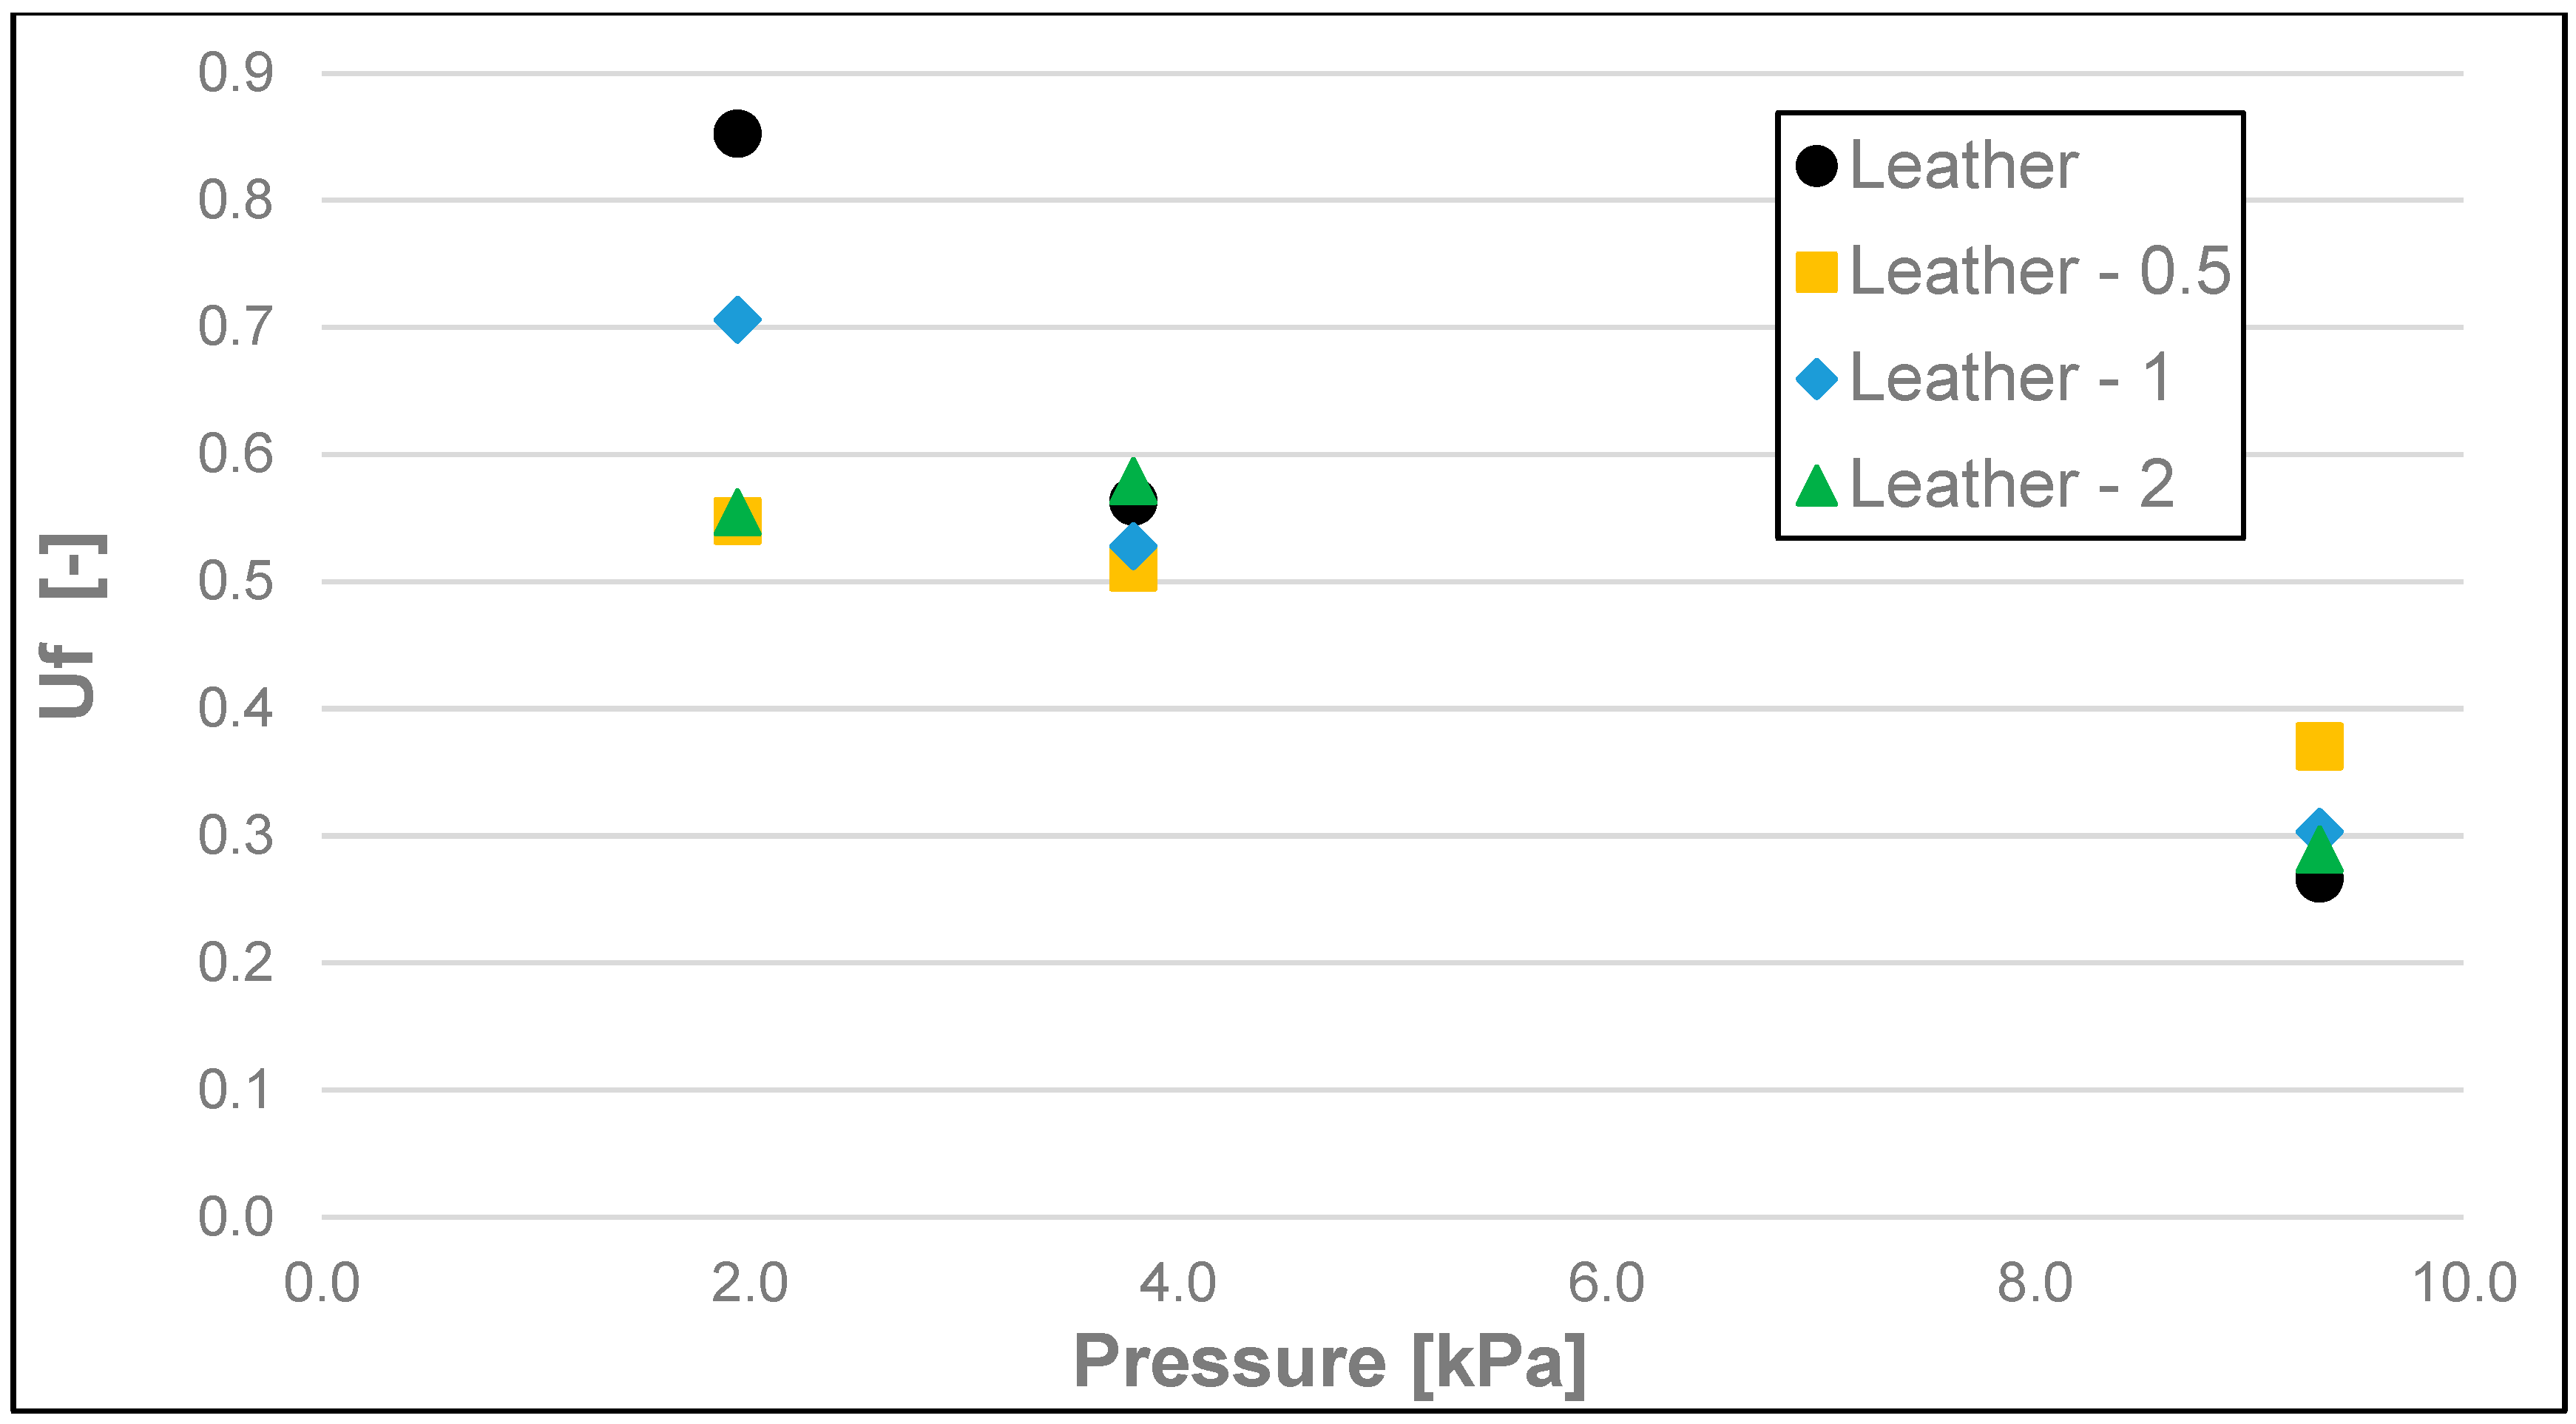
| Surface | Pressure [kPa] | Size range of Nutshell Particles Added to the Soap [mm] | Min. Uf | Max. Uf | Mean Uf | Uf S.D. | Homogeneous Group * |
|---|---|---|---|---|---|---|---|
| Leather | 1.94 | - | 0.70 | 1.05 | 0.85 | 0.16 | k, l |
| <0–0.5 | 0.51 | 0.61 | 0.55 | 0.04 | g, h | ||
| <0.5–1 | 0.53 | 0.89 | 0.71 | 0.14 | i, j, k | ||
| <1–2 | 0.52 | 0.61 | 0.55 | 0.04 | h | ||
| 3.79 | - | 0.46 | 0.63 | 0.56 | 0.07 | h, i | |
| <0–0.5 | 0.48 | 0.59 | 0.51 | 0.05 | f, g, h | ||
| <0.5–1 | 0.43 | 0.65 | 0.53 | 0.11 | g, h | ||
| <1–2 | 0.52 | 0.63 | 0.58 | 0.05 | h, i | ||
| 9.33 | - | 0.21 | 0.32 | 0.27 | 0.04 | b, c, d, e | |
| <0–0.5 | 0.32 | 0.43 | 0.37 | 0.05 | e, f | ||
| <0.5–1 | 0.28 | 0.32 | 0.30 | 0.01 | c, d, e | ||
| <1–2 | 0.27 | 0.31 | 0.29 | 0.01 | c, d, e | ||
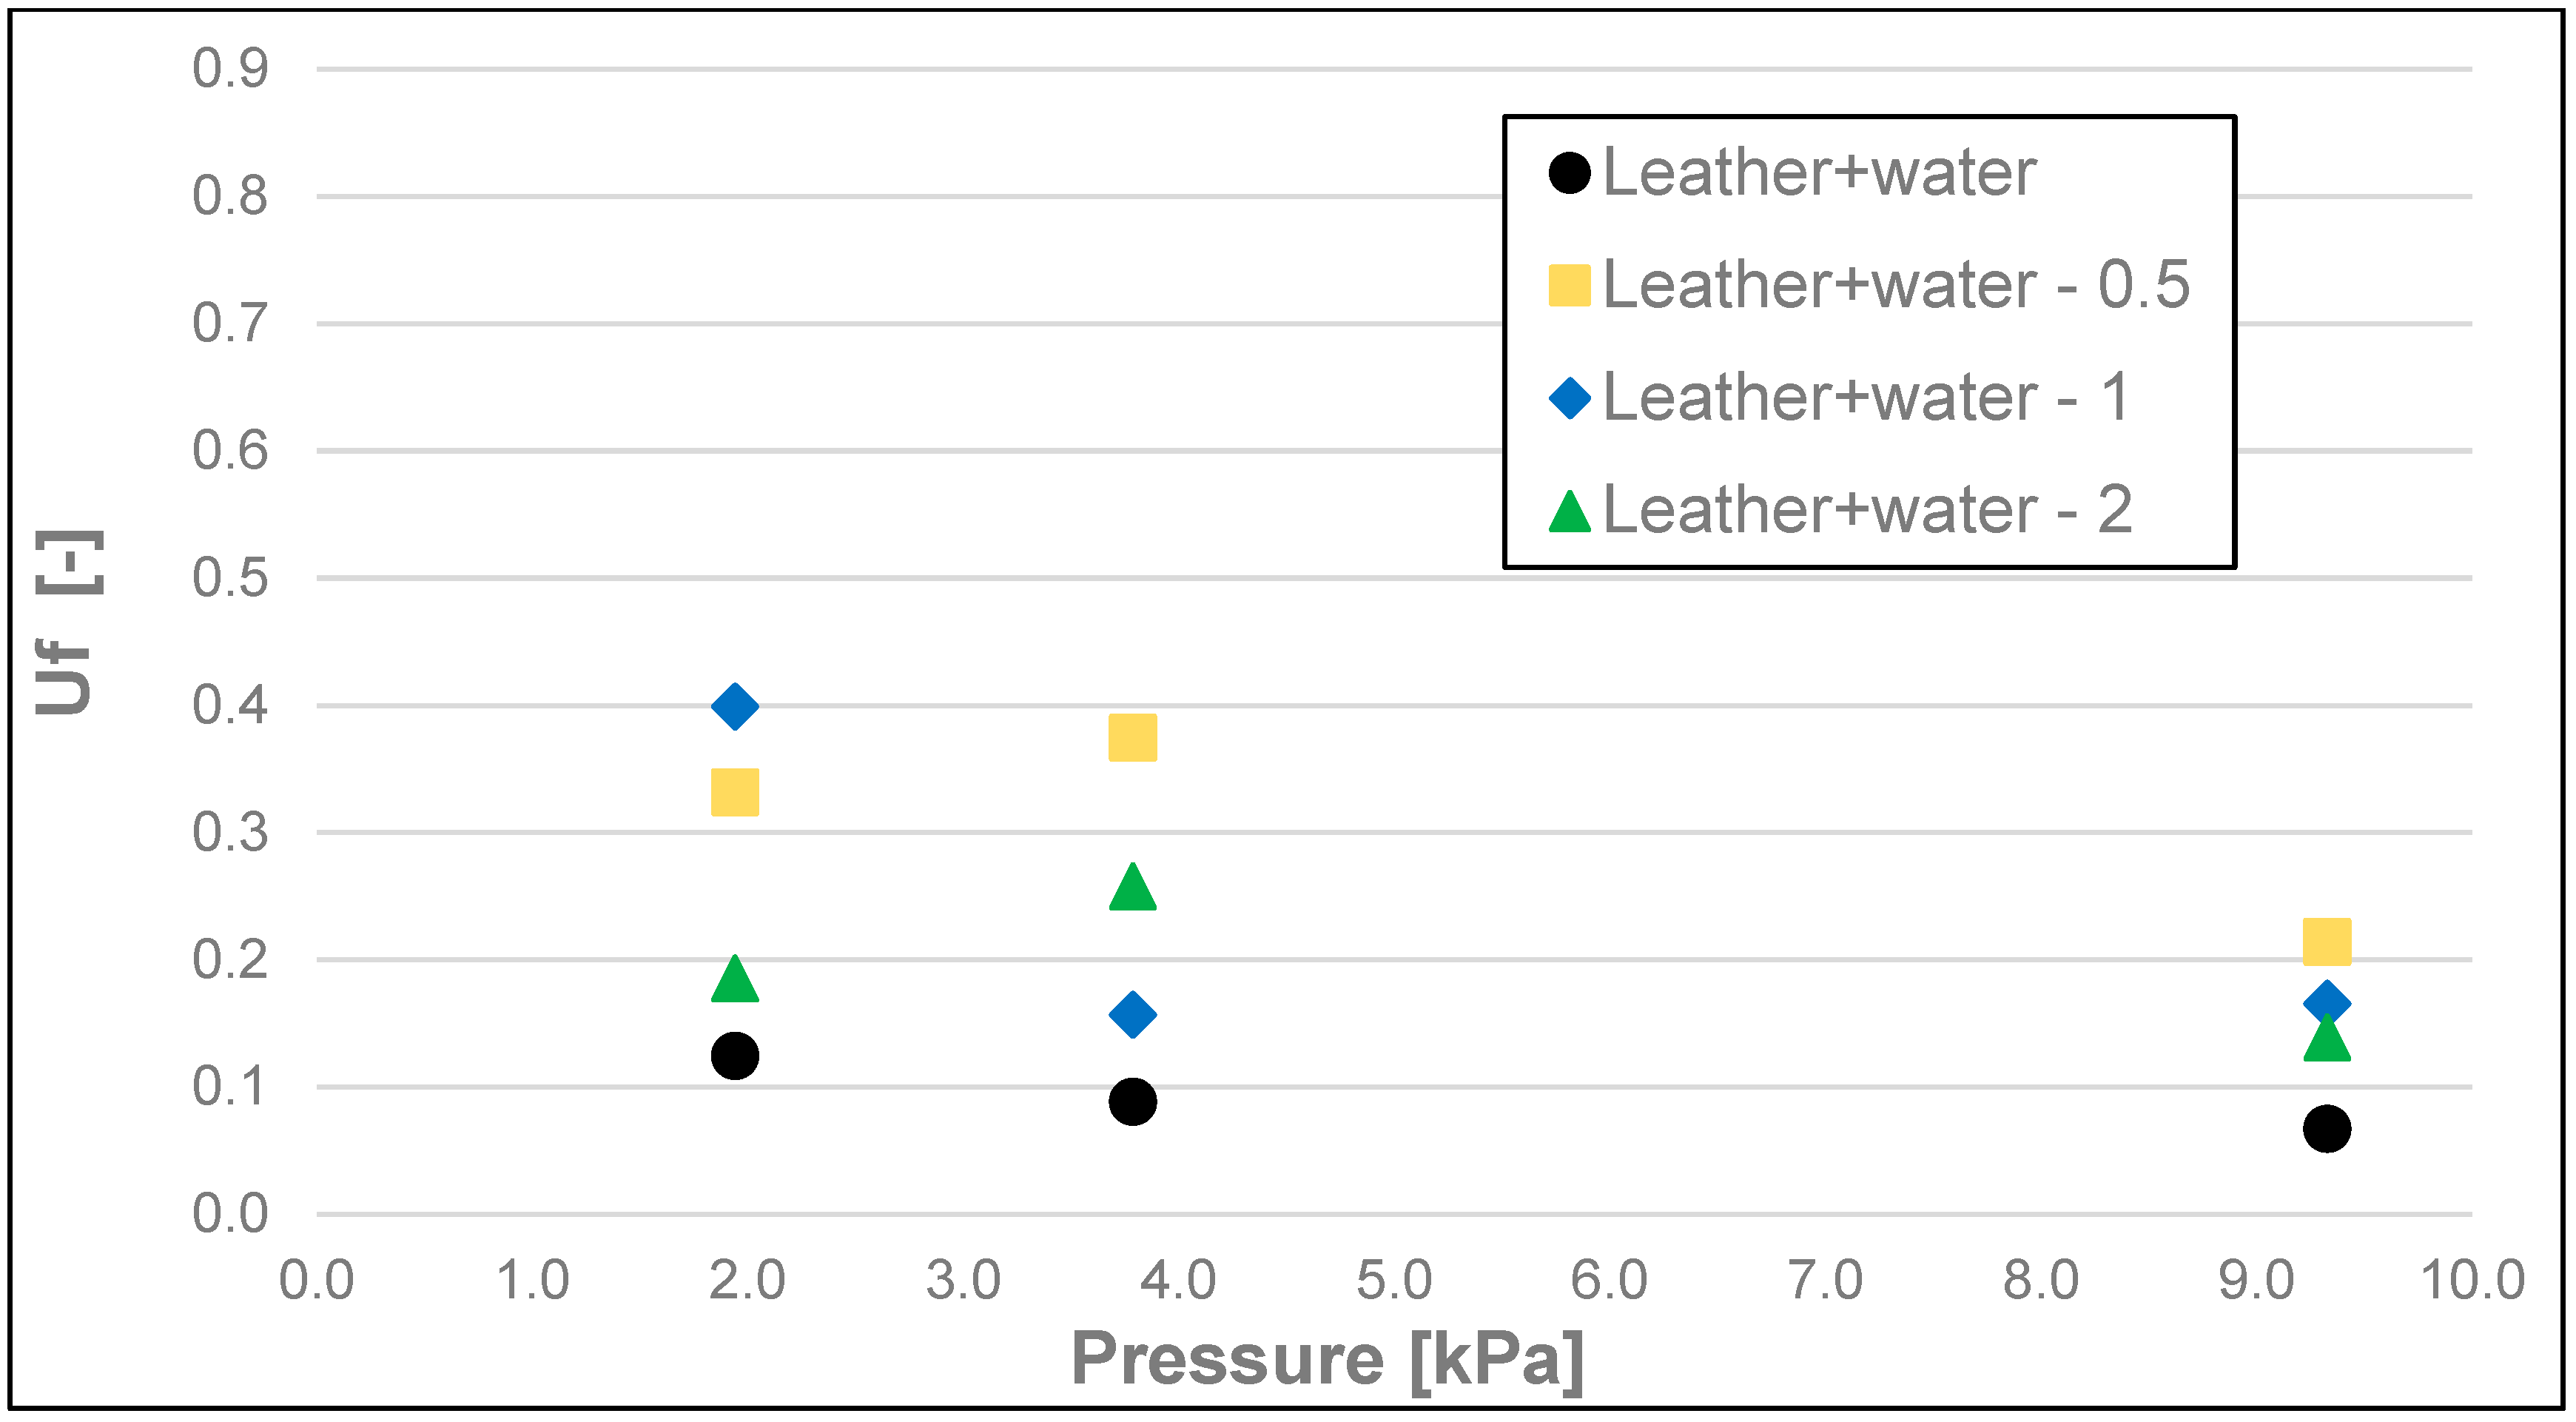
| Leather + Water | 1.94 | - | 0.12 | 0.13 | 0.12 | 0.01 | a, b |
| <0–0.5 | 0.28 | 0.37 | 0.33 | 0.04 | d, e | ||
| <0.5–1 | 0.35 | 0.53 | 0.40 | 0.07 | e, f, g | ||
| <1–2 | 0.17 | 0.21 | 0.19 | 0.02 | a, b, c, d | ||
| 3.79 | - | 0.08 | 0.10 | 0.09 | 0.01 | a | |
| <0–0.5 | 0.31 | 0.45 | 0.37 | 0.05 | e, f | ||
| <0.5–1 | 0.10 | 0.20 | 0.16 | 0.04 | a, b, c | ||
| <1–2 | 0.22 | 0.32 | 0.26 | 0.04 | b, c, d, e | ||
| 9.33 | - | 0.06 | 0.07 | 0.07 | 0.01 | a | |
| <0–0.5 | 0.17 | 0.27 | 0.21 | 0.04 | a, b, c, d | ||
| <0.5–1 | 0.10 | 0.27 | 0.17 | 0.07 | a, b, c | ||
| <1–2 | 0.11 | 0.20 | 0.14 | 0.04 | a, b | ||
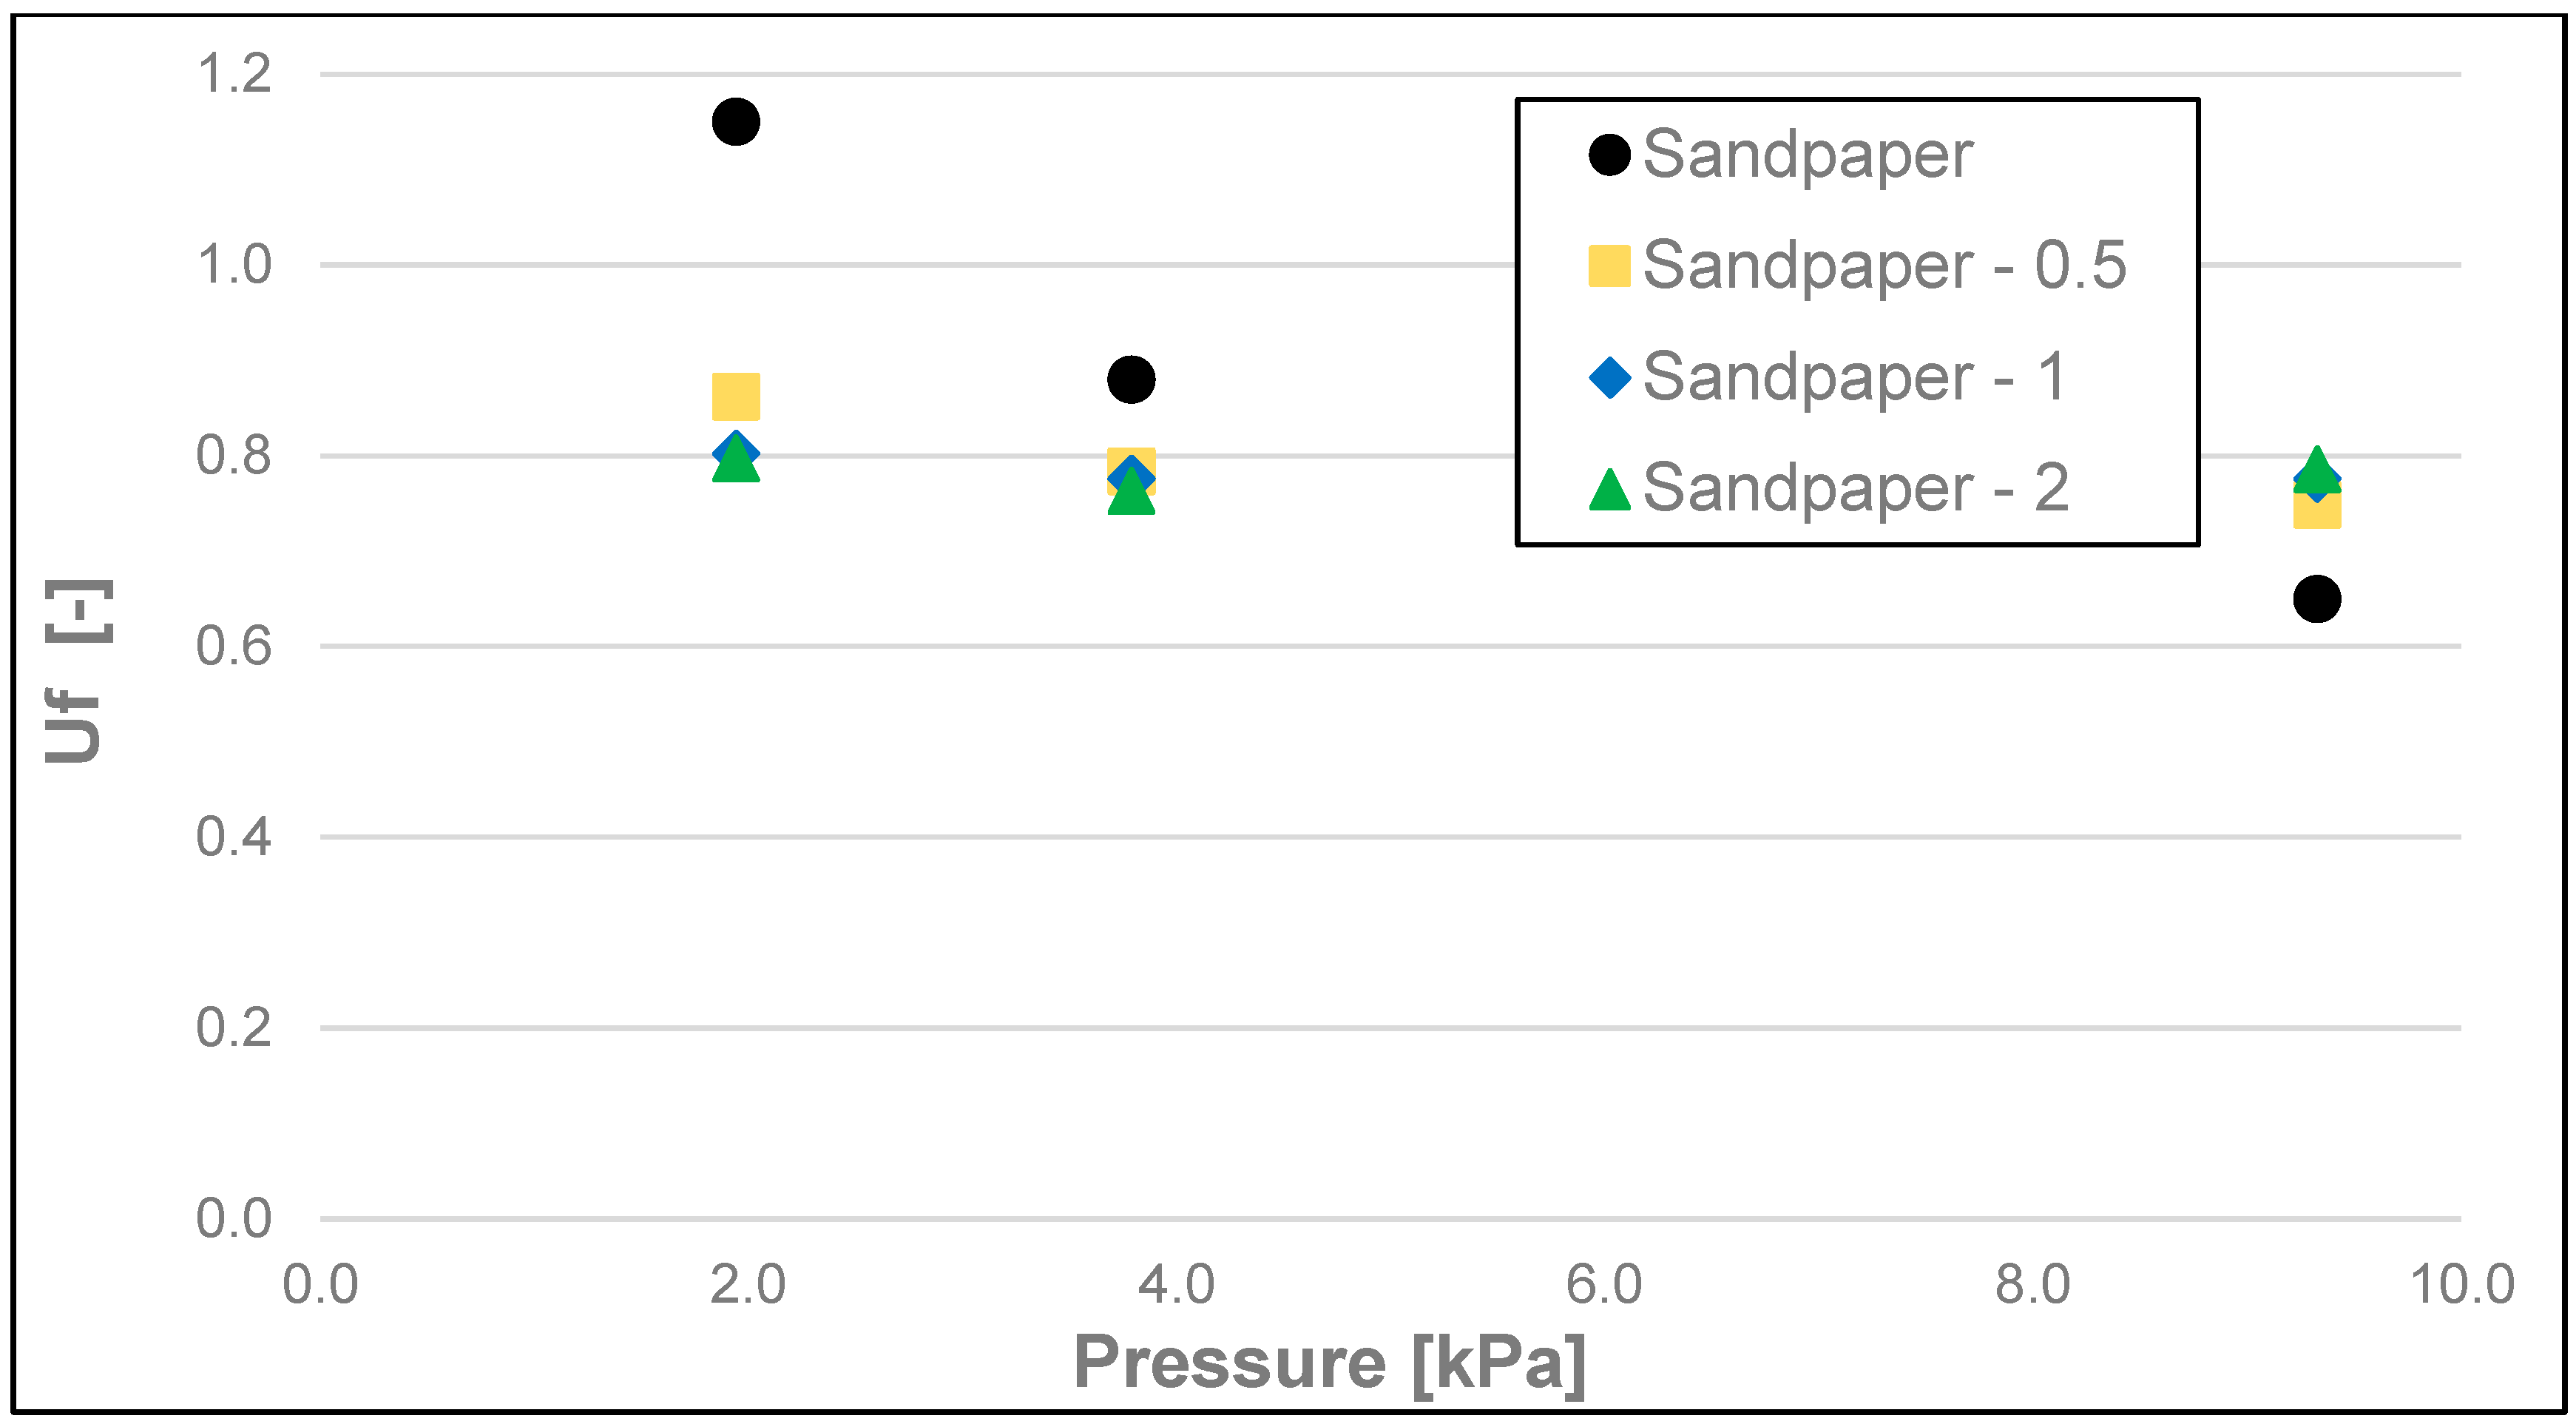
| Sandpaper (320) | 1.94 | - | 1.09 | 1.24 | 1.15 | 0.06 | m |
| <0–0.5 | 0.72 | 1.00 | 0.86 | 0.12 | l | ||
| <0.5–1 | 0.74 | 0.85 | 0.80 | 0.05 | k, l | ||
| <1–2 | 0.68 | 0.87 | 0.80 | 0.07 | j, k, l | ||
| 3.79 | - | 0.79 | 1.01 | 0.88 | 0.08 | l | |
| <0–0.5 | 0.73 | 0.86 | 0.78 | 0.05 | j, k, l | ||
| <0.5–1 | 0.73 | 0.84 | 0.78 | 0.05 | j, k, l | ||
| <1–2 | 0.73 | 0.82 | 0.76 | 0.03 | j, k, l | ||
| 9.33 | - | 0.60 | 0.69 | 0.65 | 0.03 | h, i, j | |
| <0–0.5 | 0.71 | 0.82 | 0.75 | 0.04 | j, k, l | ||
| <0.5–1 | 0.74 | 0.80 | 0.78 | 0.03 | j, k, l | ||
| <1–2 | 0.77 | 0.84 | 0.79 | 0.03 | j, k, l |
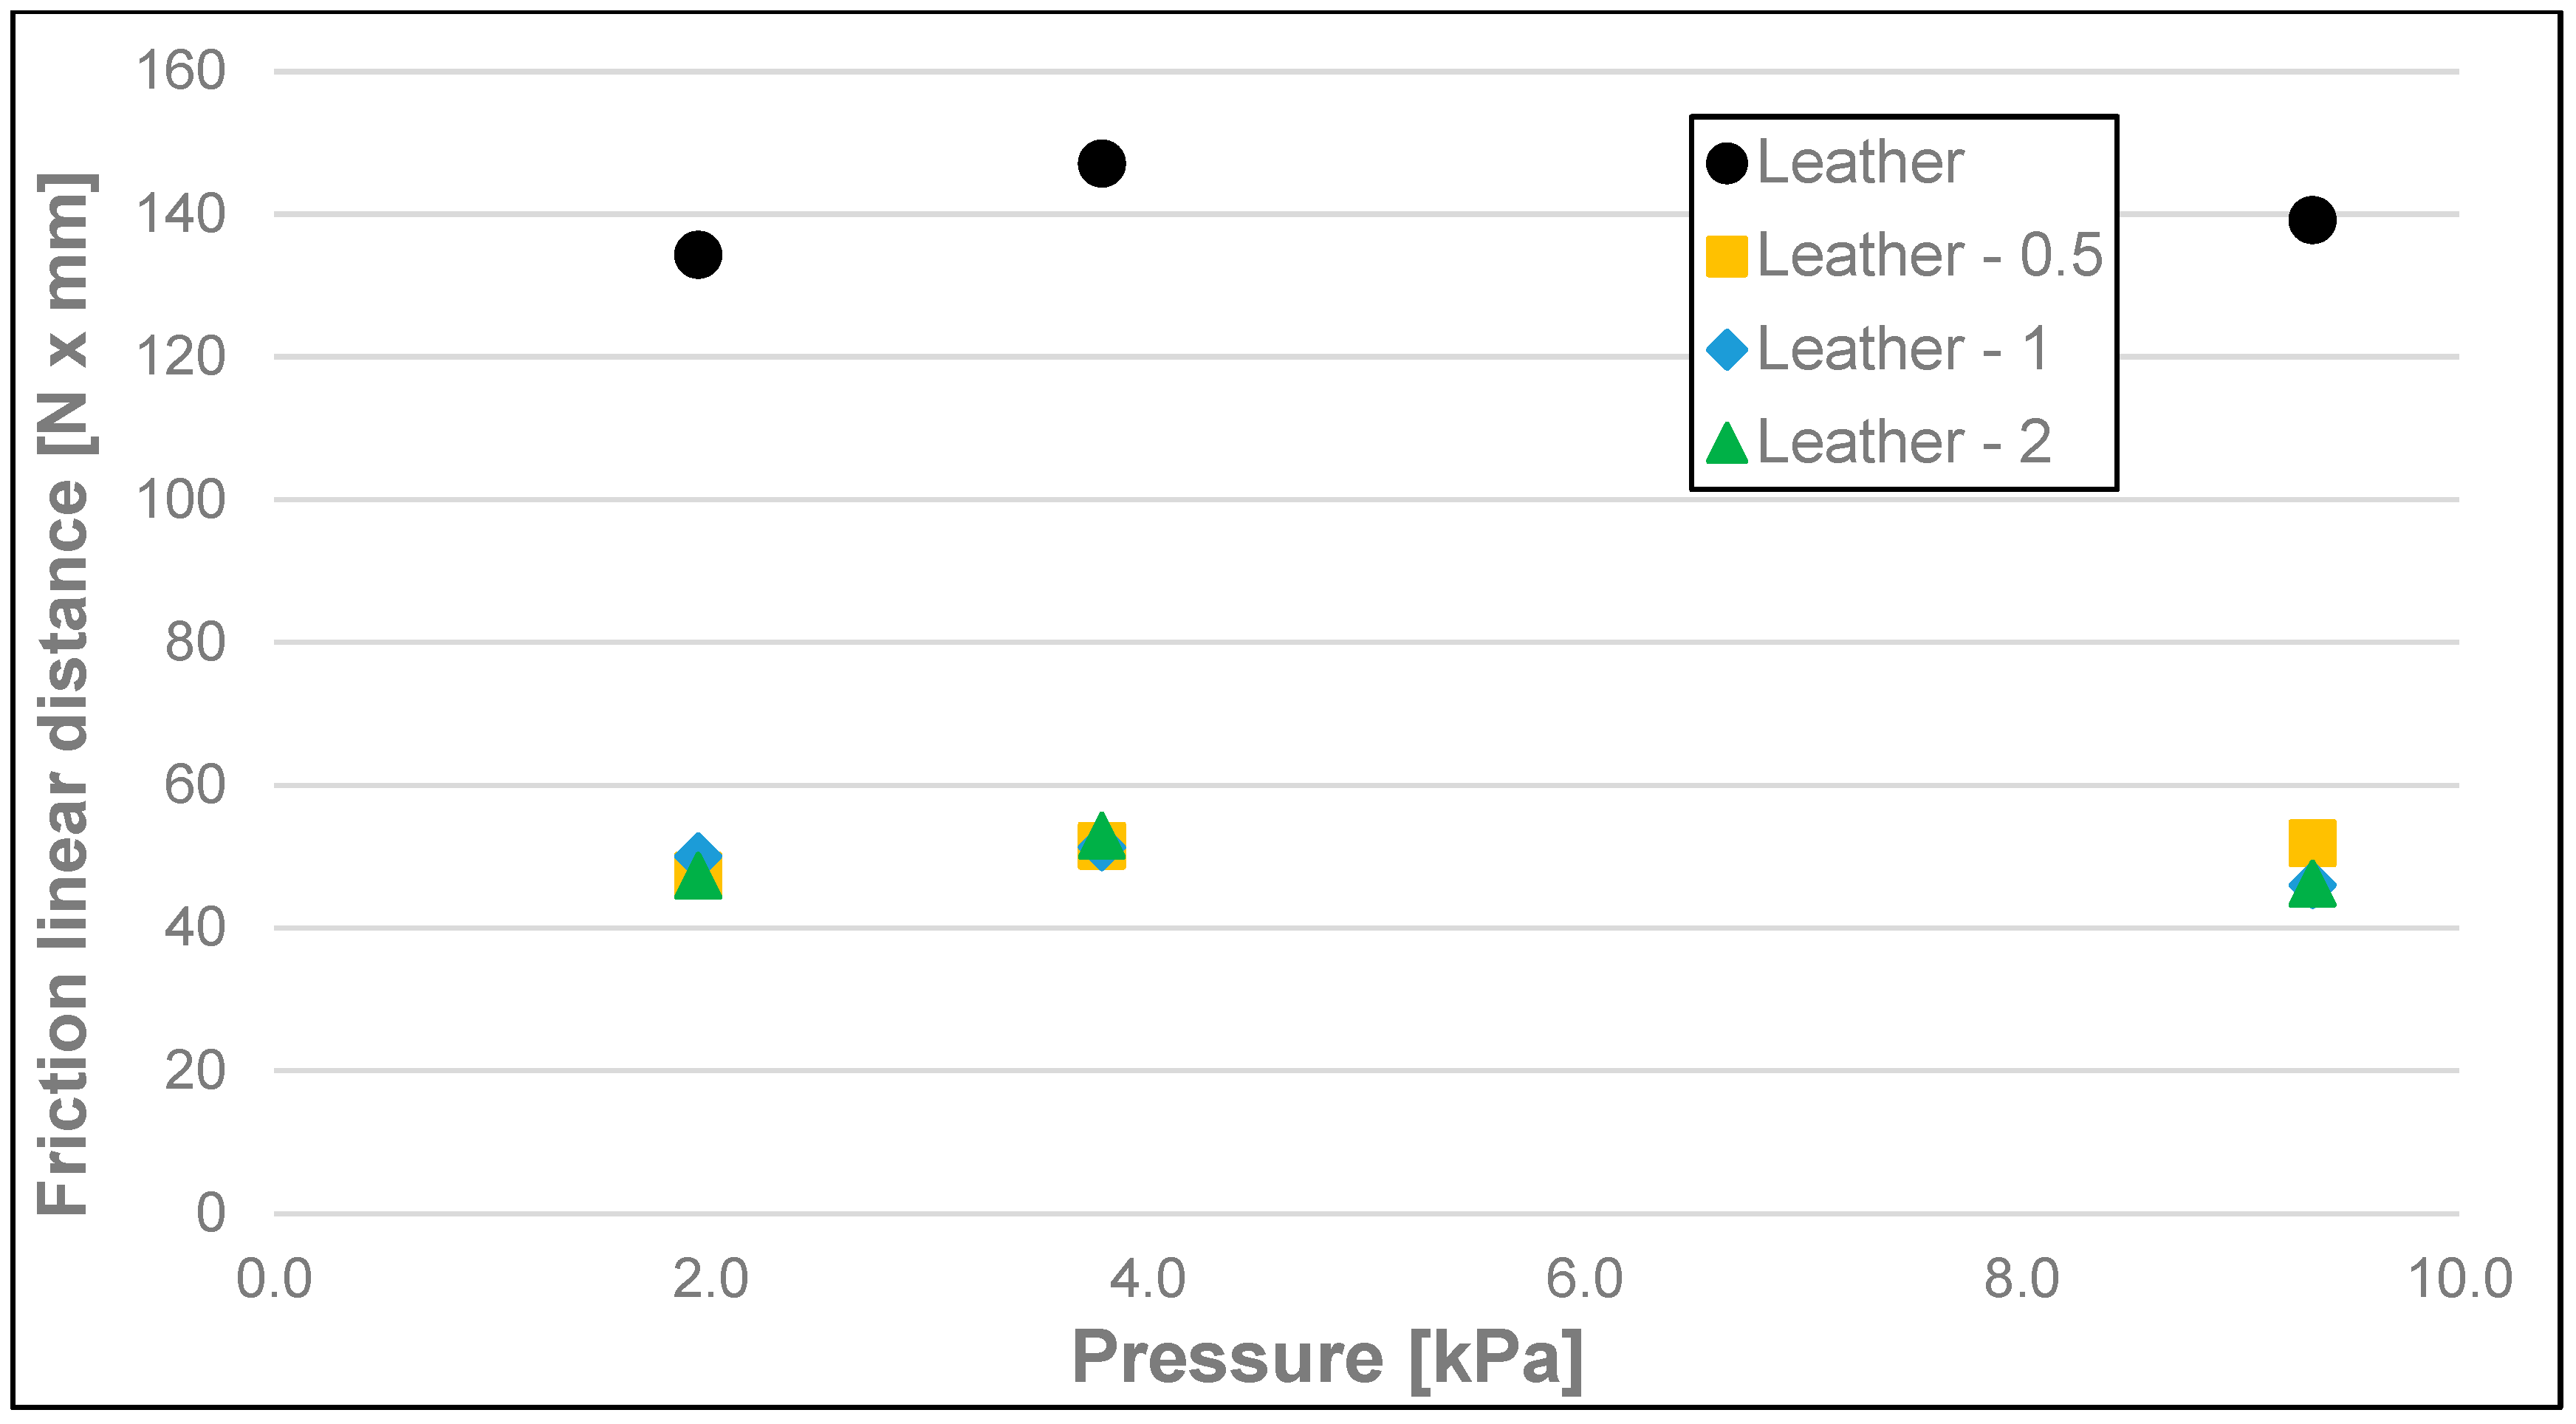
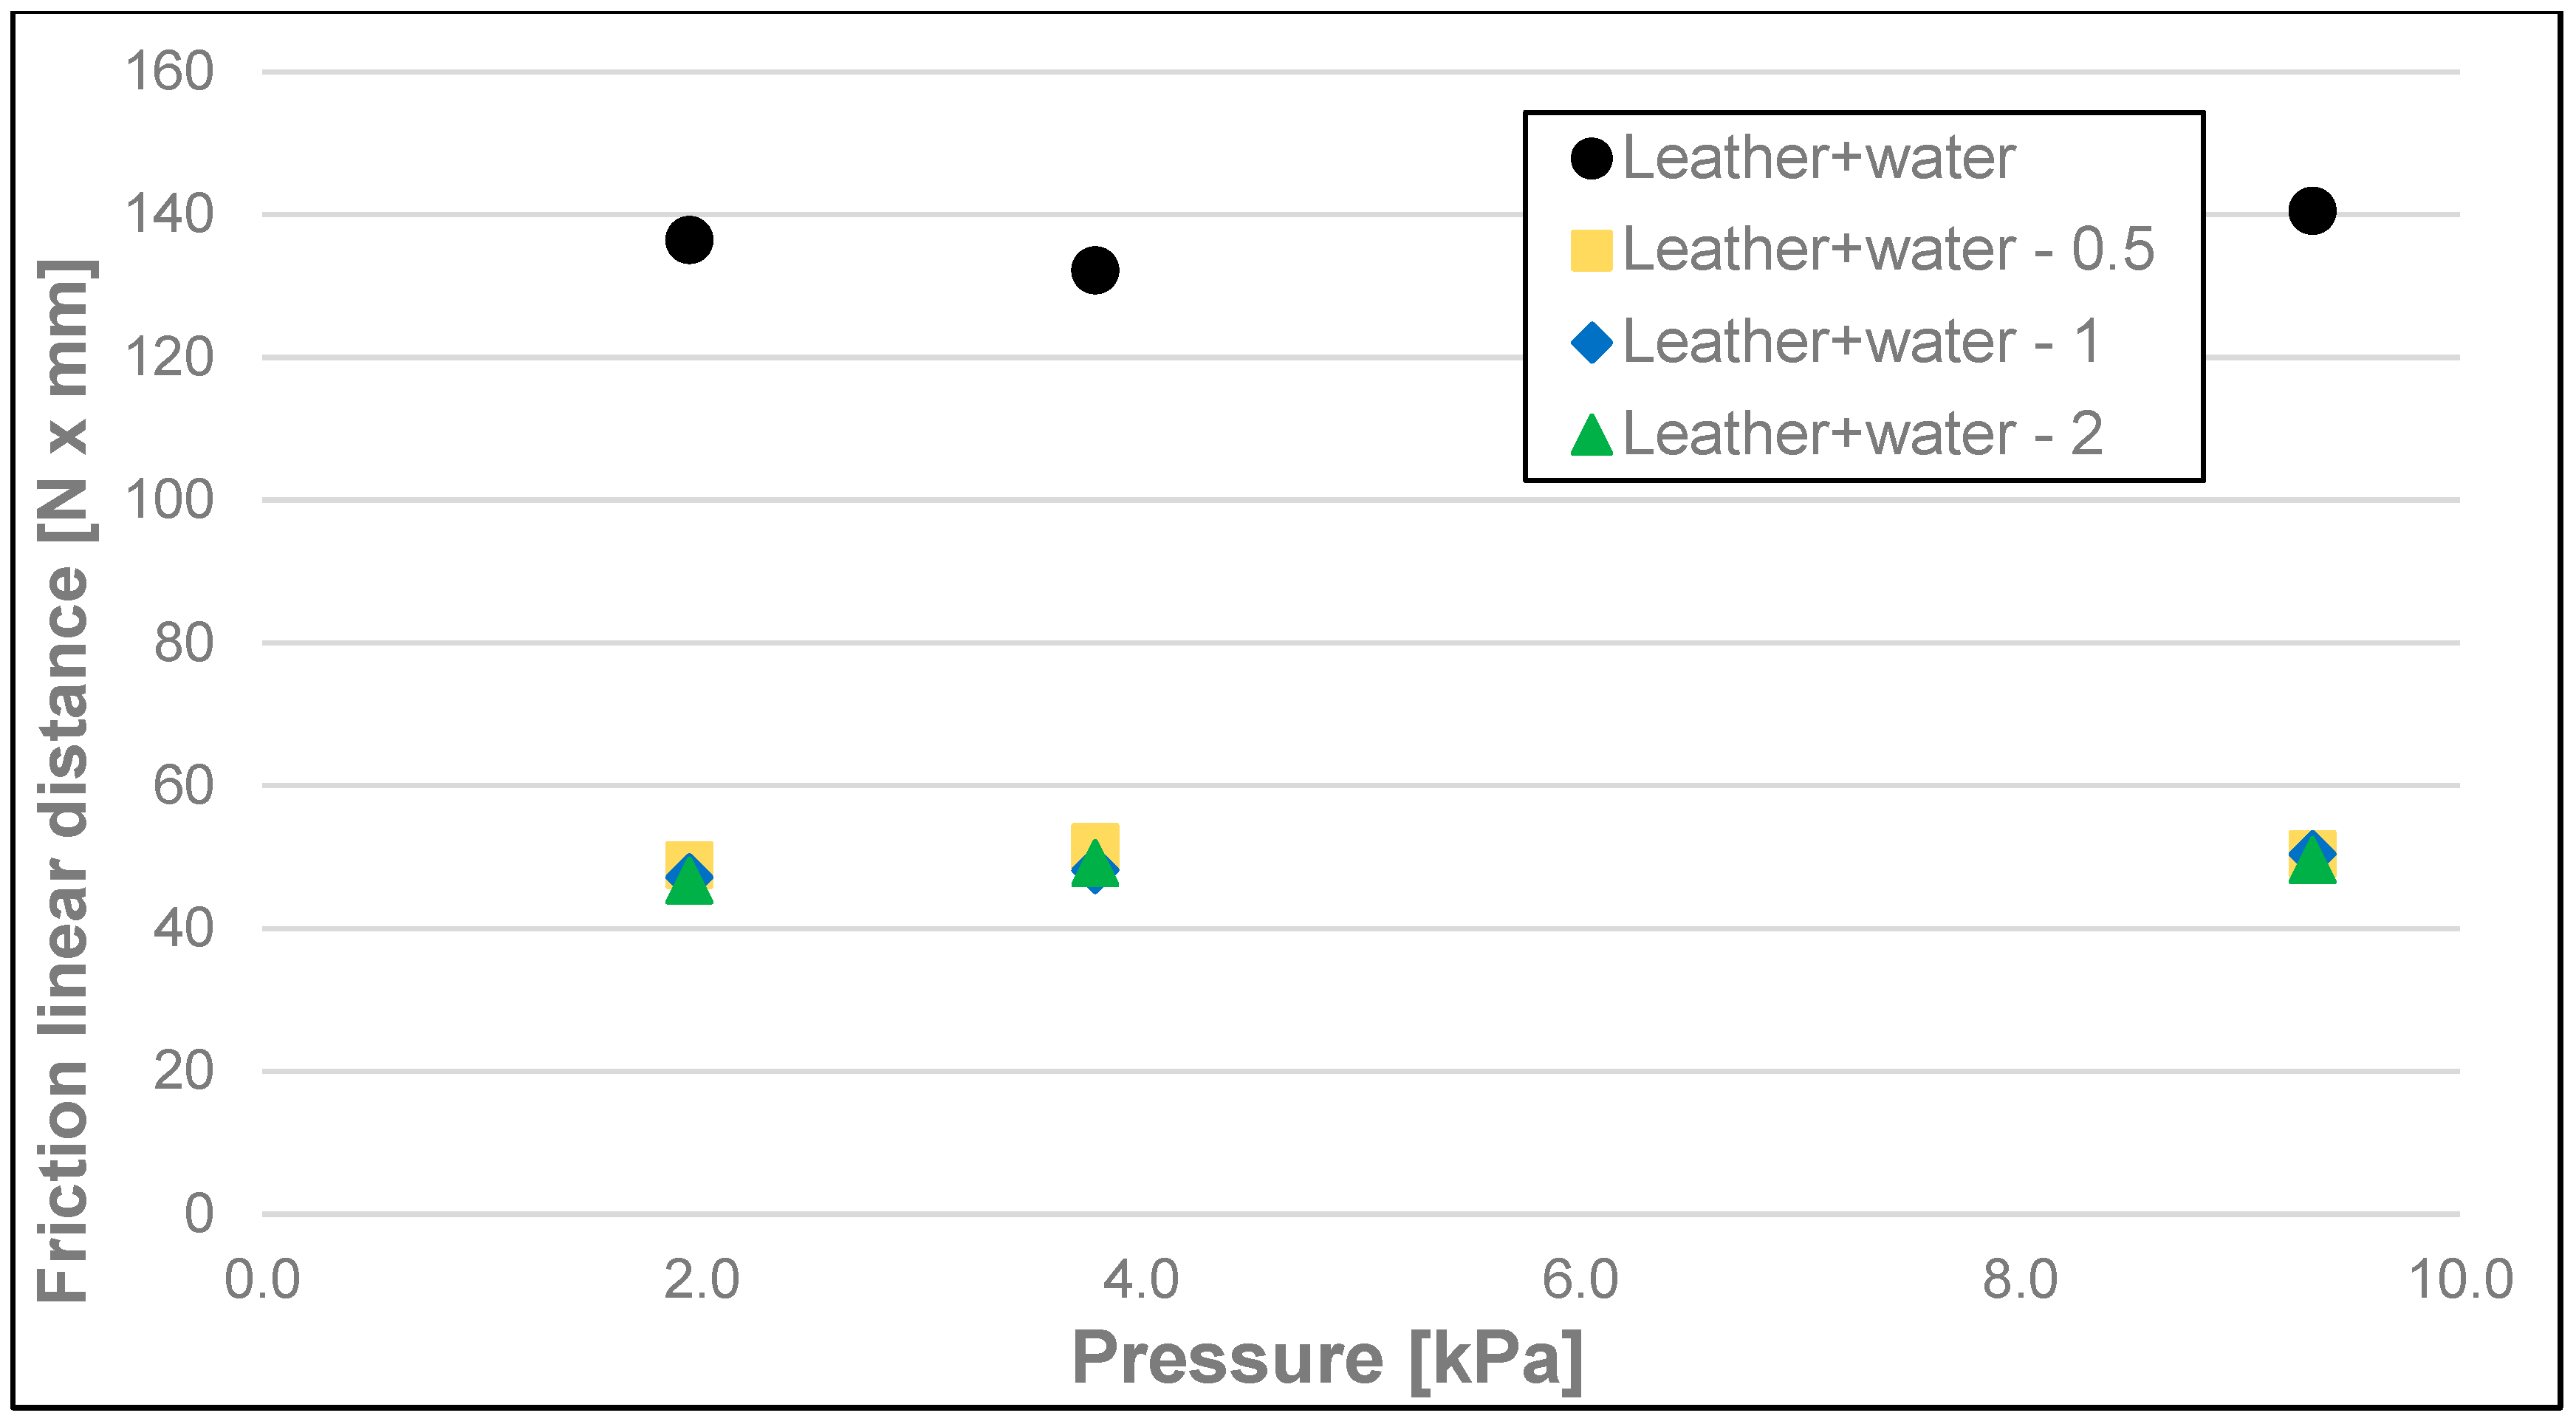
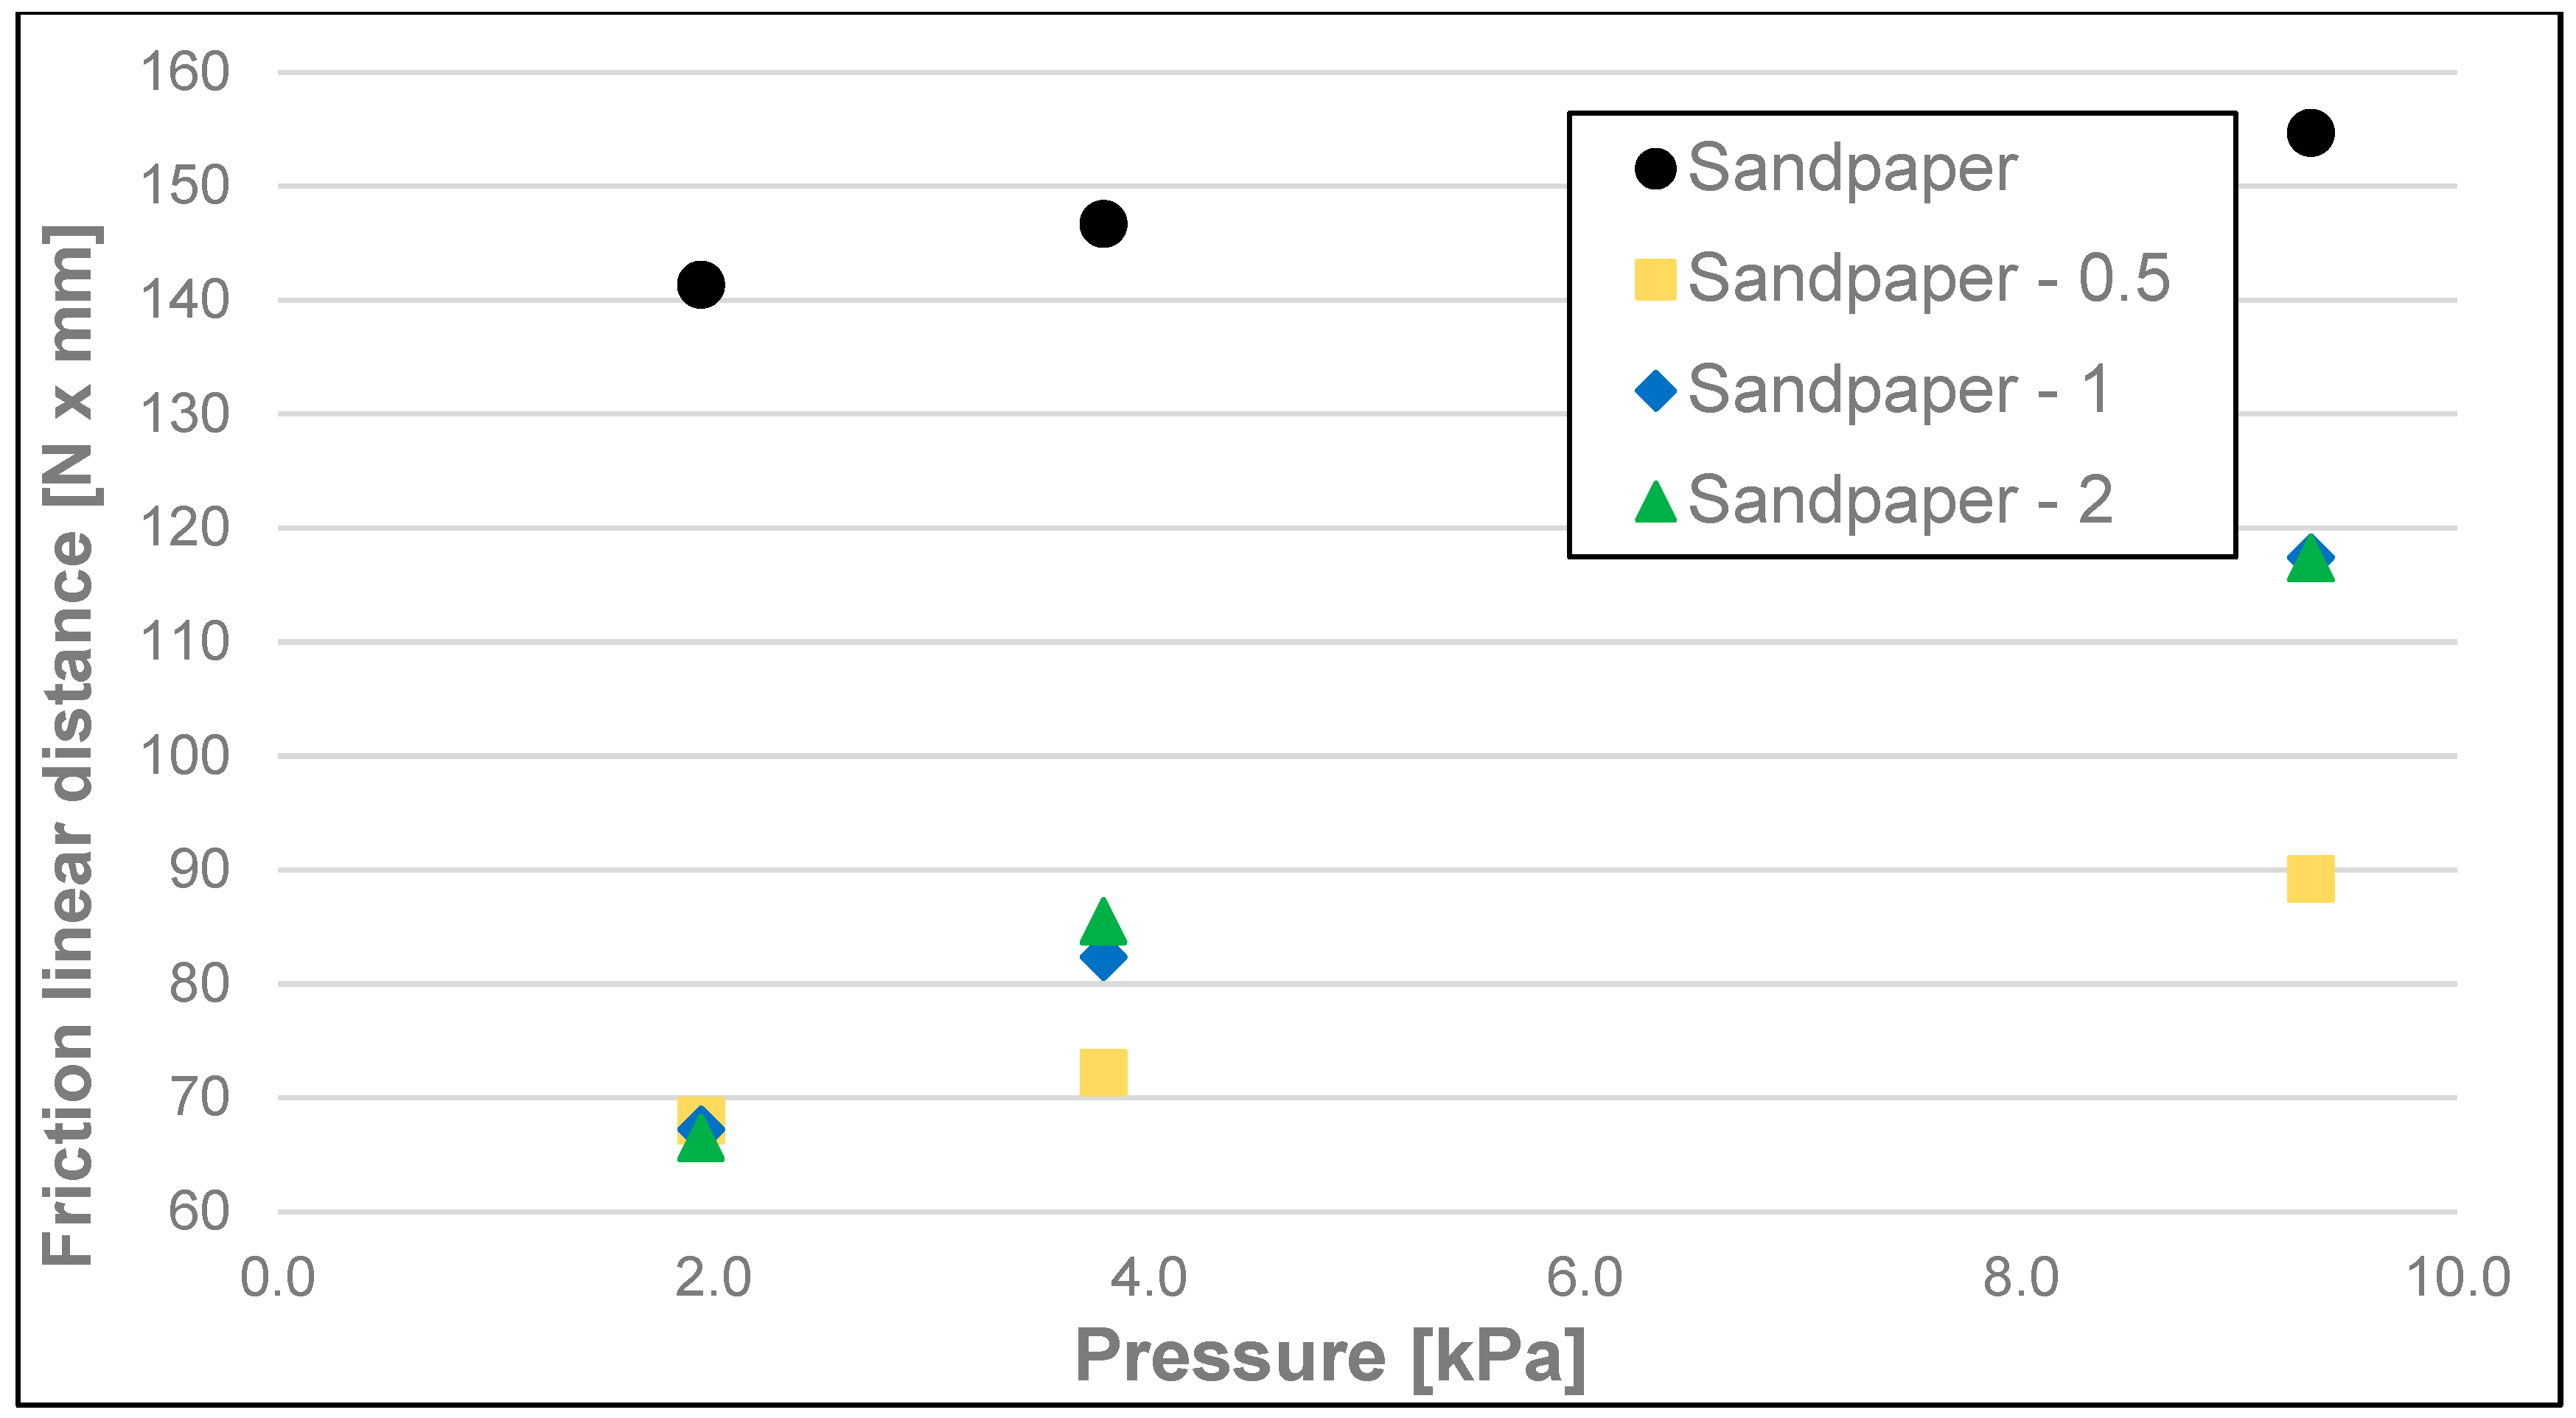
| Surface | Pressure [kPa] | Size Range of Nutshell Particles Added to the Soap [mm] | Min. Linear Distance of Friction [N × mm] | Max. Linear Distance of Friction [N × mm] | Mean Linear Distance of Friction [N × mm] | Linear Distance of Friction S.D. | Homogeneous Group * |
|---|---|---|---|---|---|---|---|
| Leather | 1.94 | - | 130.18 | 138.58 | 134.35 | 3.45 | g, h |
| <0–0.5 | 46.59 | 48.13 | 47.33 | 0.56 | a | ||
| <0.5–1 | 47.27 | 52.41 | 50.10 | 2.35 | a | ||
| <1–2 | 46.96 | 48.01 | 47.37 | 0.41 | a | ||
| 3.79 | - | 139.57 | 152.82 | 147.09 | 6.87 | h, i | |
| <0–0.5 | 46.50 | 56.22 | 51.53 | 3.81 | a | ||
| <0.5–1 | 49.17 | 53.50 | 51.33 | 1.91 | a | ||
| <1–2 | 49.12 | 56.62 | 52.98 | 3.56 | a, b | ||
| 9.33 | - | 136.03 | 142.55 | 139.17 | 2.78 | g, h | |
| <0–0.5 | 48.34 | 56.45 | 51.89 | 3.13 | a | ||
| <0.5–1 | 44.60 | 47.71 | 46.08 | 1.41 | a | ||
| <1–2 | 43.79 | 48.59 | 46.28 | 1.93 | a | ||
| Leather + Water | 1.94 | - | 131.05 | 140.17 | 136.48 | 3.85 | g, h |
| <0–0.5 | 46.23 | 50.69 | 48.91 | 1.93 | a | ||
| <0.5–1 | 45.88 | 48.78 | 47.21 | 1.14 | a | ||
| <1–2 | 44.75 | 48.97 | 46.75 | 1.87 | a | ||
| 3.79 | - | 129.18 | 135.56 | 132.20 | 2.98 | g | |
| <0–0.5 | 46.03 | 55.70 | 51.45 | 4.61 | a | ||
| <0.5–1 | 44.36 | 51.34 | 48.18 | 3.43 | a | ||
| <1–2 | 45.24 | 53.20 | 49.16 | 3.43 | a | ||
| 9.33 | - | 133.13 | 143.49 | 140.55 | 4.23 | g, h | |
| <0–0.5 | 46.40 | 52.97 | 49.59 | 2.69 | a | ||
| <0.5–1 | 46.22 | 62.63 | 50.45 | 6.84 | a | ||
| <1–2 | 46.40 | 52.97 | 49.59 | 2.69 | a | ||
| Sandpaper (320) | 1.94 | - | 131.66 | 148.77 | 141.35 | 6.43 | g, h, i |
| <0–0.5 | 62.03 | 77.82 | 68.03 | 6.34 | c | ||
| <0.5–1 | 61.00 | 70.48 | 67.24 | 4.05 | c | ||
| <1–2 | 55.30 | 73.51 | 66.49 | 8.03 | b, c | ||
| 3.79 | - | 135.71 | 159.65 | 146.71 | 10.94 | h, i | |
| <0–0.5 | 65.54 | 80.89 | 72.23 | 6.66 | c, d | ||
| <0.5–1 | 79.01 | 92.82 | 82.37 | 5.90 | d, e | ||
| <1–2 | 73.05 | 95.05 | 85.51 | 9.44 | d, e | ||
| 9.33 | - | 146.39 | 164.03 | 154.69 | 6.90 | i | |
| <0–0.5 | 79.69 | 104.57 | 89.22 | 9.53 | e | ||
| <0.5–1 | 103.74 | 135.75 | 117.43 | 12.82 | f | ||
| <1–2 | 99.44 | 130.48 | 117.34 | 12.80 | f |
Disclaimer/Publisher’s Note: The statements, opinions and data contained in all publications are solely those of the individual author(s) and contributor(s) and not of MDPI and/or the editor(s). MDPI and/or the editor(s) disclaim responsibility for any injury to people or property resulting from any ideas, methods, instructions or products referred to in the content. |
© 2024 by the authors. Licensee MDPI, Basel, Switzerland. This article is an open access article distributed under the terms and conditions of the Creative Commons Attribution (CC BY) license (https://creativecommons.org/licenses/by/4.0/).
Share and Cite
Mazur, J.; Wójcik, M.; Różyło, R.; Sobczak, P.; Panasiewicz, M.; Obidziński, S. Frictional Properties of Soaps with the Addition of Ground Hazelnut Shells. Materials 2024, 17, 2966. https://doi.org/10.3390/ma17122966
Mazur J, Wójcik M, Różyło R, Sobczak P, Panasiewicz M, Obidziński S. Frictional Properties of Soaps with the Addition of Ground Hazelnut Shells. Materials. 2024; 17(12):2966. https://doi.org/10.3390/ma17122966
Chicago/Turabian StyleMazur, Jacek, Monika Wójcik, Renata Różyło, Paweł Sobczak, Marian Panasiewicz, and Sławomir Obidziński. 2024. "Frictional Properties of Soaps with the Addition of Ground Hazelnut Shells" Materials 17, no. 12: 2966. https://doi.org/10.3390/ma17122966
APA StyleMazur, J., Wójcik, M., Różyło, R., Sobczak, P., Panasiewicz, M., & Obidziński, S. (2024). Frictional Properties of Soaps with the Addition of Ground Hazelnut Shells. Materials, 17(12), 2966. https://doi.org/10.3390/ma17122966