
Experimental Study on the Flexural Performance of Steel–Polyvinyl Alcohol Hybrid Fiber-Reinforced Concrete

Abstract
1. Introduction
2. Experimental Materials and Methods
2.1. Experimental Materials
2.2. Test Methods
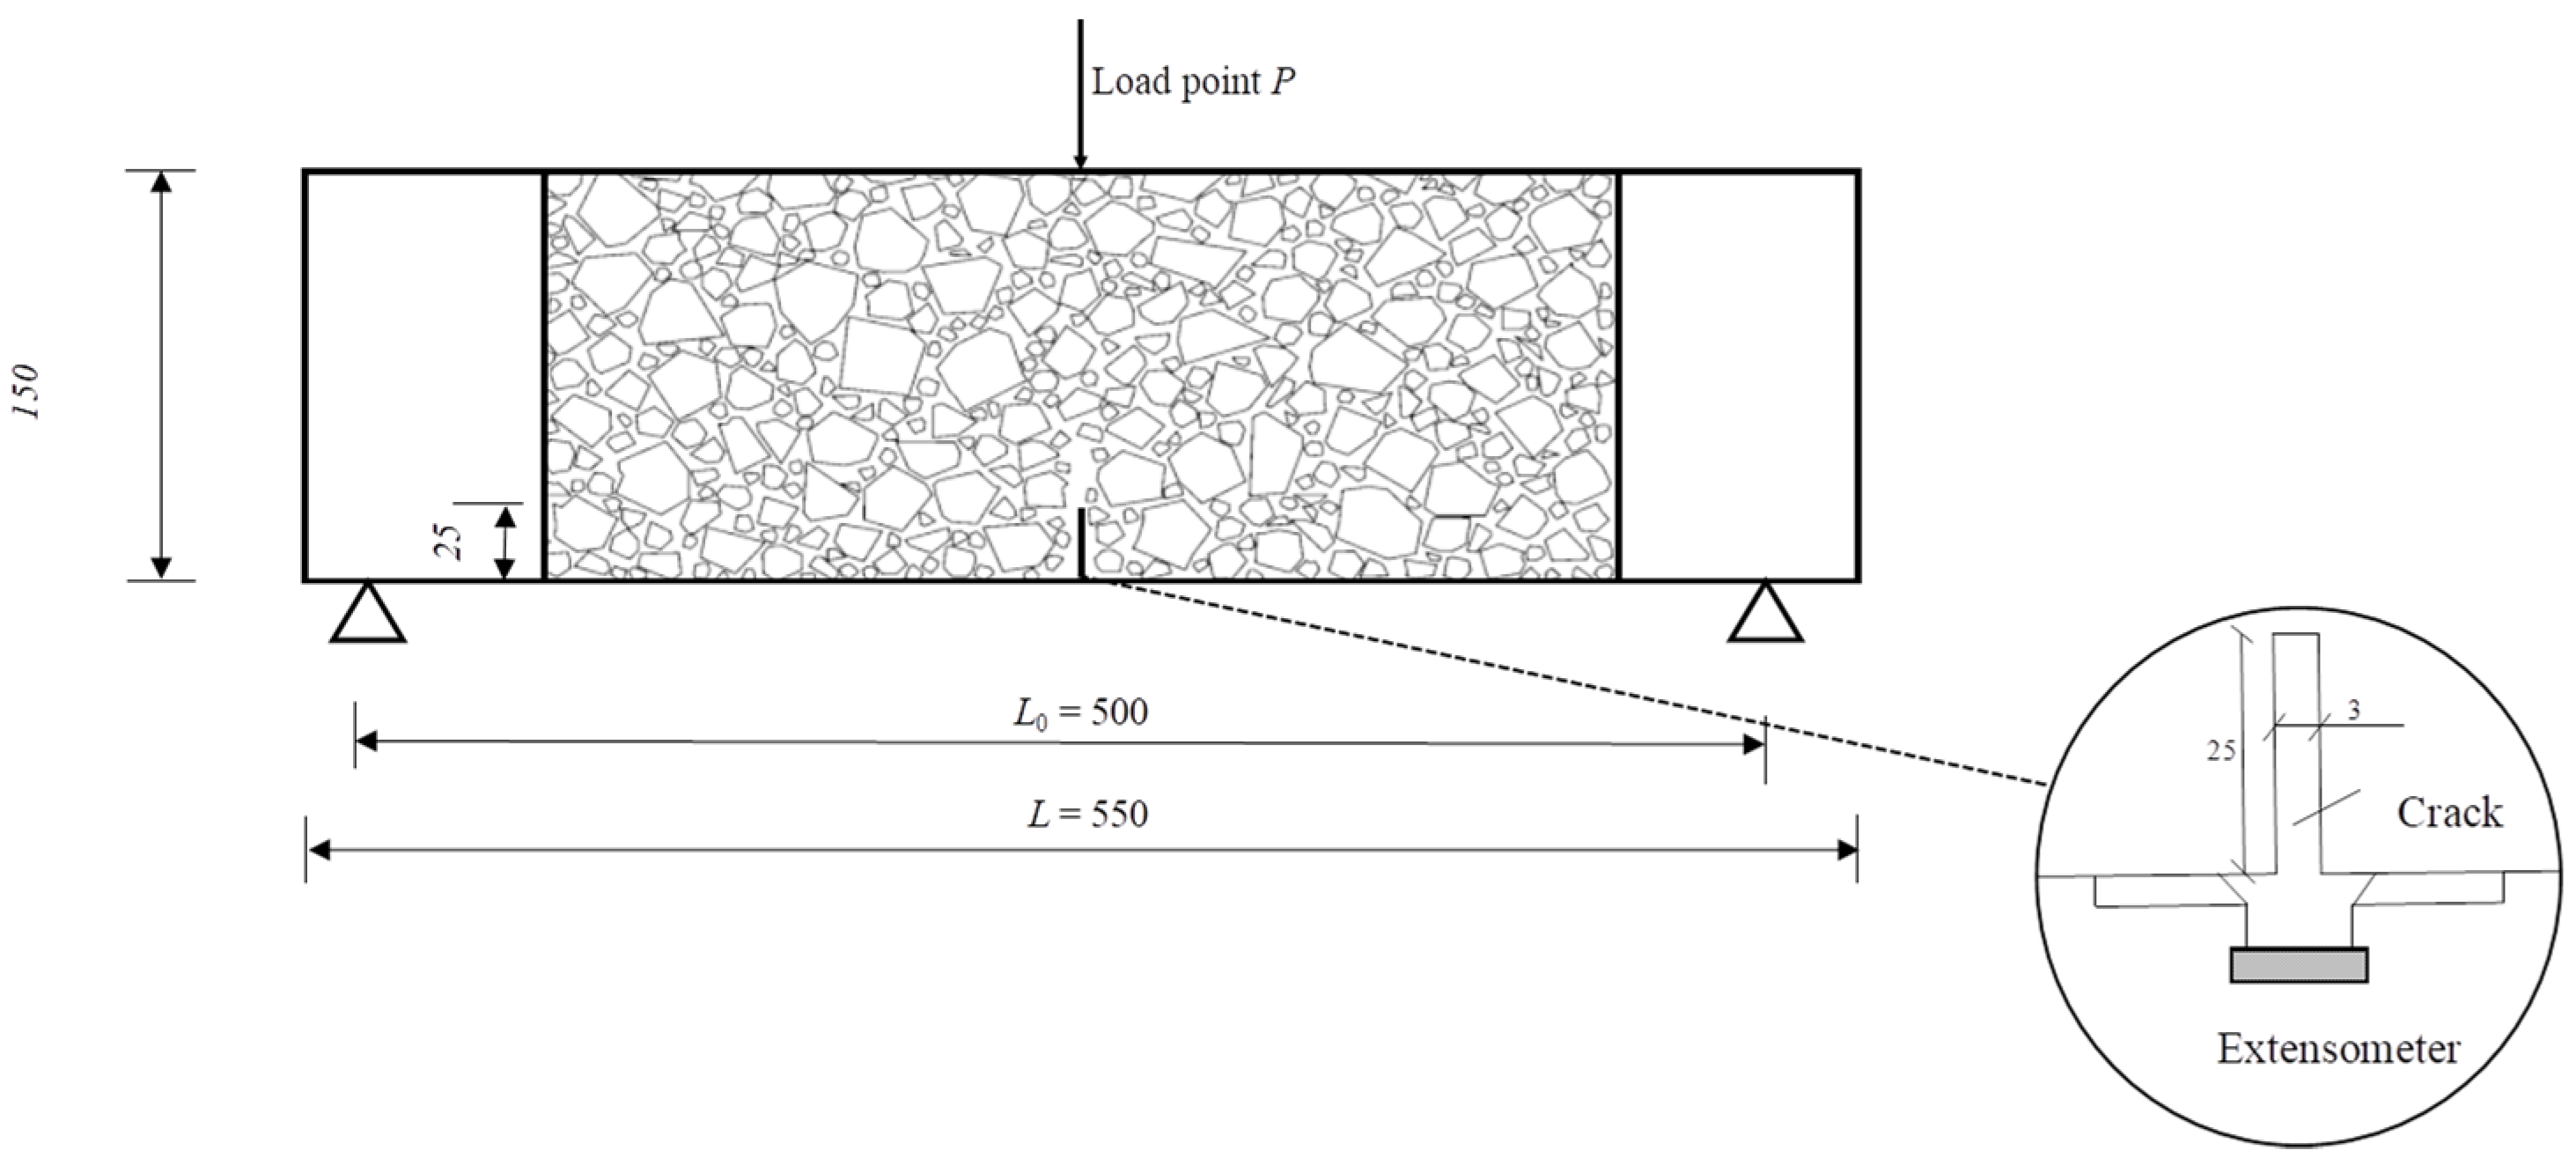
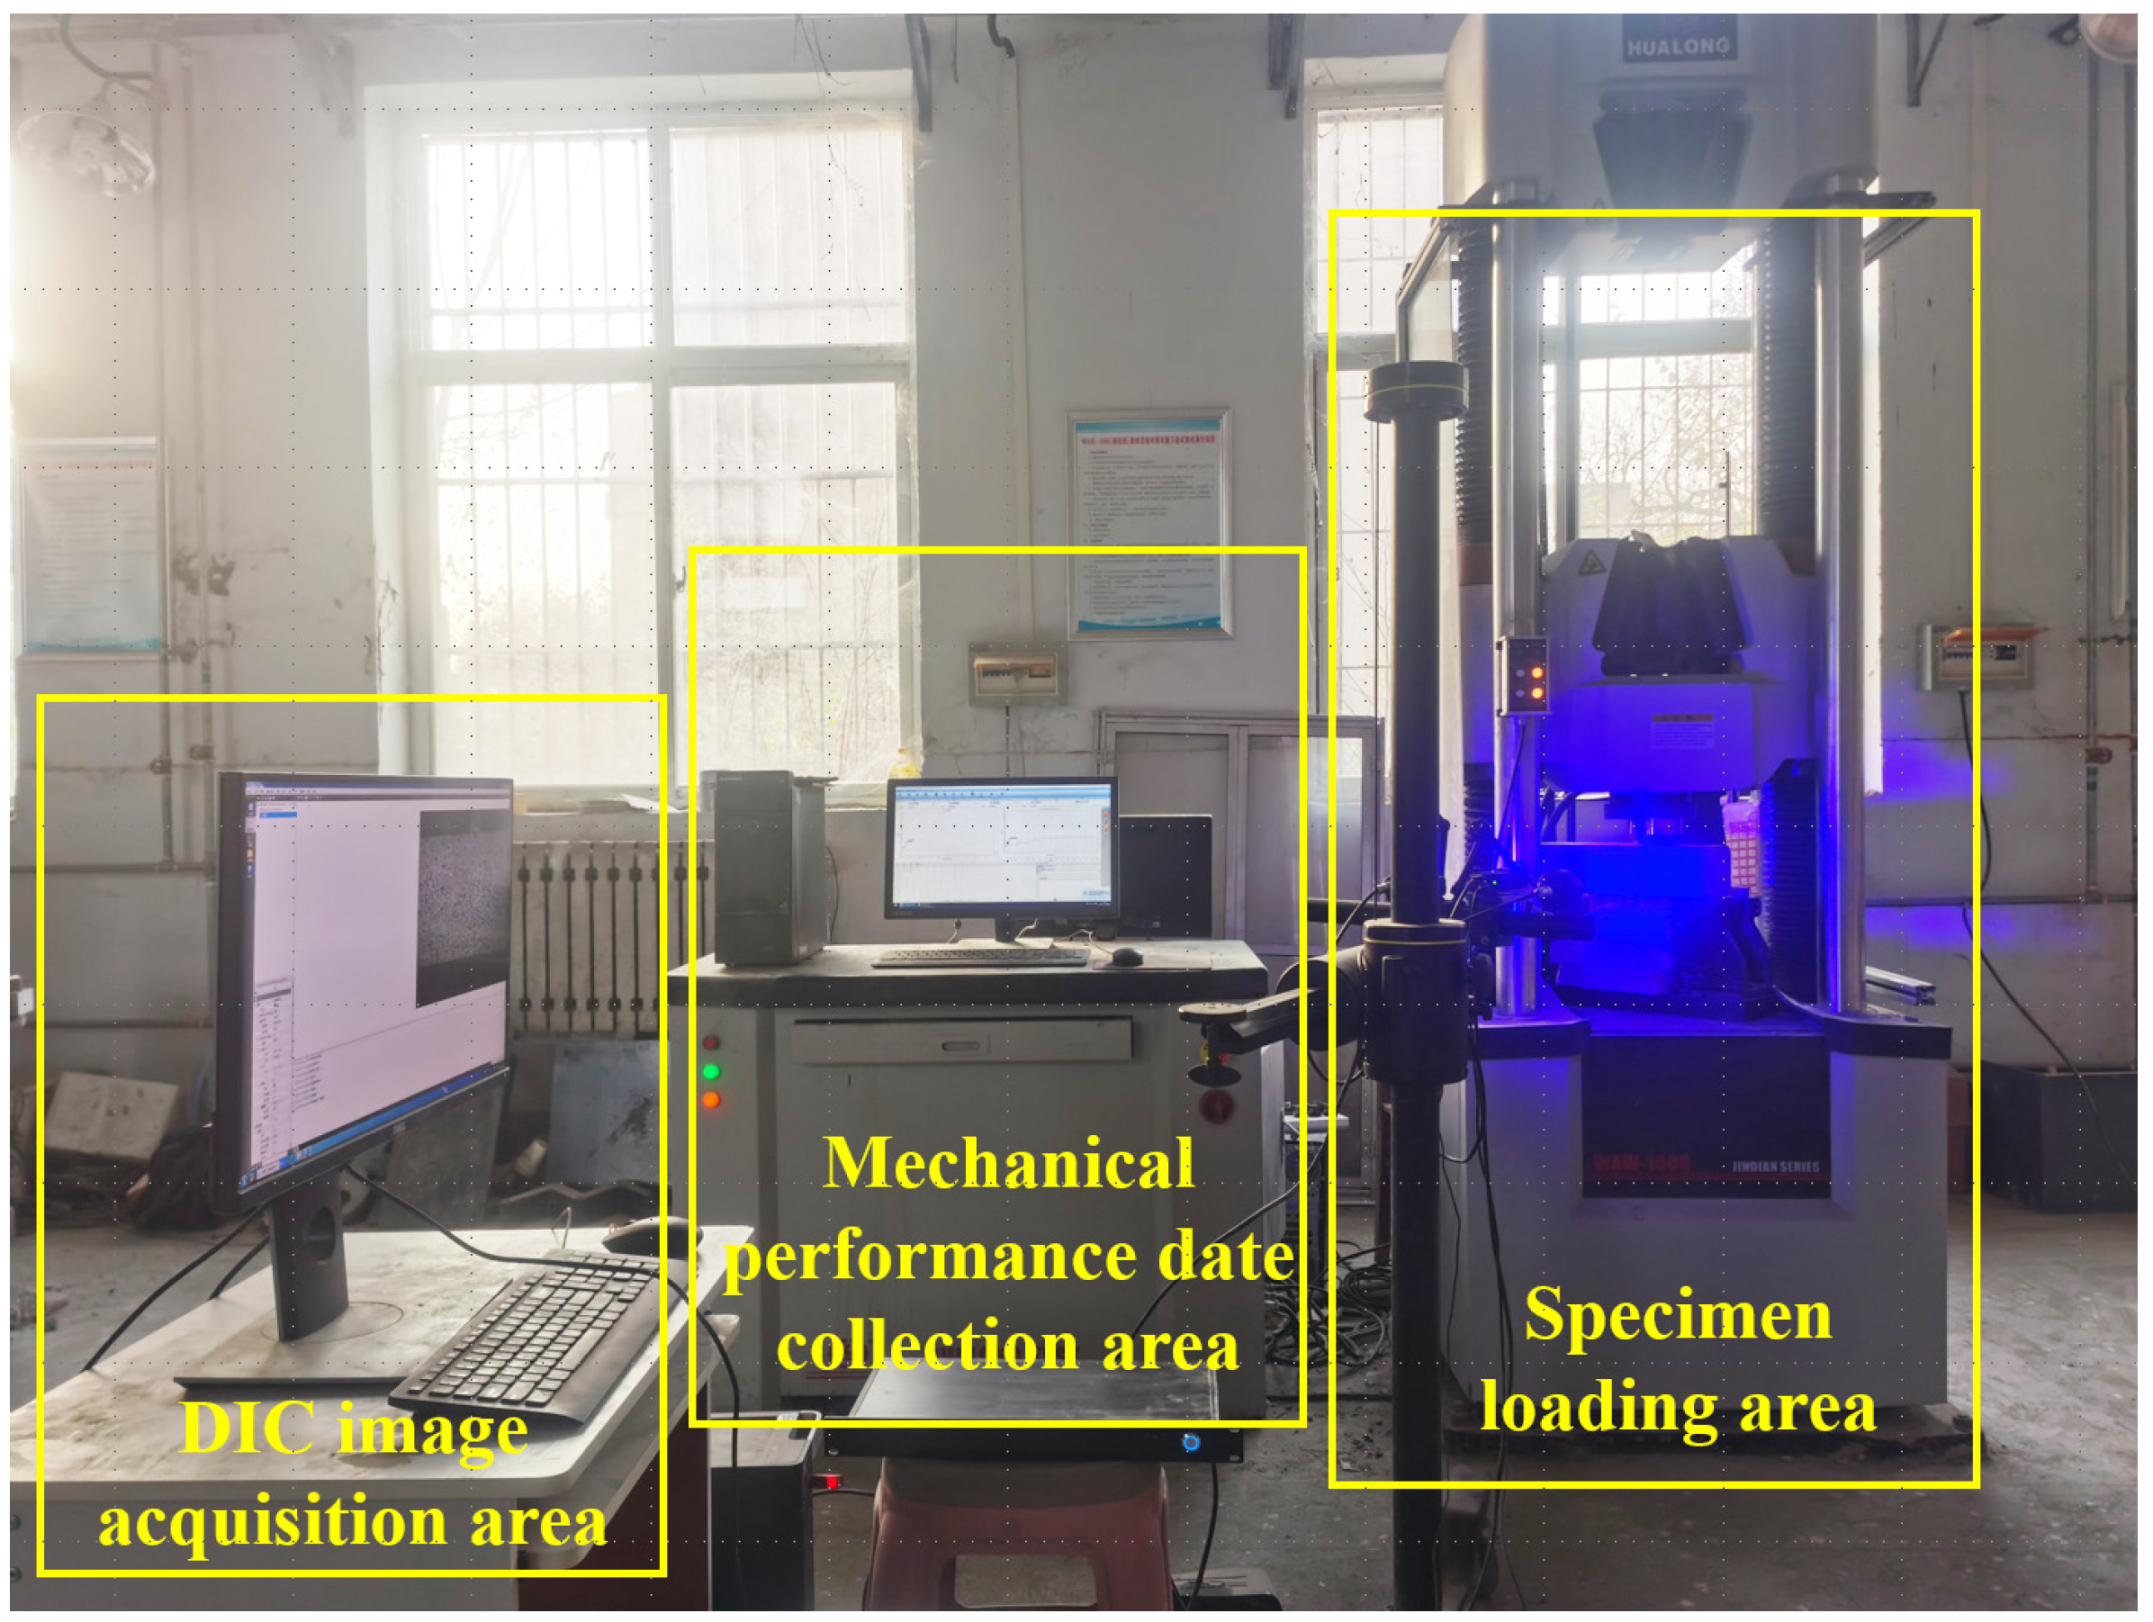
2.2.1. Three-Point Bending Test
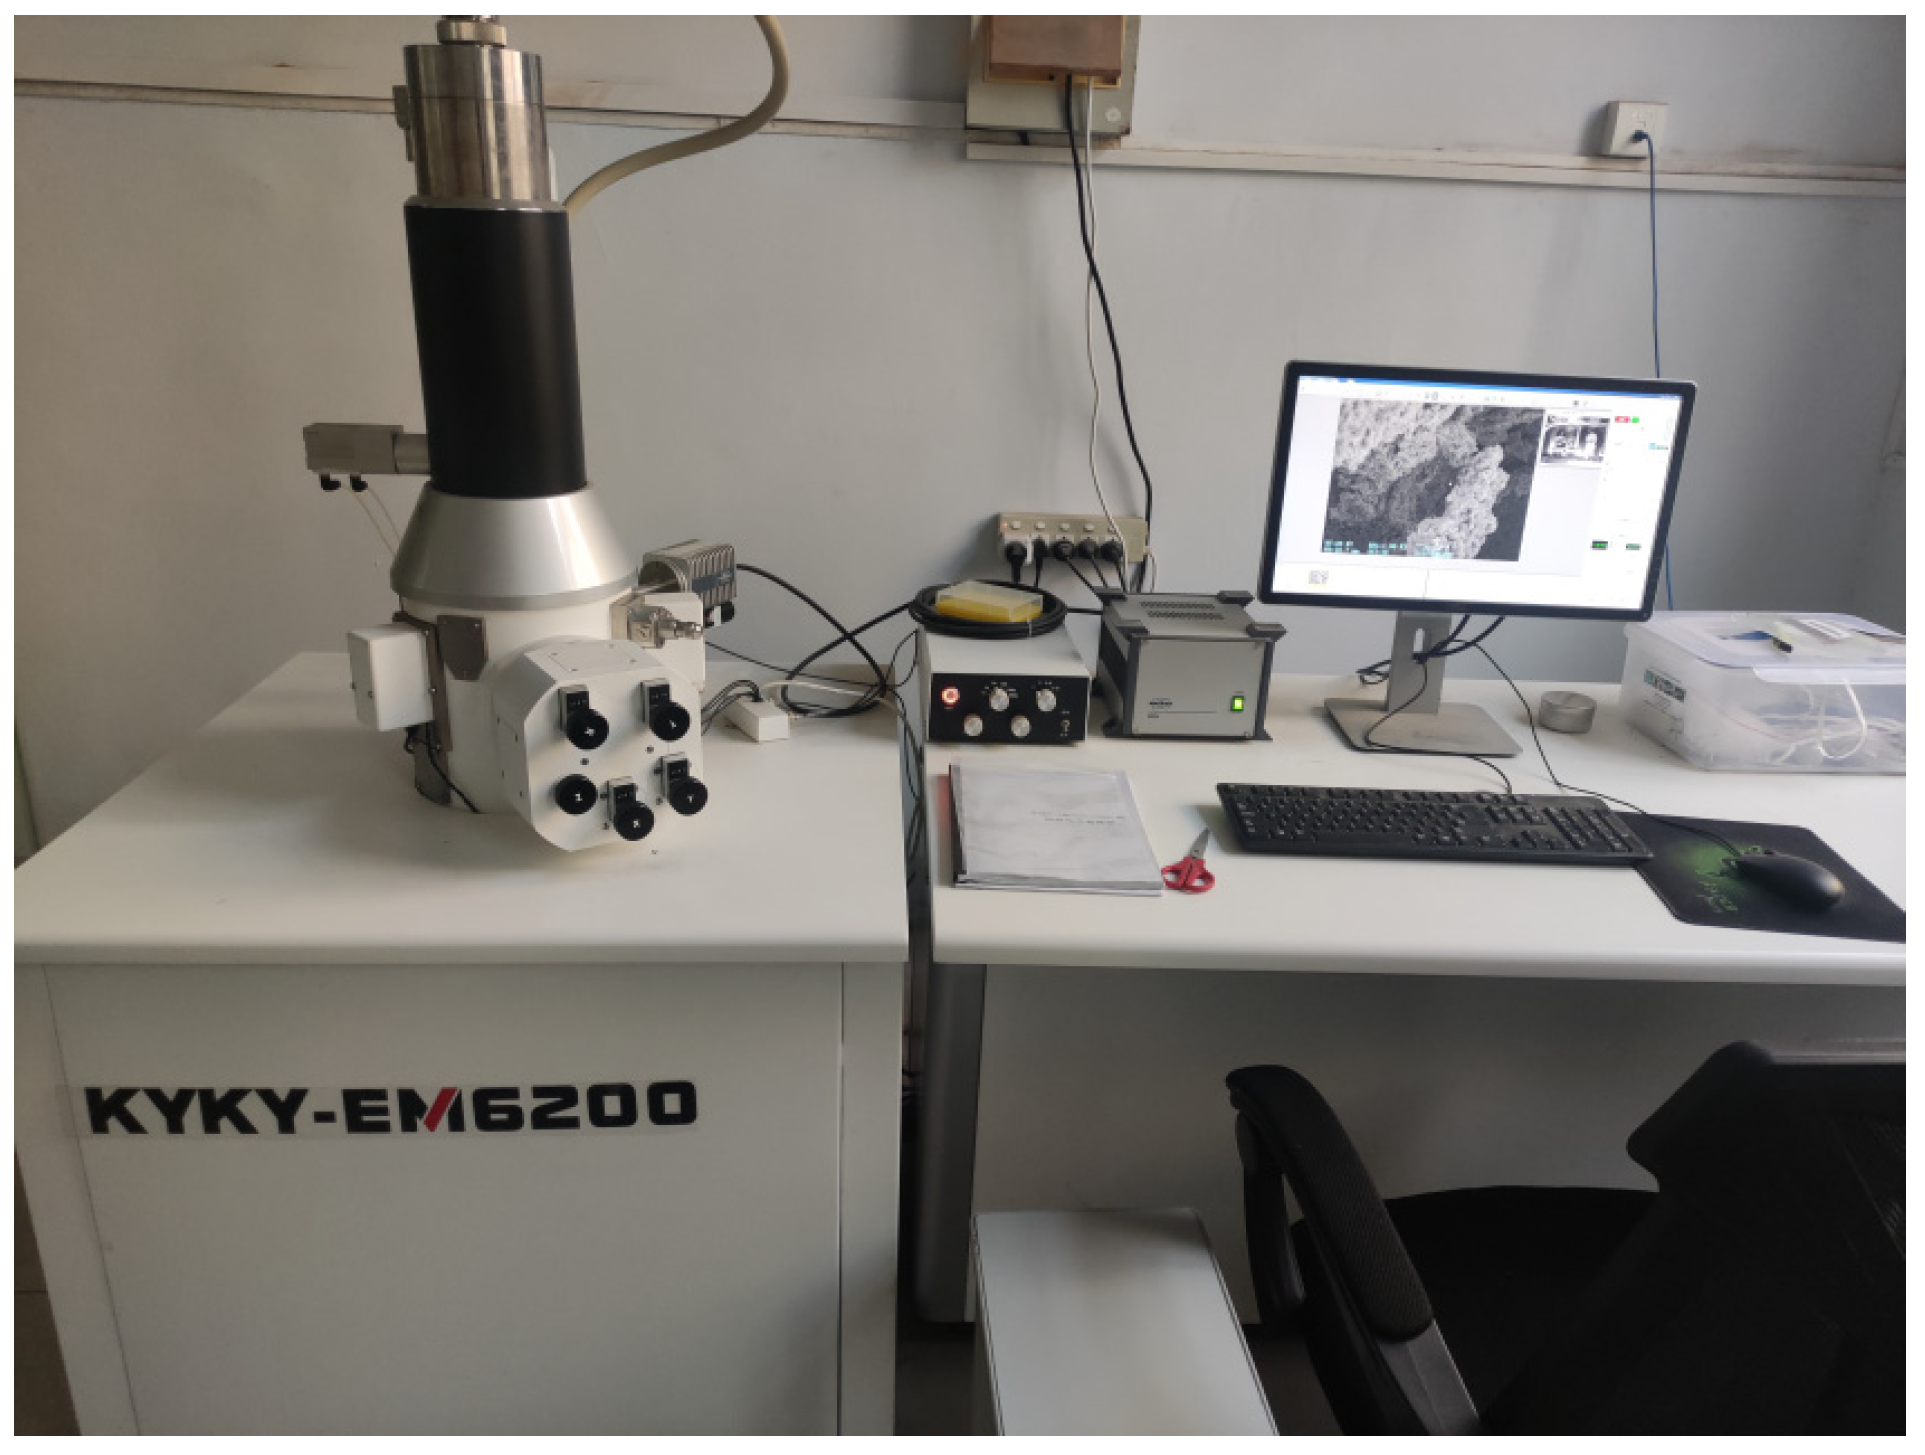
2.2.2. Microstructure Test
2.2.3. Fractal Dimension
3. Results and Discussion
3.1. Concrete Failure Process and Failure Mode
3.1.1. Reference Concrete
3.1.2. SFRC
3.1.3. S-PVA HFRC at the δ Is 3 mm
- (1)
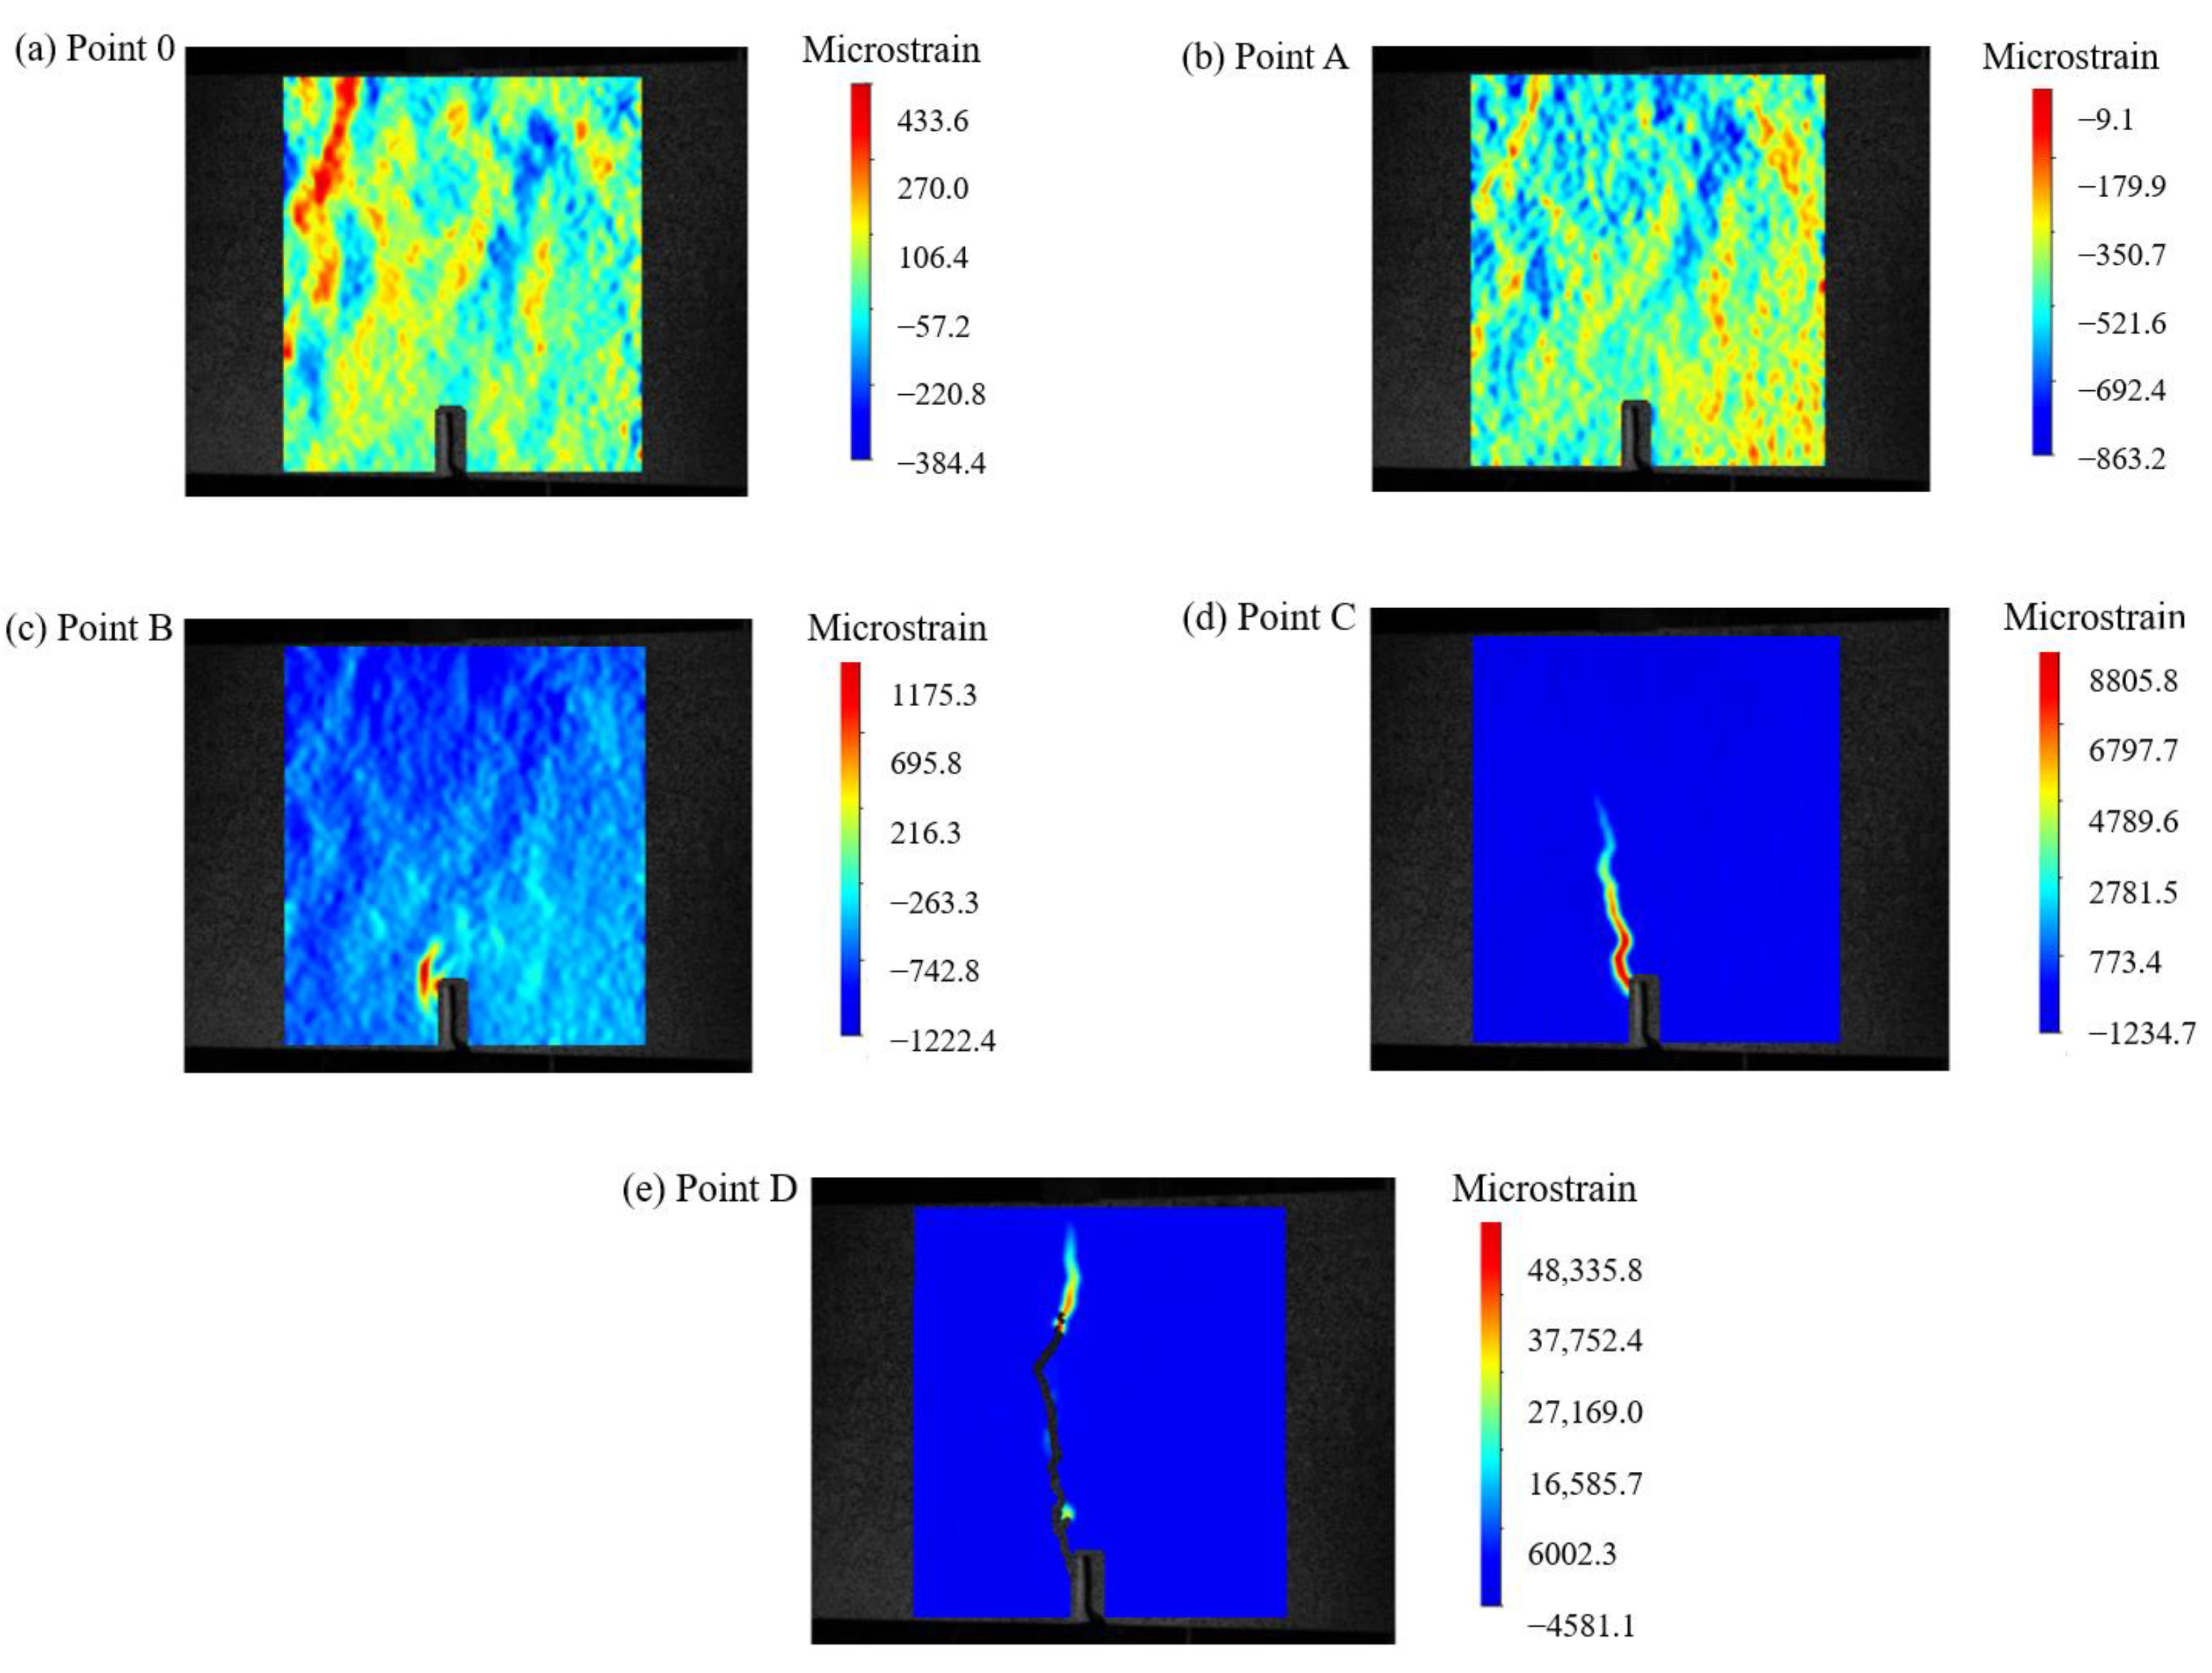
- Prior to reaching a of 3 mm, the reference concrete already exhibited a penetrating crack.
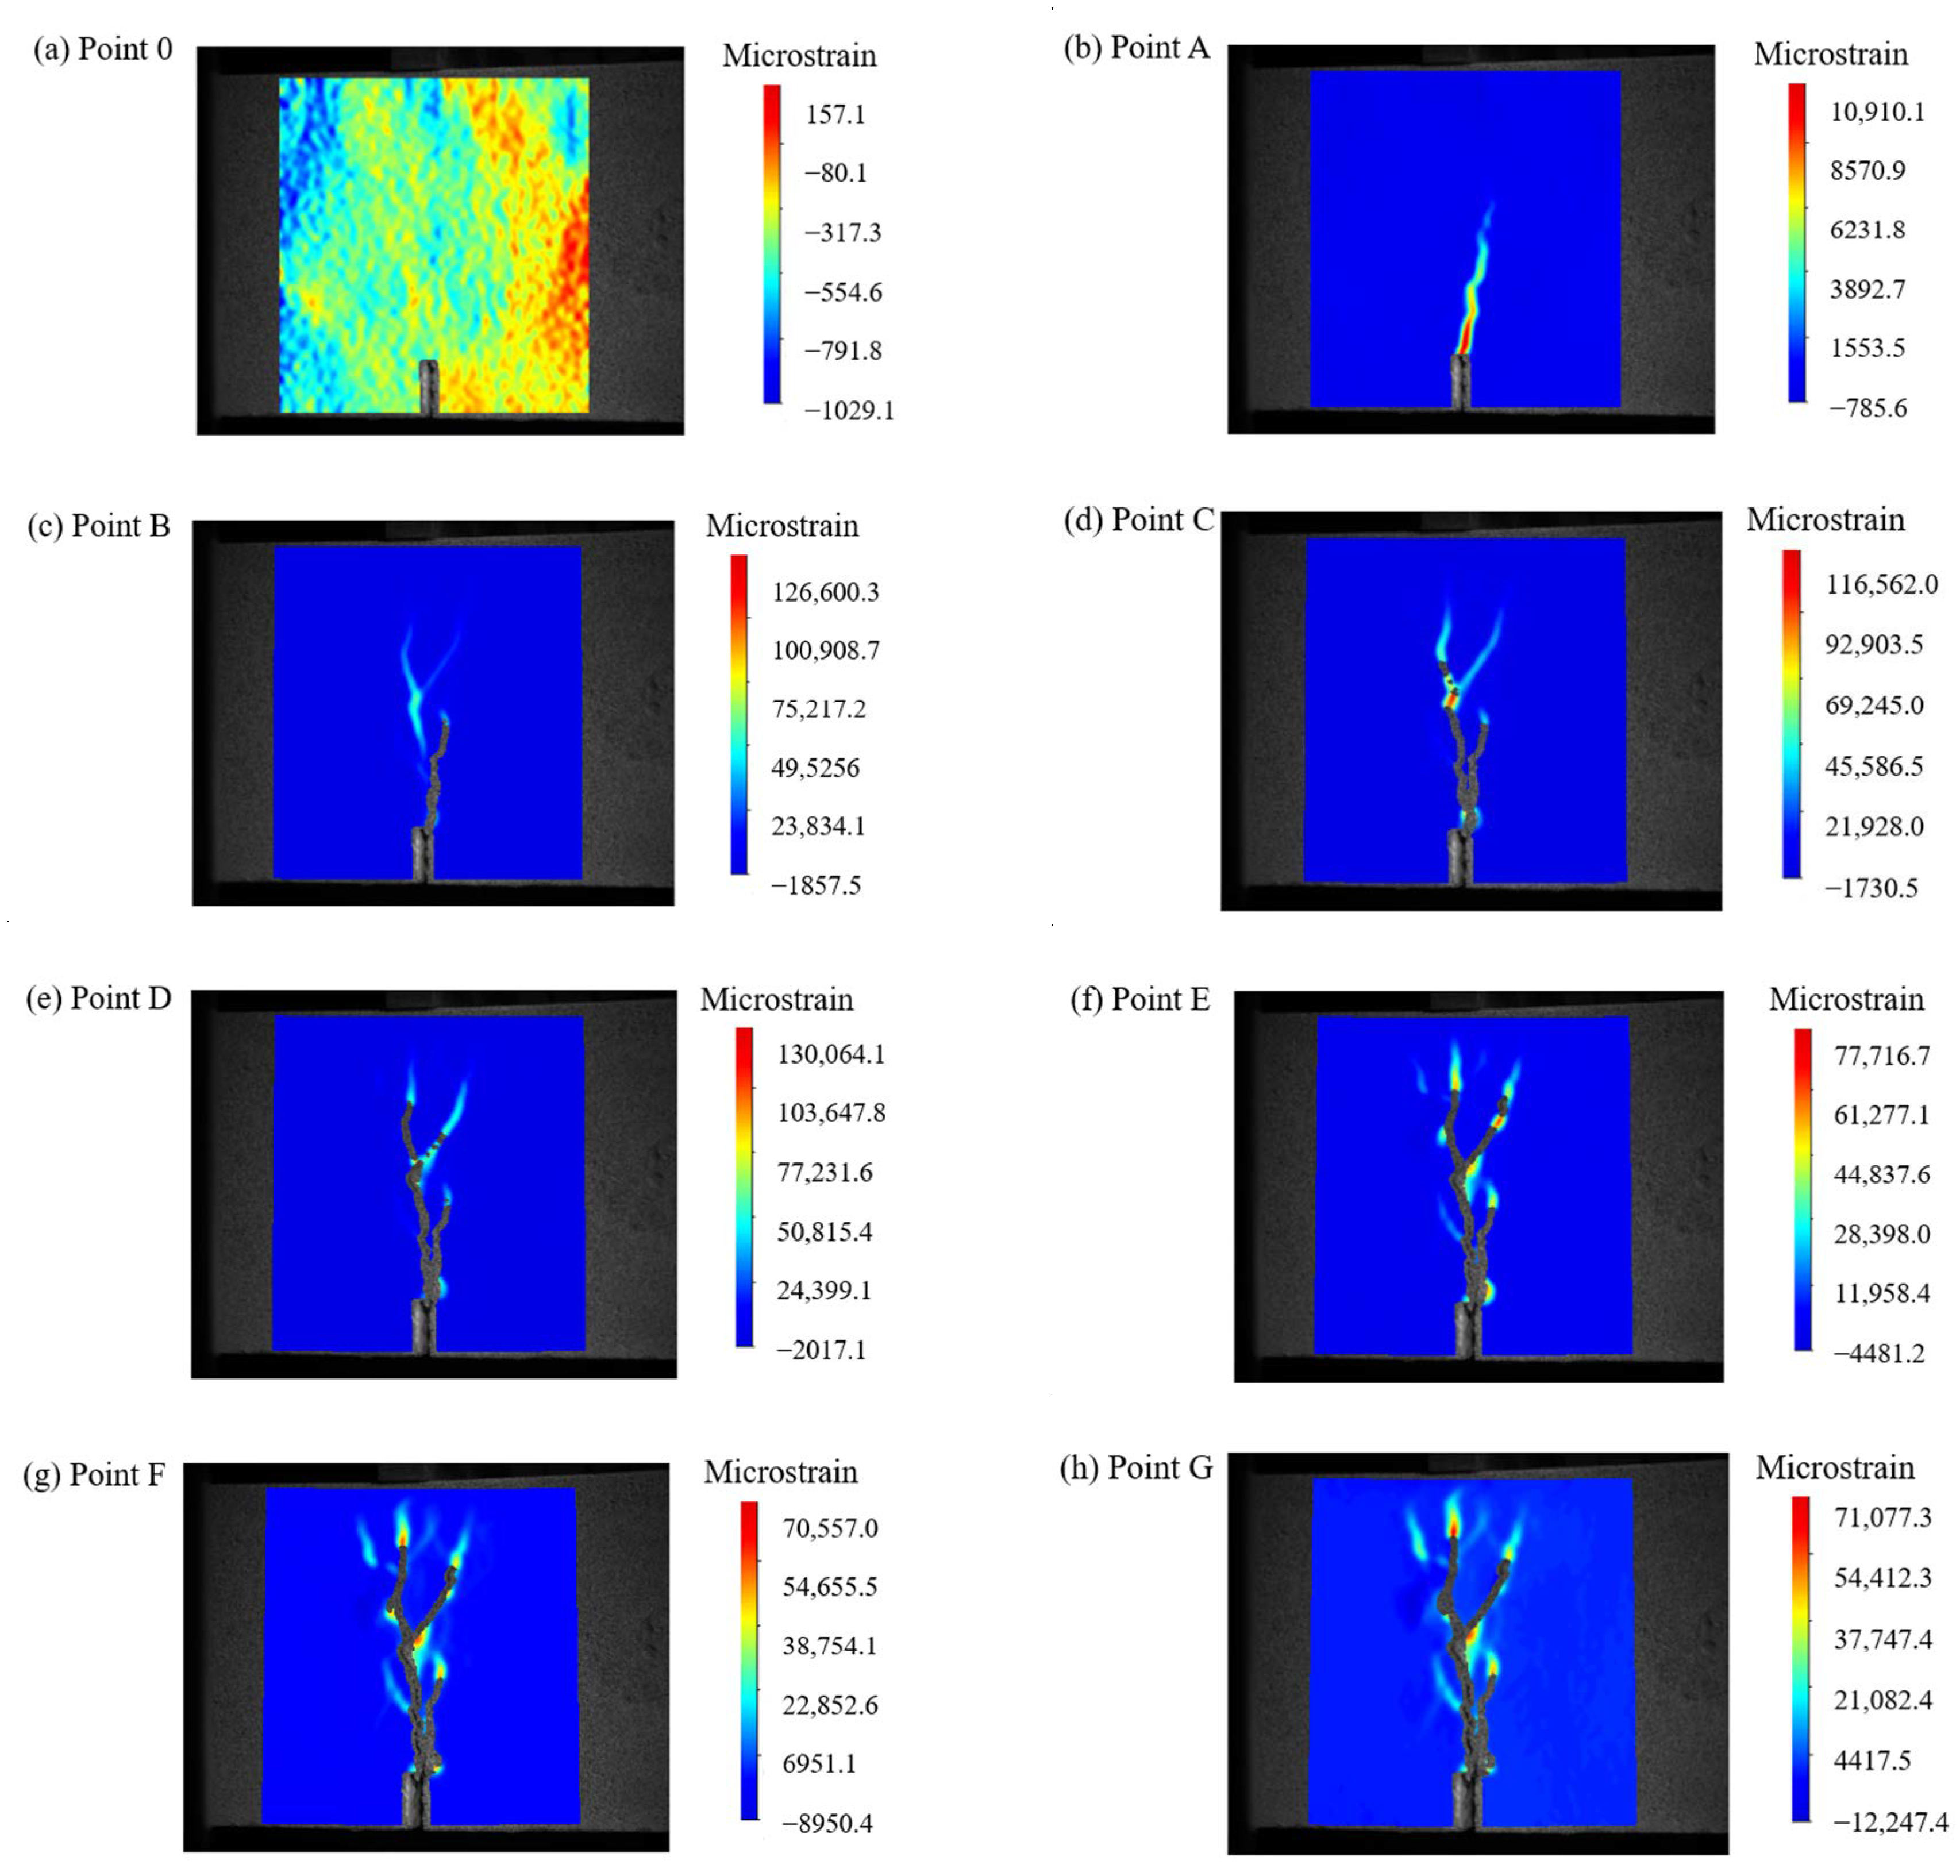
- (2)
- The addition of steel fibers delayed the development of cracks in the concrete specimens. It also increased the maximum micro-strain at the crack tip. However, the presence of steel fibers resulted in multiple cracks, as they altered the crack propagation direction. This led to an increase in the ductility of the concrete specimens.
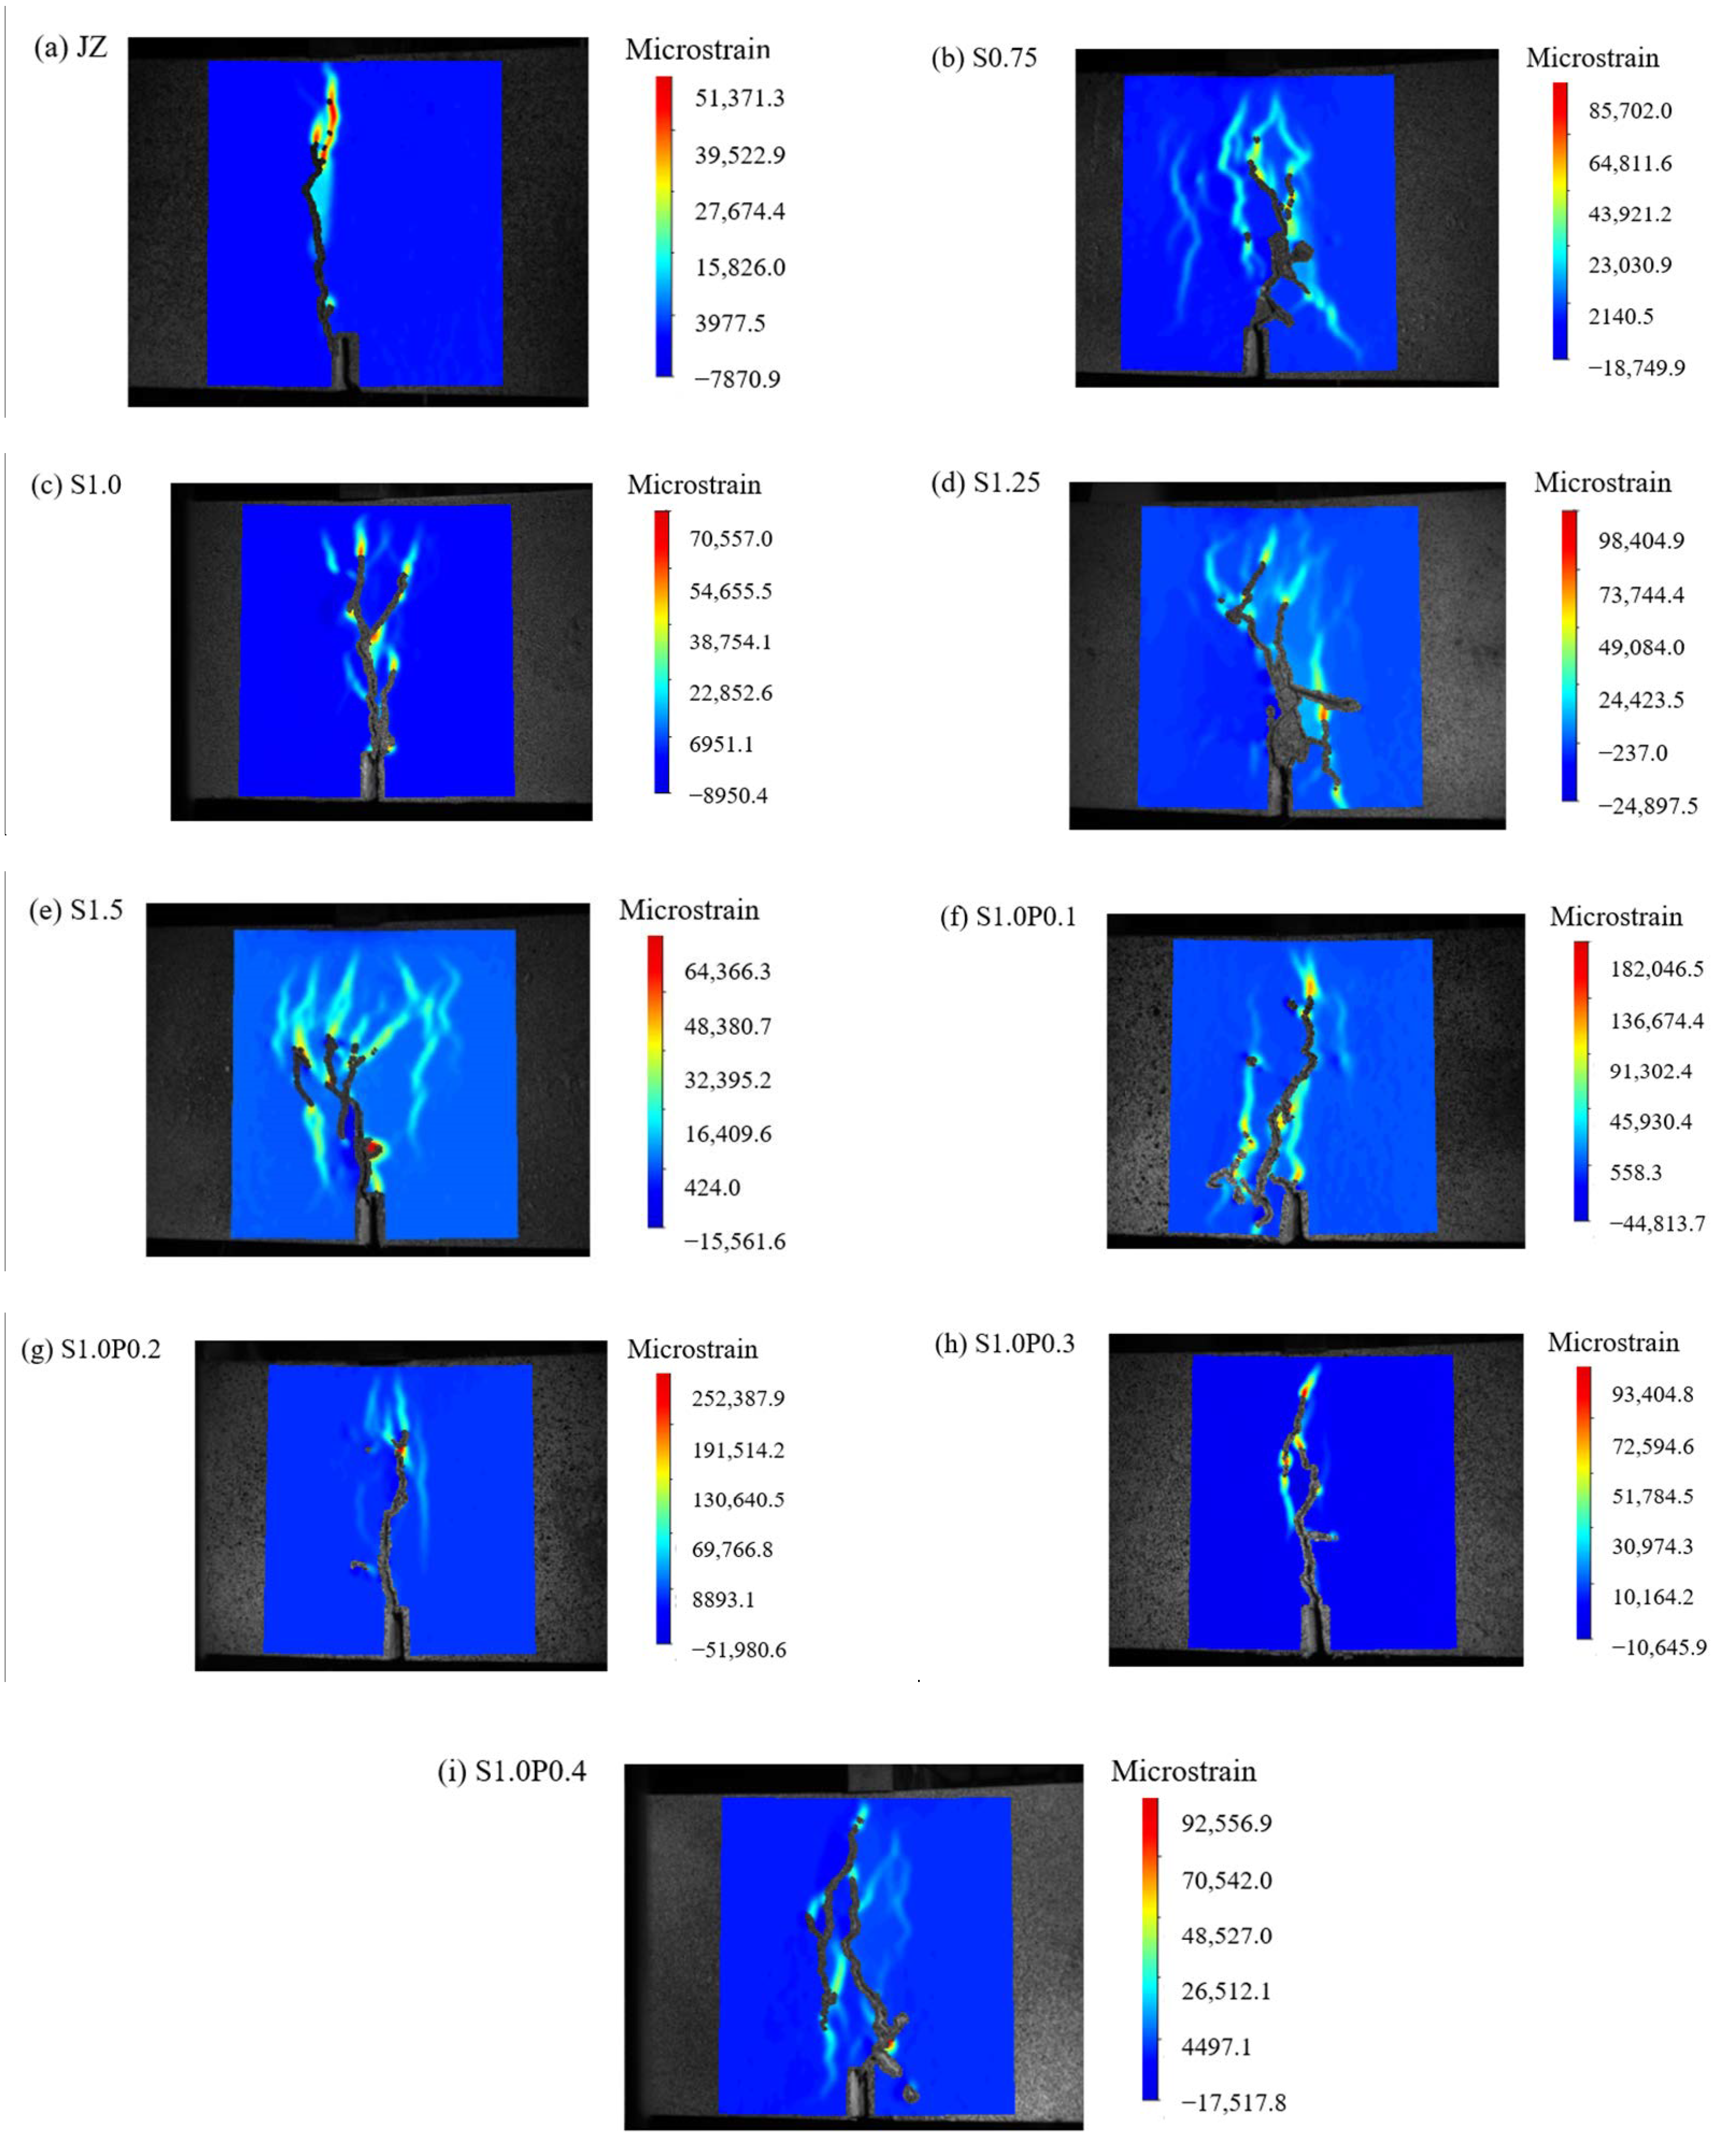
- (3)
- In comparison to SFRC, S-PVA HFRC showed a reduction in the number and area of cracks. The addition of PVA fibers in addition to steel fibers increased the maximum micro-strain in the SFRC. The PVA fibers limited the development of micro-cracks in the SFRC, enhanced the resistance to steel fiber pull-out, and further decreased the crack area in the concrete.
3.2. Concrete F-CMOD Curves
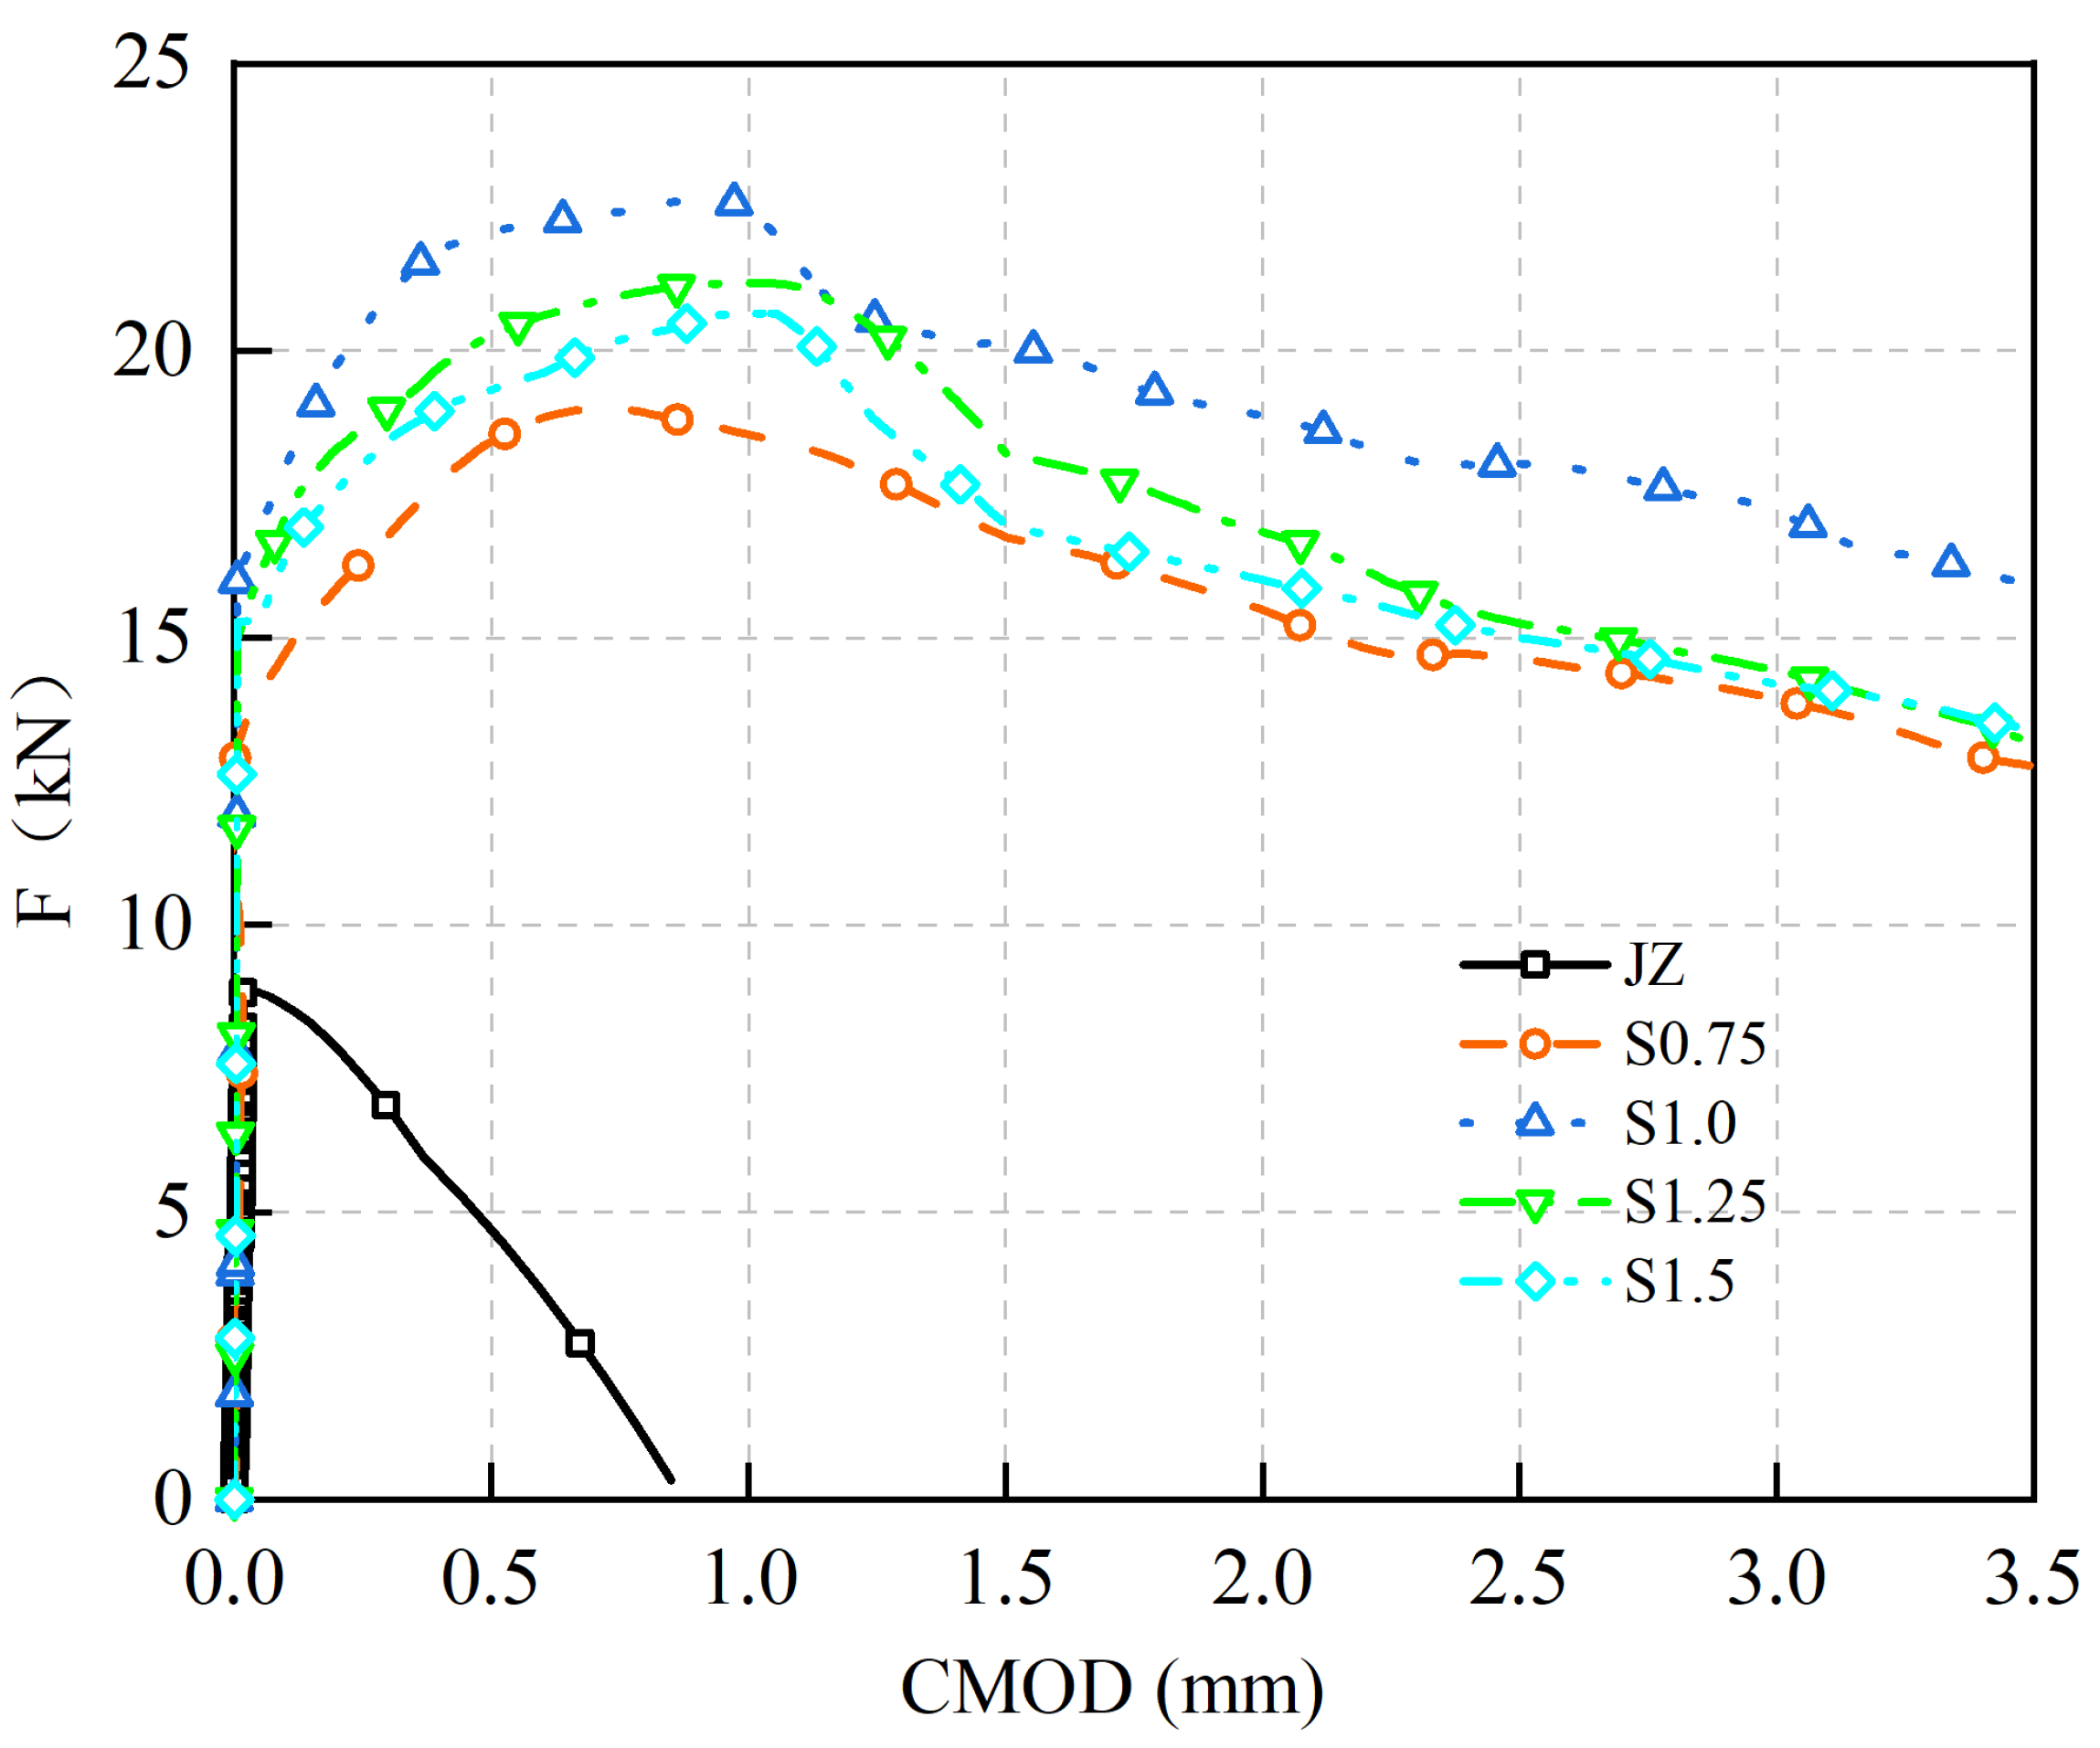
3.2.1. SFRC F-CMOD Curves
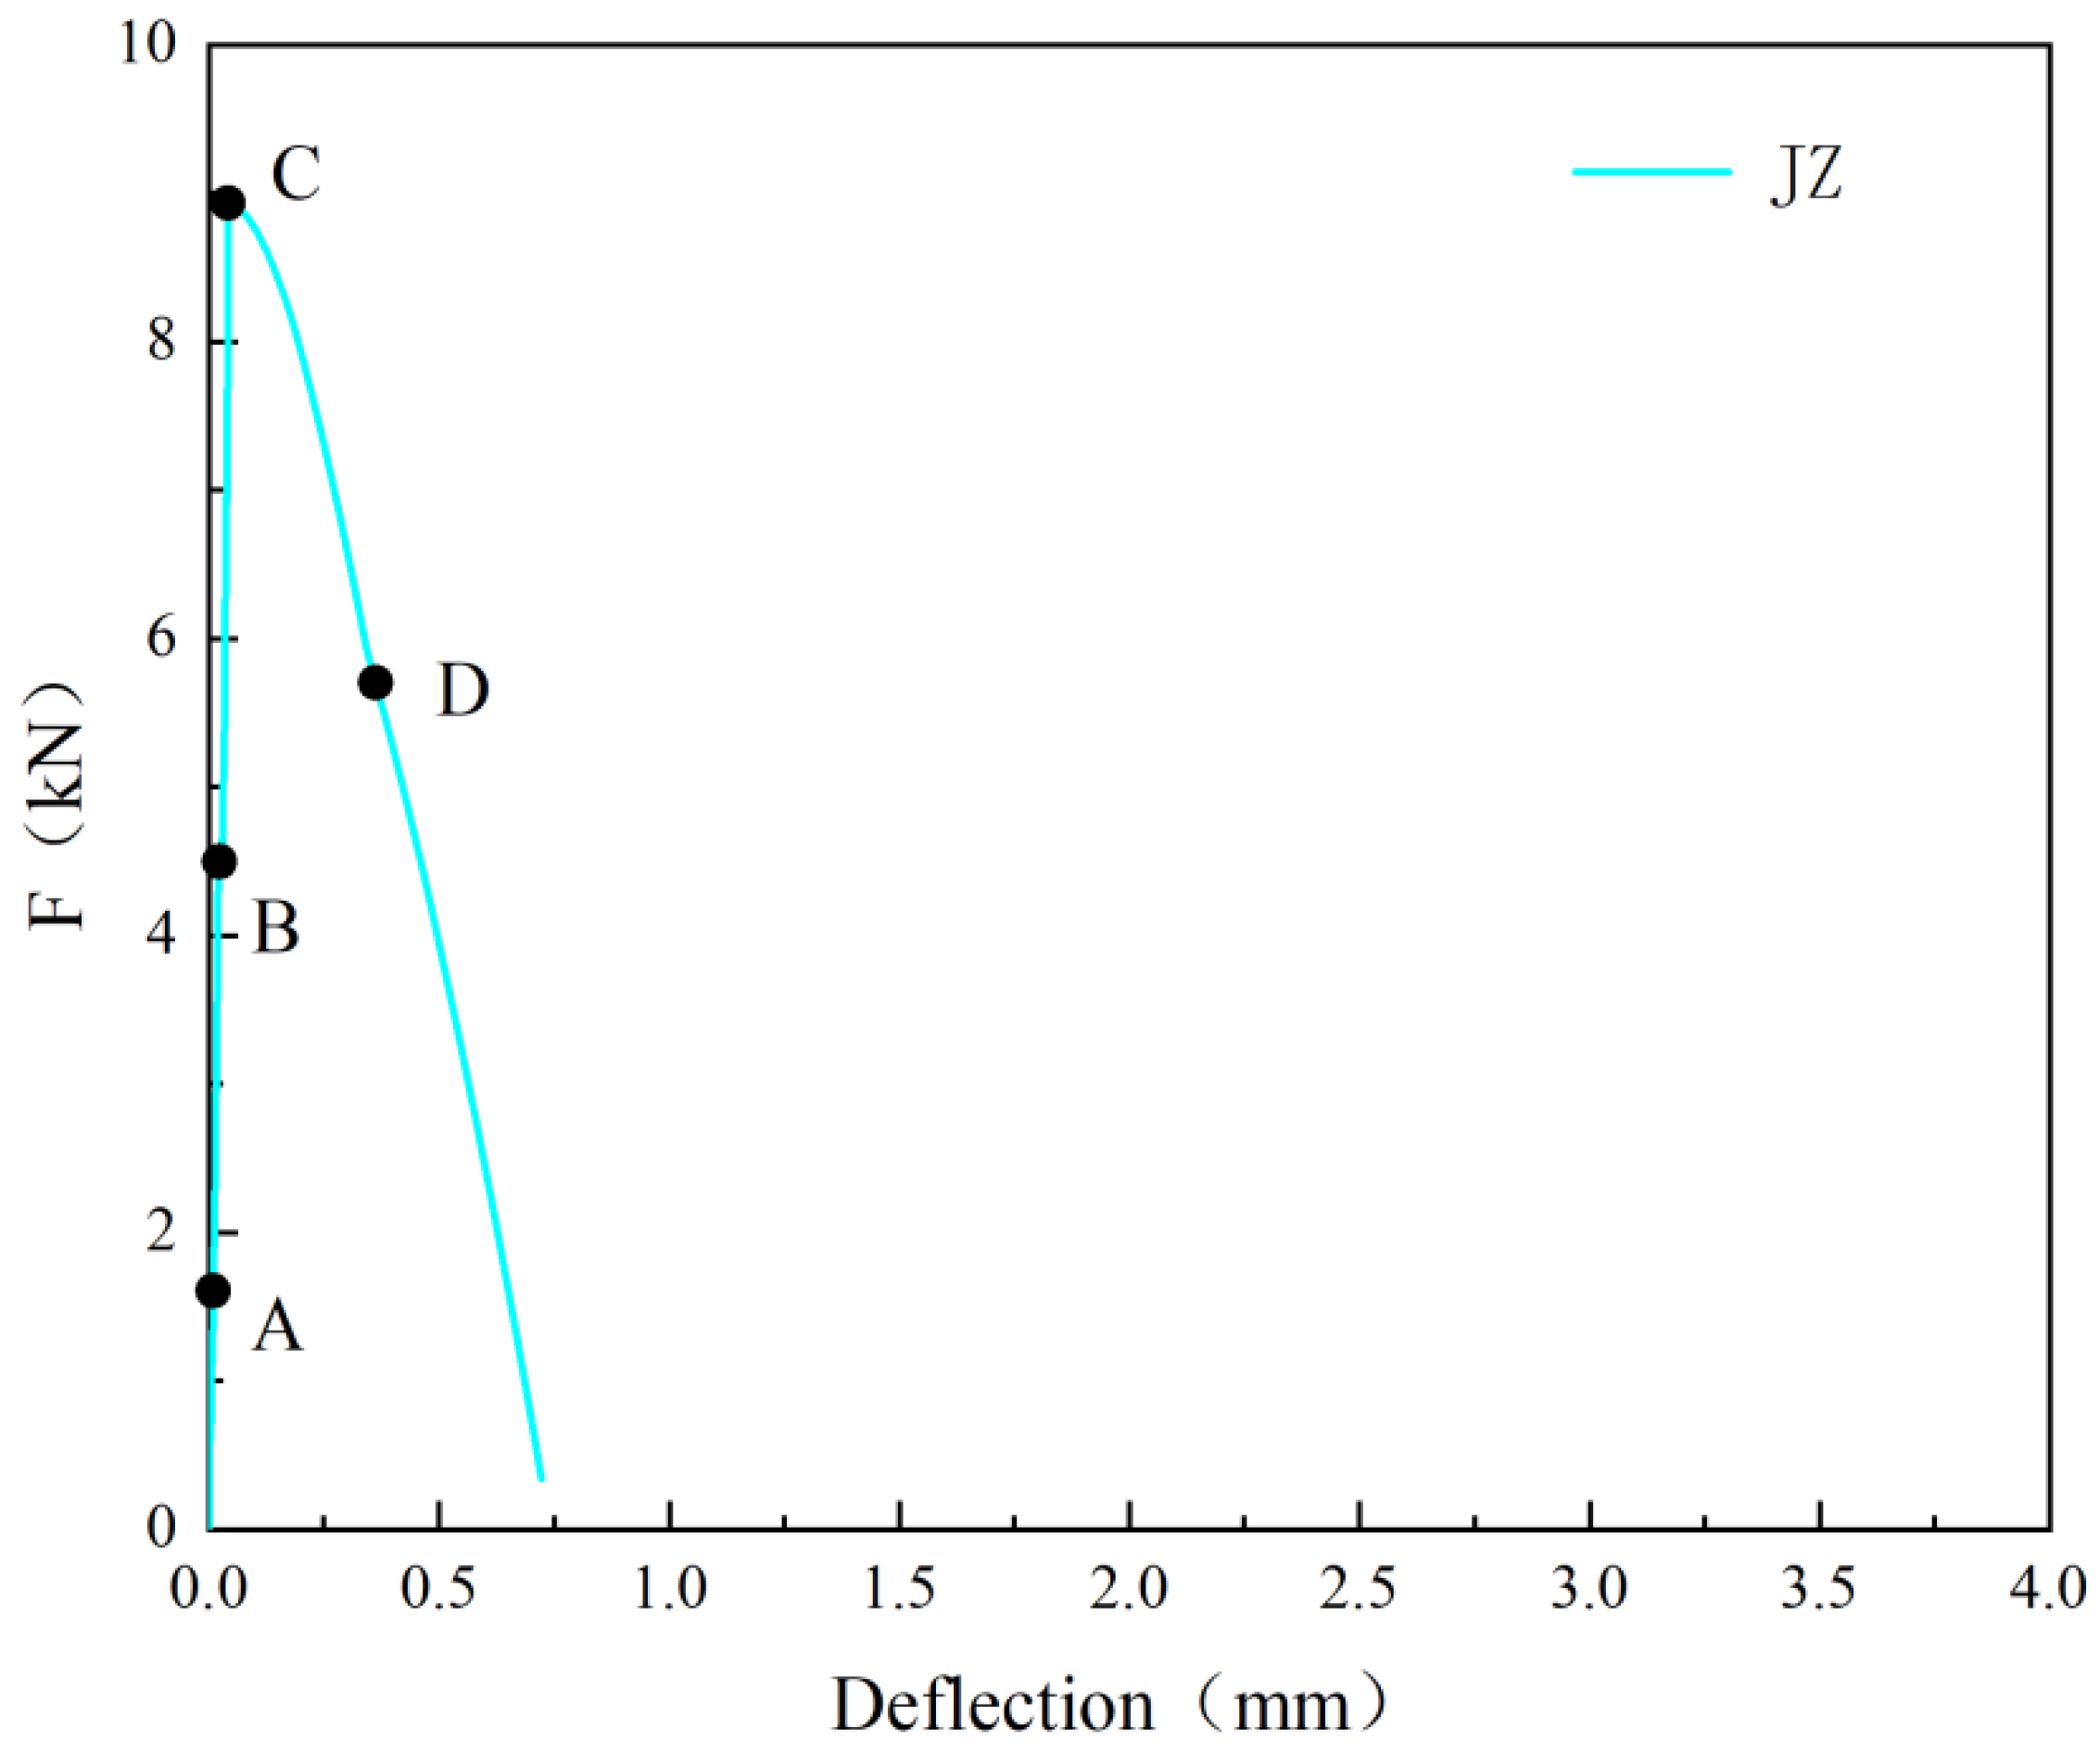
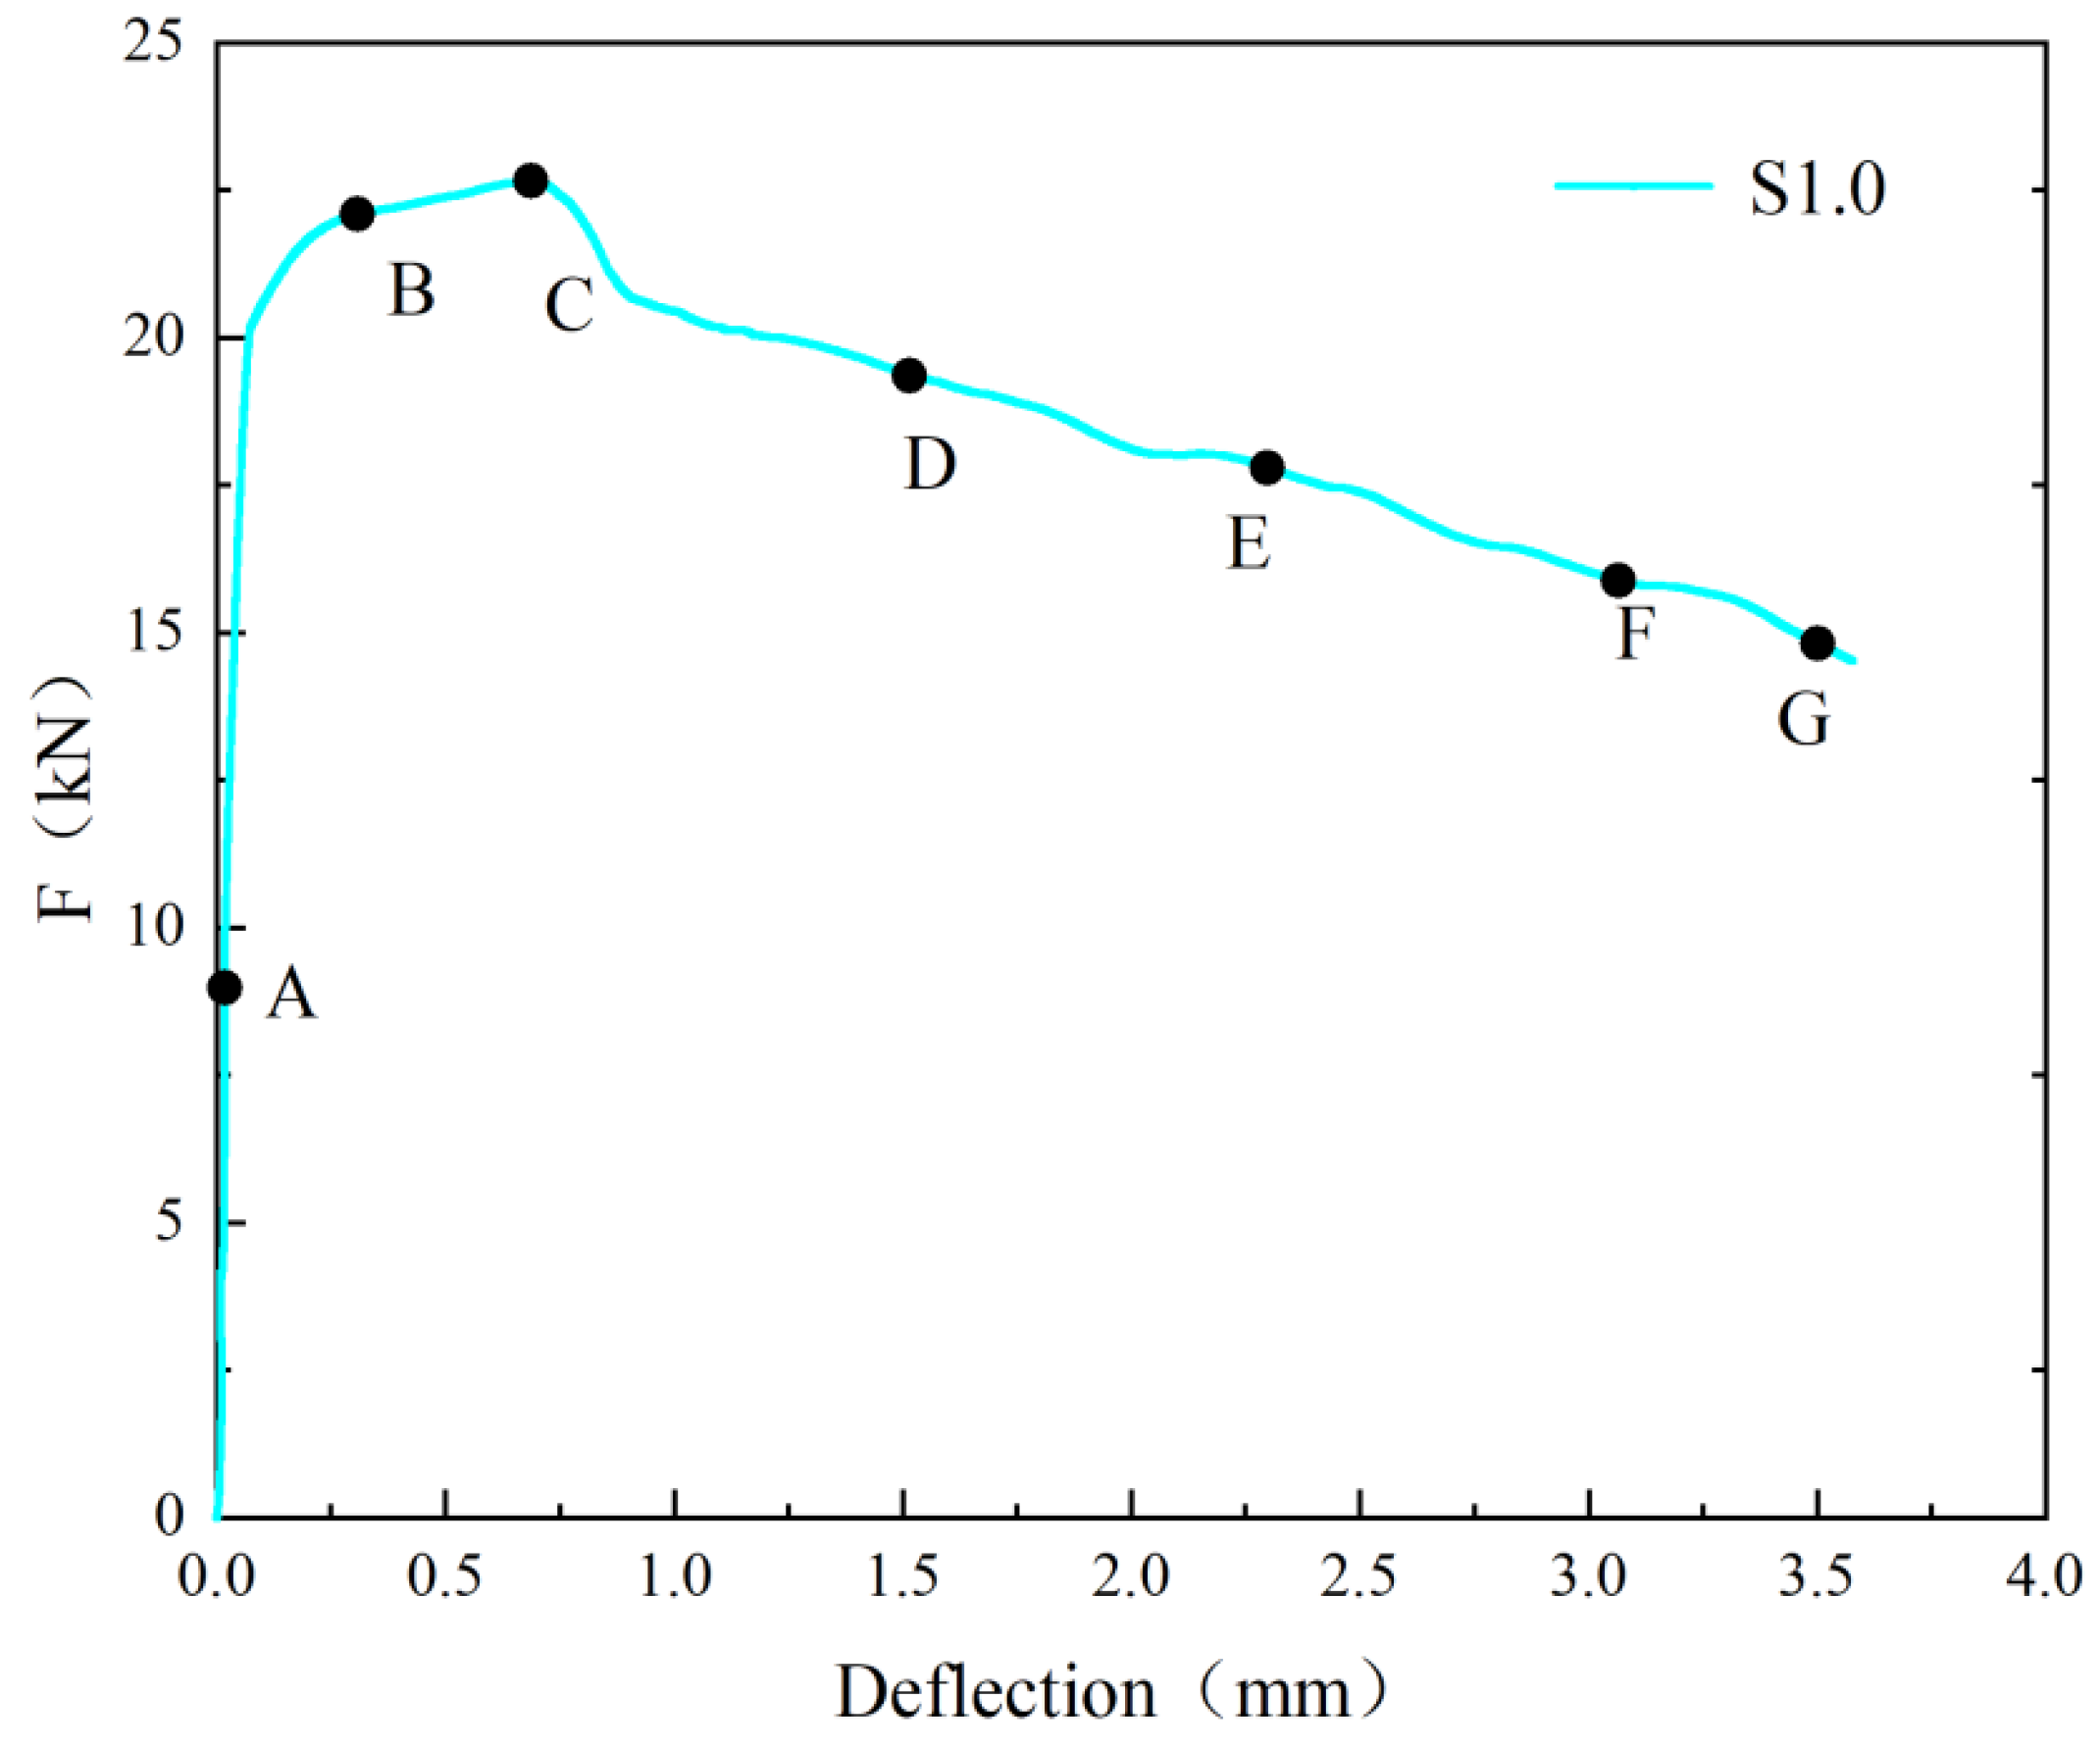
- (1)
- F increases approximately linearly with CMOD until the concrete cracks.
- (2)
- The F-CMOD curve of the reference concrete specimen without steel fibers rapidly decreases after reaching its peak F as CMOD increases.
- (3)
- Adding steel fibers not only enhances the of concrete but also leads to a smoother descending segment and a fuller curve of the F-CMOD relationship. As the of steel fibers increases, the of concrete and the enveloping area of the F-CMOD curve initially increase and then decrease. The maximum values are achieved at a steel fiber dosage of 1.0%, with an of 7.25 MPa. Compared to the reference concrete without steel fibers, the increased from 2.86 MPa to 7.25 MPa, representing a 153% improvement.
3.2.2. S-PVA HFRC F-CMOD Curve
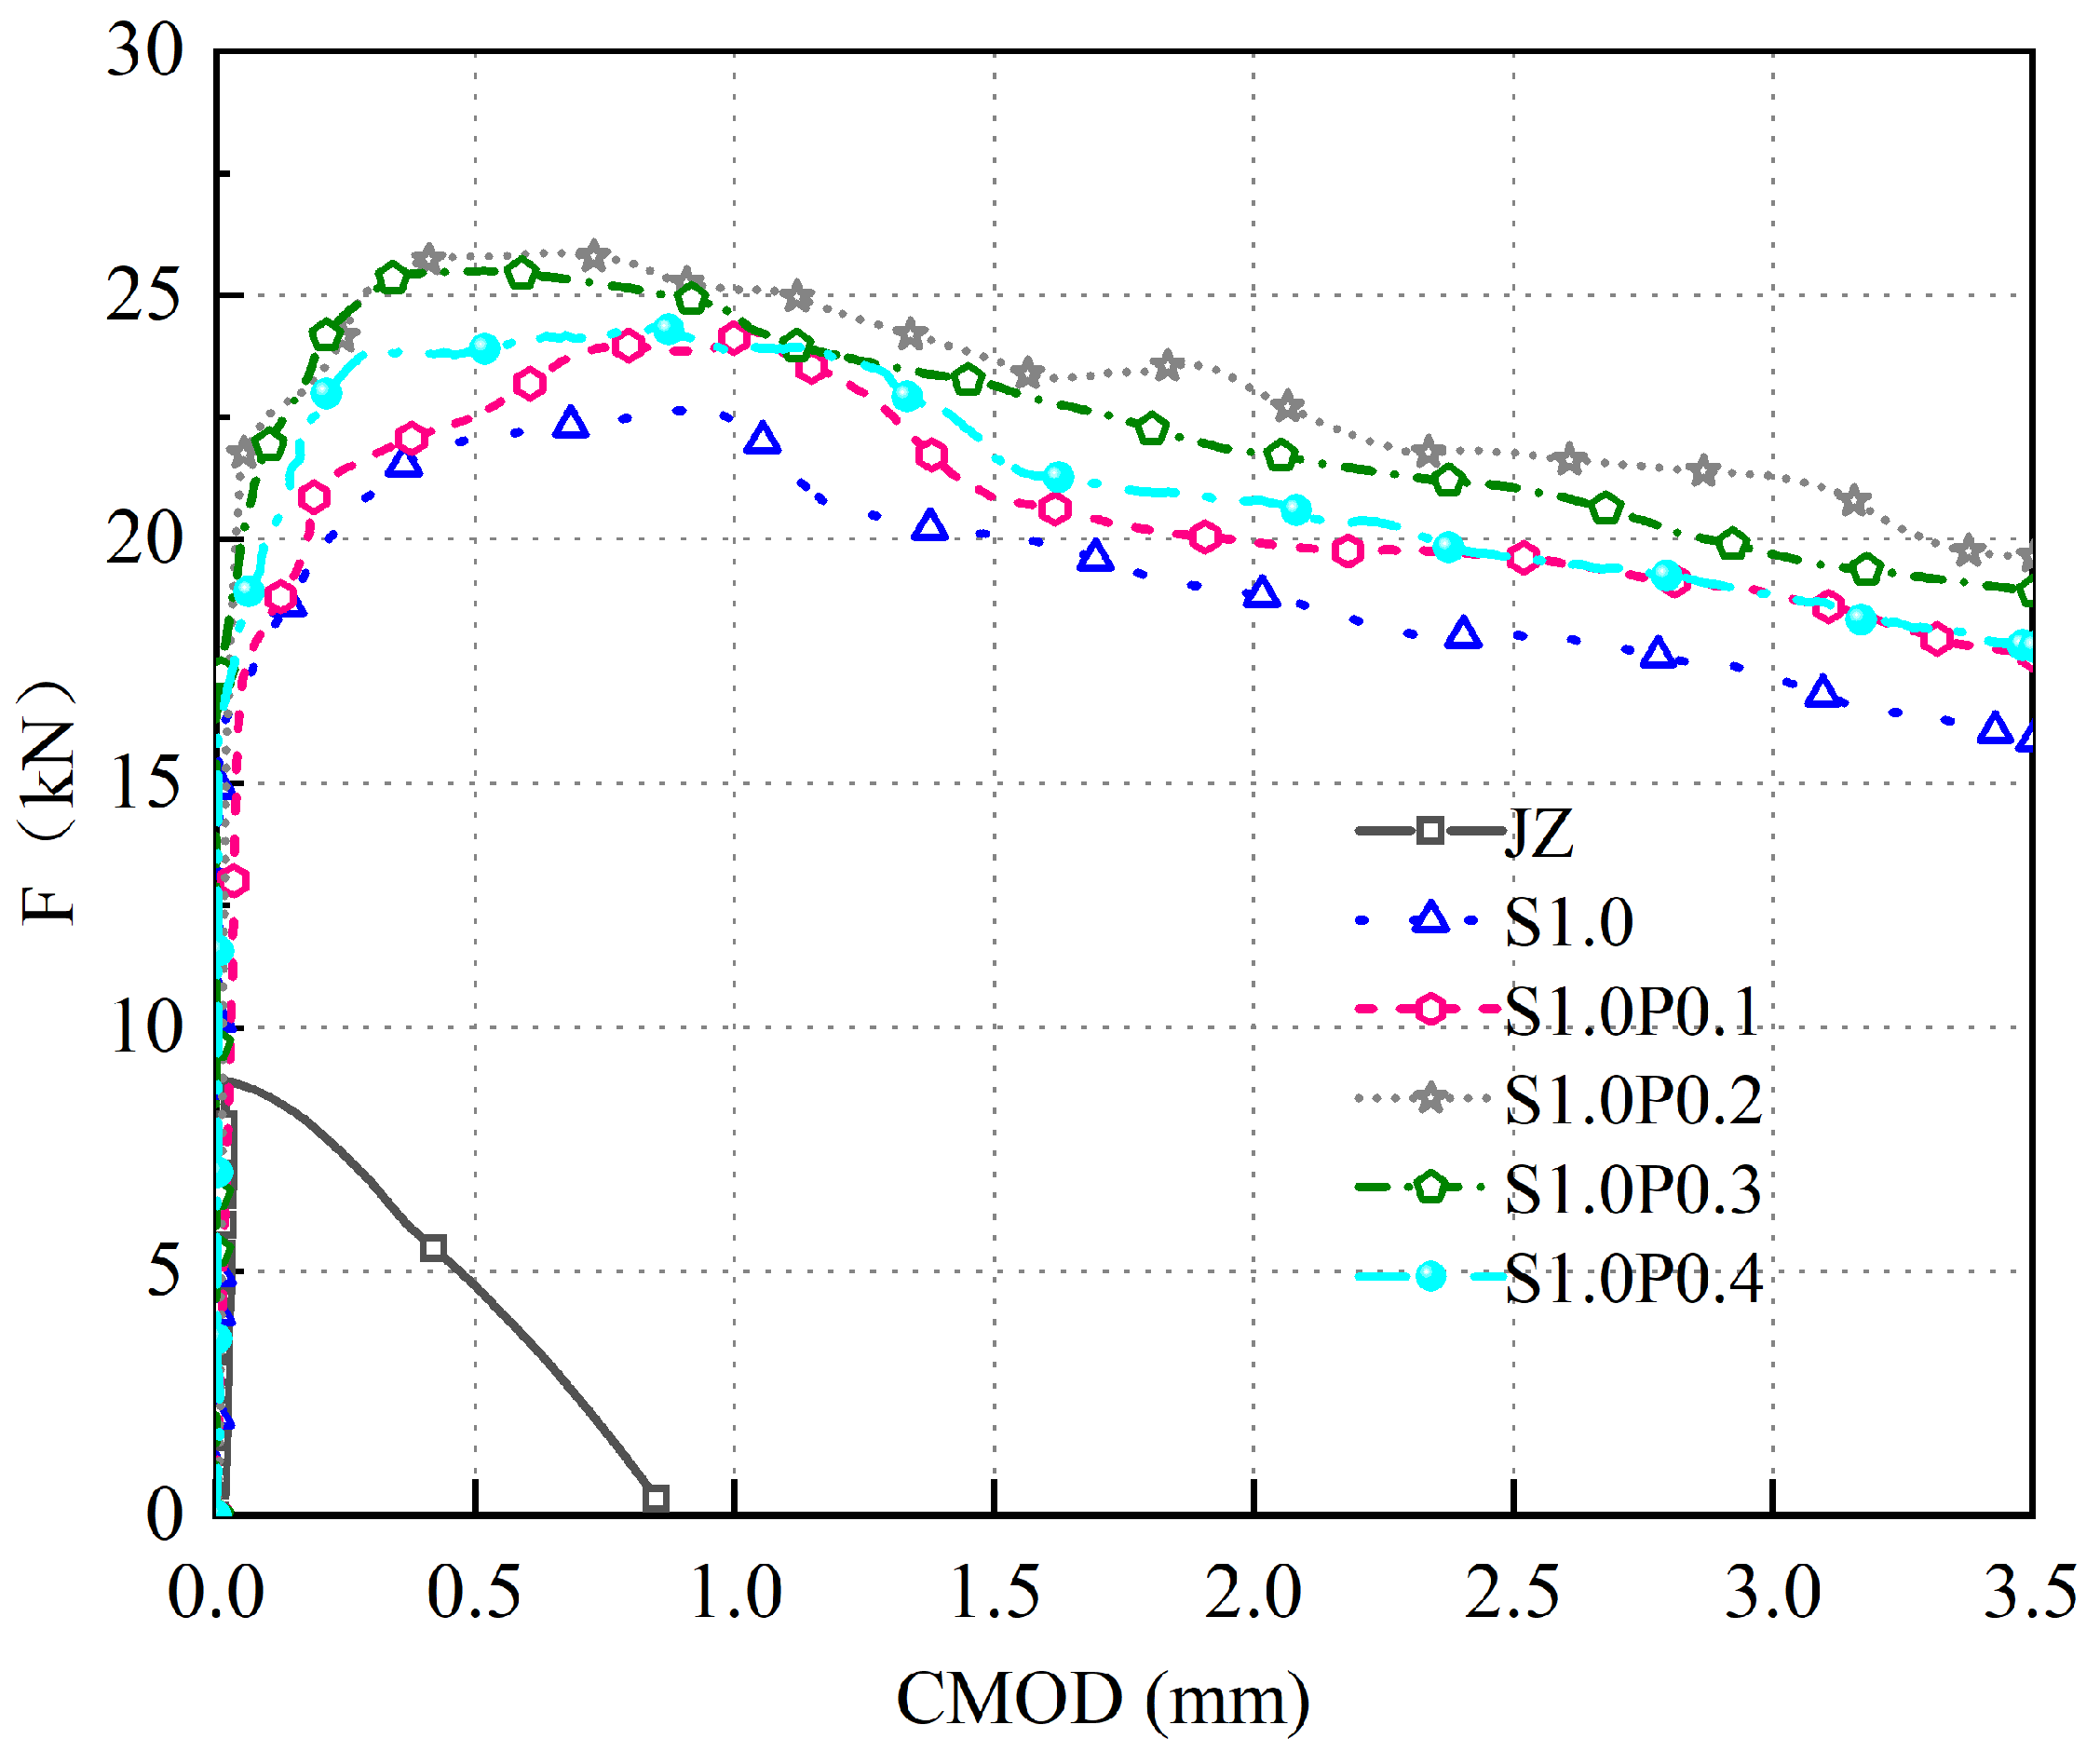
- (1)
- The S-PVA HFRC exhibits a linear increase in F with the increase in CMOD during the early cracking stage.
- (2)
- PVA fibers further enhance the and the enveloping area of the F-CMOD curve in SFRC. When the PVA fiber increases from 0.1% to 0.4%, the of S-PVA HFRC initially increases and then decreases. At 1.0% of steel fibers and 0.2% of PVA fibers, the S-PVA HFRC exhibits the highest . Compared to concrete with 1.0% steel fiber , the is increased from 7.25 MPa to 8.28 MPa, representing a 14.2% improvement.
- (3)
- These results indicate that S-PVA HF can improve the of SFRC. The inclusion of PVA fibers increases the compactness of the matrix and enhances the pull-out resistance of the steel fibers within the cement matrix. The hybrid effect of S-PVA HF significantly improves the of SFRC. However, excessive PVA fiber content will lead to the aggregation of steel fibers and PVA fibers, resulting in reduced and ductility of S-PVA HFRC.
3.3. Concrete Bending Strength
3.3.1. SFRC
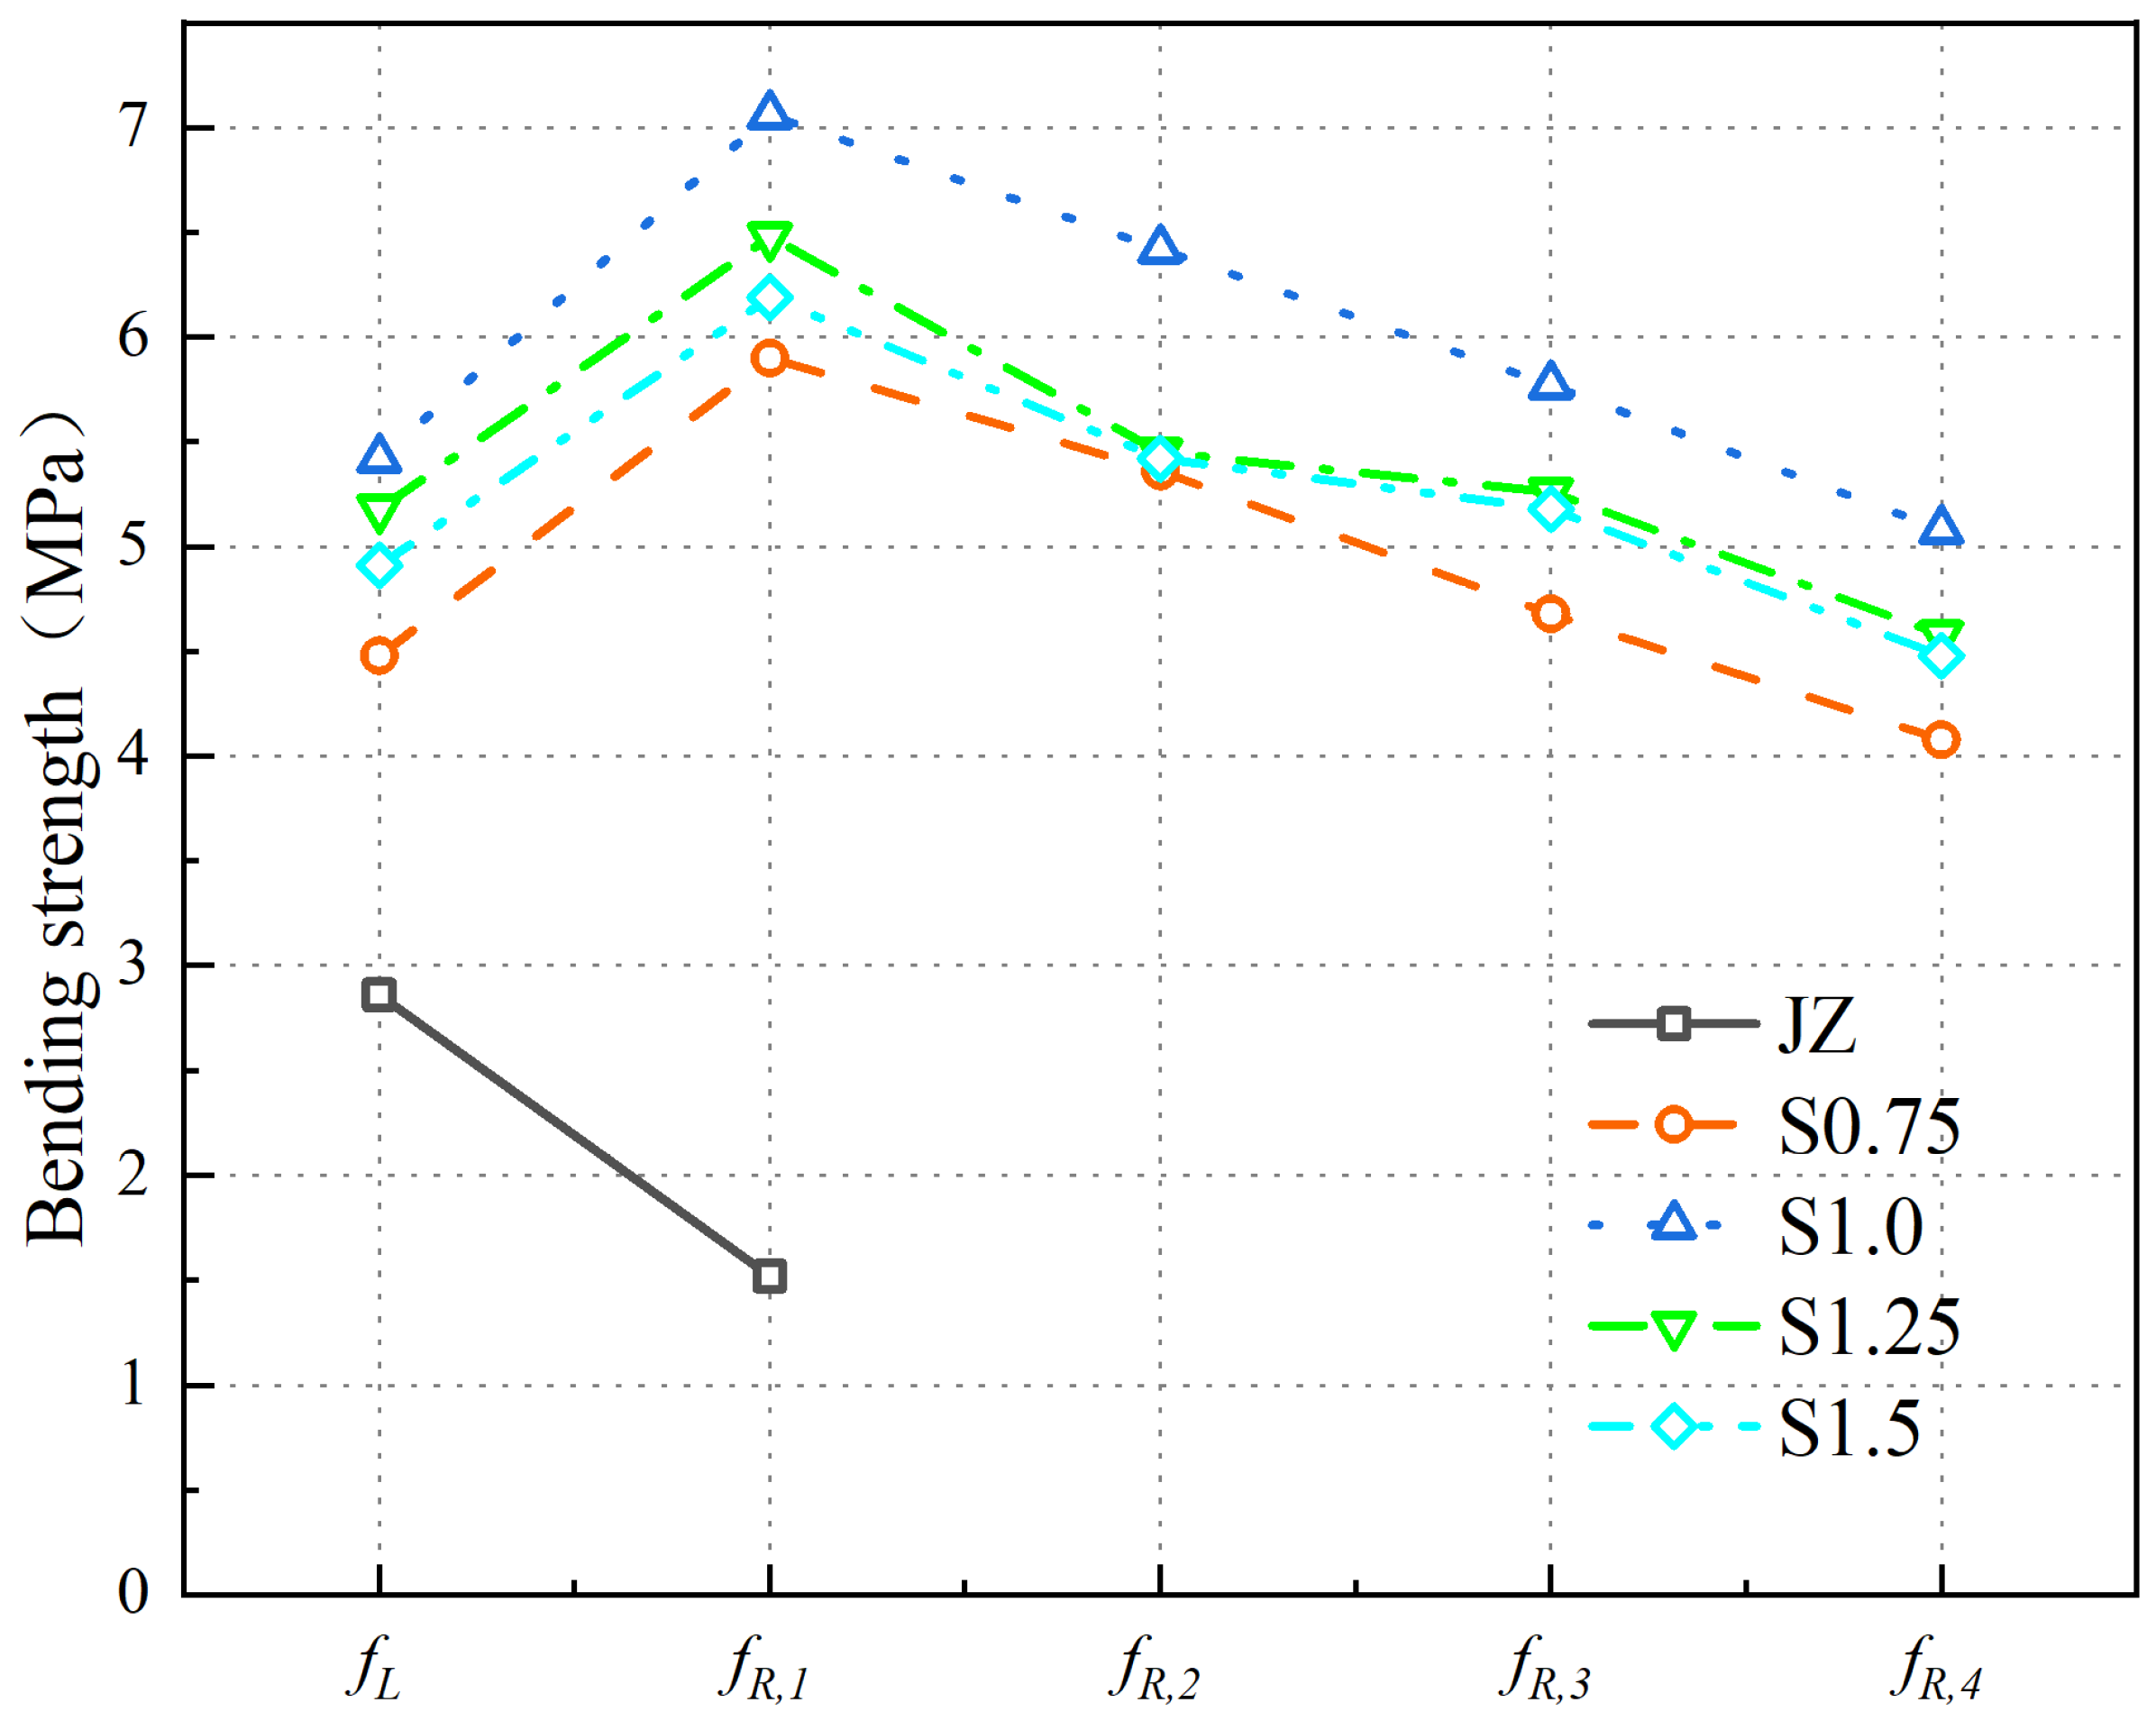
- (1)
- With an increase in steel fiber , initially increases and then decreases. The of SFRC is maximum at a steel fiber of 1.0%. Compared to the plain concrete, the value increases from 2.86 MPa to 5.64 MPa, resulting in a 97.2% improvement.
- (2)
- The of the reference concrete is only , with a strength value of 1.52 MPa. There are no , , or values for the reference concrete. When the steel fiber ranges increase to 1.5%, the values of , , , and initially increase and then decrease, with the maximum values achieved at a 1.0% steel fiber .
- (1)
- An appropriate amount of steel fibers improves the compactness of the concrete matrix and enhances its strength, thereby increasing the of the concrete.
- (2)
- Due to the brittle nature of the plain concrete, after reaching the , F rapidly decreases with increasing CMOD, resulting in the reference concrete having only as its . In the case of SFRC, as the steel fiber increases to 1.0%, more steel fibers participate in crack arrest, leading to an increase in the of the concrete. However, when the steel fiber exceeds 1.0%, an excessive amount of steel fibers can cluster together and fail to effectively contribute to crack arrest, resulting in a reduction in the of the concrete.
- (1)
- Some scholars found that for C40 concrete specimens, as the 3D steel fiber content increased to 110 kg/m3, also increased, reaching its maximum at 70 kg/m3. Relevant scholars found that as the steel fiber increased to 1.5%, showed an increased trend and did not find the optimal steel fiber to increase . The reason for the difference in this study may be that concrete is different, and the optimal range of steel fiber that affects the of concrete is different.
- (2)
- For steel fiber to improve the of concrete, it was found that as the steel fiber content increased to 110 kg/m3, the increase in and of steel fiber concrete was also greater than and , but they did not find the best to improve the of concrete.
3.3.2. S-PVA HFRC
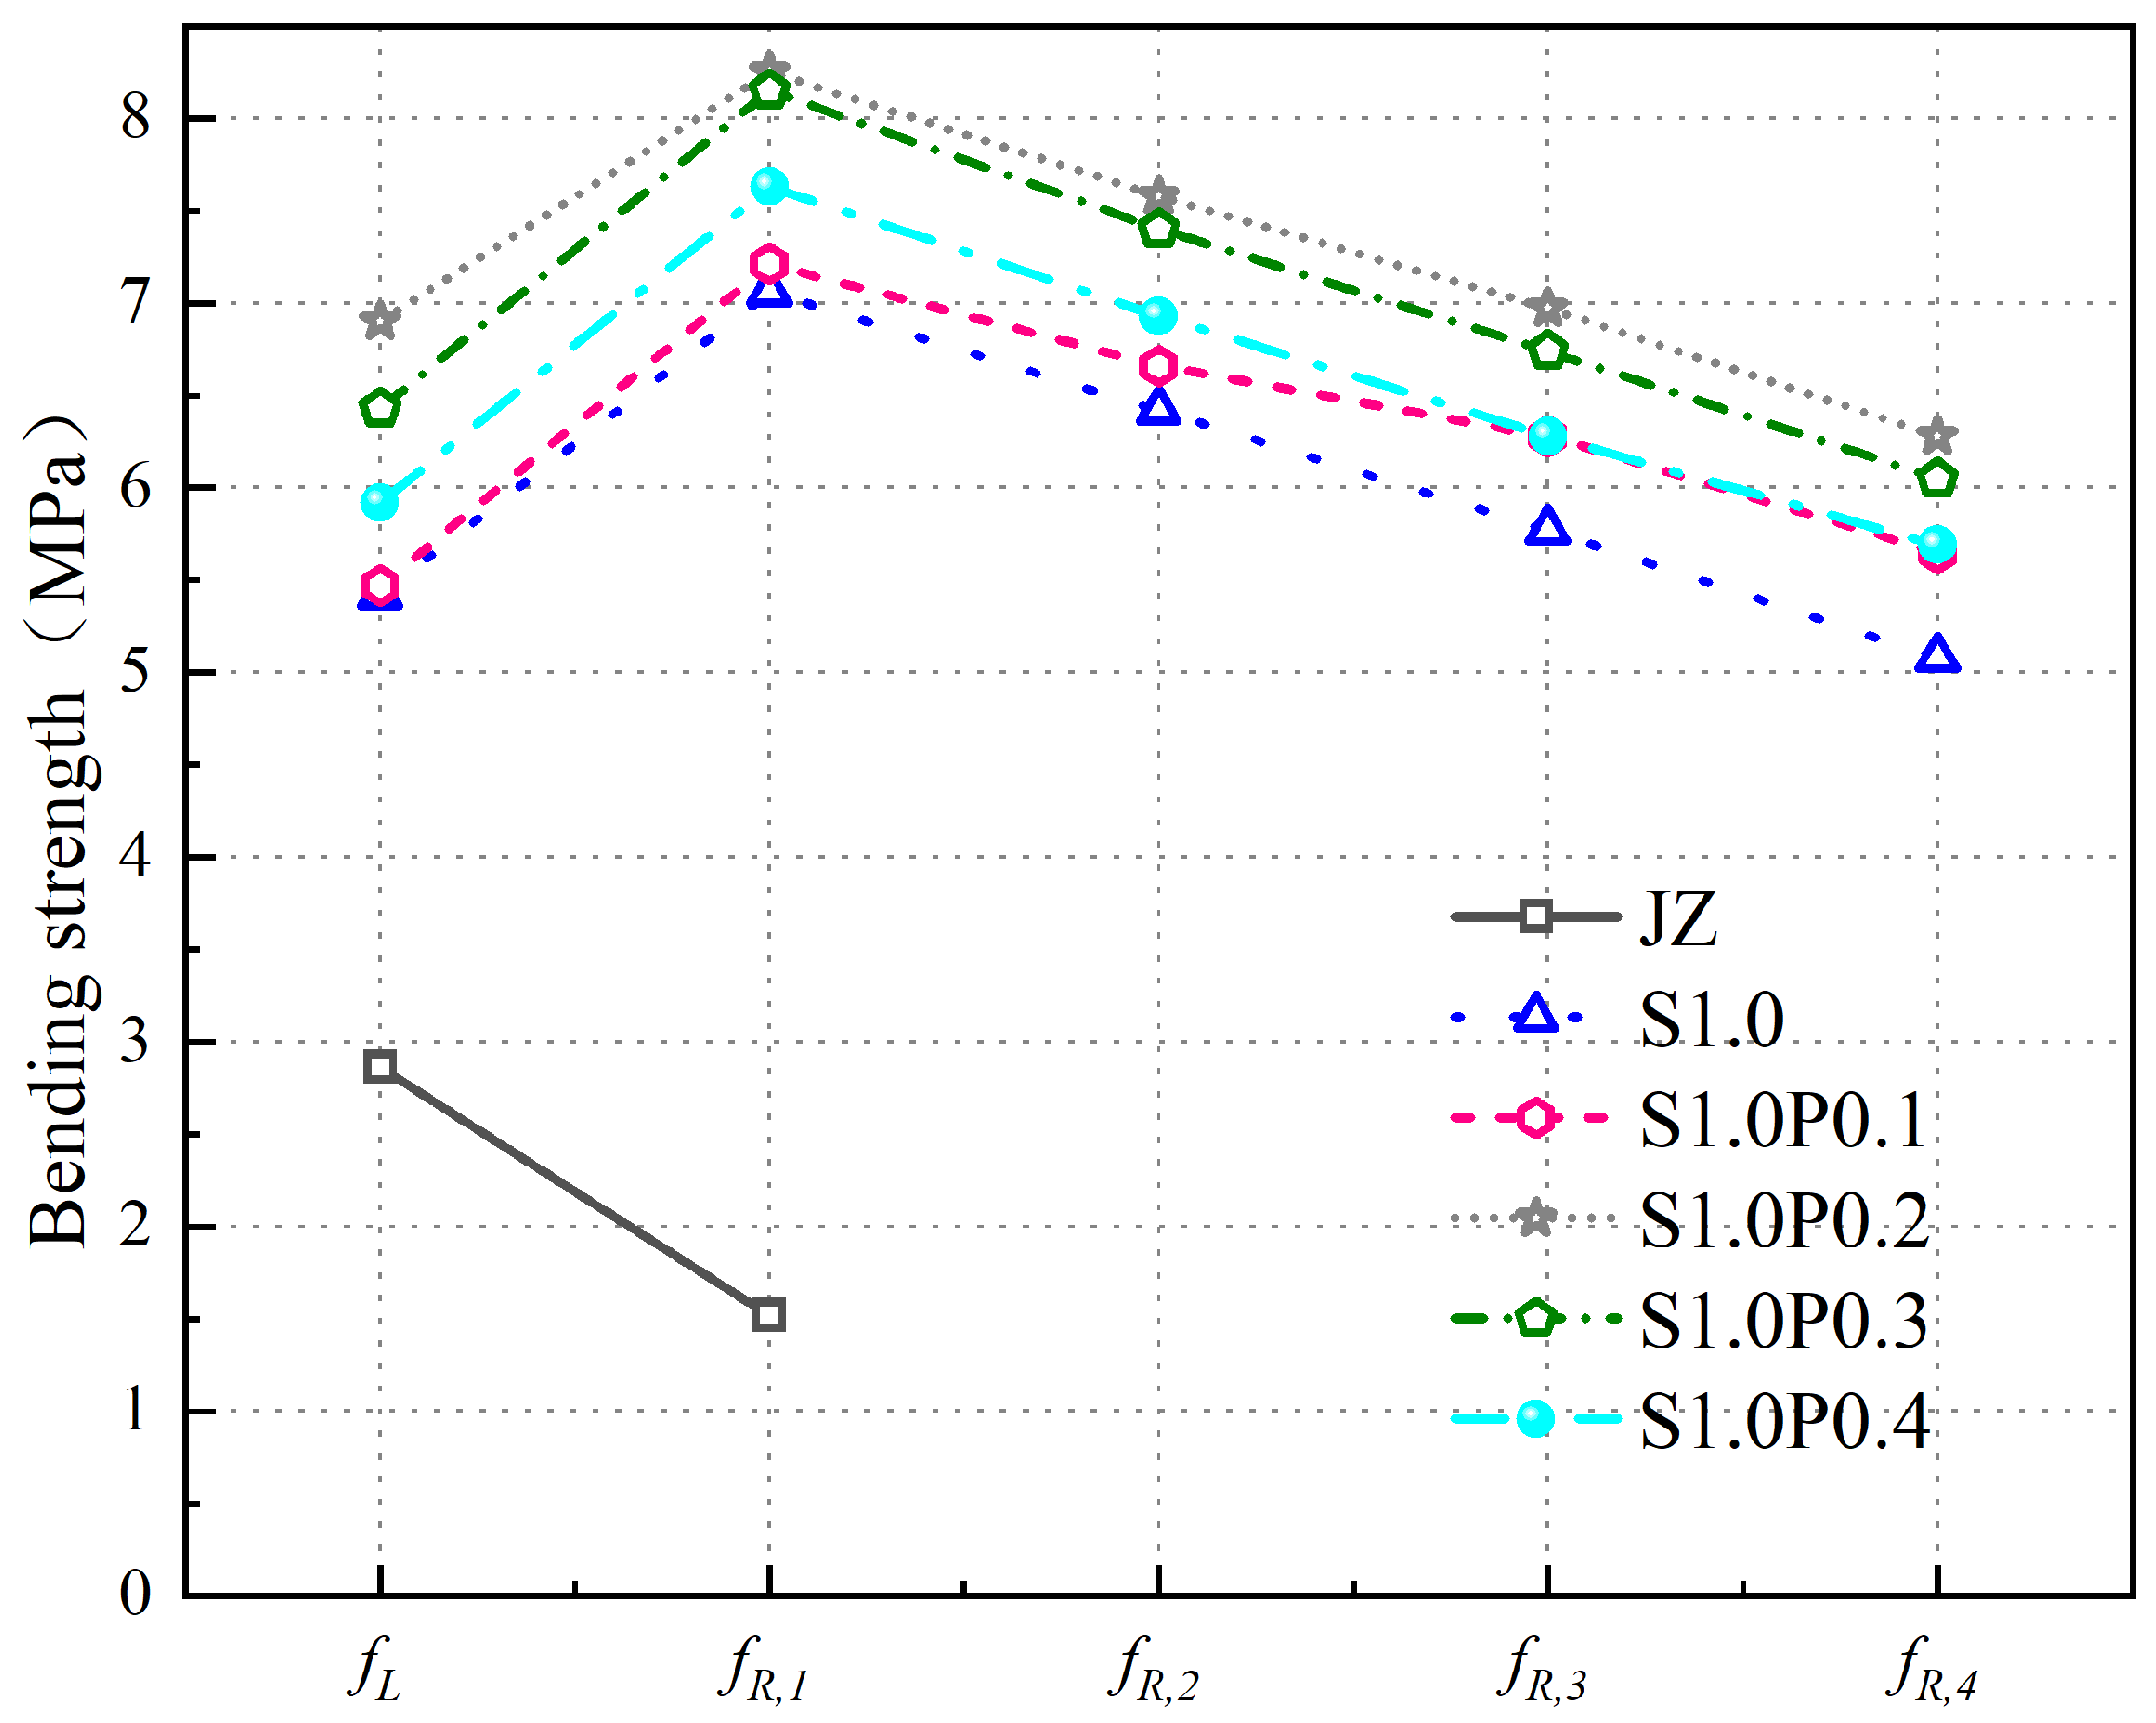
- (1)
- PVA fibers further increase the of SFRC. Compared with the of S1.0, the of S1.0P0.1, S1.0P0.2, S1.0P0.3, and S1.0P0.4 increased to 5.67 MPa, 6.90 MPa, 6.43 MPa, and 5.92 MPa, increasing by 0.5%, 22.3%, 14.0%, and 5.0%. The degree of improvement first increased and then decreased.
- (2)
- The of S-PVA HFRC is greater than , , and .
- (3)
- With the increase in PVA fiber , the of S-PVA HFRC first increases and then decreases. The of S1.0P0.2 is the largest. Compared with the of S1.0, the increase in , , , and is higher.
- (1)
- The is mainly influenced by the strength of the concrete. Before reaching the proportional ultimate load, cracks first appear at the crack tip of the prefabricated incision of the concrete. Due to the reduction in the porosity of the concrete and the improvement in the density of the concrete matrix by the PVA fibers in the S-PVA HF, the generation and development of microcracks are restricted at the crack tip, which increases the of the concrete. However, as the PVA fiber is too high, the phenomenon of agglomeration between steel fibers and PVA fibers reduces the workability of concrete, thereby affecting the strength of the concrete matrix and reducing the of the concrete.
- (2)
- The , , , and of S-PVA HFRC, compared with the of concrete with 1.0% steel fiber content, increases because the multi-stage crack resistance of S-PVA HF helps to improve the load of concrete after the , and improve the ductility and toughness of concrete. At the same time, PVA fiber increases the pulling resistance of steel fiber while strengthening the density of the concrete matrix. The hybrid effect of steel fibers and PVA fibers further increases energy dissipation; therefore, especially in the , and stages, the degree of improvement is significantly higher than and .
- (3)
- At the same time, it is found that steel fiber has a greater effect on the and of concrete than PVA fiber. Compared with the benchmark concrete, the of concrete with 1.0% steel fiber increased by 2.56 MPa, increased by 5.54 MPa, the fL of concrete with 1.0% steel fiber and 0.2% PVA fiber increased by 0.98 MPa, and the increased by 1.19 MPa, compared with concrete with 1.0% steel fiber. In terms of , steel fibers have a more significant lifting effect on concrete than PVA fibers, but PVA fibers also play a crucial role.
3.4. Microstructure Analysis of Concrete
3.4.1. SFRC
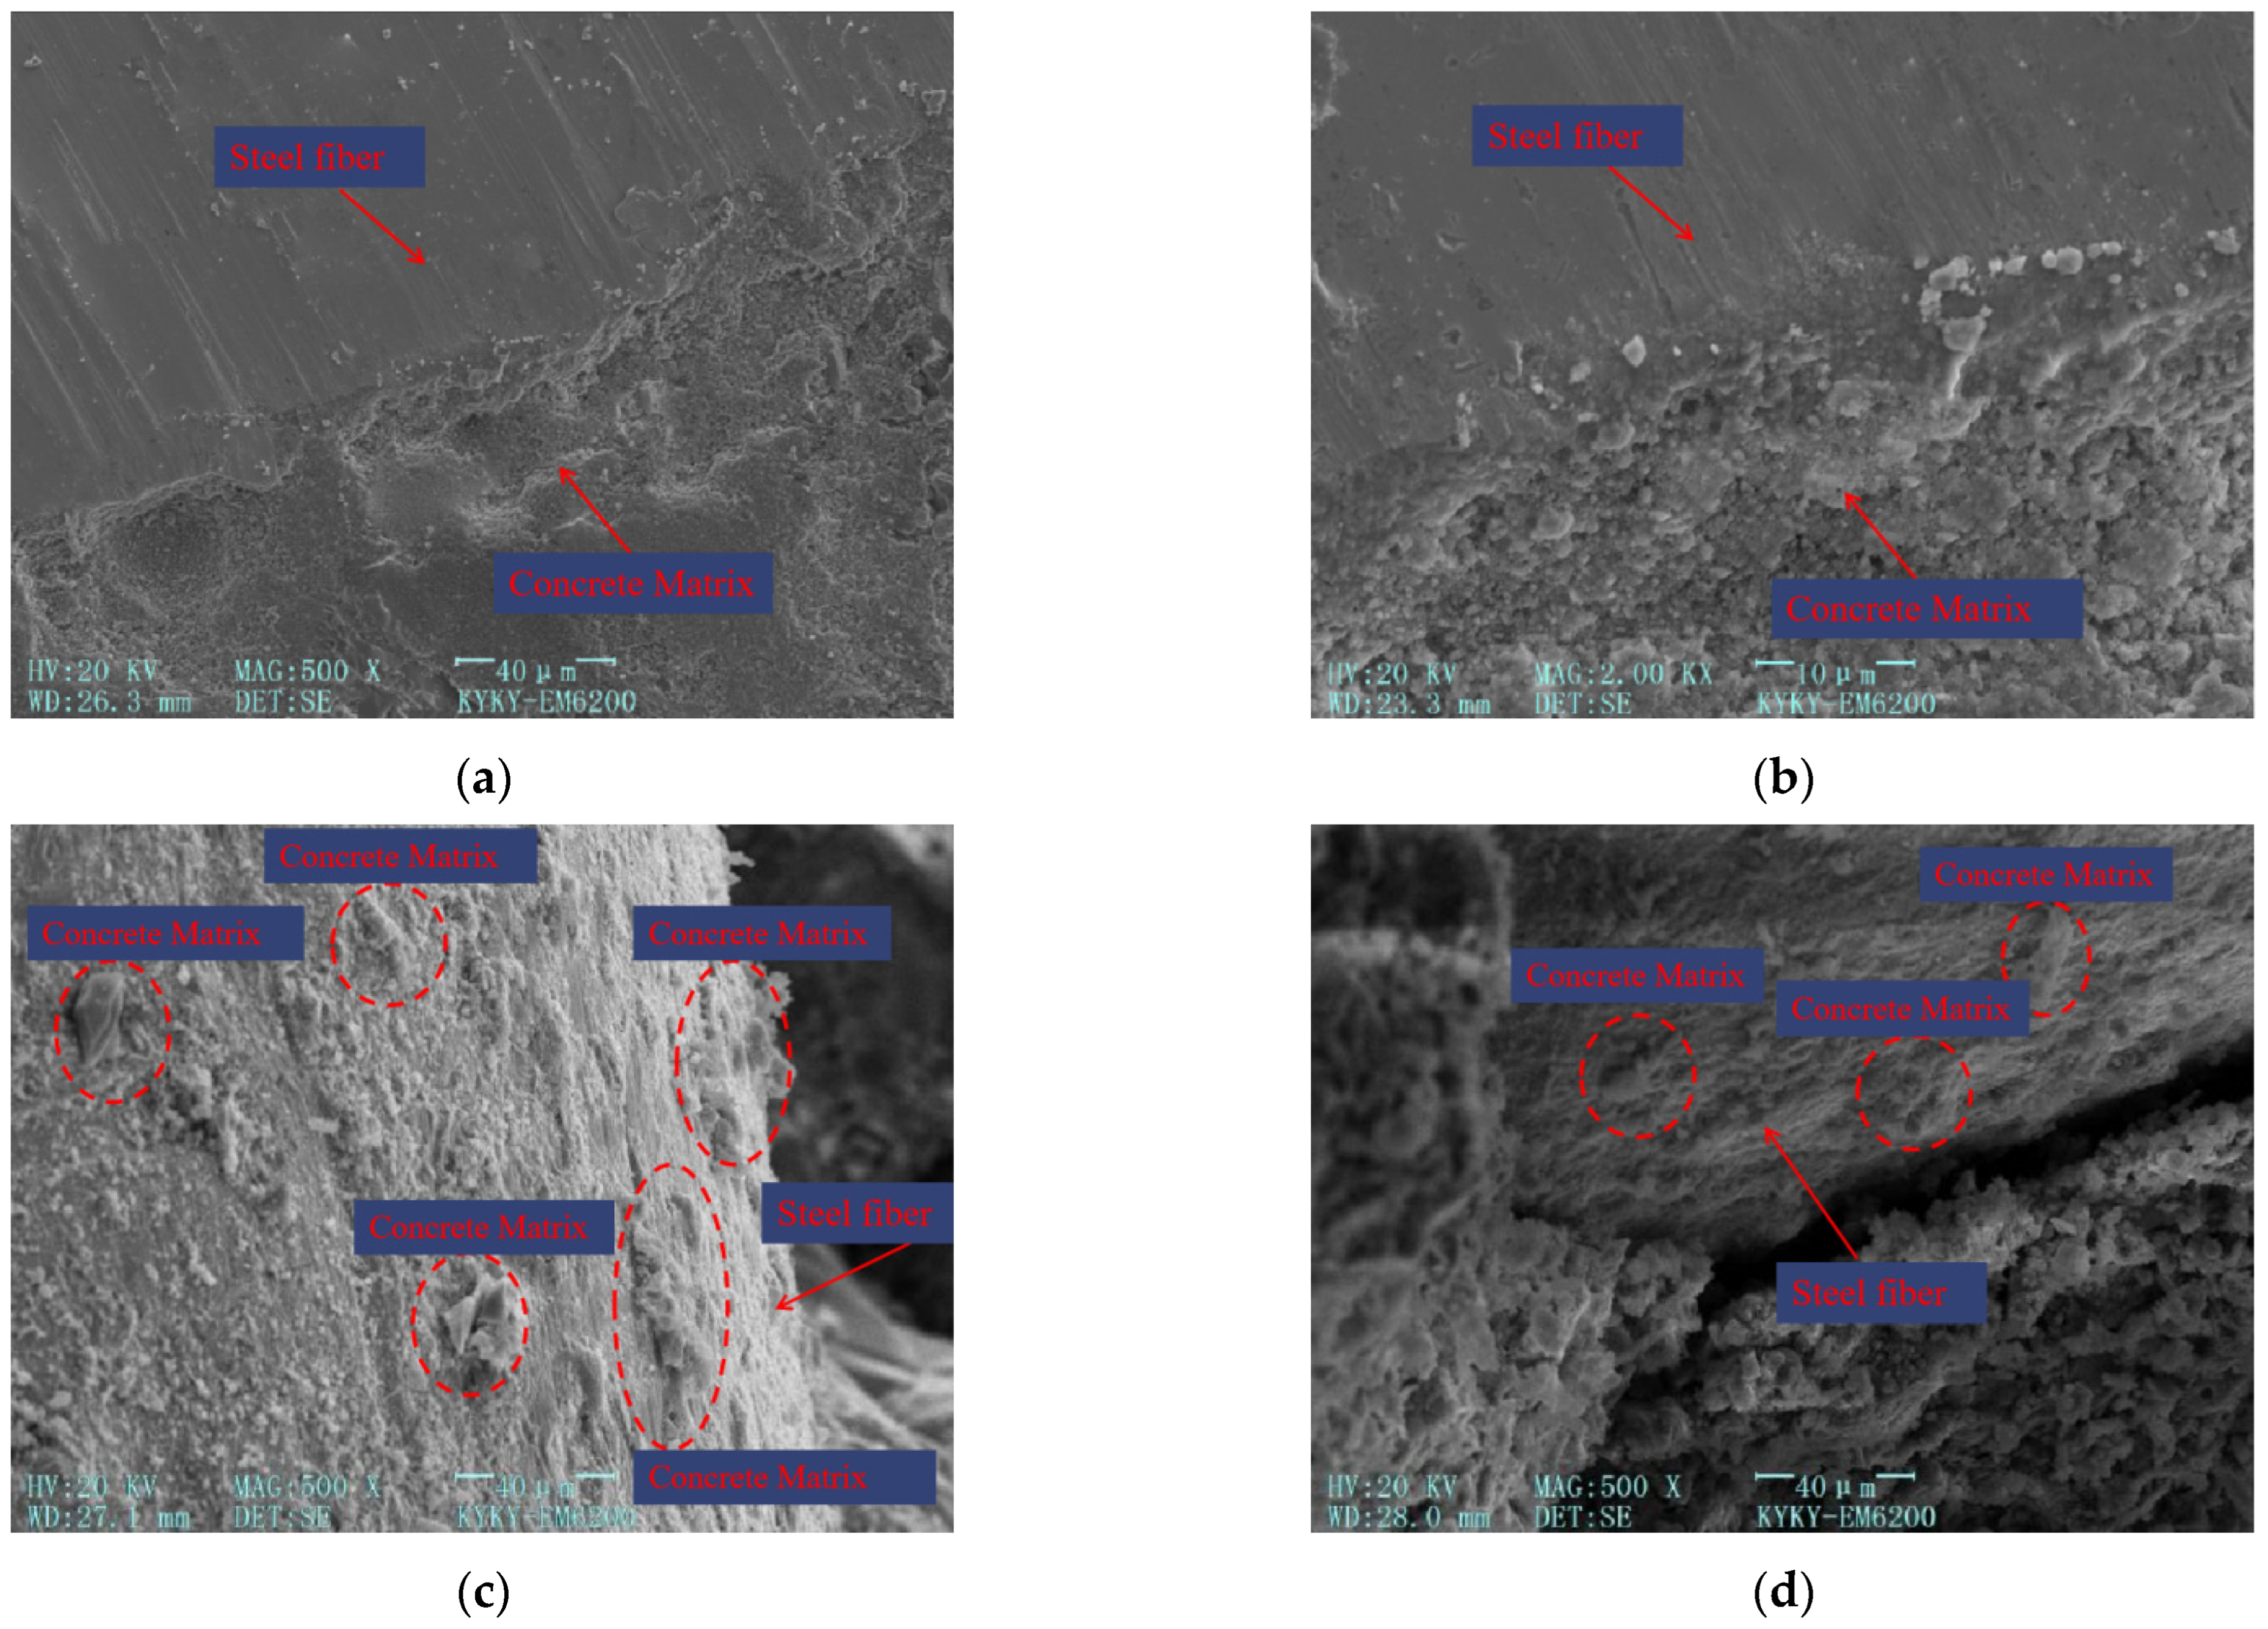
- (1)
- As depicted in Figure 14a,b, the inclusion of steel fibers in the cement matrix results in a robust bond that restricts the development of macroscopic cracks. This can be attributed to the bridging effect provided by the steel fibers. Additionally, as the steel fibers unhook within the concrete, two forces come into play to further impede crack growth: the friction force between the steel fibers and the concrete, and the anchoring force exerted by the end hooks of the steel fibers embedded in the concrete. These forces work together to enhance the overall toughness and crack resistance of the concrete.
- (2)
- In Figure 14c,d, it can be observed that when the steel fiber is pulled out, a small amount of cement-based material remains attached to its surface. This indicates that the bonding between the steel fiber and the cement-based material is limited. The relatively smooth surface of the steel fiber allows for a tight bond with the cement matrix, but the bonding force is not extensive.
3.4.2. S-PVA HFRC
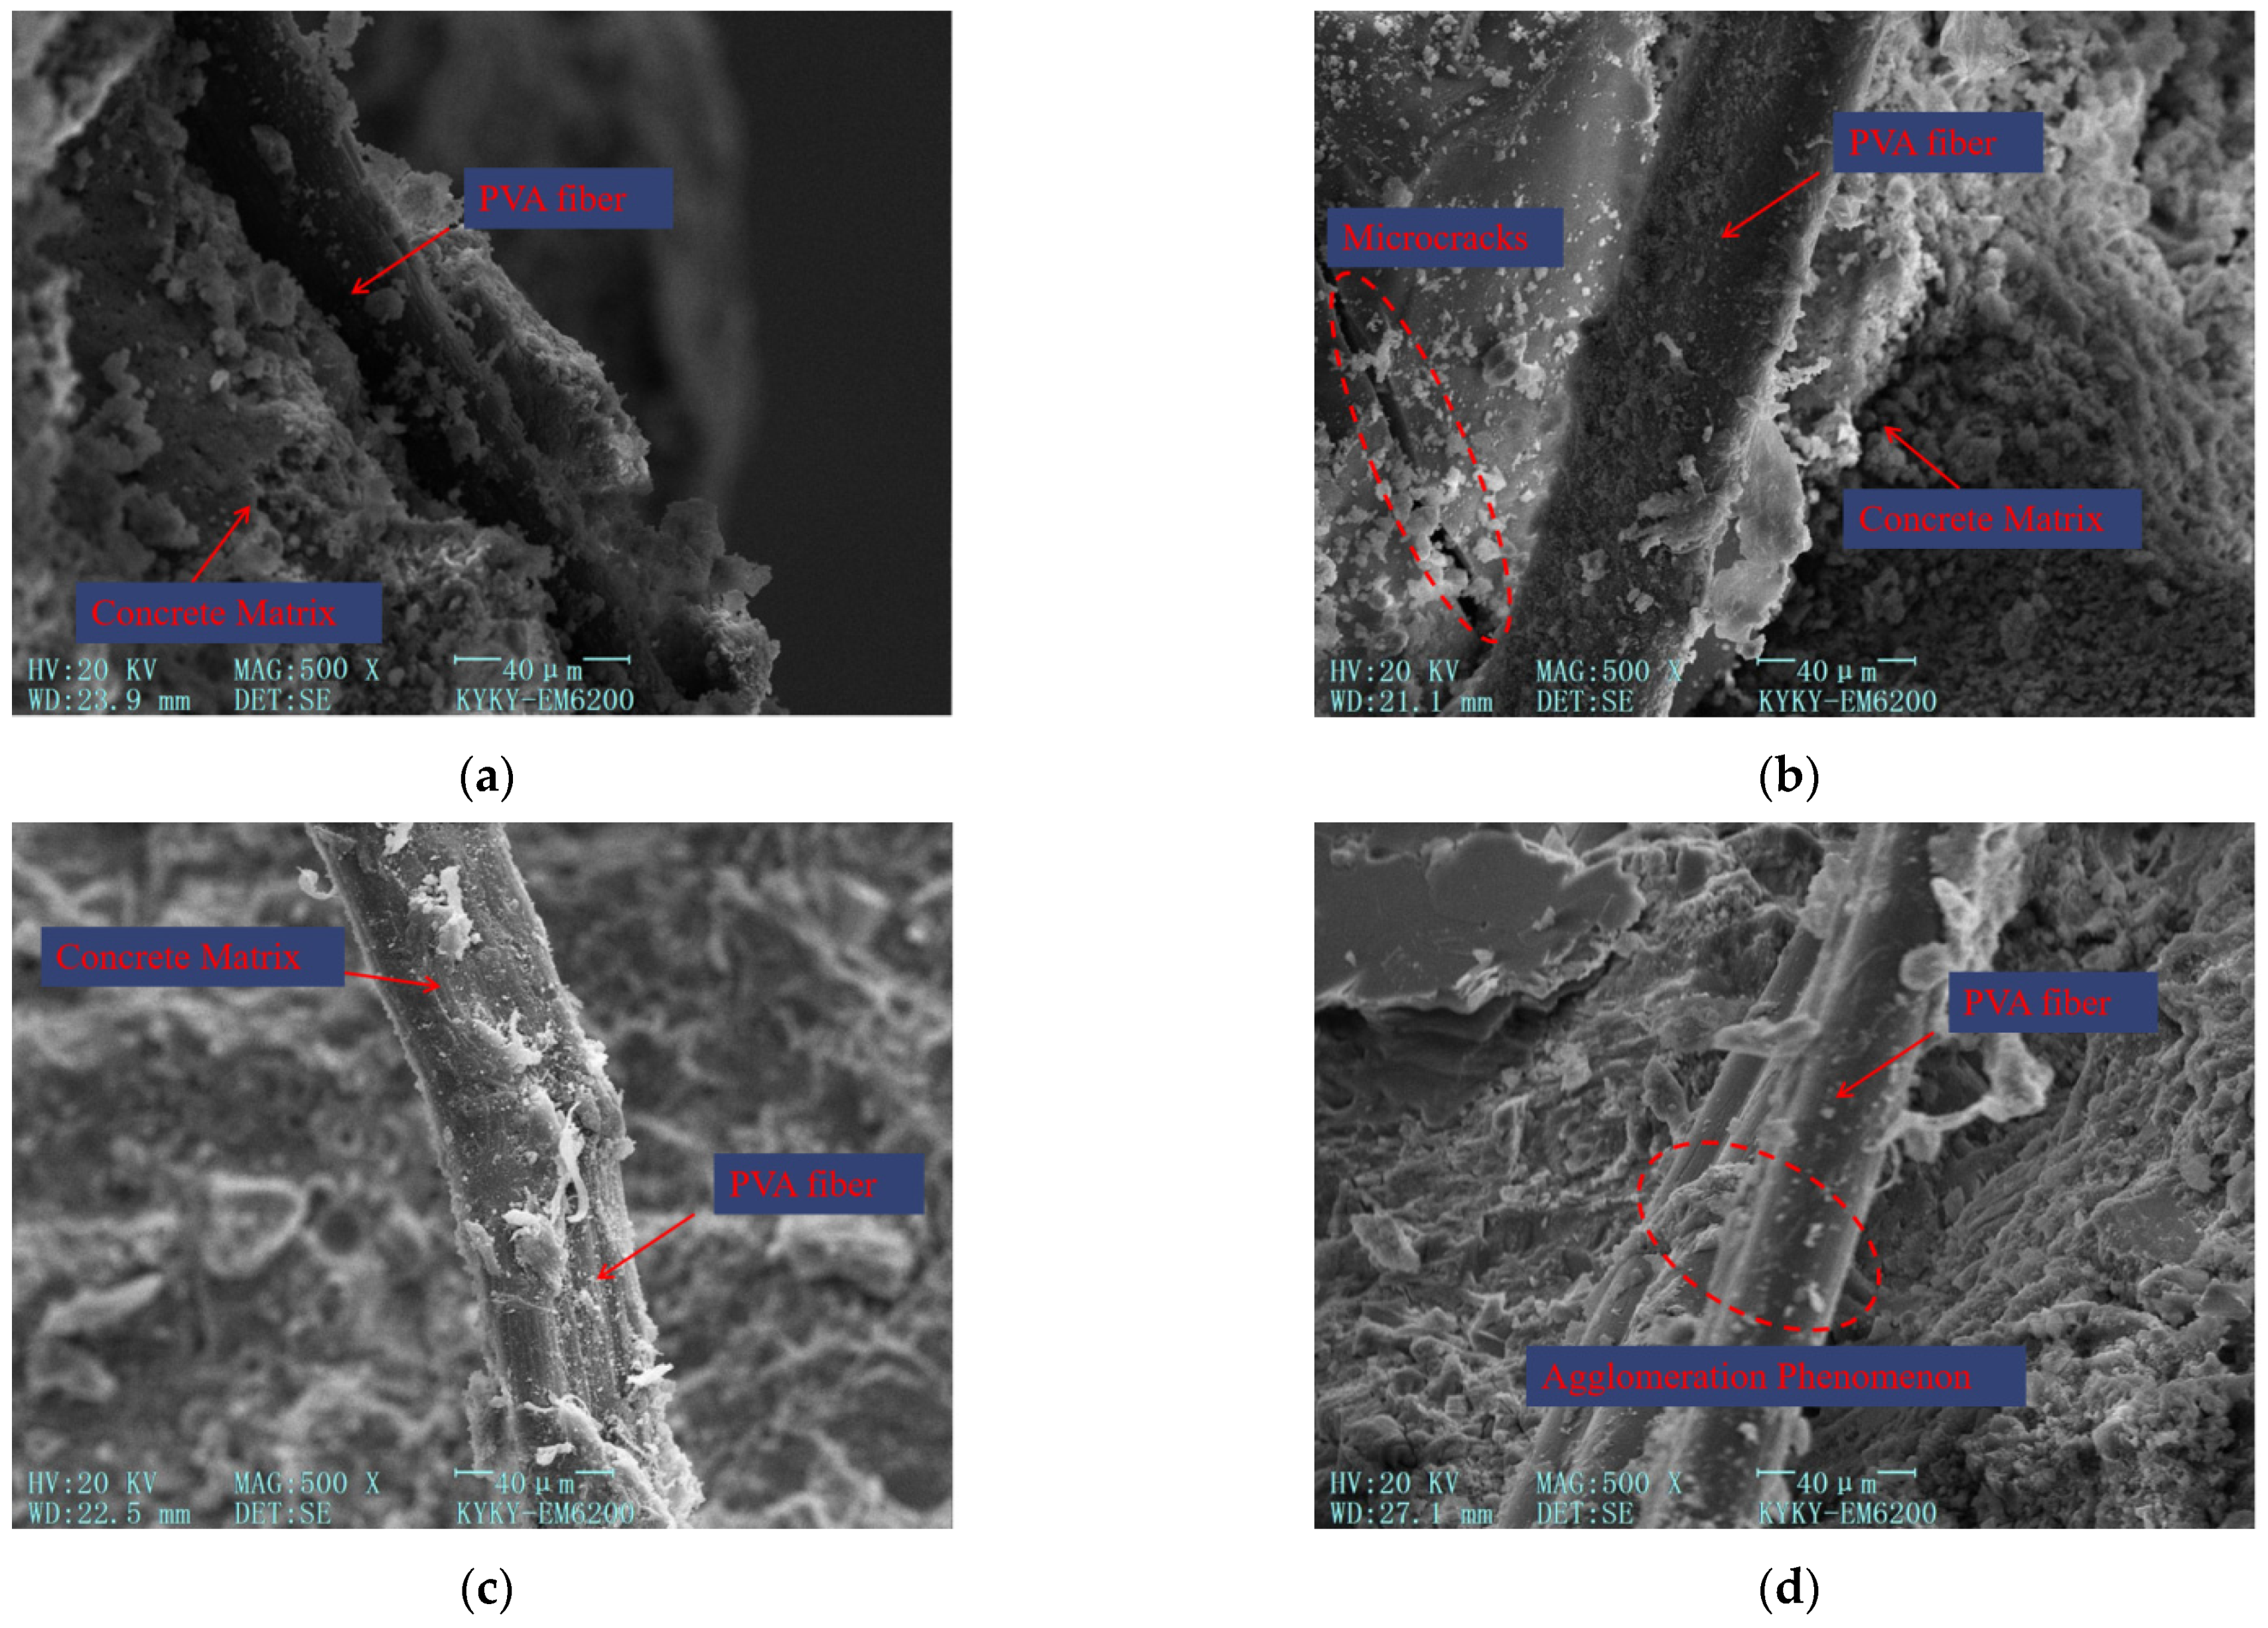
- (1)
- Figure 15a–c illustrate the relatively uniform distribution of PVA fibers within the concrete. The surface of these fibers exhibits a rough texture without any signs of fracture. This indicates that the pulling effect of PVA fibers is optimal, as they consume more energy during the bonding and sliding processes. Consequently, the crack resistance and toughness of the concrete are improved. When stress is transmitted to the fibers through the transition zone around them, PVA fibers exhibit greater elastic deformation capacity, allowing them to effectively resist stress. In collaboration with steel fibers, PVA fibers work to suppress the formation and propagation of macroscopic cracks in the concrete.
- (2)
- PVA fibers, as depicted in Figure 15b, pass through microcracks in the concrete. The presence of PVA fibers limits the generation and propagation of microcracks by confining the cracks on both sides of the fibers. Some microcracks may still develop and extend into areas where PVA fibers are distributed. By changing the direction of crack development and bridging the cracks, PVA fibers effectively restrict the concentrated growth of cracks. This ensures a more uniform distribution of stress throughout the entire matrix, resulting in improved strength and toughness of the cement-based materials. Furthermore, a significant amount of cement-based material can be observed adhering to the surface of PVA fibers. This strong bond between the fibers and the matrix limits the development of microcracks by tightly binding them to the matrix.
- (3)
- But the more PVA fiber is not the better. As shown in Figure 15d, excessive PVA fiber content leads to poor dispersion of PVA fibers inside the concrete, leading to the agglomeration of PVA fibers, which increases the internal porosity of cement-based materials, and reduces concrete strength and crack resistance.
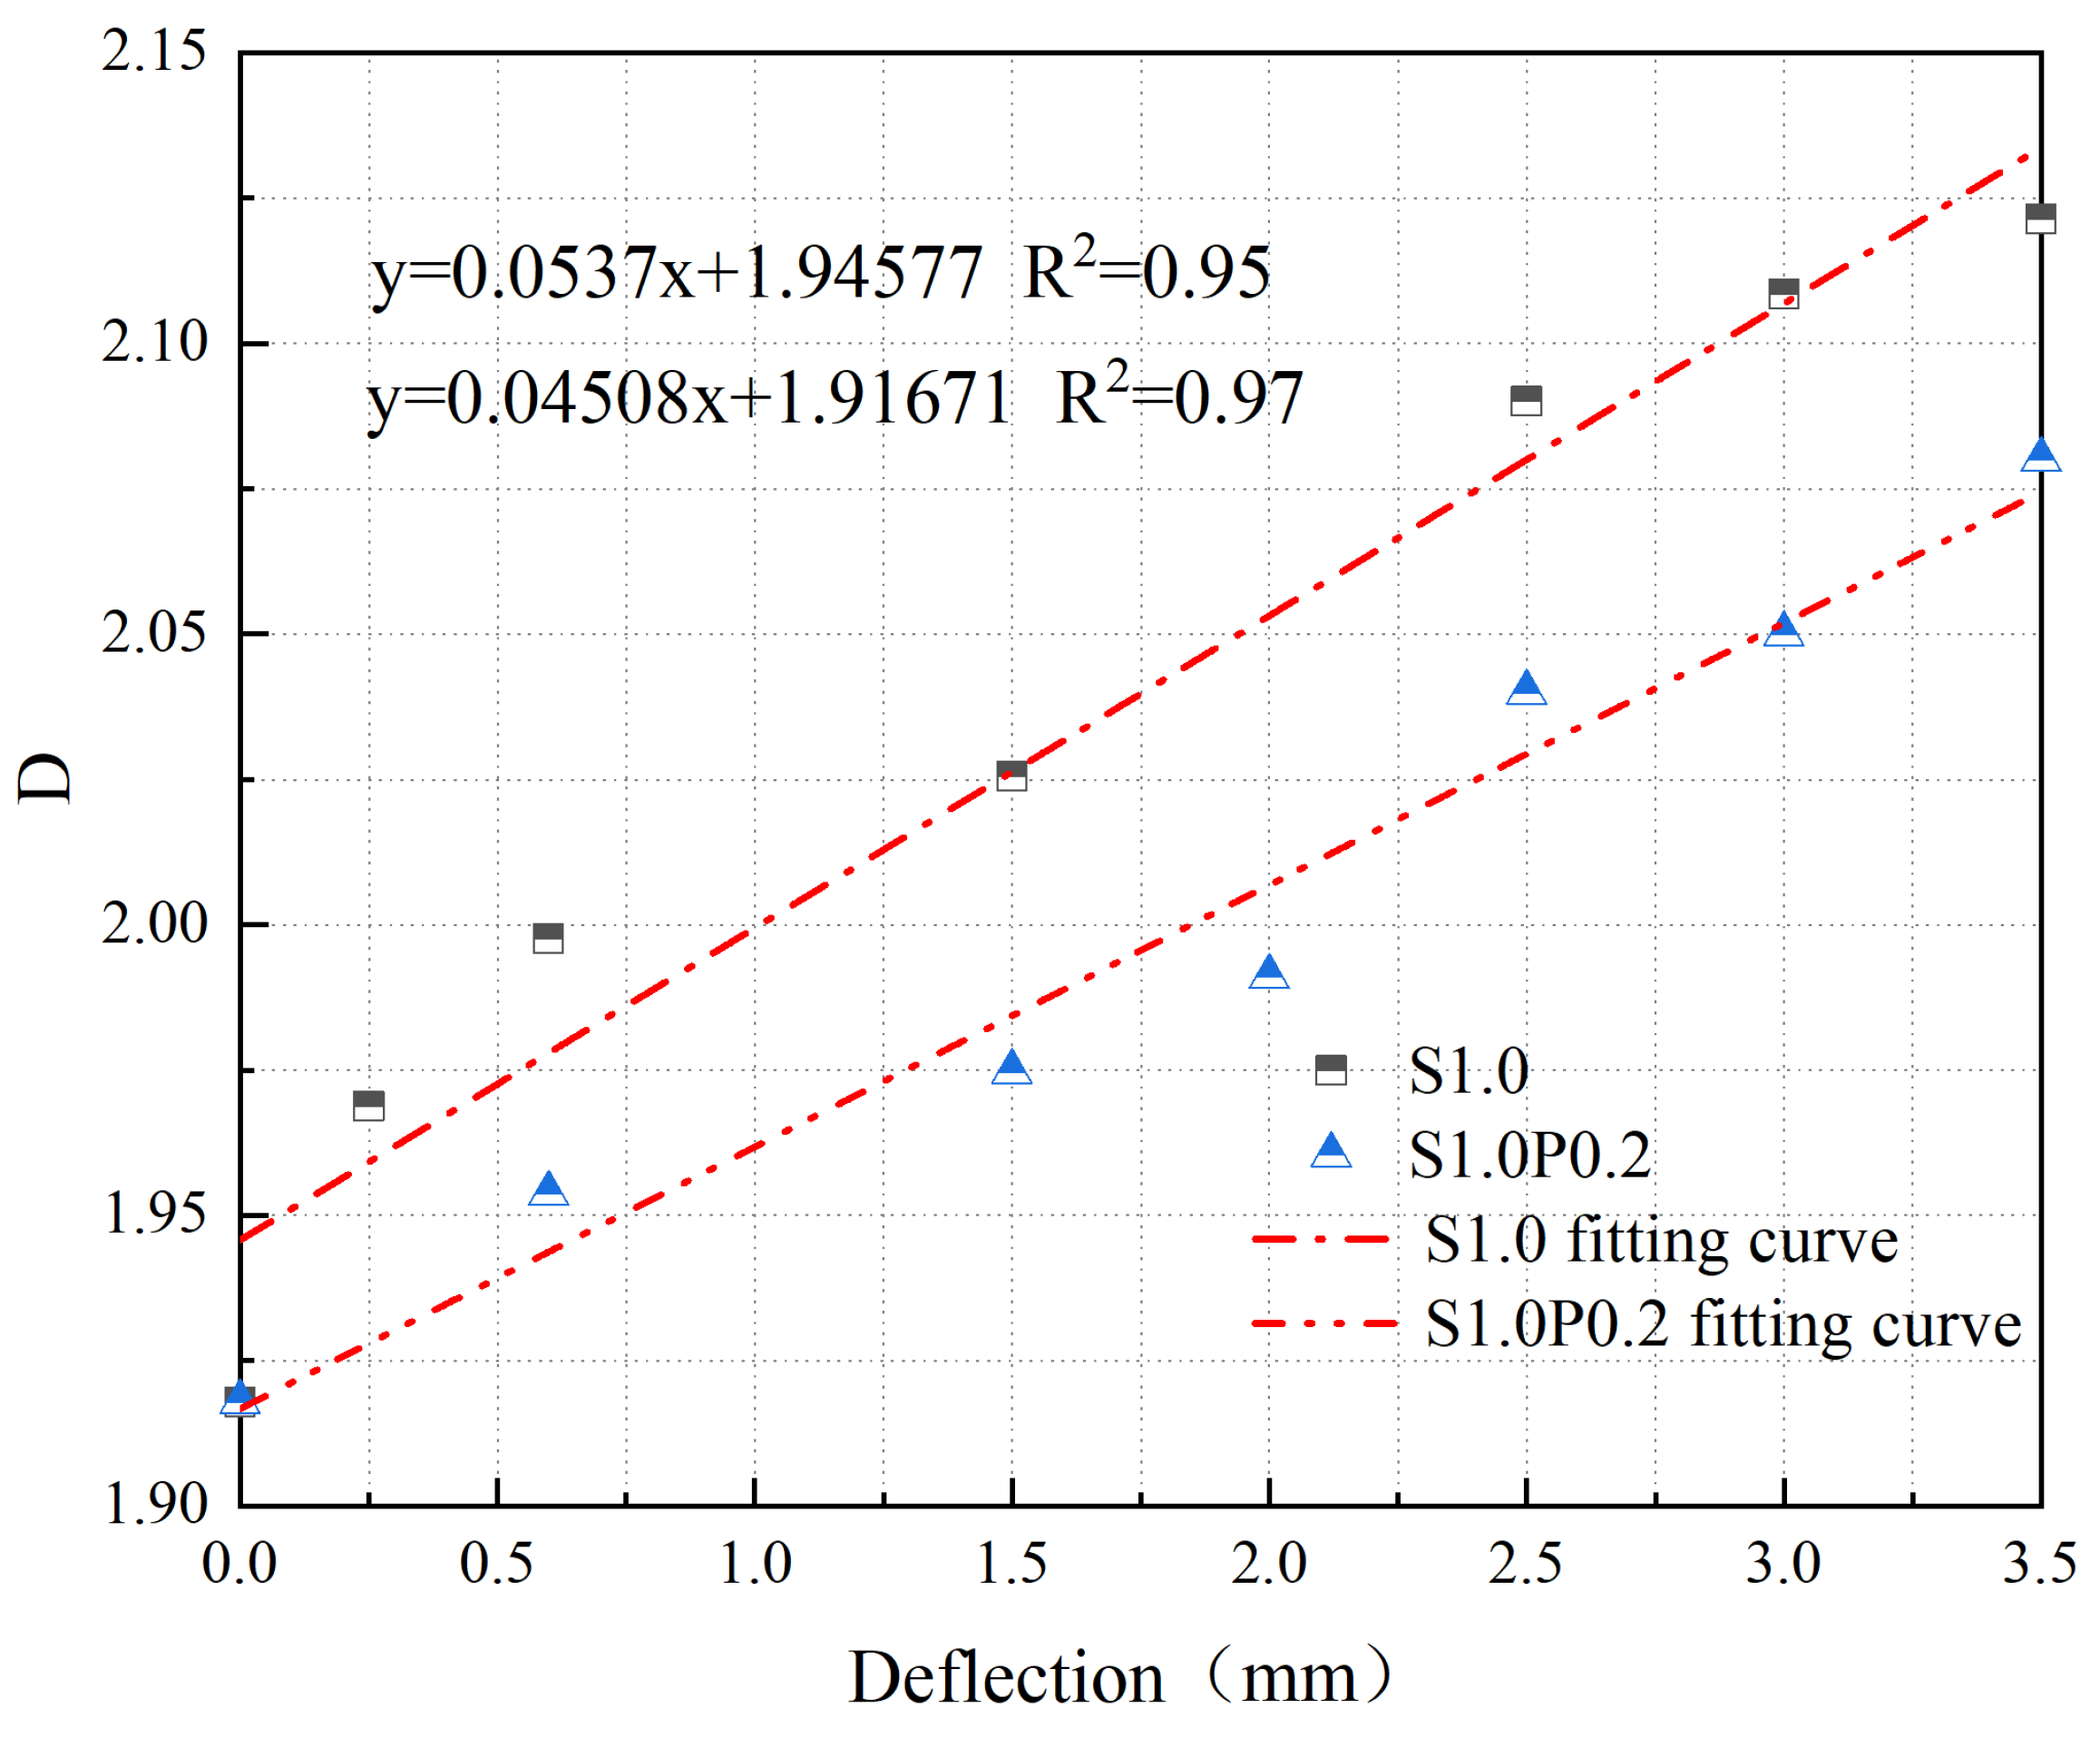
4. Analysis of Crack Evolution Based on Fractal Theory
4.1. SFRC
4.2. S-PVA HFRC
4.3. Concrete Crack Evolution Analysis
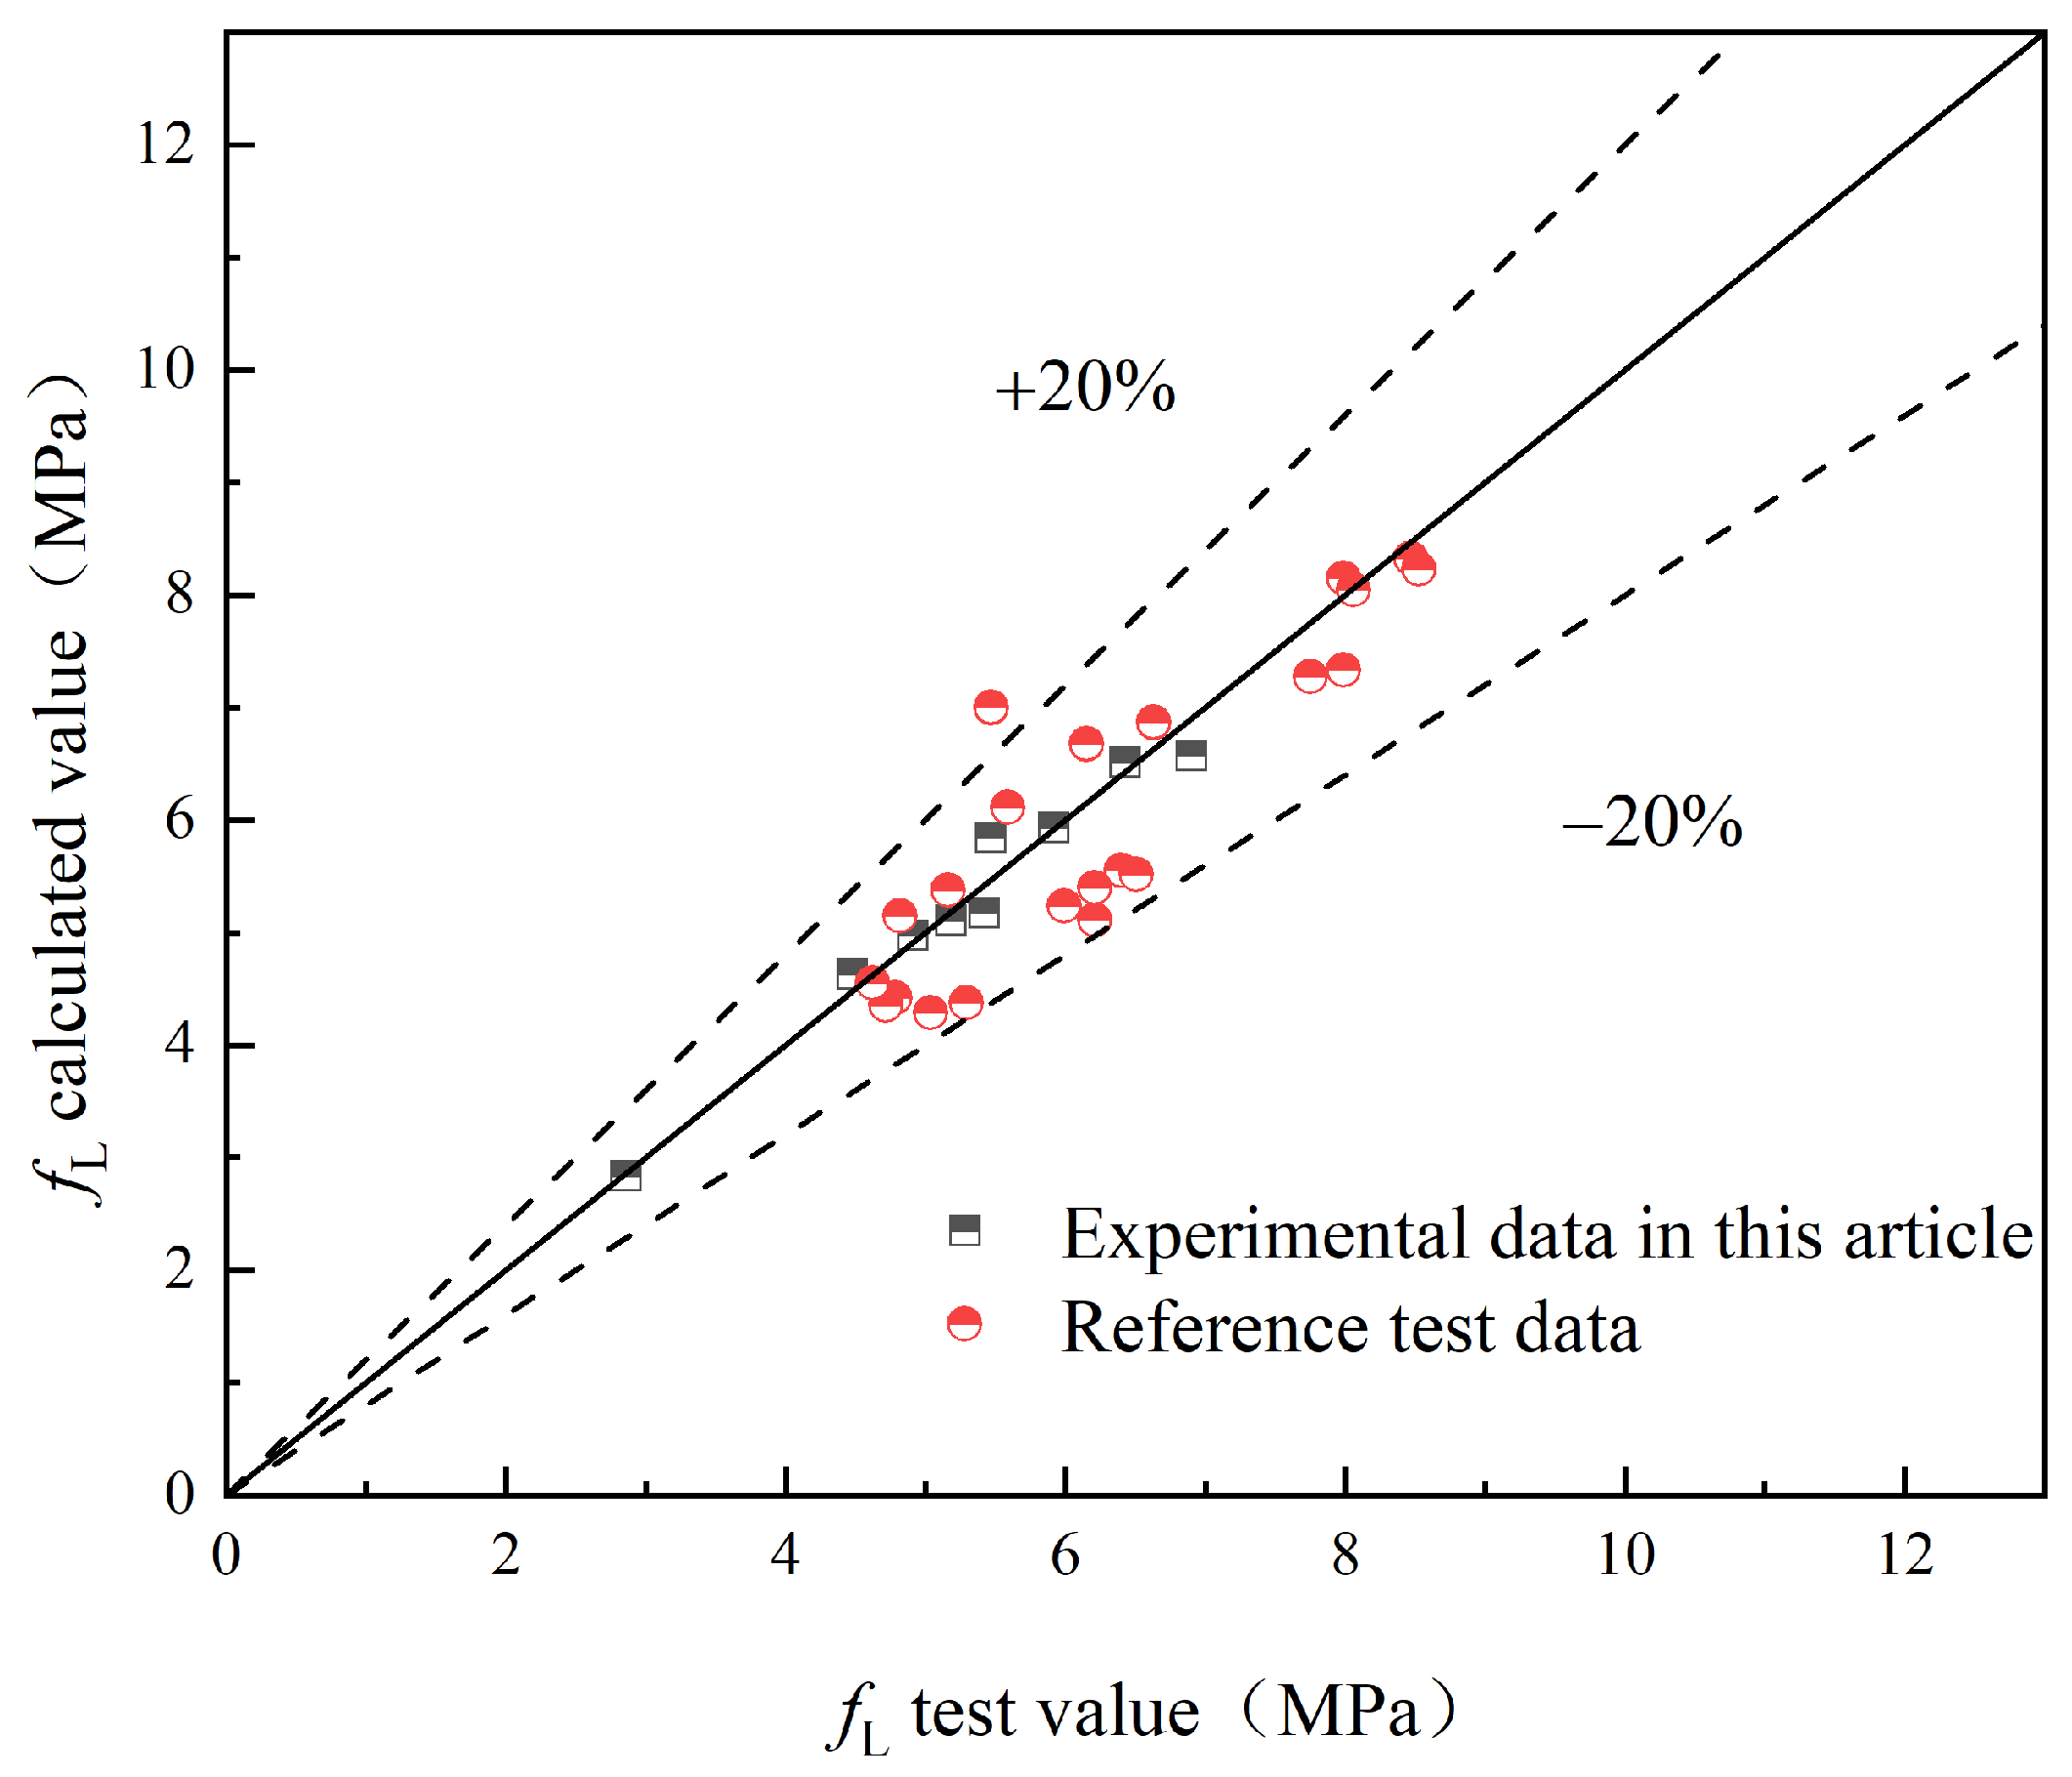
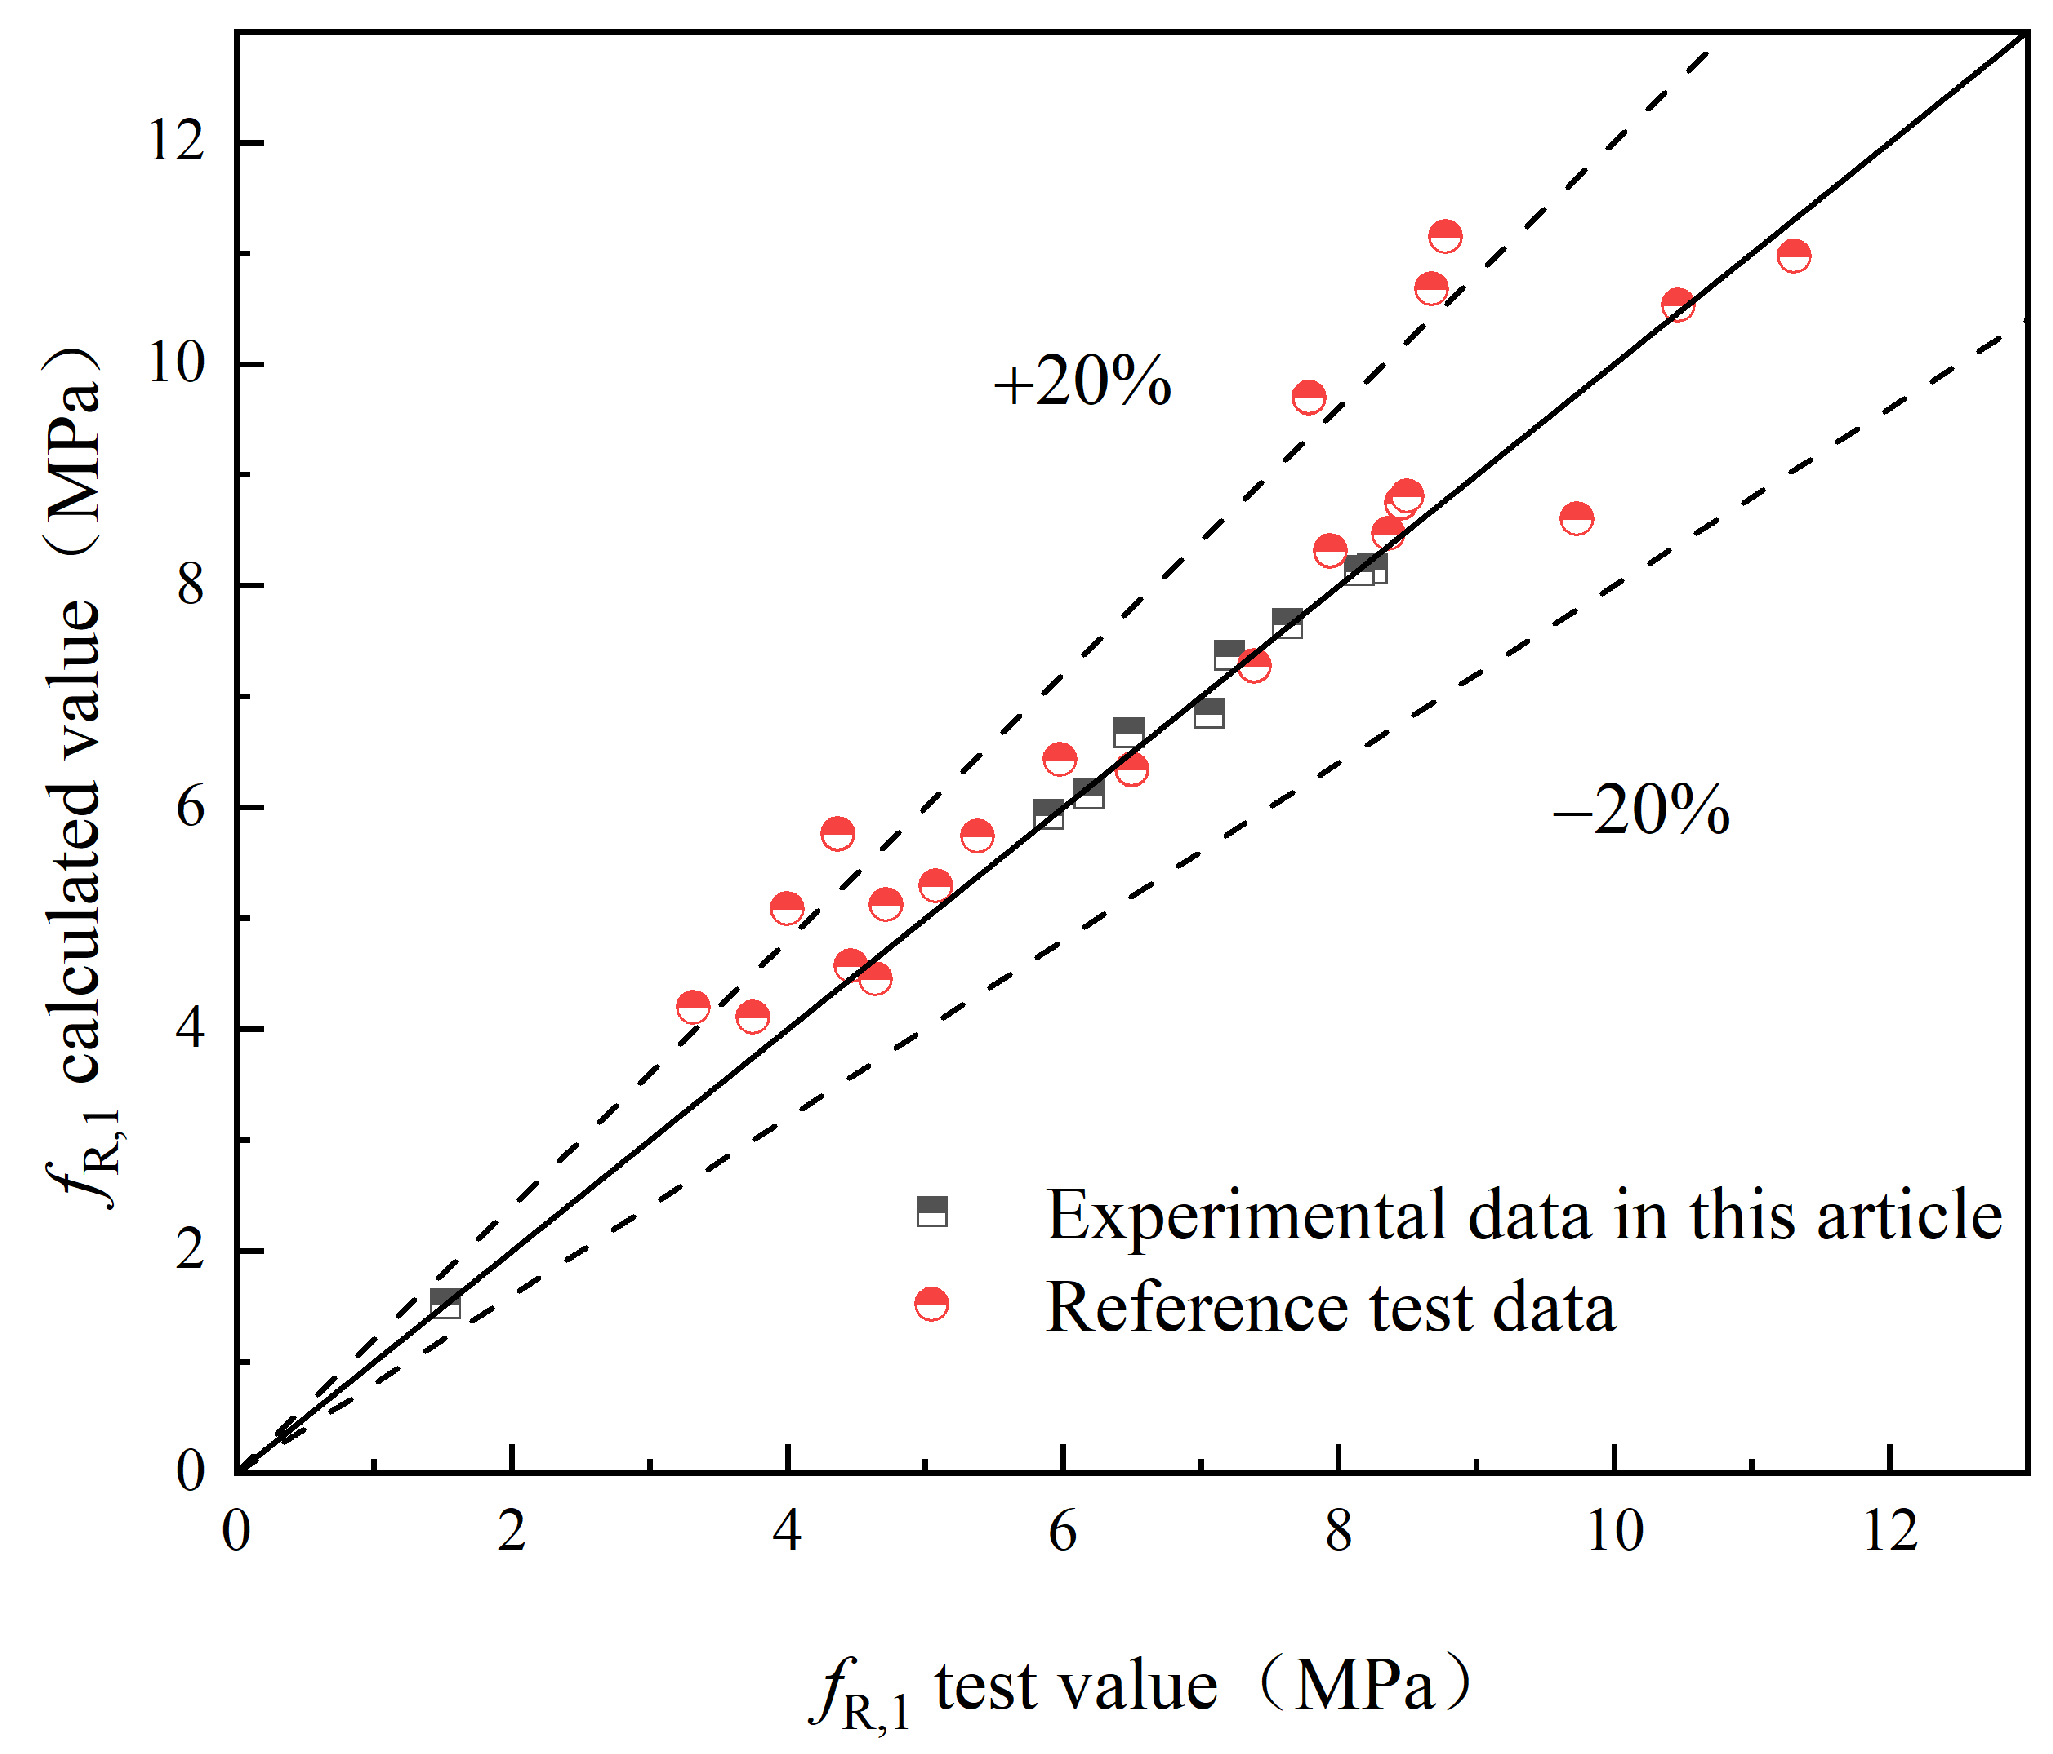
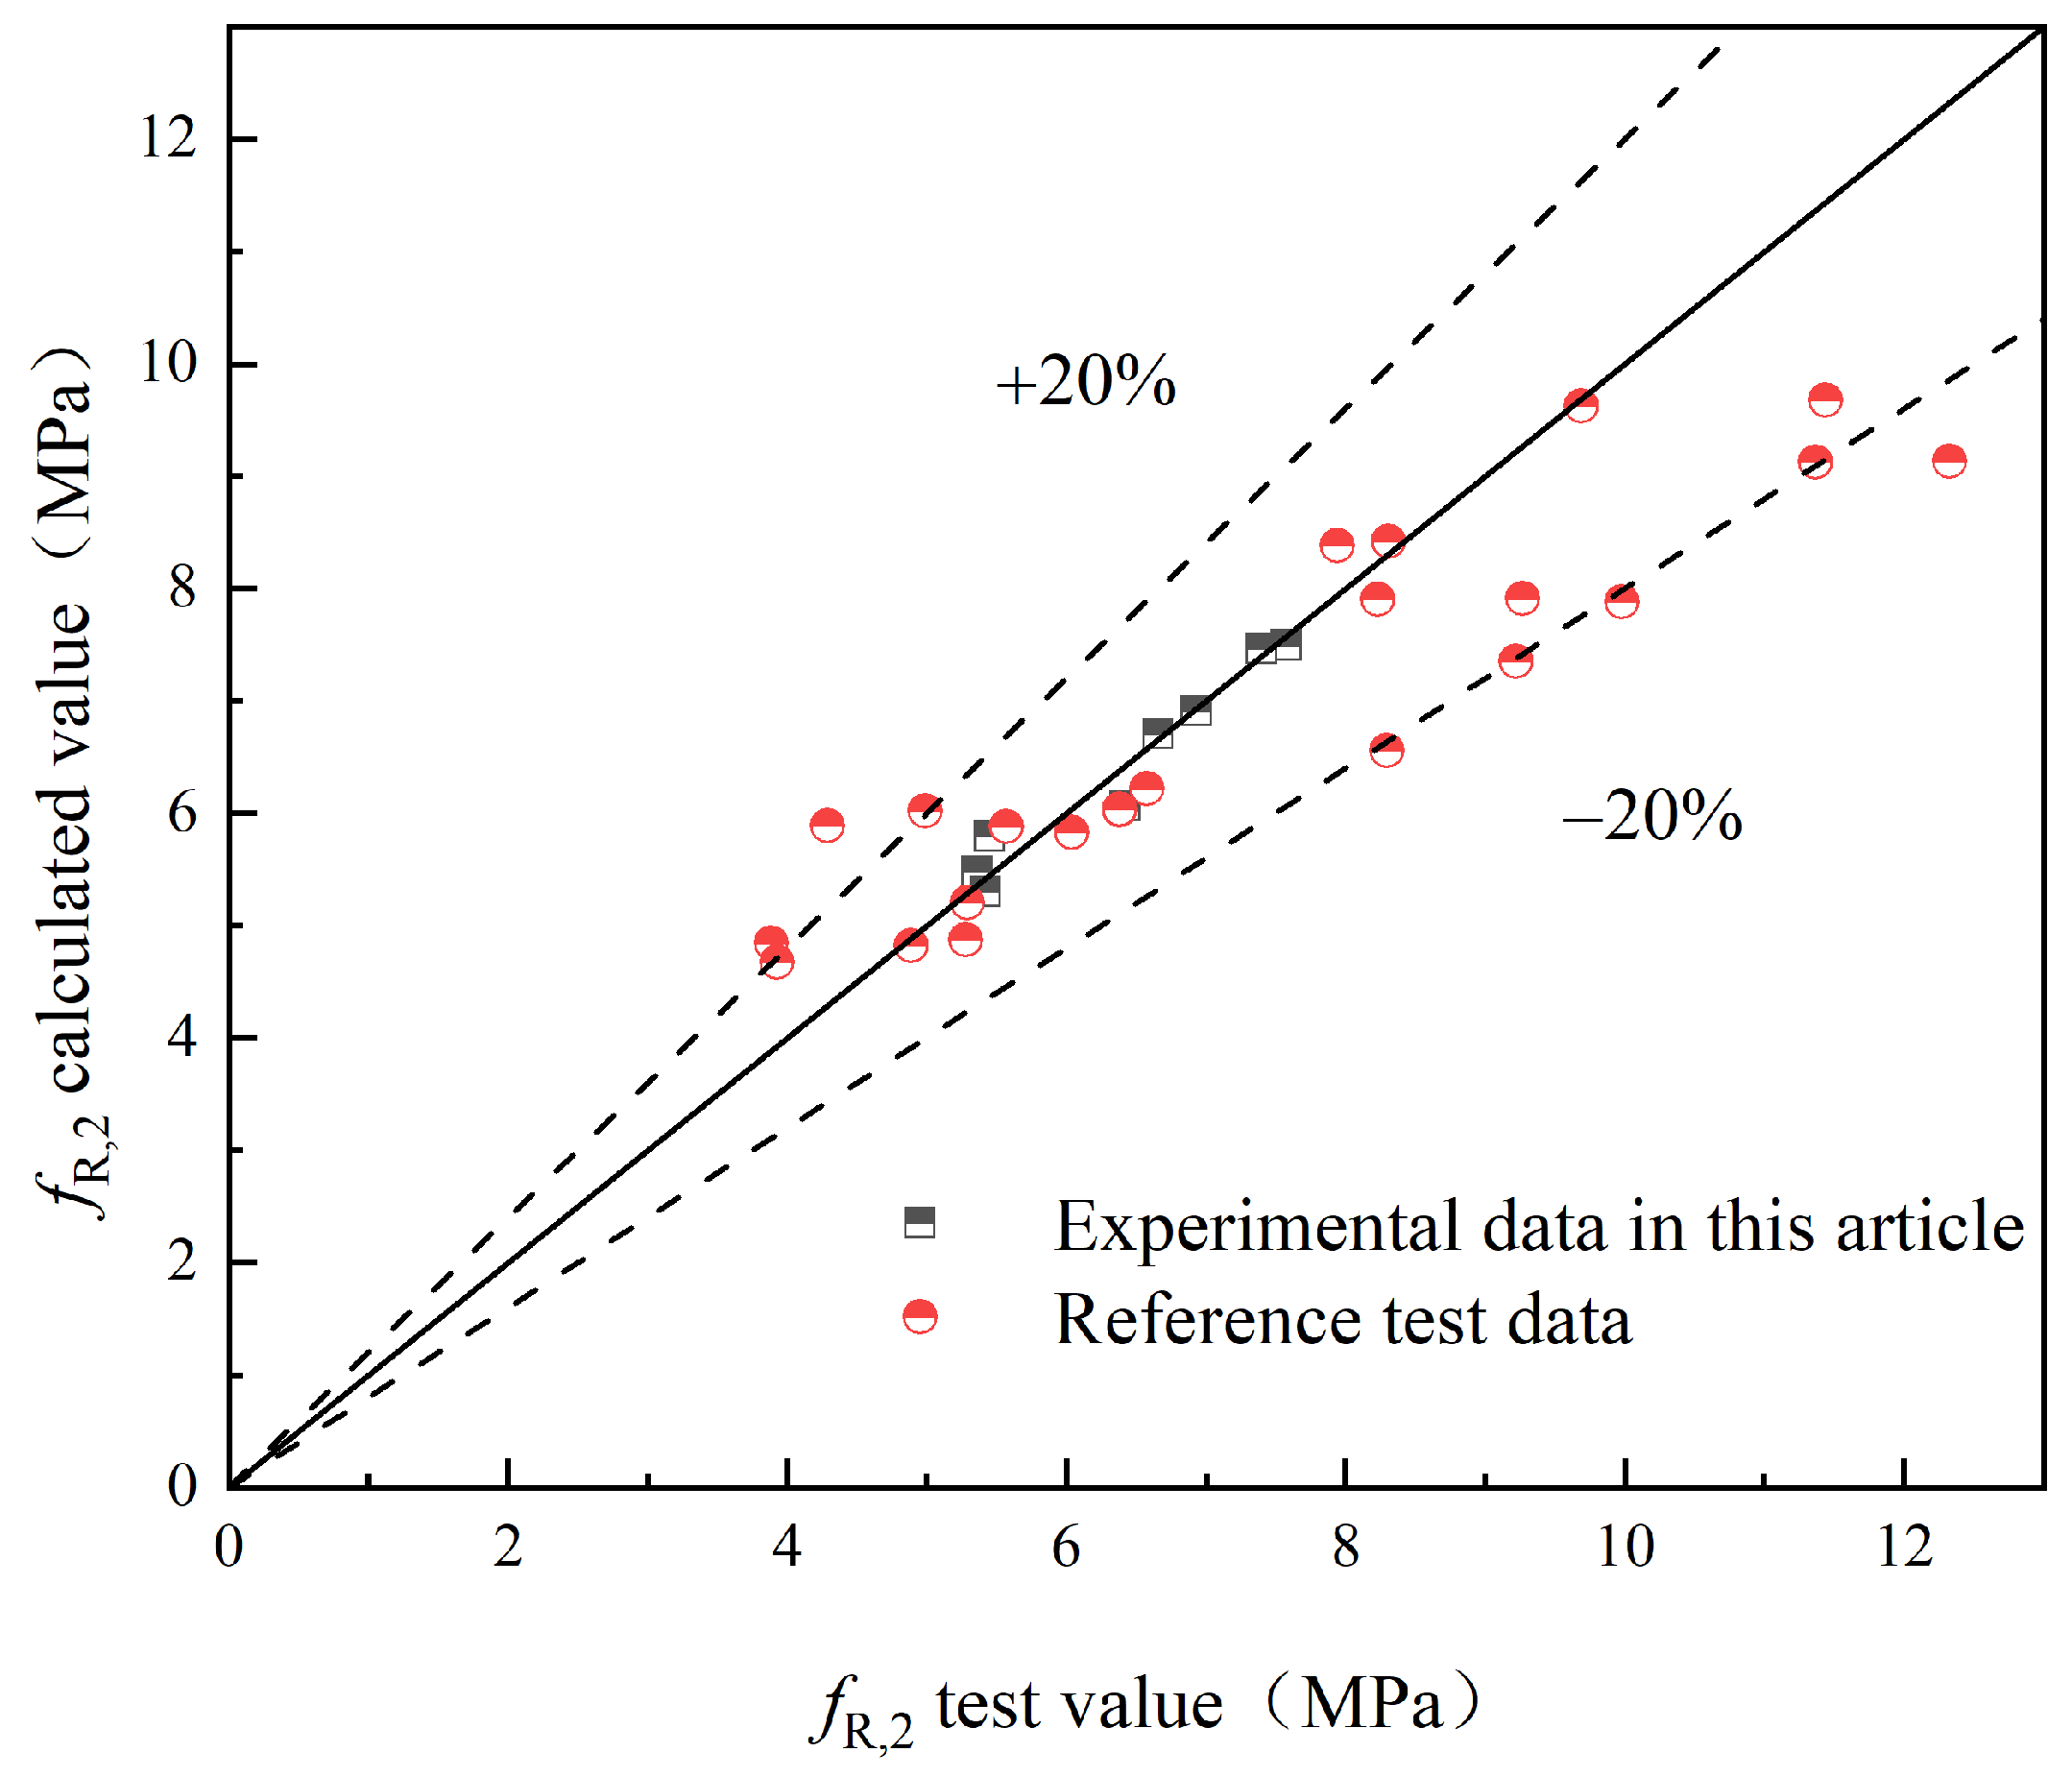
5. PMFS of Concrete
6. Conclusions
- The addition of S-PVA HF significantly enhances the and of the concrete. Comparison and analysis with the results of current studies show that S-PVA HF has a better effect on the flexural properties of concrete than steel or PVA alone, with a maximum increase in flexural strength of 22.3%.
- SEM observations revealed that the S-PVA HF effectively controlled crack development at different scales, thereby enhancing the flexural performance of the concrete.
- The S-PVA HF exhibited a significant improvement in crack control, resulting in reduced crack area and propagation rate.
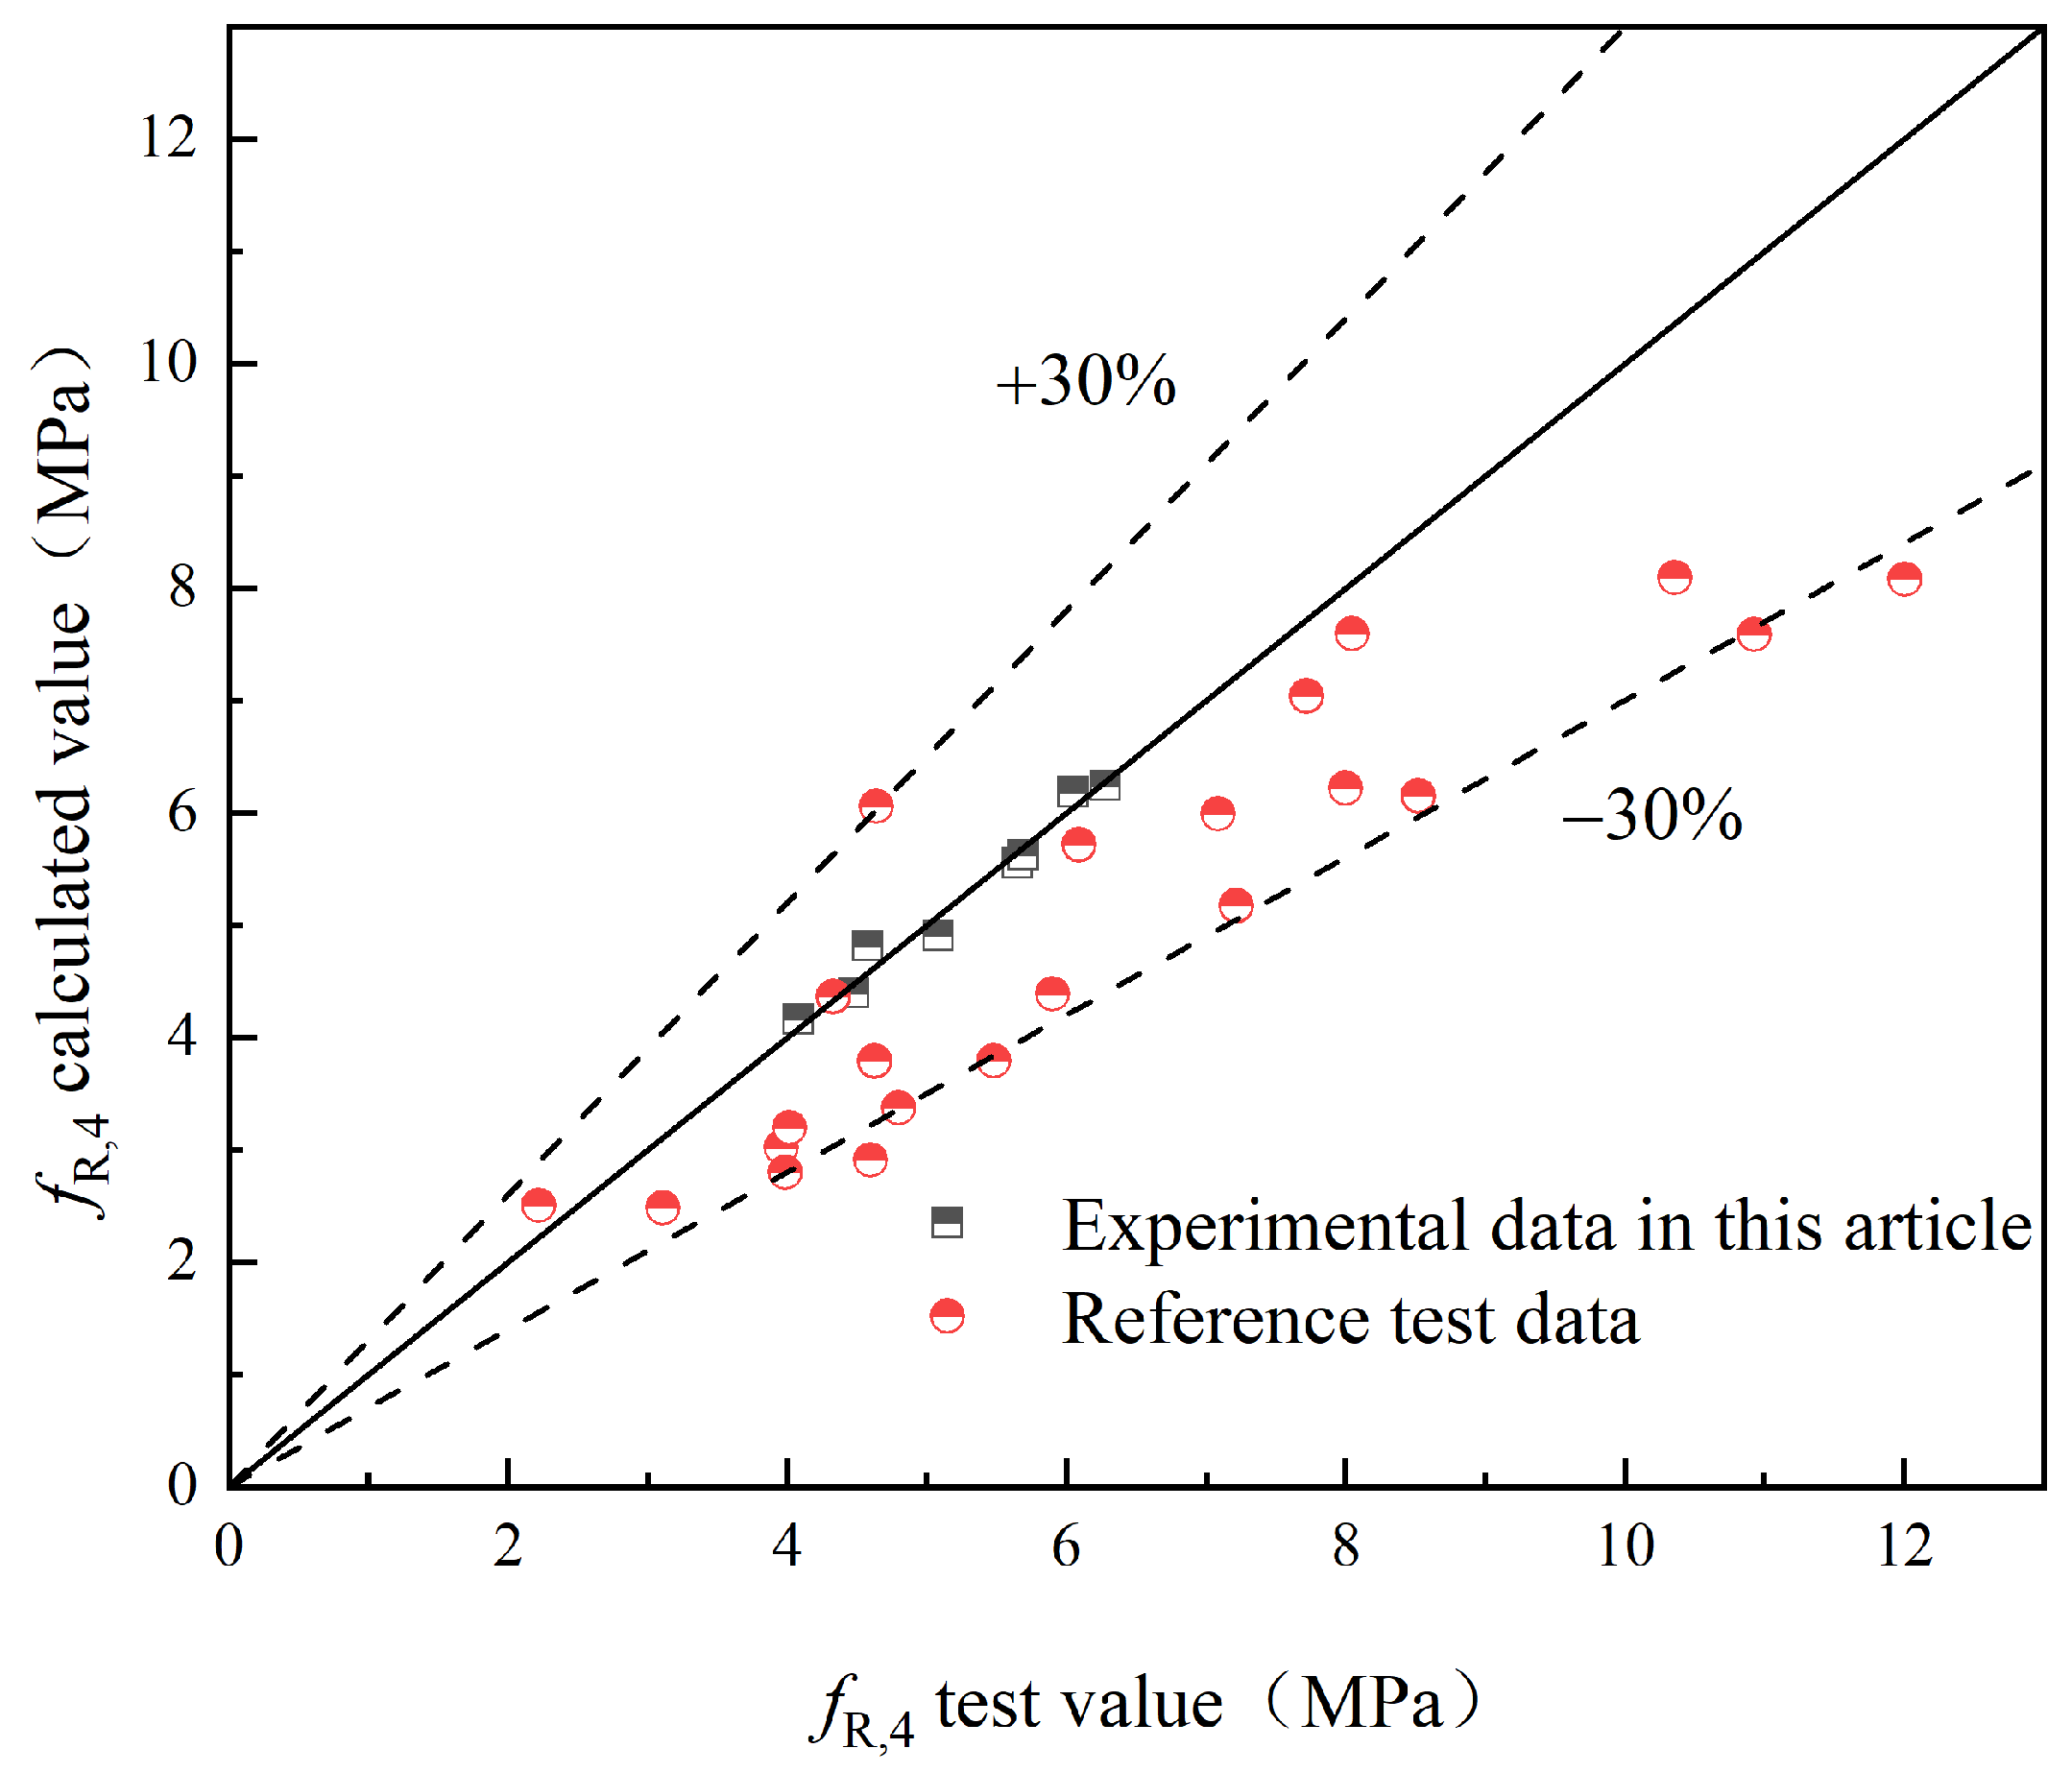
- A flexural strength prediction model for HFRC was developed, considering the influence of hybrid fibers on the concrete’s flexural strength. The reliability of the model was verified through experimental data.
- For panel concrete, the greatest enhancement in flexural performance was achieved when incorporating 1.0% steel fibers and 0.2% PVA fibers.
Author Contributions
Funding
Institutional Review Board Statement
Informed Consent Statement
Data Availability Statement
Conflicts of Interest
Abbreviations
| S-PVA HF | steel–PVA hybrid fibers |
| DIC | Digital Image Correlation |
| SEM | Scanning Electron Microscope |
| SFRC | steel fiber-reinforced concrete |
| HFRC | hybrid fiber-reinforced concrete |
| PVA | Polyvinyl alcohol |
| S-PVA HFRC | steel–PVA hybrid fiber concrete |
| CMOD | Crack Mouth Opening Displacement |
| Deflection (mm) | |
| F | Load (kN) |
| Ultimate flexural strength (MPa) | |
| Ultimate flexural load (N) | |
| Proportional ultimate strength (MPa) | |
| Proportional ultimate load (N) | |
| Residual flexural strength (MPa) when CMOD = CMODj (j = 1, 2, 3, 4) | |
| Load value (N) corresponding to CMOD = CMODj (j = 1, 2, 3, 4) | |
| B | Specimen cross-section width (mm) |
| Effective height of the specimen cross-section (mm) | |
| Compressive strength of cubic specimens (MPa) | |
| N | Number of end hooks of steel fibers |
| Fiber characteristic values | |
| Volume fraction | |
| Hybridization effect coefficient | |
| PMFS | predictive model for flexural strength |
| D | fractal dimension |
References
- Sun, Y.; Liu, S.H.; Jia, Y.; Zhu, A.L.; Wang, L.J.; He, W. A cross-scale finite element analysis of concrete-faced rockfill dam. Phys. Chem. Earth 2023, 130, 103375. [Google Scholar] [CrossRef]
- Wang, L.; Li, G.X.; Li, X.; Guo, F.X.; Tang, S.W.; Lu, X.; Hanif, A. Influence of reactivity and dosage of MgO expansive agent on shrinkage and crack resistance of face slab concrete. Cement Concr. Compos. 2022, 126, 104333. [Google Scholar] [CrossRef]
- Vatani Oskouei, A.; Nazari, R.; Houshmand Khaneghahi, M. Laboratory and in situ investigation of the compressive strength of CFRD concrete. Construct. Build. Mater. 2020, 242, 118166. [Google Scholar] [CrossRef]
- Wang, Z.J.; Liu, S.H.; Vallejo, L.; Wang, L.J. Numerical analysis of the causes of face slab cracks in Gongboxia rockfill dam. Eng. Geol. 2014, 181, 224–232. [Google Scholar] [CrossRef]
- Qu, Y.Q.; Zou, D.G.; Kong, X.J.; Liu, J.M.; Zhang, Y.; Yu, X. Seismic damage performance of the steel fiber reinforced face slab in the concrete-faced rockfill dam. Soil Dyn. Earth. Eng. 2019, 119, 320–330. [Google Scholar] [CrossRef]
- Zhou, W.; Hua, J.J.; Chang, X.L.; Zhou, C.B. Settlement analysis of the Shuibuya concrete-face rockfill dam. Comput. Geotech. 2011, 38, 269–280. [Google Scholar] [CrossRef]
- Bu, P.; Li, Y.L.; Li, B.; Wang, X.K.; Zhang, Y.; Xu, Z.G. Study on stress-deformation mechanism of concrete face rockfill dam based on centrifugal model test. Measurement 2023, 216, 112973. [Google Scholar] [CrossRef]
- Wang, L.; He, T.S.; Zhou, Y.X.; Tang, S.W.; Tan, J.J.; Liu, Z.T.; Su, J.W. The influence of fiber type and length on the cracking resistance, durability and pore structure of face slab concrete. Construct. Build. Mater. 2021, 282, 122706. [Google Scholar] [CrossRef]
- Zuaiter, M.; El-Hassan, H.; El-Maaddawy, T.; El-Ariss, B. Flexural and shear performance of geopolymer concrete reinforced with hybrid glass fibers. J. Build. Eng. 2023, 72, 106580. [Google Scholar] [CrossRef]
- Lu, X.Y.; Wang, B.X.; Yuan, K.; Zhao, J.Y. Influence of textile reinforced self-stressing concrete with three-dimensional collaborative textile on crack resistance and bending properties. J. Build. Eng. 2022, 61, 105261. [Google Scholar] [CrossRef]
- Han, J.H.; Zhao, M.M.; Chen, J.Y.; Lan, X.F. Effects of steel fiber length and coarse aggregate maximum size on mechanical properties of steel fiber reinforced concrete. Construct. Build. Mater. 2019, 209, 577–591. [Google Scholar] [CrossRef]
- Bhanavath, S.; Sivakumar, M.V.N. Compressive properties and analytical modelling for stress-strain curves of polyvinyl alcohol fiber reinforced concrete. Construct. Build. Mater. 2021, 291, 123192. [Google Scholar]
- Huang, Y.; Huang, J.; Zhang, W.; Liu, X. Experimental and numerical study of hooked-end steel fiber-reinforced concrete based on the meso- and macro-models. Compos. Struct. 2023, 309, 116750. [Google Scholar] [CrossRef]
- Wang, L.; Zhou, S.H.; Shi, Y.; Tang, S.W.; Chen, E. Effect of silica fume and PVA fiber on the abrasion resistance and volume stability of concrete. Compos. Part B-Eng. 2017, 130, 28–37. [Google Scholar] [CrossRef]
- Chen, Y.; He, Q.; Liang, X.; Chen, Z.; Li, H. Experimental investigation on mechanical properties of steel fiber reinforced recycled aggregate concrete under uniaxial cyclic compression. Construct. Build. Mater. 2023, 387, 131616. [Google Scholar] [CrossRef]
- Han, J.H.; Zhang, W.J.; Liu, Y. Experimental Study on freeze–thaw resistance of steel fiber-reinforced hydraulic concrete with two-grade aggregate. J. Build. Eng. 2022, 60, 105181. [Google Scholar] [CrossRef]
- Han, J.H.; Liu, Z.Y.; Zhang, C.F. Experimental study on impact resistance of steel-fiber-reinforced two-grade aggregate concrete. Construct. Build. Mater. 2023, 373, 130901. [Google Scholar] [CrossRef]
- Xu, W.; Yang, L.; Gao, D.; Tang, J.; Sun, G.; Zhang, Y. Mechanical properties of seawater-mixed steel fiber reinforced concrete. J. Build. Eng. 2023, 73, 106823. [Google Scholar] [CrossRef]
- Lu, F.; Xu, J.; Li, W.; Hou, Y.; Qin, F.; Pan, M. Study on multi-scale damage and failure mechanism of steel fiber reinforced concrete: Experimental and numerical analysis. Structures 2023, 48, 768–781. [Google Scholar] [CrossRef]
- Zeng, J.J.; Wang, J.S.; Ouyang, Y.; Zhuge, Y.; Liao, J.J.; Long, Y.L.; Zhou, J.K. Tri-axial compressive behavior of expansive concrete and steel fiber-reinforced expansive concrete. J. Build. Eng. 2023, 68, 106026. [Google Scholar] [CrossRef]
- Han, J.H.; Huang, D.C.; Chen, J.Y.; Lan, X.F. Experiment Study and Finite Element Analysis of the Coupling Effect of Steel Fiber Length and Coarse Aggregate Maximum Size on the Fracture Properties of Concrete. Crystals 2021, 11, 850. [Google Scholar] [CrossRef]
- Bautista, A.; Pomares, J.C.; González, M.N.; Velasco, F. Influence of the microstructure of TMT reinforcing bars on their corrosion behavior in concrete with chlorides. Construct. Build. Mater. 2019, 229, 116899. [Google Scholar] [CrossRef]
- Ren, H.L.; Li, T.; Ning, J.G.; Song, S.Z. Analysis of damage characteristics of steel fiber-reinforced concrete based on acoustic emission. Eng. Fail. Anal. 2023, 148, 107166. [Google Scholar] [CrossRef]
- Zhang, S.; Gao, D.Y.; Zhu, H.T.; Chen, L.X.; He, Z.H.; Yang, L. Flexural behavior of seawater-mixed steel fiber reinforced concrete exposed to simulated marine environments. Construct. Build. Mater. 2023, 373, 130858. [Google Scholar] [CrossRef]
- Chen, G.; Gao, D.Y.; Zhu, H.T.; Yuan, J.S.; Xiao, X.; Wang, W.Q. Effects of novel multiple hooked-end steel fibres on flexural tensile behaviour of notched concrete beams with various strength grades. Structures 2021, 33, 3644–3654. [Google Scholar] [CrossRef]
- Gao, D.Y.; Luo, F.F.; Yan, Y.M.; Tang, J.Y.; Yang, L. Experimental investigation on the flexural performance and damage process of steel fiber reinforced recycled coarse aggregate concrete. Structures 2023, 51, 1205–1218. [Google Scholar] [CrossRef]
- Gondokusumo, G.S.; Venkateshwaran, A.; Li, S.; Richard, L.J.Y. Residual flexural tensile strength of normal-weight and lightweight steel fibre-reinforced concrete at elevated temperatures. Construct. Build. Mater. 2023, 367, 130221. [Google Scholar] [CrossRef]
- Xu, J.; Houndehou, J.D.; Wan, Z.Y.; Ma, Q. Experimental investigation on the mechanical properties and damage evolution of steel-fiber-reinforced crumb rubber concrete with porcelain tile waste. Construct. Build. Mater. 2023, 370, 130643. [Google Scholar] [CrossRef]
- Tiberti, G.; Germano, F.; Mudadu, A.; Plizzari, G.A. An overview of the flexural post-cracking behavior of steel fiber reinforced concrete. Struct. Concr. 2018, 19, 695–718. [Google Scholar] [CrossRef]
- Noushini, A.; Samali, B.; Vessalas, K. Effect of polyvinyl alcohol (PVA) fibre on dynamic and material properties of fibre reinforced concrete. Construct. Build. Mater. 2013, 49, 374–383. [Google Scholar] [CrossRef]
- Wang, J.Q.; Dai, Q.L.; Si, R.Z.; Guo, S.C. Investigation of properties and performances of Polyvinyl Alcohol (PVA) fiber-reinforced rubber concrete. Construct. Build. Mater. 2018, 193, 631–642. [Google Scholar] [CrossRef]
- Khan, S.U.; Ayub, T. Modelling of the pre and post-cracking response of the PVA fibre reinforced concrete subjected to direct tension. Construct. Build. Mater. 2016, 120, 540–557. [Google Scholar] [CrossRef]
- Wang, J.; Hao, D. PVA fiber-reinforced ultrafine fly ash concrete: Engineering properties, resistance to chloride ion penetration, and microstructure. J. Build. Eng. 2023, 66, 105858. [Google Scholar] [CrossRef]
- Jang, J.G.; Kim, H.K.; Kim, T.S.; Min, B.J.; Lee, H.K. Improved flexural fatigue resistance of PVA fiber-reinforced concrete subjected to freezing and thawing cycles. Construct. Build. Mater. 2014, 59, 129–135. [Google Scholar] [CrossRef]
- Li, J.J.; Yan, J.; Xue, G.; Niu, J.G. Acoustic emission behavior of polyvinyl alcohol (PVA) fiber reinforced calcium sulphoaluminate cement mortar under flexural load. J. Build. Eng. 2021, 40, 102734. [Google Scholar] [CrossRef]
- Cao, M.L.; Liu, Z.X.; Xie, C.P. Effect of steel-PVA hybrid fibers on compressive behavior of CaCO3 whiskers reinforced cement mortar. J. Build. Eng. 2020, 31, 101314. [Google Scholar] [CrossRef]
- Liu, F.Y.; Ding, W.Q.; Qiao, Y.F. Experimental investigation on the tensile behavior of hybrid steel-PVA fiber reinforced concrete containing fly ash and slag powder. Construct. Build. Mater. 2020, 241, 118000. [Google Scholar] [CrossRef]
- Liu, F.Y.; Xu, K.; Ding, W.Q.; Qiao, Y.F.; Wang, L.B. Microstructural characteristics and their impact on mechanical properties of steel-PVA fiber reinforced concrete. Cement Concr. Compos. 2021, 123, 104196. [Google Scholar] [CrossRef]
- Zhou, Y.; Xiao, Y.; Gu, A.Q.; Zhong, G.C.; Feng, S.Y. Orthogonal experimental investigation of steel-PVA fiber-reinforced concrete and its uniaxial constitutive model. Construct. Build. Mater. 2019, 197, 615–625. [Google Scholar] [CrossRef]
- Sun, L.Z.; Hao, Q.; Zhao, J.L.; Wu, D.Y.; Yang, F. Stress strain behavior of hybrid steel-PVA fiber reinforced cementitious composites under uniaxial compression. Construct. Build. Mater. 2018, 188, 349–360. [Google Scholar] [CrossRef]
- Wang, L.; Guo, F.X.; Yang, H.M.; Wang, Y.; Tang, S.W. Comparison of fly ash, PVA fiber, MgO and shrinkage-reducing admixture on the frost resistance of face slab concrete via pore structural and fractal analysis. Fractals 2021, 29, 2140002. [Google Scholar] [CrossRef]
- Wang, L.; Zeng, X.M.; Li, Y.; Yang, H.M.; Tang, S.W. Influences of MgO and PVA fiber on the abrasion and cracking resistnce, pore structure and fractal features of hydraulic concrete. Fractal Fract. 2022, 6, 674. [Google Scholar] [CrossRef]
- Liu, F.Y.; Ding, W.Q.; Qiao, Y.F. Experimental investigation on the flexural behavior of hybrid steel-PVA fiber reinforced concrete containing fly ash and slag powder. Construct. Build. Mater. 2019, 228, 116706. [Google Scholar] [CrossRef]
- BS EN14651: 2005+A1:2007; Test Method for Metallic Fibre Concrete—Measuring the Flexural Tensile Strength (Limit of Proportionality (LOP), Residual). European Committee For Standardization: Brussels, Belgium, 2007.
- Golewski, G.L. Comparative measurements of fracture toughgness combined with visual analysis of cracks propagation using the DIC technique of concretes based on cement matrix with a highly diversified composition. Theor. Appl. Fract. Mec. 2022, 121, 103553. [Google Scholar] [CrossRef]
- Li, X.; Ma, F.H.; Chen, X.D.; Hu, J.; Wang, J.M. Fracture behavior investigation of self-compacting rubberized concrete by DIC and mesoscale modeling. J. Clean. Prod. 2023, 384, 135503. [Google Scholar] [CrossRef]
- Allain, M.; Ple, O.; Prime, N.; Roux, E.; Vacher, P. In situ DIC method to determine stress state in reinforced concrete structures. Measurement 2023, 210, 112483. [Google Scholar] [CrossRef]
- He, J.T.; Lei, D.; Di Luzio, G.; Zhu, F.P.; Bai, P.X. Mechanical properties measurement and micro-damage characterization of ITZ in concrete by SEM-DIC method. Opt. Laser. Eng. 2022, 155, 107064. [Google Scholar] [CrossRef]
- Lian, H.H.; Sun, X.J.; Yu, Z.P.; Lian, Y.J.; Xie, L.; Long, A.X.; Guan, Z.X. Study on the dynamic fracture properties and size effect of concrete based on DIC technology. Eng. Fract. Mech. 2022, 274, 108789. [Google Scholar] [CrossRef]
- Wang, F.; Kan, L.L.; Yu, J.T.; Duan, X.Z. Systematic studies on behaviors of ultra-high performance concrete subject to freezing and thawing cycles combining DIC technology. Construct. Build. Mater. 2023, 388, 131580. [Google Scholar] [CrossRef]
- Miura, T.; Sato, K.; Nakamura, H. The role of microcracking on the compressive strength and stiffness of cracked concrete with different crack widths and angles evaluated by DIC. Cement Concr. Compos. 2020, 114, 103768. [Google Scholar] [CrossRef]
- SL228-2013; Code for Design of Concrete Face Rockfill Dams. Chinese National Standard: Beijing, China, 2015.
- DL/T 5330−2015; Code for Mix Proportion Design of Hydraulic Concrete. Chinese National Standard: Beijing, China, 2015.
- JG/T 472-2015; Steel Fiber Reinforced Concrete. Chinese National Standard: Beijing, China, 2015.
- Banthia, N.; Gupta, R. Hybrid fiber reinforced concrete (HyFRC): Fiber synergy in high strength matrices. Mater. Struct. 2004, 37, 707–716. [Google Scholar] [CrossRef]


| Name | Density (g/cm3) | Diameter (mm) | Length (mm) | Elastic Modulus (GPa) | Tensile Strength (MPa) | Elongation (%) |
|---|---|---|---|---|---|---|
| RECS-15-12 | 1.3 | 0.031 | 12 | 41 | 1650 | 6 |
| Test Piece Number | Water/Binder Ratio | Sand Rate | The Quantity of Materials Used for 1 m3 of Concrete (Unit: kg/m3) | ||||||||
|---|---|---|---|---|---|---|---|---|---|---|---|
| Water | Cement | Fly Ash | Sand | Small Stones | Large Stones | Steel Fiber | PVA Fiber | Water Reducing Agent | |||
| JZ | 0.4 | 0.35 | 160 | 320 | 80 | 644 | 657.8 | 538.2 | 0 | 0 | 0.40% |
| S0.75 | 0.4 | 0.35 | 160 | 320 | 80 | 623.42 | 636.78 | 521 | 58.8 | 0 | 0.40% |
| S1.0 | 0.4 | 0.35 | 160 | 320 | 80 | 616.53 | 629.74 | 515.24 | 78.5 | 0 | 0.40% |
| S1.25 | 0.4 | 0.35 | 160 | 320 | 80 | 609.67 | 622.73 | 509.51 | 98.1 | 0 | 0.40% |
| S1.5 | 0.4 | 0.35 | 160 | 320 | 80 | 602.79 | 615.71 | 503.76 | 117.75 | 0 | 0.40% |
| S1.0P0.1 | 0.4 | 0.35 | 160 | 320 | 80 | 616.07 | 629.28 | 514.86 | 78.5 | 1.3 | 0.40% |
| S1.0P0.2 | 0.4 | 0.35 | 160 | 320 | 80 | 615.62 | 628.81 | 514.48 | 78.5 | 2.6 | 0.40% |
| S1.0P0.3 | 0.4 | 0.35 | 160 | 320 | 80 | 615.16 | 628.35 | 514.1 | 78.5 | 3.9 | 0.40% |
| S1.0P0.4 | 0.4 | 0.35 | 160 | 320 | 80 | 614.71 | 627.88 | 513.72 | 78.5 | 5.2 | 0.40% |
| Test Piece Number | JZ | S0.75 | S1.0 | S1.25 | S1.5 | S1.0P0.1 | S1.0P0.2 | S1.0P0.3 | S1.0P0.4 |
|---|---|---|---|---|---|---|---|---|---|
| Compressive strength (MPa) | 43.7 | 44.17 | 48.66 | 46.64 | 45.64 | 49.5 | 50.7 | 50.64 | 50.04 |
| Flexural Strength | A | B | C | D | E | R2 | |
|---|---|---|---|---|---|---|---|
| 0.22923 | −17.32713 | 0.43951 | −52.38159 | 0.25589 | 2.22962 | 0.95 | |
| 0.12327 | −29.83773 | 0.68098 | −24.41836 | 0.12618 | 9.28956 | 0.99 | |
| 0.26386 | −24.83106 | 0.51745 | −43.15311 | 0.21698 | 2.31504 | 0.93 | |
| 0.10383 | −25.44404 | 0.60194 | −35.56586 | 0.16902 | 9.79513 | 0.97 | |
| 0.06118 | −28.7121 | 0.66761 | −38.50862 | 0.18742 | 15.3302 | 0.97 |
Disclaimer/Publisher’s Note: The statements, opinions and data contained in all publications are solely those of the individual author(s) and contributor(s) and not of MDPI and/or the editor(s). MDPI and/or the editor(s) disclaim responsibility for any injury to people or property resulting from any ideas, methods, instructions or products referred to in the content. |
© 2024 by the authors. Licensee MDPI, Basel, Switzerland. This article is an open access article distributed under the terms and conditions of the Creative Commons Attribution (CC BY) license (https://creativecommons.org/licenses/by/4.0/).
Share and Cite
Wu, J.; Zhang, W.; Han, J.; Liu, Z.; Liu, J.; Huang, Y. Experimental Study on the Flexural Performance of Steel–Polyvinyl Alcohol Hybrid Fiber-Reinforced Concrete. Materials 2024, 17, 3099. https://doi.org/10.3390/ma17133099
Wu J, Zhang W, Han J, Liu Z, Liu J, Huang Y. Experimental Study on the Flexural Performance of Steel–Polyvinyl Alcohol Hybrid Fiber-Reinforced Concrete. Materials. 2024; 17(13):3099. https://doi.org/10.3390/ma17133099
Chicago/Turabian StyleWu, Jingjiang, Wenjie Zhang, Juhong Han, Zheyuan Liu, Jie Liu, and Yafei Huang. 2024. "Experimental Study on the Flexural Performance of Steel–Polyvinyl Alcohol Hybrid Fiber-Reinforced Concrete" Materials 17, no. 13: 3099. https://doi.org/10.3390/ma17133099
APA StyleWu, J., Zhang, W., Han, J., Liu, Z., Liu, J., & Huang, Y. (2024). Experimental Study on the Flexural Performance of Steel–Polyvinyl Alcohol Hybrid Fiber-Reinforced Concrete. Materials, 17(13), 3099. https://doi.org/10.3390/ma17133099