Article

Multi-Objective Optimization of Laser Cleaning Quality of Q390 Steel Rust Layer Based on Response Surface Methodology and NSGA-II Algorithm

1
School of Mechanical Engineering, University of South China, Hengyang 421001, China
2
School of Electrical Engineering, University of South China, Hengyang 421001, China
*
Author to whom correspondence should be addressed.
Materials 2024, 17(13), 3109; https://doi.org/10.3390/ma17133109
Submission received: 28 May 2024 / Revised: 18 June 2024 / Accepted: 21 June 2024 / Published: 25 June 2024

Abstract

:
To improve the laser cleaning surface quality of rust layers in Q390 steel, a method of determining the optimal cleaning parameters is proposed that is based on response surface methodology and the second-generation non-dominated sorting genetic algorithm (NSGA-II). It involves constructing a mathematical model of the input variables (laser power, cleaning speed, scanning speed, and repetition frequency) and the objective values (surface oxygen content, rust layer removal rate, and surface roughness). The effects of the laser cleaning process parameters on the cleaning surface quality were analyzed in our study, and accordingly, NSGA-II was used to determine the optimal process parameters. The results indicate that the optimal process parameters are as follows: a laser power of 44.99 W, cleaning speed of 174.01 mm/min, scanning speed of 3852.03 mm/s, and repetition frequency of 116 kHz. With these parameters, the surface corrosion is effectively removed, revealing a distinct metal luster and meeting the standard for surface treatment before welding.

1. Introduction

In the construction of nuclear power plants, the use of embedded steel rebar and steel plate components is ubiquitous, and among these components, Q390 steel plates are commonly used [1,2]. There is typically a loose rust layer on the surface, and in the welding process, water absorbed by the rust layer decomposes and produces a large amount of hydrogen, which cannot be discharged in time during the cooling process of the weld. The gases accumulate in the weld, forming pores and other defects, which significantly affects the homogeneity of the metal and the joint quality. Therefore, it is necessary to properly treat the surface of Q390 steel plates before welding. Although the commonly used treatment methods, such as manual grinding, mechanical grinding, and chemical cleaning, have practical applications, they also have limitations [3,4].
As an advanced manufacturing technology, laser cleaning has been widely used in various industrial fields, including electronics and semiconductors [5], healthcare [6], automotive manufacturing [7], aerospace [8], and heritage protection [9]. As industrial demand grows, research on the process parameters, surface quality, and performance of laser cleaning is expanding. For example, Ma et al. [10] conducted single-factor experiments to investigate the effects of laser cleaning on the rust layer of Q345 steel used in mining machinery. They specifically examined the influences of laser power and spot overlap rate on the post-cleaning surface integrity, ultimately determining optimal cleaning process parameters. Separately, Yao et al. [11] studied methods for cleaning rust layers on AH36 steel surfaces, successfully reducing surface roughness and enhancing corrosion resistance. Narayanan et al. [12] systematically observed the effects of varying parameters such as scanning speed and the number of passes on the removal depth, surface profile, roughness, and hardness of processed surfaces. In addition, Li et al. [3] explored the impact of laser scanning speed on the cleaning quality of Q345 steel, finding that the optimal cleaning effect was achieved at 3000 mm/s and noting a trend where oxygen content decreased initially and then increased as speed increased from 1000 mm/s to 6000 mm/s post-cleaning. Finally, Wu et al. [13] investigated how laser power and cleaning speed affected the macroscopic and microscopic surface morphology of cleaned specimens, revealing the formation of a re-melted layer on the substrate surface post-cleaning, which correspondingly enhanced its corrosion resistance. The types of lasers used by these researchers are shown in Table 1.
However, despite the progress made in existing research, studies in the field of laser cleaning have mainly focused on the impact of a single factor on the cleaning effect of the substrate, and few studies have considered the relationships between multiple factors and their overall impact on the quality of metal surface cleaning. In addition, genetic algorithms have not been widely used to optimize process parameters in the field of laser cleaning. The optimization strategy of response surface methodology (RSM) combined with a genetic algorithm is used in other fields such as laser cladding [14,15,16,17,18]. Therefore, in the present study, this method was introduced to the field of laser cleaning.
The rust layer of Q390 carbon steel was selected as the subject of study, and a fiber-optic pulsed laser was used to conduct experiments. Using the Box–Behnken design methodology, a mathematical model for the relationships between the laser cleaning process parameters (energy density, scanning speed, and cleaning speed) and the parameters of the surface quality assessment after cleaning (oxygen content, removal rate, and surface roughness) was developed. By analyzing the interaction patterns under different parameter combinations, this study attempted to optimize the impact indicators using a combination of response surface-based surrogate models and multi-objective genetic algorithms, thereby determining the optimal laser cleaning process parameters. This approach provides a scientific methodological basis and technical support for the laser cleaning of various carbon steels in real-life production.

2. Experimental Conditions and Methods

2.1. Materials and Equipment

In this study, Q390 steel was selected as the experimental material, and its chemical composition is presented in Table 2. The surface rust layer of the steel was formed in the natural environment, and a scanning electron microscopy (SEM) image of the sample surface (Figure 1) indicated that the rust layer was covered with a large number of cracks and pores. This indicated that the surface structure was relatively loose, making it difficult to block water and oxygen penetration; therefore, further corrosion of the interior was easily accelerated. Analysis of SEM images of the sample sections (Figure 2) revealed that the thickness of the rust layer varied between 50 and 65 μm, with significant positional differences. The cross-sectional micromorphology exhibited large pores in the middle of the rust layer and cracks in the upper locations, confirming that the structure of the rust layer was loose. The rust layer was not uniformly distributed on the specimen surface but grew from the surface to the internal pores. In addition, Figure 3 shows the results of an elemental content analysis of the surface rust layer; the rust was mainly composed of oxygen and iron, and it also contained carbon and trace amounts of other elements. The main thermophysical parameters of substrate and rust layer are shown in Table 3.
In the experiment, a fiber pulsed laser (HLCM-100W, Han’S Laser, Shenzhen, China) was used as the cleaning equipment. It had various adjustable parameters, such as the laser energy density, scanning speed, and repetition frequency, which were precisely adjusted through the control system. The detailed workflow of the experiment is shown in Figure 4. In this process, the laser beam was reflected through a scanning galvanometer, and a precise laser cleaning operation was performed in the X-direction. Simultaneously, the sample was moved along the Y-direction by controlling the two-dimensional moving platform, and its speed was defined as the laser cleaning speed. The main parameter ranges of the laser cleaning platform are presented in Table 4.

2.2. Experimental Design

In the pre-experiment stage, the surface rust layer of the sample was unevenly distributed, which made it difficult to accurately control the process parameters of single-laser cleaning and could have easily lead to ablation of oxide residues in some areas. Therefore, the high-power and low-power double-laser cleaning method was adopted during the secondary cleaning, and differences in the laser absorption rate of the material were utilized for process refinement [20,21,22]. The parameters of the second laser cleaning process significantly affect the quality of the cleaned surface.
To better investigate the effects of the parameters of the secondary laser cleaning process on the cleaning quality, the parameters were optimized using the RSM according to the equation of regression between each of the factors and the response values. The RSM is more effective than other methods in establishing predictive models for inputs and outputs, is suitable for precise optimization of continuous variables, and offers greater flexibility in the post-experimental phase. It allows for detailed exploration of nonlinear relationships and complex interactions among variables. By inputting the independent variables of laser cleaning process parameters and describing the degrees of correlation between multiple response values and the input factors, which are measurable, controllable, and continuous for k independent factors, the response function can be expressed as [23]
y = f ( x 1 , x 2 , x 3 , , x k 1 , x k ) .
Its quadratic regression equation is [24,25,26]
y = b 0 + i = 1 k b i x i + i = 1 k b i j x i i 2 + i = 1 k j = 1 k b i j x i x j + ε .
A three-factor, three-level Box–Behnken design (BBD) was used to design the experimental plan, and the RSM was applied to optimize the parameters of secondary laser cleaning in the laser cleaning process. The laser power (P), laser cleaning speed (Vx), laser repetition frequency (f), and laser scanning speed (Vy) were considered as independent variables for laser cleaning and rust removal. According to the results of previous experiments, the experiment levels were coded using the statistical software Design Expert 13, as shown in Table 5.
After the cleaning experiment, the surface removal rate (R%) was calculated using Image-Pro Plus 6 software. The surface morphology of the cleaned sample was observed using a field-emission scanning electron microscope (SEM, SU8020,Hitachi, Tokyo, Japan) and the oxygen content (O%) on the surface was analyzed with the attached energy-dispersive spectrometer (EDS, EX 350i, HORIBA, Paris, France). The maximum detection depth of the instrument is approximately 1 μm. Additionally, a 3D optical profilometer (Sensofar S neox 090, Sensofar, Barcelona, Spain) was employed to measure the surface roughness (Sa). The matrix and results of the experimental design are presented in Table 6, and the surface morphology images of the samples after cleaning corresponding to the experimental sequence in Table 6 are shown in Figure 5.

3. Effects of Parameters on Quality Characteristics

3.1. Mathematical Relationships and Analysis of Variance

The quadratic polynomials constructed from the response surface test describing the functional relationship between the input variables and the response values are as follows:
f ( 1 ) = 135.2185 1.693 x 1 0.580 x 2 0.0017 x 3 0.6870 x 4 0.004 x 1 x 2 1.7875 × 10 5 x 1 x 3 0.0056 x 1 x 4 1.5 × 10 7 x 2 x 3 + 0.0012 x 2 x 4 + 1.6875 × 10 6 x 3 x 4 + 0.04105 x 1 2 + 0.0015 x 2 2 + 2.5902 × 10 7 x 3 2 + 0.0034 x 4 2 , f ( 2 ) = 176.1046 1.8118 x 1 0.3281 x 2 0.0032 x 3 0.1788 x 4 + 0.0009 x 1 x 2 + 0.0001 x 1 x 3 + 2.5 × 10 5 x 1 x 4 + 6.5 × 10 7 x 2 x 3 0.0003 x 2 x 4 1.65 × 10 5 x 3 x 4 + 0.0189 x 1 2 + 0.0006 x 2 2 7.114 × 10 8 x 3 2 + 0.0017 x 4 2 f ( 3 ) = 8.8716 + 0.0099 x 1 + 0.0028 x 2 0.0005 x 3 0.0795 x 4 + 4.14 × 10 5 x 1 x 2 5.75875 × 10 6 x 1 x 3 0.0003 x 1 x 4 4.3875 × 10 7 x 2 x 3 1.8175 × 10 5 x 2 x 4 + 2.8563 × 10 6 x 3 x 4 + 0.0013 x 1 2 3.866 × 10 7 x 2 2 + 3.7352 × 10 8 x 3 2 + 0.00026 x 4 2 .
Here, f(1) represents the surface oxygen content, f(2) represents the rust layer removal rate, f(3) represents the surface roughness, x1 represents the laser power, x2 represents the cleaning speed, x3 represents the scanning speed, and x4 represents the repetition frequency.
Table 7 presents the analysis of variance (ANOVA) results for the three response values. The p-values for the oxygen content, rust layer removal rate, and surface roughness model are all <0.0001, the degrees of freedom (F-values) are large, and the values of the misfit terms are all >0.1, indicating that the selected confidence interval is reasonable and the model is effective. Correlation coefficients were used in this study to verify the reliability of the fit; e.g., the correlation squared coefficient was R2 = 0.9723 for the oxygen content model, indicating that 97.23% of the experimental data can be explained by this model. Similarly, both the rust layer removal rate model and the surface roughness model were shown to be reliable through their correlation coefficients. The signal-to-noise ratios for all three response values were >4, indicating that the test results were reliable.
Residual plots corresponding to the oxygen content, rust layer removal rate, and surface roughness models are shown in Figure 6. All the points are distributed around a straight line. Normally distributed probabilities closer to the straight line indicate a better fit.
In summary, the developed laser cleaning agent model establishes a close-to-real nonlinear relationship between the two factors with good significance and high prediction accuracy.

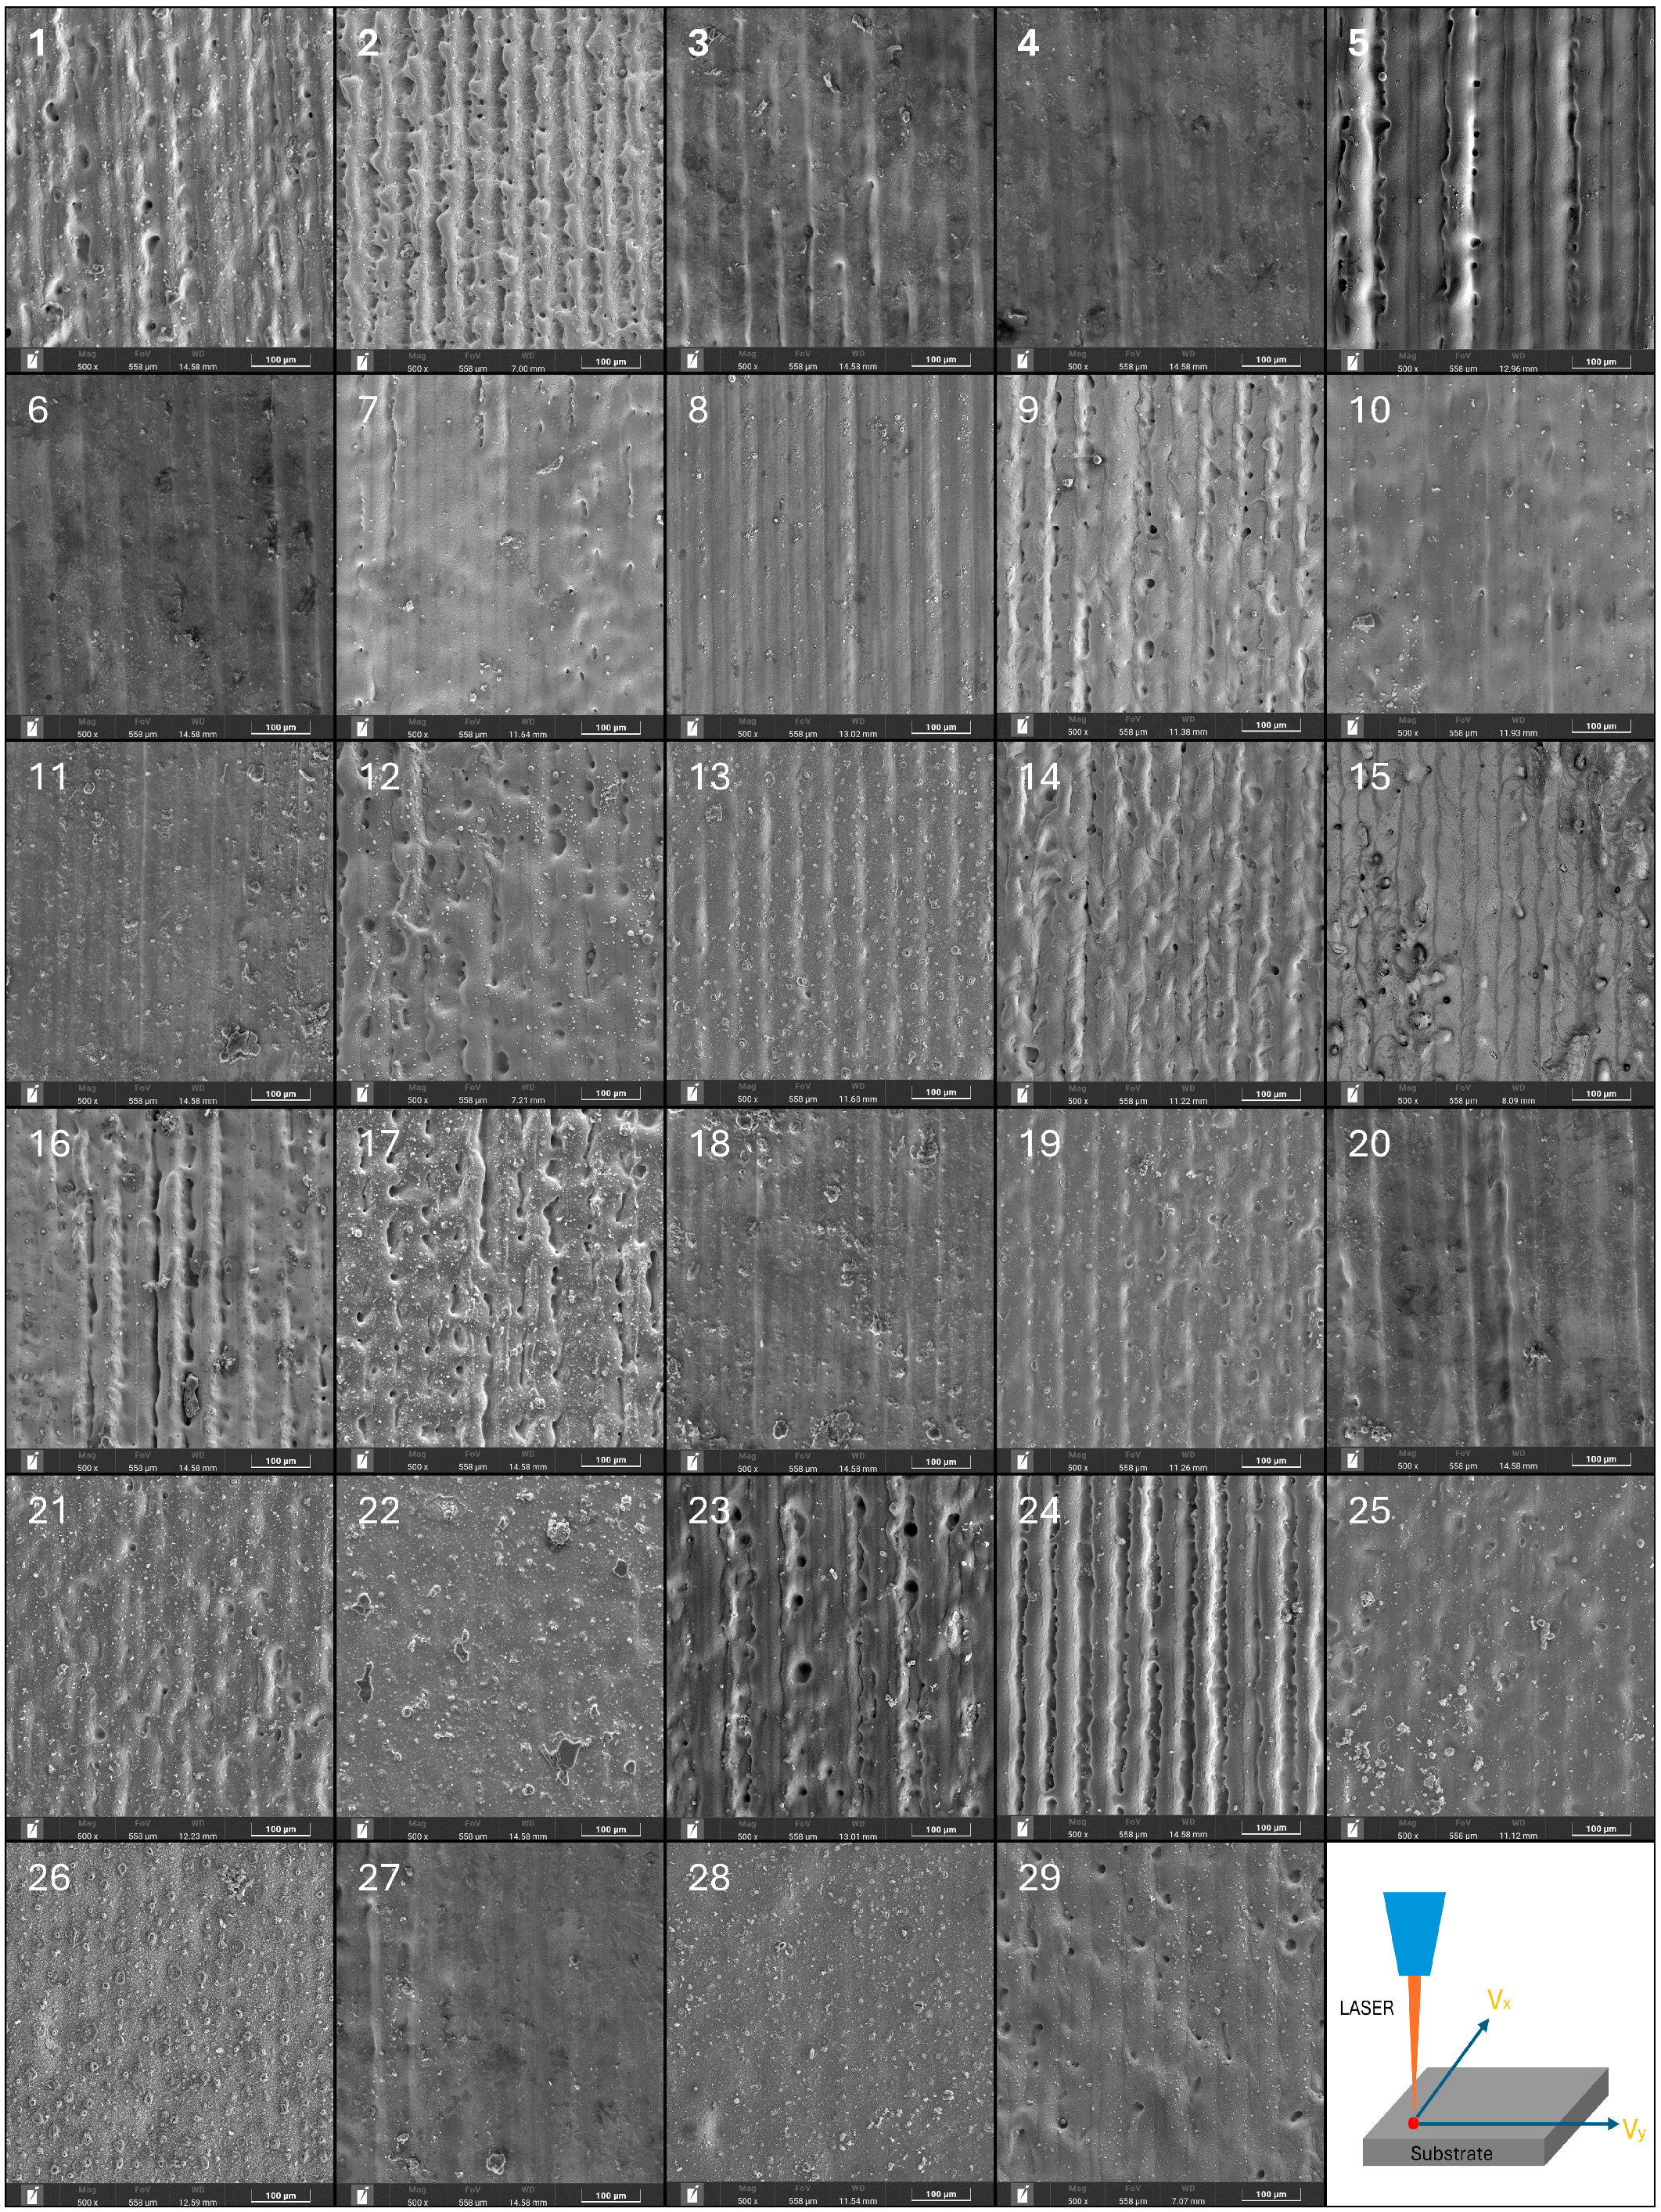
3.2. Effects of Parameters of Laser Cleaning and Rust Removal Process on Surface Quality

3.2.1. Effects of Process Parameters on Oxygen Content

According to the results from “Table 6: Response values of the ANOVA”, factors that significantly affect the oxygen content on the surface include the following: A, B, C, D, AB, AD, BD, A2, B2, C2, and D2. Among individual factors, the effects of cleaning speed and laser power are more significant than the other two parameters. The analysis shows that the interactions between power, cleaning speed, and repetition frequency, as well as between cleaning speed and scanning speed, are significant. Figure 7 demonstrates how these interactions influence the oxygen content. It is observed that in the lower-level range, the impact of laser power exceeds that of cleaning speed whereas in the higher level range, the influence of cleaning speed becomes more pronounced. However, merely changing the laser’s scanning speed and repetition frequency has no significant effect on the surface oxygen content.
As can be seen from Figure 8, the elemental oxygen content increases with an increase or decrease in the cleaning speed, which is explained as follows. Under excessive cleaning speeds, the temperature field in the thicker area of the surface rust layer does not fully reach the vaporization point of the rust layer, causing oxidized particles to remain on the substrate surface after cleaning [27]. When the cleaning speed is too low, there is a sharp increase in the surface temperature field, resulting in a prominent “ploughing effect” on the sample surface and ablation of the substrate, which causes the secondary oxidation of the substrate surface, increasing the surface oxygen content. The laser output energy can be effectively controlled by adjusting the laser output power and repetition frequency. In the circumstance of a higher cleaning speed, increasing the laser power can enhance the cleaning of residual oxidized particles, reducing the surface oxygen content, and when the cleaning speed is low, excessive power aggravates the substrate ablation. Increasing the laser repetition frequency reduces the laser energy density and increases the overlap rate of the laser spot. The two factors affect each other, weakening the effect of the laser repetition frequency on the temperature field. Therefore, the effect of the laser repetition frequency on the surface oxygen content is insignificant compared with those of the laser power and cleaning speed. As shown in Figure 8, the surface oxygen content can be reduced by using a combination of the median parameter values of the cleaning speed, laser power, and repetition frequency.

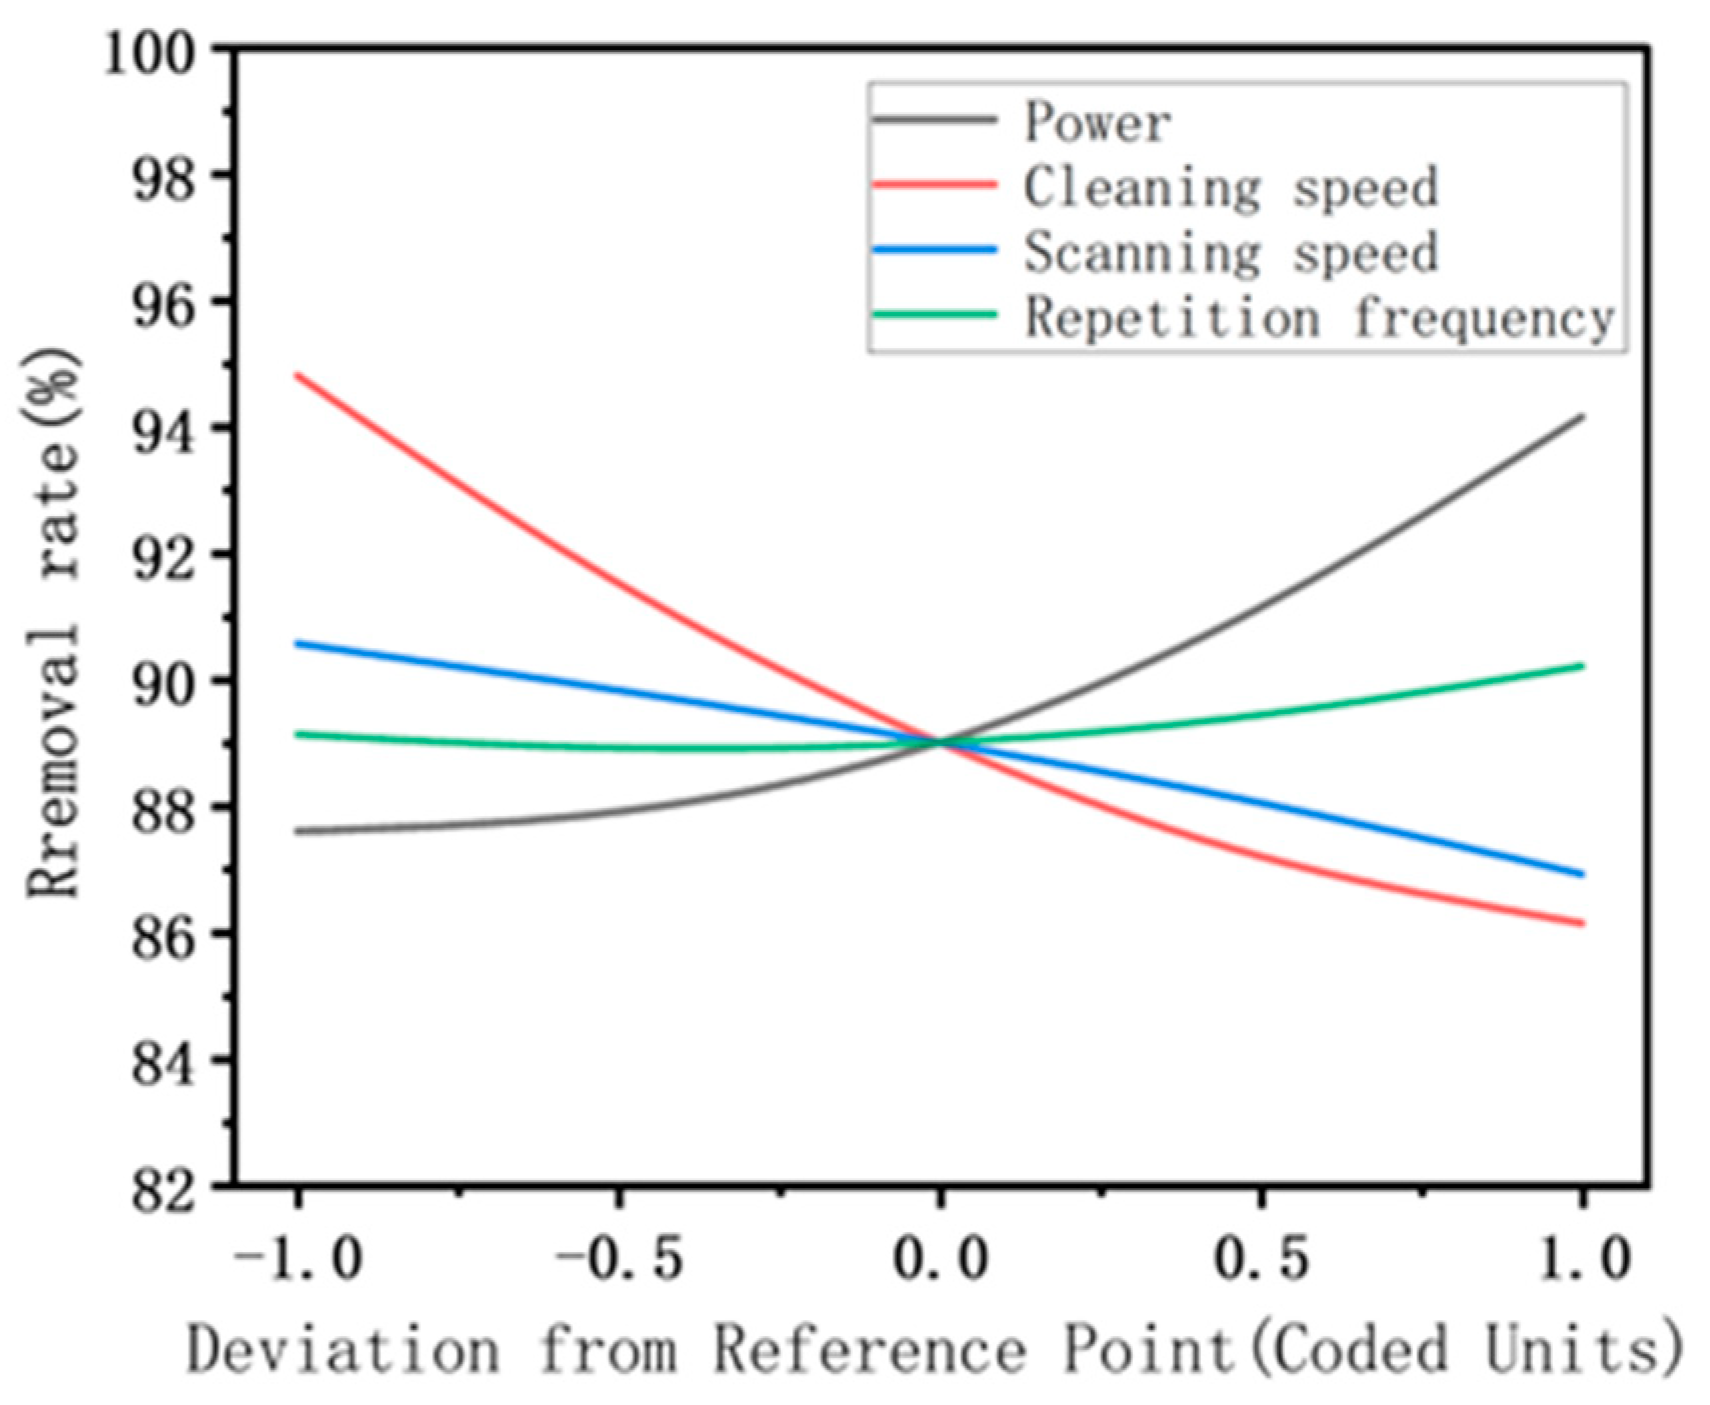
3.2.2. Effects of Process Parameters on Removal Rate

Combining the response values of the ANOVA from Table 6 with the effects of the interactions of various factors shown on the removal rate in Figure 9, it is evident that the significant factors influencing the removal rate of the rust layer are A, B, C, D, AC, CD, A2, B2, and D2, among which the single factors with the most significant influence are the laser cleaning speed and laser power, also the change law of laser power is opposite to that of cleaning speed.
Figure 10 shows two significant interaction terms of cleaning speed and laser power and their combined interactions with regard to removal rate. As shown in Figure 10a, when the laser power increases and the cleaning speed decreases, the rust layer removal rate increases rapidly, reaching a maximum of 98.95%. This is because when the laser cleaning speed is reduced, the laser residence time per unit area is increased, implying that the rust layer absorbs more energy per unit time and vaporizes more material on the surface layer. Meanwhile, the increase in laser power increases the energy density input to the sample surface and thus increases the removal rate of the rust layer. In contrast, in Figure 10b, increases in the laser scanning speed reduce the superposition rate of the spot, weakening the cumulative thermal effect of the surface temperature field and hindering the removal of the rust layer. Figure 10c shows the interaction between the laser repetition frequency and scanning speed. With the combination of a low scanning speed and high repetition frequency, a high removal rate can be obtained. Therefore, according to the three-dimensional response surface model, the combination of a low cleaning speed, high laser power, low scanning speed, and high repetition frequency results in a high rate of removal of the rust layer.

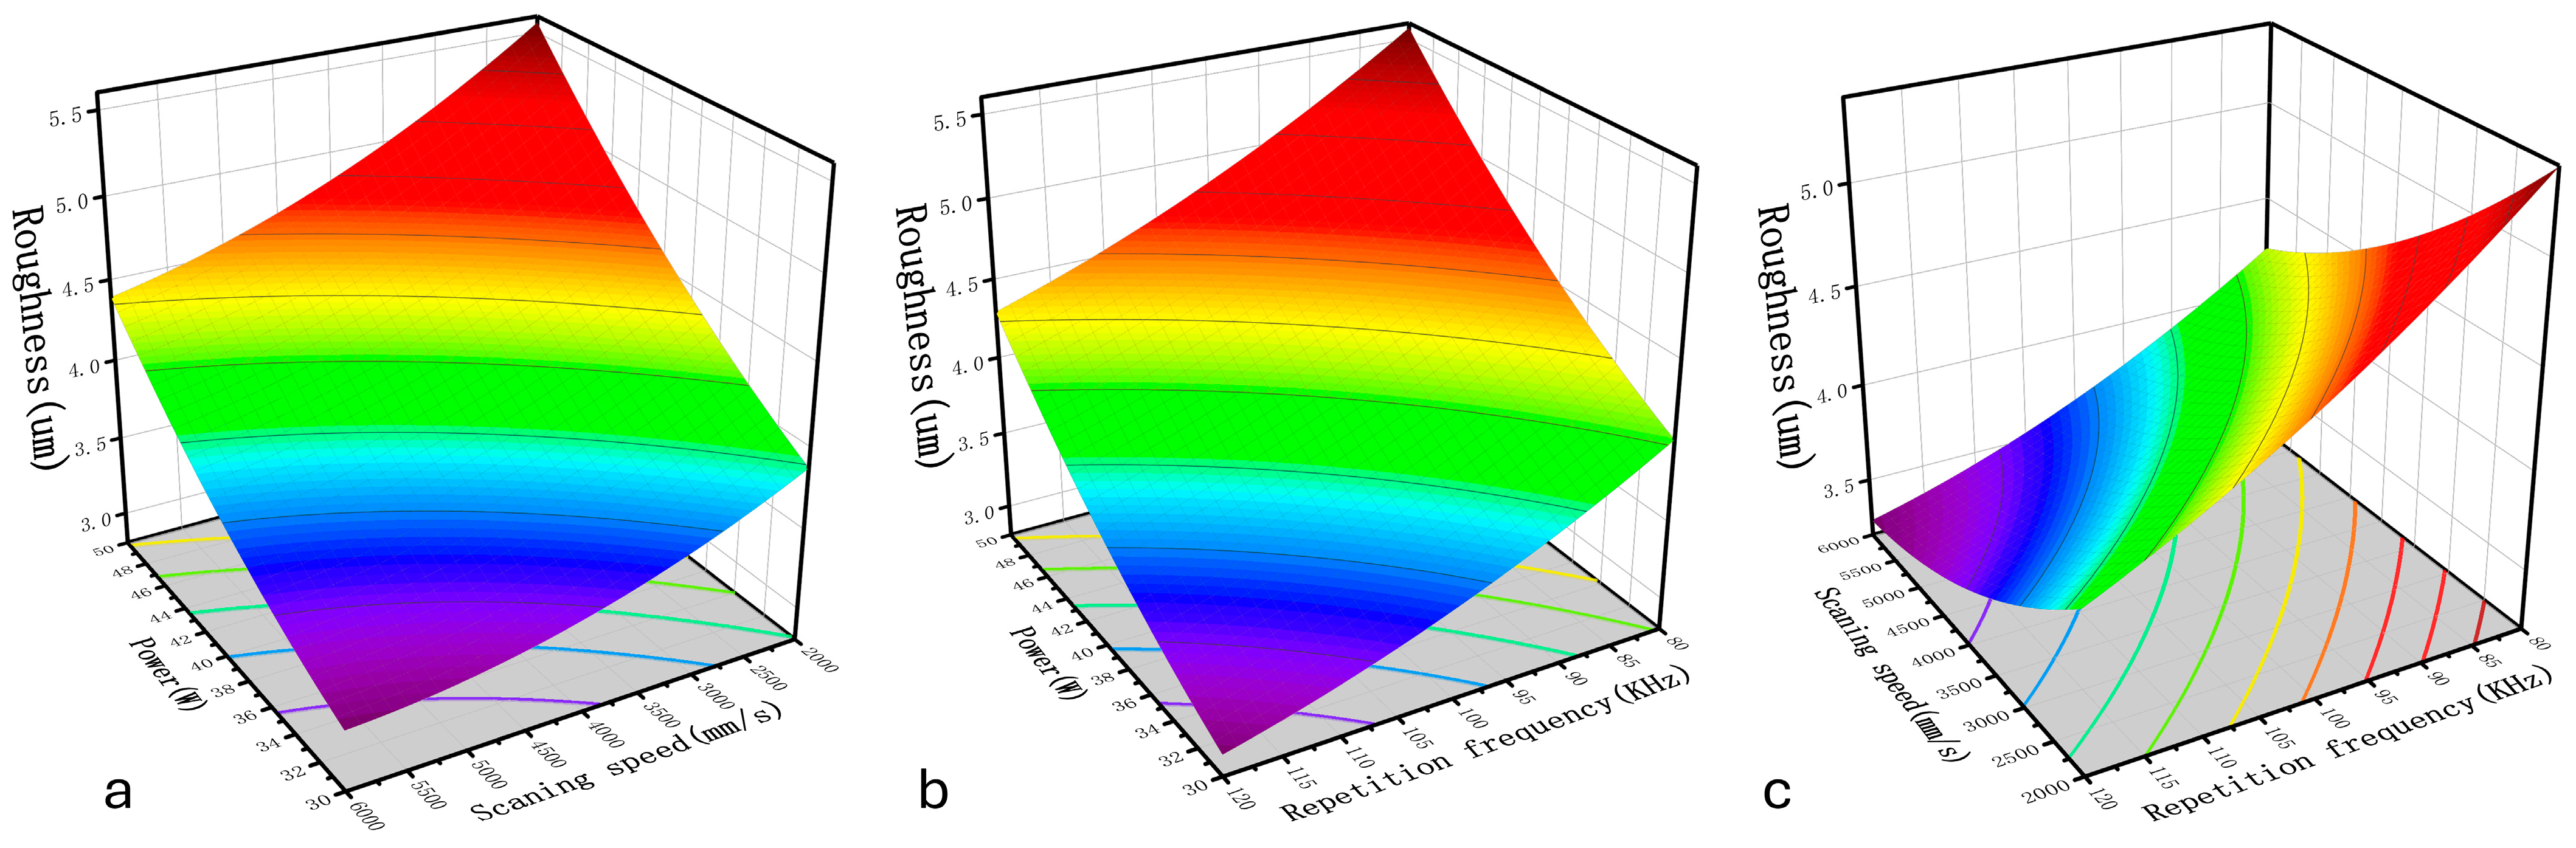
3.2.3. Effects of Process Parameters on Roughness

As shown in Table 7 and Figure 11, the factors that have a significant effect on the sample surface roughness after the cleaning process are A, C, D, AC, CD, A2, B2, and D2, among which the most significant single factor is the laser power. The laser power is an important parameter that determines the total energy of the laser output, and when it increases, the peak energy density of the laser increases, more energy is received at a single point, and the ablation becomes deeper, increasing the sample surface roughness. The factor with the second-most significant effect is the laser repetition frequency. Although increasing the laser repetition frequency reduces the spot overlap rate of the laser, it increases the output energy density of the laser. Therefore, as indicated by the interaction between the laser power and repetition frequency in Figure 12b, the surface roughness increases significantly with an increase in laser power and a reduction in repetition frequency and the interaction between the laser power and scanning speed follows a similar pattern. As shown in Figure 12a, simultaneously increasing the power and reducing the scanning speed strengthens the “ploughing effect” on the sample surface, which leads to deeper grooves on the substrate surface, significantly increasing the roughness of the substrate. Regarding the interaction between the laser repetition frequency and laser scanning speed, as shown in Figure 12c, when the repetition frequency increases, the effect of the scanning speed on the surface roughness weakens. In summary, for reducing the surface roughness, the laser power should be reduced and the scanning speed and repetition frequency should be increased.

3.3. Optimization of Surface Quality Characteristics after Cleaning Based on NSGA-II

The second-generation non-dominated sorting genetic algorithm (NSGA-II) is an algorithm for multi-objective optimization problems proposed by Deb et al. [28,29]. It ensures the diversity and excellence of solutions through rapid non-dominated ordering and crowding distance computation. In practice, NSGA-II combines binary tournament selection, crossover, and mutation to generate new populations and employs an elite strategy to maintain the propagation of superior solutions. It is suitable for finding the Pareto-optimal solution sets and has been widely used to solve complex multi-objective optimization problems [30,31,32]. NSGA-II has several significant advantages over particle swarm optimization [33,34] and other genetic algorithms [35]. First, it does not compute the algorithmic fitness function and weights; nor does it need to perform second-order fitting based on function fitting. Second, it is highly adaptable to complex problems, such as non-convex and nonlinear problems, and does not require excessive parameter tuning [36]. Thus, it has good performance for multi-objective optimization problems—especially in maintaining diversity and finding Pareto-optimal solutions.
In the previous study described in Section 3, a mathematical model was developed using Response Surface Methodology (RSM) to solve a multi-objective optimization problem. This problem involved process parameters such as laser power, cleaning speed, scanning speed, and repetition frequency, with the objective variables being oxygen content, removal rate, and surface roughness. The oxygen content and roughness needed to be minimized, while the removal rate needed to be maximized. Typically, optimization problems mean finding the minimum value of a function; therefore, when the minimization of an objective is required, the straightforward method is to solve for the minimum value. To address the removal rate function within a unified optimization framework, the problem of objective maximization is transformed into a minimization problem by prefixing the objective function of the removal rate with a negative sign, ensuring that all optimization objectives are efficiently dealt with. Thus, the following functional equation is obtained:
m i n F x 1 , x 2 , x 3 , x 4 = m i n F 1 x 1 , x 2 , x 3 , x 4 m a x F 2 x 1 , x 2 , x 3 , x 4 m i n F 3 x 1 , x 2 , x 3 , x 4       s u b j e c t       t o       30 x 1 50 150 x 2 250 2000 x 3 4000 80 x 4 120
NSGA-II was used to obtain the Pareto-optimal solution sets, as shown in Figure 13. The parameters were set as follows: the population size was 250, the number of iterations was 200, and the crossover ratio was 0.85. The obtained Pareto-optimal solution set contained 105 groups of solutions. Results from the algorithm indicated that there are constraints among the optimal solution set and that the surface removal rate (F3) decreases when the surface oxygen content (F1) or surface roughness (F2) of the sample decreases.
On the basis of the actual laser cleaning process and steel surface treatment standards [37], an evaluation standard for the laser cleaning of Q390 steel rust layers is proposed. After laser cleaning, the substrate surface should exhibit a clear metal luster with no rust layer residue, the oxygen content should be controlled at ≤10 wt.%, the surface removal rate should be ≥90% [23], and the laser-cleaned sample surface should be smooth enough in cases where light spot cleaning marks are permitted to make sure the flowability of the weld pool reaches the standard during the subsequent welding process, to enhance the bonding between the weld metal and the base material, and to improve the stress corrosion cracking resistance of the material [38,39].
According to the aforementioned criteria, there are 28 groups of solutions that meet the requirements, and the corresponding number of intervals for each variable is shown in Figure 14. For most of the optimal solutions, the laser power is in the range of 35–45 W. Similarly, for the scanning speed, the optimal solutions are mainly concentrated in the center segment. When the cleaning speed is low, all the optimal solutions are within the interval of 150–200 mm/min. Meanwhile, most of the satisfactory repetition frequencies are concentrated in the interval of 110–120 kHz.

3.4. Optimization Results and Validation of Surface Quality and Laser Process Parameters

According to the standard requirements of laser cleaning, four groups were randomly selected from the twenty-eight groups of satisfactory solutions for verification experiments, and the results are presented in Table 8. The error ranges of all the objective values were ≤5%, the surfaces of the samples exhibited a clear metallic luster, and the oxygen content was <10%. The No. 1 area was selected to examine its surface morphology, and the results are shown in Figure 15. The surface rust layer was completely removed and the surface roughness of the sample was appropriately reduced while allowing cleaning marks to remain. According to the laser cleaning evaluation method mentioned above, the rust removal effect was good and the rust removal efficiency was high. The resulting optimal parameter set was as follows: a laser power of 44.99 W, cleaning speed of 174.01 mm/min, scanning speed of 3852.03 mm/s, and repetition frequency of 116 kHz. By comparing its results with the multi-objective optimization results generated using the Design Expert software (refer to Table A1 in Appendix A), it was found that its accuracy is significantly higher than the accuracy of the optimization results obtained through the response surface method.

4. Conclusions

The objective of this study was to explore the optimization strategy of the laser cleaning process for removing the surface rust layer of Q390 steel through experimental methods. RSM was applied to design the experiments and build the corresponding statistical models, and the models were optimized using NSGA-II to accurately predict the surface quality after laser cleaning. This paper has detailed the experimental design, model construction, and optimization process. The accuracy of the model predictions was verified through experiments. The results of the experimental analysis were as follows:
(1)
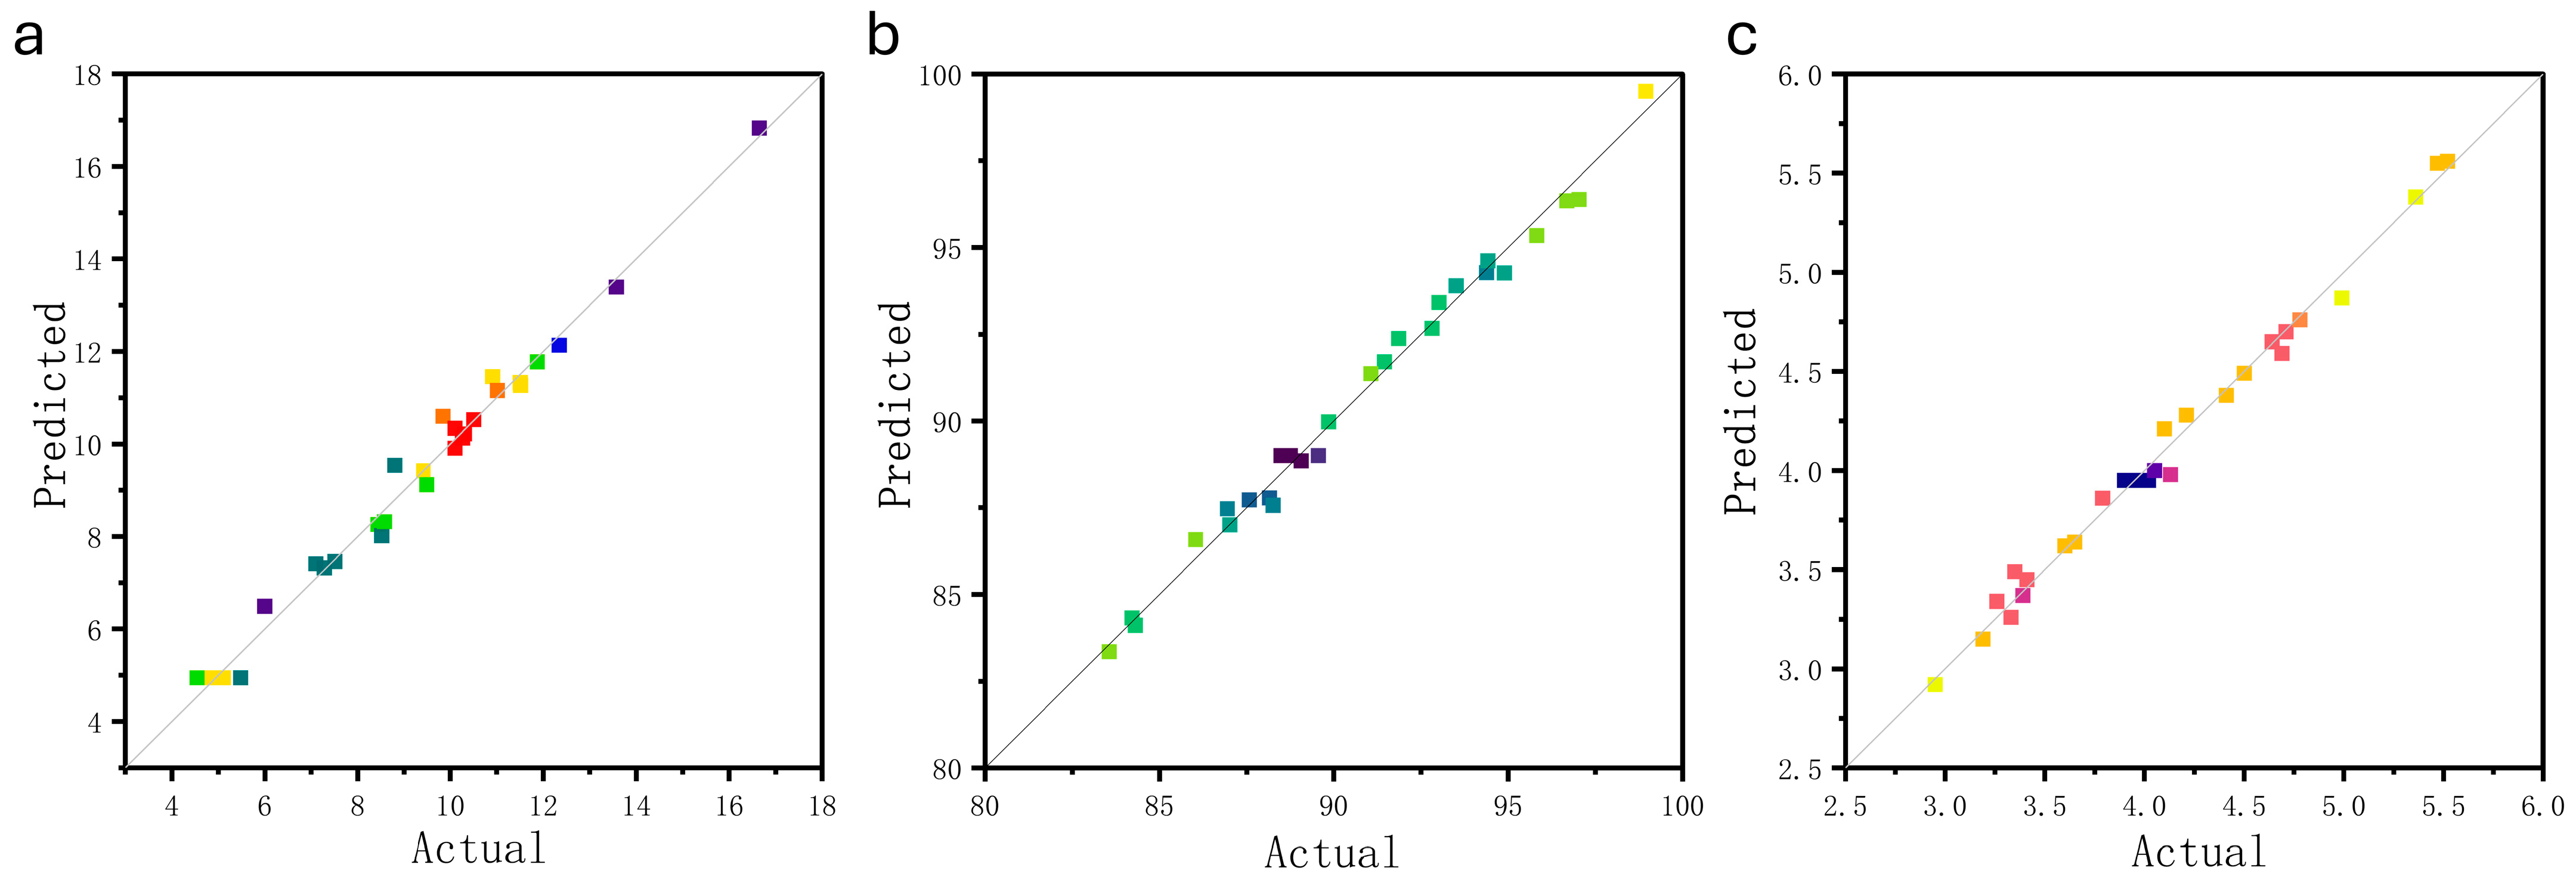
The relationship between the objective value and the input variables had been effectively represented by the proxy mode based on the response surface, and evaluation parameters such as the p-value, F-value, and signal-to-noise ratio indicated that the proxy model was well fitted.
(2)
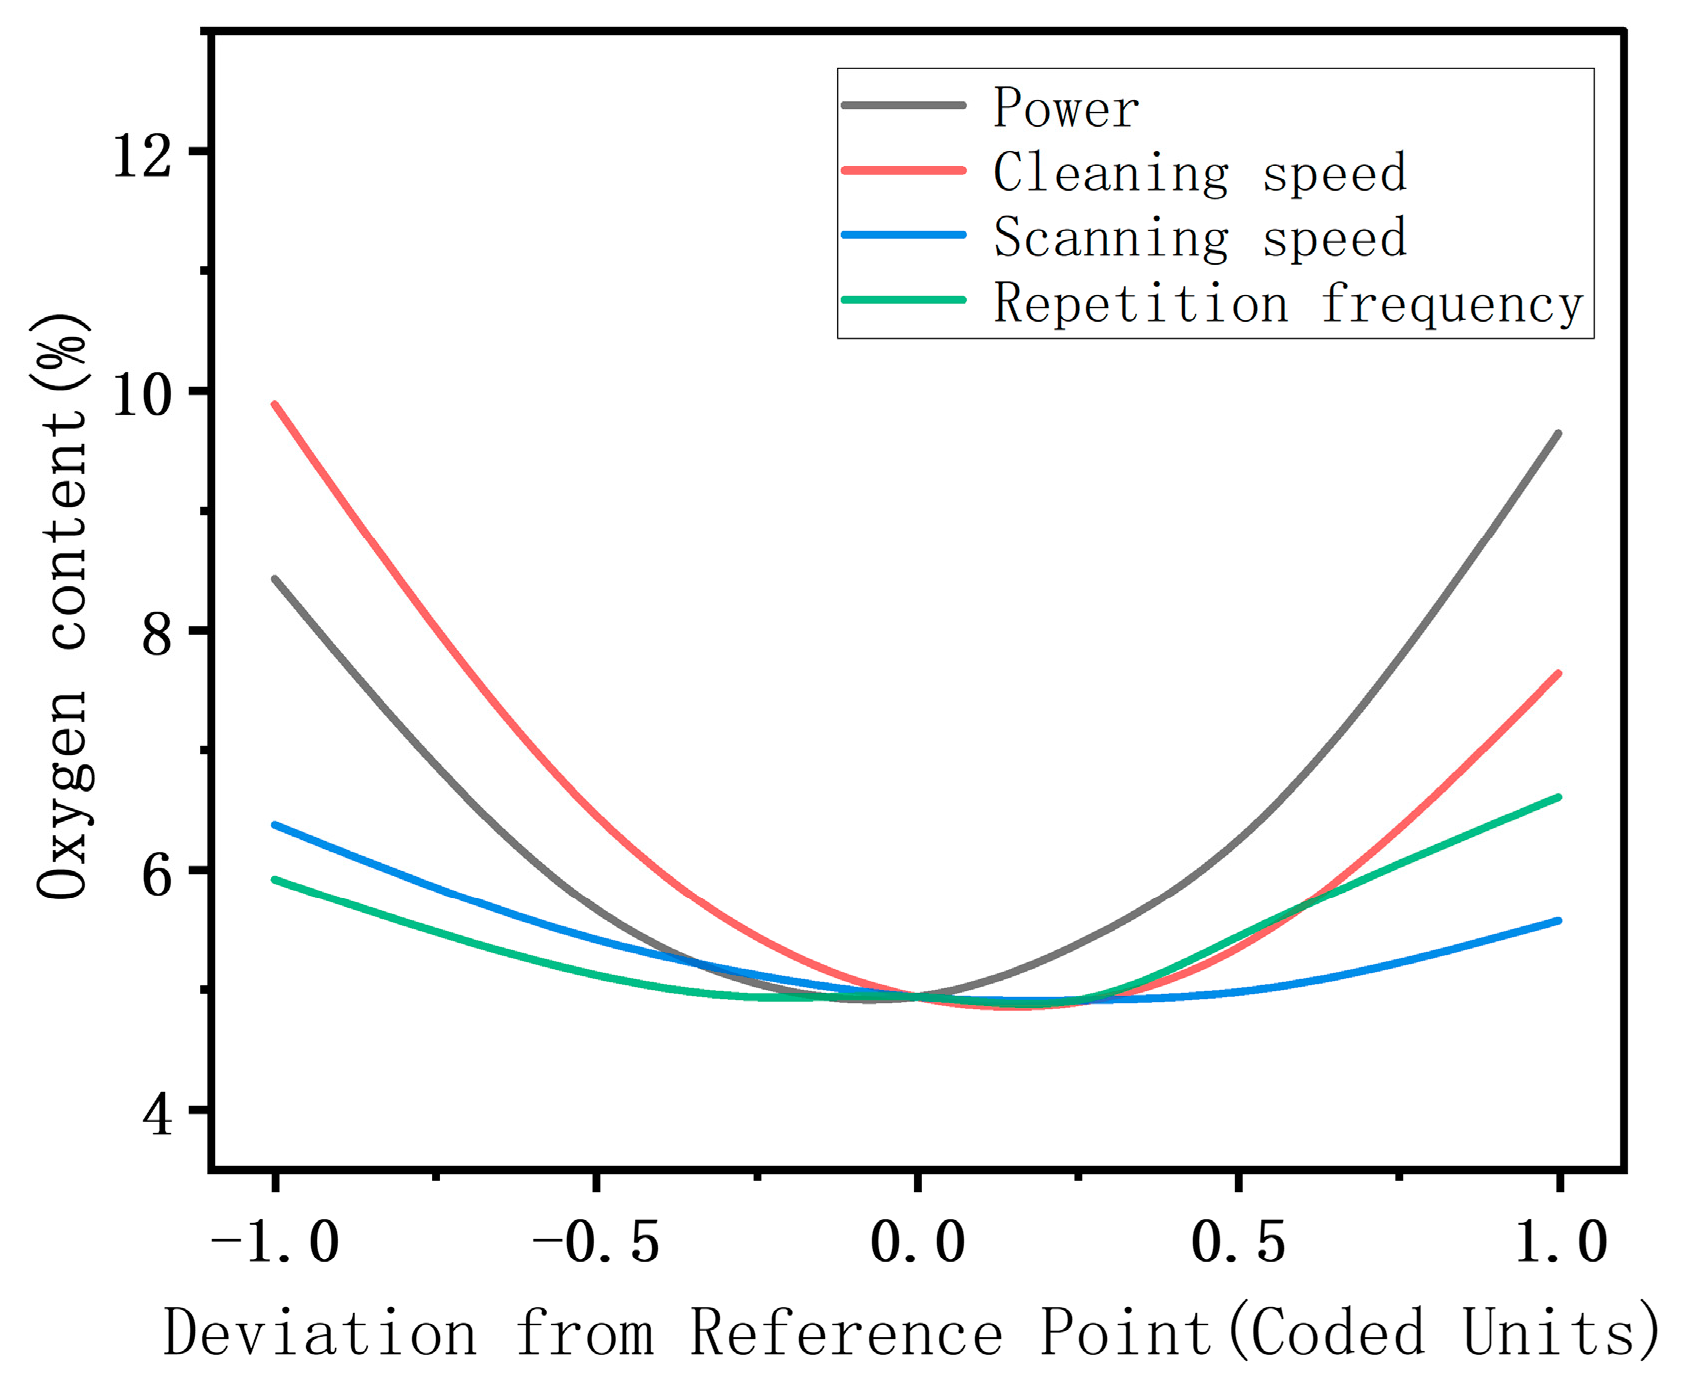
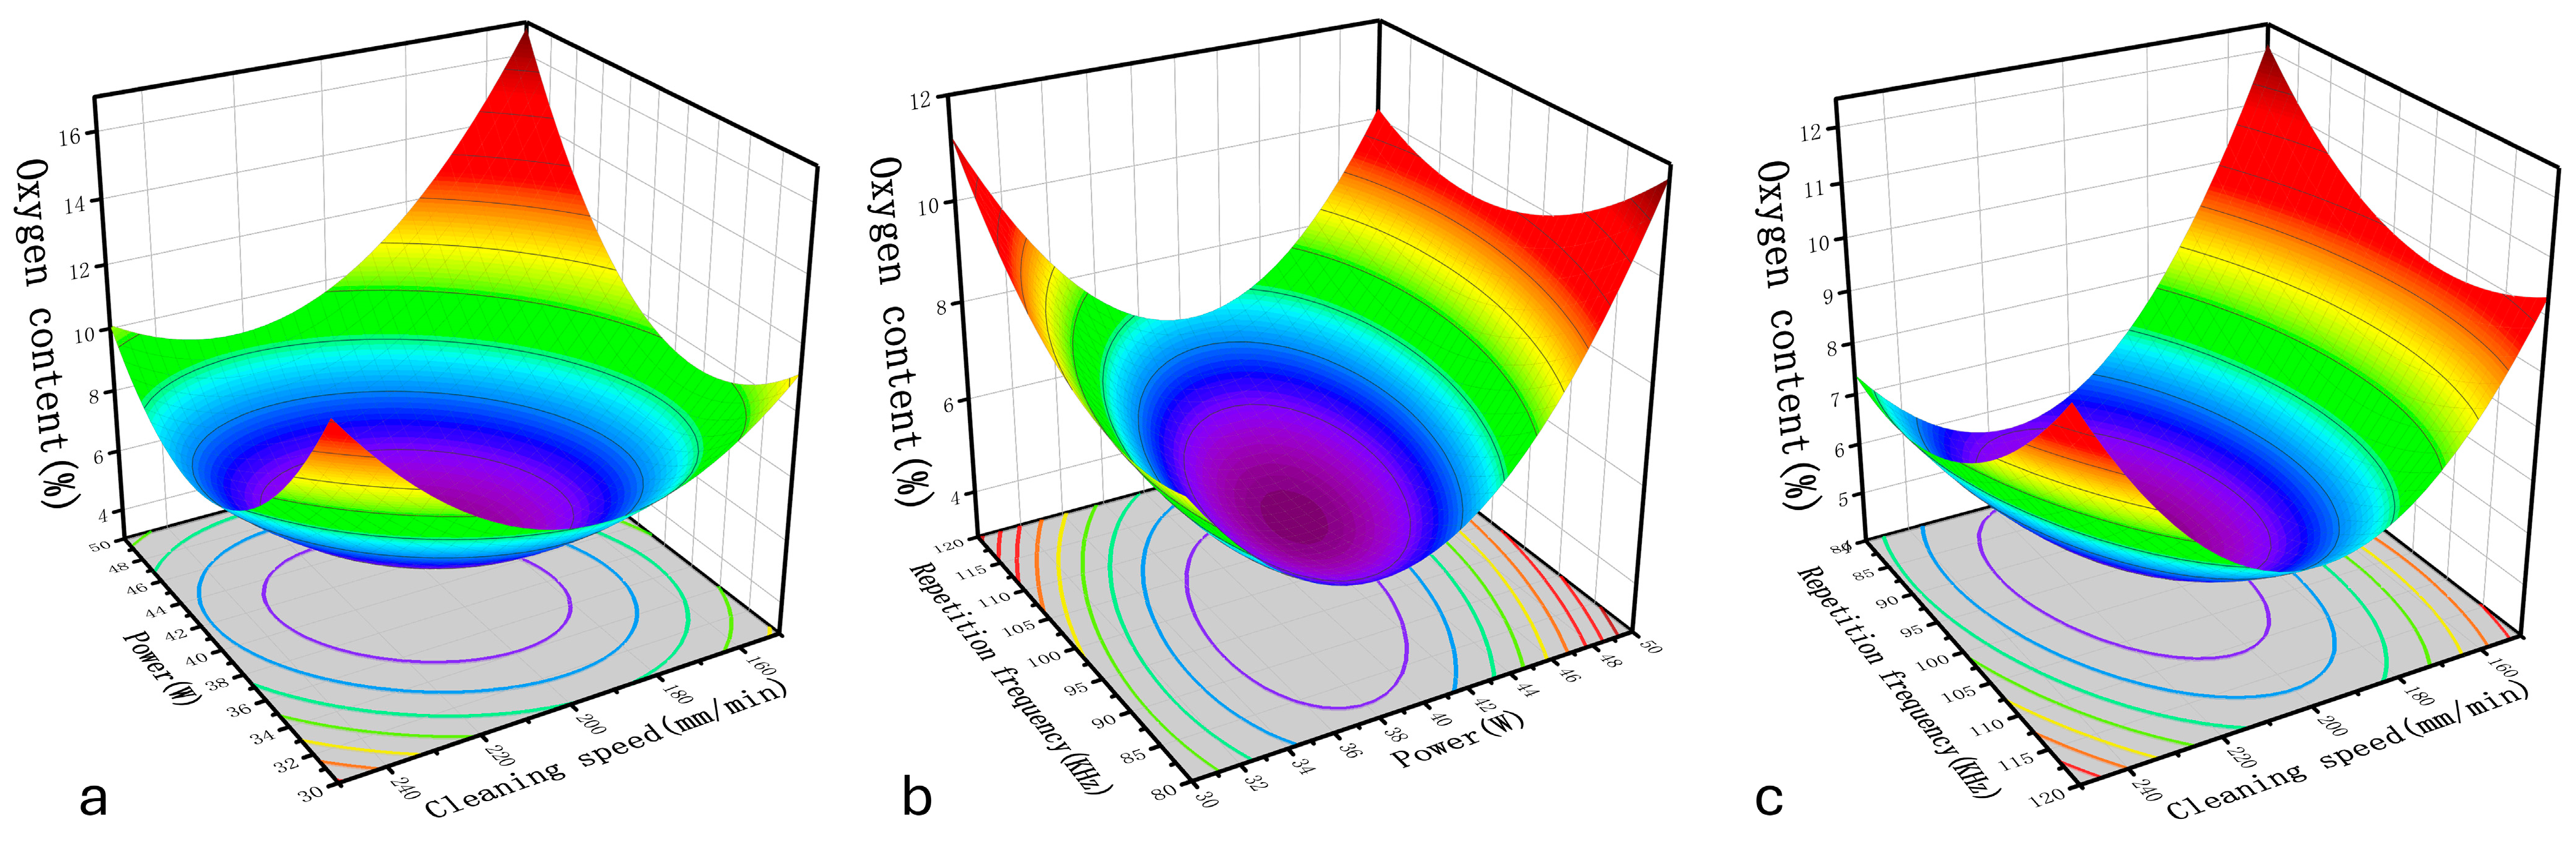
The pattern of the influence of each single factor on the surface cleaning quality after secondary laser cleaning was analyzed, along with the influence pattern for the interaction of laser power, cleaning speed, scanning speed, and repetition frequency. For the surface oxygen content, the single factors with the most significant influence were the cleaning speed and laser power, and the median value of each process parameter could be selected to minimize the oxygen content. Regarding the surface removal rate, the combination of a low cleaning speed, high laser power, and low scanning speed resulted in the highest removal rate. The single factor most significantly affecting the surface roughness was the laser power, and the surface roughness could be reduced by increasing the scanning speed and repetition frequency.
(3)
On the basis of the mathematical model constructed using the response surface, NSGA-II was employed to find the optimum, from which good objective values were obtained, and the optimal process parameters were obtained as follows: a laser power of 44.99 W, cleaning speed of 174.01 mm/min, scanning speed of 3852.03 mm/s, and repetition frequency of 116 kHz.
In this paper, a new optimization method for laser cleaning parameters of carbon steel rust layers has been proposed, and the influence of parameters on the target value has been studied, which has provided effective support for practical production applications. It is hoped that a comprehensive reference framework for laser cleaning process parameters of carbon steel will be constructed on this basis to guide and improve the cleaning process in industrial applications. Next, attempts will be made to further optimize the NSGA-II algorithm and to integrate it with the BP genetic algorithm in order to analyze the optimization effects of laser cleaning process parameters.

Author Contributions

Conceptualization, G.W. and Z.L.; methodology, G.W. and J.D.; validation, G.W. and J.L.; formal analysis, G.W.; investigation, W.T. and W.Z.; resources, Z.L. and J.D.; formal analysis, G.W.; software, G.W.; data curation, G.W.; writing—original draft preparation, G.W.; supervision, Z.L. All authors have read and agreed to the published version of the manuscript.

Funding

This research was funded by the National Key Research and Development Program of China, grant number 2019YFC1907704. This research was funded by the Postgraduate Scientific Research Innovation Project of Hunan Province, grant number QL20210227.

Institutional Review Board Statement

Not applicable.

Informed Consent Statement

Not applicable.

Data Availability Statement

The original contributions presented in the study are included in the article, further inquiries can be directed to the corresponding author.

Conflicts of Interest

The authors declare no conflicts of interest.

Appendix A

Appendix A.1. Computational Formul

Laser fluence [23,40]:
F 0 = 4 P π d 2 f
Laser energy density refers to the energy distributed by a laser beam over a unit area. It is calculated by dividing the total energy of the laser beam by the area it irradiates.
Laser spot overlap rate [23,40]:
η = 1 v f · d × 100 %
In laser processing, the overlap ratio of laser spots refers to the degree of mutual overlap of successive laser spots on the surface of the workpiece.
In the formula, P represents the average laser power; d denotes the focused diameter of the laser spot (mm), f indicates the pulse repetition frequency (Hz), and v represents the scanning speed (mm/s).

Appendix A.2. Response Surface Multi-Objective Optimization Results

Parameter settings were conducted in Design Expert software, setting the weights for the oxidation amount and removal rate at 5, and the weight for roughness at 4, for optimization. Three sets of parameters were randomly selected from the results for experimental verification. The parameter sets and verification results are shown in Table A1 below.
Table A1. Multi-objective solution set based on Design Expert.
NoP/WVy/(mm/min)Vx (mm/s)f/kHzO%E%R%E%Sa/µmE%
PreActPreActPreAct
137.168162.733354.061208.8419.2944.8%94.8190.125.23%3.3903.781210.34%
244.845183.4424834.931208.0279.81218.1%93.3091.561.90%3.6813.87545.01%
337.232163.633311.701198.7668.1567.47%94.7589.226.19%3.4023.71858.51%

References

  1. Zhang, Y.; Lan, L.; Shi, Q. Correlation between Weld Metal Microstructure Evolution and Welding Process Parameters of Low Alloy Ferritic Steel Weldments. Steel Res. Int. 2023, 94, 2200797. [Google Scholar] [CrossRef]
  2. Cheng, X.; Gu, X.; Bie, G.; Yang, J.; Zhou, J.s.; Liu, C. Influence of ultrasonic shock treatment and post-welding heat treatment on welding residual stress of large thickness nuclear power structural steel. Weld. Technol. 2022, 47, 5. [Google Scholar] [CrossRef]
  3. Li, X.; Li, C.; Wang, D.; Lei, Y.; Li, M.; Huang, W. Effect of Laser Scanning Speeds on Cleaning Quality of Rusted Layer on Q345 Steel Surface. Chin. J. Lasers 2020, 47, 1002010. [Google Scholar] [CrossRef]
  4. Zhu, G.; Xu, Z.; Jin, Y.; Chen, X.; Yang, L.; Xu, J.; Shan, D.; Chen, Y.; Guo, B. Mechanism and application of laser cleaning: A review. Opt. Lasers Eng. 2022, 157, 107130. [Google Scholar] [CrossRef]
  5. Hecht, C.; Slama, J.-N.; Sprenger, M.; HauBler, F.; Sippel, M.; Franke, J. Laser Cleaning of Flux Residues on Copper Surfaces in Electronics Production. In Proceedings of the 2022 IEEE 28th International Symposium for Design and Technology in Electronic Packaging (SIITME), Bucharest, Romania, 26–29 October 2022; pp. 65–69. [Google Scholar]
  6. Chen, L.; Lingfei, J.; Yan, W.; Qiurui, L.; Yijian, J.; Kai, Y. Research and Mechanism Study on Refurbishing Stainless Bracket Using Picosecond Laser Based on Laser Cleaning Technology. Chin. J. Lasers 2014, 41, 84–90. [Google Scholar] [CrossRef]
  7. AlShaer, A.W.; Li, L.; Mistry, A. The effects of short pulse laser surface cleaning on porosity formation and reduction in laser welding of aluminium alloy for automotive component manufacture. Opt. Laser Technol. 2014, 64, 162–171. [Google Scholar] [CrossRef]
  8. Li, Z.; Zhang, D.; Su, X.; Yang, S.; Xu, J.; Ma, R.; Shan, D.; Guo, B. Removal mechanism of surface cleaning on TA15 titanium alloy using nanosecond pulsed laser. Opt. Laser Technol. 2021, 139, 106998. [Google Scholar] [CrossRef]
  9. Bertasa, M.; Korenberg, C. Successes and challenges in laser cleaning metal artefacts: A review. J. Cult. Herit. 2022, 53, 100–117. [Google Scholar] [CrossRef]
  10. Ma, M.; Wang, L.; Li, J.; Jia, X.; Wang, X.; Ren, Y.; Zhou, Y. Investigation of the Surface Integrity of Q345 Steel After Nd:YAG Laser Cleaning of Oxidized Mining Parts. Coatings 2020, 10, 716. [Google Scholar] [CrossRef]
  11. Lu, Y.; Ding, Y.; Wang, G.; Yang, L.; Wang, M.; Wang, Y.; Guo, B. Ultraviolet laser cleaning and surface characterization of AH36 steel for rust removal. J. Laser Appl. 2020, 32, 032023. [Google Scholar] [CrossRef]
  12. Narayanan, V.; Singh, R.K.; Marla, D.; Kondo, Y. Laser cleaning for rust removal on mild steel: An experimental study on surface characteristics. MATEC Web Conf. 2018, 221, 01007. [Google Scholar] [CrossRef]
  13. Wu, Q.; Sun, X.; Sun, J.; Han, L.; Liu, L. Effect of Continuous Laser Cleaning Process Parameters on Surface Quality of Q235B Carbon Steel Rust Layer. Laser Optoelectron. Prog. 2023, 60, 2314002. [Google Scholar] [CrossRef]
  14. Zhang, Y.; Xu, Y.; Sun, Y.; Cheng, W. Surface quality optimization of laser cladding based on surface response and genetic neural network model. Surf. Topogr. Metrol. Prop. 2022, 10, 044007. [Google Scholar] [CrossRef]
  15. Yanyan, W.; Jiahao, L.; Linsen, S.; Chengming, S. Multi-Objective Optimization of Laser Cladding Parameters Based on RSM and NSGA-II Algorithm. Laser Optoelectron. Prog. 2022, 59, 195–201. [Google Scholar] [CrossRef]
  16. Shu, L.; Li, J.; Wu, H.; Heng, Z. Optimization of Multi-Track Laser-Cladding Process of Titanium Alloy Based on RSM and NSGA-II Algorithm. Coatings 2022, 12, 1301. [Google Scholar] [CrossRef]
  17. Meng, G.; Zhu, L.; Zhang, J.; Yang, Z.; Xue, P. Statistical analysis and multi-objective process optimization of laser cladding TiC-Inconel718 composite coating. Optik 2021, 240, 166828. [Google Scholar] [CrossRef]
  18. Yang, Y.; Cao, L.; Wang, C.; Zhou, Q.; Jiang, P. Multi-objective process parameters optimization of hot-wire laser welding using ensemble of metamodels and NSGA-II. Robot. Comput.-Integr. Manuf. 2018, 53, 141–152. [Google Scholar] [CrossRef]
  19. Tong, Y. Basic Research on Mechanism and Application of Laser Removal of Metal Oxides. Ph.D. Thesis, Jiangsu University, Zhenjiang, China, 2014. [Google Scholar]
  20. Hipp, D.; Mahrle, A.; Beyer, E. Beyond Fresnel: Absorption of fibre laser radiation on rough stainless steel surfaces. J. Phys. D Appl. Phys. 2019, 52, 355302. [Google Scholar] [CrossRef]
  21. Li, Y.; Založnik, M.; Zollinger, J.; Dembinski, L.; Mathieu, A. Effects of the powder, laser parameters and surface conditions on the molten pool formation in the selective laser melting of IN718. J. Mater. Process. Technol. 2021, 289, 116930. [Google Scholar] [CrossRef]
  22. Ding, H.; Wang, Z.; Guo, Y. Multi-objective optimization of fiber laser cutting based on generalized regression neural network and non-dominated sorting genetic algorithm. Infrared Phys. Technol. 2020, 108, 103337. [Google Scholar] [CrossRef]
  23. Zhu, M.; Zhou, J.; Meng, X.; Sun, Q.; Gao, L.; Li, H.; Guo, Z.; Yang, J.; Fu, Q. Optimization of Laser Cleaning Process Parameters for Q345C Steel Rust Layer Based on Response Surface. Surf. Technol. 2019, 48, 381–391. [Google Scholar] [CrossRef]
  24. Javid, Y. Multi-response optimization in laser cladding process of WC powder on Inconel 718. CIRP J. Manuf. Sci. Technol. 2020, 31, 406–417. [Google Scholar] [CrossRef]
  25. Ragavendran, M.; Chandrasekhar, N.; Ravikumar, R.; Saxena, R.; Vasudevan, M.; Bhaduri, A.K. Optimization of hybrid laser—TIG welding of 316LN steel using response surface methodology (RSM). Opt. Lasers Eng. 2017, 94, 27–36. [Google Scholar] [CrossRef]
  26. Zhang, W.; Huang, Z.; Kang, M.; Shi, M.; Deng, R.; Yan, Y.; Zhu, Q. Research on multivariate nonlinear regression model of specific energy of rock with laser drilling based on response surface methodology. Opt. Commun. 2021, 489, 126865. [Google Scholar] [CrossRef]
  27. Liu, H.; Yang, W.; Wang, D.; Yao, Y.; Chi, Y. Effects of Laser Energy Density on Cleaning Effect and Mechanism of TWIP Steel Surface Oxide. J. Med. Libr. Assoc. 2024, 100 (Suppl. 4). [Google Scholar]
  28. Peng, S.; Li, T.; Zhao, J.; Lv, S.; Tan, G.Z.; Dong, M.; Zhang, H. Towards energy and material efficient laser cladding process: Modeling and optimization using a hybrid TS-GEP algorithm and the NSGA-II. J. Clean. Prod. 2019, 227, 58–69. [Google Scholar] [CrossRef]
  29. Chaki, S.; Bathe, R.N.; Ghosal, S.; Padmanabham, G. Multi-objective optimisation of pulsed Nd:YAG laser cutting process using integrated ANN–NSGAII model. J. Intell. Manuf. 2015, 29, 175–190. [Google Scholar] [CrossRef]
  30. Zhang, D.; Liu, Z.; Song, K.; Zhai, Z.; Zhang, Y.; Gao, Z. Parameters optimization for laser-cladding CoCrFeNiMn high-entropy alloy layer based on GRNN and NSGA-II. Mater. Today Commun. 2024, 39, 108615. [Google Scholar] [CrossRef]
  31. Luo, D.; Liu, C.; Wang, C.; Wang, Y.; Wang, X.; Zhao, J.; Jiang, S. Optimization of multilayer laser cladding process parameters based on NSGA-II-MOPSO algorithm. Opt. Laser Technol. 2024, 176, 111025. [Google Scholar] [CrossRef]
  32. Rafiei, J.; Soheil Shamaee, M.; Ghasemi, A.R. Process parameter optimization of WC/Inconel 625 metal matrix composites laser cladding based on the Taguchi approach and NSGA-II algorithm. Soft Comput. 2024. [Google Scholar] [CrossRef]
  33. Libin, N.; Jichang, L.; Yaoting, W.; Cuo, Y. Optimization of Laser Cladding Process V ariables Based on Neural Network and Particle Swarm Optimization Algorithms. Chin. J. Lasers 2011, 38, 99–104. [Google Scholar] [CrossRef]
  34. Qin, H.; Pang, X. Novel method to design laser beam shaping lenses using PSO techniques. Appl. Phys. B 2018, 125, 7. [Google Scholar] [CrossRef]
  35. Yifan, P.; Geyan, F.; Mingyu, W.; Yanqi, G.; Siqi, Y.; Jiachao, X.; Fan, L. Parameter Optimization of High Deposition Rate Laser Cladding Based on the Response Surface Method and Genetic Neural NetworkModel. Chin. J. Lasers 2021, 48, 152–162. [Google Scholar] [CrossRef]
  36. Liu, F.; Chen, Y.; Qin, W.; Li, J. Optimal design of liquid cooling structure with bionic leaf vein branch channel for power battery. Appl. Therm. Eng. 2023, 218, 119283. [Google Scholar] [CrossRef]
  37. Conghui, Z.; Hua, R.; Guodong, S.; Kun, H. Effect of Surface Roughness by Shot Peening on Stress Corrosion Cracking Behavior of Pure Titanium Welded Joints in HCl Solution. Acta Metall. Sin. 2019, 55, 1282–1290. [Google Scholar] [CrossRef]
  38. Junhoong, C.; Peng, W.; Baohua, C.; Jiguo, S.; Dong, D.; Hao, C. Laser Cleaning of Titanium Alloy and Its Effect on Laser Welding Porosity. China Mech. Eng. 2020, 31, 379–383. [Google Scholar] [CrossRef]
  39. ISO8501-1-2007; Preparation of Steel Substrates before Application of Paints and Related Products Visual Assessment of Surface Cleanliness, Part 1: Rust Grades and Preparation Grades of Uncoated Steel Substrates and of Steel Substrates after Overall Removal of Previous Coatings. International Organization for Standardization: Geneva, Switzerland, 2007.
  40. Zhou, J.; Li, H.; Sun, Q.; Meng, X.; Fu, Q. Laser derusting mechanism of AH32 steel based oncleaned surface topography. Opt. Precis. Eng. 2019, 27, 1754–1764. [Google Scholar] [CrossRef]
Figure 1. Surface morphology of the rust layer.
Materials 17 03109 g001
Figure 2. Cross-sectional morphology of the rust layer.
Materials 17 03109 g002
Figure 3. Elemental distribution of the rust layer determined via energy-dispersive X-ray spectroscopy.
Materials 17 03109 g003
Figure 4. Schematic of the laser cleaning system.
Materials 17 03109 g004
Figure 5. Surface topography of each sample after laser cleaning.
Materials 17 03109 g005
Figure 6. Comparison of actual and predicted values: (a) oxygen content; (b) removal rate; (c) roughness.
Materials 17 03109 g006
Figure 7. The impact of interactions among various factors on oxygen content.
Materials 17 03109 g007
Figure 8. Effects of the cleaning process parameters on the oxygen content: (a) power vs. cleaning speed; (b) power vs. repetition frequency; (c) cleaning speed vs. repetition frequency.
Materials 17 03109 g008
Figure 9. The impact of interactions among various factors on removal rate.
Materials 17 03109 g009
Figure 10. Effects of process parameters on the removal rate: (a) power vs. cleaning speed; (b) power vs. scanning speed; (c) scanning speed vs. repetition frequency.
Materials 17 03109 g010
Figure 11. The impact of interactions among various factors on oxygen content surface roughness.
Materials 17 03109 g011
Figure 12. Effects of process parameters on the roughness: (a) power vs. scanning speed; (b) power vs. repetition frequency; (c) scanning speed vs. repetition frequency.
Materials 17 03109 g012
Figure 13. Pareto-optimal solution sets.
Materials 17 03109 g013
Figure 14. Number of intervals for each variable.
Materials 17 03109 g014
Figure 15. Verifying the results of the experiment: (a) SEM surface topography; (b) surface roughness.
Materials 17 03109 g015
Table 1. The types of lasers used by other researchers.
SubstrateLaser TypeRef.
Q345Solid-state laser with flat-top laser energy[10]
AH36Ultraviolet nanosecond laser[11]
Q345Nanosecond pulsed laser[3]
Mild steelNanosecond pulsed laser[12]
Q235B1080 nm continuous laser[13]
Table 2. Chemical composition of Q390 steel.
ElementFeCMnSiS, PAlCeq
Content (wt.%)base≤0.201.00–1.600.55≤0.0300.0380.37–0.42
Table 3. Main thermophysical parameters of carbon steel plate substrate and rust layer [13,19].
Thermophysical ParameterCarbon SteelRust Layer
Destiny/(kg·m−3)78605200
Thermal conductivity/(W·m−1·K−1)44.54.3
Constant pressure heat capacity/(J·kg−1·K−1)600900
Absorption ratio0.490.8
Melting temperature/K18081773
Vaporization temperature/K31332973
Table 4. Ranges of the main parameters of the laser cleaning platform.
ParameterValue
Wavelength1064 nm
Pulse width100 ns
Focused spot diameter100 µm
Laser power0–100 W
Repetition frequency10–100 kHz
Scanning speed0–8000 mm/s
Cleaning speed0–1000 mm/min
Table 5. BBD experiment factor and level design.
VariableCode
Low (−1)Medium (0)High (1)
Laser power (W)304050
Laser cleaning speed Vy (mm/min)150200250
Laser scanning speed Vx (mm/s)200040006000
Laser repetition rate f (kHz)80100120
Table 6. Experimental design matrix and experimental results.
RunPVyVxfO%R%Sa
1403004000807.1186.044.7125
25020040008011.8994.895.5212
34020040001005.4988.493.8995
44020040001004.5788.643.9142
550300400010010.2891.454.9915
64020040001004.8888.753.9867
7402006000806.0187.584.0968
83020020001008.8191.473.7948
950200600010010.1294.384.4054
1030200400012011.5389.062.9451
114030060001008.4584.313.6047
1250100400010016.6798.954.7757
133020060001009.4383.563.1897
1440100200010011.5297.034.5034
1550200400012010.3295.824.2125
16402002000807.5289.855.3625
174010040008012.3694.424.6921
184020020001208.5391.864.1341
194020040001004.5589.564.0245
204020040001005.1289.563.9456
21302004000808.5988.154.0525
224020060001207.2986.953.3254
234030020001009.5188.264.6378
2450200200010010.9396.025.4712
254030040001209.8687.023.3534
2630300400010013.5984.213.3895
2740100400012010.1296.693.4057
2830100400010011.0393.573.2565
2940100600010010.5292.823.6458
Table 7. Response values of the ANOVA.
Variance SourceResponse Value
Oxygen ContentRemoval RateRoughness
F-Valuep-ValueF-Valuep-ValueF-Valuep-Value
Model71.16<0.000196.5<0.0001105.78<0.0001
A19.090.0006376.23<0.0001695.67<0.0001
B65.76<0.0001673.93<0.00011.530.2366
C9.130.0092114.53<0.0001288.66<0.0001
D6.350.024510.380.0061453.14<0.0001
AB87.74<0.00012.410.14280.18690.6721
AC2.240.156758.53<0.00015.790.0305
AD22.280.00030.00030.98651.10.311
BC0.00390.95080.05030.82580.83970.375
BD27.280.00011.240.28460.14410.7099
CD0.07990.78165.190.0395.690.0317
A2478.89<0.000168.8<0.000111.710.0041
B2417.69<0.000141.59<0.00010.00070.9799
C230.51<0.00011.560.231715.790.0014
D251.59<0.00018.680.01067.750.0146
Lack of fit1.640.33451.340.41674.420.0826
R20.98610.98970.9906
Adjusted R20.97230.97950.9813
Predicted R20.93160.95080.9493
Adeq precision34.625738.730138.2623
Table 8. Optimization results and experimental validation.
NoP/WVy/(mm/min)Vx (mm/s)f/kHzO%E%R%E%Sa/µmE%
PreActPreActPreAct
144.59174.013852.031168.658.482.01%94.7193.850.9%3.94153.90390.96%
233.31173.294691.381148.298.411.42%90.0590.820.85%3.01113.15424.53%
341.42155.183922.681179.719.591.25%95.8593.112.94%3.60943.68542.06%
444.29177.493707.94997.317.132.52%92.5793.771.27%4.29754.35121.23%
Disclaimer/Publisher’s Note: The statements, opinions and data contained in all publications are solely those of the individual author(s) and contributor(s) and not of MDPI and/or the editor(s). MDPI and/or the editor(s) disclaim responsibility for any injury to people or property resulting from any ideas, methods, instructions or products referred to in the content.

