Influence of Admixture Source on Fresh Properties of Self-Consolidating Concrete


Abstract
1. Introduction
2. Research Objective
3. Materials and Methods
3.1. Raw Materials
3.2. Mixing Procedure and Testing
4. Results and Discussion
4.1. Optimum Admixture Dosage
4.1.1. Influence of Admixture Source on Optimum Admixture Dosage
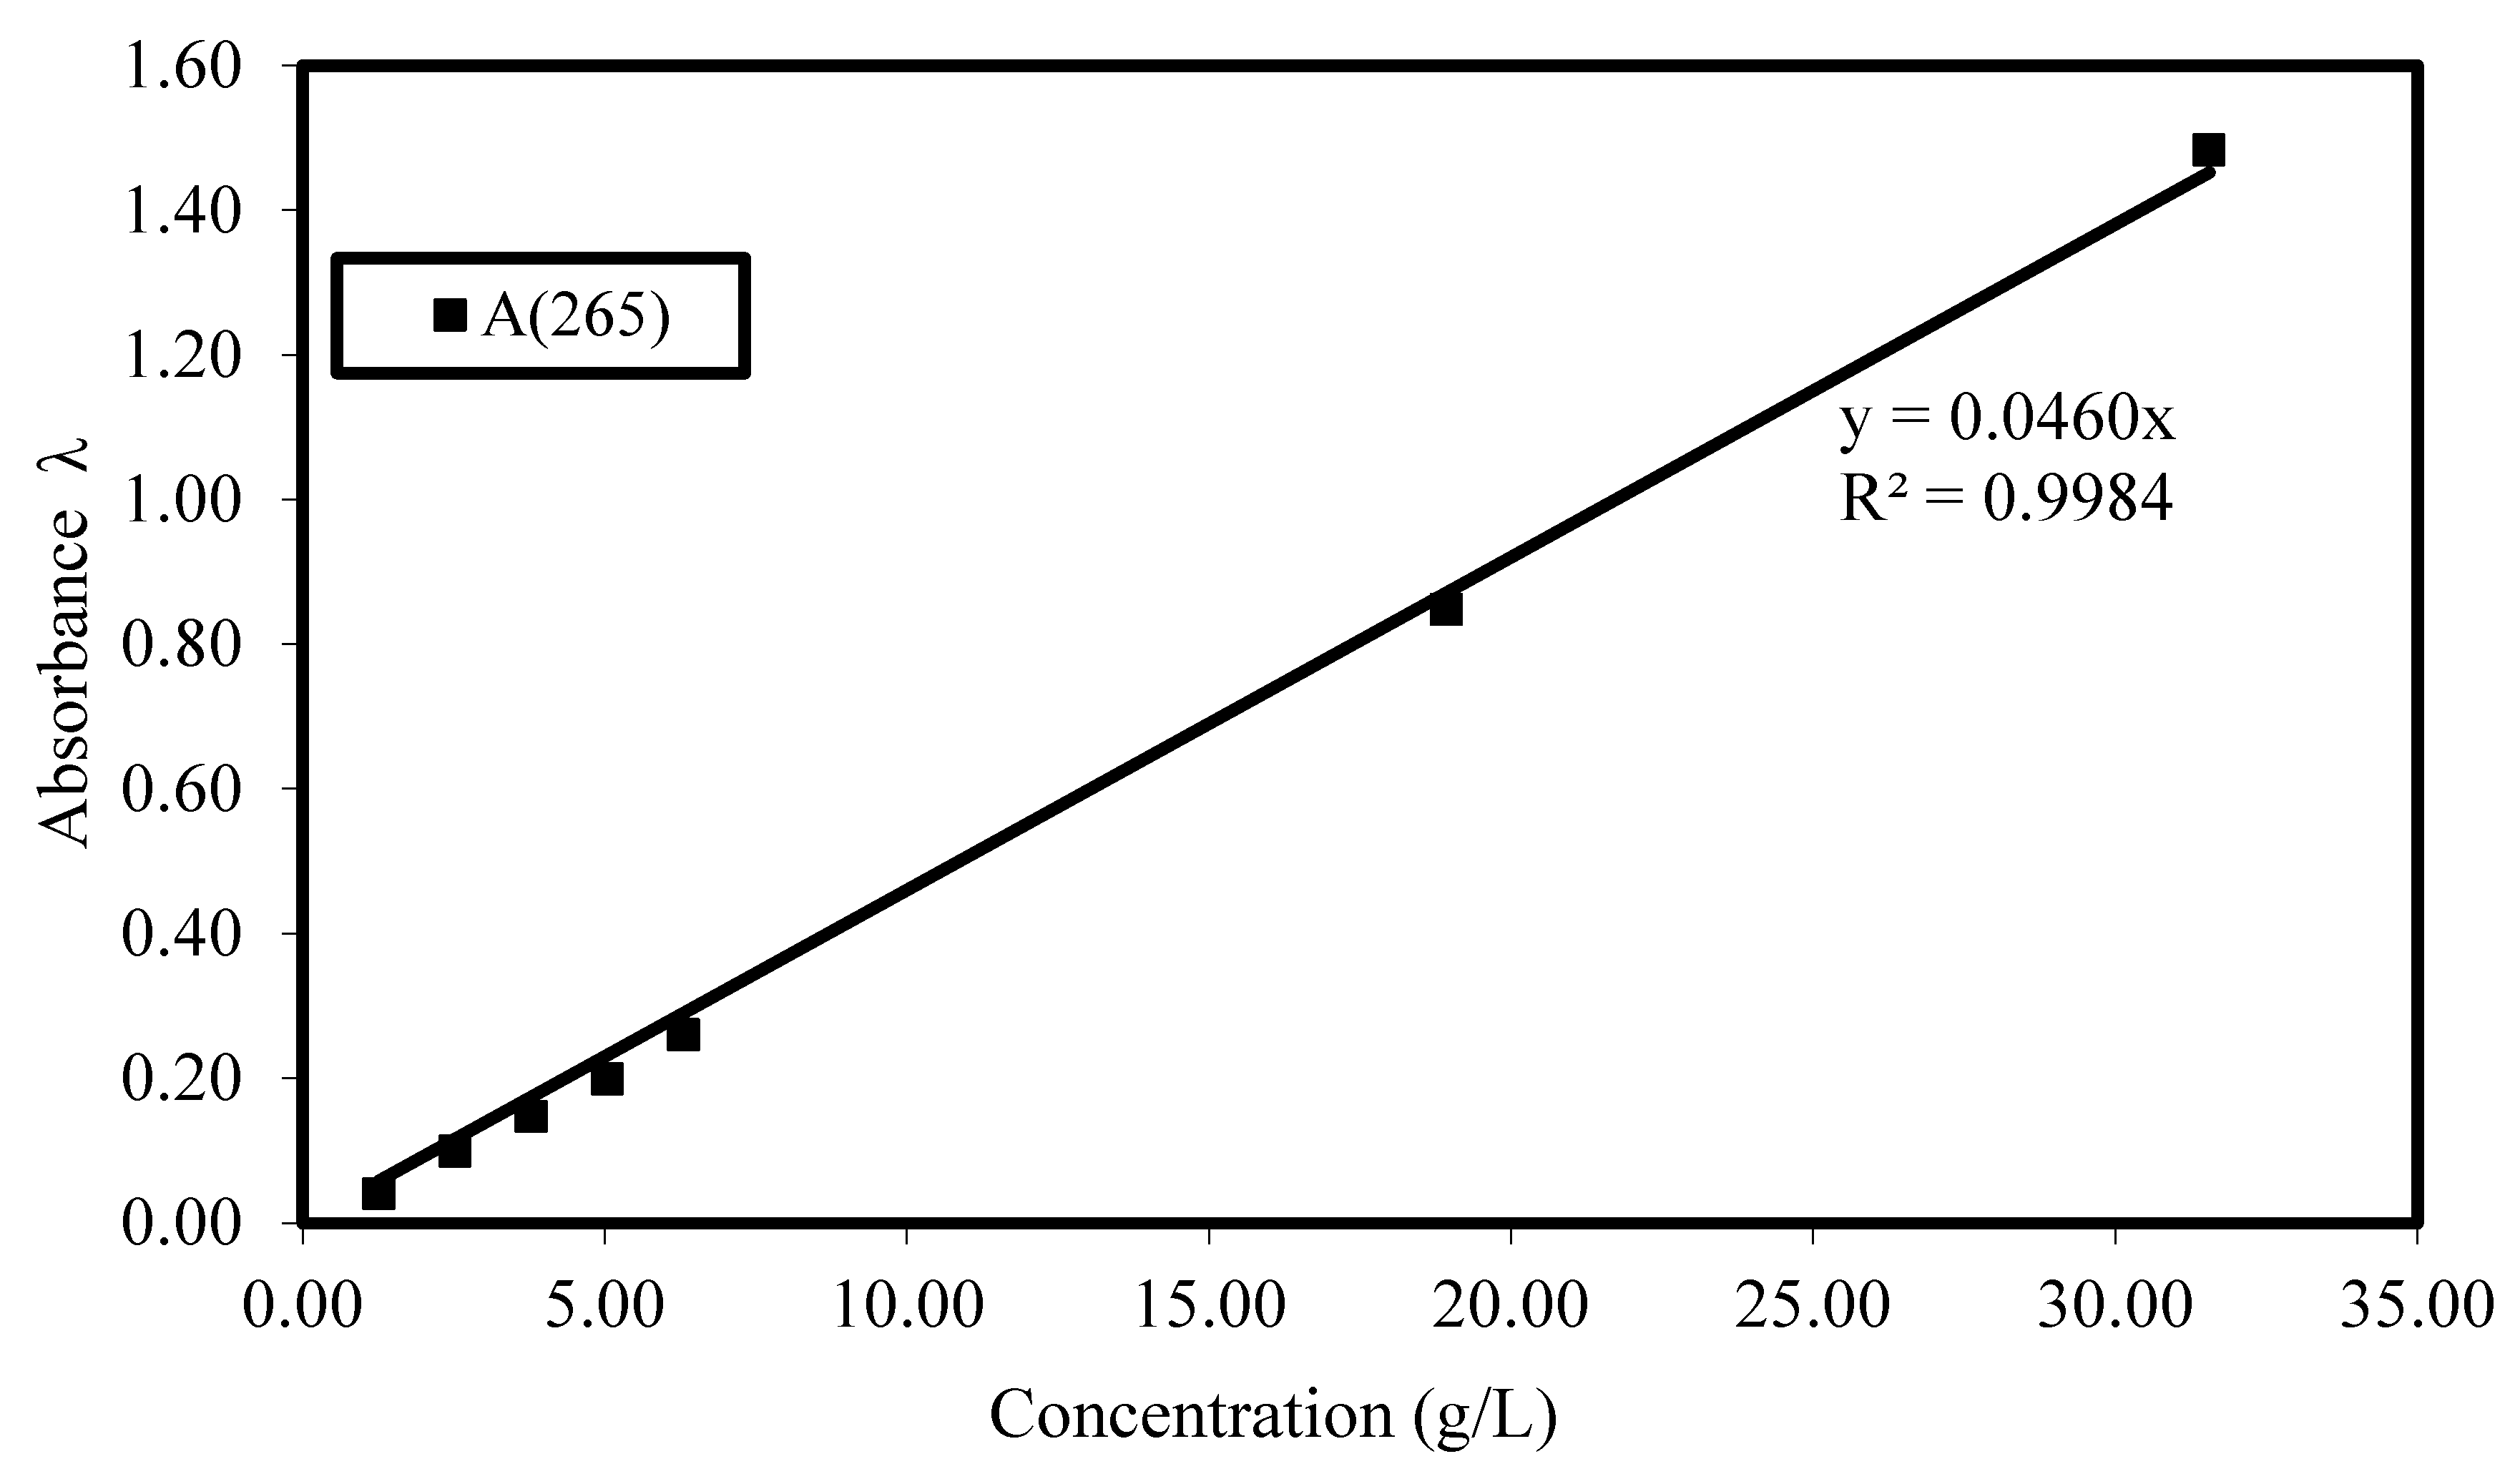
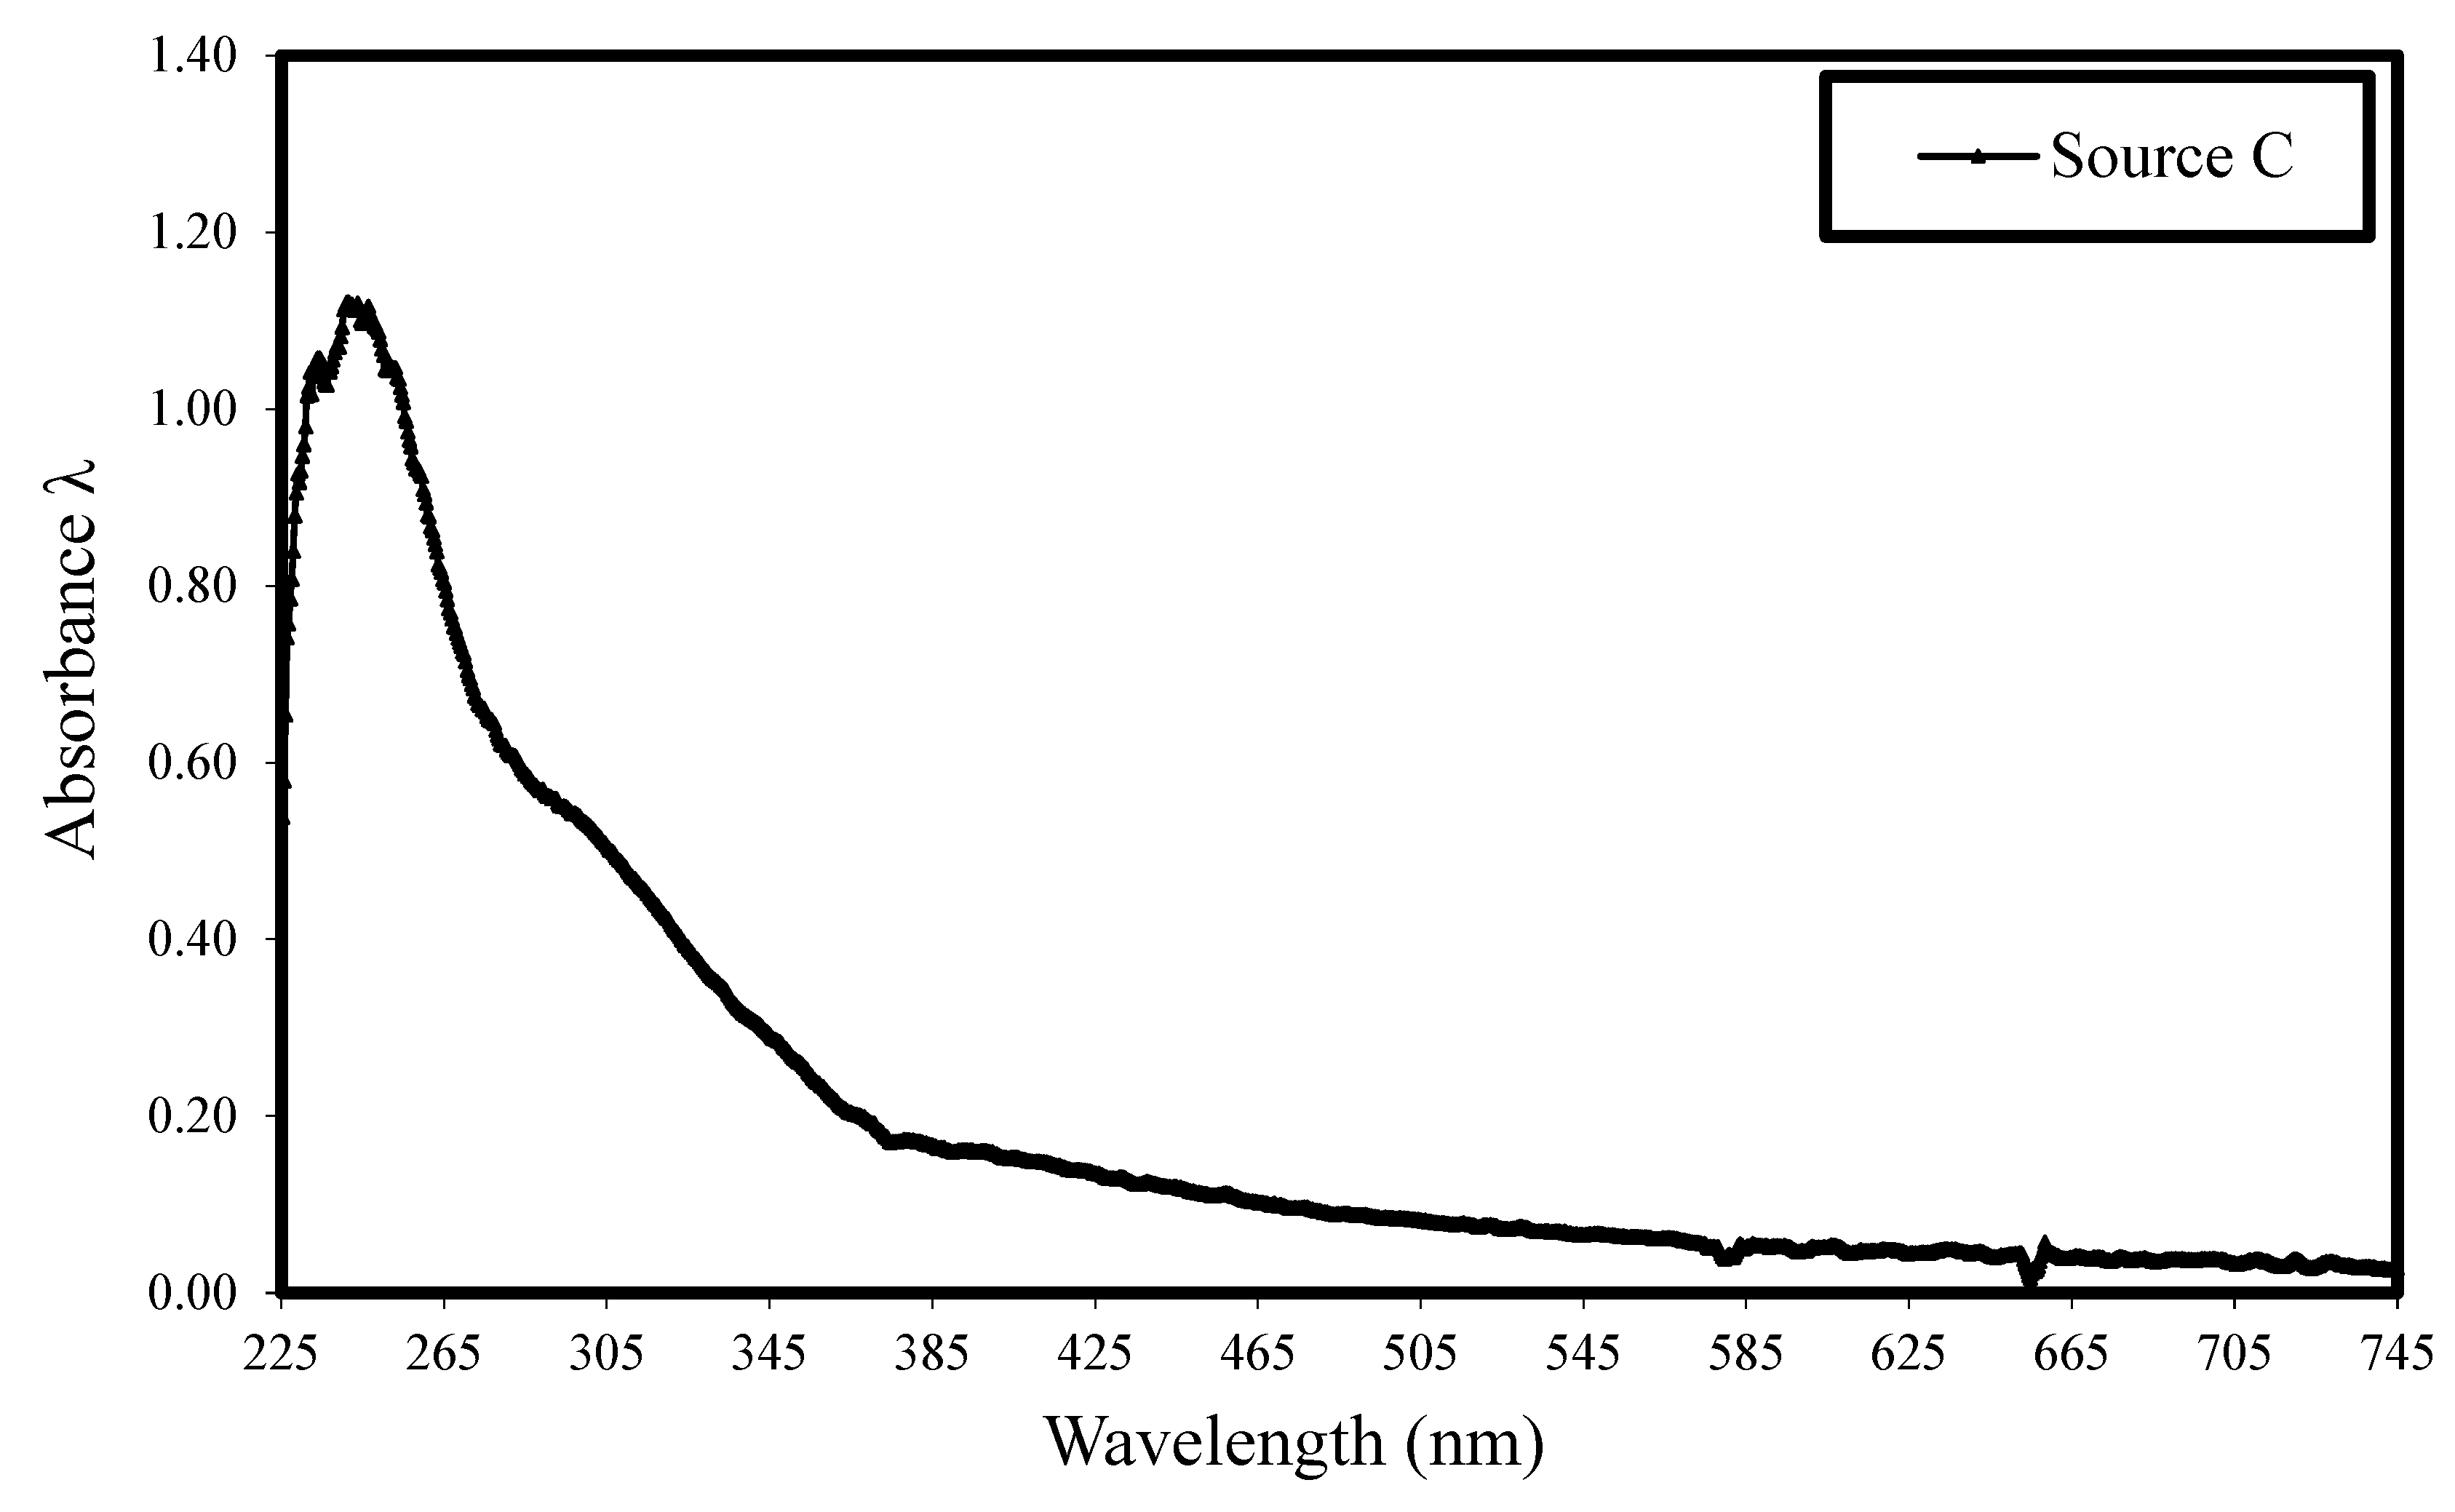
Evaluation of Adsorption of HRWRAs Using UV–Vis Spectroscopy
Mechanism of Action of VMA
VMA-to-HRWRA Ratio
4.1.2. Influence of Slump Flow on Optimum Admixture Dosage
4.2. Fresh Characteristics
4.2.1. Flowability/Viscosity
Influence of Admixture Source on Flowability/Viscosity
Influence of Slump Flow on Flowability/Viscosity
4.2.2. Stability
Dynamic Segregation Resistance
Influence of Admixture Source on Dynamic Segregation Resistance
Influence of Slump Flow on Dynamic Segregation Resistance
Static Segregation Resistance
Influence of Admixture Source on Static Segregation Resistance
Influence of Slump Flow on Static Segregation Resistance
4.2.3. Passing Ability
Influence of Admixture Source on Passing Ability
Influence of Slump Flow on Passing Ability
4.2.4. Filling Ability
4.3. Predictive Statistical Equations and Ranking of the SCC Admixture Dosage
- where
- − The paste and mortar used in β do not include the admixtures.
- − No VMA is needed for a slump flow SF ≤ 508 mm.
4.4. Compressive Strength
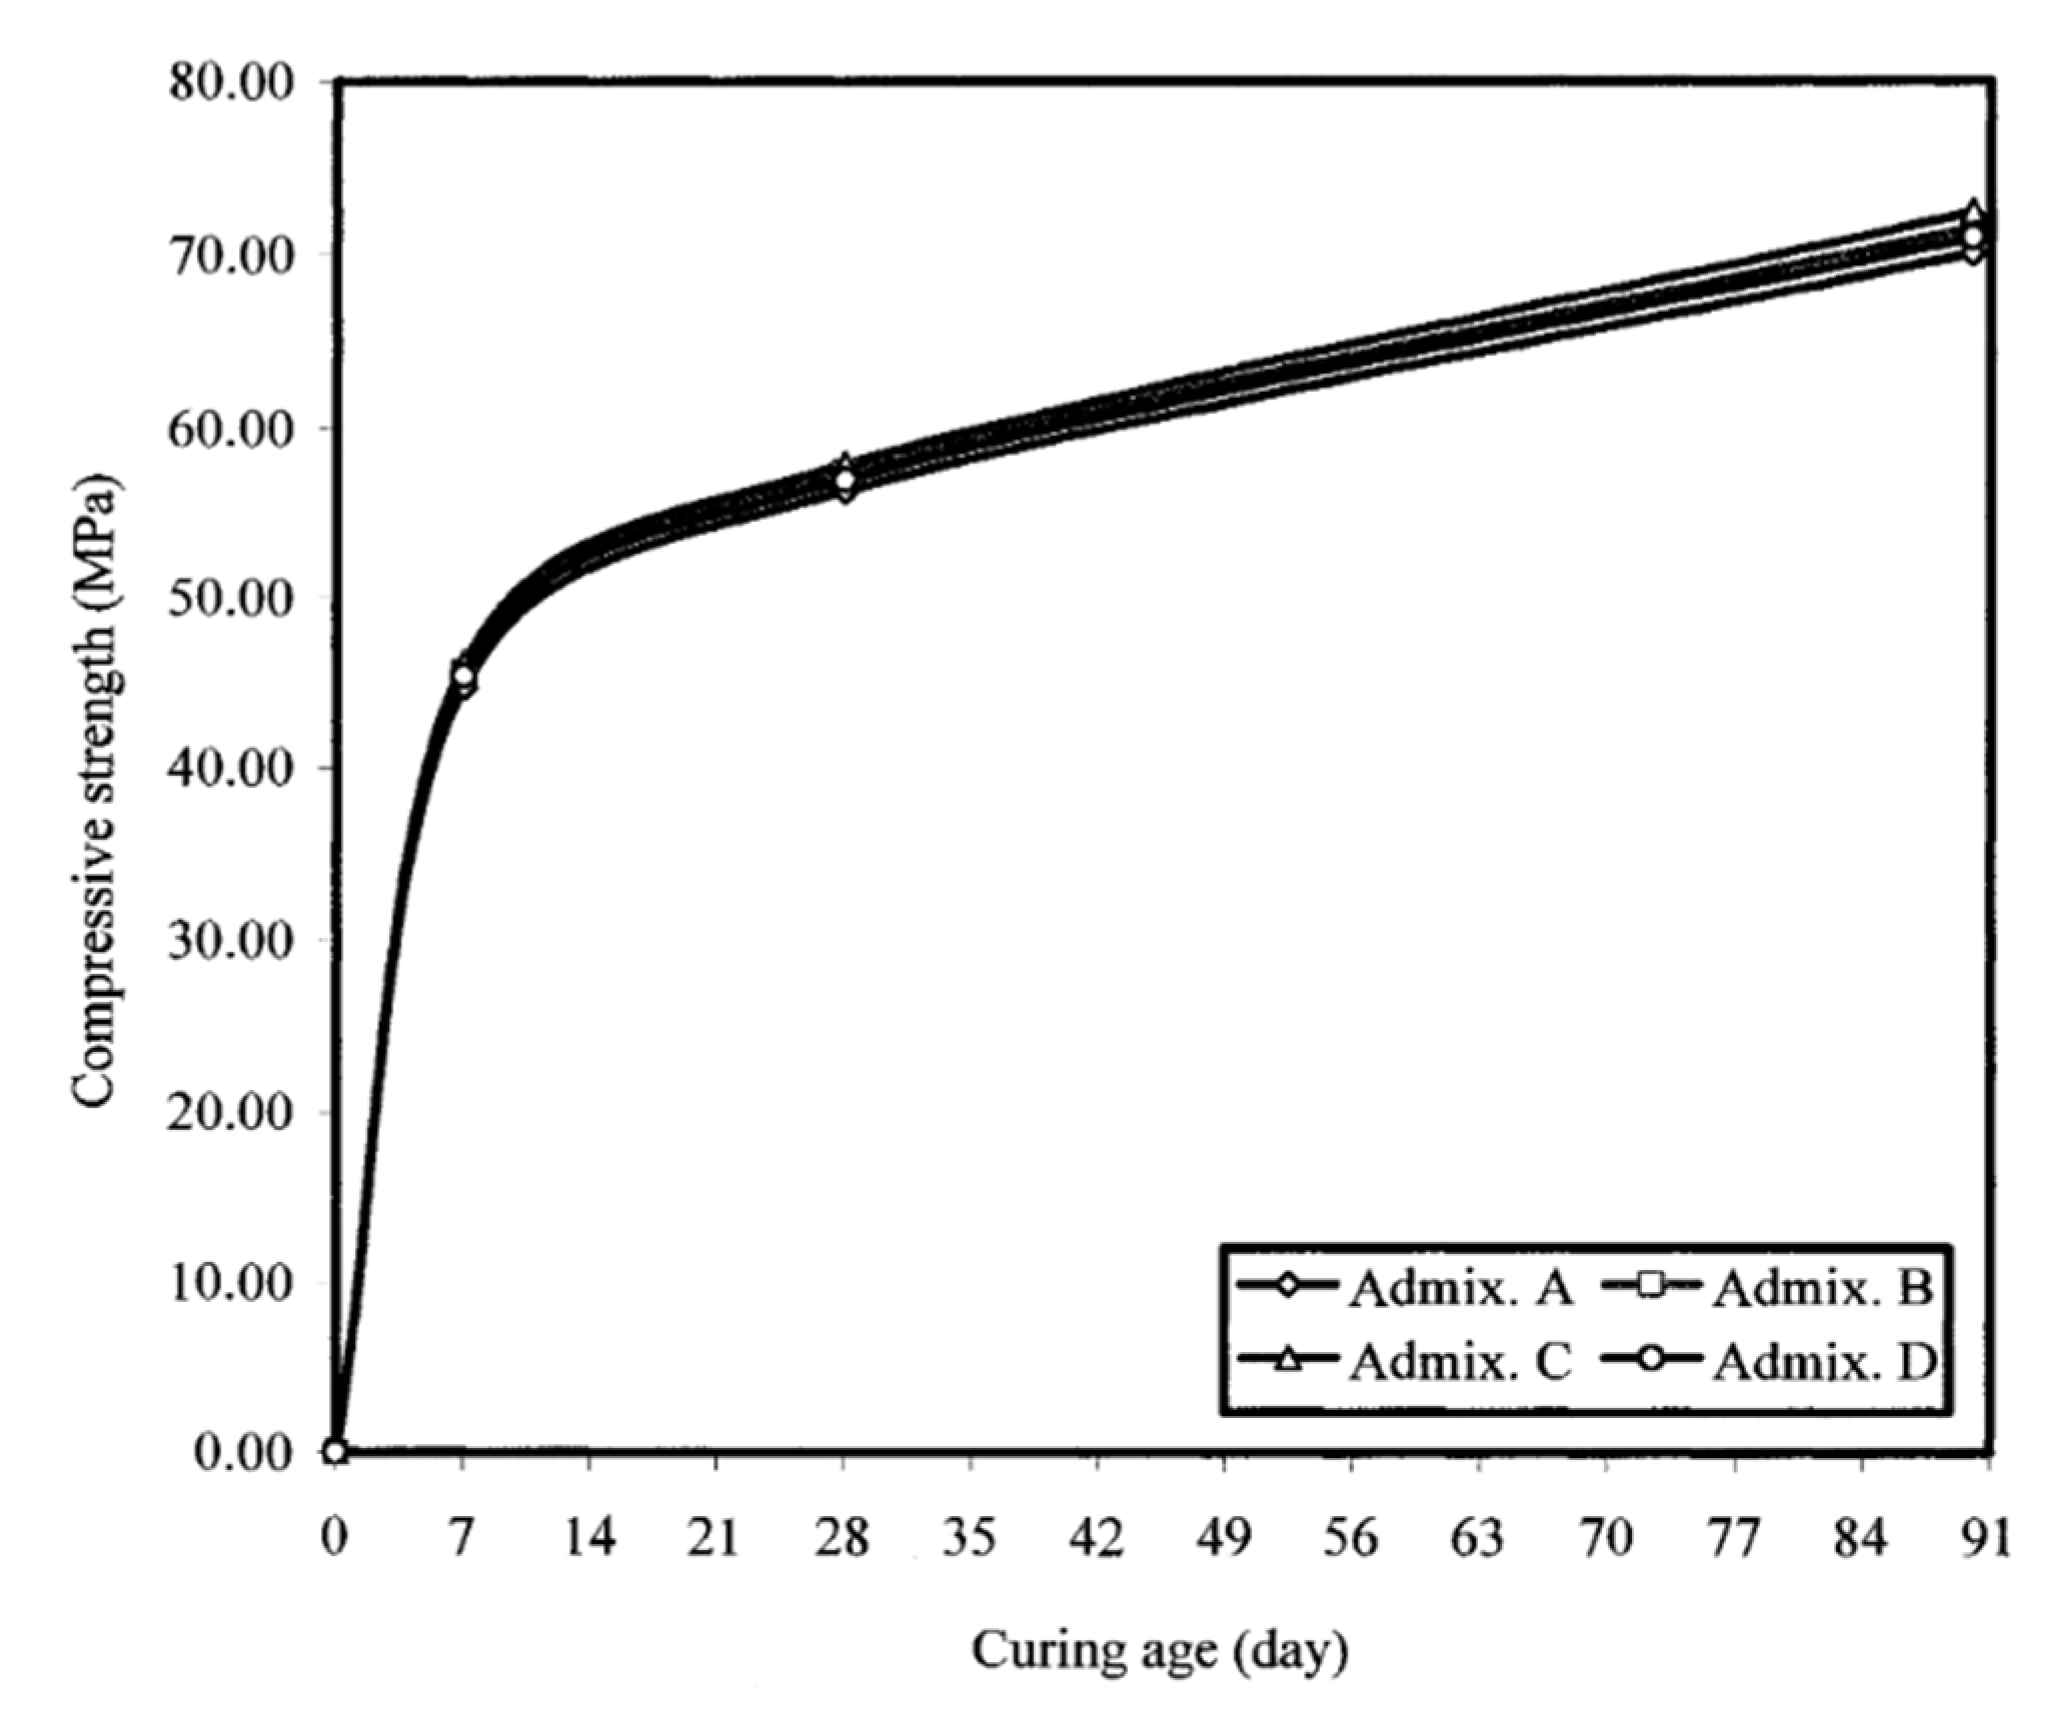
4.4.1. Influence of Admixture Source on Compressive Strength
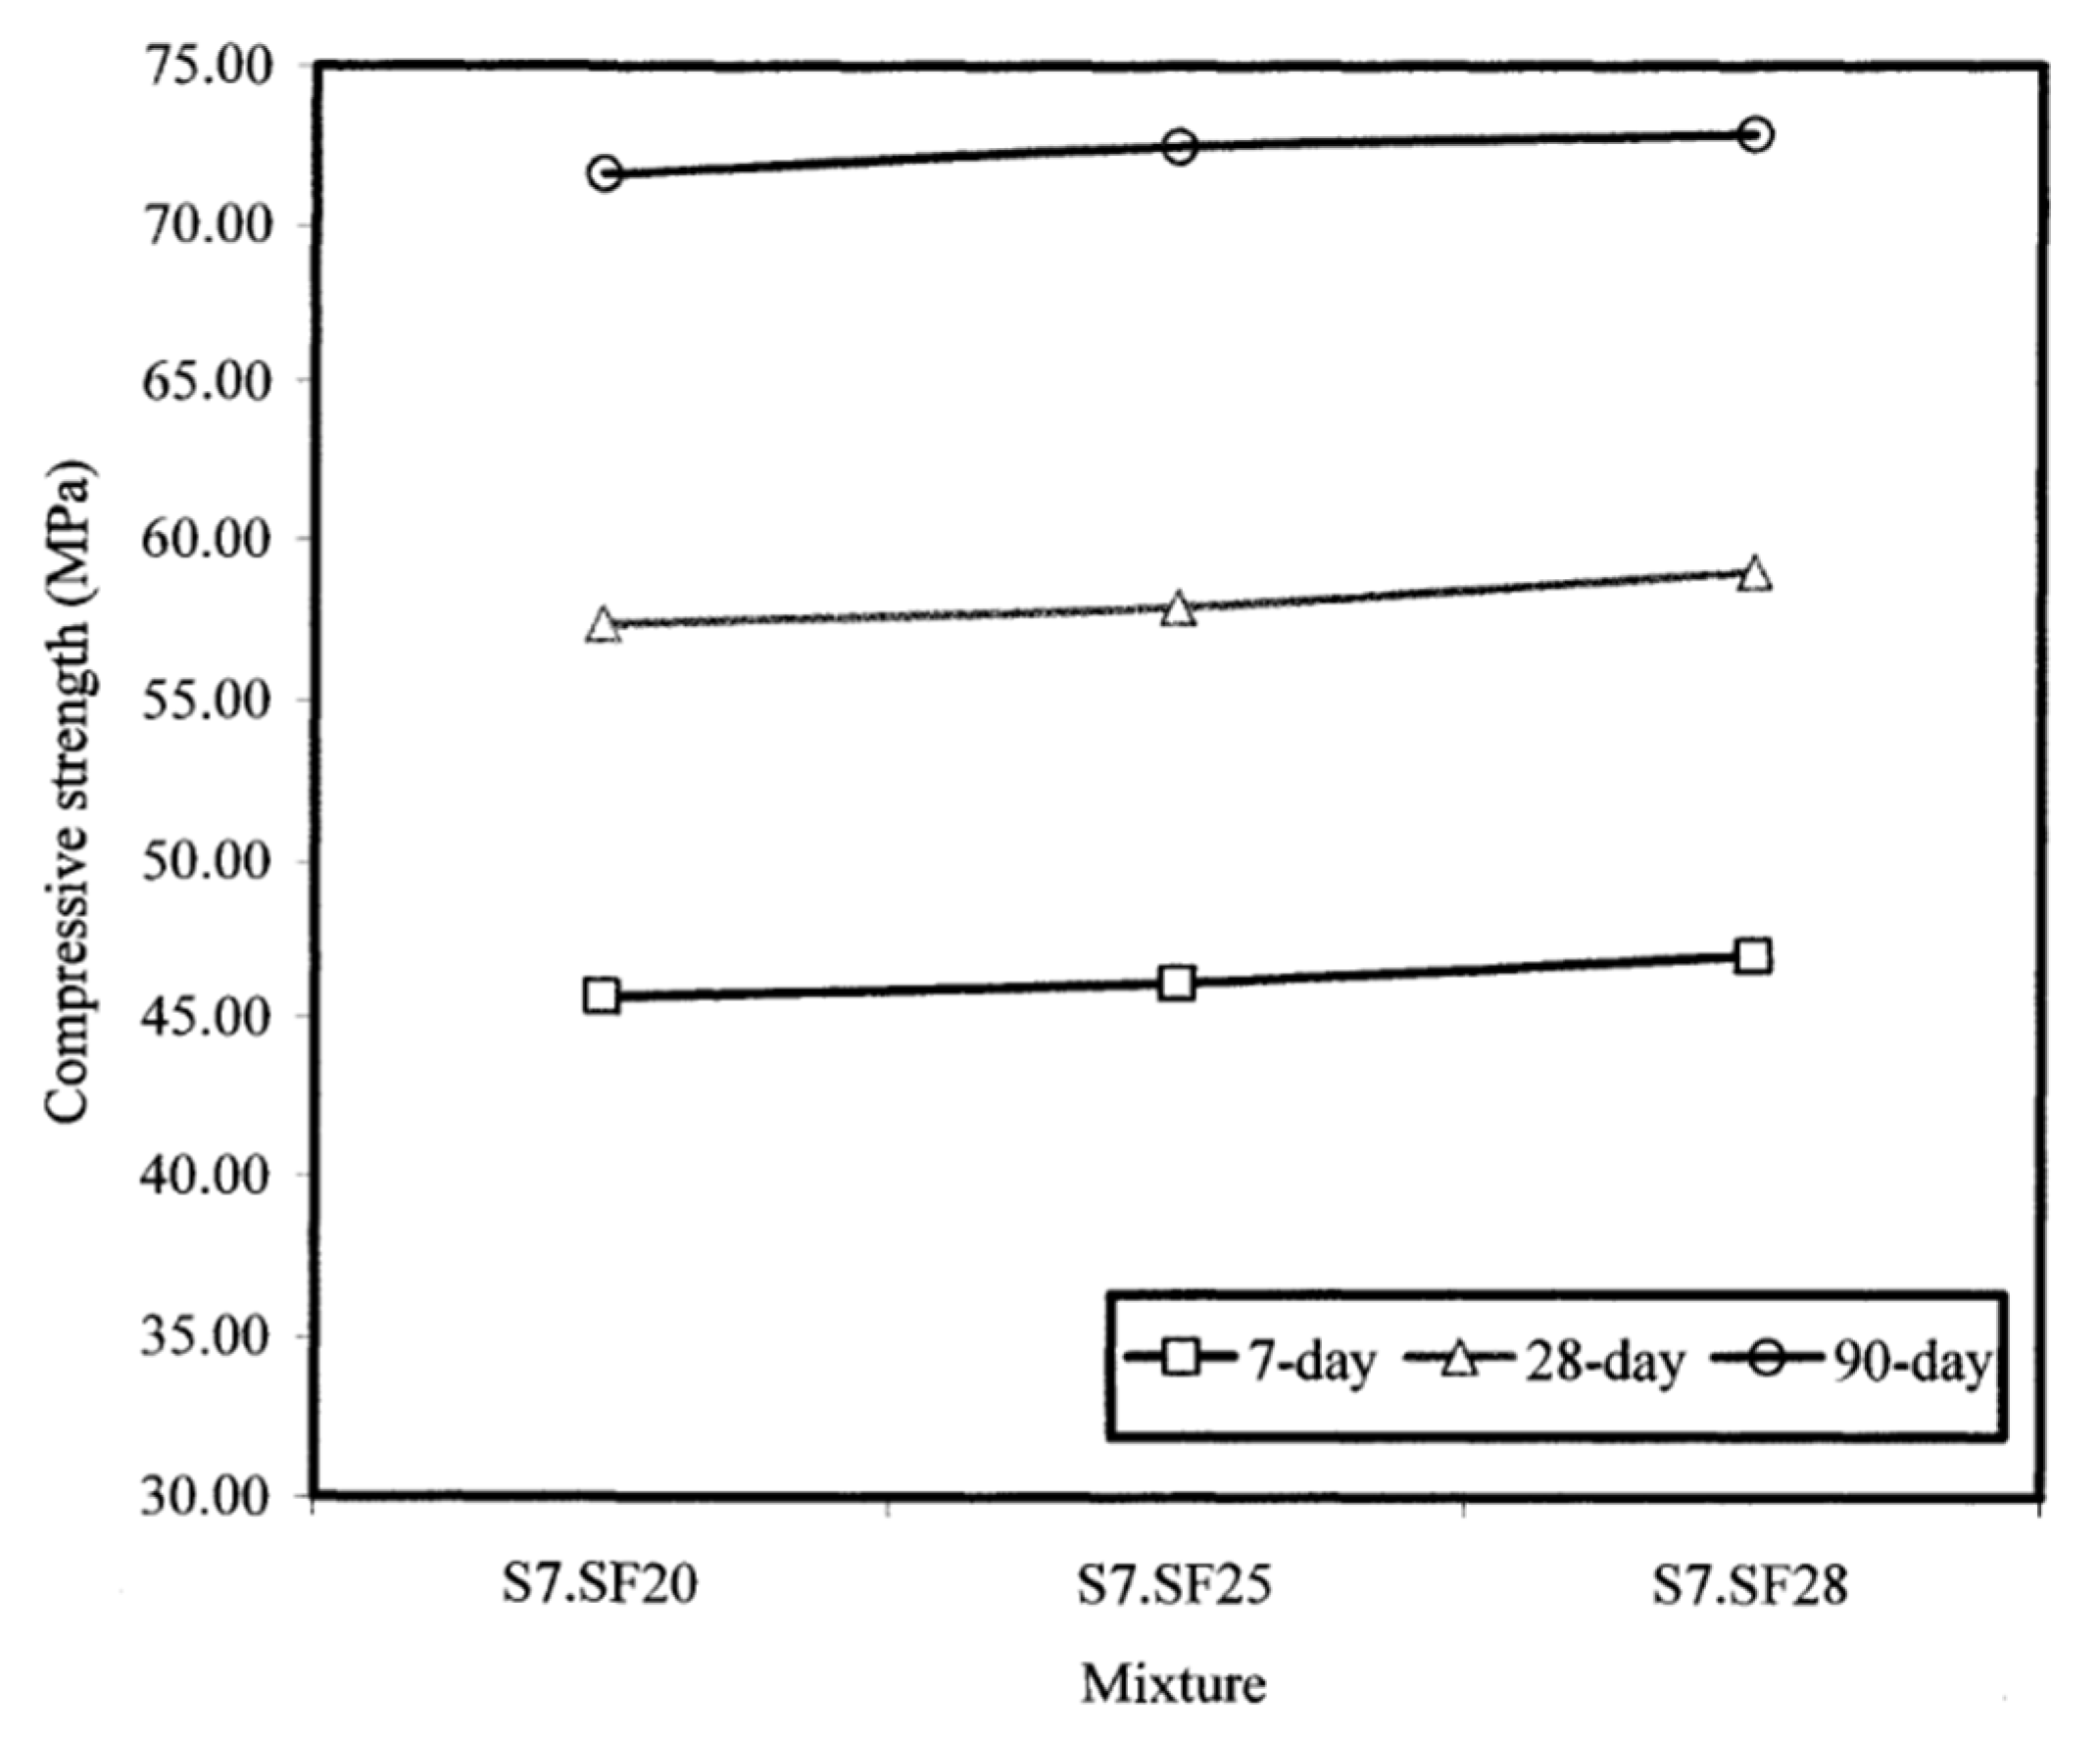
4.4.2. Influence of Slump Flow on Compressive Strength
4.4.3. Effect of Admixture Source on the Strength of the Concrete
5. Summary of the Results
- Source A required the highest dosage amount of the HRWRA, followed by sources C, B, and D (in descending order).
- The optimum dosages of sources B, C, and D superplasticizers were 47%, 19%, and 51% lower, respectively, compared to source A for a 508 mm slump flow.
- The reductions in the HRWRA dosage for sources B, C, and D were 36%, 20%, and 40% for a 508 mm slump flow.
- The increases in the HRWRA dosage ranged from 14% to 43% as the slump flow increased from 508 to 711 mm for all admixture sources.
- The reductions in the VMA dosage for sources B, C, and D were fairly uniform at about 60% and 69% for SCCs with 635 mm and 711 mm slump flows, respectively.
- The increase in the VMA dosage remained at 60% for source A and 25% for sources B, C, and D when the slump flow changed from 635 to 711 mm.
- No VMA was needed for SCCs with a 508 mm slump flow.
- The study aimed to achieve a VSI of 0 or 1, indicating good visual stability.
- The proper proportioning of admixtures led to self-consolidating concretes with an acceptable flowability, plastic viscosity, dynamic and static stabilities, passing ability, and filling ability for all four selected admixture sources
6. Conclusions
- (a)
- Irrespective of the self-consolidating concrete group, the optimum dosage requirements to obtain a uniform slump flow and visual stability index varied amongst the four selected admixture sources. An increase in the slump flow generated a higher dosage demand for all admixture sources.
- (b)
- The differences among the admixture sources can be explained through the adsorption amount of the HRWRA molecules on cement grains, the chemical type/bonds of the HRWRA, and the calculated VMA-to-HRWRA ratio. The behaviors of the superplasticizers from sources B, C, and D were similar to that of a polycarboxylate-acid (PCA) type, whereas the acid portion was predominant when compared to the ester part. On the other hand, source A was a polycarboxylate-ester type and at the same dosage, it was unable to disperse cement grains at the same as polycarboxylate-acid types.
- (c)
- With proper proportioning, self-consolidating concrete with an acceptable flowability, plastic viscosity, dynamic and static stabilities, passing ability, and filling ability can be achieved with any of the four selected admixture sources. However, the performance of the selected admixtures in attaining uniform fresh properties varied among the admixture sources.
- (d)
- The 508 mm slump flow SCCs exhibited a very low plastic viscosity (based on inference), very high dynamic stability, moderate filling ability, low passing ability, and high static stability. As a result, a 508 mm slump flow was found to be unsuitable for congested reinforced structures. All 635 mm and 711 mm slump flow self-consolidating concretes displayed a high flowability, low plastic viscosity (by inference), high dynamic stability, moderate static stability, moderate passing ability, and moderate to high filling ability, indicating their suitability for most civil engineering applications. The formwork for the 711 mm slump flow SCCs may be subjected to a higher-than-expected pressure due to the flowability that remained near the lower bond of the acceptable limit.
- (e)
- The predictive equation to correlate the dependent variable (HRWRA or VMA) with independent variables (past content, aggregate size, and target slump flow) showed significant statistical relationships.
- (f)
- This study showed that self-consolidating concretes with admixtures from sources A, B, and D showed only slight reductions in compressive strength (1–3%) compared to source C, suggesting that the admixtures do not significantly interfere with hydration or strength development. The strength increases at 28 and 90 days were due to the pozzolanic reaction of the fly ash and continued cement hydration.
Author Contributions
Funding
Institutional Review Board Statement
Informed Consent Statement
Data Availability Statement
Acknowledgments
Conflicts of Interest
Conversion Factors
| 1 mm = 0.0394-inch | 1 kg/m3 = 1.6856 lb/yd3 |
| °C = (5/9) (°F-32) | 1 mL/100 kg = 0.0153 oz/cwt |
References
- Aghabaglou, A.M.; Tuyan, M.; Yilmaz, G.; Arıöz, Ö.; Ramyar, K. Effect of different types of superplasticizers on fresh, rheological and strength properties of self-consolidating concrete. Constr. Build. Mater. 2013, 47, 1020–1025. [Google Scholar] [CrossRef]
- Naik, T.R.; Kumar, R.; Ramme, B.W.; Canpolat, F. Development of high-strength, economical self-consolidating concrete. Constr. Build. Mater. 2012, 30, 463–469. [Google Scholar] [CrossRef]
- Okamura, H. Self-Compacting High-Performance Concrete. Concr. Int. 1997, 19, 50–54. [Google Scholar]
- Shi, C.; Wu, Z.; Lv, K.; Wu, L. A review on mixture design methods for self-compacting concrete. Constr. Build. Mater. 2015, 84, 387–398. [Google Scholar] [CrossRef]
- Brouwers, H.J.H.; Radix, H.J. Self-Compacting Concrete: Theoretical and experimental study. Cem. Concr. Res. 2005, 35, 2116–2136. [Google Scholar] [CrossRef]
- Abed, M.; Nemes, R.; Tayeh, B.A. Properties of self-compacting high-strength concrete containing multiple use of recycled aggregate. J. King Saud Univ.—Eng. Sci. 2020, 32, 108–114. [Google Scholar] [CrossRef]
- Domone, P.L. A review of the hardened mechanical properties of self-compacting concrete. Cem. Concr. Compos. 2007, 29, 1–12. [Google Scholar] [CrossRef]
- Kheder, G.F.; Al Jadiri Rand, S. New method for proportioning self-consolidating concrete based on compressive strength requirements. ACI Mater. J. 2010, 107, 490–497. [Google Scholar]
- Şahmaran, M.; Yaman, İ.Ö.; Tokyay, M. Transport and mechanical properties of self-consolidating concrete with high volume fly ash. Cem. Concr. Compos. 2009, 31, 99–106. [Google Scholar] [CrossRef]
- Nanthagopalan, P.; Santhanam, M. Fresh and hardened properties of self-compacting concrete produced with manufactured sand. Cem. Concr. Compos. 2011, 33, 353–358. [Google Scholar] [CrossRef]
- Filho, F.M.A.; Barragán, B.E.; Casas, J.R.; El Debs, A.L.H.C. Hardened properties of self-compacting concrete—A statistical approach. Constr. Build. Mater. 2010, 24, 1608–1615. [Google Scholar] [CrossRef]
- Lei, L.; Hirata, T.; Plank, J. 40 years of PCE superplasticizers—History, current state-of-the-art and an outlook. Cem. Concr. Res. 2022, 157. [Google Scholar] [CrossRef]
- Bonen, D.; Shah, S.P. Fresh and hardened properties of self-consolidating concrete. Prog. Struct. Eng. Mater. 2005, 7, 14–26. [Google Scholar] [CrossRef]
- Lachemi, M.; Hossain, K.M.A.; Lambros, V.; Nkinamubanzi, P.C.; Bouzoubaâ, N. Self-consolidating concrete incorporating new viscosity modifying admixtures. Cem. Concr. Res. 2004, 34, 917–926. [Google Scholar] [CrossRef]
- Diawara, H.; Ghafoori, N. Parametric Study of Self Consolidating Concrete. Ph.D. Dissertation, University of Nevada, Las Vegas, NV, USA, 2008. [Google Scholar] [CrossRef]
- Ghafoori, N.; Diawara, H.; Hasnat, A. Remediation of loss in flow properties of self-consolidating concrete under various combinations of transportation time and temperature. Constr. Build. Mater. 2018, 192, 508–514. [Google Scholar] [CrossRef]
- Mailvaganam, N.; Rixom, R.; Manson, P.; Gonzales, C. Chemical Admixtures for Concrete, 3rd ed.; Crc Press: Boca Raton, FL, USA, 1999; p. 456. [Google Scholar]
- Prados, M.T.; Pesqueira, M.L.; Fonteboa, B.G.; Seara-Paz, S. Effect of polycarboxylate superplasticizers on large amounts of fly ash cement. Constr. Build. Mater. 2013, 48, 628–635. [Google Scholar] [CrossRef]
- Bessaies-Bey, H.; Massoussi, N.; Mulik, S.; Baumann, R.; Schmitz, M.; Radler, M.; Gelardi, G.; Flatt, R.J.; Roussel, N. Polycarboxylate ester adsorption on cement grains. Influence of polydispersity. Cem. Concr. Res. 2021, 143, 106383. [Google Scholar] [CrossRef]
- Boukendakdji, O.; Kadri, E.; Kenai, S. Effects of granulated blast furnace slag and superplasticizer type on the fresh properties and compressive strength of self-compacting concrete. Cem. Concr. Compos. 2012, 34, 583–590. [Google Scholar] [CrossRef]
- Winnefeld, F.; Becker, S.; Pakusch, J.; Götz, T. Effects of the molecular architecture of comb-shaped superplasticizers on their performance in cementitious systems. Cem. Concr. Compos. 2007, 29, 251–262. [Google Scholar] [CrossRef]
- Hanehara, H.; Yamada, K. Rheology and early age properties of cement systems. Cem. Concr. Res. 2008, 38, 175–195. [Google Scholar] [CrossRef]
- Liu, M.; Lei, J.; Bi, Y.; Du, X.; Zhao, Q.; Zhang, X. Preparation of polycarboxylate-based superplasticizer and its effects on zeta potential and rheological property of cement paste. J. Wuhan Univ. Technol.-Mat. Sci. 2015, 30, 1008–1012. [Google Scholar] [CrossRef]
- Yamada, K.; Takahashi, T.; Hanehara, S.; Matsuhisa, M. Effects of the chemical structure on the properties of polycarboxylate-type superplasticizer. Cem. Concr. Res. 2000, 30, 197–207. [Google Scholar] [CrossRef]
- Erzengin, S.G.; Kaya, K.; Özkorucuklu, S.P.; Özdemir, V.; Yıldırım, G. The properties of cement systems superplasticizer with methacrylic ester-based polycarboxylates. Constr. Build. Mater. 2018, 166, 96–109. [Google Scholar] [CrossRef]
- Barfield, M.; Ghafoori, N. Air-entrained self-consolidating concrete: A study of admixture sources. Constr. Build. Mater. 2012, 26, 490–496. [Google Scholar] [CrossRef]
- Łaźniewska-Piekarczyk, B. The influence of selected new generation admixtures on the workability, air-voids parameters and frost-resistance of self-compacting concrete. Constr. Build. Mater. 2012, 31, 310–319. [Google Scholar] [CrossRef]
- Łaźniewska-Piekarczyk, B. the influence of admixtures type on the air-voids parameters of non-air- entrained and air-entrained high-performance SCC. Constr. Build. Mater. 2013, 41, 109–124. [Google Scholar] [CrossRef]
- Łaźniewska-Piekarczyk, B. The methodology for assessing the impact of new generation superplasticizers on air content in self-compacting concrete. Constr. Build. Mater. 2014, 53, 488–502. [Google Scholar] [CrossRef]
- ASTM C150; Standard Specification for Portland Cement. Annual Book of ASTM Standards. American Society for Testing and Materials: West Conshohocken, PA, USA, 2004; Volume 4, pp. 150–157.
- ASTM C618; Standard Test Method for Coal Fly Ash and Raw or Calcined Natural Pozzolan for Use as a Mineral Admixture in Concrete. Annual Book of ASTM Standards. American Society for Testing and Materials: West Conshohocken, PA, USA, 2004; Volume 4, pp. 312–319.
- ASTM C33; Standard Specification for Concrete Aggregates. Annual Book of ASTM Standards. American Society for Testing and Materials: West Conshohocken, PA, USA, 2004; Volume 4, pp. 10–16.
- ASTM C94; Standard Specification for Chemical Admixture for Concrete. Annual Book of ASTM Standards. American Society for Testing and Materials: West Conshohocken, PA, USA, 2004; Volume 4, pp. 271–279.
- American Society for Testing and Materials Subcommittee C09.47 on Self-Consolidating Concrete, Part of ASTM International Committee C09 on Concrete and Concrete Aggregates. Available online: https://www.astm.org/get-involved/technical-committees/committee-c09/subcommittee-c09/jurisdiction-c0947 (accessed on 25 May 2024).
- ASTM C1611; Standard Test Method for Slump Flow of Self-Consolidating Concrete. Annual Book of ASTM Standards. American Society for Testing and Materials: West Conshohocken, PA, USA, 2005; Volume 4, pp. 36–41.
- ASTM C1621; Standard Test Method for Passing Ability of Self-Consolidating Concrete by J-Ring. Annual Book of ASTM Standards. American Society for Testing and Materials: West Conshohocken, PA, USA, 2005; Volume 4, pp. 42–45.
- ASTM C1610; Standard Test Method for Static Segregation of Self-Consolidating Concrete Using Column Technique. Annual Book of ASTM Standards. American Society for Testing and Materials: West Conshohocken, PA, USA, 2005; Volume 4, pp. 46–49.
- Skoog, D.A.; Holler, F.J.; Nieman, T.A. Principles of Instrumental Analysis, 5th ed.; Harcourt Brace College Publishers: San Diego, CA, USA, 1998; p. 849. [Google Scholar]
- Linear and Nonlinear Regression (Curve Fitting), Statistical Analysis and Data Plotting Software, DataFit 8.1.


| Mix No. | Portland Cement (kg/m3) | Fly Ash (kg/m3) | w/cm 1 | Fine Aggre. (kg/m3) | Coarse Aggre. (kg/m3) | Admixture Dosage (mL/100 kg) | Paste Fraction | Mortar Fraction | Volume of Coarse Aggre. | |
|---|---|---|---|---|---|---|---|---|---|---|
| HRWRA 2 | VMA 3 | (%) | (%) | (%) | ||||||
| A. SF508 | 390 | 78 | 0.40 | 849 | 922 | 281.05 | 0.00 | 34.60 | 65.62 | 33.04 |
| B. SF508 | 390 | 78 | 0.40 | 849 | 922 | 150.33 | 0.00 | 34.55 | 65.63 | 33.03 |
| C. SF508 | 390 | 78 | 0.40 | 849 | 922 | 228.76 | 0.00 | 34.58 | 65.63 | 33.03 |
| D. SF508 | 390 | 78 | 0.40 | 848 | 922 | 137.25 | 0.00 | 34.54 | 65.63 | 33.03 |
| A. SF635 | 390 | 78 | 0.40 | 849 | 922 | 326.80 | 65.36 | 34.63 | 65.62 | 33.05 |
| B. SF635 | 390 | 78 | 0.40 | 849 | 922 | 209.15 | 26.14 | 34.58 | 65.62 | 33.04 |
| C. SF635 | 390 | 78 | 0.40 | 849 | 922 | 261.44 | 26.14 | 34.60 | 65.62 | 33.04 |
| D. SF635 | 390 | 78 | 0.40 | 849 | 922 | 196.08 | 26.14 | 34.57 | 65.63 | 33.04 |
| A. SF711 | 390 | 78 | 0.40 | 849 | 923 | 431.37 | 104.58 | 34.69 | 65.61 | 33.05 |
| B. SF711 | 390 | 78 | 0.40 | 849 | 922 | 254.90 | 32.68 | 34.60 | 65.62 | 33.04 |
| C. SF711 | 390 | 78 | 0.40 | 849 | 922 | 307.19 | 32.68 | 34.62 | 65.62 | 33.04 |
| D. SF711 | 390 | 78 | 0.40 | 849 | 922 | 235.29 | 32.68 | 34.59 | 65.62 | 33.04 |
| Designation | * Absorbance (l, nm) | Increase in HRWRA Concentration (g/L) | ||
|---|---|---|---|---|
| A (265) | A (700) | A (265 Corr) | ||
| Source A | 1.039 | 0.013 | 1.026 | 15.43 |
| Source B | 2.558 | 0.051 | 2.507 | 33.96 |
| Source C | 1.624 | 0.054 | 1.570 | 16.61 |
| Source D | 2.495 | 0.052 | 2.443 | 194.90 |
| Admixture Source | Group I SCC | Group III SCC | ||
|---|---|---|---|---|
| Slump Flow 635 mm | Slump Flow 711 mm | Slump Flow 635 mm | Slump Flow 711 mm | |
| A | 0.59 | 0.78 | 0.20 | 0.24 |
| B | 0.19 | 0.20 | 0.13 | 0.13 |
| C | 0.17 | 0.19 | 0.10 | 0.11 |
| D | 0.17 | 0.16 | 0.13 | 0.14 |
| Mix No. | Slump Flow (mm) | T50 (s) | VSI | J Ring Value (mm) | SI (%) | L Box H2/H1 | U-Box H1-H2 (mm) | V-Funnel (s) | ||
|---|---|---|---|---|---|---|---|---|---|---|
| H2/H1 | T20 (s) | T40 (s) | ||||||||
| S7.A.SF20 | 527.05 | 2.69 | 0 | 43.94 | 6.37 | 0.65 | 0.55 | 1.62 | 225.55 | 4.82 |
| S7.B.SF20 | 524.00 | 3.19 | 0 | 42.67 | 4.83 | 0.63 | 0.71 | 2.45 | 244.60 | 5.12 |
| S7.C.SF20 | 524.00 | 3.15 | 0 | 45.72 | 5.07 | 0.65 | 0.67 | 1.82 | 247.65 | 5.17 |
| S7.D.SF20 | 511.30 | 2.82 | 0 | 44.45 | 7.15 | 0.70 | 0.63 | 1.79 | 242.32 | 4.90 |
| S7.A.SF25 | 651.00 | 2.48 | 0 | 36.83 | 8.12 | 0.84 | 0.52 | 1.61 | 215.90 | 4.35 |
| S7.B.SF25 | 651.00 | 2.79 | 0 | 38.86 | 5.72 | 0.83 | 0.70 | 1.97 | 231.90 | 4.55 |
| S7.C.SF25 | 651.00 | 2.69 | 0 | 37.59 | 5.64 | 0.83 | 0.59 | 1.74 | 231.65 | 4.65 |
| S7.D.SF25 | 649.73 | 2.04 | 0 | 38.10 | 9.57 | 0.86 | 0.58 | 1.70 | 234.95 | 4.40 |
| S7.A.SF28 | 727.20 | 1.85 | 1 | 31.75 | 9.11 | 0.88 | 0.48 | 1.48 | 184.15 | 4.07 |
| S7.B.SF28 | 723.90 | 2.16 | 1 | 33.78 | 8.03 | 0.90 | 0.52 | 1.83 | 222.25 | 4.13 |
| S7.C.SF28 | 720.85 | 2.15 | 1 | 32.51 | 8.17 | 0.86 | 0.56 | 1.64 | 225.55 | 4.22 |
| S7.D.SF28 | 727.20 | 1.88 | 1 | 32.51 | 10.56 | 0.88 | 0.52 | 1.60 | 212.85 | 4.07 |
| Equation | Coefficient of Multiple Determination R2, % | Standard Deviation S, mL/100 kg | Prob(t) | Prob (F) | |||||
|---|---|---|---|---|---|---|---|---|---|
| a | b | c | d | E | f | ||||
| 1. HRA = a + b*SF + c/b + d/b2 | 98.58 | 27.44 | 0.2847 | 0.0398 | 0.2897 | 0.2949 | - | - | 0.0211 |
| 2. VMAA = a + b*SF + c/b + d/b2 | 99.53 | 22.61 | 0.0144 | 0.0187 | 0.0144 | 0.0146 | - | - | 0.0069 |
| 3. HRB,C,D = a + b*SF + c/b + d/b2 + e/b3 | 92.68 | 27.16 | 0.0038 | 0.3983 | 0.0039 | 0.0039 | 0.0039 | - | 0.0000 |
| 4. VMAB,C,D = a + b/SF + c*b + d/SF2 + e*b2 + f*b/SF | 98.40 | 4.44 | 0.2027 | 0.0069 | 0.1913 | 0.00142 | 0.1809 | 0.0158 | 0.0000 |
| Flowability/viscosity | 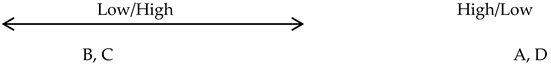 |
| Dynamic stability | 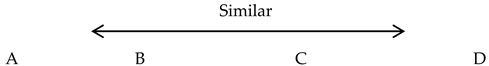 |
| Static stability | 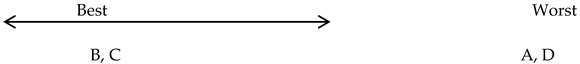 |
| Passing Stability |  |
| Filling Ability | 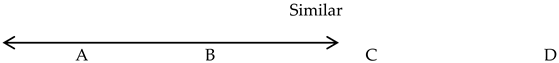 |
| Mix No. | Demolded Unit Weight (kg/m3) | 7 Days | 28 Days | 90 Days |
|---|---|---|---|---|
| S7.A.SF20 | 2452 | 44.21 | 55.50 | 69.24 |
| S7.B.SF20 | 2452 | 45.13 | 56.68 | 70.85 |
| S7.C.SF20 | 2452 | 45.67 | 57.42 | 71.62 |
| S7.D.SF20 | 2452 | 44.79 | 56.22 | 70.16 |
| S7.A.SF25 | 2452 | 44.72 | 56.32 | 70.13 |
| S7.B.SF25 | 2452 | 45.58 | 57.41 | 71.64 |
| S7.C.SF25 | 2452 | 46.13 | 57.92 | 72.48 |
| S7.D.SF25 | 2452 | 45.39 | 56.99 | 71.04 |
| S7.A.SF28 | 2452 | 45.55 | 57.08 | 70.43 |
| S7.B.SF28 | 2452 | 46.41 | 58.30 | 71.98 |
| S7.C.SF28 | 2452 | 47.02 | 59.03 | 72.87 |
| S7.D.SF28 | 2452 | 46.19 | 57.86 | 71.31 |
Disclaimer/Publisher’s Note: The statements, opinions and data contained in all publications are solely those of the individual author(s) and contributor(s) and not of MDPI and/or the editor(s). MDPI and/or the editor(s) disclaim responsibility for any injury to people or property resulting from any ideas, methods, instructions or products referred to in the content. |
© 2024 by the authors. Licensee MDPI, Basel, Switzerland. This article is an open access article distributed under the terms and conditions of the Creative Commons Attribution (CC BY) license (https://creativecommons.org/licenses/by/4.0/).
Share and Cite
Ghafoori, N.; Gbadamosi, A.; Diawara, H.; Hasnat, A. Influence of Admixture Source on Fresh Properties of Self-Consolidating Concrete. Materials 2024, 17, 3215. https://doi.org/10.3390/ma17133215
Ghafoori N, Gbadamosi A, Diawara H, Hasnat A. Influence of Admixture Source on Fresh Properties of Self-Consolidating Concrete. Materials. 2024; 17(13):3215. https://doi.org/10.3390/ma17133215
Chicago/Turabian StyleGhafoori, Nader, Aderemi Gbadamosi, Hamidou Diawara, and Ariful Hasnat. 2024. "Influence of Admixture Source on Fresh Properties of Self-Consolidating Concrete" Materials 17, no. 13: 3215. https://doi.org/10.3390/ma17133215
APA StyleGhafoori, N., Gbadamosi, A., Diawara, H., & Hasnat, A. (2024). Influence of Admixture Source on Fresh Properties of Self-Consolidating Concrete. Materials, 17(13), 3215. https://doi.org/10.3390/ma17133215