Article

Resistance Analysis of Crack Propagation in Concrete Subjected to Hydraulic Pressure

1
State Key Laboratory of Precision Blasting, Jianghan University, Wuhan 430056, China
2
Hubei Key Laboratory of Blasting Engineering, Jianghan University, Wuhan 430056, China
3
School of Water Resources and Hydropower Engineering, Wuhan University, Wuhan 430072, China
*
Authors to whom correspondence should be addressed.
Materials 2024, 17(13), 3243; https://doi.org/10.3390/ma17133243
Submission received: 24 May 2024 / Revised: 12 June 2024 / Accepted: 17 June 2024 / Published: 2 July 2024
(This article belongs to the Section Construction and Building Materials)

Abstract

:
The KR resistance curve for hydraulic crack propagation in a concrete beam was determined and discussed. A semi-analytical method was introduced to calculate the hydraulic crack propagation in concrete. A series of concrete beams with various hydraulic pressures and initial crack depths were tested, and the hydraulic crack propagation in these beams was calculated. The calculated P-CMOD curves were first verified, and then the calculated KR resistance curve for hydraulic crack propagation was determined. Based on the test results and calculation results, the following conclusions can be drawn: The proposed analysis method can accurately predict the hydraulic crack propagation process in concrete. The KR resistance to hydraulic crack propagation in concrete decreases with the increase in hydraulic pressure but is less influenced by the initial crack depth of the test beams. In addition, the concrete beams collapse immediately under hydraulic fracturing once the KIw curve reaches the KR resistance curve. This indicates that the failure of concrete structures under hydraulic fracturing occurs immediately once the driving force of crack propagation, dominated by the hydraulic pressure in the crack, becomes significant.

1. Introduction

Hydraulic fracturing is a severe problem in hydraulic engineering and is the main cause of serious leakage accidents in high concrete dams, deep water tunnels, and water conveyance tunnels [1,2,3]. The splitting load effect of hydraulic pressure in cracks has been recognized by common research, and the hydraulic pressure transition zone in cracks has been observed in experiments [4,5], which is related to the shape of the crack opening. Generally, due to the weak tensile performance of concrete and the inevitable temperature stress during concrete pouring, cracks often occur in concrete structures. The existence of these initial cracks can easily trigger the initiation of hydraulic fracturing and the propagation of hydraulic cracks in concrete structures. Therefore, studying the propagation of hydraulic cracks in concrete is of great importance.
The key to investigating the hydraulic crack propagation in concrete is describing the resistance of crack propagation. To analyze the resistance characteristics of crack propagation in metal materials, an R resistance curve was proposed [6,7]. However, the R resistance curve has limitations in analyzing the fracture resistance of solid materials like concrete. It cannot accurately describe the increase in fracture toughness in the crack propagation. To solve this problem, Reinhardt and Xu [8,9] proposed using the KR resistance curve instead of the R resistance curve to describe the crack propagation resistance of concrete. The crack propagation resistance in concrete is divided into two parts in the KR resistance curve: one is the inherent crack resistance of concrete material named as K I c i n i , and the other is the resistance induced by the cohesion distributed in the fictitious crack zone. A large number of concrete experiments [10,11,12,13] show that the KR resistance curve has high reliability in describing the resistance of crack propagation in concrete.
The determination of the KR resistance curve of concrete is related to the fracture parameters, including elastic modulus, initiation fracture toughness, and the tensile stress softening curve. Therefore, numerous hydraulic fracturing tests of concrete are necessary to study the resistance of hydraulic crack propagation in concrete. Bruhwiler and Saouma [14,15] conducted a series of hydraulic fracturing tests to study the influence of hydraulic pressure on the fracture energy of concrete. They recommended the compact tensile specimen as the test specimen and proposed and verified the test method. Xu and Wang [16,17] recommended improved hydraulic fracturing tests of concrete based on a large compact tensile specimen and calculated the double-K fracture toughness in their research. John P. and Lee [18] performed four-point bending tests on reinforced concrete beams within hydraulic pressure and discussed the loading force and strain performance of reinforced concrete beams. Wang and Jia [19,20] employed notched columnar concrete specimens to study the critical hydraulic pressure in the crack that break the test specimen. Chen and Du [21,22] developed a new sealing device to conduct the hydraulic fracturing tests of concrete specimens and discussed the hydraulic pressure distributions in the crack under different loading rates. Wang [23,24,25] performed hydraulic fracturing tests on the three-point bending concrete beams to investigate the effect of water pressure on the fracture parameters of concrete. In these hydraulic fracturing tests, all tested specimens were precracked and filled with pressurized water to simulate hydraulic cracks in concrete. In these tests, the distribution of hydraulic pressure in cracks and the fracture parameters of the concrete are the focus of scholars’ attention; however, the discussion on the resistance of hydraulic crack propagation in the concrete is rarely mentioned.
The main objective of this paper is to study the KR resistance curve of the concrete subjected to different hydraulic pressures. A semi-analytical method is proposed to calculate the propagation of the mode-I crack within hydraulic pressure in the concrete based on the fictitious crack mode by combining the deformation coordination equation and the initiation fracture toughness criterion. Moreover, a series of three-point bending (TPB) concrete beams subjected to hydraulic fracturing are assessed to verify the validity of the proposed method. Additionally, the effects of hydraulic pressure and initial crack depth ratio on the KR resistance and the hydraulic crack propagation in concrete are analyzed and discussed.

2. Analysis of Hydraulic Crack Propagation in Concrete Beam

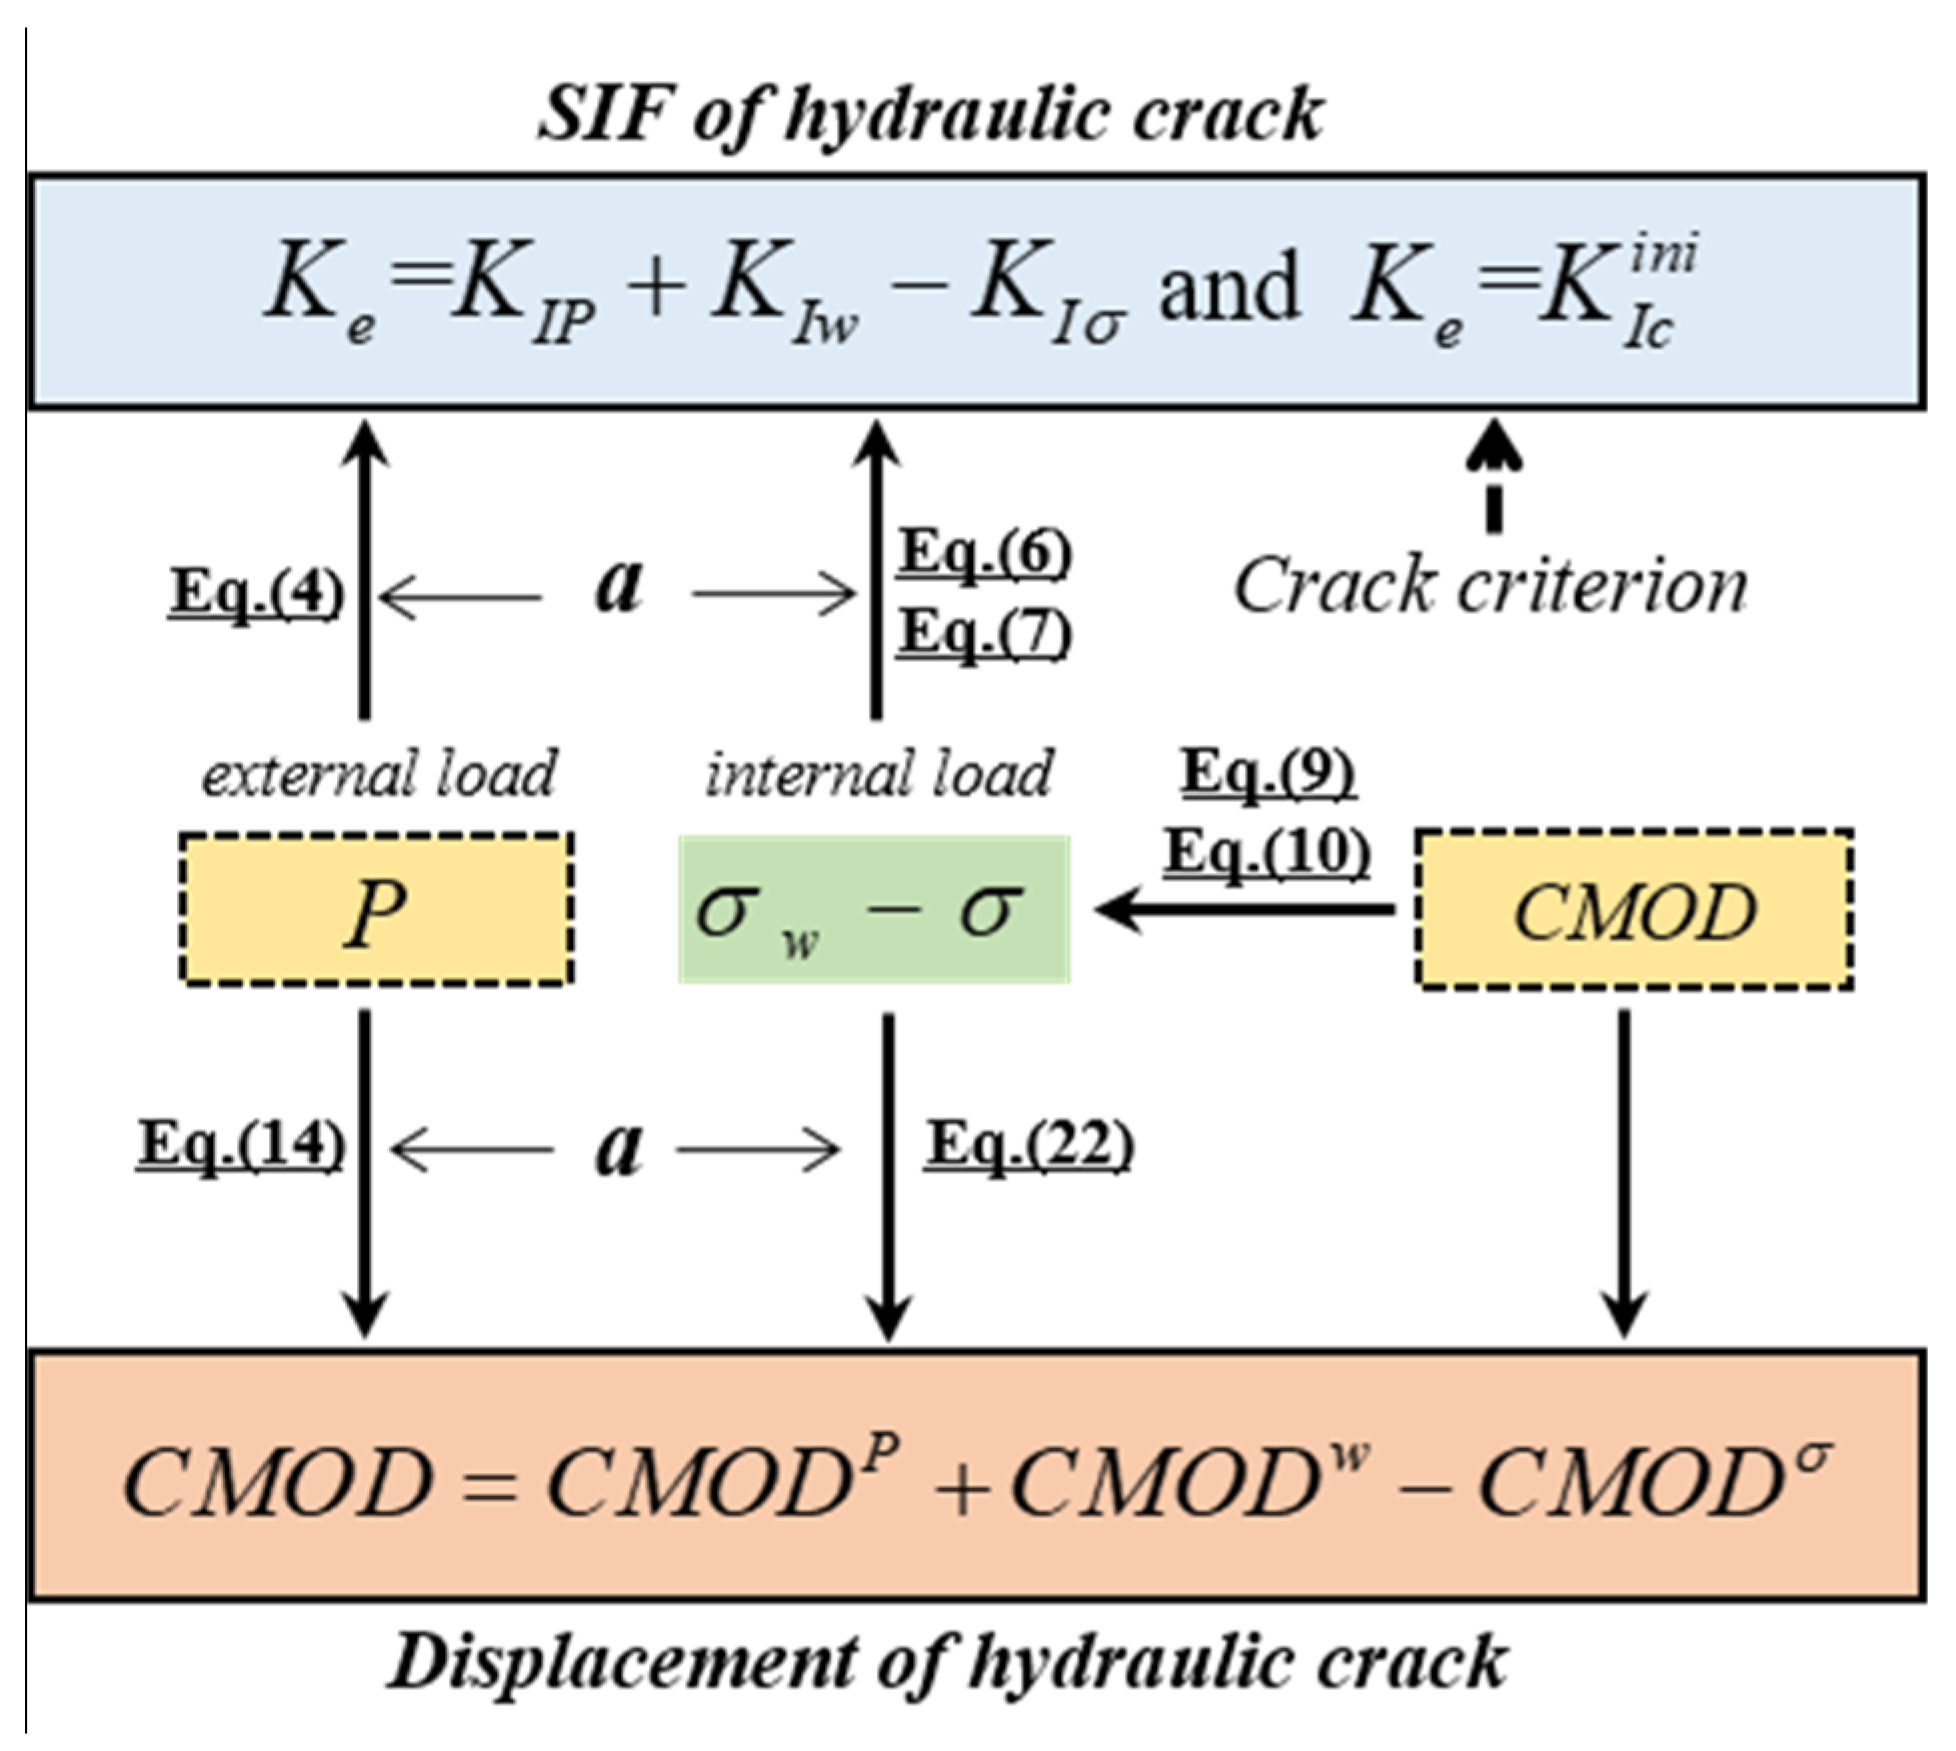
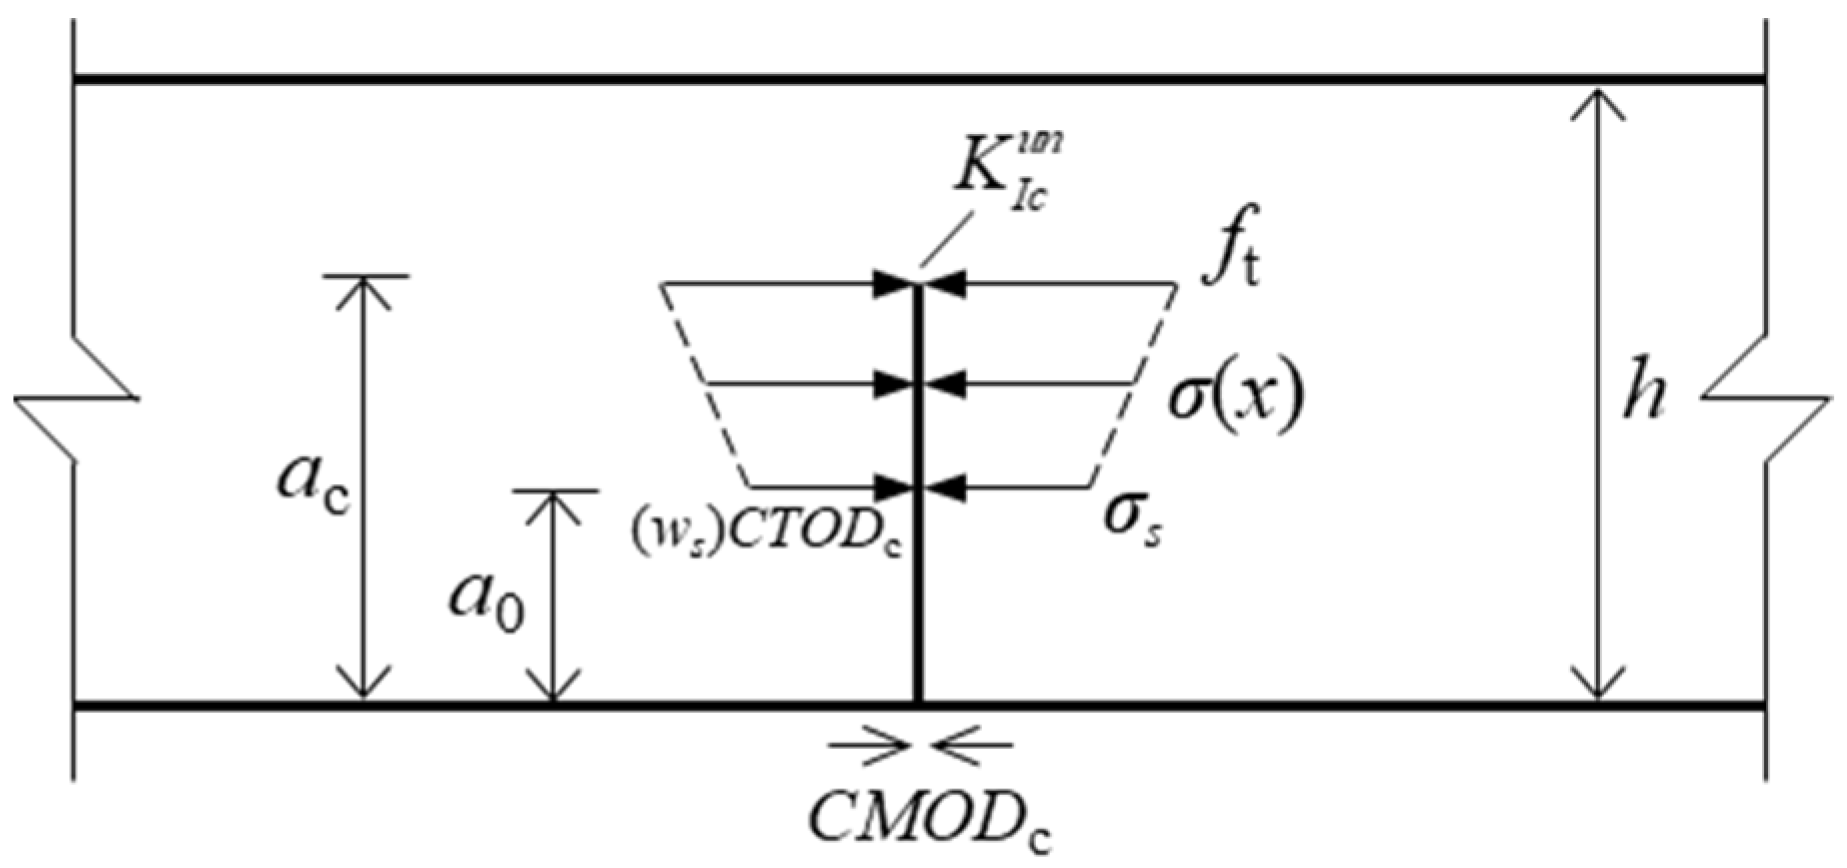
2.1. Criterion of Hydraulic Crack Propagation in Concrete

Figure 1 shows the loading forces applied on a standard TPB notched concrete beam under hydraulic fracturing. The geometry of the beam is S in the span, h in the height, and B in the thickness, and the length of the initial crack in the middle of the beam is a0. Figure 1 shows external load P and hydraulic pressure σ w acting on the crack surface, which are the driving forces of the hydraulic crack propagation in concrete.
All forces applied on the concrete beam under hydraulic fracturing can be divided into three parts: external load P, internal hydraulic pressure σ w , and cohesion in the crack σ . According to the superposition principle, the stress intensity factor (SIF) at the crack tip Ke can be evaluated using the following equation:
K e = K I P + K I w K I σ
where K e is the SIF at the crack tip, K I P is the SIF induced by the loading force P, K I w is the SIF induced by the hydraulic pressure in the crack, and K I σ is the SIF induced by the cohesive force in FPZ.
For a crack that continuously propagates in quasi-brittle materials, the SIF of the crack tip should satisfy the following equation:
K e = K I c i n i
where K I c i n i is the initial fracture toughness of the materials. This crack propagation criterion has been proven by Wu and Dong [26,27] in a simulation of crack propagation in concrete. Therefore, the hydraulic crack propagation criterion can be proposed as follows:
K I P + K I w K I σ = K I c i n i
The SIF induced by loading force P, for the TPB beam with a crack length of a, can be calculated by the following formula [28]:
K I P = 3 P S a 2 h 2 B F 1 ( a h )
F 1 ( a h ) = 1.99 ( a h ) ( 1 a h ) [ 2.15 3.93 ( a h ) + 2.7 ( a h ) 2 ] ( 1 + 2 a h ) ( 1 a h ) 3 / 2
According to the fictitious crack model, hydraulic pressure σ w and cohesive force σ are considered to act on both sides of the fictitious crack zone. The SIFs induced by hydraulic pressure and cohesive force can be determined by Equation (6) [23] and Equation (7) [29], respectively.
K I w = 0 a 2 σ w ( x ) π a F 2 ( x a , a h ) d x
K I σ = a 0 a 2 σ ( x ) π a F 2 ( x a , a h ) d x
F 2 ( x a , a h ) = 3.52 ( 1 x a ) ( 1 a h ) 3 / 2 4.35 5.28 ( x a ) ( 1 a h ) 1 / 2 + 1.3 0.3 ( x a ) 3 / 2 1 ( x a ) 2 + 0.83 - 1.76 ( x a ) [ 1 - ( 1 - x a ) ( a h ) ]
Previous researchers have shown that the hydraulic pressure and cohesive force applied on the crack surface can be described as quadratic and bilinear functions of crack width, respectively. The quadratic function relation of the hydraulic pressure σ w ( x ) and crack width w(x) shown in Figure 2a can be expressed as follows [23]:
σ w ( x ) = A ( w ( x ) C O D w ) 2 σ w 0 + B ( w ( x ) C O D w ) σ w 0   ,   w ( x ) C O D w σ w 0   ,   C O D w < w ( x )
where COD is the crack opening displacement, CODw is the critical crack width, and A and B are the fitting parameters of the relation between internal hydraulic pressure and crack width; CODw, A, and B can be obtained using a hydraulic fracture test of concrete beams [23].
Moreover, the bilinear function shown in Figure 2b can be employed to represent the softening tensile relationship of the cohesive stress in the fracture process zone (FPZ) of the crack. The relationship between the cohesive stress σ(x) and the crack width w(x) can be expressed as follows:
σ ( x ) = f t ( f t σ s ) w ( x ) / w s   0 w ( x ) w s σ s w 0 w ( x ) / w 0 w s w s < w ( x ) w 0 0 w 0 < w ( x )
where f t is the tensile strength. The key parameters w s , w 0 , and σ s in Equation (10) can be obtained based on the fracture energy G F and tensile strength f t of concrete as follows:
w s = 0.8   G F / f t w 0 = 3.6   G F / f t σ s = f t / 3

2.2. Determination of Hydraulic Crack Width in Concrete

Equations (8) and (9) show that the determinations of the internal hydraulic pressure σ w ( x ) and the cohesive force σ ( x ) are related to the crack width w ( x ) . For the concrete beam, the crack width, w, is produced by the external loading force, the hydraulic pressure σ w ( x ) , and the cohesion σ ( x ) in the crack. Hence, the w ( x ) of the hydraulic crack can be mathematically written as follows:
w ( x ) = w P ( x ) + w σ w ( x ) w σ ( x )
where w ( x ) is the crack width of the hydraulic crack at a distance of x to the crack mouth, w P ( x ) is the crack width of the hydraulic crack created by the external load, w σ w ( x ) is the crack width of the hydraulic crack created by the hydraulic pressure in the crack, and w σ ( x ) is the crack width of the hydraulic crack created by the cohesion in the crack.
The crack width w P ( x ) created by the external force P can be obtained by the following formula:
w P ( x ) = CMOD p [ ( 1 x a ) 2 + ( 1.081 1.149 a h ) x a ( 1 x a ) ] 1 / 2
where C M O D P represents the crack mouth opening displacement of test concrete beams created by the external load P, which can be obtained by Equation (14) [26]:
CMOD p = 24 P λ E B 0.76 2.28 λ + 3.87 λ 2 2.04 λ 3 + 0.66 ( 1 λ ) 2
where E is the Young’s modulus of the concrete beam, and λ = a / h .
For the hydraulic crack in the concrete, the internal forces applied on the crack surface consist of hydraulic pressure w σ w ( x ) and cohesive force w σ ( x ) . Thus, the crack width of the hydraulic crack can be obtained by the superposition of the crack width under a pair of concentrated loads using Castigliano’s theorem.
Figure 3 shows the crack width w(y) of the crack with a length subjected to a pair of concentrated loads, F, with a distance of l to the crack tip which can be given by [30].
w ( y ) = 2 E l y l K F ( u ) K Q ( u - l + y ) Q Q = 0 d u
Here, u is the distance of the calculated point to the crack tip; v is the distance of the calculated point to the point of application of F; Q is a pair of fictitious concentrated forces in the crack with a distance of y to the tip; and KF and KQ are the SIFs created by F and Q, respectively. Exchanging the locations of F and Q in the crack, Equation (15) can be rewritten as follows:
w ( y ) = 2 E y l l K F ( u y + l ) K Q ( u ) Q Q = 0 d u
The internal stress applied in the hydraulic crack can be calculated as σ c ( x ) = σ w ( x ) σ ( x ) . The internal stress can be divided into two parts: the stress distributed along the range of 0 v x denoted as σ 1 ( x ) and the stress distributed along the range of x < v a denoted as σ 2 ( x ) . Substituting F = σ c ( v ) Δ v = [ σ w ( v ) σ ( v ) ] Δ v , Equations (5) and (6) into Equation (15), and integrating v along the range of 0 v x , the crack width w σ 1 ( x ) induced by σ 1 ( x ) can be calculated as follows:
w σ 1 ( x ) = 8 π E 0 x x a σ w ( v ) σ ( v ) u F 2 ( v u , u h ) F 2 ( x u , u h ) d u d v
Similarly, substituting F = σ c ( v ) Δ v = [ σ w ( v ) σ ( v ) ] Δ v , Equations (5) and (6) into Equation (16), and changing the integration path of v to the range of x < v a , the crack width w σ 2 ( x ) created by σ 2 ( x ) can be calculated as follows:
w σ 2 ( x ) = 8 π E x a v a σ w ( v ) σ ( v ) u F 2 ( v u , u h ) F 2 ( x u , u h ) d u d v
The crack width w σ c ( x ) induced by internal forces applied in the crack can be obtained by Equation (19), which is a combination of Equations (17) and (18) as follows:
w σ c ( x ) = w σ 1 ( x ) + w σ 2 ( x )
Therefore, the crack width induced by the hydraulic pressure and the cohesive force can be obtained by substituting w σ c ( x ) = w σ w ( x ) w σ ( x ) into Equation (19) as follows:
w σ w ( x ) w σ ( x ) = 8 π E x a v a σ w ( v ) σ ( v ) u F 2 ( v u , u h ) F 2 ( x u , u h ) d u d v
Crack width w ( x ) can be calculated by combining Equations (13) and (20).
If x = 0, w ( 0 ) represents the crack mouth opening displacement, CMOD, of the hydraulic crack and can be expressed as follows:
C M O D = C M O D P + C M O D w C M O D σ
where C M O D P is the CMOD created by P which can be obtained by Equation (15), C M O D w is the CMOD created by the hydraulic pressure, and σ w ( x ) and C M O D σ represent the CMOD created by the cohesion σ ( x ) . Therefore, the CMOD of the hydraulic crack in the concrete beam can be expressed as follows:
C M O D = 24 P λ E B 0.76 2.28 λ + 3.87 λ 2 2.04 λ 3 + 0.66 ( 1 λ ) 2 + 8 π E 0 a v a σ w ( v ) σ ( v ) u F 2 ( v u , u h ) F 2 ( 0 , u h ) d u d v
Based on the previous analysis, the CMOD can be obtained by calculating the deformation of the hydraulic crack induced by P, σ w ( x ) , and σ ( x ) . The solutions of σ w ( x ) and σ ( x ) are governed by w(x), whereas w(x) is governed by CMOD as follows:
w ( x ) = N ( x ) C M O D
where N(x) is the shape function of a crack in the TPB beam and relating to the CMOD, it can be expressed as follows:
w ( x ) = C M O D ( 1 x / a ) 2 + [ 1.081 1.149 ( a / h ) ] [ x / a ( x / a ) 2 ] 1 / 2
Hence, a correlation must exist between CMOD, P, and σ w ( x ) σ ( x ) for testing a concrete TPB beam with a notch length of a. All parameters of the test beam can be determined when CMOD and P are known.

2.3. Calculation of Hydraulic Crack Propagation

The previous analysis revealed that for a standard TPB beam with a notch length a, the calculation of the hydraulic crack propagation consists of three unknown quantities: loading forces, crack deformation, and the SIF of the crack tip. The solutions of crack deformations and the SIFs induced by cracks are governed by CMOD. A nonexplicit functional relationship exists between P, CMOD, and Ke, as shown in Figure 4. Consequently, CMOD and P can be used as control parameters for calculating the hydraulic crack propagation. In the calculation model of hydraulic crack propagation, Δa, ΔCMOD, and ΔP are the increased step lengths of a, CMOD, and P, respectively.
The specific computation procedures of the crack propagation for TPB concrete beams under hydraulic fracturing can be summarized as follows:
(1)
Input the parameters required for the calculation, including the geometrical dimensions (span S, width B, height h, and initial notch length a0) of the test beam and the material parameters (Young’s modulus E, tensile strength ft, fracture energy GF, and initial fracturing toughness K I c i n i ) of the concrete.
(2)
Specify the expansion of the crack length increment, Δa = a + Δa, Δa = 0.0001 m; employ the increment of crack mouth opening displacement, CMOD = CMOD + ΔCMOD, ΔCMOD = 0.00002m; apply the increment of external load, P = P + ΔP, ΔP = 0.0001 kN.
(3)
Calculate K I P , K I w , K I σ , C M O D P , C M O D w , and C M O D σ by increasing P and CMOD until K I P + K I w K I σ = K I c i n i and C M O D = C M O D P + C M O D w C M O D σ are satisfied. This iterative process is terminated until the increase in applied load P cannot satisfy the K I P + K I w K I σ = K I c i n i , and the maximum load Pmax and the critical crack mouth opening displacement CMODc are determined.
(4)
Calculate K I P , K I w , K I σ , C M O D P , C M O D w , and C M O D σ by decreasing P and increasing CMOD until K I P + K I w K I σ = K I c i n i and C M O D = C M O D P + C M O D w C M O D σ are satisfied. This iterative process is terminated when the crack tip reaches the boundary of the concrete. P < 0 is used in the calculation of satisfying K I P + K I w K I σ = K I c i n i , but P = 0 stands in the calculation of satisfying C M O D = C M O D P + C M O D w C M O D σ .
(5)
Output the calculated results of the characteristic curves of the hydraulic crack propagation process of the test concrete, including the P-CMOD curve, the KR curve, the KIP curve, and the KIw curve.
During the calculation, the applied vertical loading force P, the internal hydraulic pressure σw, and the cohesive force σ, as well as the corresponding SIFs induced by these forces, such as KIP, KIw, and KIc, can be obtained in the iteration.

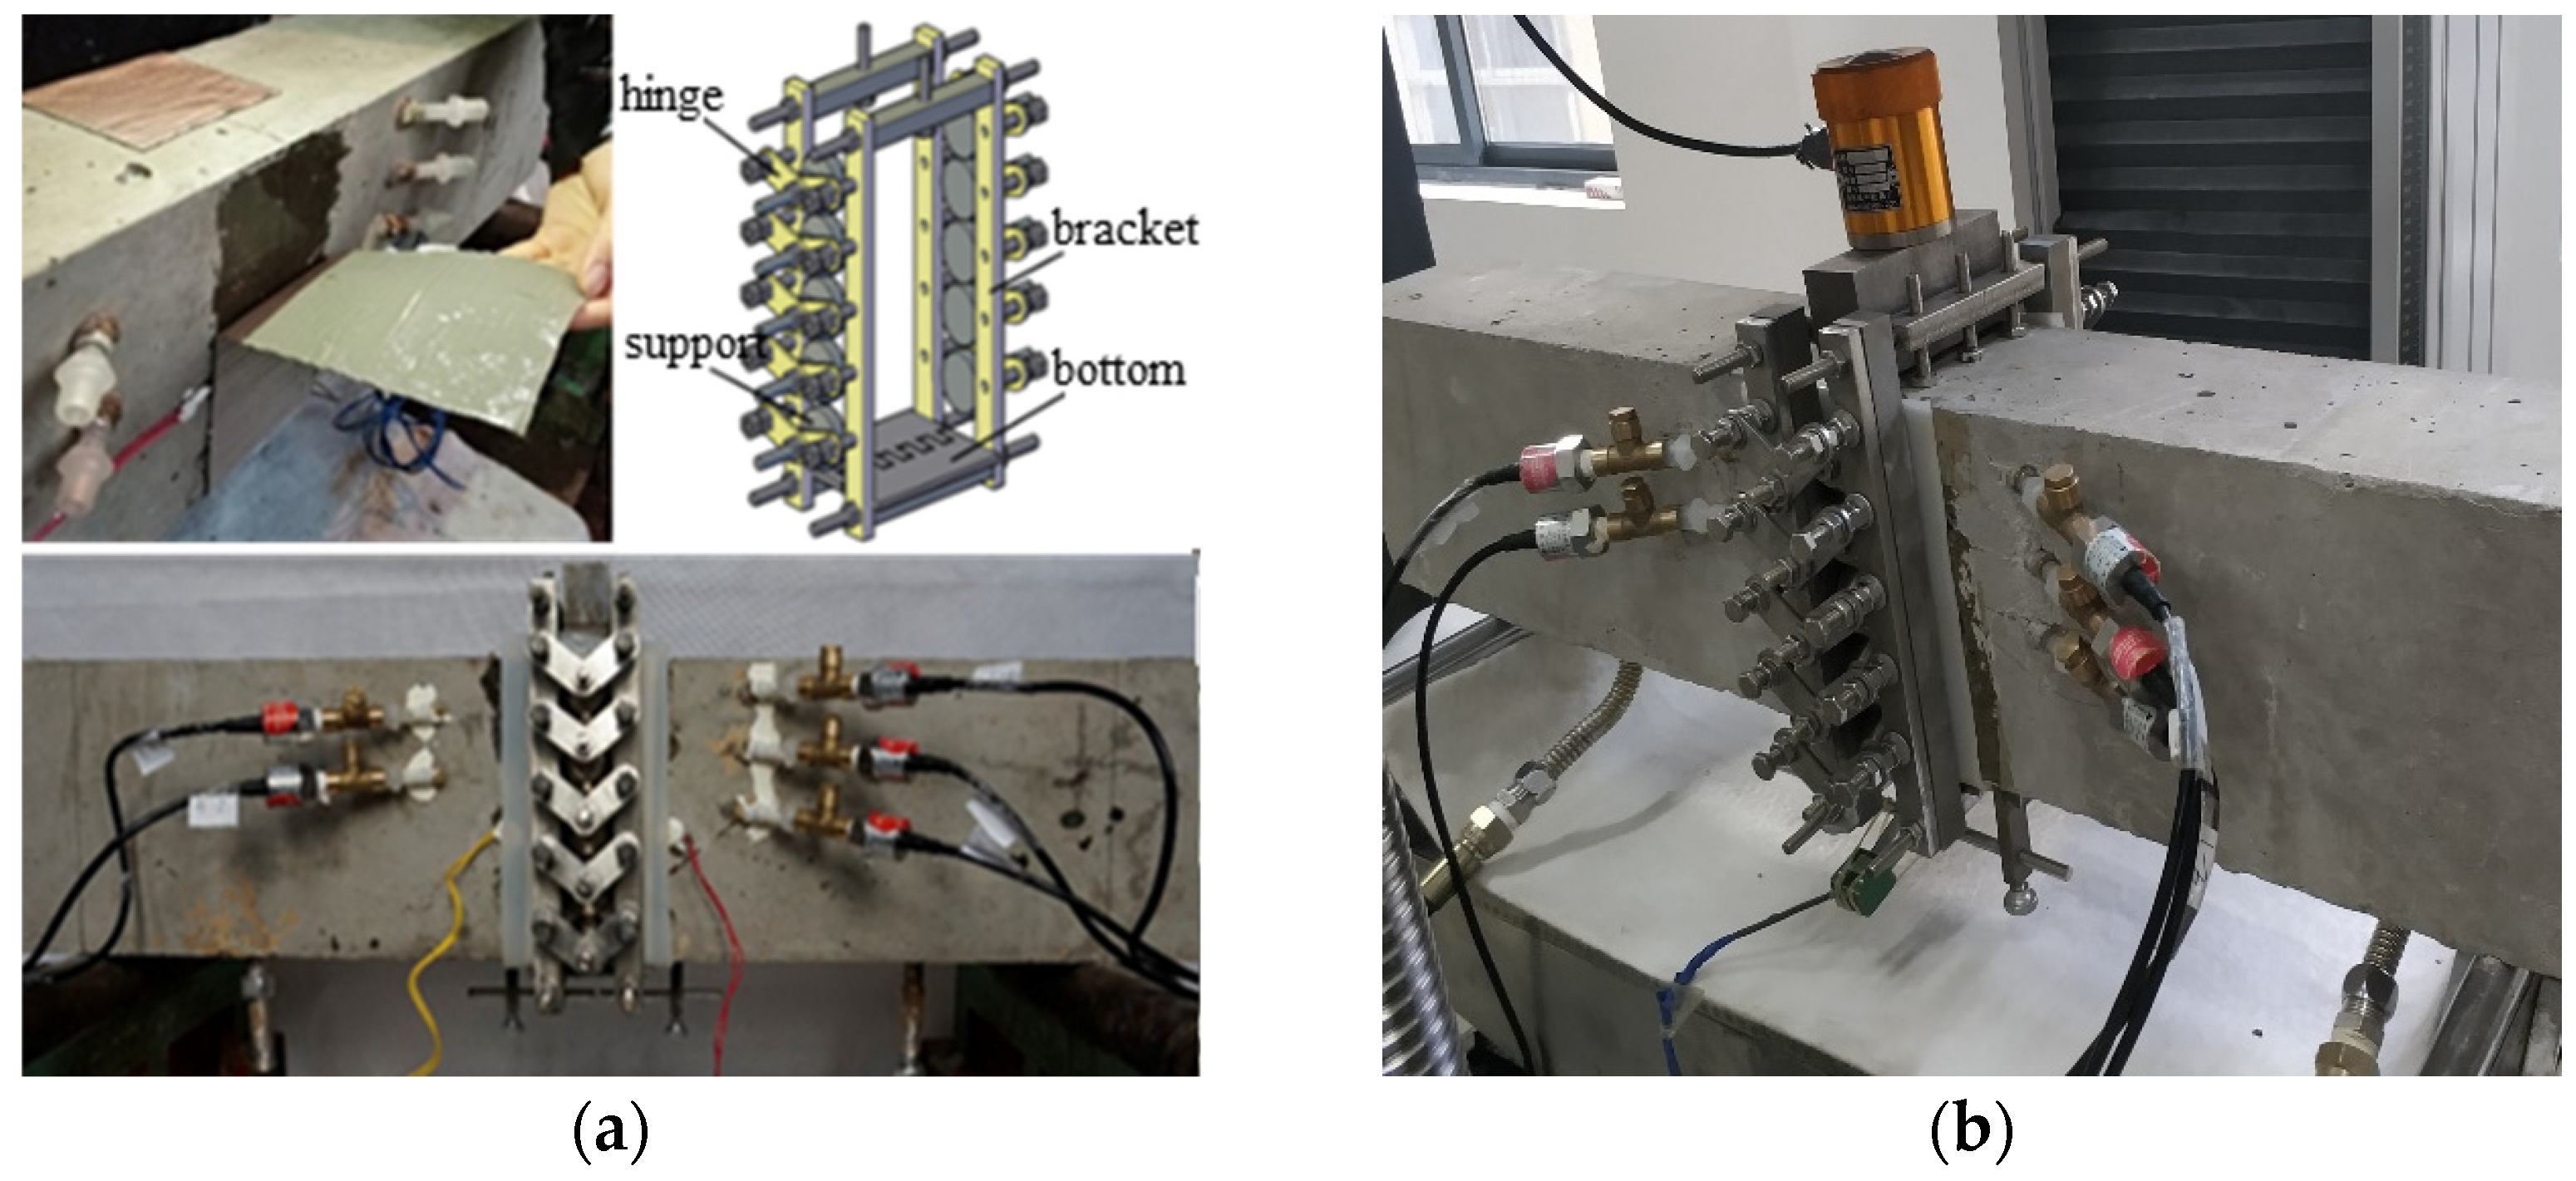
3. Hydraulic Fracturing Test of Concrete Beams

3.1. Experiment Program

In this experiment, 120 mm × 200 mm × 1000 mm molds were used to pour 30 concrete beams divided into 11 groups at one time. To create the crack in the beam, a 3 mm width steel plate was pre-embedded at the center of the timber molding plate before pouring. To create a hydraulic system in the crack, two metal pipes were pre-embedded at each side of the steel plate. Specimens stood 24 h before demolition, covered with cloth, and watered periodically in the laboratory for 28 days. The concrete beam was mixed from cement, natural river sands, and two levels of gravel aggregates. The Young’s modulus, compressive strength, and tensile strength of test concrete are 32.4 GPa, 27.9 MPa, and 3.12 MPa, respectively. The concrete composition is listed in Table 1. The arrangements of all test beams are listed in Table 2. The hydraulic fracturing test setup of the concrete beams is shown in Figure 5.

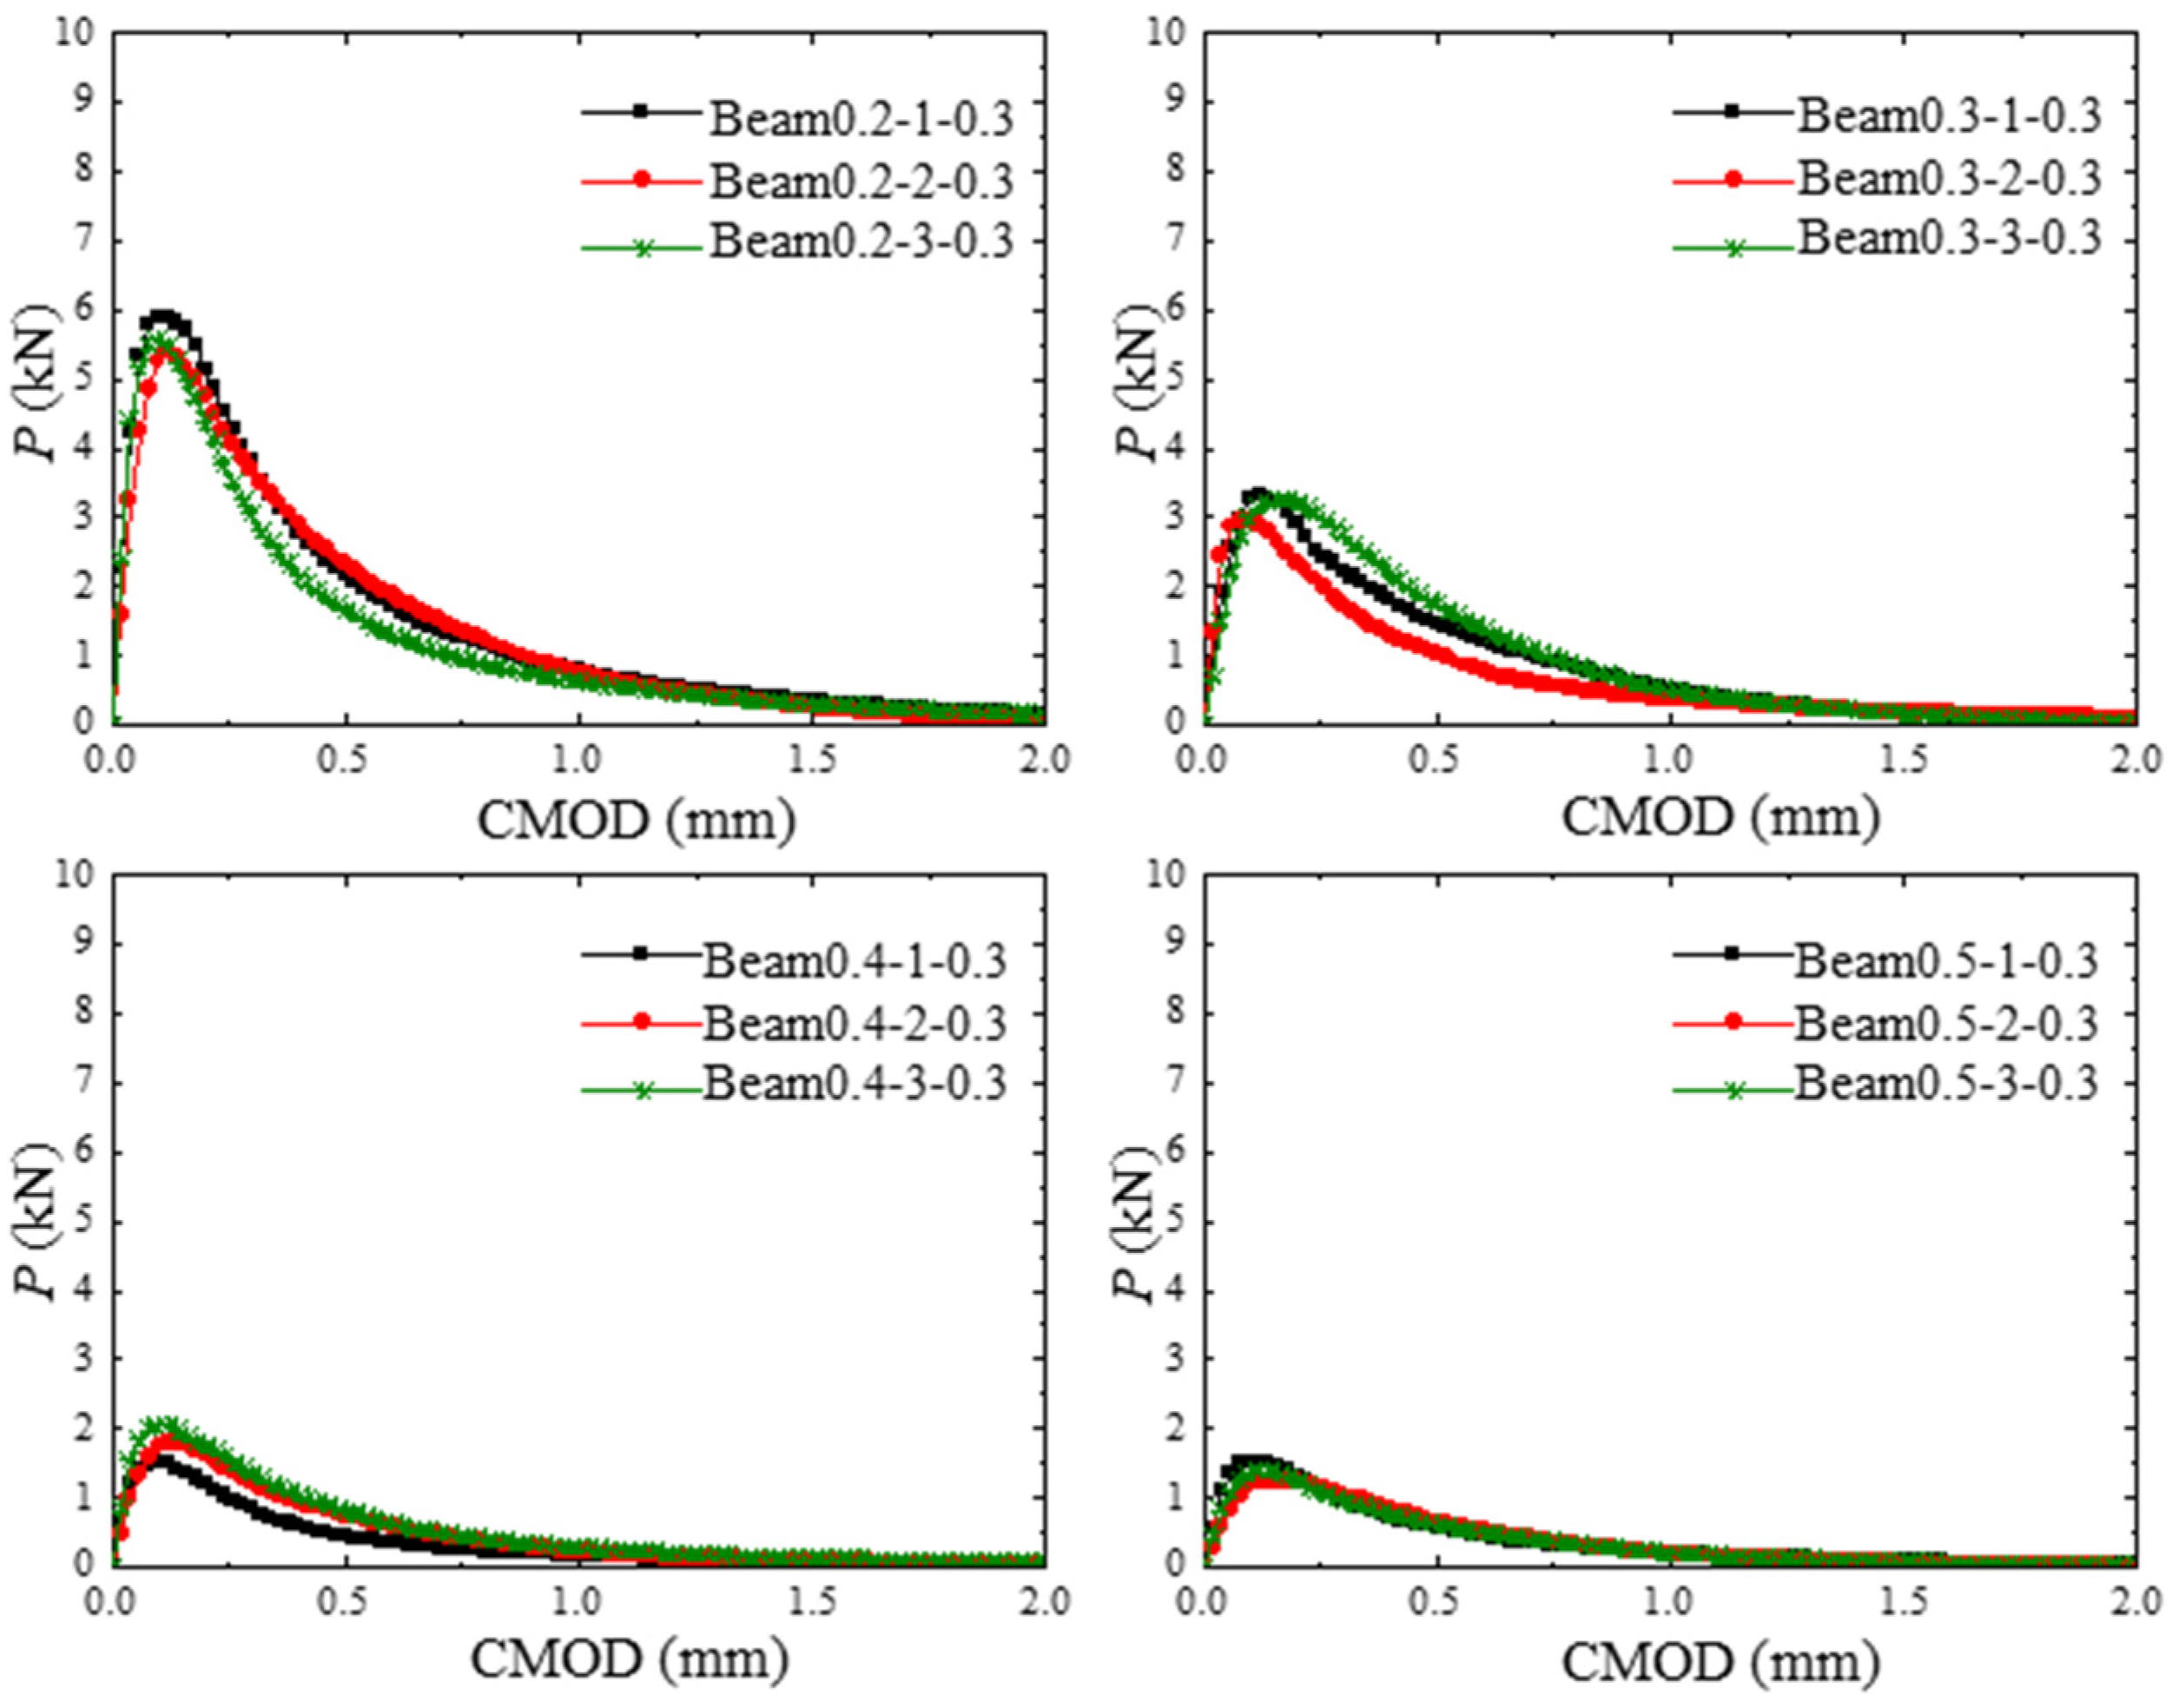
3.2. Experiment Results

The P-CMOD curves of concrete beams within different hydraulic pressures are shown in Figure 6. Linear elastic deformation is observed at the early loading stages, and the loading force decreases to maintain the same CMOD with the increase in hydraulic pressure. By increasing the hydraulic pressure applied in the crack, the peak value of the loading force decreases. The fracture parameter results of the test concrete beams in Table 3 show that when the internal hydraulic pressure is increased, the initial load and maximum load are decreased.
w s = C T O D c w 0 = 4.5 C T O D c σ s = f t / 3
To determine the softening curve parameters of the concrete under different hydraulic pressures, the crack tip opening displacement (CTOD) of the test beam was measured. When a = ac, the cohesive stress applied on the crack surface is shown in Figure 7, and the critical crack tip opening displacement (CTODc) is equal to ws based on reference [14]. Hence, the softening curve parameters calculated by Equation (11) can be translated to Equation (25). The parameters of the hydraulic pressure curve were obtained by fitting the internal hydraulic pressure data collected by the transducer installed at the end of the preset holes. The results of the fitting parameters of the hydraulic pressure curve and softening stress curve are listed in Table 4. As the applied hydraulic pressure increases from 0.0 MPa to 0.3 MPa, the peak load of test beams decreases by 60% and the cohesion fracture toughness decreases by 30%.
The P-CMOD curves of the concrete beams with different initial crack depth ratios under the hydraulic pressures of 0.0 and 0.3 MPa are shown in Figure 8 and Figure 9. The peak load of the test beam decreases with the increase in initial crack depth. When the hydraulic pressure applied in the crack increases from 0.0 MPa to 0.3 MPa, the cracking load and the maximum load decrease dramatically, as shown in Table 5, where K Ic is the cohesive fracture toughness of the concrete. Moreover, the reduction in maximum load induced by hydraulic pressure increases with the increase in the initial crack depth ratio. In addition, the influence of the initial crack depth ratio on the fracture parameters under the same hydraulic pressure is slight.

4. Results and Discussion

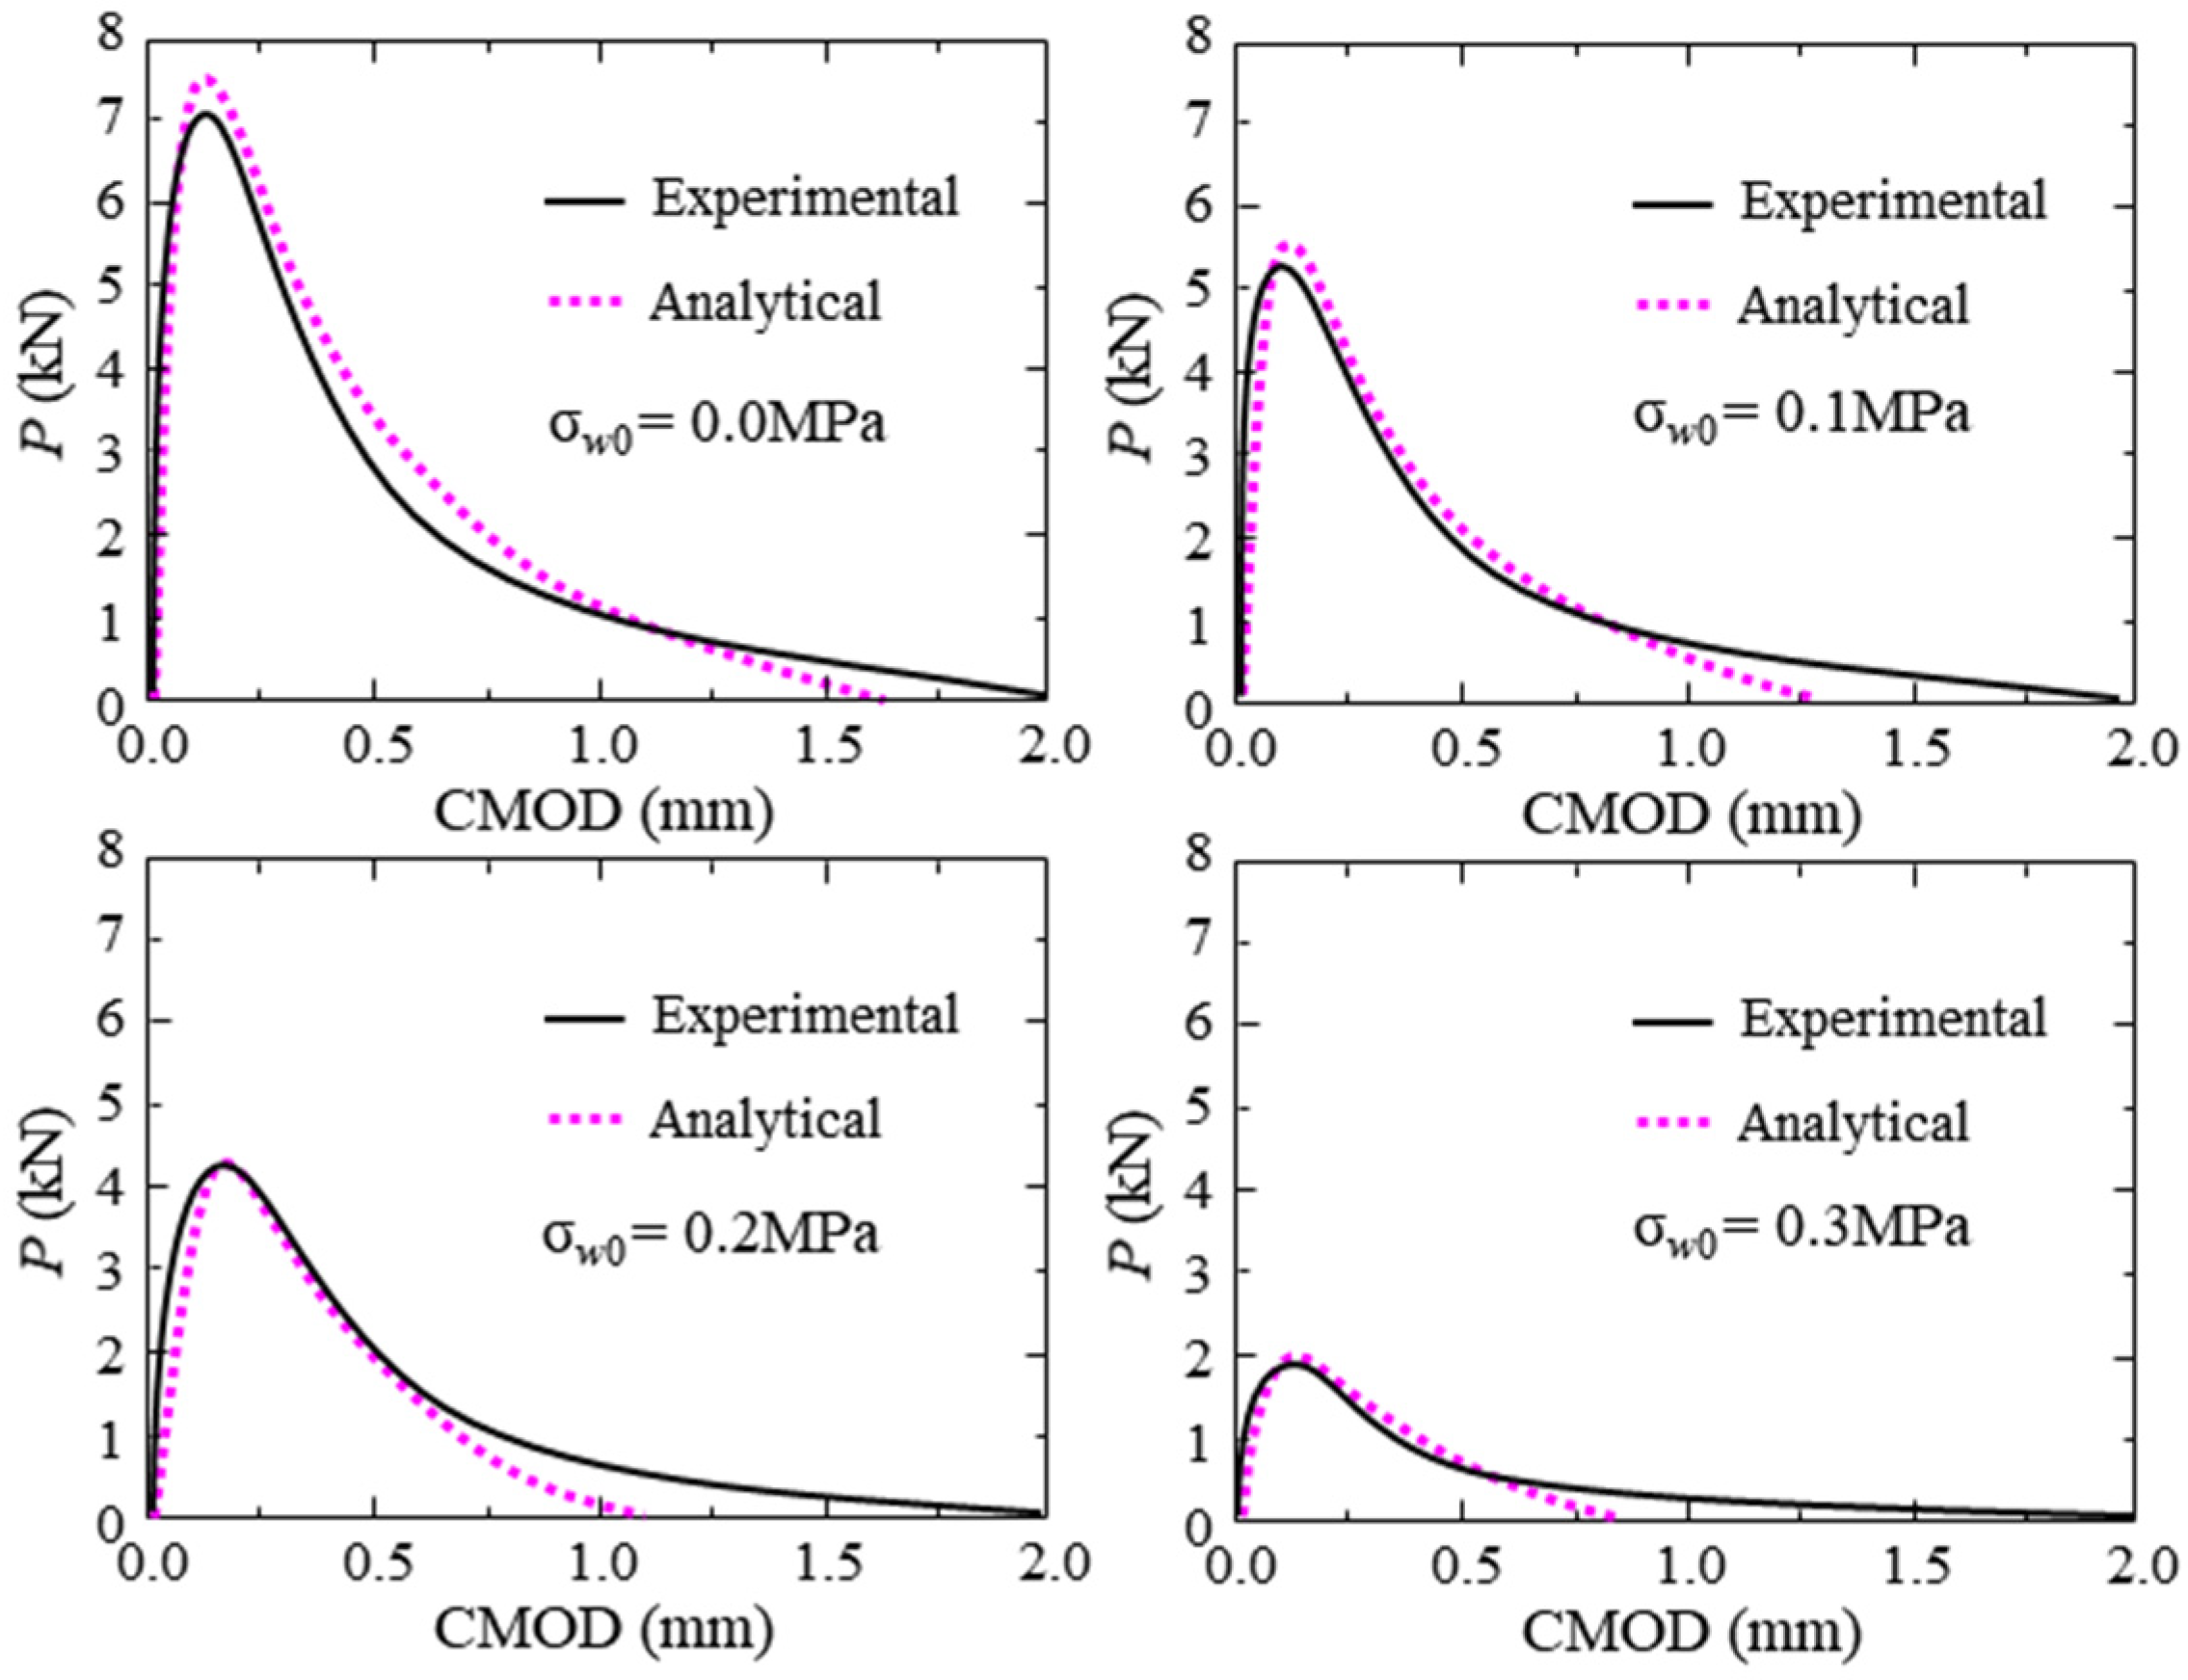
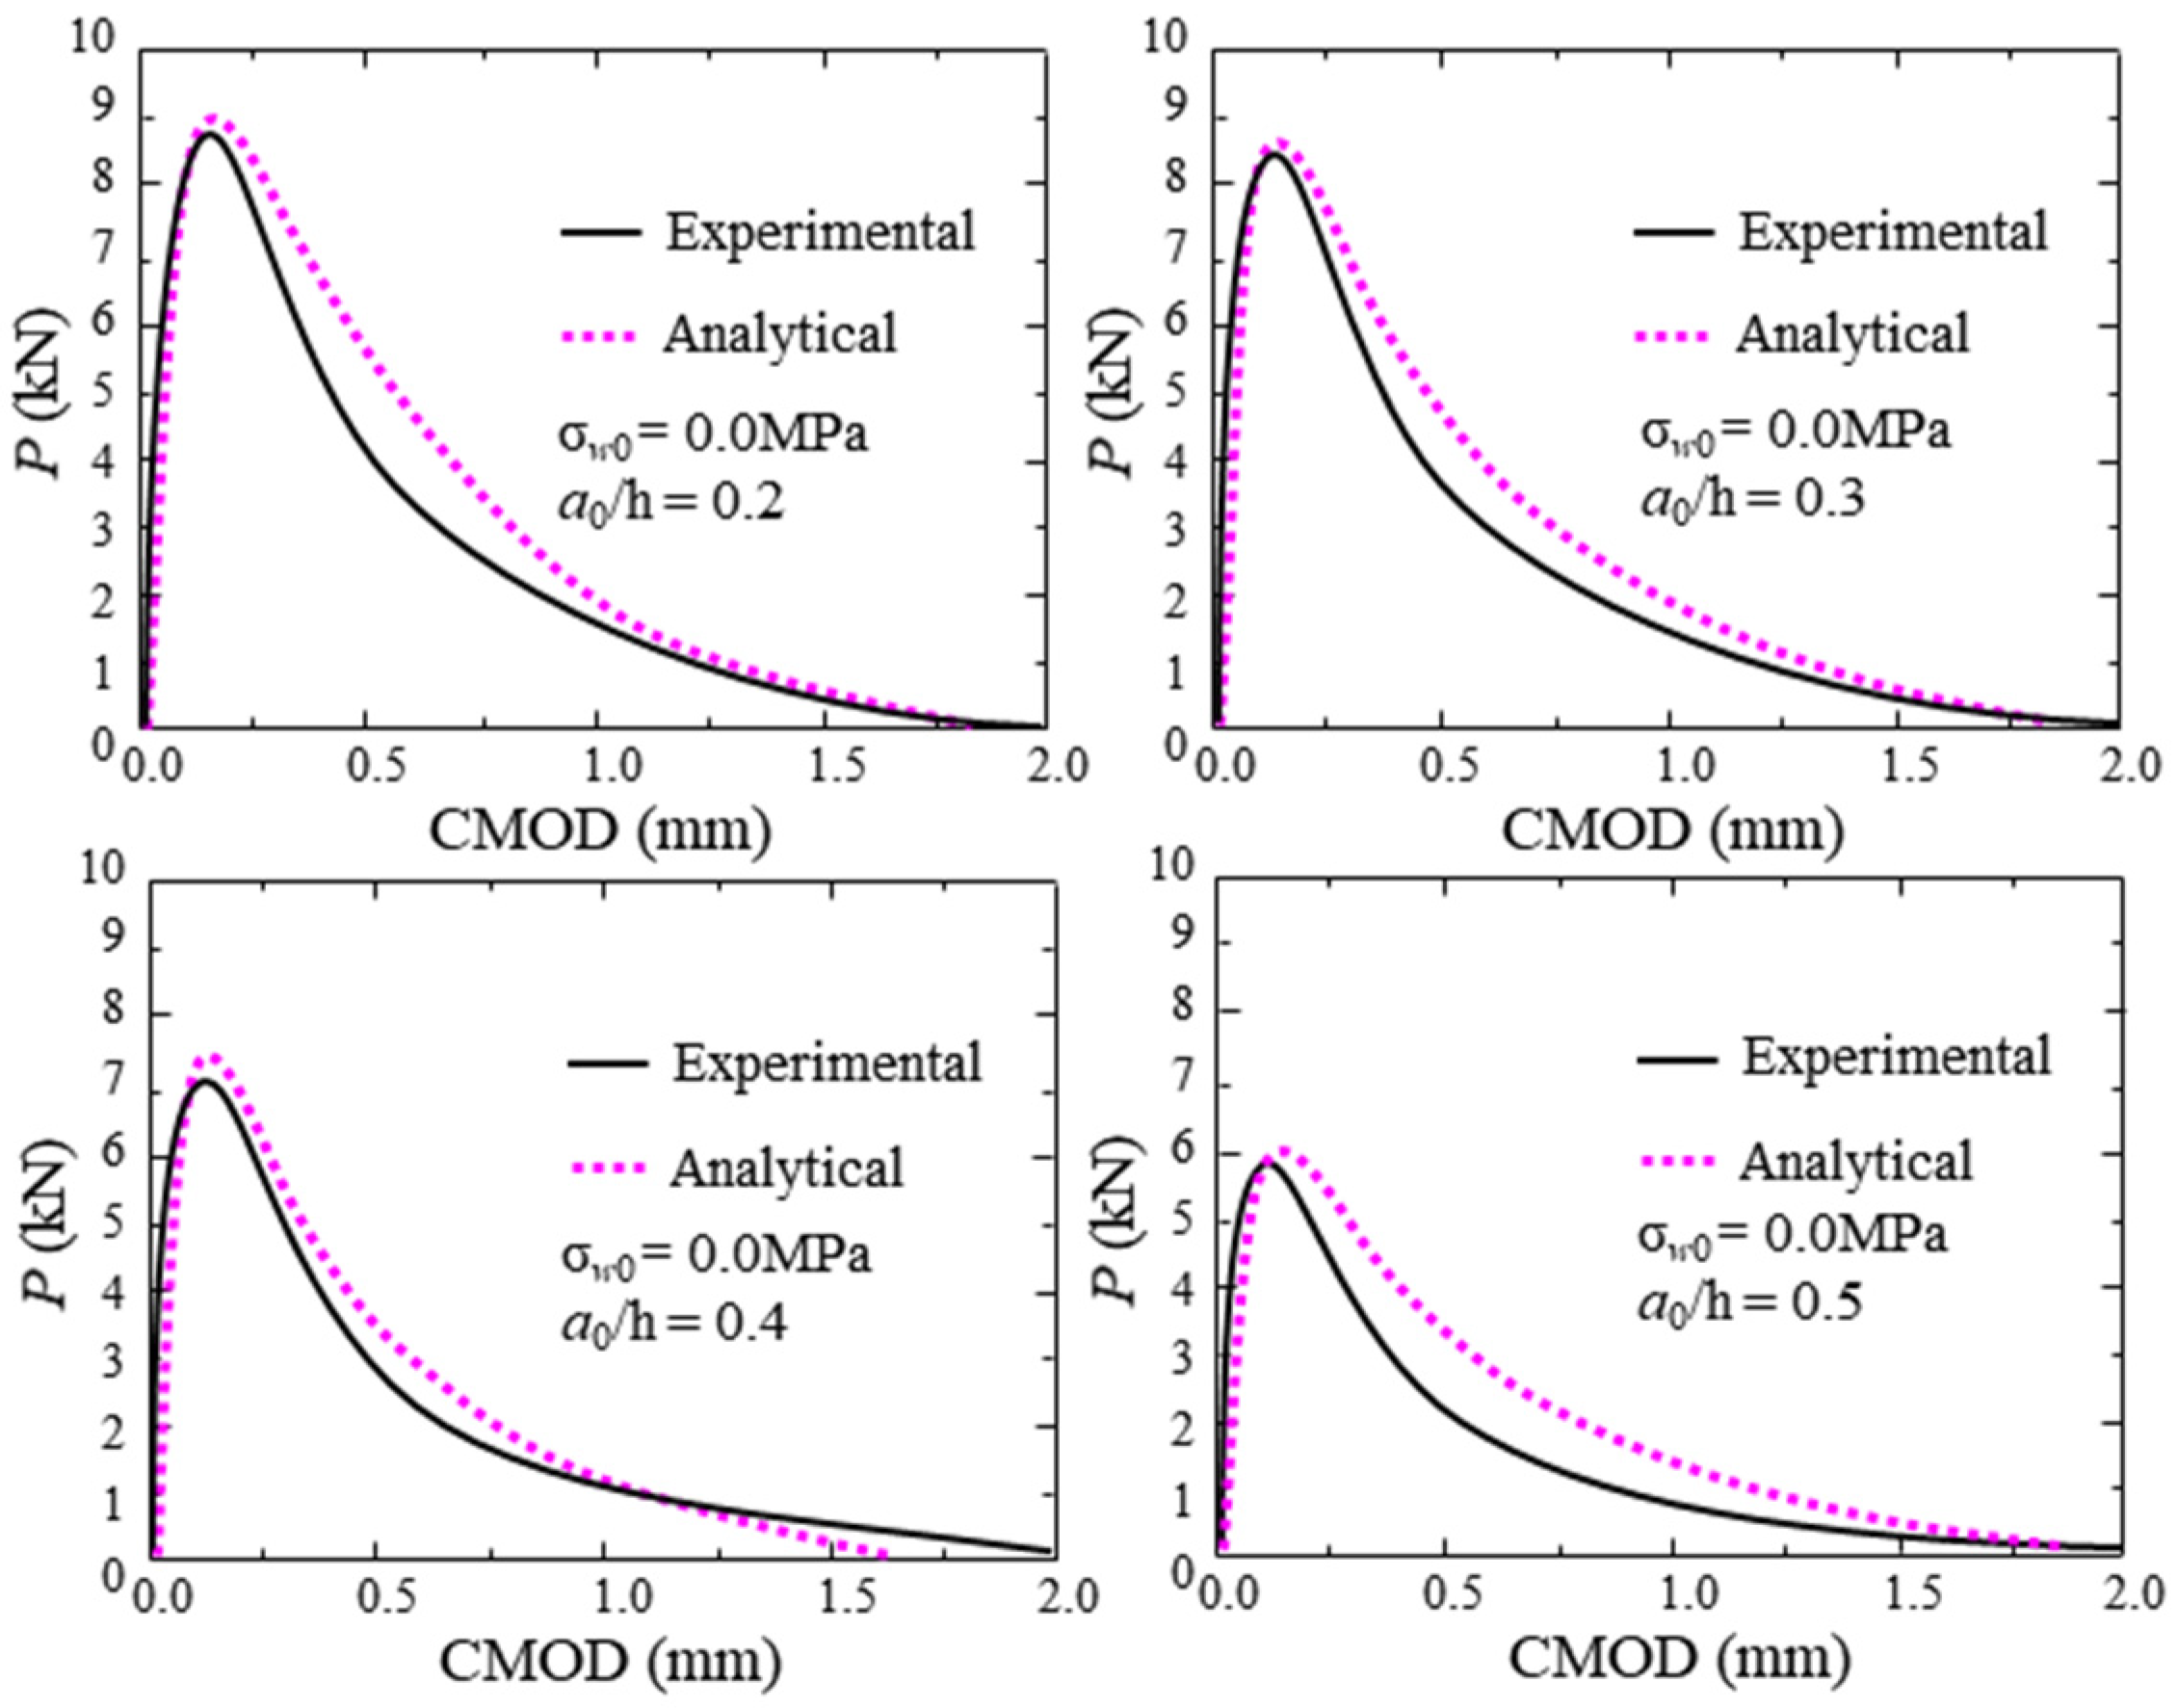
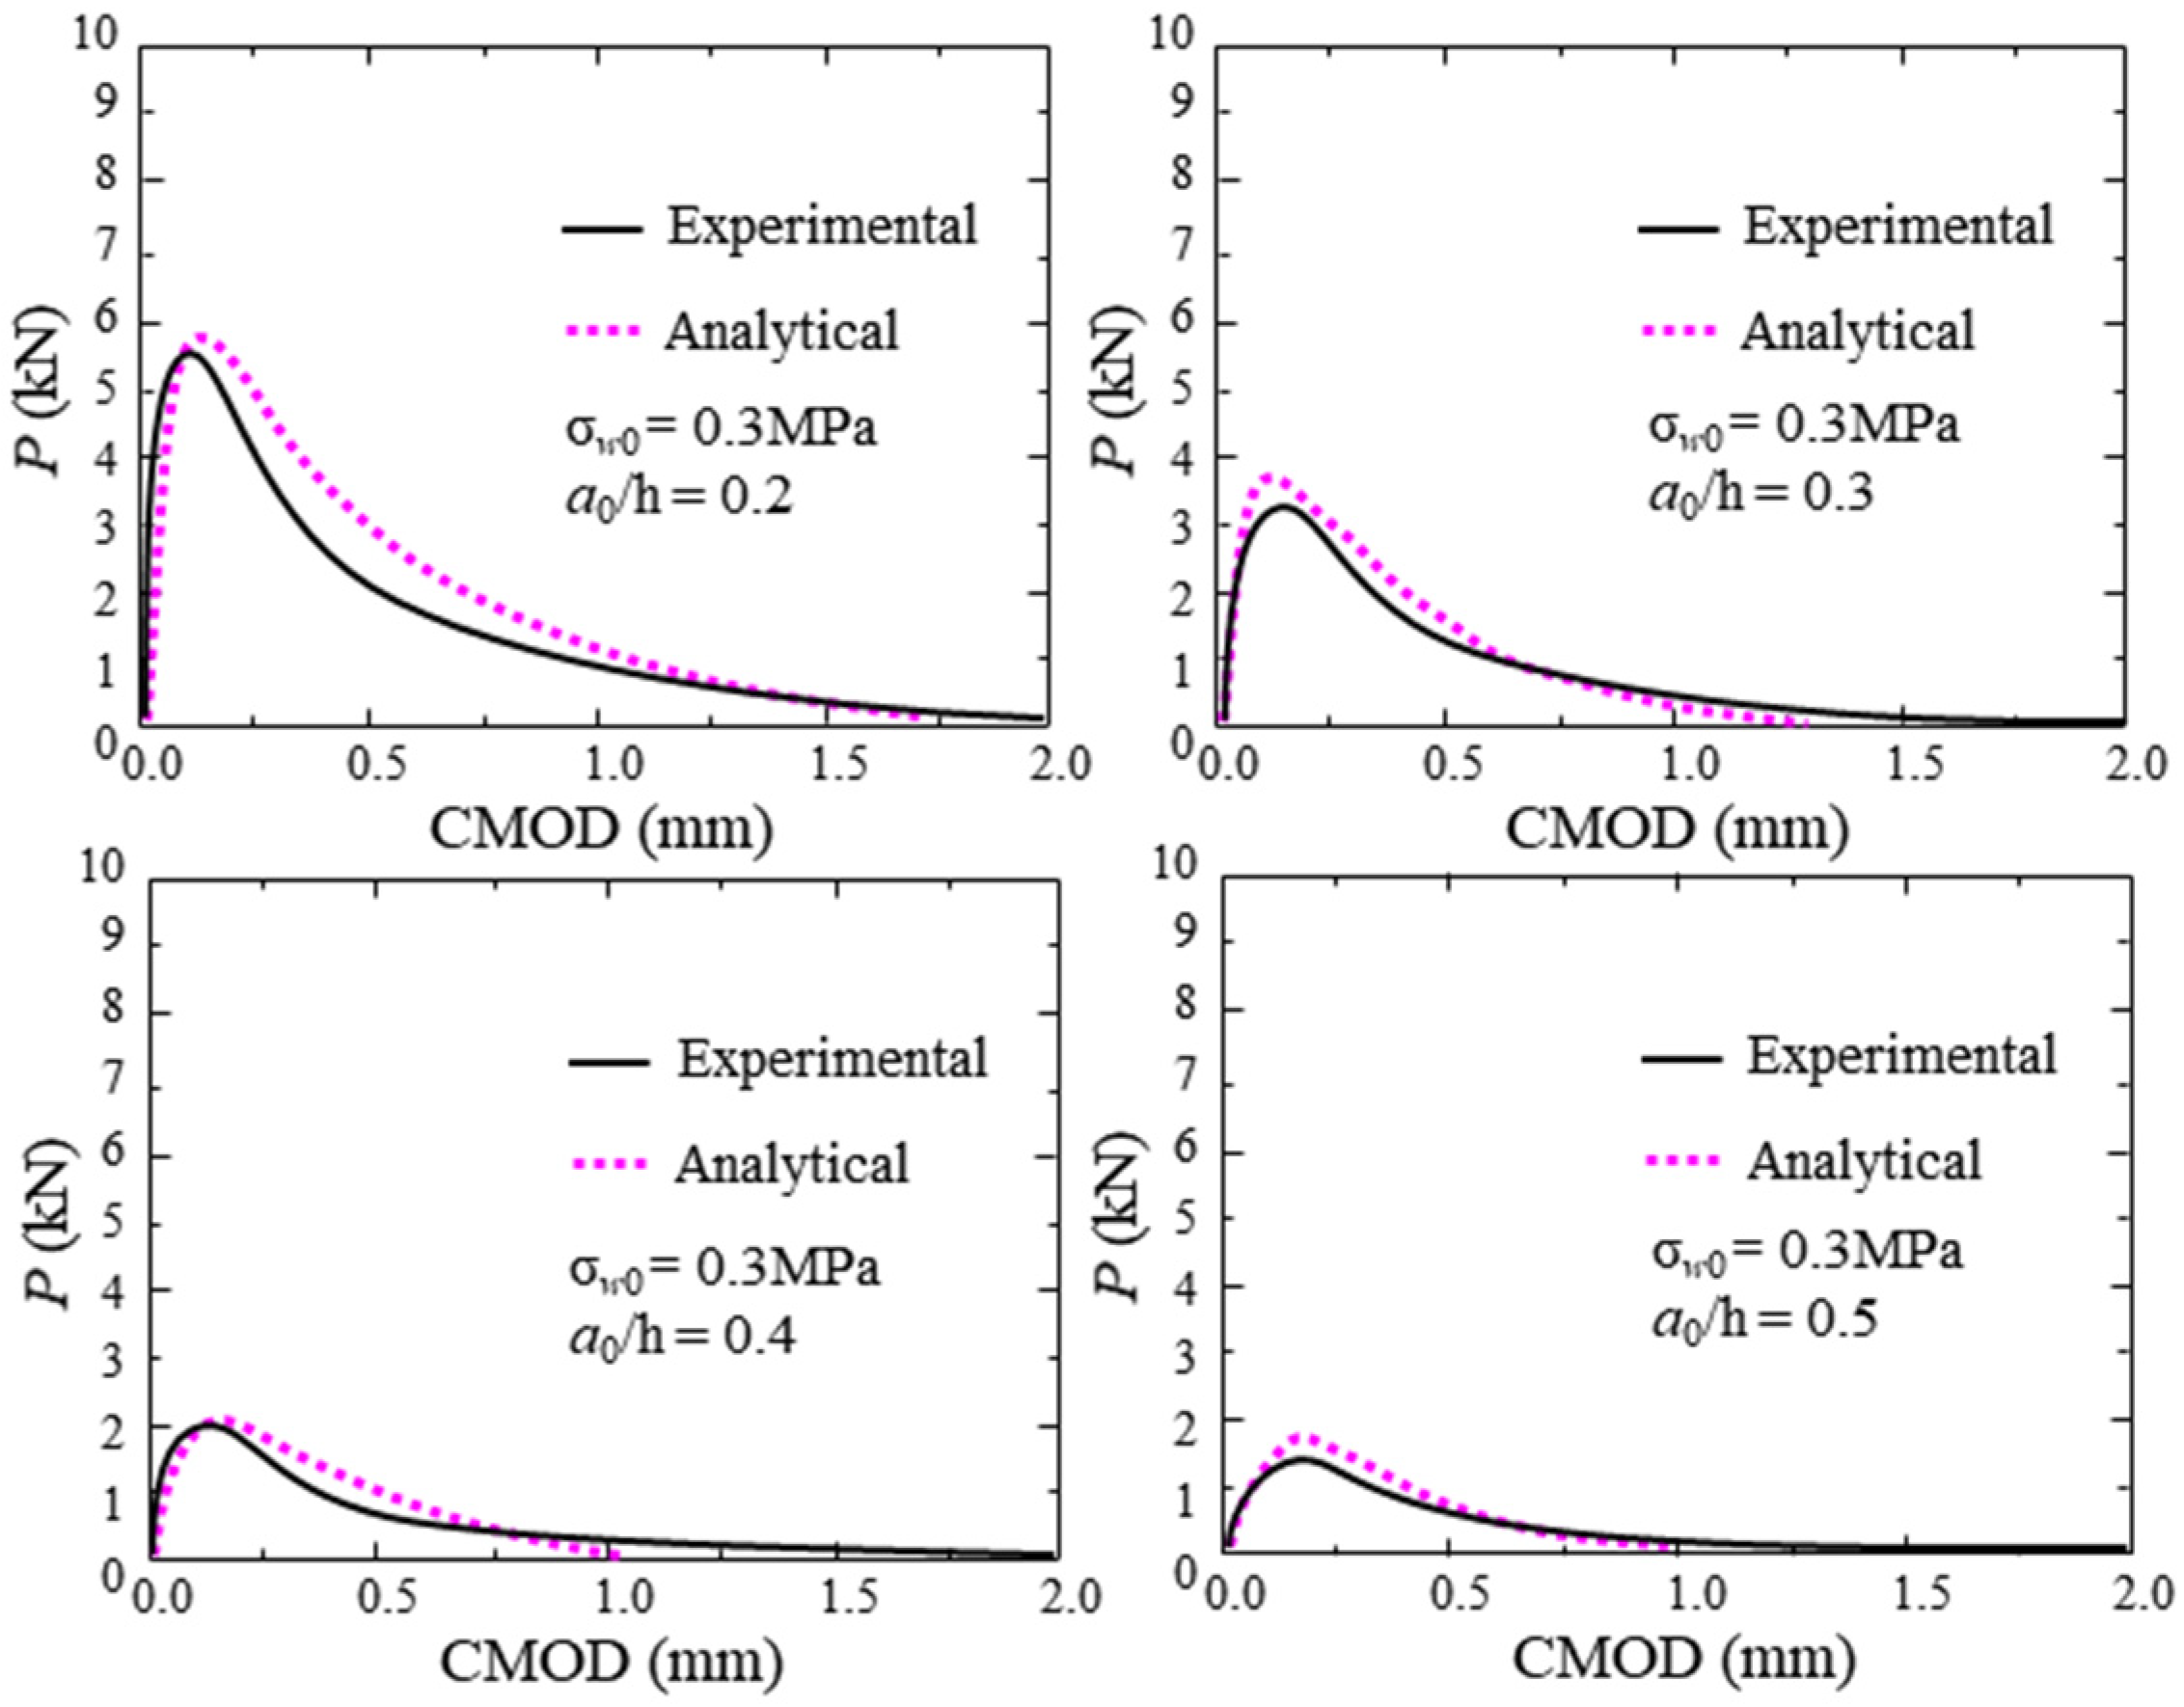
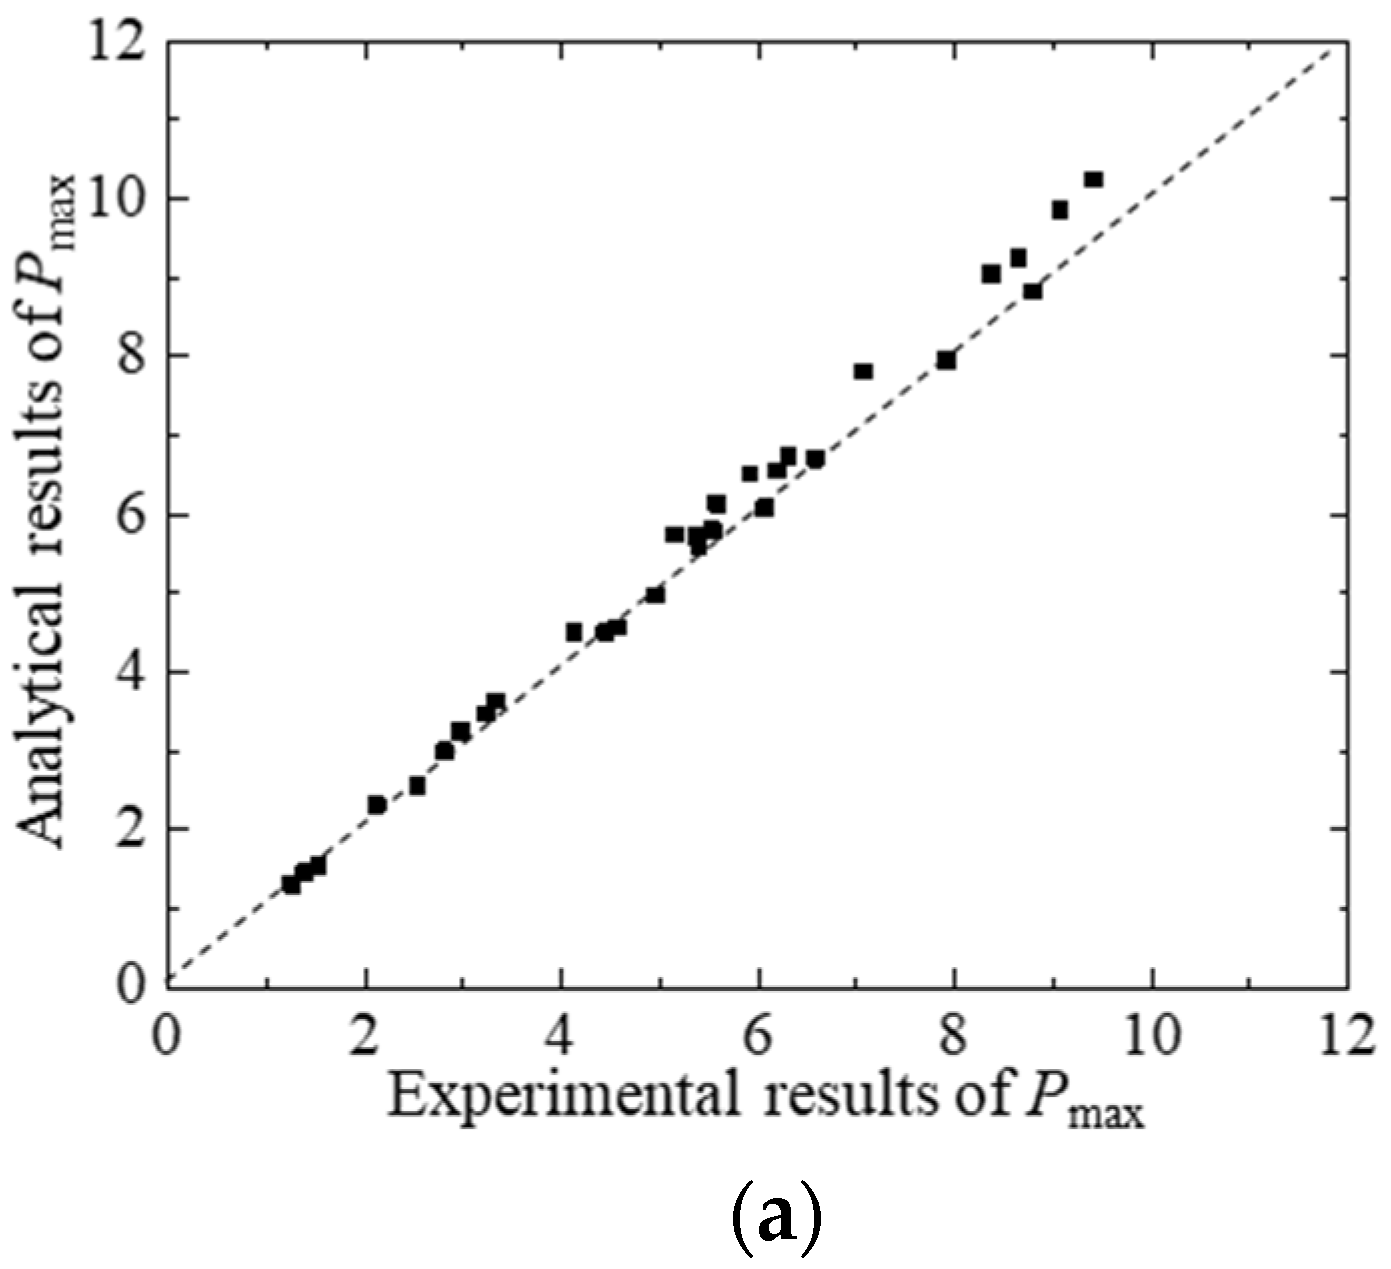
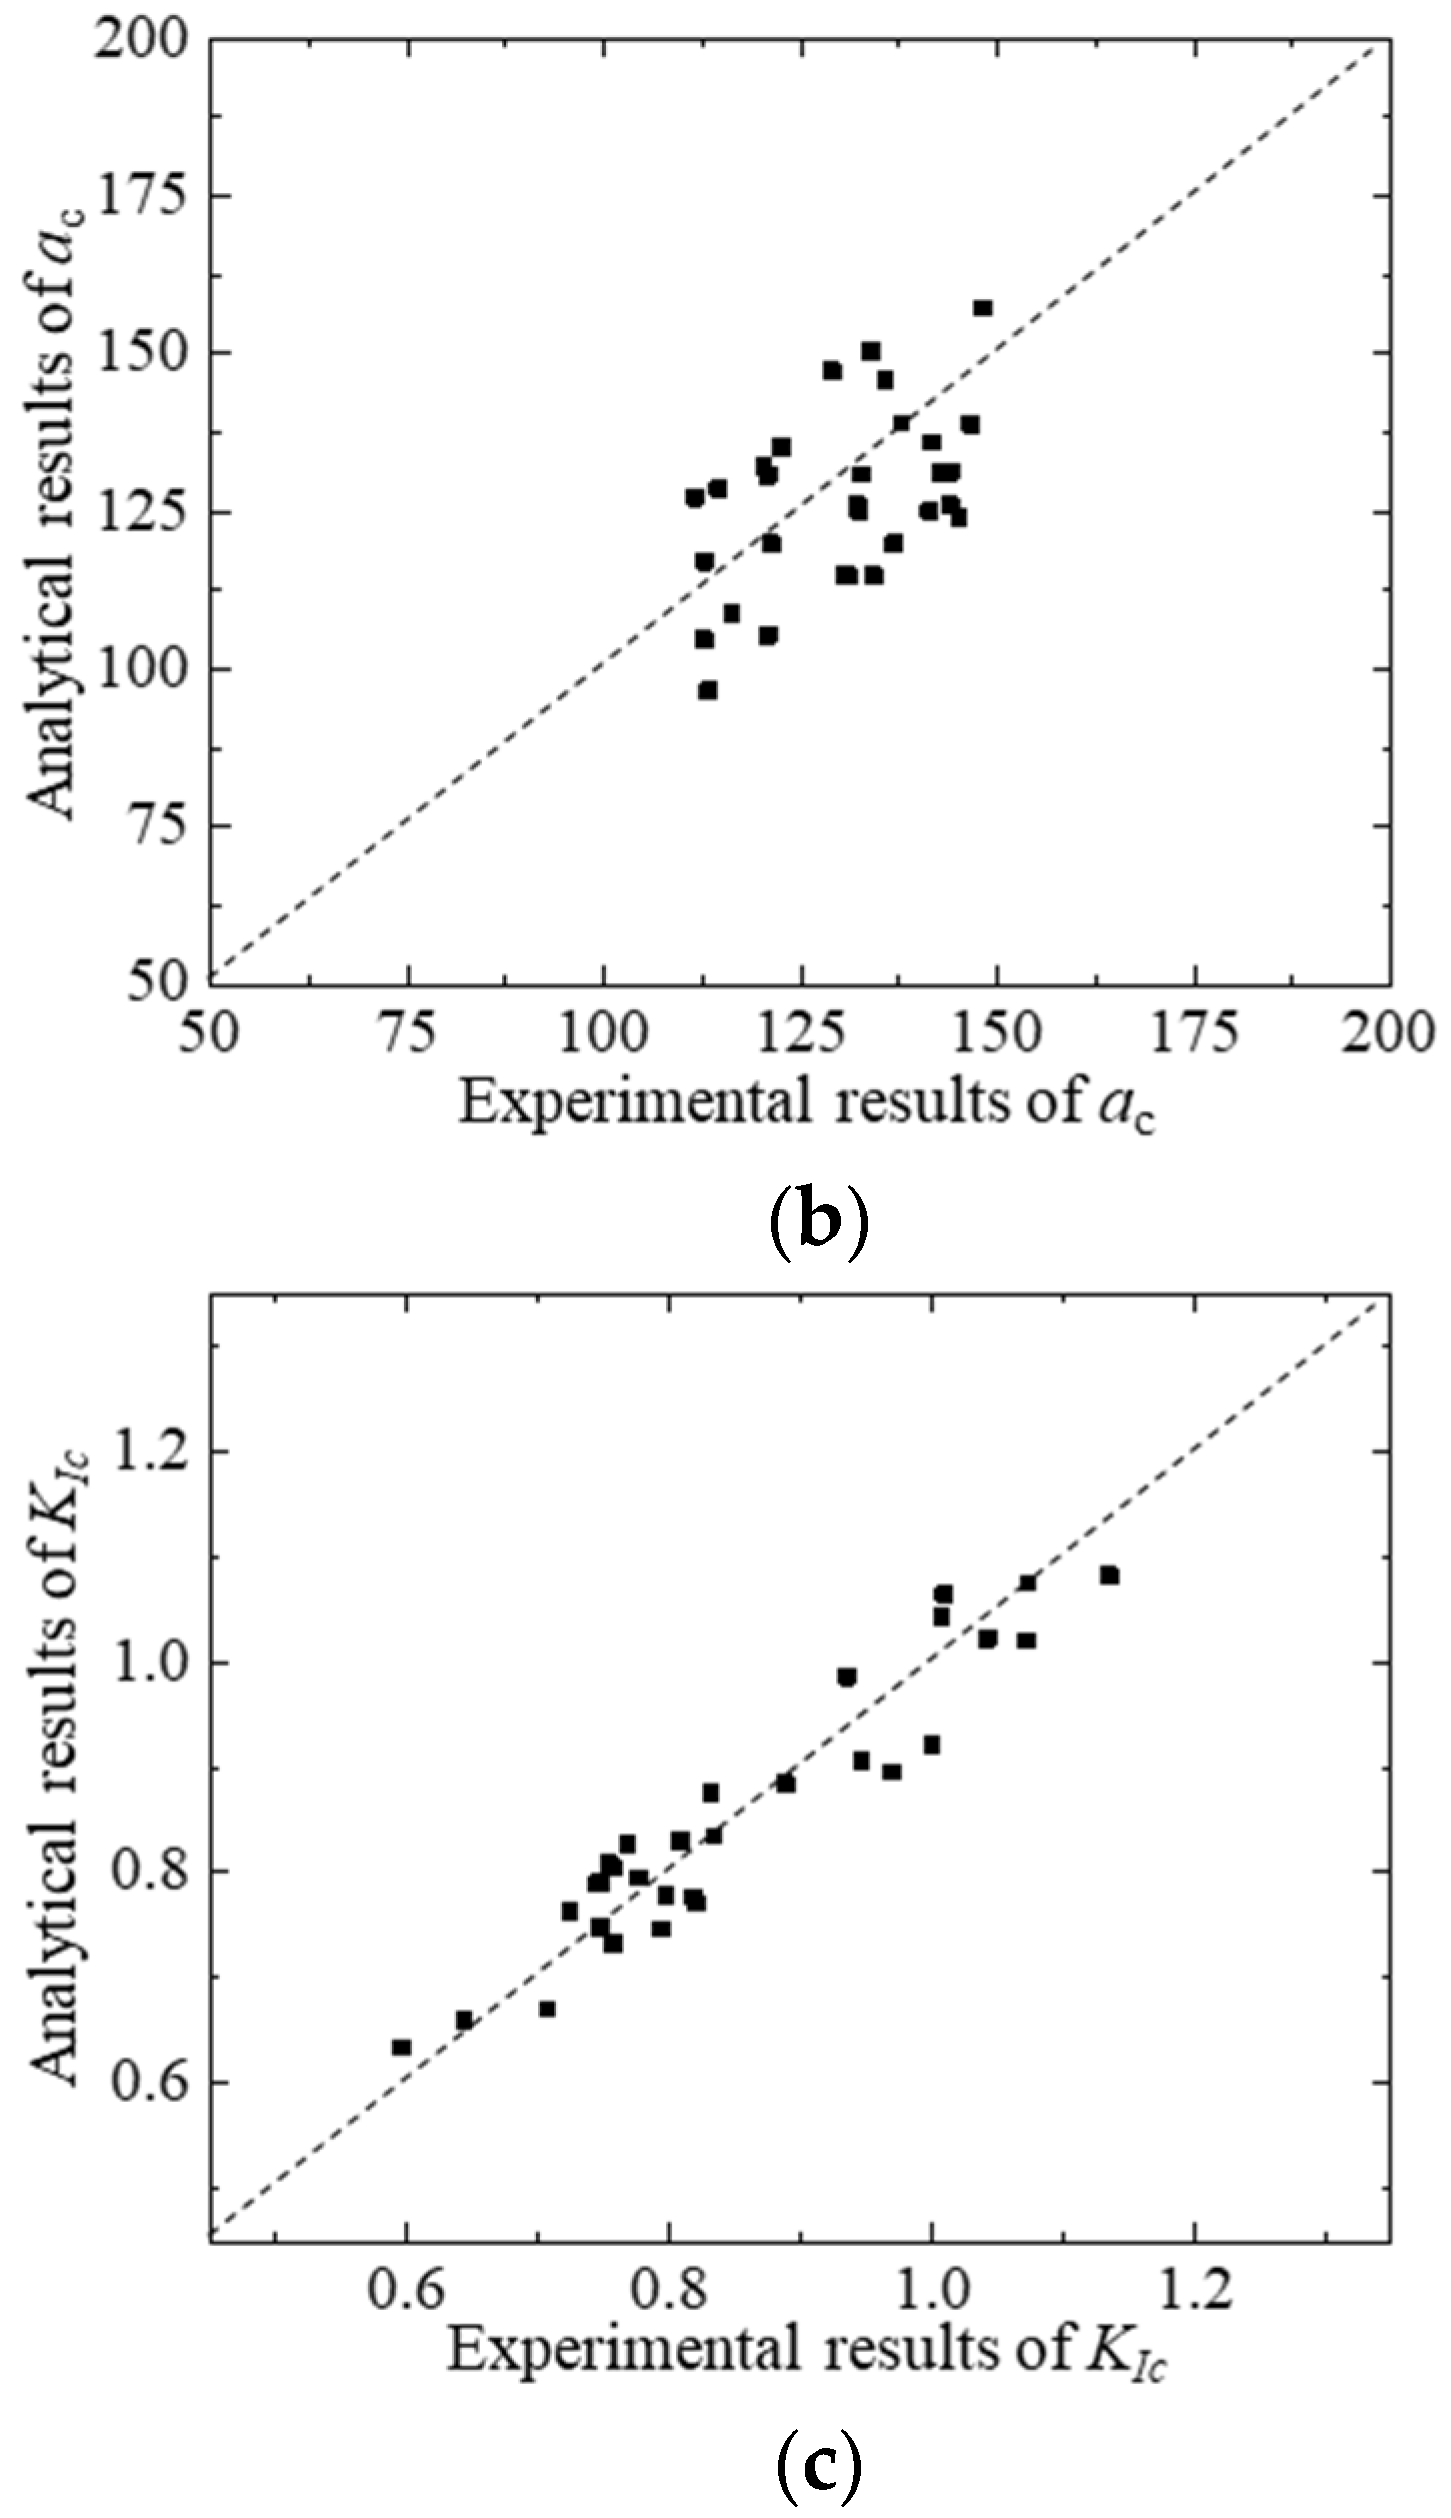
4.1. Verification of Proposed Theoretical Model

According to the material parameters and geometric parameters of the test concrete, the P-CMOD curve, KR-curve, and FPZ length can be calculated using the proposed analytical method. To consider the effect of the thickness of the clip gauge holder (H0 = 2.0 mm) and the self-weight on the experimental results, the calculated P and CMOD should be replaced by P − Pw and CMOD(a + H0)/a, respectively. The comparisons between the analytical and experimental P-CMOD curves of test beams within different hydraulic pressures, which are displayed in Figure 10, show that the analytical predictions agree with the experimental results. Moreover, the predicted results of P-CMOD curves of test beams with different initial crack depths are described in Figure 11 and Figure 12. The results show good agreement between the predicted results and the experimental results. Furthermore, the predicted results of Pmax, ac, and KIc are compared with the measured results in Figure 13 and listed in Table 6. The predicted values agree with the measured values. Thus, the proposed analytical method has good applicability under different hydraulic pressures and diverse initial crack depth conditions.

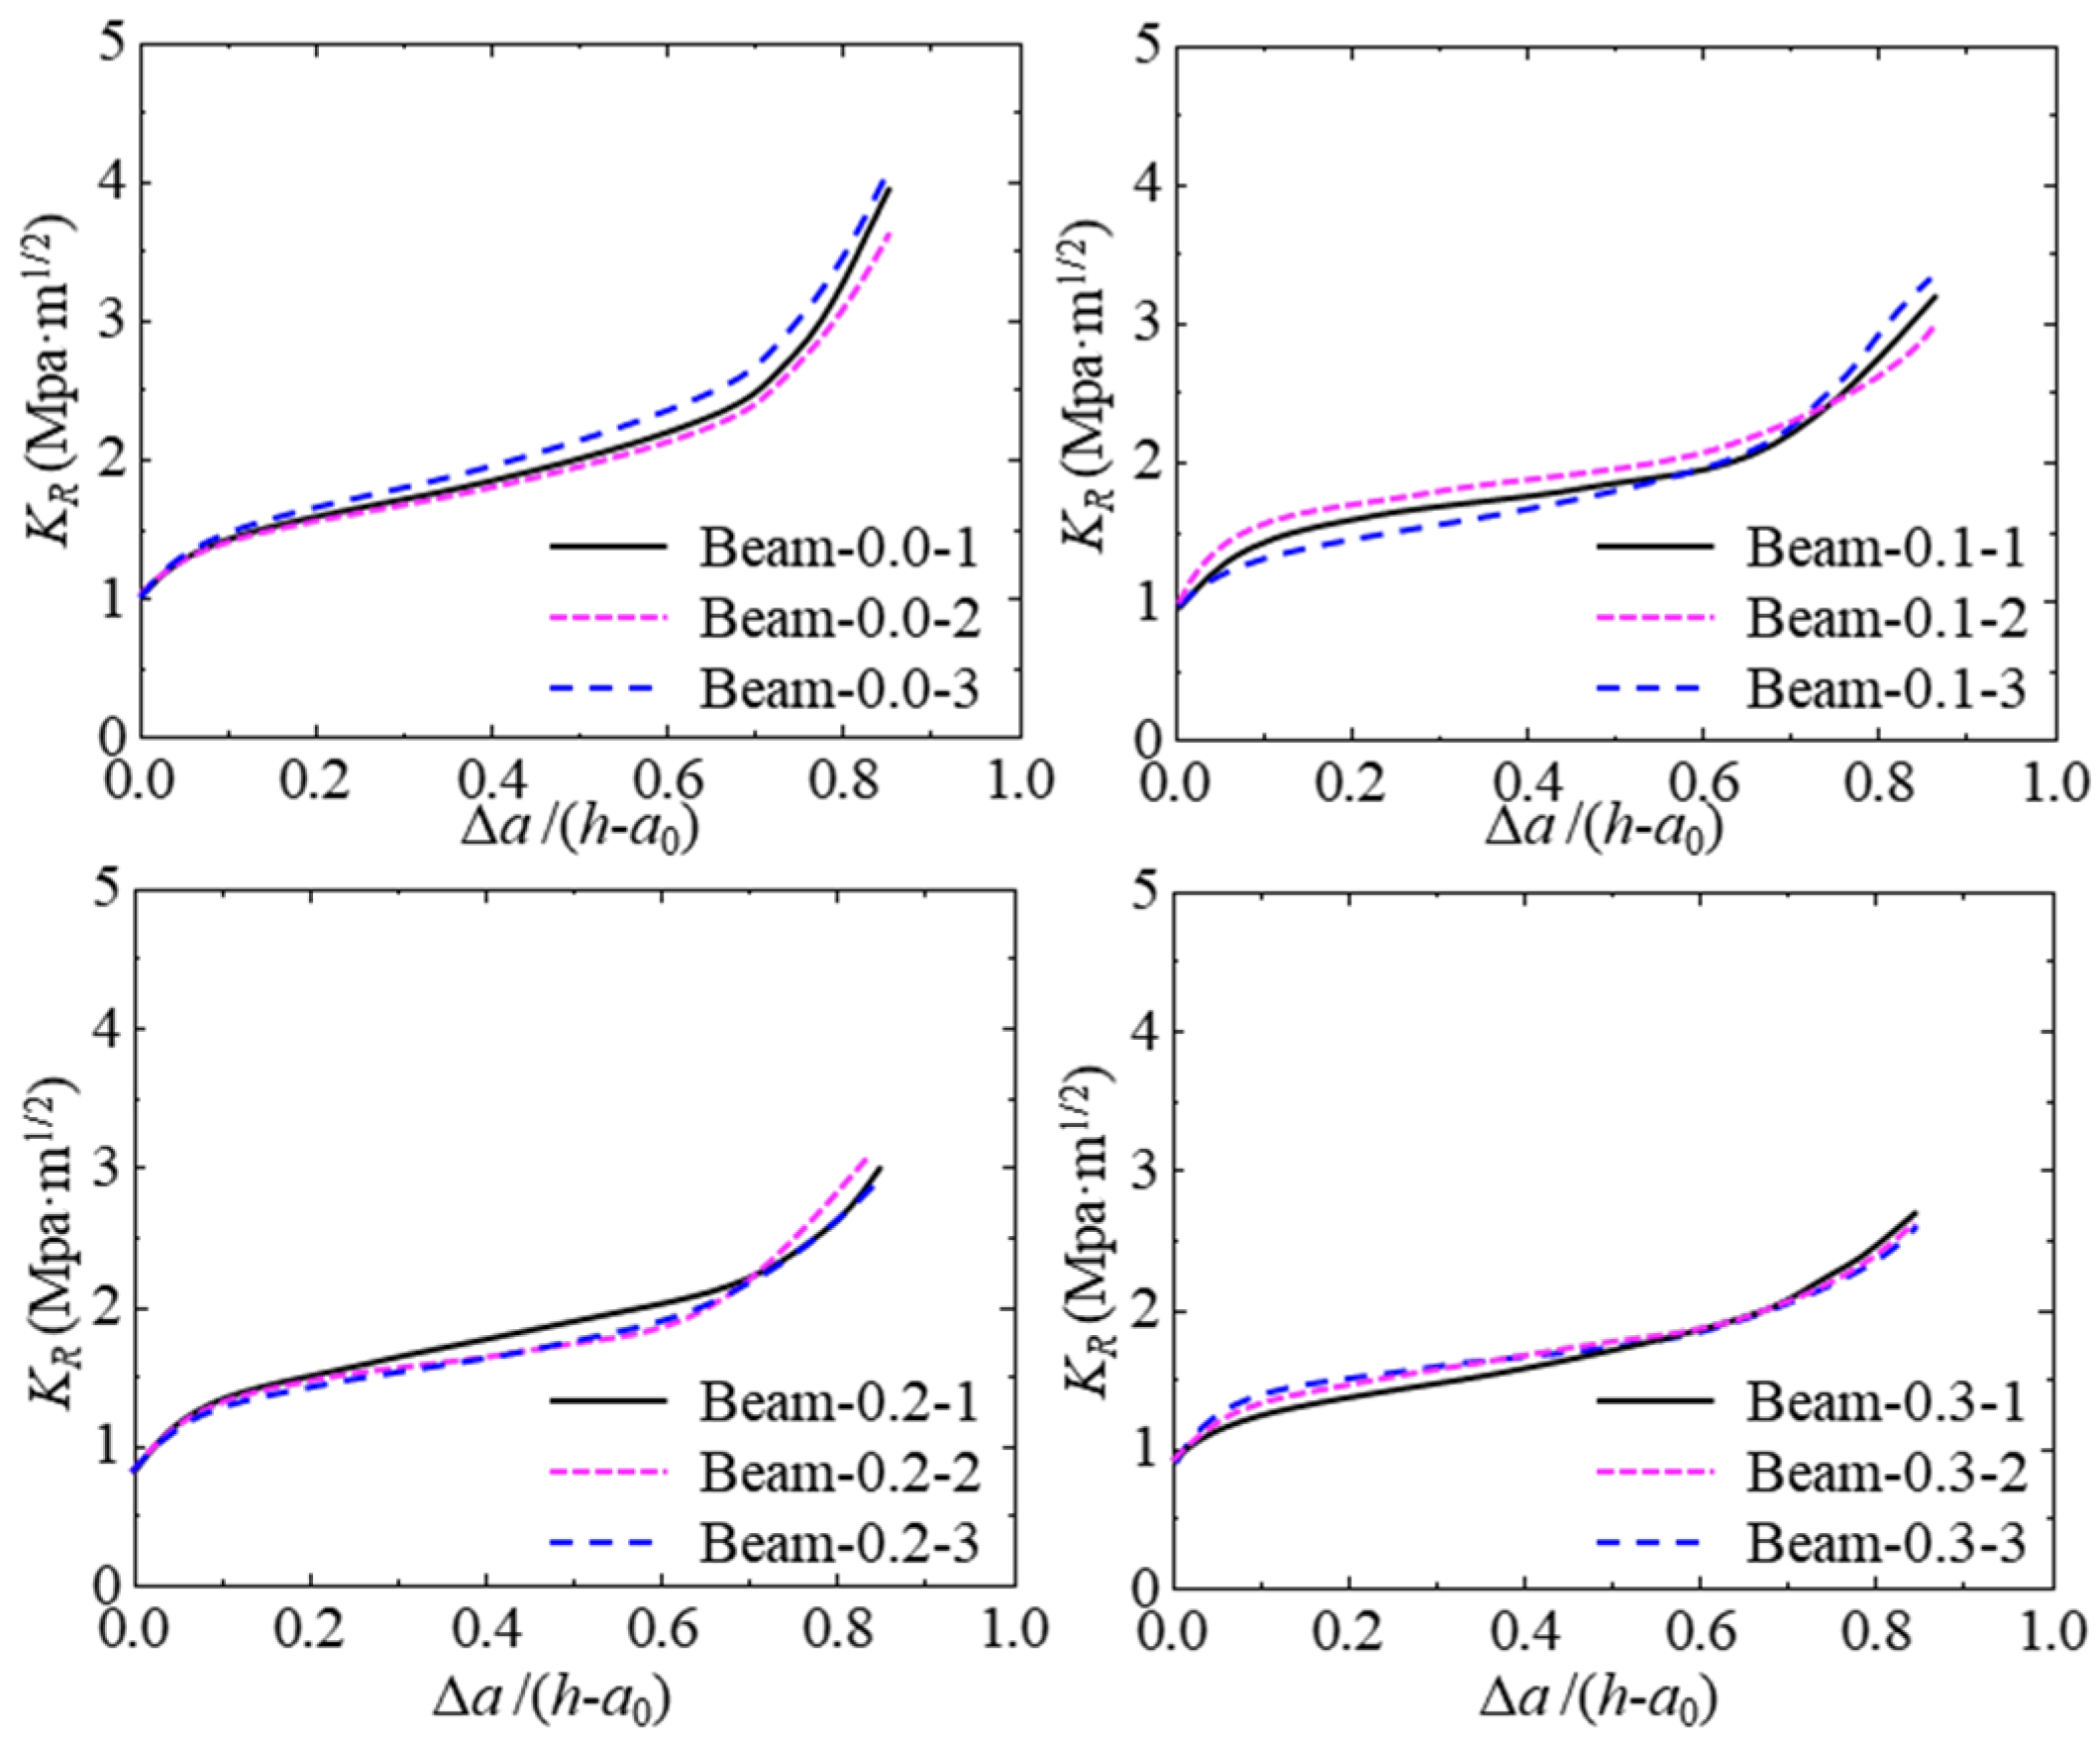
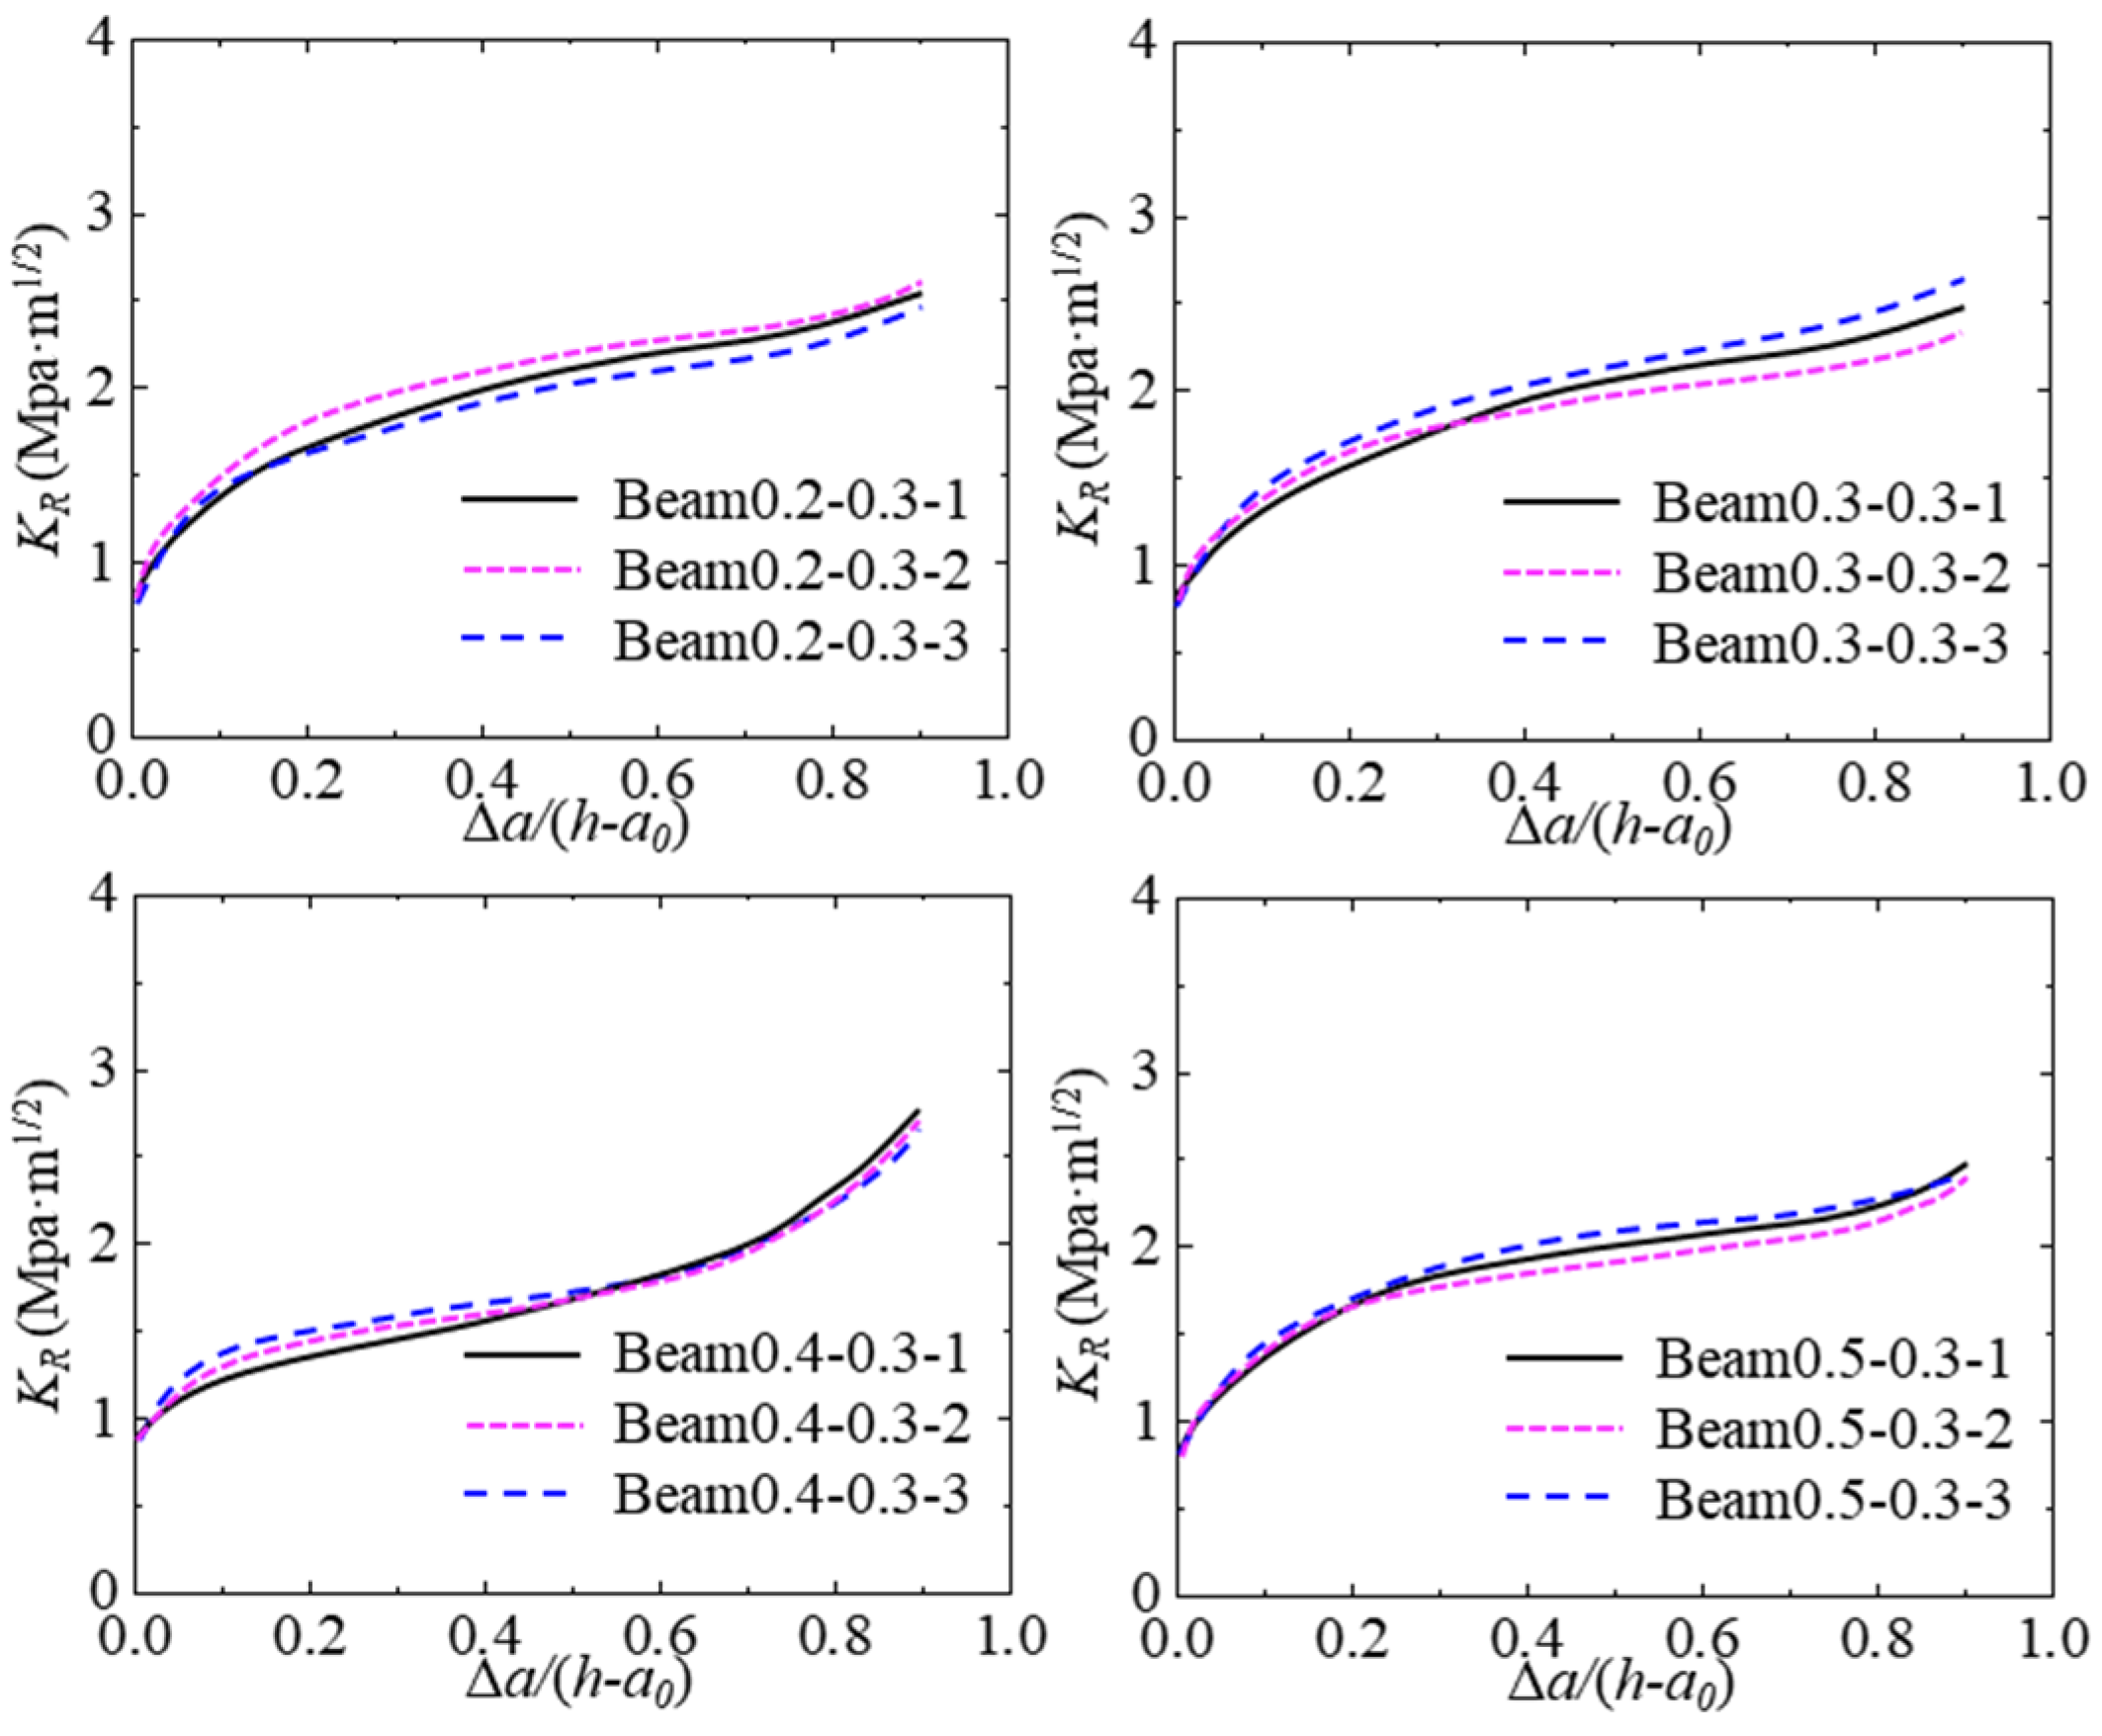
4.2. Effect of Hydraulic Pressure on KR Resistance Curve

Based on the proposed program, the theoretical P-CMOD curve of the test concrete beam can be calculated by inputting the geometric shape, elastic modulus, softening curve, and other parameters. After verification, the calculated KR resistance curve of the test concrete beam can be obtained. The calculated KR resistance curves of all tested beams are described in Figure 14. The shape difference among the KR resistance curves under the same hydraulic pressure is quite small, which means the KR resistance curve calculated by the proposed program can illustrate the inherent resistance of hydraulic crack propagation in concrete.
The KR resistance curve of concrete increases when the crack propagation length increases, and the trend is to accelerate first and then slow down. Moreover, the KR resistance is constant once it reaches the maximum value. Figure 15 shows the typical KR resistance curves under different hydraulic pressures. The KR resistance curves decrease with the increase in hydraulic pressure in the crack. Moreover, the starting points of all KR resistance curves are close to one another, which represents that the initiation fracture toughness of the concrete within different hydraulic pressures is similar. In addition, the gaps between the KR resistance curves under different hydraulic pressures are close. The degradation of KR resistance induced by hydraulic pressure has a linear relation to the increase in hydraulic pressure.

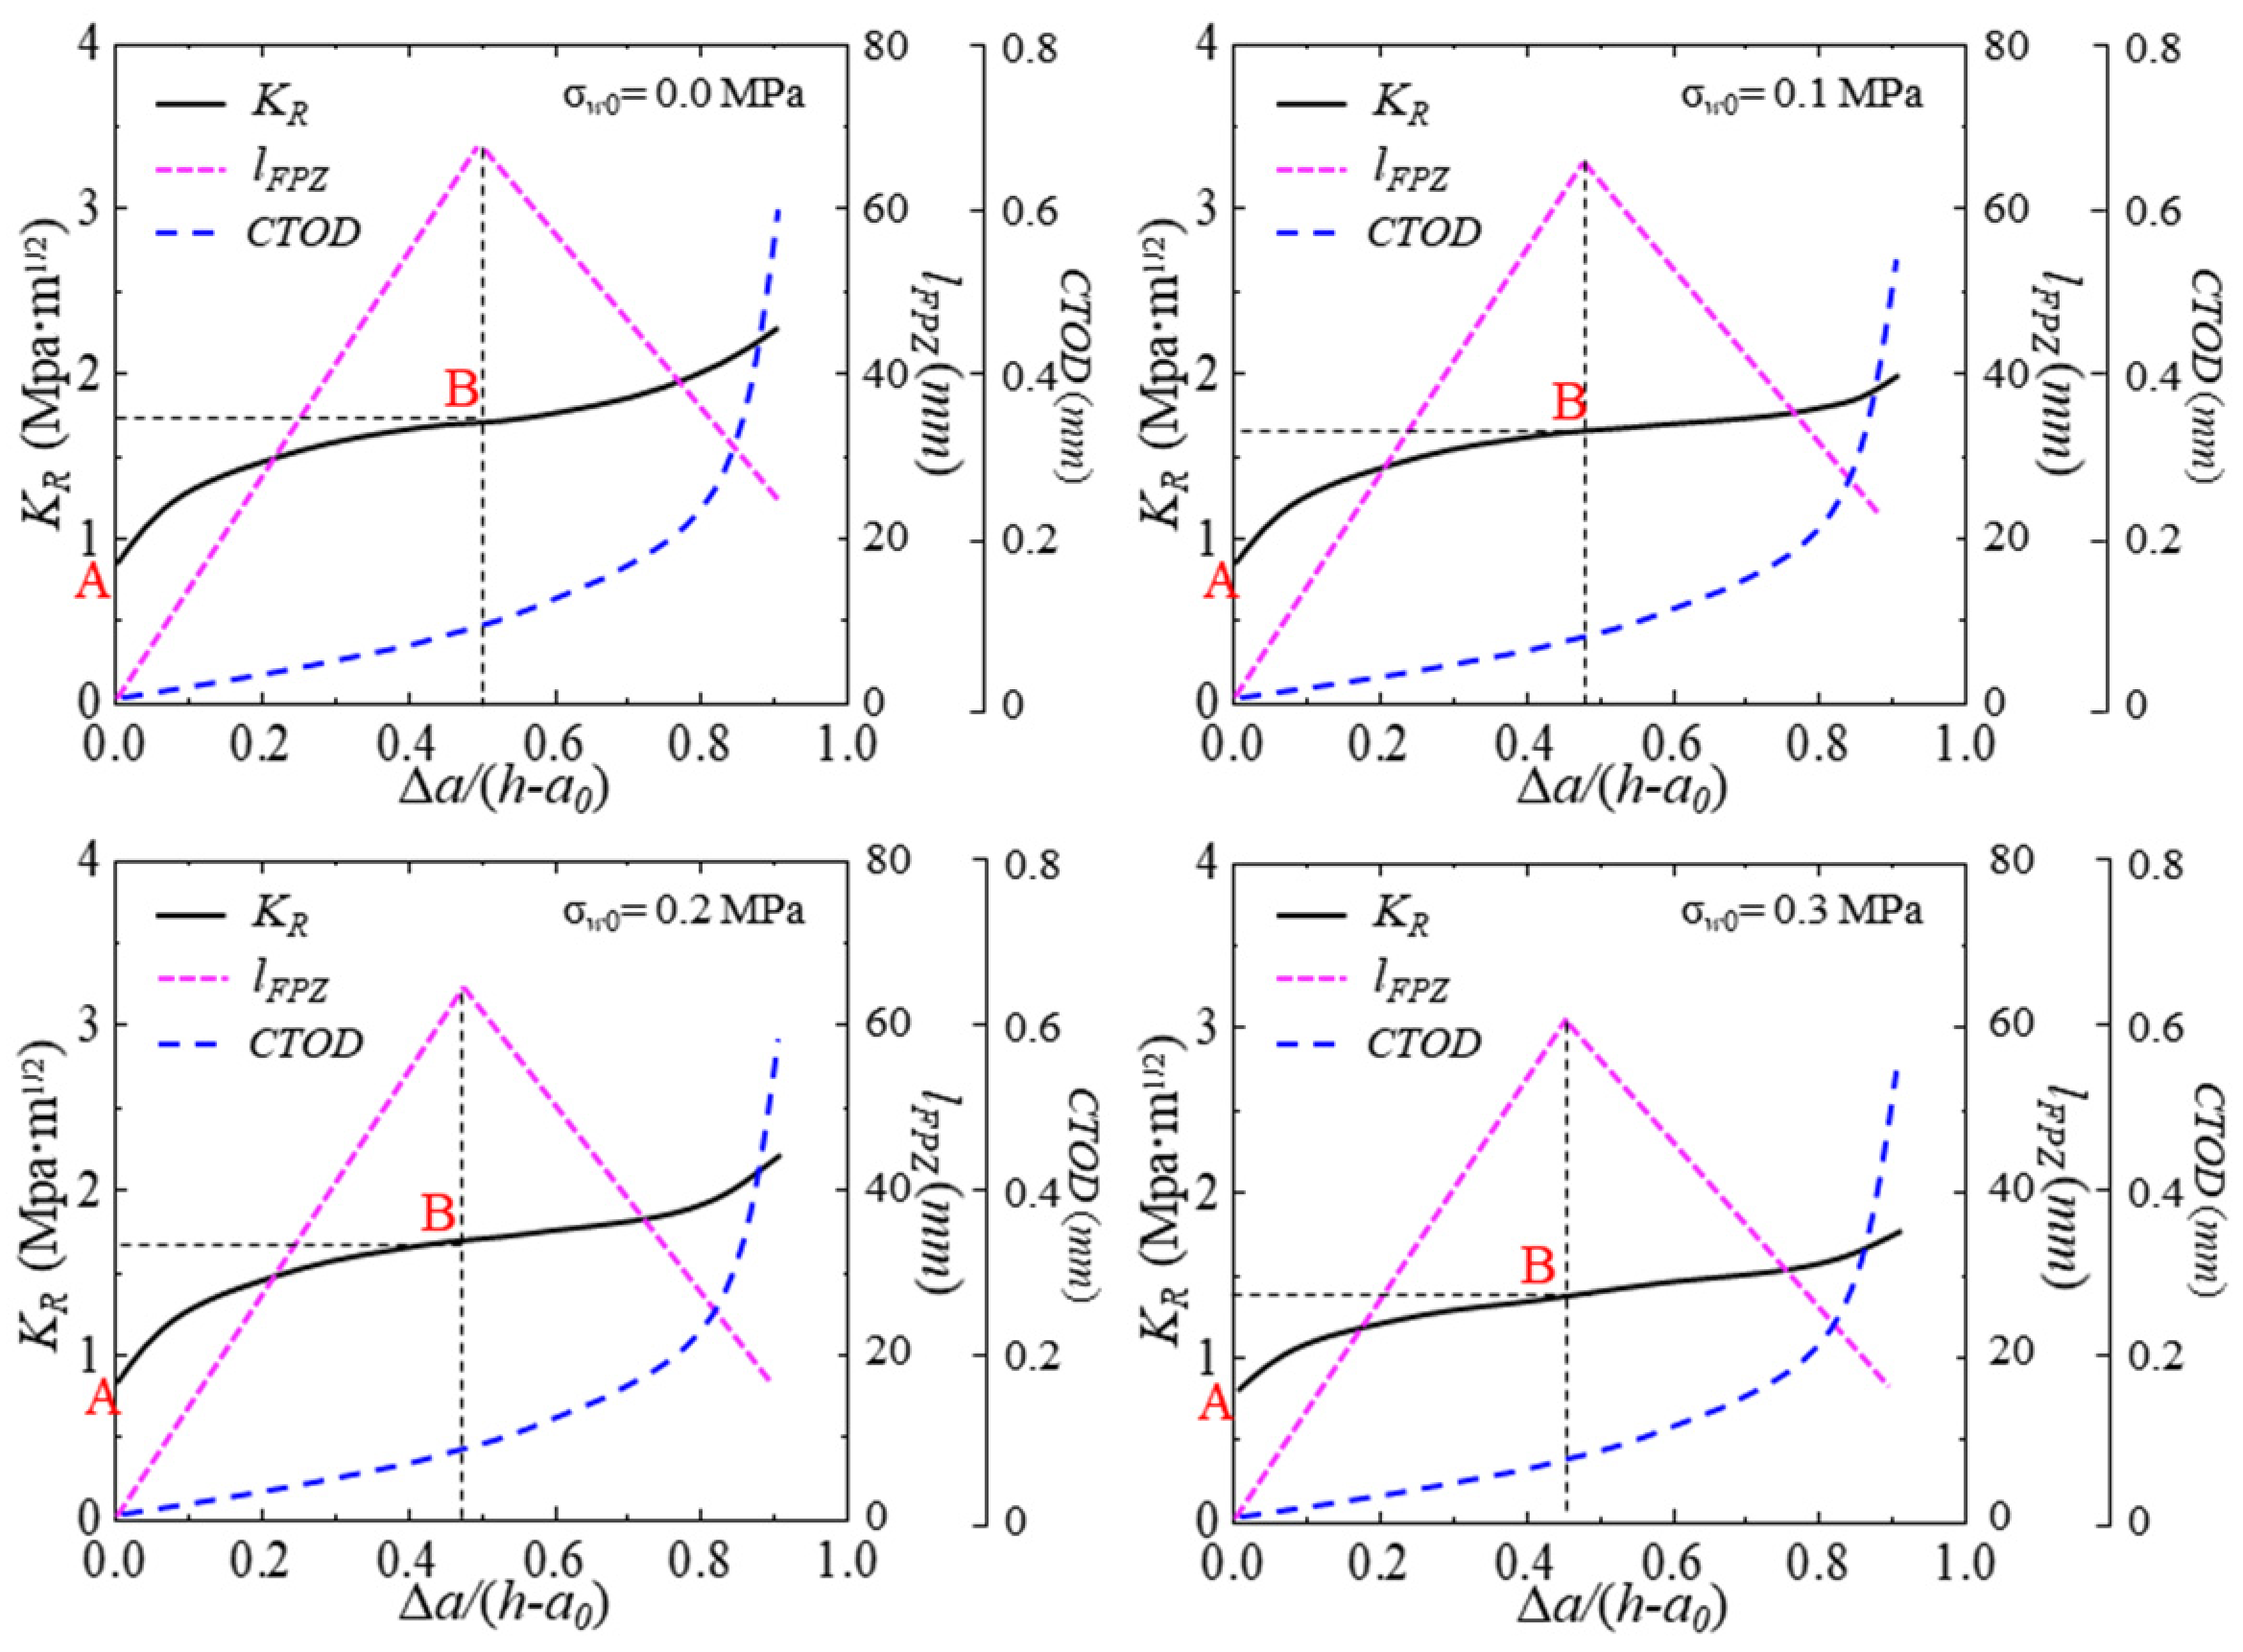
4.3. Effect of Fracture Process Zone Length on KR Resistance Curve

To analyze the effect of hydraulic pressure on the KR resistance curve more deeply, the FPZ length lFPZ during the hydraulic crack propagation in concrete is recorded and illustrated in Figure 16. The lFPZ is calculated as follows:
l F P Z = a a 0   ,   C T O D   <   w 0   l F P Z = a a w 0     ,   C T O D w 0
where a w 0 is the critical crack length when CTOD = w0.
lFPZ determines the cohesive fracture toughness K I c Δ a . The effective integration interval is K I c Δ a , so the influence of lFPZ on the KR curve needs to be studied. The calculation results of hydraulic crack propagation are analyzed below. Figure 16 describes the changes in the KR, lFPZ, and CTOD of test beams with crack propagation under different hydraulic pressures. The lFPZ first increases and then decreases with the crack propagation. The KR curve can be divided into two parts through points A and B, namely, the rising part and the approximate horizontal part. Point A represents that the crack just begins to expand, and the crack propagation resistance is equal to K I c i n i . Between points A and B represent stable and unstable crack propagation, and the lFPZ increases gradually. The crack propagation resistance increases gradually with the crack propagation until it reaches the maximum value, that is, point B. At this time, the lFPZ reaches the maximum, that is, a complete FPZ is formed. Subsequently, the value of CTOD exceeds the critical crack opening displacement w0, and CTOD clearly increases with the crack propagation, resulting in the formation of a new stress-free crack near the tip of the initial crack, and the lFPZ decreases rapidly with the crack propagation. The decrease in lFPZ leads to cohesive fracture toughness K I c Δ a . The effective integral interval of K I c Δ a becomes smaller, resulting in no evident increase in crack propagation resistance. It shows that each specimen has a common feature, that is, when the peak load is reached, the stress intensity factor K and crack propagation resistance KR are equal to the instability fracture toughness, whose corresponding abscissa is equal to a c a 0 / h a 0 . In addition, when the value of Δa/(h − a0) is between point A and point B, the crack expands stably. At this time, the driving force of crack development is less than the crack propagation resistance. When the value of Δa/(h − a0) is greater than point B, the crack expands unsteadily. At this time, the driving force of crack development is greater than the resistance of crack propagation. Thus, the stability of crack propagation in the concrete can be expressed as follows:
  • When K P , a + K σ w , a < K R Δ a , there is stable crack propagation;
  • When K P , a + K σ w , a K R Δ a , there is unstable crack propagation.

4.4. Analysis of Hydraulic Crack Propagation in Concrete

A KR resistance curve represents the concrete of the whole fracture process and can be used as the stability criterion of crack propagation in the whole fracture process. Before the stability analysis, the SIF curves in the crack propagation need to be calculated in advance. The load P and effective crack length a are substituted into the calculation formula to calculate the SIFs at the crack tip of the specimen at any loading time. Figure 17 shows the analysis of SIF curves and calculation results of typical specimens subjected to different hydraulic pressures of 0.0–0.3 MPa. The ratio of crack propagation length Δa to specimen height h is shown in the figure below. Δa/(ha0) is the x-axis, and the KR at the crack tip, the KIP induced by P, and the KIw induced by the hydraulic pressure in the crack are the y-axis. Through this figure, the stability analysis of crack propagation of concrete structures in the whole fracture process can be conducted. It can be found that the KR and KIw at the crack tip increase, but the KIP first increases and then decreases to zero. This indicates that the driving force for the expansion of hydraulic fracture has shifted from load P to hydraulic pressure in the crack. Meanwhile, the hydraulic pressure in the crack increases with the increase in crack opening displacement. The hydraulic crack propagation in concrete is completely controlled by the hydraulic pressure in the crack. Thus, when K σ w , a > K R Δ a , the crack propagation in concrete accelerates until the specimen fails. This can be considered as the starting point of the hydraulic fracturing disaster effect of concrete structures. For simplicity, the stability analysis of hydraulic crack development can be expressed as follows:
  • When K P , a + K σ w , a < K R Δ a , there is stable crack propagation;
  • When K P , a + K σ w , a K R Δ a , there is unstable crack propagation;
  • When K σ w , a K R Δ a , hydraulic crack propagation accelerates.

5. Conclusions

An analytical method is proposed to calculate the hydraulic crack propagation in concrete. This method is based on the fictitious crack model and the initial fracture toughness criterion. Subsequently, a series of concrete beams with varying initial crack depths and different hydraulic pressures within the cracks are tested to investigate hydraulic crack propagation in concrete. Based on this investigation, the analytical model is verified, and the hydraulic fracturing is analyzed. The following conclusions can be drawn:
(1)
Through the deformation relationship and crack initiation criterion, an analytical method for the hydraulic fracture propagation in concrete is proposed. Based on this analytical method, given the geometry and material information of the test concrete beam, the P-CMOD curve, FPZ length, and SIF curves induced by different loads can be calculated. The accuracy of the proposed analytical method is verified by comparing the theoretical results with the experimental results.
(2)
Increasing the internal hydraulic pressure decreases the carrying capacity of the test beam, the crack resistance of concrete, and the length of the FPZ of the hydraulic crack. As the applied hydraulic pressure increases from 0.0 MPa to 0.3 MPa, the peak load decreases by 60%, the cohesion fracture toughness decreases by 30%, and the maximum FPZ length decreases by 10%.
(3)
Increasing the initial crack depth ratio decreases the initial cracking load and peak load of the test beam, but it has less influence on the crack resistance of concrete and the length of the FPZ of the hydraulic crack. As a0/h increases from 0.2 to 0.5, the initial cracking load and the peak load incur a substantial percentage reduction of 30%.
(4)
The stability of crack propagation in concrete subjected to hydraulic fracturing decreases as the internal hydraulic pressure increases, but it is less affected by the initial crack depth ratio. Furthermore, crack propagation, which is primarily driven by hydraulic pressure, occurs earlier with the increase in internal hydraulic pressure. The values of Δa/(h − a0) at the collapse of the concrete beam under hydraulic pressures of 0.1, 0.2, and 0.3 MPa are 0.74, 0.52, and 0.38, respectively.
(5)
In this analytical method for hydraulic crack propagation in concrete, the softening curve parameters are determined based on the measured CTODc, which may compromise the computational accuracy of the proposed analysis model. Consequently, a more reliable theoretical approach to determining softening curve parameters using this method requires further investigation.
In the future, the softening curve parameters of concrete under different hydraulic pressures will be studied, and the influence of hydraulic pressure on the softening constitutive model will be analyzed through different hydraulic pressure tests to determine the influence of hydraulic pressure on the softening curve parameters.

Author Contributions

Writing—original draft preparation, Y.W.; conceptualization, methodology, investigation and funding acquisition, J.S.; resources and investigation, G.W.; conceptualization, investigation and software, Y.L.; investigation, W.X. All authors have read and agreed to the published version of the manuscript.

Funding

This research was funded by the State Key Laboratory of Precision Blasting and Hubei Key Laboratory of Blasting Engineering (No. PBSKL2022D10). This research was also funded by the National Natural Science Foundation of China (No. 52109164).

Institutional Review Board Statement

Not applicable.

Informed Consent Statement

Informed consent was obtained from all subjects involved in the study.

Data Availability Statement

Data are unavailable due to privacy.

Conflicts of Interest

The authors declare no conflicts of interest.

References

  1. Feltrin, G.; Wepf, D.; Bachmann, H. Seismic cracking of concrete gravity dams. Dam. Eng. 1990, 1, 279–289. [Google Scholar]
  2. Bucher, K.; Stober, I.; Seelig, U. Water deep inside the mountains: Unique water samples from the Gotthard rail base tunnel, Switzerland. Chem. Geol. 2012, 12, 240–253. [Google Scholar] [CrossRef]
  3. Duan, K.M.; Zhang, G.F.; Sun, H. Construction practice of water conveyance tunnel among complex geotechnical conditions: A case study. Sci. Rep. 2023, 13, 715–736. [Google Scholar] [CrossRef] [PubMed]
  4. Wang, Y.; Tao, M.M.; Wang, Z.K. Effect of leaching behavior on the geometric and hydraulic characteristics of concrete fracture. Materials 2022, 15, 4584. [Google Scholar] [CrossRef]
  5. He, J.X.; Ding, X.Y.; Liu, L. Predicting the effect of the loading rate on the fracture toughness of hydraulic asphalt concrete based on the weibull distribution. Materials 2024, 17, 803. [Google Scholar] [CrossRef]
  6. Ouyang, C.S.; Mobasher, B.; Shah, S.P. An R-curve approach for fracture of quasi-brittle materials. Eng. Fract. Mech. 1990, 37, 901–913. [Google Scholar]
  7. Bažant, Z.P.; Jirásek, M. R-curve modeling of rate and size effects in quasi brittle fracture. Int. J. Fract. 1993, 62, 355–373. [Google Scholar] [CrossRef]
  8. Reinhardt, H.W.; Xu, S.L. Crack extension resistance based on the cohesive force in concrete. Eng. Fract. Mech. 1999, 64, 563–587. [Google Scholar] [CrossRef]
  9. Xu, S.L.; Reinhardt, H.W. Determination of double-K criterion for crack propagation in quasi-brittle fracture, Part I: Experimental investigation of crack propagation. Int. J. Fract. 1999, 98, 111–149. [Google Scholar] [CrossRef]
  10. Kumar, S.; Barai, S. Influence of specimen geometry and size-effect on the KR-curve based on the cohesive stress in concrete. Int. J. Fract. 2008, 152, 127–148. [Google Scholar] [CrossRef]
  11. Wang, H.W.; Wu, Z.M.; Wang, Y.J.; Yu, R.C. An analytical method for predicting mode-I crack propagation process and resistance curve of rock and concrete materials. Theor. Appl. Fract. Mech. 2019, 100, 328–341. [Google Scholar] [CrossRef]
  12. Hu, S.W.; Fan, B. Crack extension resistance of concrete at low temperatures. Mag. Concr. Res. 2020, 72, 837–851. [Google Scholar] [CrossRef]
  13. Li, Z.H. A numerical method for applying cohesive stress on fracture process zone in concrete using nonlinear spring element. Materials 2022, 5, 1251. [Google Scholar] [CrossRef]
  14. Bruhwiler, E.; Saouma, V.E. Water fracture interaction in concrete-part I: Fracture properties. ACI Mater. J. 1995, 92, 296–303. [Google Scholar]
  15. Bruhwiler, E.; Saouma, V.E. Water fracture interaction in concrete-part II: Hydrostatic pressure in cracks. ACI Mater. J. 1995, 92, 383–390. [Google Scholar]
  16. Xu, S.; Wang, J. Crack propagation in a concrete dam under water pressure and determination of the double-K fracture parameters. China Civ. Eng. J. 2009, 42, 121–125. [Google Scholar]
  17. Xu, S.; Wang, J. Experimental determination of double-K fracture parameters of concrete under water pressure. J. Hydraul. Eng. 2007, 38, 972–978. [Google Scholar]
  18. Forth, J.P.; Higgins, L.; Neville, A.; Hodgson, T. Response of reinforced concrete beams to hydrostatic pressure acting within primary cracks. Mater. Struct. 2014, 47, 1545–1557. [Google Scholar] [CrossRef]
  19. Wang, Y.; Jia, J. Experimental study on the influence of hydraulic fracturing on high concrete gravity dams. Eng. Struct. 2017, 132, 508–517. [Google Scholar] [CrossRef]
  20. Jia, J.; Wang, Y.; Wei, F. Simulation method of hydraulic fracturing and discussions on design criteria for super high gravity dams. J. Hydraul. Eng. 2013, 44, 127–133. [Google Scholar]
  21. Du, C.; Chen, X.; Chen, Y. Experimental research on hydraulic fracture of concrete. J. Hydraul. Eng. 2017, 48, 1–8. [Google Scholar]
  22. Chen, X.; Du, C.; You, M.; Jiang, S.; Sun, L. Experimental study on water fracture interactions in concrete. Eng. Fract. Mech. 2017, 179, 314–327. [Google Scholar] [CrossRef]
  23. Wang, Y.; Hu, S.; Fan, X.; Lu, J. Effect of water pressure on fracture parameters of concrete. Constr. Build. Mater. 2019, 199, 613–623. [Google Scholar] [CrossRef]
  24. Wang, Y.; Hu, S.; Lu, J.; Qiao, Y. A note on the fracture behavior of concrete beams within water pressure under different loading rates. KSCE J. Civ. Eng. 2019, 23, 3993–3999. [Google Scholar] [CrossRef]
  25. Wang, Y.; Lu, W.; Hu, S.; Wang, G.; Chen, M.; Yan, P. Study on the influence of hydraulic pressure on the bilinear softening curve of concrete. Theor. Appl. Fract. Mech. 2022, 119, 103351. [Google Scholar] [CrossRef]
  26. Wu, Z.M.; Dong, W.; Liu, K.; Yang, S.T. Mode-I crack propagation criterion of concrete and numerical simulation for the complete crack propagation process. J. Hydraul. Eng. 2007, 12, 1453–1507. [Google Scholar]
  27. Dong, W.; Wu, Z.M.; Zhou, X.M. Calculating crack extension resistance of concrete based on a new crack propagation criterion. Constr. Build. Mater. 2013, 38, 879–889. [Google Scholar] [CrossRef]
  28. Tada, H.; Paris, P.C.; Irwin, G.R. The Stress Analysis of Cracks Handbook, 3rd ed.; ASME Press: New York, USA, 2000. [Google Scholar]
  29. Jenq, Y.S.; Shah, S.P. A fracture toughness criterion for concrete. Eng. Fract. Mech. 1985, 21, 1055–1069. [Google Scholar] [CrossRef]
  30. Foote, R.M.L.; Mai, Y.W.; Cotterell, B. Crack growth resistance curves in strain softening materials. J. Mech. Phys. Solids 1986, 34, 593–607. [Google Scholar] [CrossRef]
Figure 1. Analysis of hydraulic fracturing load of concrete beam.
Materials 17 03243 g001
Figure 2. Hydraulic pressure-displacement and cohesive stress-displacement relationships. (a) Quadratic function of σ w w , (b) bilinear function of σ w .
Materials 17 03243 g002
Figure 3. Estimation of hydraulic crack face separation by Castigliano’s theorem.
Materials 17 03243 g003
Figure 4. Relationships of the P, CMOD, and Ke of the hydraulic crack.
Materials 17 03243 g004
Figure 5. Hydraulic fracturing test of concrete beam. (a) Hydraulic test setup [24], (b) experimental setup.
Materials 17 03243 g005
Figure 6. P-CMOD curves of concrete beams within different hydraulic pressures.
Materials 17 03243 g006
Figure 7. Cohesive stress applied at the crack surface when a = ac.
Materials 17 03243 g007
Figure 8. P-CMOD curves of test beams with different initial crack depths.
Materials 17 03243 g008
Figure 9. P-CMOD curves of test beams with different initial crack depths subjected to 0.3 MPa hydraulic pressure.
Materials 17 03243 g009
Figure 10. Comparison between analytical and experimental results within different hydraulic pressures.
Materials 17 03243 g010
Figure 11. Comparison between analytical and experimental results without hydraulic pressure.
Materials 17 03243 g011
Figure 12. Comparison between analytical and experimental results with 0.3 MPa hydraulic pressure.
Materials 17 03243 g012
Figure 13. Comparison between theoretical and experimental results of test beams. (a) Comparison between analytical and experimental results of Pmax. (b) Comparison between analytical and experimental results of ac. (c) Comparison between analytical and experimental results of KIc.
Materials 17 03243 g013aMaterials 17 03243 g013b
Figure 14. KR curves for tested concrete beams with different hydraulic pressures.
Materials 17 03243 g014
Figure 15. KR curves for tested concrete beams with different initial crack lengths.
Materials 17 03243 g015
Figure 16. KR curve, variation of lFPZ and CTOD curve for test beams with different initial crack lengths. Point A is the initiation crack point and point B is the unstable crack propagation point.
Materials 17 03243 g016
Figure 17. SIFs of hydraulic crack propagation in concrete.
Materials 17 03243 g017
Table 1. Mixture proportion of concrete (kg/m3).
WaterCementSandGravel
(5–12.5 mm)
Gravel
(12.5–25 mm)
182350761614538
Table 2. Number of test concrete beams.
Beamsa0 (mm)a0/hσw0 (MPa)AmountsSources
Beam-0.0-X800.40.03Ref. [23]
Beam-0.1-X800.40.13
Beam-0.2-X800.40.23
Beam-0.3-X800.40.33
Beam0.2-X-0.0400.20.03This work
Beam0.3-X-0.0600.30.03
Beam0.4-X-0.0800.40.03
Beam0.5-X-0.01000.50.03
Beam0.2-X-0.3400.20.33
Beam0.3-X-0.3600.30.33
Beam0.4-X-0.3800.40.33
Beam0.5-X-0.31000.50.33
Here, X = 1, 2, and 3 represent the different numbers of test beams.
Table 3. Experimental results of fracture parameters.
Numberac (mm)Pini (kN)Pmax (kN)Fracture Toughness (MPa·m1/2)
K I c i n i K I c u n
TPB-0.0-1135.73.696.310.8831.714
TPB-0.0-2137.73.827.080.9141.923
TPB-0.0-3133.83.566.580.8521.787
Average135.73.696.660.8831.808
TPB-0.1-1141.52.584.960.8541.601
TPB-0.1-2132.72.835.530.9221.756
TPB-0.1-3136.82.765.160.9031.657
Average137.02.725.220.8931.671
TPB-0.2-1134.22.014.440.9391.715
TPB-0.2-2130.52.124.560.9741.742
TPB-0.2-3141.31.824.130.8781.623
Average135.31.984.380.931.693
TPB-0.3-1132.31.422.120.7891.385
TPB-0.3-2130.91.312.810.7571.575
TPB-0.3-3132.21.152.530.7451.502
Average131.81.292.490.7641.487
Table 4. Fitting parameters of the hydraulic pressure curve and softening stress curve.
Numberσw0
(MPa)
Hydraulic Pressure CurveSoftening Stress Curve
ABCODw
(μm)
f t
(MPa)
σ s
(MPa)
w s
(μm)
w 0
(μm)
TPB-0.1-10.1−1.212.07813.121.0432.45146.03
TPB-0.1-2−0.761.84763.121.0432.01144.05
TPB-0.1-3−0.941.981043.121.0431.42141.39
Average−0.971.96873.121.0431.96143.82
TPB-0.2-10.2−1.532.55603.121.0428.49128.21
TPB-0.2-2−1.212.23763.121.0428.67129.02
TPB-0.2-3−0.821.91673.121.0428.55128.48
Average−1.182.23683.121.0428.57128.57
TPB-0.3-10.3−0.942.01513.121.0427.99125.96
TPB-0.3-2−1.552.56573.121.0428.01126.05
TPB-0.3-3−1.132.15603.121.0427.49123.71
Average−1.212.24563.121.0427.83125.24
Table 5. Experimental results of fracture parameters with different initial crack depths.
Numberac
(mm)
Pini
(kN)
Pmax
(kN)
Fracture Toughness (MPa·m1/2)
K Ic i n i K Ic u n K Ic
TPB0.2-1-0.0114.55.138.780.9321.8780.946
TPB0.2-2-0.0112.75.089.410.9172.0421.135
TPB0.2-3-0.0116.24.919.070.8911.8911.000
Average114.55.039.080.9131.9371.038
TPB0.3-1-0.0121.24.898.370.9531.9951.042
TPB0.3-2-0.0120.84.678.650.9111.9831.072
TPB0.3-3-0.0122.54.287.910.9451.9421.007
Average121.24.618.310.9331.9731.042
TPB0.4-1-0.0135.73.696.310.8831.7140.831
TPB0.4-2-0.0137.73.827.080.9141.9231.009
TPB0.4-3-0.0133.83.566.580.8521.7870.935
Average135.73.696.660.8831.8080.925
TPB0.5-1-0.0146.53.135.360.9141.7920.888
TPB0.5-2-0.0148.13.346.190.9091.9821.073
TPB0.5-3-0.0145.13.286.070.8711.8410.970
Average146.53.255.870.8911.8740.983
TPB0.2-1-0.3111.54.235.910.8071.5540.747
TPB0.2-2-0.3113.33.865.390.7551.5120.757
TPB0.2-3-0.3112.73.985.580.7851.5930.808
Average112.54.025.620.7811.5540.773
TPB0.3-1-0.3128.92.383.320.8011.4440.643
TPB0.3-2-0.3120.32.132.970.7361.5560.820
TPB0.3-3-0.3120.82.323.240.7281.5250.797
Average123.72.273.180.7591.5200.761
TPB0.4-1-0.3132.31.422.120.7891.3850.596
TPB0.4-2-0.3130.91.312.810.7571.5750.818
TPB0.4-3-0.3132.21.152.530.7451.5020.757
Average131.81.292.490.7641.4870.723
TPB0.5-1-0.3143.91.0881.520.7921.5160.724
TPB0.5-2-0.3142.70.8951.250.7361.5290.793
TPB0.5-3-0.3143.90.9881.380.8011.5080.707
Average143.60.9881.380.7731.5180.745
Table 6. Comparison of experimental and calculated results.
Numberac
(mm)
Pini
(kN)
Pmax (kN)Fracture Toughness (MPa·m1/2)
K I c i n i K I c u n
TPB-0.0-XExperiment135.73.696.660.8831.808
Calculation135.93.627.360.8311.925
Error0.1%1.9%9.5%6.25%6.1%
TPB-0.1-XExperiment137.02.725.220.8931.671
Calculation138.52.615.630.8321.754
Error1.1%4.2%7.3%7.3%4.7%
TPB-0.2-XExperiment135.31.984.380.931.693
Calculation135.01.824.370.881.689
Error0.2%8.8%0.2%5.7%0.2%
TPB-0.3-XExperiment131.81.292.090.7641.487
Calculation130.91.222.100.7321.443
Error0.7%5.7%0.5%4.4%3.0%
TPB0.2-X-0.0Experiment114.55.039.080.9131.937
Calculation114.05.009.100.9091.989
Error0.4%0.6%0.2%0.4%2.6%
TPB0.3-X-0.0Experiment121.24.618.310.9331.973
Calculation120.84.588.460.9201.987
Error0.3%0.6%1.8%1.4%0.7%
TPB0.4-X-0.0Experiment135.73.697.060.8831.808
Calculation134.23.637.530.8681.897
Error1.1%1.7%6.2%1.7%4.7%
TPB0.5-X-0.0Experiment146.53.255.870.8911.874
Calculation140.93.285.990.8871.901
Error4.0%0.9%2.0%0.5%1.4%
TPB0.2-X-0.3Experiment112.54.025.620.7811.554
Calculation112.73.985.680.7801.567
Error0.2%1.0%1.1%0.1%0.8%
TPB0.3-X-0.3Experiment123.72.273.180.7591.520
Calculation124.02.203.210.7501.531
Error0.2%3.2%0.9%1.2%0.7%
TPB0.4-X-0.3Experiment131.81.292.490.7641.487
Calculation130.91.272.580.7591.499
Error0.7%1.6%3.5%0.7%0.8%
TPB0.5-X-0.3Experiment143.60.9881.380.7731.518
Calculation142.80.9721.450.7801.529
Error0.6%1.6%4.8%0.9%0.7%
Disclaimer/Publisher’s Note: The statements, opinions and data contained in all publications are solely those of the individual author(s) and contributor(s) and not of MDPI and/or the editor(s). MDPI and/or the editor(s) disclaim responsibility for any injury to people or property resulting from any ideas, methods, instructions or products referred to in the content.

