
Investigation on the Correlation between Mechanical Strength, Grain Size, and Density of Fly Ash Microspheres in the Context of Refining Process


Abstract
1. Introduction
2. Materials and Methods
2.1. Characteristics of the Tested Microspheres
- Material 1—microspheres from Poland, from the combustion process of bituminous coal in a pulverized boiler, with a wet separation process—the sink–float method,
- Material 2—microspheres from Kazakhstan, from the combustion of coal bituminous in a pulverized boiler, with a wet separation process—the sink–float method.
2.2. Methodology for Investigating Selected Properties of the Microspheres
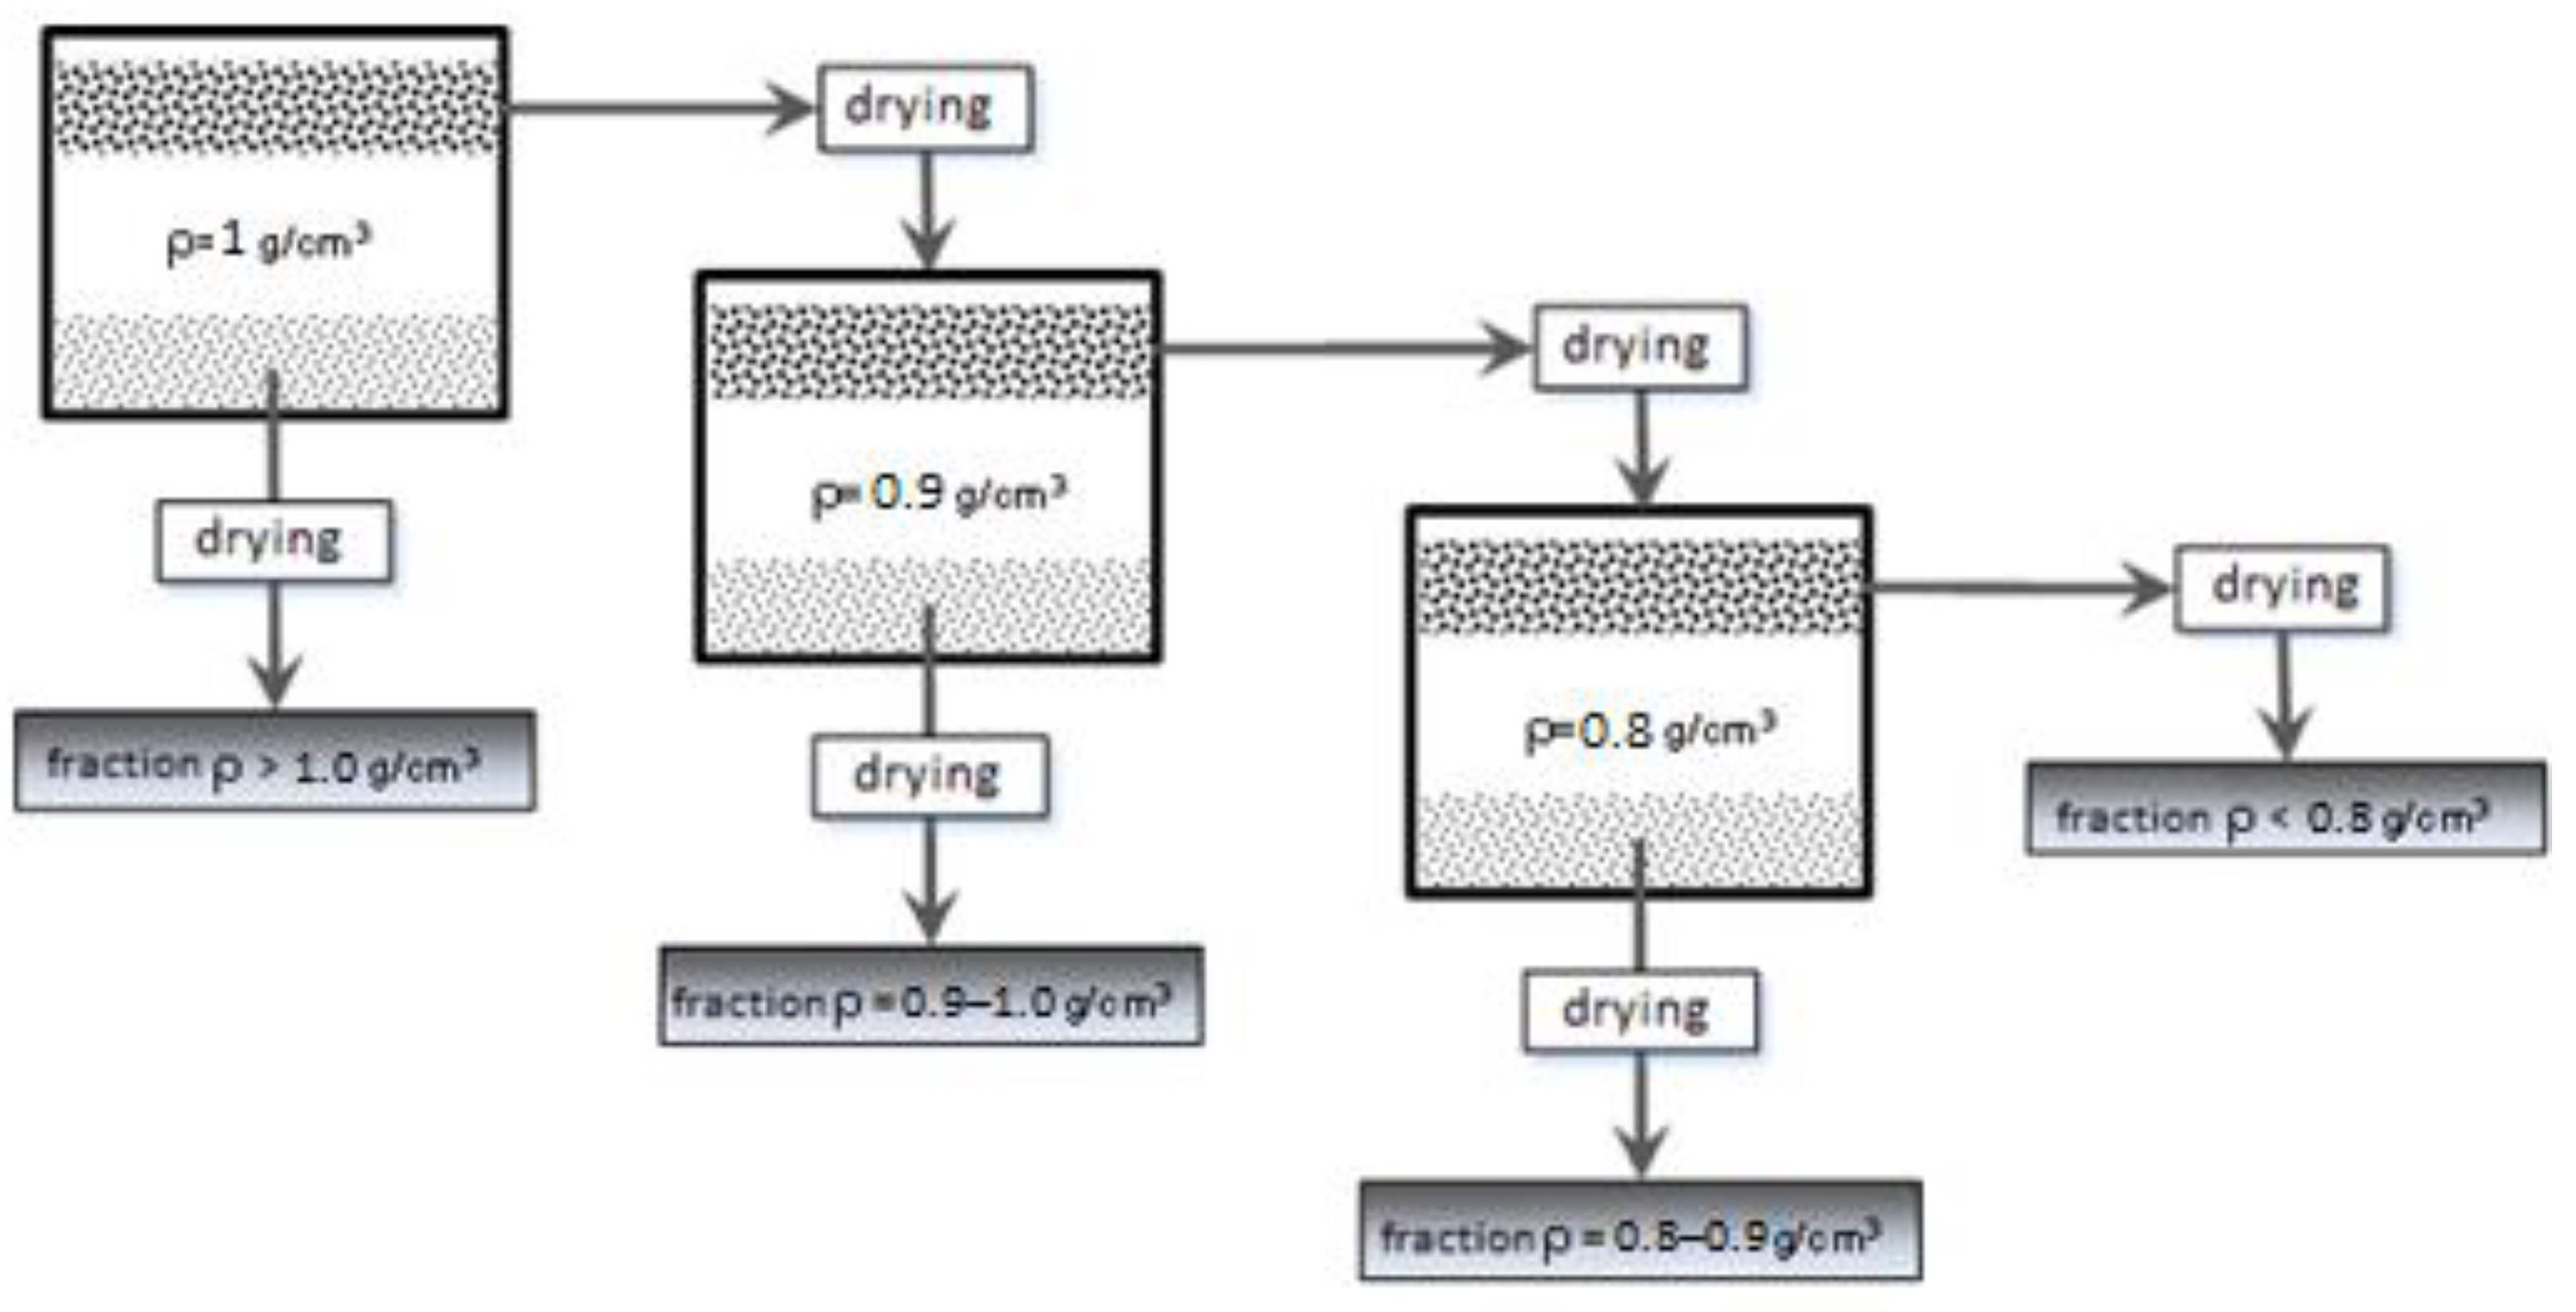
- (1)
- Separation of density fractions
- (2)
- Separation of grain classes
- (3)
- True density
- (4)
- Analysis of the oxide composition using the XRF method
- (5)
- Mechanical strength
- mf—mass of falling grains after the mechanical strength test, g,
- ms—mass of microspheres sample before mechanical strength test, g,
- S—mass fraction of falling grains before mechanical strength test, %.
3. Results and Discussion
3.1. Basic Properties of the Tested Microspheres
3.2. Densiometric Analysis
3.3. Investigation on the Mechanical Strength of Microspheres in Density Fractions
4. Conclusions
Author Contributions
Funding
Institutional Review Board Statement
Informed Consent Statement
Data Availability Statement
Acknowledgments
Conflicts of Interest
Correction Statement
References
- Strzałkowska, E.; Adamczyk, Z. Influence of chemical composition of fly-ash cenospheres on their grains size. Int. J. Environ. Sci. Technol. 2020, 17, 809–818. [Google Scholar] [CrossRef]
- Wang, Q.; Wang, D.; Chen, H. The role of fly ash microsphere in the microstructure and macroscopic properties of high-strength concrete. Cem. Concr. Compos. 2017, 83, 125–137. [Google Scholar] [CrossRef]
- Rychlewska, K.; Tomaszewicz, M.; Radko, T. Zeolitization of Coal Fly Ashes and Coal Fly Ash Microspheres. J. Ecol. Eng. 2022, 23, 109–121. [Google Scholar] [CrossRef]
- Fenelonov, V.B.; Mel’gunov, M.S.; Parmon, V.N. The Properties of Cenospheres and the Mechanism of Their Formation During High-Temperature Coal Combustion at Thermal Power Plants. KONA Powder Part. J. 2010, 28, 189–208. [Google Scholar] [CrossRef]
- Danilin, L.D.; Drozhozhin, V.S. Hollow alumosilicate microspheres as a promising cartier for sorbents for LRW deactivation. In Proceedings of the International Conference “Nuclear Energy for New Europe”, Portoroz, Slovenia, 8–11 September 2008; pp. 609.1–609.7. [Google Scholar]
- Haustein, E.; Quant, B. The characteristics of selected properties of the cenospheres-Fraction of fly ash-by-product of coal combustion [Charakterystyka wybranych właściwości mikrosfer- frakcji popiołu lotnego-ubocznego produktu spalania węgla kamiennego]. Gospod. Surowcami Miner./Miner. Resour. Manag. 2011, 27, 95–111. [Google Scholar]
- Strzałkowska, E. Fly ash–a valuable material for the circular economy [Popiół lotny–cenny materiał dla gospodarki o obiegu zamkniętym]. Gospod. Surowcami Miner./Miner. Resour. Manag. 2021, 37, 49–62. [Google Scholar] [CrossRef]
- Liu, J.; Zhang, X.; Wang, Y.; Wang, Z.; Li, Y. Study on the effect of the density and incorporation amount of Coal Fly ash hollow microspheres on the fire performance of epoxy resin. Mater. Today Commun. 2023, 34, 105213. [Google Scholar] [CrossRef]
- Vereshchagina, T.; Kutikhina, E.; Solovyov, L.; Vereshchagin, S.; Mazurova, E.; Anshits, A. Article hydrothermal co-processing of coal fly ash cenospheres and soluble sr(Ii) as environmentally sustainable approach to sr-90 immobilization in a mineral-like form. Materials 2021, 14, 5586. [Google Scholar] [CrossRef]
- Sočo, E.; Kalembkiewicz, J. Characterisation and utilisation of solid waste from coal combustion to modelling of sorption equilibrium in a bi-component system metal-dye. Waste Manag. Res. 2020, 38, 567–575. [Google Scholar] [CrossRef]
- Yemelyanova, V.S.; Dossumova, B.T.; Shakiyeva, T.V.; Sassykova, L.R.; Sendilvelan, S. Processing fly ash from the thermal power stations for gas emissions purification from sulfur dioxide. Int. J. Mech. Prod. Eng. Res. Dev. 2019, 9, 1027–1036. [Google Scholar] [CrossRef]
- Wrona, J.; Zukowski, W.; Bradlo, D.; Czuprynśki, P. Recovery of cenospheres and fine fraction from coal fly ash by a novel dry separation method. Energies 2020, 13, 3576. [Google Scholar] [CrossRef]
- Wajda, A. Management of wastes from energy industry in the frame of circular economy on the example of microspheres. Int. Multidiscip. Sci. GeoConference SGEM 2018, 18, 71–78. [Google Scholar] [CrossRef]
- Bradlo, D.; Wrona, J.; Zukowski, W.; Czuprynski, P.; Kandefer, S. Recovery of aluminosilicate microspheres from fly ash using a combination of air classifiers. In Proceedings of the 23rd International Congress of Chemical and Process Engineering, CHISA, Prague, Czech Republic, 25–29 August 2018; Volume 2, p. 1256. [Google Scholar]
- Blissett, R.S.; Rowson, N.A. A review of the multi-component utilisation of coal fly ash. Fuel 2012, 97, 1–23. [Google Scholar] [CrossRef]
- Yang, Y.; Cheng, T.; You, Z.; Liang, T.; Hou, J. Profile control using fly ash three-phase foam assisted by microspheres with an adhesive coating. Appl. Sci. 2021, 11, 3616. [Google Scholar] [CrossRef]
- Doumbia, A.S.; Bourmaud, A.; Jouannet, D.; Falher, T.; Orange, F.; Retoux, R.; Le Pluart, L.; Cauret, L. Hollow microspheres–poly-(propylene) blends: Relationship between microspheres degradation and composite properties. Polym. Degrad. Stab. 2015, 114, 146–153. [Google Scholar] [CrossRef]
- Yang, T.; Zhu, H.; Zhang, Z.; Gao, X.; Zhang, C.; Wu, Q. Effect of fly ash microsphere on the rheology and microstructure of alkali-activated fly ash/slag pastes. Cem. Concr. Res. 2018, 109, 198–207. [Google Scholar] [CrossRef]
- Miryuk, O.; Fediuk, R.; Amran, M. Porous Fly Ash/Aluminosilicate Microspheres-Based Composites Containing Lightweight Granules Using Liquid Glass as Binder. Polymers 2022, 14, 3461. [Google Scholar] [CrossRef]
- Molendowska, A. Scaling Resistance of Concretes Made with Fly Ash Cement. IOP Conf. Ser. Mater. Sci. Eng. 2019, 471, 032024. [Google Scholar] [CrossRef]
- Hanif, A.; Lu, Z.; Li, Z. Utilization of fly ash cenosphere as lightweight filler in cement-based composites–A review. Constr. Build. Mater. 2017, 144, 373–384. [Google Scholar] [CrossRef]
- Haustein, E.; Kuryłowicz-Cudowska, A. Effect of Particle Size of Fly Ash Microspheres (FAMs) on the Selected Properties of Concrete. Minerals 2022, 12, 847. [Google Scholar] [CrossRef]
- Vereshchagina, T.; Kutikhina, E.; Vereshchagin, S.; Buyko, O.; Anshits, A. Cenosphere-Based Zeolite Precursors of Lutetium Encapsulated Aluminosilicate Microspheres for Application in Brachytherapy. Materials 2022, 15, 7025. [Google Scholar] [CrossRef] [PubMed]
- Kuźnia, M.; Magiera, A.; Zygmunt-Kowalska, B.; Kaczorek-Chrobak, K.; Pielichowska, K.; Szatkowski, P.; Benko, A.; Ziabka, M.; Jerzak, W. Fly ash as an eco-friendly filler for rigid polyurethane foams modification. Materials 2021, 14, 6604. [Google Scholar] [CrossRef] [PubMed]
- Baziak, A.; Pławecka, K.; Hager, I.; Castel, A.; Korniejenko, K. Development and characterization of lightweight geopolymer composite reinforced with hybrid carbon and steel. Materials 2021, 14, 5741. [Google Scholar] [CrossRef] [PubMed]
- Poranek, N.; Łaźniewska-Piekarczyk, B.; Lombardi, L.; Czajkowski, A.; Bogacka, M.; Pikoń, K. Green Deal and Circular Economy of Bottom Ash Waste Management in Building Industry—Alkali (NaOH) Pre-Treatment. Materials 2022, 15, 3487. [Google Scholar] [CrossRef] [PubMed]
- Poranek, N.; Łaźniewska-Piekarczyk, B.; Czajkowski, A.; Pikoń, K. MSWIBA Formation and Geopolymerisation to Meet the United Nations Sustainable Development Goals (SDGs) and Climate Mitigation. Buildings 2022, 12, 1083. [Google Scholar] [CrossRef]
- Szołdra, P.; Pichór, W.; Cholewa-Kowalska, K.; Adamczyk, A.; Szudek, W. Synthesis and characterization of tio2 thin film on fly ash cenospheres [Synteza I Charakterystyka Cienkiej Warstwy TiO2 Osadzonej Na Mikrosferach Z Popiołów Lotnych]. Compos. Theory Pract. 2019, 19, 71–75. [Google Scholar]
- Kwan, A.K.H.; Chen, J.J. Adding fly ash microsphere to improve packing density, flowability and strength of cement paste. Powder Technol. 2013, 234, 19–25. [Google Scholar] [CrossRef]
- Zhou, S.; Zhou, S.; Zhang, J.; Tan, X.; Chen, D. Relationship between Moisture Transportation, Efflorescence and Structure Degradation in Fly Ash/Slag Geopolymer. Materials 2020, 13, 5550. [Google Scholar] [CrossRef] [PubMed]
- Fang, Z.; Luo, Y.; Chen, H.; Gao, Y.; Yang, W.; Wang, C. Research on mechanical properties and hydration characteristics of ultra-high performance concrete with high-volume fly ash microsphere. J. Build. Eng. 2023, 78, 107738. [Google Scholar] [CrossRef]
- Ranjbar, N.; Kuenzel, C. Cenospheres: A review. Fuel 2017, 207, 1–12. [Google Scholar] [CrossRef]
- Feng, S.; Zhang, X.; Xu, L.; Tao, W.; Duan, G. Correlation analysis of various characteristics of fly ash based on particle separation. Case Stud. Constr. Mater. 2024, 20, e02785. [Google Scholar] [CrossRef]
- Jaworek, A.; Sobczyk, A.T.; Czech, T.; Marchewicz, A.; Krupa, A. Recovery of cenospheres from solid waste produced by coal-fired power plants. Clean. Waste Syst. 2023, 6, 100109. [Google Scholar] [CrossRef]


| Parameter | Unit | Material 1 | Material 2 |
|---|---|---|---|
| Content of falling particles (sinkers) in raw material | % m/m | 3 | 7 |
| True density in raw material | g/cm3 | 0.7133 | 0.8275 |
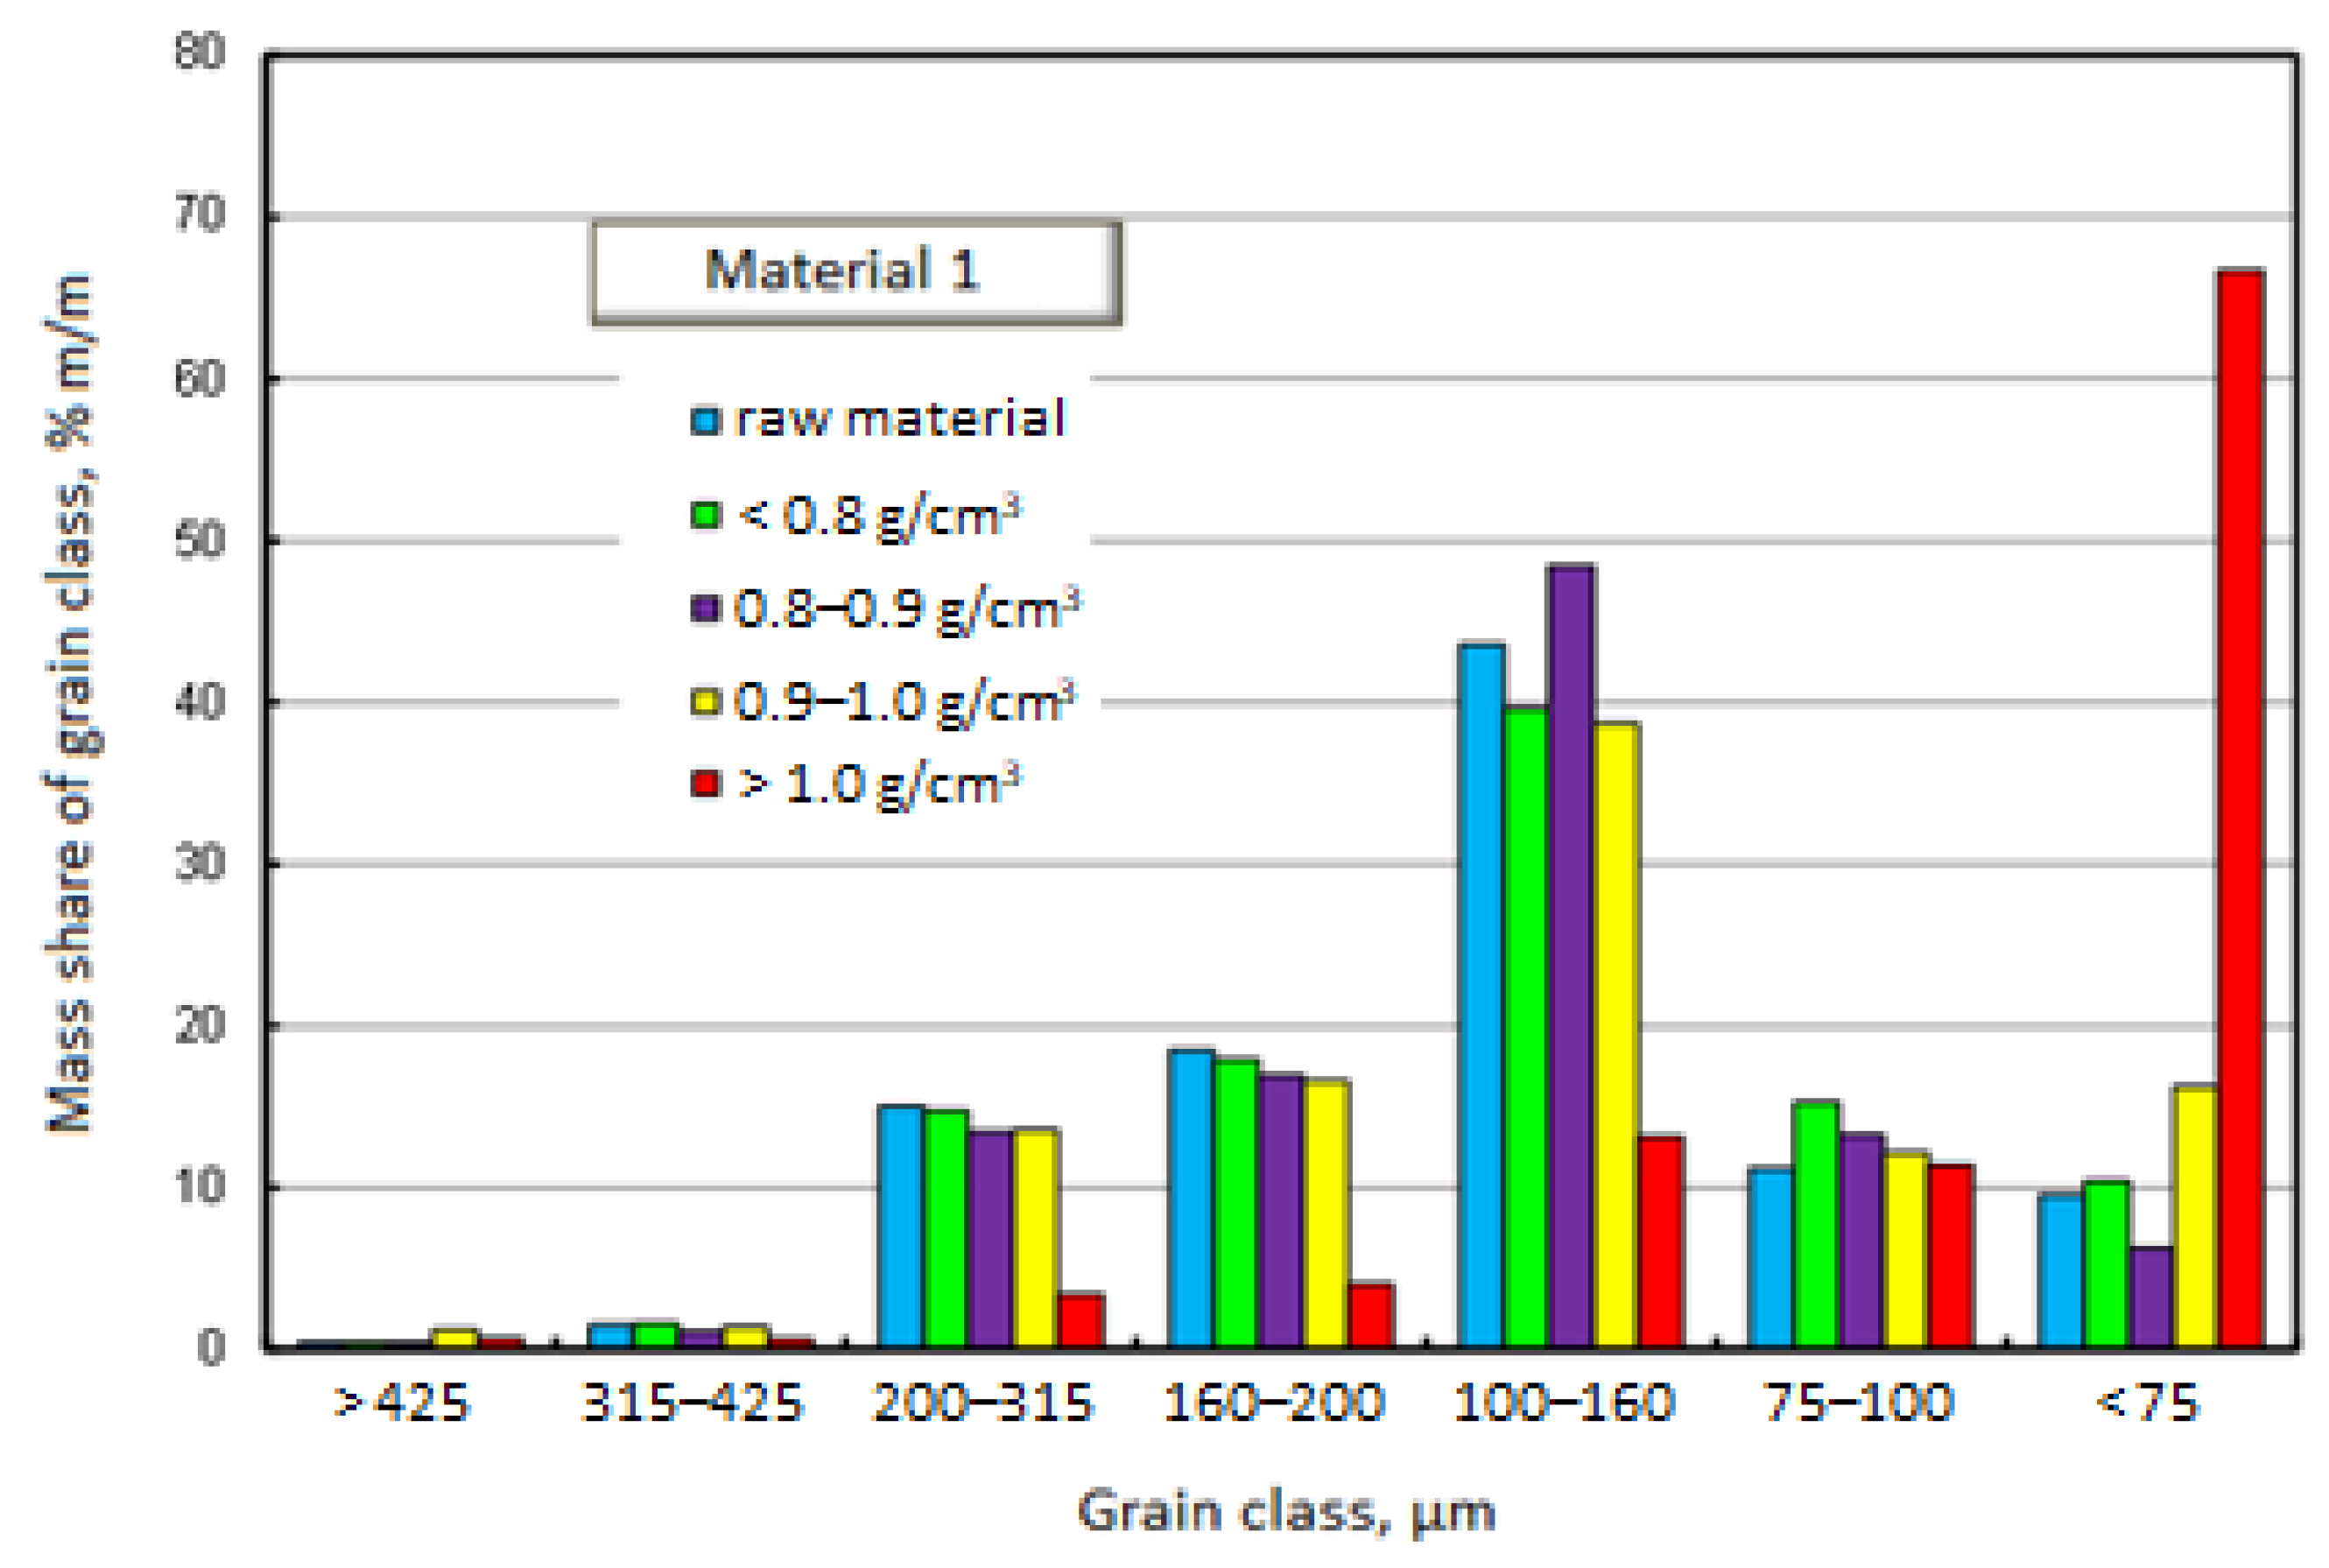
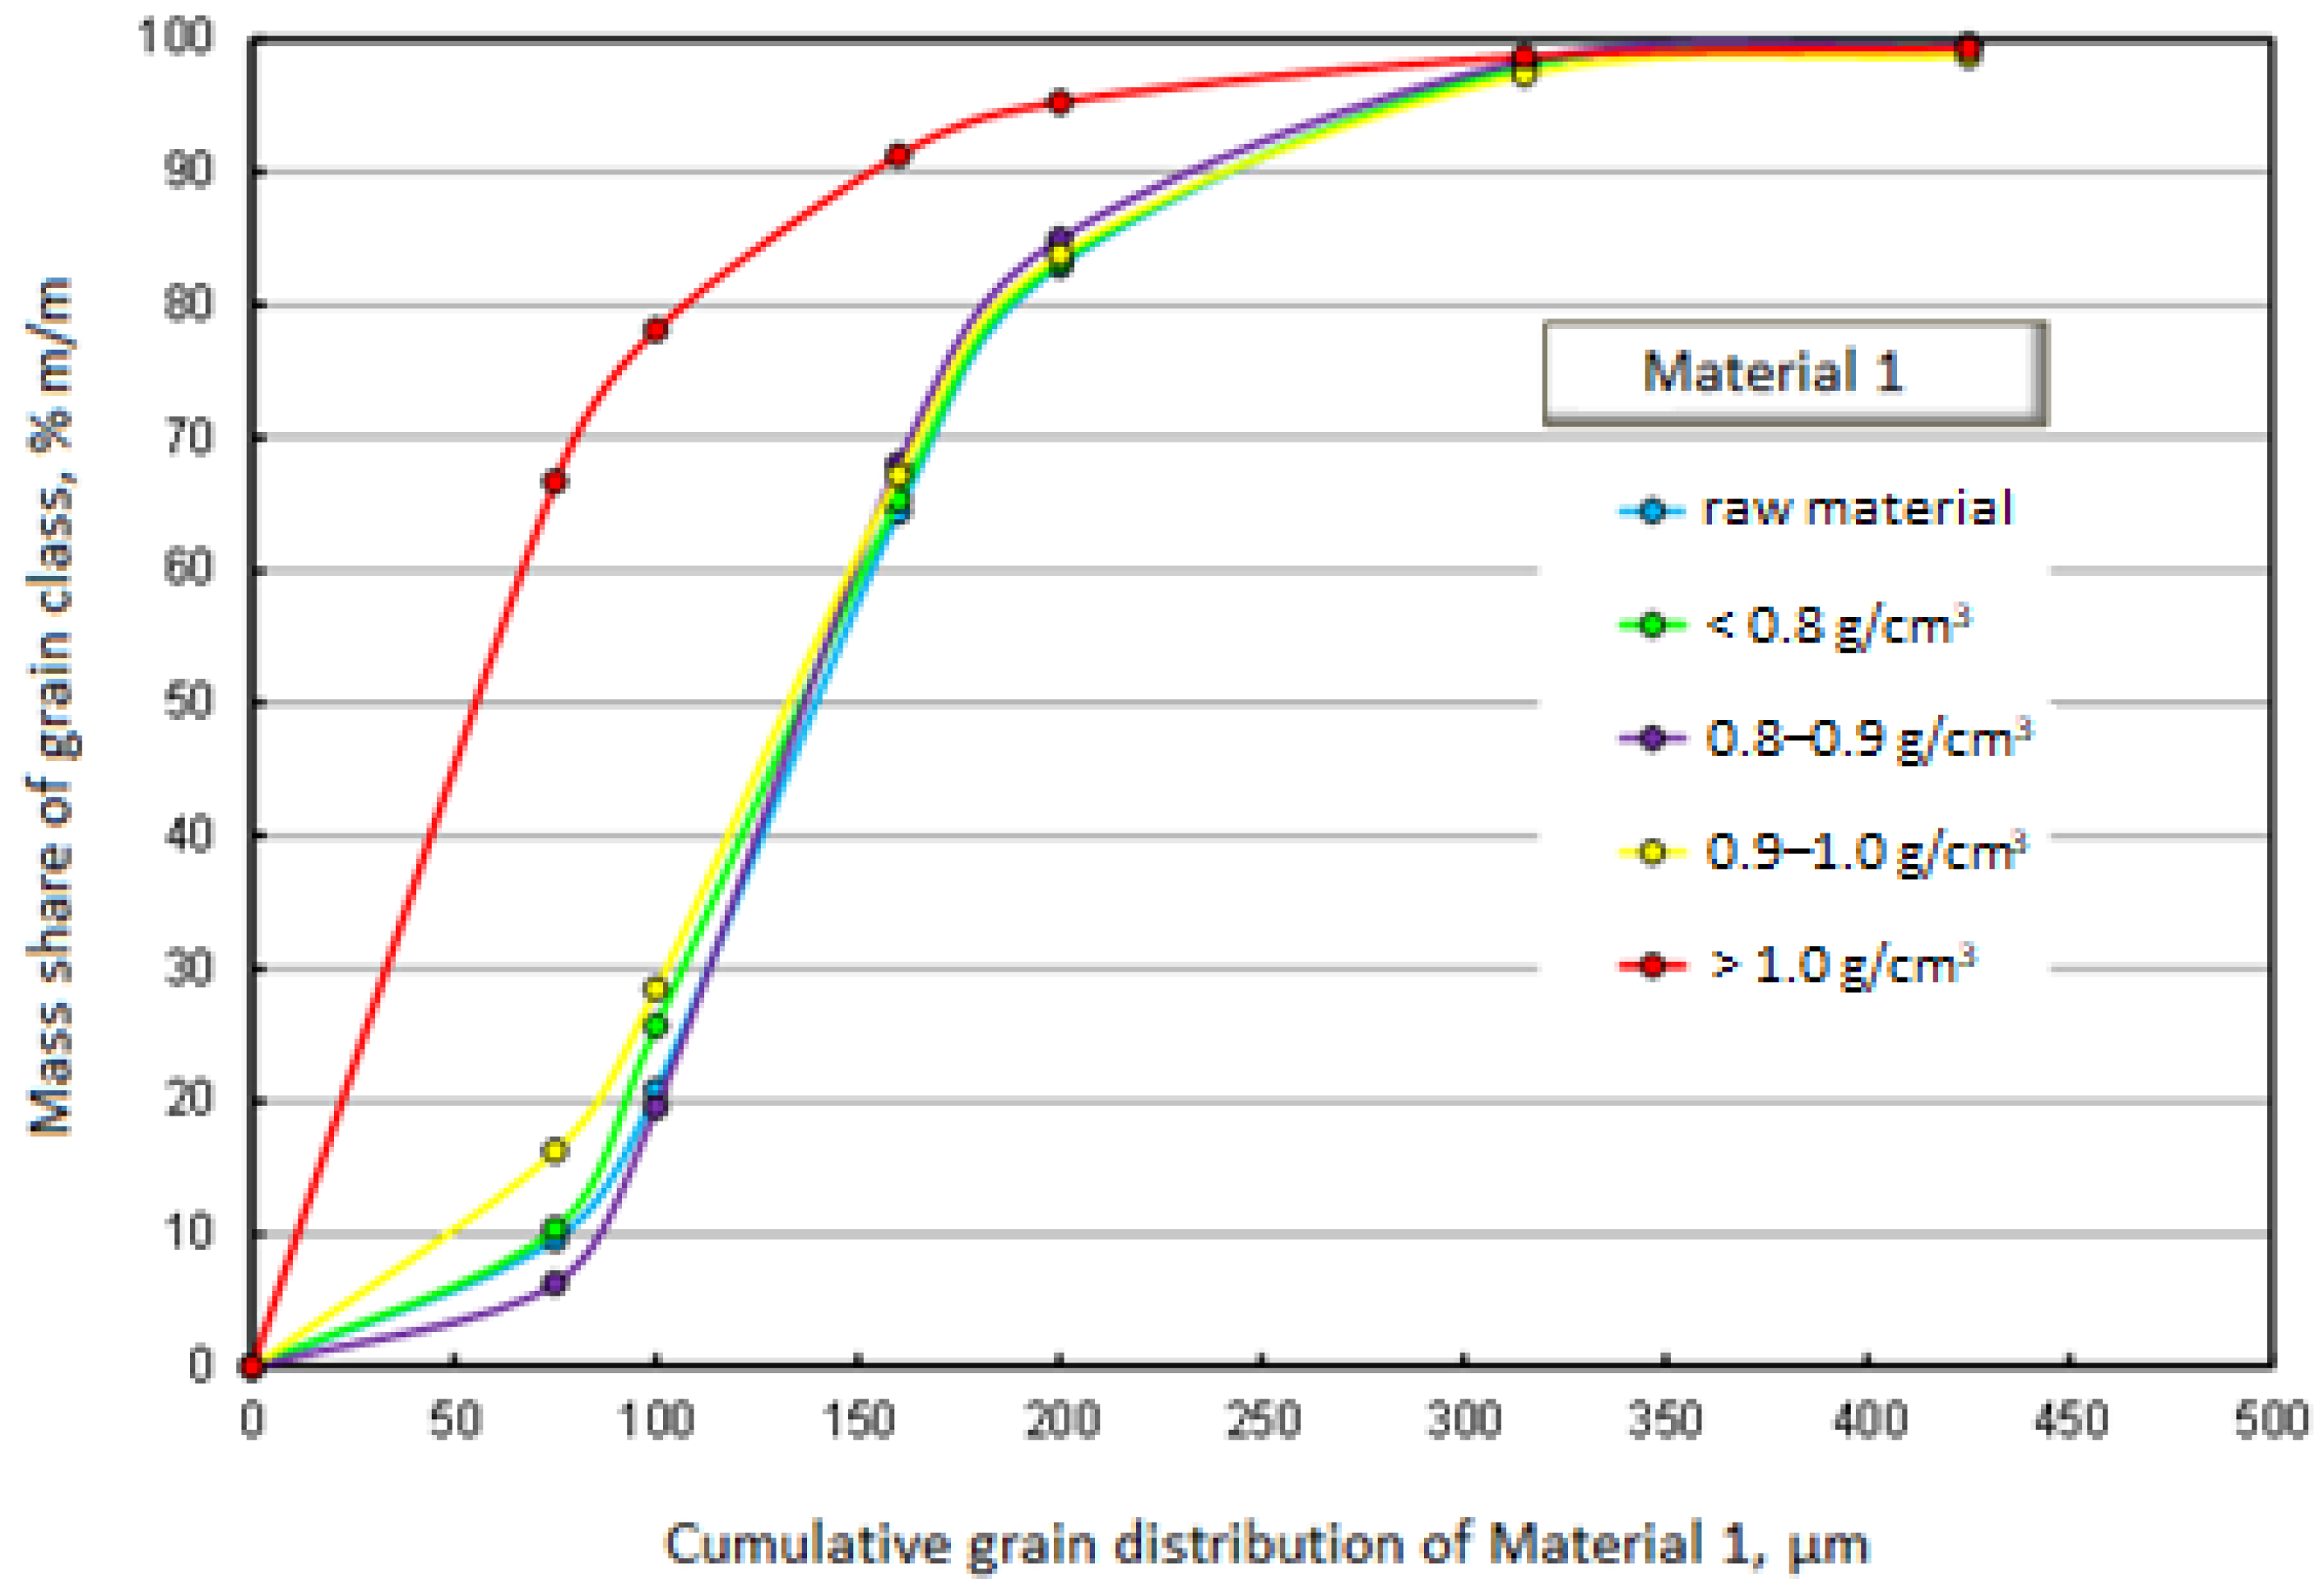
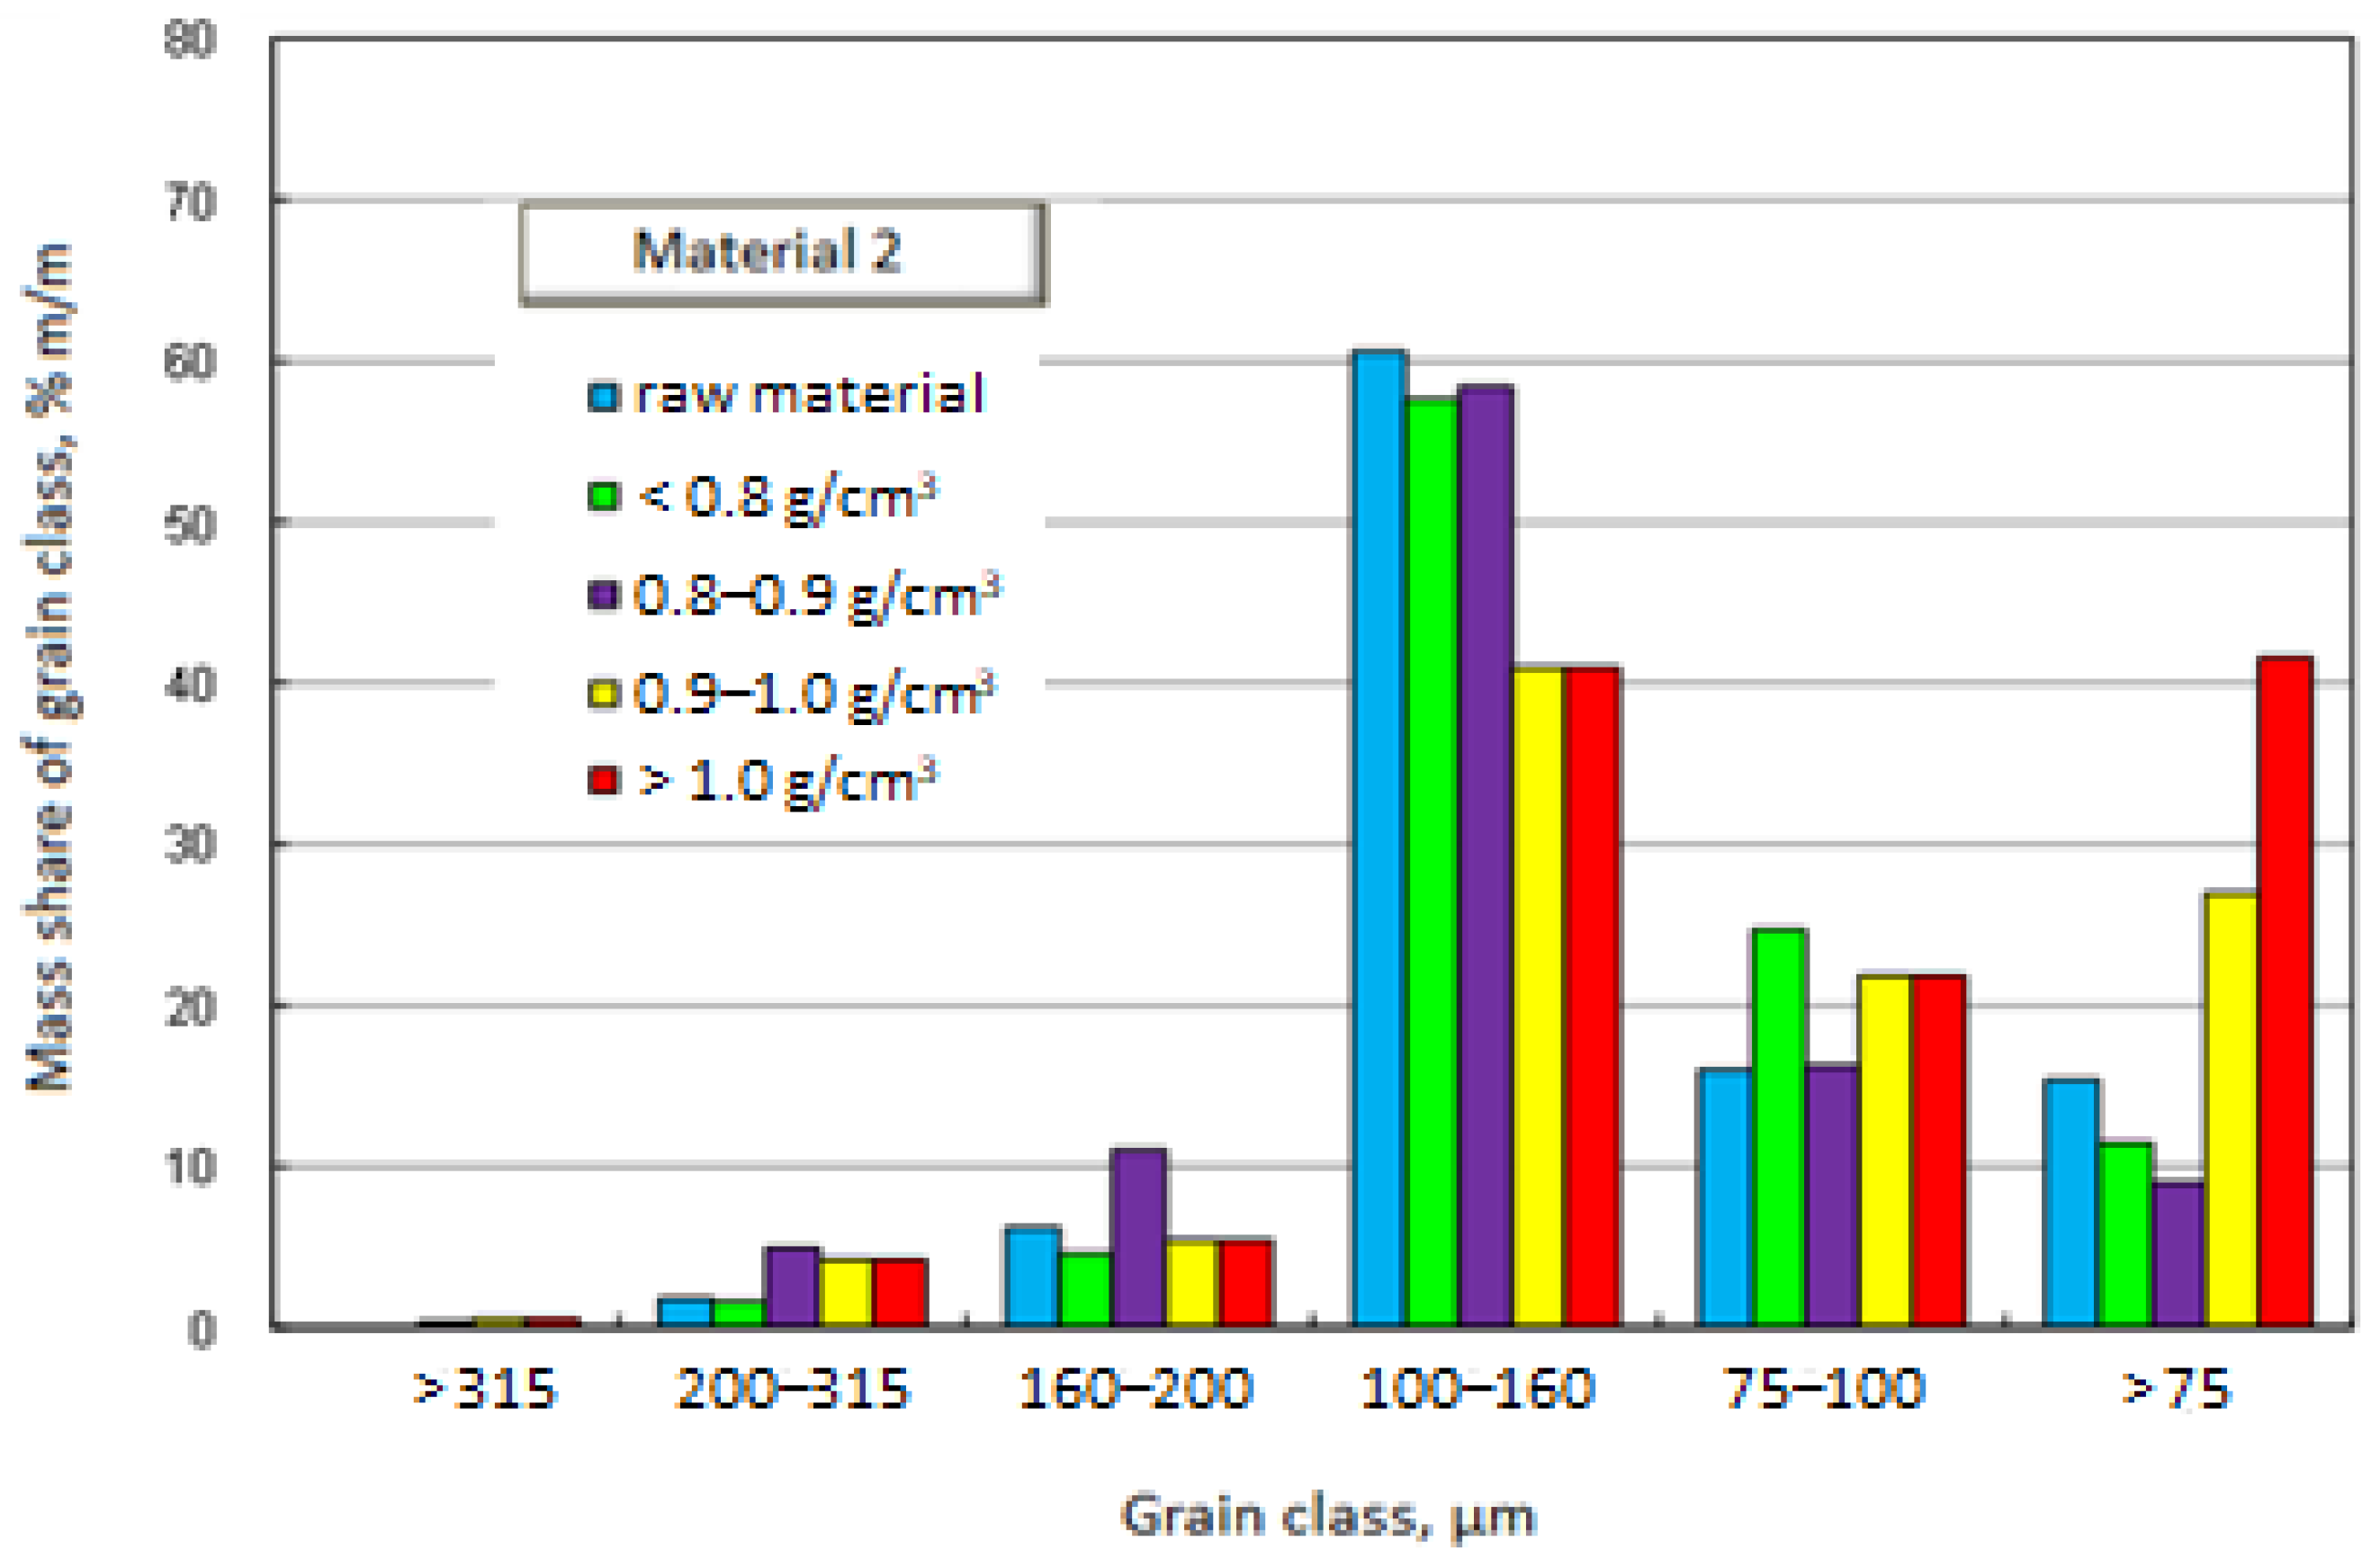
| Material 1 | Material 2 | ||
|---|---|---|---|
| Size of the Grain Class, µm | Share of the Grain Class, % m/m | Size of the Grain Class, µm | Share of the Grain Class, % m/m |
| >425 | 0.46 | - | - |
| 315–425 | 1.51 | 315–425 | 0.00 |
| 200–315 | 15.07 | 200–315 | 1.80 |
| 160–200 | 18.54 | 160–200 | 6.20 |
| 100–160 | 43.58 | 100–160 | 60.60 |
| 75–100 | 11.24 | 75–100 | 16.00 |
| <75 | 9.60 | 56–75 | 9.8 |
| - | - | 40–56 | 4.70 |
| - | - | <40 | 0.90 |
| Parameter | Unit | Material 1 | Material 2 | |
|---|---|---|---|---|
| Silicon dioxide | SiO2 | % m/m | 59.07 | 55.20 |
| Aluminum dioxide | Al2O3 | % m/m | 29.54 | 37.10 |
| Diiron trioxide | Fe2O3 | % m/m | 1.84 | 2.30 |
| Calcium oxide | CaO | % m/m | 1.98 | 1.52 |
| Magnesium oxide | MgO | % m/m | 0.38 | 0.51 |
| Diphosphorus pentoxide | P2O5 | % m/m | 0.71 | 0.86 |
| Sulfur trioxide | SO3 | % m/m | 0.13 | 0.09 |
| Trimanganese tetraoxide | Mn3O4 | % m/m | 0.04 | 0.06 |
| Titanium dioxide | TiO2 | % m/m | 1.07 | 0.98 |
| Barium oxide | BaO | % m/m | 0.42 | 0.21 |
| Strontium oxide | SrO | % m/m | 0.11 | 0.08 |
| Disodium oxide | Na2O | % m/m | 0.56 | 0.38 |
| Dipotassium oxide | K2O | % m/m | 0.60 | 0.51 |
| Grain Class | Raw Material | <0.8 g/cm3 | 0.8–0.9 g/cm3 | 0.9–1.0 g/cm3 | >1.0 g/cm3 | |||||
|---|---|---|---|---|---|---|---|---|---|---|
| Share % | Density g/cm3 | Share % | Density g/cm3 | Share % | Density g/cm3 | Share % | Density g/cm3 | Share % | Density g/cm3 | |
| >425 | 0.5 | n/o | 0.4 | n/o | 0.5 | n/o | 1.2 | n/o | 0.7 | n/o |
| 315–425 | 1.5 | n/o | 1.6 | 0.7901 | 1.1 | n/o | 1.4 | n/o | 0.6 | n/o |
| 200–315 | 15.1 | 0.7415 | 14.8 | 0.7048 | 13.5 | 0.8989 | 13.6 | 0.9608 | 3.5 | 1.3943 |
| 160–200 | 18.5 | 0.7186 | 17.9 | 0.6559 | 16.9 | 0.8852 | 16.6 | 0.9585 | 4.0 | 1.4999 |
| 100–160 | 43.6 | 0.7127 | 39.6 | 0.6531 | 48.5 | 0.8789 | 38.7 | 0.9301 | 13.2 | 1.4121 |
| 75–100 | 11.2 | 0.7020 | 15.3 | 0.6488 | 13.3 | 0.8799 | 12.2 | 0.9293 | 11.4 | 1.6271 |
| <75 | 9.6 | 0.7305 | 10.4 | 0.6278 | 6.3 | 0.9347 | 16.3 | 0.9863 | 66.7 | 1.8580 |
| Grain Class | Raw Material | <0.8 g/cm3 | 0.8–0.9 g/cm3 | 0.9–1.0 g/cm3 | >1.0 g/cm3 | |||||
|---|---|---|---|---|---|---|---|---|---|---|
| Share % | Density g/cm3 | Share % | Density g/cm3 | Share % | Density g/cm3 | Share % | Density g/cm3 | Share % | Density g/cm3 | |
| >315 | 0.0 | n/o | 0.0 | n/o | 0.4 | n/o | 0.5 | n/o | 0.5 | n/o |
| 200–315 | 1.8 | n/o | 1.6 | 1.0009 | 4.9 | 1.0009 | 4.2 | 1.1505 | 2.6 | n/o |
| 160–200 | 6.2 | 0.7415 | 4.6 | 0.7889 | 11.1 | 0.9061 | 5.4 | 1.1622 | 3.5 | 1.5482 |
| 100–160 | 60.6 | 0.7186 | 57.6 | 0.7477 | 58.4 | 0.9724 | 41.0 | 1.3327 | 30.2 | 1.8644 |
| 75–100 | 16.0 | 0.7127 | 24.7 | 0.6987 | 16.2 | 1.0023 | 21.8 | 1.5177 | 21.6 | 1.8648 |
| 56–75 | 9.8 | 0.7020 | 8.9 | 0.7099 | 5.7 | 1.0325 | 11.9 | 1.6790 | 16.7 | 1.9754 |
| 40–56 | 4.7 | 0.7305 | 2.0 | 0.7099 | 2.8 | 1.0475 | 9.8 | 1.8997 | 15.3 | 2.1048 |
| <40 | 0.9 | 0.7305 | 0.2 | 0.7099 | 0.5 | n/o | 5.3 | 2.1861 | 9.6 | 2.2487 |
| Grain Class | Raw Material | <0.8 g/cm3 | ||
|---|---|---|---|---|
| Share % | Strength % | Share % | Strength % | |
| 315–425 | 1.5 | 70 | 1.6 | - |
| 200–315 | 15.1 | 52 | 14.8 | 57 |
| 160–200 | 18.5 | 36 | 17.9 | 41 |
| 100–160 | 43.6 | 27 | 36.9 | 30 |
| 75–100 | 11.2 | 26 | 15.3 | 24 |
| <75 | 9.6 | 37 | 10.4 | 26 |
| Grain Class | Raw Material | <0.8 g/cm3 | ||
|---|---|---|---|---|
| Share % | Strength % | Share % | Strength % | |
| >160 | 8.0 | 59 | 6.2 | 61 |
| 100–160 | 60.6 | 42 | 57.6 | 42 |
| 75–100 | 16.0 | 38 | 24.7 | 30 |
| <75 | 15.4 | 48 | 11.5 | 34 |
Disclaimer/Publisher’s Note: The statements, opinions and data contained in all publications are solely those of the individual author(s) and contributor(s) and not of MDPI and/or the editor(s). MDPI and/or the editor(s) disclaim responsibility for any injury to people or property resulting from any ideas, methods, instructions or products referred to in the content. |
© 2024 by the authors. Licensee MDPI, Basel, Switzerland. This article is an open access article distributed under the terms and conditions of the Creative Commons Attribution (CC BY) license (https://creativecommons.org/licenses/by/4.0/).
Share and Cite
Radko, T.; Wajda, A.; Iluk, T.; Najser, J. Investigation on the Correlation between Mechanical Strength, Grain Size, and Density of Fly Ash Microspheres in the Context of Refining Process. Materials 2024, 17, 3459. https://doi.org/10.3390/ma17143459
Radko T, Wajda A, Iluk T, Najser J. Investigation on the Correlation between Mechanical Strength, Grain Size, and Density of Fly Ash Microspheres in the Context of Refining Process. Materials. 2024; 17(14):3459. https://doi.org/10.3390/ma17143459
Chicago/Turabian StyleRadko, Tomasz, Agata Wajda, Tomasz Iluk, and Jan Najser. 2024. "Investigation on the Correlation between Mechanical Strength, Grain Size, and Density of Fly Ash Microspheres in the Context of Refining Process" Materials 17, no. 14: 3459. https://doi.org/10.3390/ma17143459
APA StyleRadko, T., Wajda, A., Iluk, T., & Najser, J. (2024). Investigation on the Correlation between Mechanical Strength, Grain Size, and Density of Fly Ash Microspheres in the Context of Refining Process. Materials, 17(14), 3459. https://doi.org/10.3390/ma17143459