
Mechanical and Antimicrobial Properties of the Graphene-Polyamide 6 Composite

 , , , , , and
Abstract
:1. Introduction
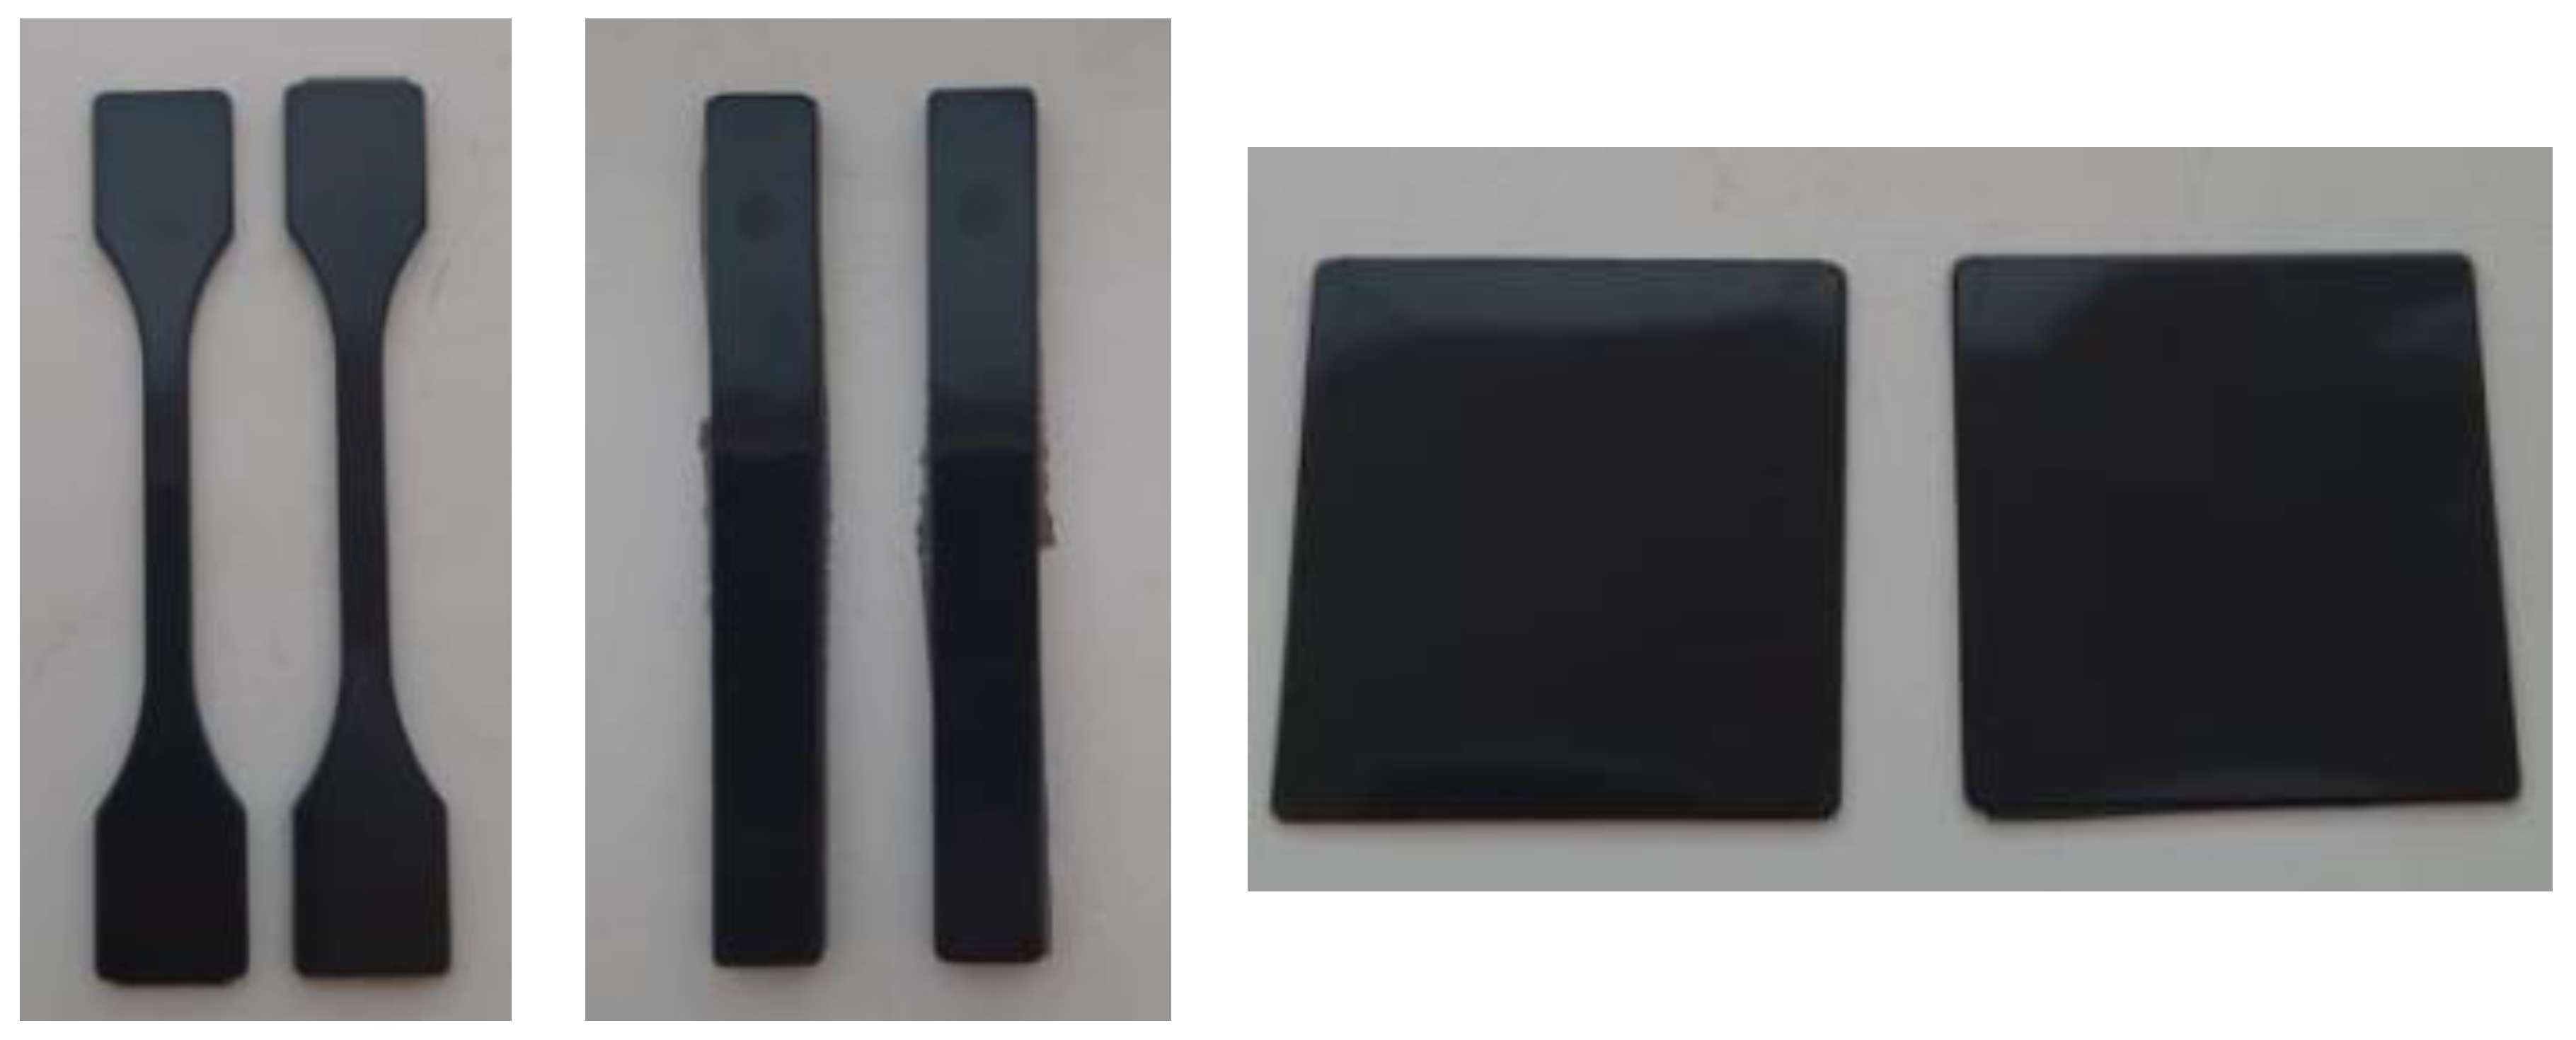
2. Experimental
2.1. Materials
2.2. Filler and Composite Characterization Methods
3. Results and Discussion
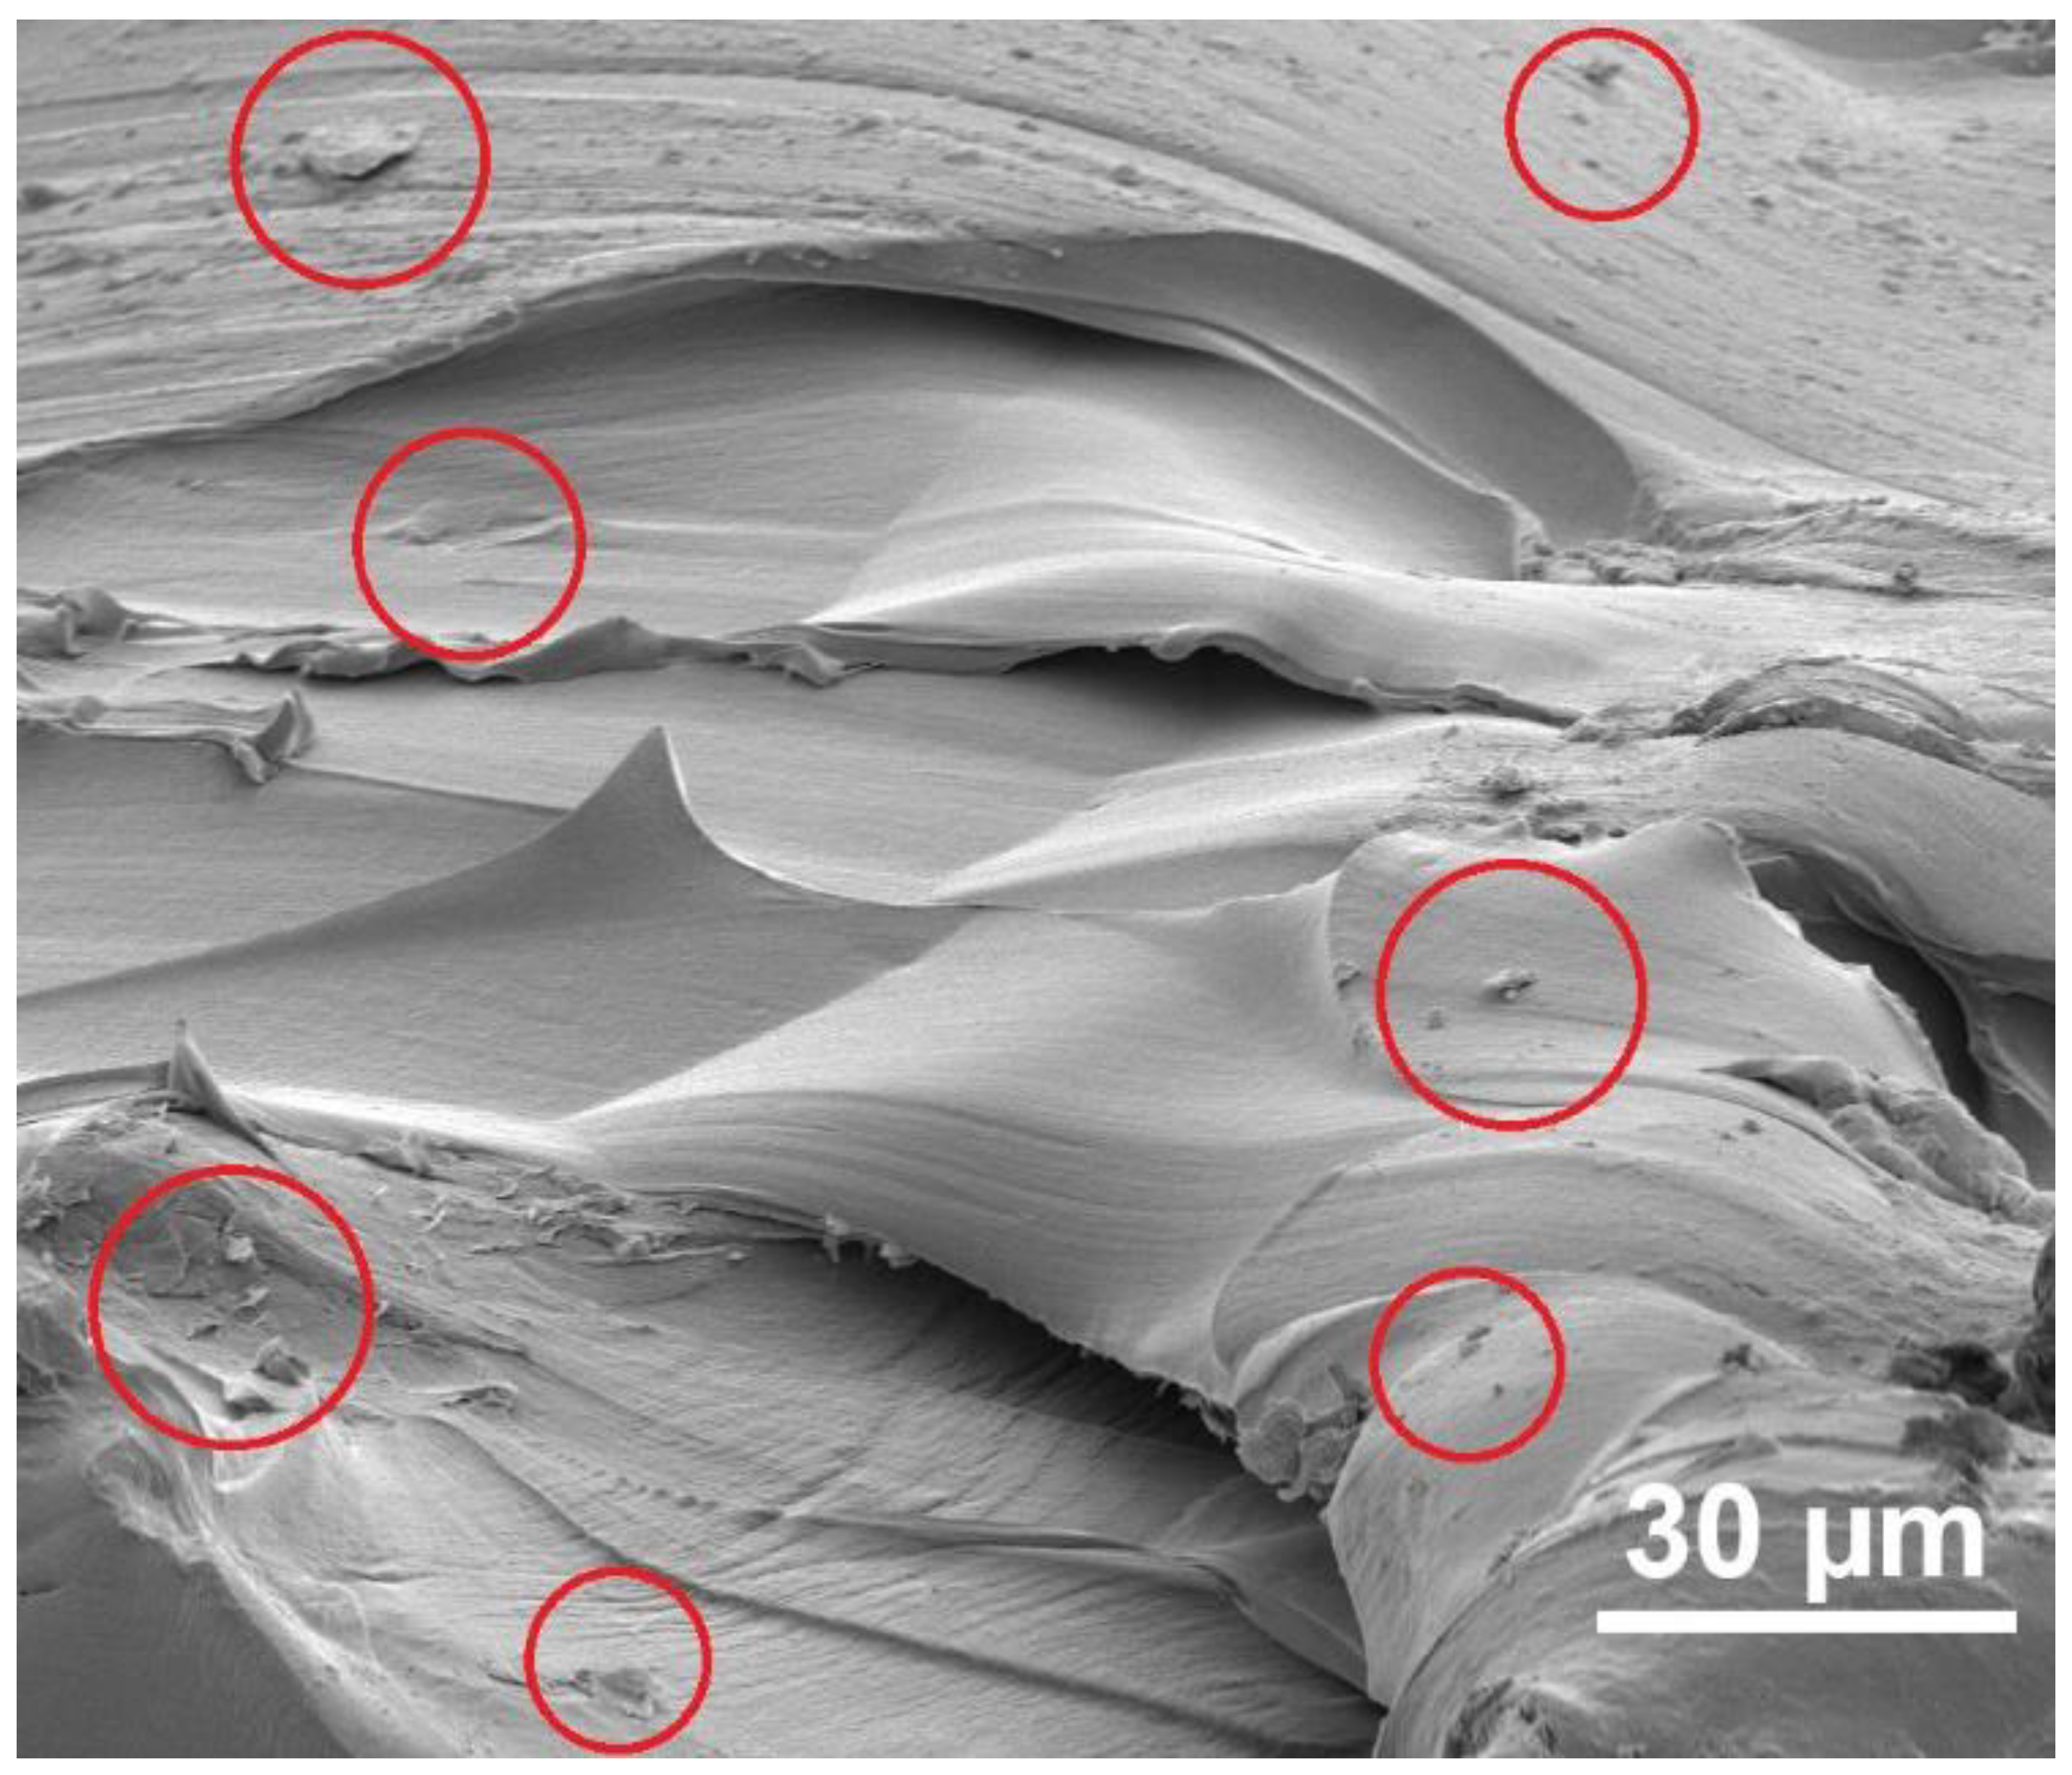
3.1. Structure and Morphology of the Graphene Flakes
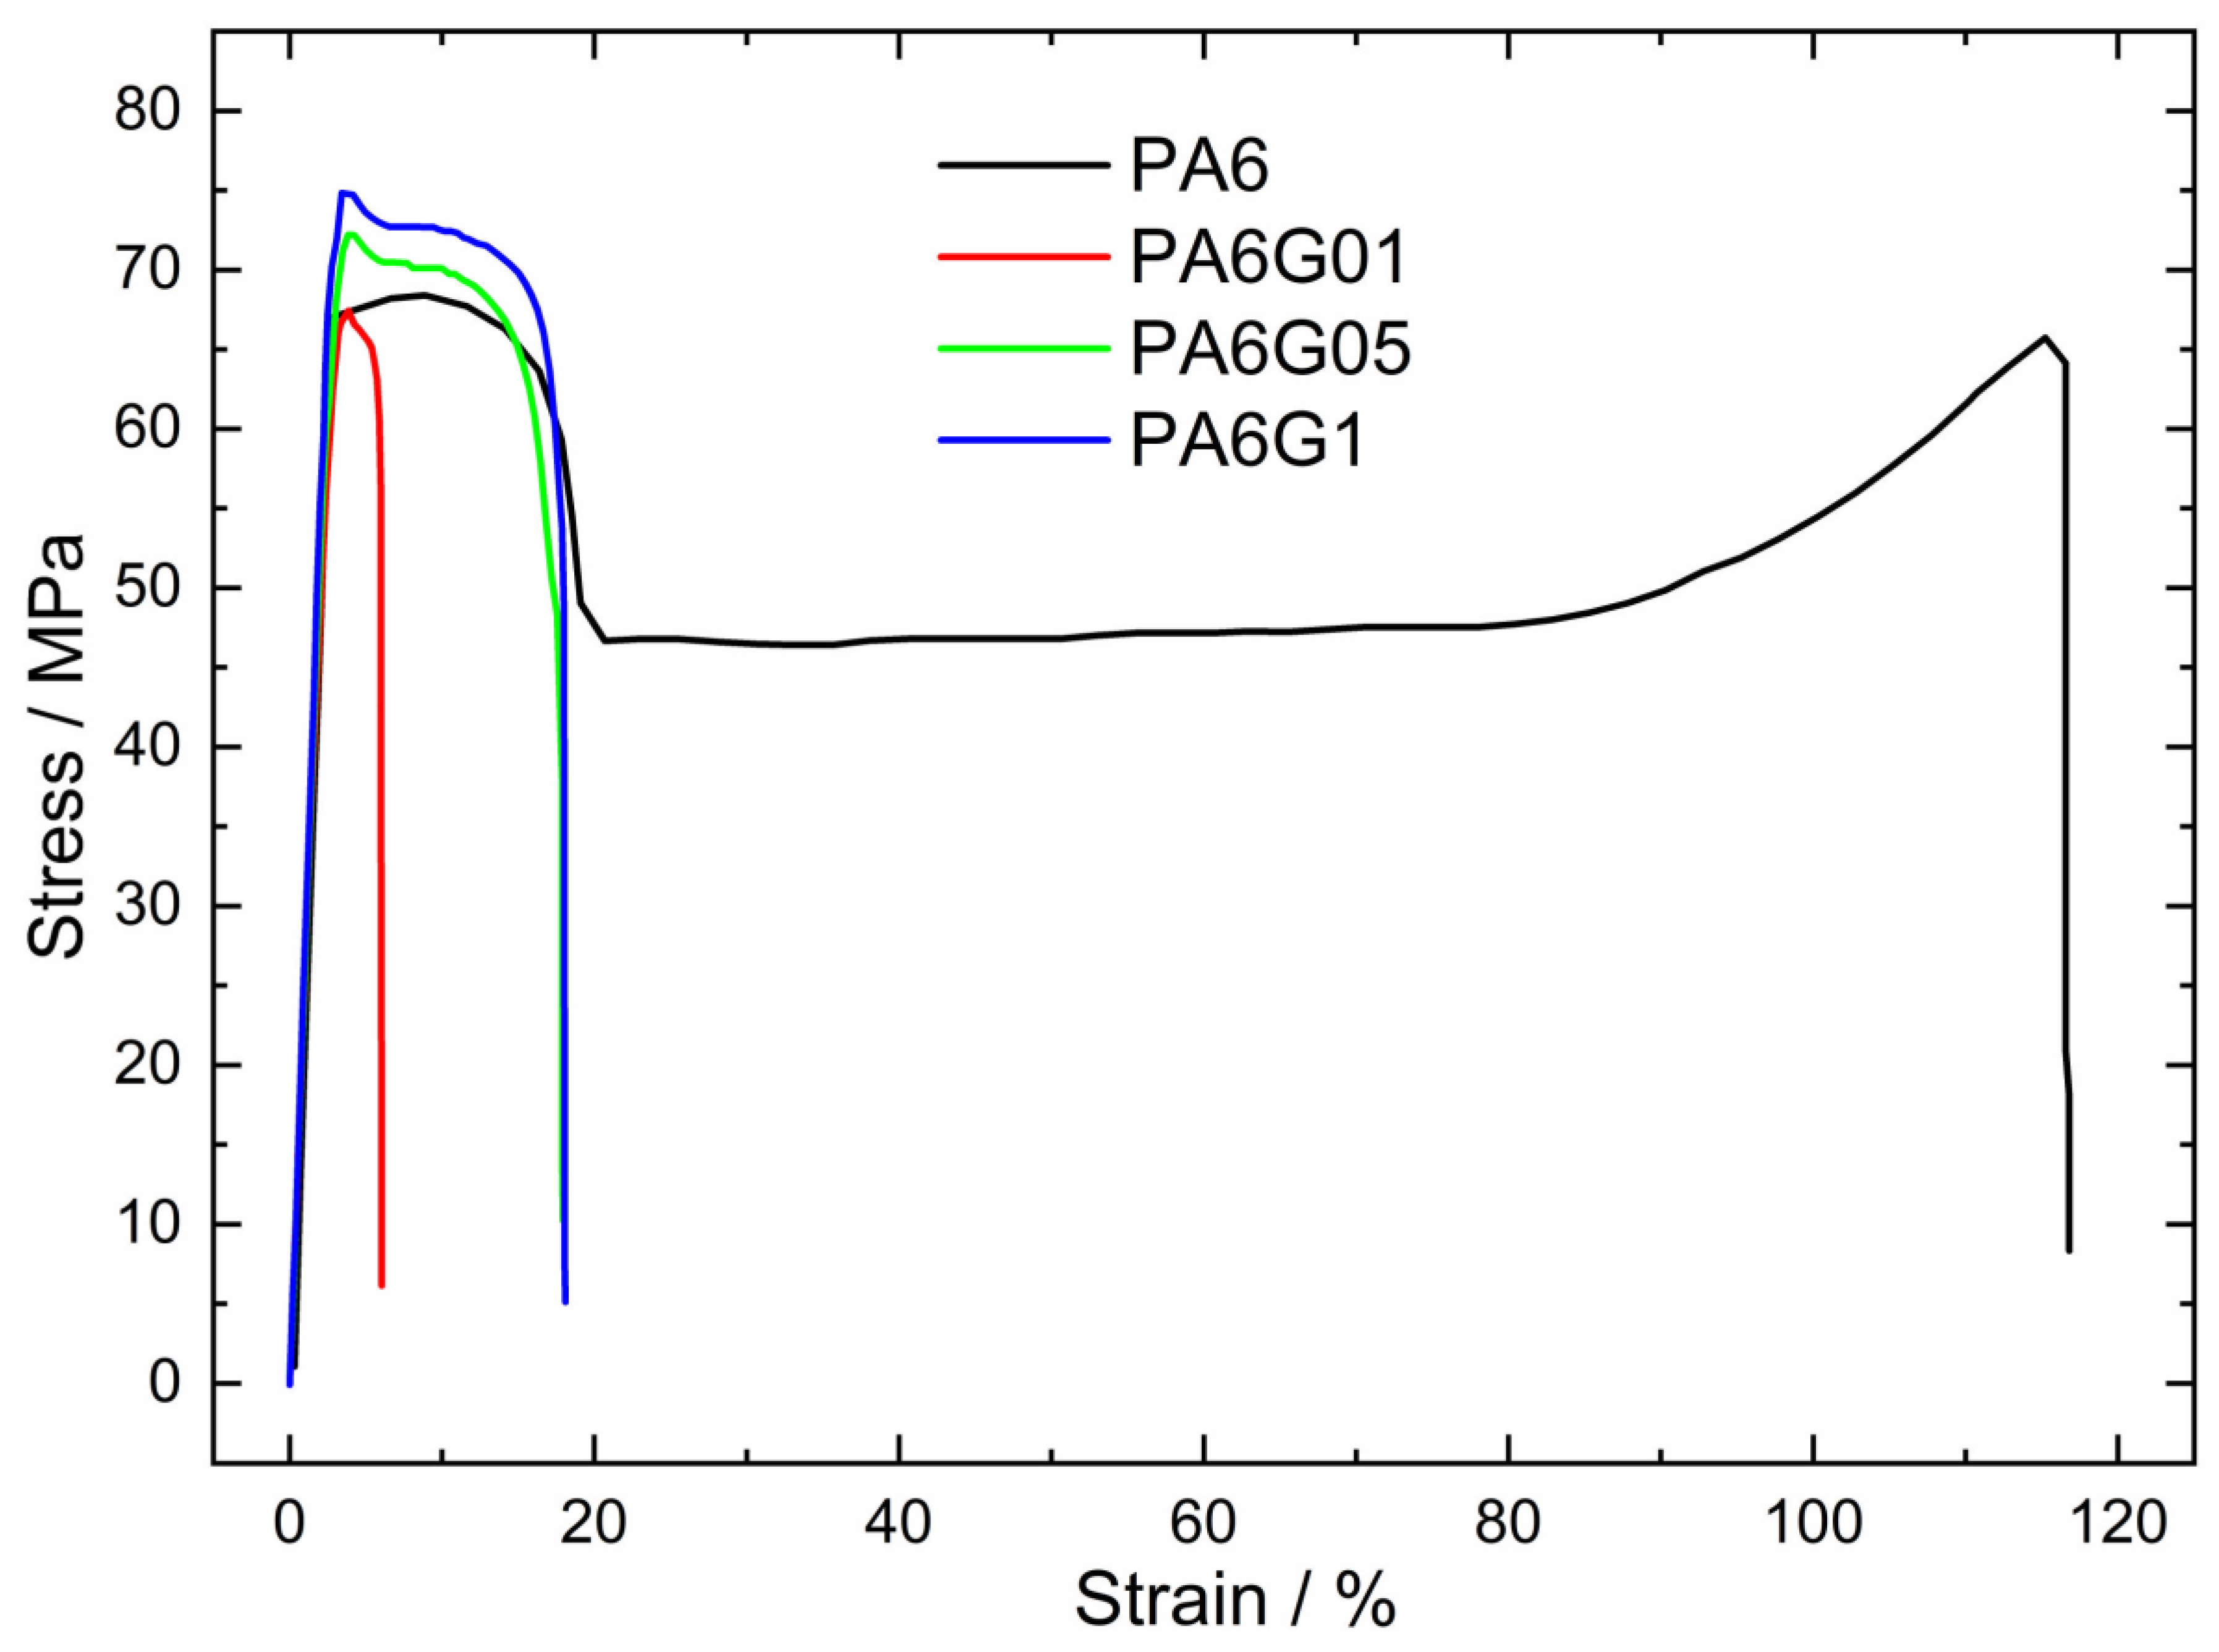
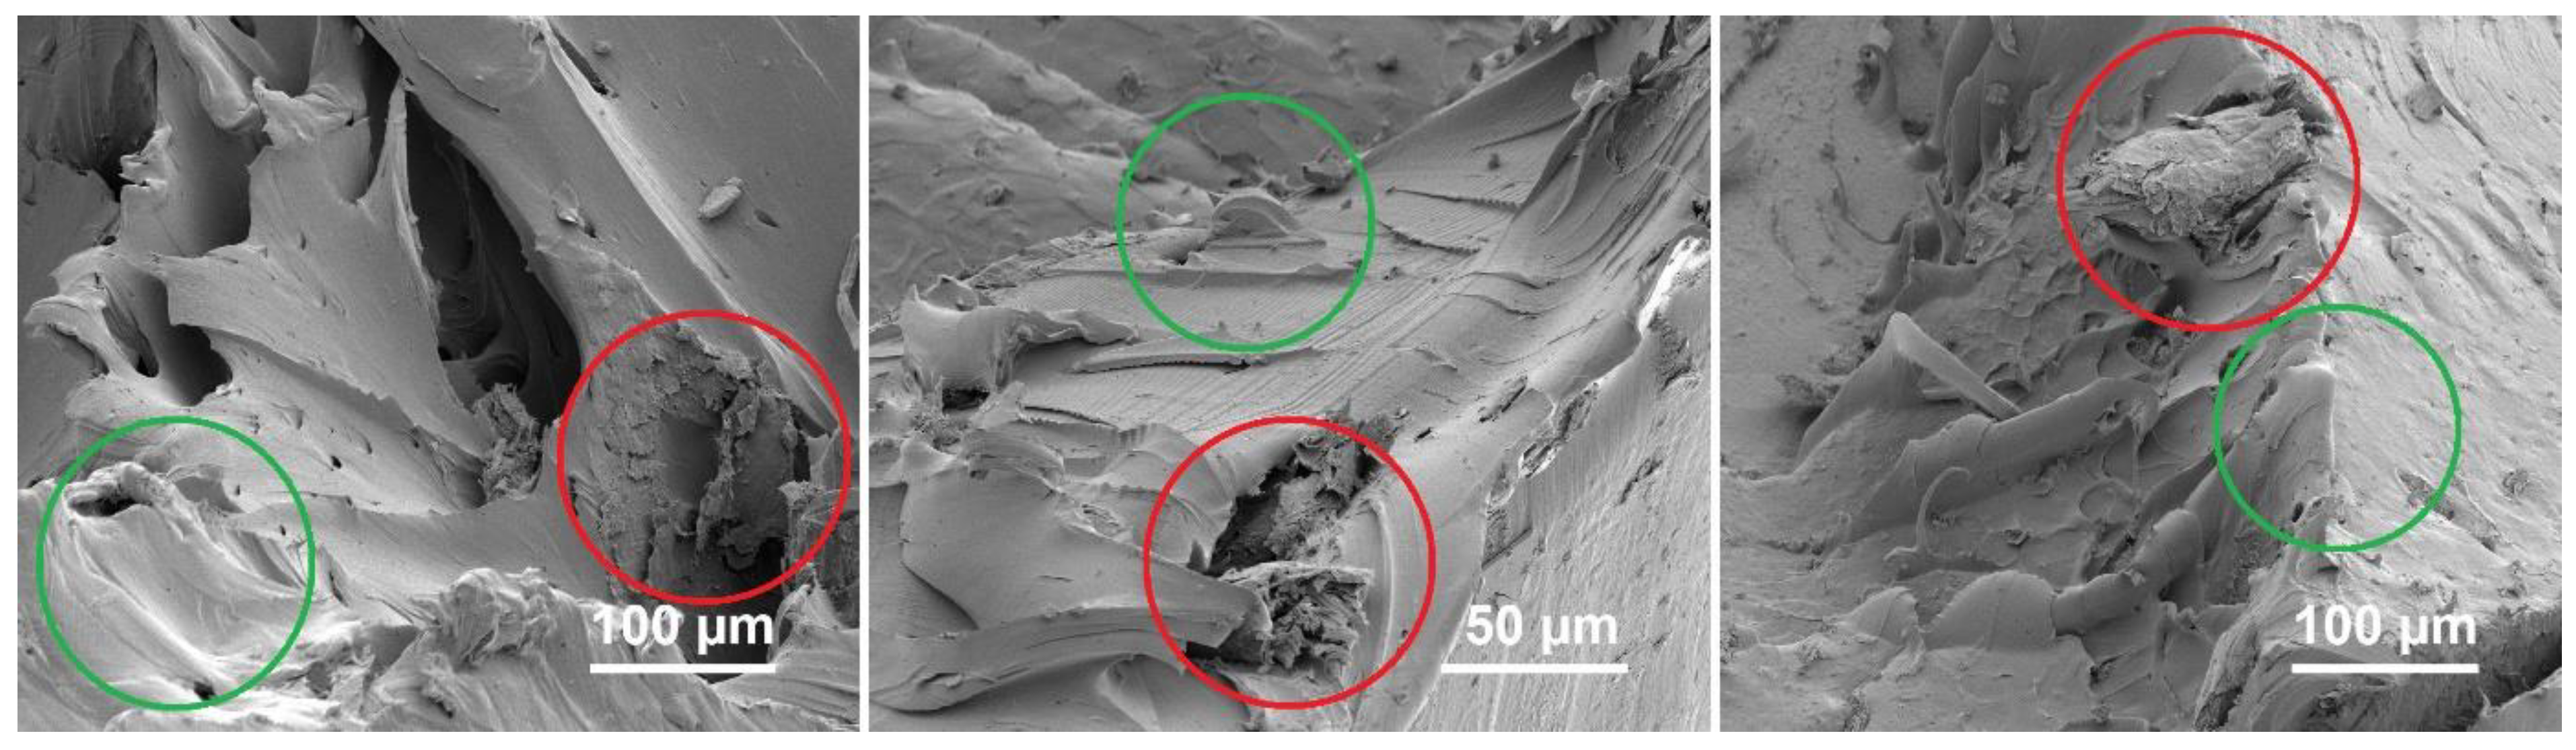
3.2. Mechanical Properties
3.3. Antimicrobial Properties
4. Conclusions
Author Contributions
Funding
Informed Consent Statement
Data Availability Statement
Conflicts of Interest
References
- Novoselov, K.S.; Geim, A.K.; Morozov, S.V.; Jiang, D.; Zhang, Y.; Dubonos, S.V.; Grigorieva, I.V.; Firsov, A.A. Electric Field Effect in Atomically Thin Carbon Films. Science 2004, 306, 666–669. [Google Scholar] [CrossRef] [PubMed]
- Wen, Y.; Liu, H.; Jiang, X. Preparation of Graphene by Exfoliation and Its Application in Lithium-Ion Batteries. J. Alloys Compd. 2023, 961, 170885. [Google Scholar] [CrossRef]
- Zhou, A.; Yu, T.; Liang, X.; Yin, S. H2O2-Free Strategy Derived from Hummers Method for Preparing Graphene Oxide with High Oxidation Degree. FlatChem 2023, 38, 100487. [Google Scholar] [CrossRef]
- Bahri, M.; Gebre, S.H.; Elaguech, M.A.; Dajan, F.T.; Sendeku, M.G.; Tlili, C.; Wang, D. Recent Advances in Chemical Vapour Deposition Techniques for Graphene-Based Nanoarchitectures: From Synthesis to Contemporary Applications. Coord. Chem. Rev. 2023, 475, 214910. [Google Scholar] [CrossRef]
- Sellathurai, A.J.; Mypati, S.; Kontopoulou, M.; Barz, D.P.J. High Yields of Graphene Nanoplatelets by Liquid Phase Exfoliation Using Graphene Oxide as a Stabilizer. Chem. Eng. J. 2023, 451, 138365. [Google Scholar] [CrossRef]
- Huo, Y.; Xiu, S.; Meng, L.Y.; Quan, B. Solvothermal Synthesis and Applications of Micro/Nano Carbons: A Review. Chem. Eng. J. 2023, 451, 138572. [Google Scholar] [CrossRef]
- Grabowska, A.; Kowalczyk, J.; Tomala, R.; Ptak, M.; Małecka, M.; Wędzyńska, A.; Stefanski, M.; Stręk, W.; Głuchowski, P. Optimization of the Electrochemical Method of Obtaining Graphene Nanoplatelets (GNPs). Materials 2023, 16, 2188. [Google Scholar] [CrossRef]
- Miao, J.; Fan, T. Flexible and Stretchable Transparent Conductive Graphene-Based Electrodes for Emerging Wearable Electronics. Carbon 2023, 202, 495–527. [Google Scholar] [CrossRef]
- Li, X.; Zheng, Q.; Li, C.; Liu, G.; Yang, Q.; Wang, Y.; Sun, P.; Tian, H.; Wang, C.; Chen, X.; et al. Bubble Up Induced Graphene Microspheres for Engineering Capacitive Energy Storage. Adv. Energy Mater. 2023, 13, 2203761. [Google Scholar] [CrossRef]
- Kong, M.; Yang, M.; Li, R.; Long, Y.Z.; Zhang, J.; Huang, X.; Cui, X.; Zhang, Y.; Said, Z.; Li, C. Graphene-Based Flexible Wearable Sensors: Mechanisms, Challenges, and Future Directions. Int. J. Adv. Manuf. Technol. 2023, 131, 1–33. [Google Scholar] [CrossRef]
- Tan, X.; Li, J.; Li, C.; Sebastián, D.; Kumar, S.; Prakash, J.; Verma, A.; Jasrotia, R.; Kandwal, A.; Verma, R.; et al. A Review on Properties and Environmental Applications of Graphene and Its Derivative-Based Composites. Catalysts 2023, 13, 111. [Google Scholar] [CrossRef]
- Kumar, R.; Sahoo, S.; Joanni, E.; Singh, R.K.; Tan, W.K.; Kar, K.K.; Matsuda, A. Recent Progress on Carbon-Based Composite Materials for Microwave Electromagnetic Interference Shielding. Carbon 2021, 177, 304–331. [Google Scholar] [CrossRef]
- Wazalwar, R.; Sahu, M.; Raichur, A.M. Mechanical Properties of Aerospace Epoxy Composites Reinforced with 2D Nano-Fillers: Current Status and Road to Industrialization. Nanoscale Adv. 2021, 3, 2741–2776. [Google Scholar] [CrossRef]
- Kwon, Y.J.; Park, J.B.; Jeon, Y.P.; Hong, J.Y.; Park, H.S.; Lee, J.U. A Review of Polymer Composites Based on Carbon Fillers for Thermal Management Applications: Design, Preparation, and Properties. Polymers 2021, 13, 1312. [Google Scholar] [CrossRef] [PubMed]
- Kasgoz, A.; Akin, D.; Ayten, A.I.; Durmus, A. Effect of Different Types of Carbon Fillers on Mechanical and Rheological Properties of Cyclic Olefin Copolymer (COC) Composites. Compos. B Eng. 2014, 66, 126–135. [Google Scholar] [CrossRef]
- Wu, M.L.; Chen, Y.; Zhang, L.; Zhan, H.; Qiang, L.; Wang, J.N. High-Performance Carbon Nanotube/Polymer Composite Fiber from Layer-by-Layer Deposition. ACS Appl. Mater. Interfaces 2016, 8, 8137–8144. [Google Scholar] [CrossRef] [PubMed]
- Miao, Y.; Chen, Q.; Li, Y.; Zhuo, D.; Wang, R. Tribological Properties of Carbon Nanotube/Polymer Composites:A Mini-Review. Front. Mater. 2023, 10, 1129676. [Google Scholar] [CrossRef]
- Kausar, A. Fullerene Reinforced Polymeric Nanocomposites for Energy Storage—Status and Prognoses. Front. Mater. 2022, 9, 874169. [Google Scholar] [CrossRef]
- Kausar, A. Epitome of Fullerene in Conducting Polymeric Nanocomposite—Fundamentals and Beyond. Polym.-Plast. Technol. Mater. 2023, 62, 618–631. [Google Scholar] [CrossRef]
- Blachowicz, T.; Ehrmann, G.; Ehrmann, A. Recent Developments in Additive Manufacturing of Conductive Polymer Composites. Macromol. Mater. Eng. 2023, 308, 2200692. [Google Scholar] [CrossRef]
- Yan, Y.; Jiang, Y.; Ng, E.L.L.; Zhang, Y.; Owh, C.; Wang, F.; Song, Q.; Feng, T.; Zhang, B.; Li, P.; et al. Progress and Opportunities in Additive Manufacturing of Electrically Conductive Polymer Composites. Mater. Today Adv. 2023, 17, 100333. [Google Scholar] [CrossRef]
- Vikram, K.; Bhaumik, S.; Pramanik, S. Effect of Graphite on Tribological and Mechanical Properties of PA6/5GF Composites. J. Therm. Anal. Calorim. 2023, 148, 3341–3355. [Google Scholar] [CrossRef]
- Praveen, P.; Vijoy, K.V.; Saji, K.J. Electrochemical Metallization in PDMS-Graphite Composite-Based Neuromorphic Memristor. Mater. Today Proc. 2023; in press. [Google Scholar] [CrossRef]
- Han, X.; Chen, T.; Zhao, Y.; Gao, J.; Sang, Y.; Xiong, H.; Chen, Z. Relationship between the Microstructure and Performance of Graphene/Polyethylene Composites Investigated by Positron Annihilation Lifetime Spectroscopy. Nanomaterials 2021, 11, 2990. [Google Scholar] [CrossRef] [PubMed]
- Kuilla, T.; Bhadra, S.; Yao, D.; Kim, N.H.; Bose, S.; Lee, J.H. Recent Advances in Graphene Based Polymer Composites. Prog. Polym. Sci. 2010, 35, 1350–1375. [Google Scholar] [CrossRef]
- Lukowiak, A.; Kedziora, A.; Strek, W. Antimicrobial Graphene Family Materials: Progress, Advances, Hopes and Fears. Adv. Colloid Interface Sci. 2016, 236, 101–112. [Google Scholar] [CrossRef]
- Cao, G.; Yan, J.; Ning, X.; Zhang, Q.; Wu, Q.; Bi, L.; Zhang, Y.; Han, Y.; Guo, J. Antibacterial and Antibiofilm Properties of Graphene and Its Derivatives. Colloids Surf. B Biointerfaces 2021, 200, 111588. [Google Scholar] [CrossRef] [PubMed]
- Cao, Y.C.; Wei, W.; Liu, J.; You, Q.; Liu, F.; Lan, Q.; Zhang, C.; Liu, C.; Zhao, J. The Preparation of Graphene Reinforced Poly(Vinyl Alcohol) Antibacterial Nanocomposite Thin Film. Int. J. Polym. Sci. 2015, 2015, 407043. [Google Scholar] [CrossRef]
- Arriagada, P.; Palza, H.; Palma, P.; Flores, M.; Caviedes, P. Poly(Lactic Acid) Composites Based on Graphene Oxide Particles with Antibacterial Behavior Enhanced by Electrical Stimulus and Biocompatibility. J. Biomed. Mater. Res. A 2018, 106, 1051–1060. [Google Scholar] [CrossRef]
- Yang, Z.; Sun, C.; Wang, L.; Chen, H.; He, J.; Chen, Y. Novel Poly(l-Lactide)/Graphene Oxide Films with Improved Mechanical Flexibility and Antibacterial Activity. J. Colloid Interface Sci. 2017, 507, 344–352. [Google Scholar] [CrossRef]
- Pan, N.; Liu, Y.; Fan, X.; Jiang, Z.; Ren, X.; Liang, J. Preparation and Characterization of Antibacterial Graphene Oxide Functionalized with Polymeric N-Halamine. J. Mater. Sci. 2017, 52, 1996–2006. [Google Scholar] [CrossRef]
- Tu, Y.; Lv, M.; Xiu, P.; Huynh, T.; Zhang, M.; Castelli, M.; Liu, Z.; Huang, Q.; Fan, C.; Fang, H.; et al. Destructive Extraction of Phospholipids from Escherichia Coli Membranes by Graphene Nanosheets. Nat. Nanotechnol. 2013, 8, 594–601. [Google Scholar] [CrossRef] [PubMed]
- Liu, S.; Zeng, T.H.; Hofmann, M.; Burcombe, E.; Wei, J.; Jiang, R.; Kong, J.; Chen, Y. Antibacterial Activity of Graphite, Graphite Oxide, Graphene Oxide, and Reduced Graphene Oxide: Membrane and Oxidative Stress. ACS Nano 2011, 5, 6971–6980. [Google Scholar] [CrossRef] [PubMed]
- Akhavan, O.; Ghaderi, E. Toxicity of Graphene and Graphene Oxide Nanowalls against Bacteria. ACS Nano 2010, 4, 5731–5736. [Google Scholar] [CrossRef] [PubMed]
- Mao, H.Y.; Laurent, S.; Chen, W.; Akhavan, O.; Imani, M.; Ashkarran, A.A.; Mahmoudi, M. Graphene: Promises, Facts, Opportunities, and Challenges in Nanomedicine. Chem. Rev. 2013, 113, 3407–3424. [Google Scholar] [CrossRef] [PubMed]
- Dallavalle, M.; Calvaresi, M.; Bottoni, A.; Melle-Franco, M.; Zerbetto, F. Graphene Can Wreak Havoc with Cell Membranes. ACS Appl. Mater. Interfaces 2015, 7, 4406–4414. [Google Scholar] [CrossRef] [PubMed]
- Shahnawaz Khan, M.; Abdelhamid, H.N.; Wu, H.F. Near Infrared (NIR) Laser Mediated Surface Activation of Graphene Oxide Nanoflakes for Efficient Antibacterial, Antifungal and Wound Healing Treatment. Colloids Surf. B Biointerfaces 2015, 127, 281–291. [Google Scholar] [CrossRef]
- O’Neill, A.; Bakirtzis, D.; Dixon, D. Polyamide 6/Graphene Composites: The Effect of in Situ Polymerisation on the Structure and Properties of Graphene Oxide and Reduced Graphene Oxide. Eur. Polym. J. 2014, 59, 353–362. [Google Scholar] [CrossRef]
- Li, L.L.; Chen, S.H.; Ma, W.J.; Cheng, Y.H.; Tao, Y.P.; Wu, T.Z.; Chen, W.P.; Zhou, Z.; Zhu, M.F. A Novel Reduced Graphene Oxide Decorated with Halloysite Nanotubes (HNTs-d-RGO) Hybrid Composite and Its Flame-Retardant Application for Polyamide 6. Express Polym. Lett. 2014, 8, 450–457. [Google Scholar] [CrossRef]
- Cai, Y.; Huang, F.; Wei, Q.; Song, L.; Hu, Y.; Ye, Y.; Xu, Y.; Gao, W. Structure, Morphology, Thermal Stability and Carbonization Mechanism Studies of Electrospun PA6/Fe-OMT Nanocomposite Fibers. Polym. Degrad. Stab. 2008, 93, 2180–2185. [Google Scholar] [CrossRef]
- Fu, X.; Zhao, X.; Li, L.; Zhou, C.; Dong, X.; Wang, D.; Yang, G. Graphene/Polyamide-6 Microsphere Composites with High Electrical and Mechanical Performance. Compos. Part C Open Access 2020, 2, 100043. [Google Scholar] [CrossRef]
- Zhang, X.; Fan, X.; Li, H.; Yan, C. Facile Preparation Route for Graphene Oxide Reinforced Polyamide 6 Composites via in Situ Anionic Ring-Opening Polymerization. J. Mater. Chem. 2012, 22, 24081–24091. [Google Scholar] [CrossRef]
- Zhu, S.; Luo, F.; Zhu, B.; Wang, G.X. Toxicological Effects of Graphene Oxide on Saccharomyces Cerevisiae. Toxicol. Res. 2017, 6, 535–543. [Google Scholar] [CrossRef]
- Lee, K.P.M.; Brandt, M.; Shanks, R.; Daver, F. Rheology and 3D Printability of Percolated Graphene–Polyamide-6 Composites. Polymers 2020, 12, 2014. [Google Scholar] [CrossRef]
- Ichakpa, M.; Goodyear, M.; Duthie, J.; Duthie, M.; Wisely, R.; MacPherson, A.; Keyte, J.; Pancholi, K.; Njuguna, J. Investigation on Mechanical and Thermal Properties of 3D-Printed Polyamide 6, Graphene Oxide and Glass-Fibre-Reinforced Composites under Dry, Wet and High Temperature Conditions. J. Compos. Sci. 2023, 7, 227. [Google Scholar] [CrossRef]
- Chong, H.M.; Hinder, S.J.; Taylor, A.C. Graphene Nanoplatelet-Modified Epoxy: Effect of Aspect Ratio and Surface Functionality on Mechanical Properties and Toughening Mechanisms. J. Mater. Sci. 2016, 51, 8764–8790. [Google Scholar] [CrossRef]
- Faghihi, M.; Shojaei, A.; Bagheri, R. Characterization of Polyamide 6/Carbon Nanotube Composites Prepared by Melt Mixing-Effect of Matrix Molecular Weight and Structure. Compos. B Eng. 2015, 78, 50–64. [Google Scholar] [CrossRef]
- Bartczak, N.; Kowalczyk, J.; Tomala, R.; Stefanski, M.; Szymański, D.; Ptak, M.; Stręk, W.; Szustakiewicz, K.; Kurzynowski, T.; Szczepański, Ł.; et al. Effect of the Addition of Graphene Flakes on the Physical and Biological Properties of Composite Paints. Molecules 2023, 28, 6173. [Google Scholar] [CrossRef]
- Gurunathan, S.; Han, J.W.; Abdal Dayem, A.; Eppakayala, V.; Kim, J.H. Oxidative Stress-Mediated Antibacterial Activity of Graphene Oxide and Reduced Graphene Oxide in Pseudomonas aeruginosa. Int. J. Nanomed. 2012, 7, 5901–5914. [Google Scholar] [CrossRef]
- Kumar, P.; Huo, P.; Zhang, R.; Liu, B. Antibacterial Properties of Graphene-Based Nanomaterials. Nanomaterials 2019, 9, 737. [Google Scholar] [CrossRef] [PubMed]


| Sample | Average Modulus of Elasticity | Modulus of Elasticity Standard Deviation | Average Tensile Strength | Tensile Strength Standard Deviation | Average Tensile Stress at Failure | Tensile Stress at Failure Standard Deviation | Average Maximum Load | Maximum Load Standard Deviation | Average Deformation at Maximum Load | Deformation at Maximum Load Standard Deviation | Average Strain at Failure | Strain at Failure Standard Deviation |
|---|---|---|---|---|---|---|---|---|---|---|---|---|
| MPa | MPa | MPa | N | % | % | |||||||
| PA6 | 2560 | 193 | 69.4 | 0.7 | 59.0 | 3.8 | 555.3 | 5.8 | 5.47 | 2.9 | 108.0 | 10.0 |
| PA6 + 0.1 wt-% graphene | 2560 | 106 | 66.7 | 2.1 | 57.1 | 7.0 | 533.6 | 17.1 | 3.71 | 0.2 | 5.76 | 0.6 |
| PA6 + 0.5 wt-% graphene | 2680 | 131 | 72.0 | 1.6 | 45.3 | 1.5 | 575.8 | 13.0 | 3.91 | 0.2 | 17.1 | 1.4 |
| PA6 + 1 wt-% graphene | 3020 | 80 | 77.5 | 1.6 | 50.8 | 3.5 | 619.9 | 13.1 | 3.82 | 0.1 | 17.2 | 1.2 |
| Sample | Average Energy | Energy Standard Deviation | Average Impact Toughness | Impact Toughness Standard Deviation |
|---|---|---|---|---|
| J | ||||
| PA6 | 0.277 | 0.019 | 8.661 | 0.592 |
| PA6 + 0.1 wt-% graphene | 0.141 | 0.006 | 4.411 | 0.186 |
| PA6 + 0.5 wt-% graphene | 0.178 | 0.020 | 5.565 | 0.622 |
| PA6 + 1 wt-% graphene | 0.128 | 0.019 | 3.983 | 0.584 |
Disclaimer/Publisher’s Note: The statements, opinions and data contained in all publications are solely those of the individual author(s) and contributor(s) and not of MDPI and/or the editor(s). MDPI and/or the editor(s) disclaim responsibility for any injury to people or property resulting from any ideas, methods, instructions or products referred to in the content. |
© 2024 by the authors. Licensee MDPI, Basel, Switzerland. This article is an open access article distributed under the terms and conditions of the Creative Commons Attribution (CC BY) license (https://creativecommons.org/licenses/by/4.0/).
Share and Cite
Głuchowski, P.; Macieja, M.; Tomala, R.; Stefanski, M.; Stręk, W.; Ptak, M.; Szymański, D.; Szustakiewicz, K.; Junka, A.; Dudek, B. Mechanical and Antimicrobial Properties of the Graphene-Polyamide 6 Composite. Materials 2024, 17, 3465. https://doi.org/10.3390/ma17143465
Głuchowski P, Macieja M, Tomala R, Stefanski M, Stręk W, Ptak M, Szymański D, Szustakiewicz K, Junka A, Dudek B. Mechanical and Antimicrobial Properties of the Graphene-Polyamide 6 Composite. Materials. 2024; 17(14):3465. https://doi.org/10.3390/ma17143465
Chicago/Turabian StyleGłuchowski, Paweł, Marta Macieja, Robert Tomala, Mariusz Stefanski, Wiesław Stręk, Maciej Ptak, Damian Szymański, Konrad Szustakiewicz, Adam Junka, and Bartłomiej Dudek. 2024. "Mechanical and Antimicrobial Properties of the Graphene-Polyamide 6 Composite" Materials 17, no. 14: 3465. https://doi.org/10.3390/ma17143465