
Strength Recovery of Thermally Damaged High-Performance Concrete during Recuring

Abstract
:1. Introduction
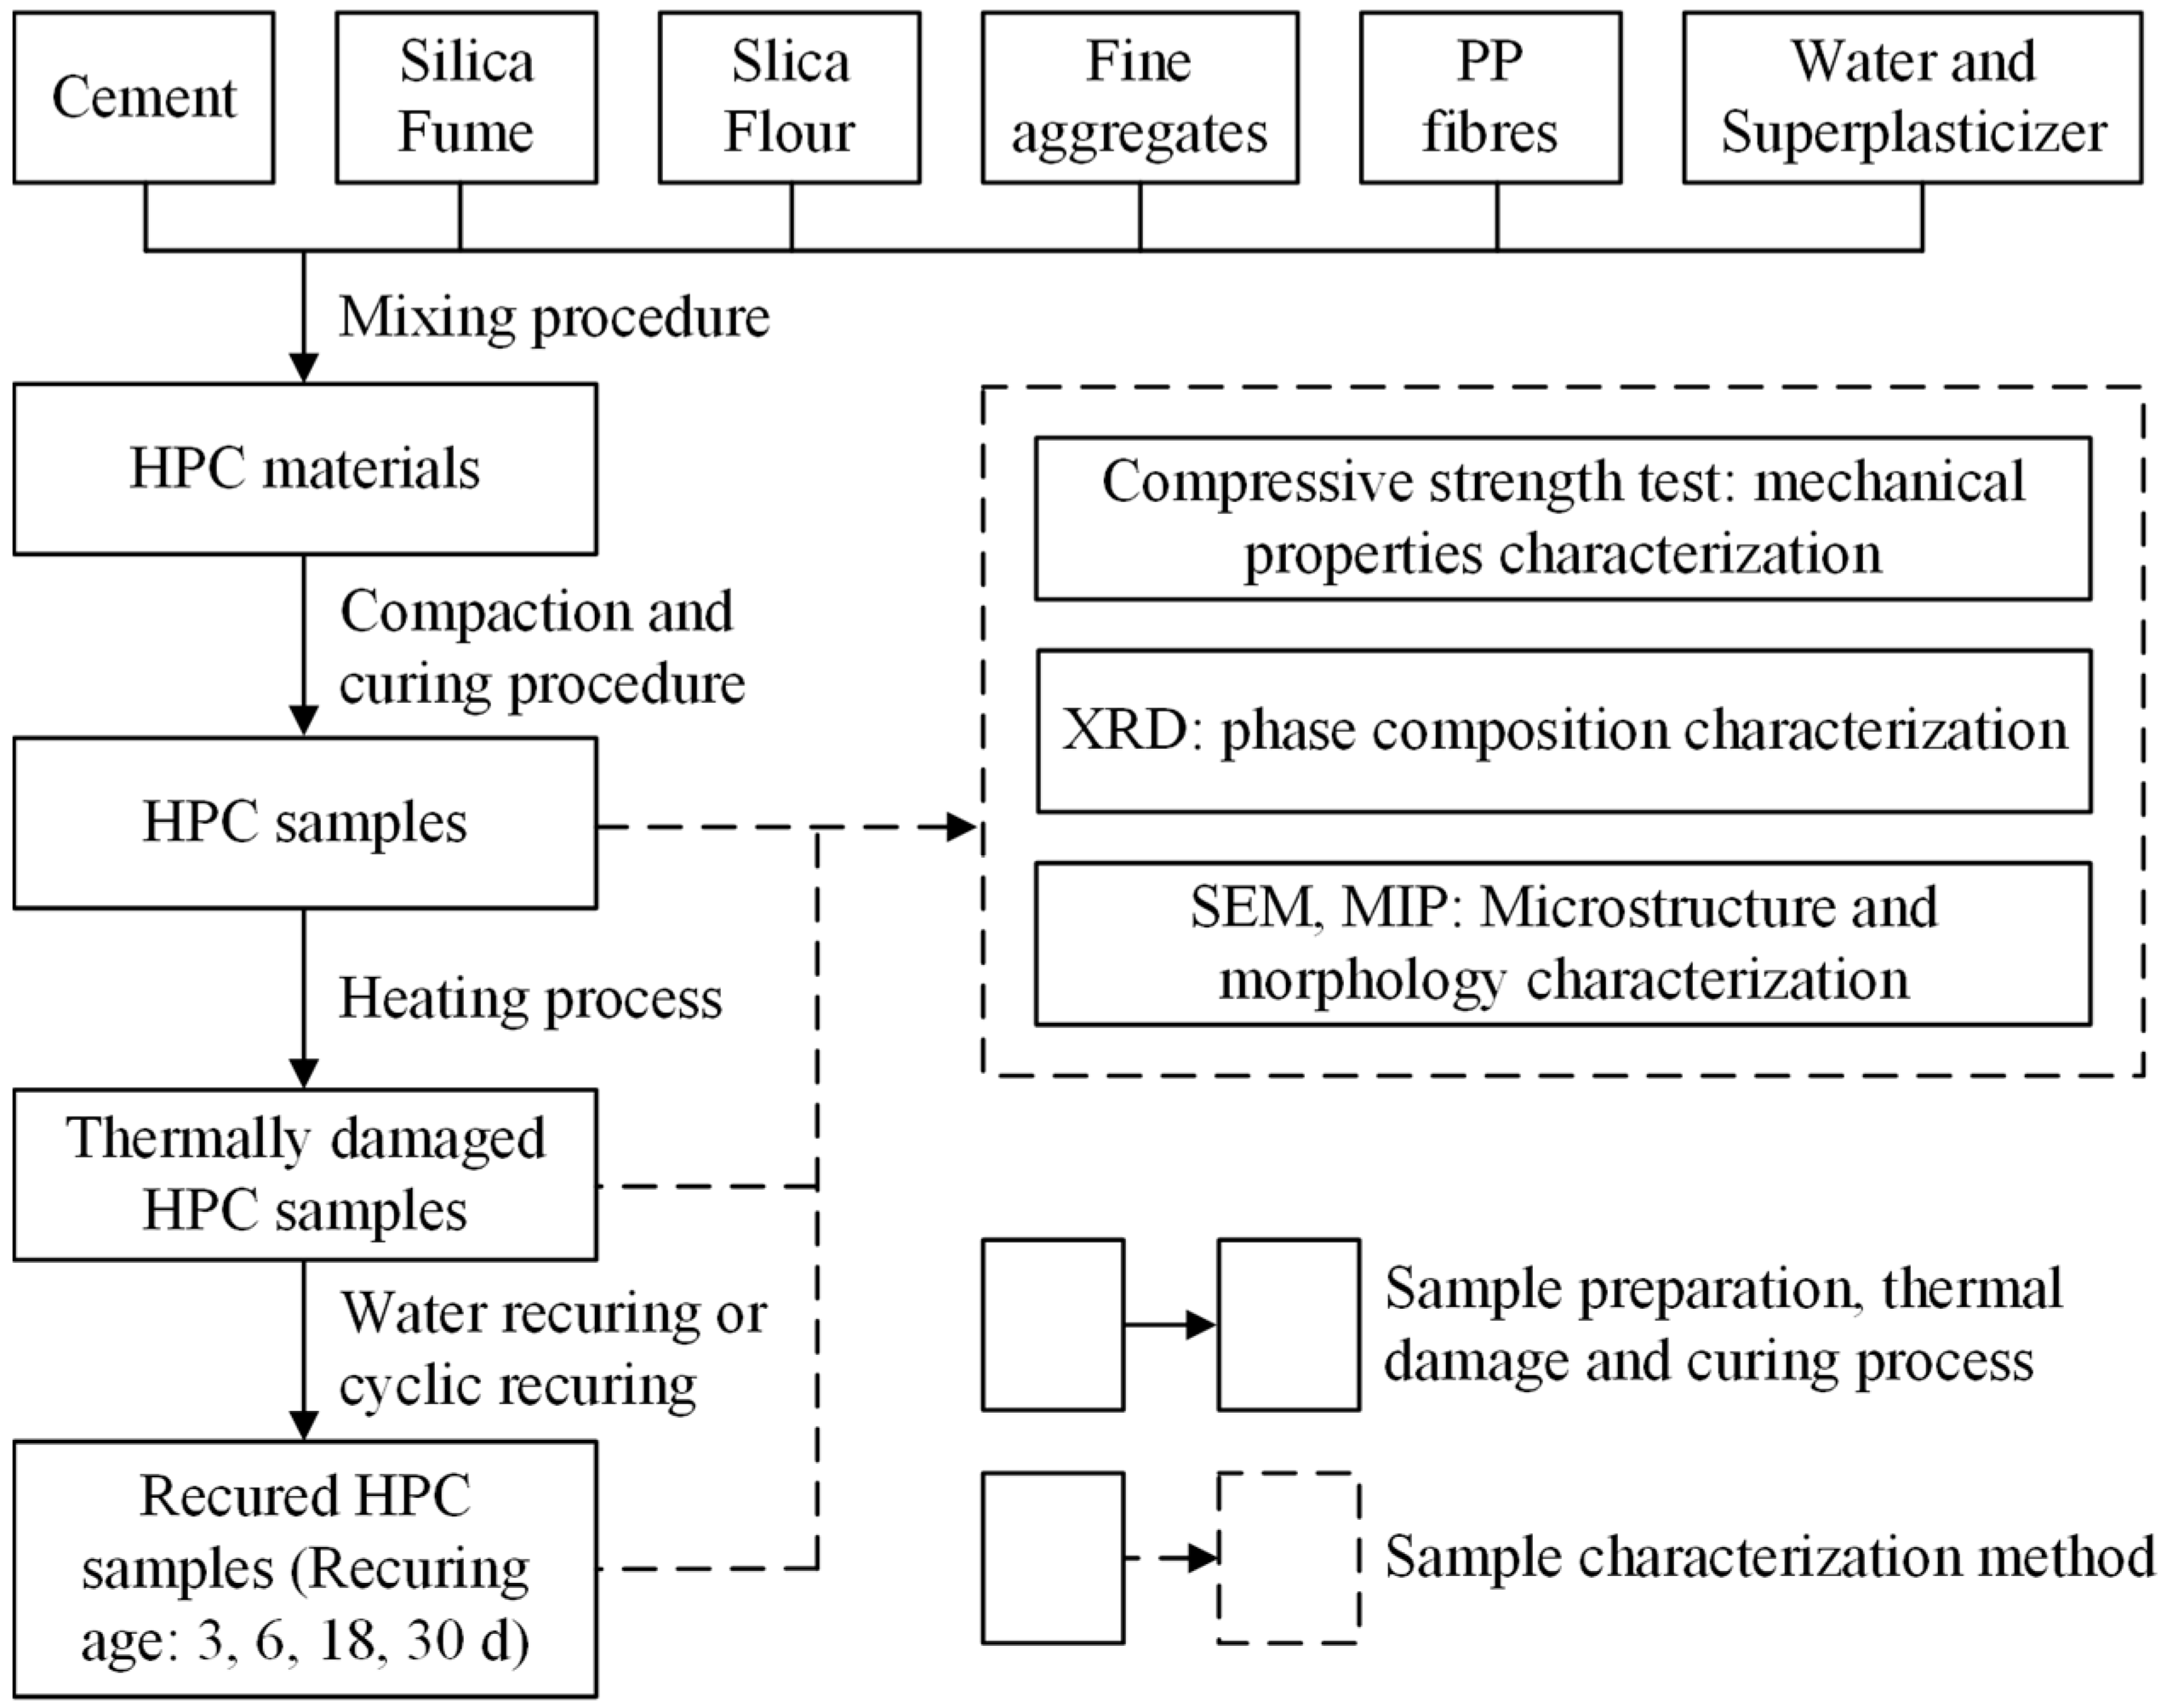
2. Materials and Methods
2.1. Materials and Sample Preparation
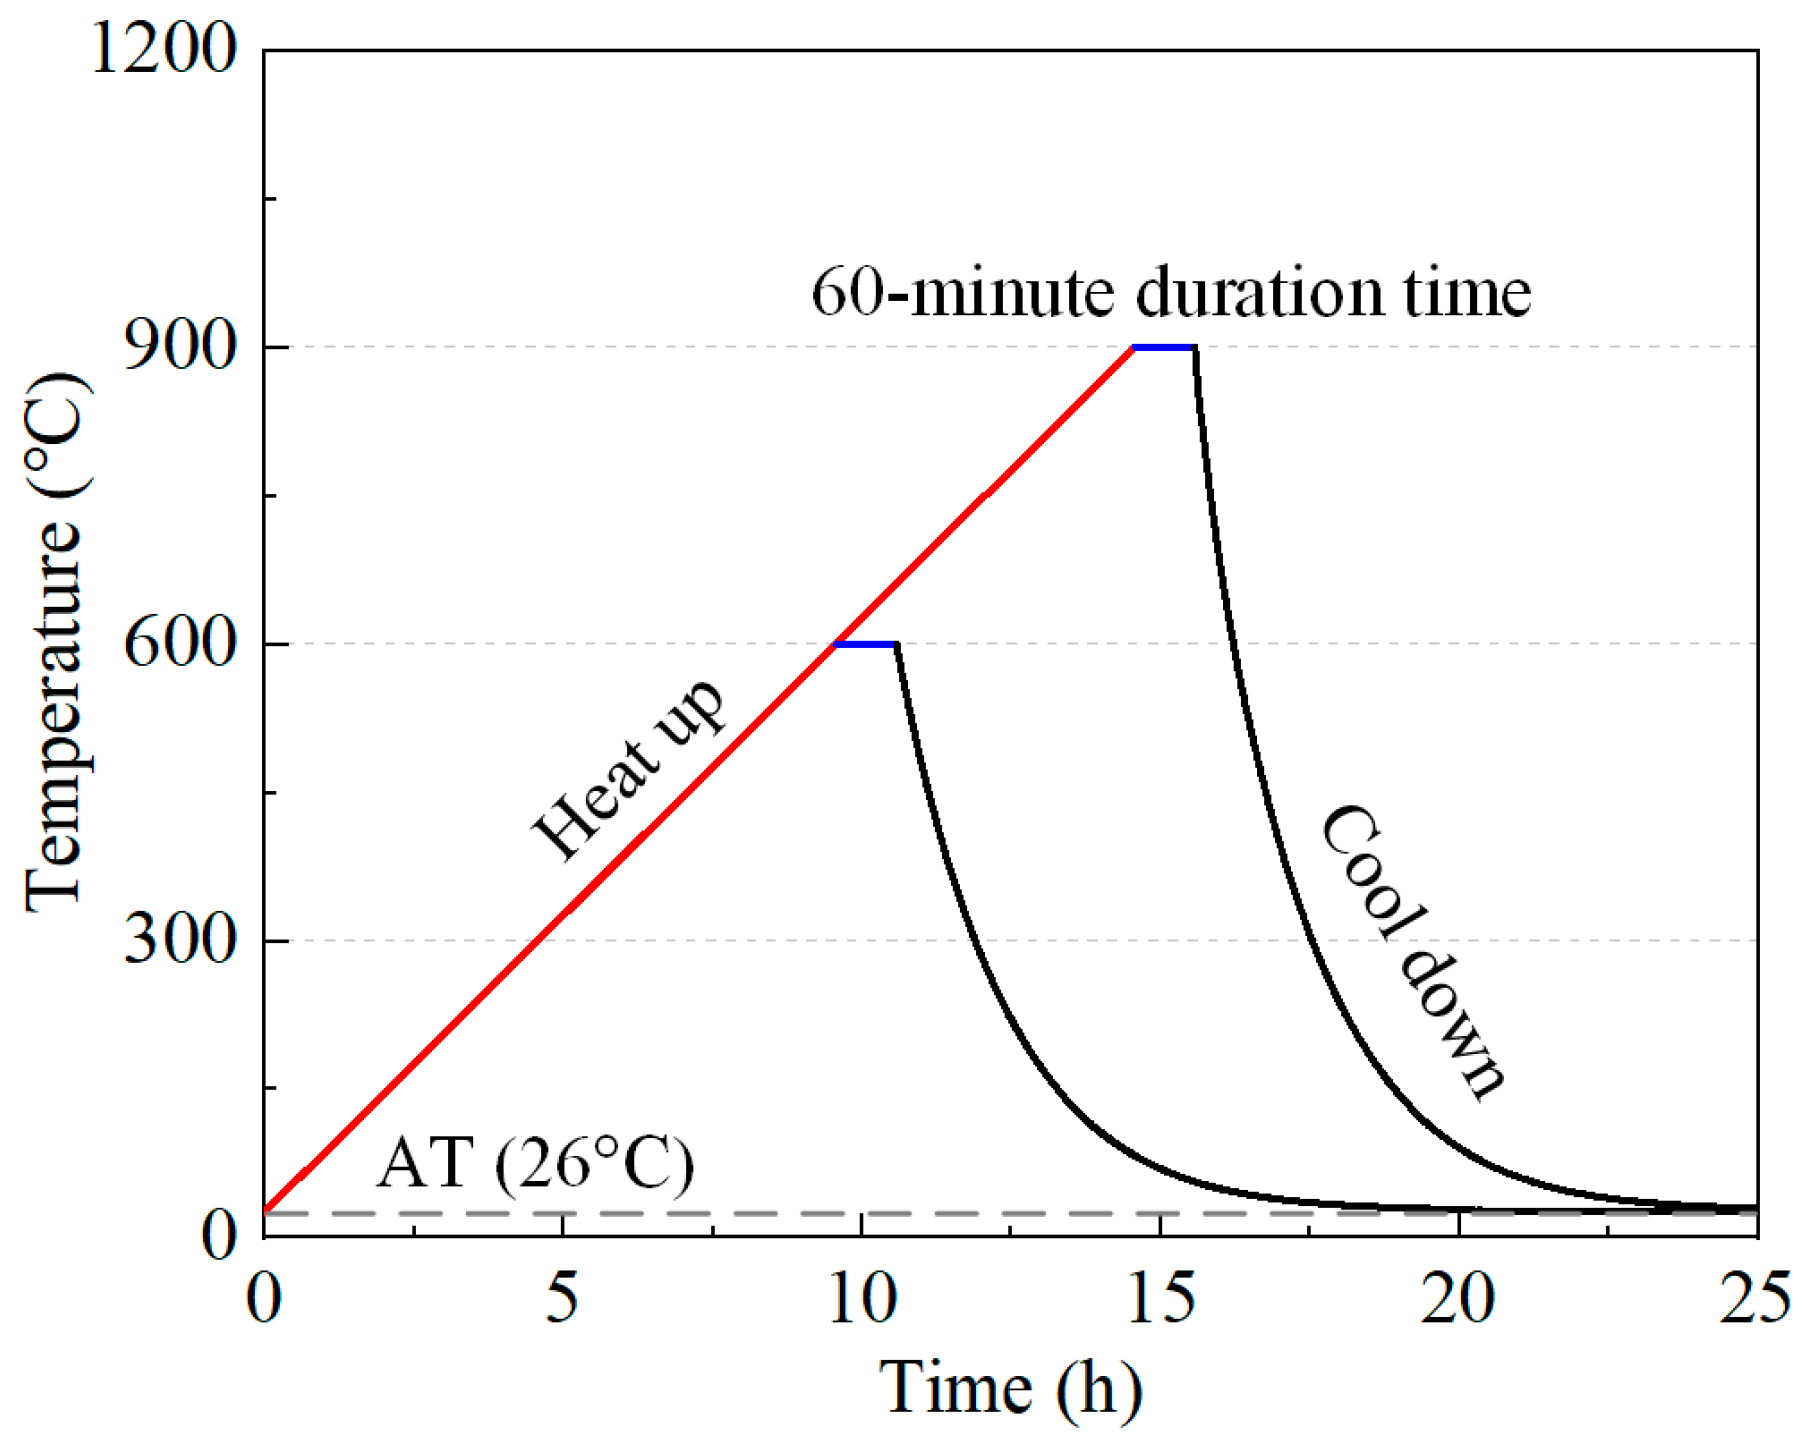
2.2. Heating and Recuring Regimes
2.3. Characterization Methods
2.3.1. Compressive Strength
2.3.2. X-ray Diffraction
2.3.3. Scanning Electron Microscopy
2.3.4. Mercury Intrusion Porosimetry
3. Results and Discussion
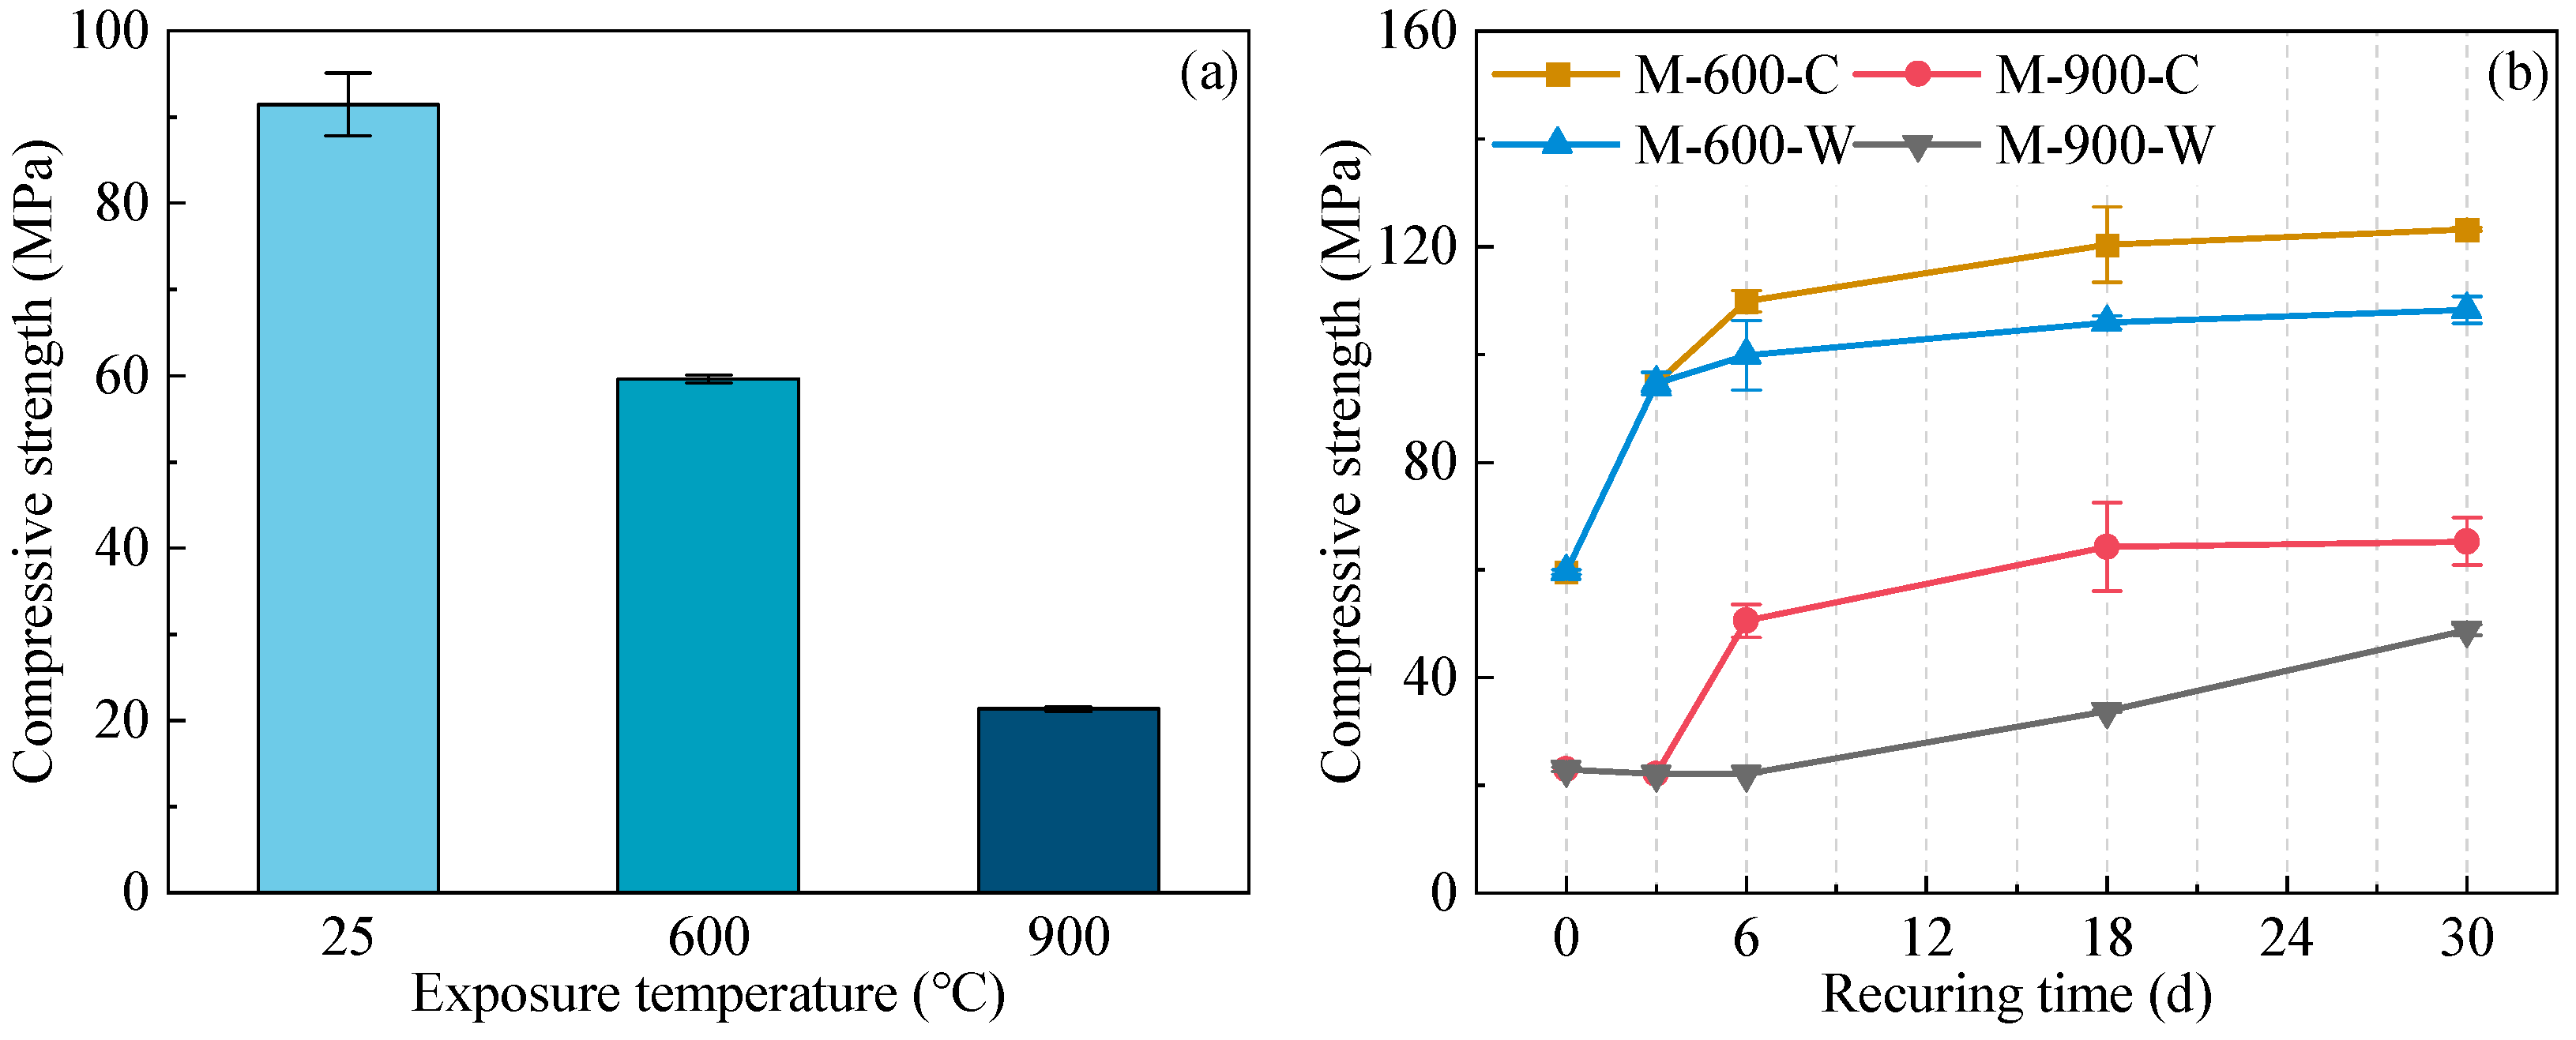
3.1. Compressive Strength
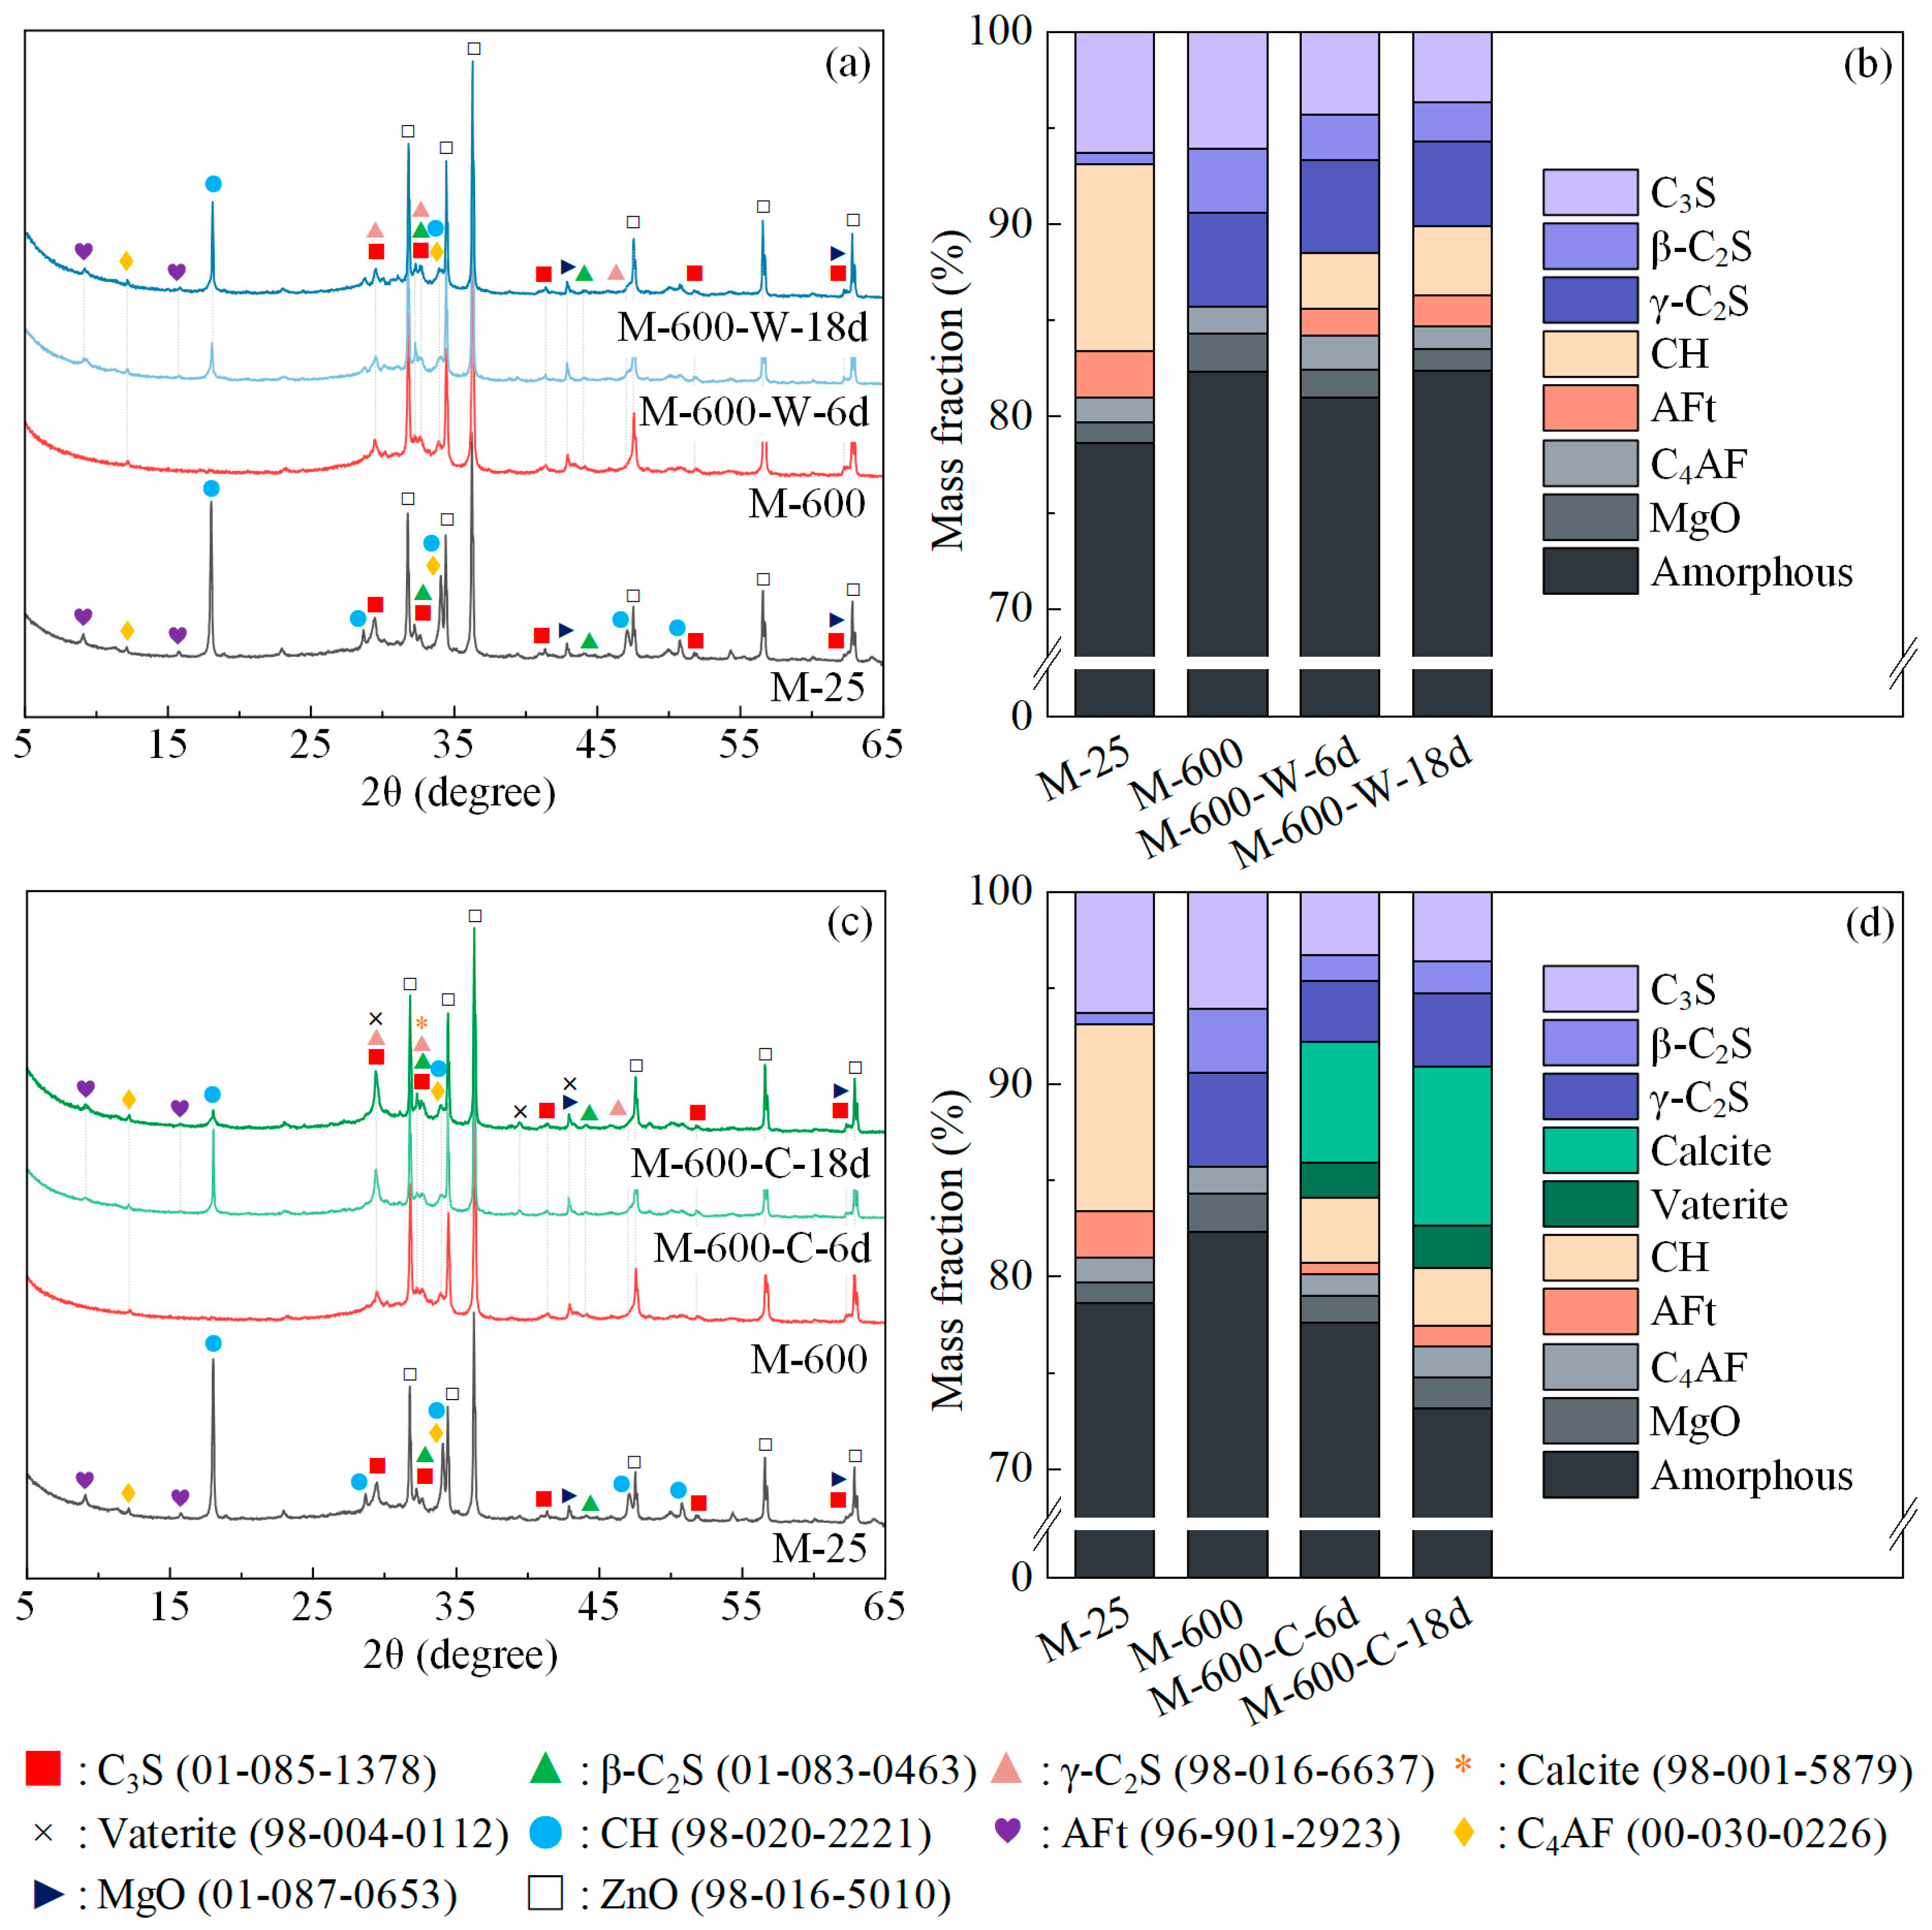
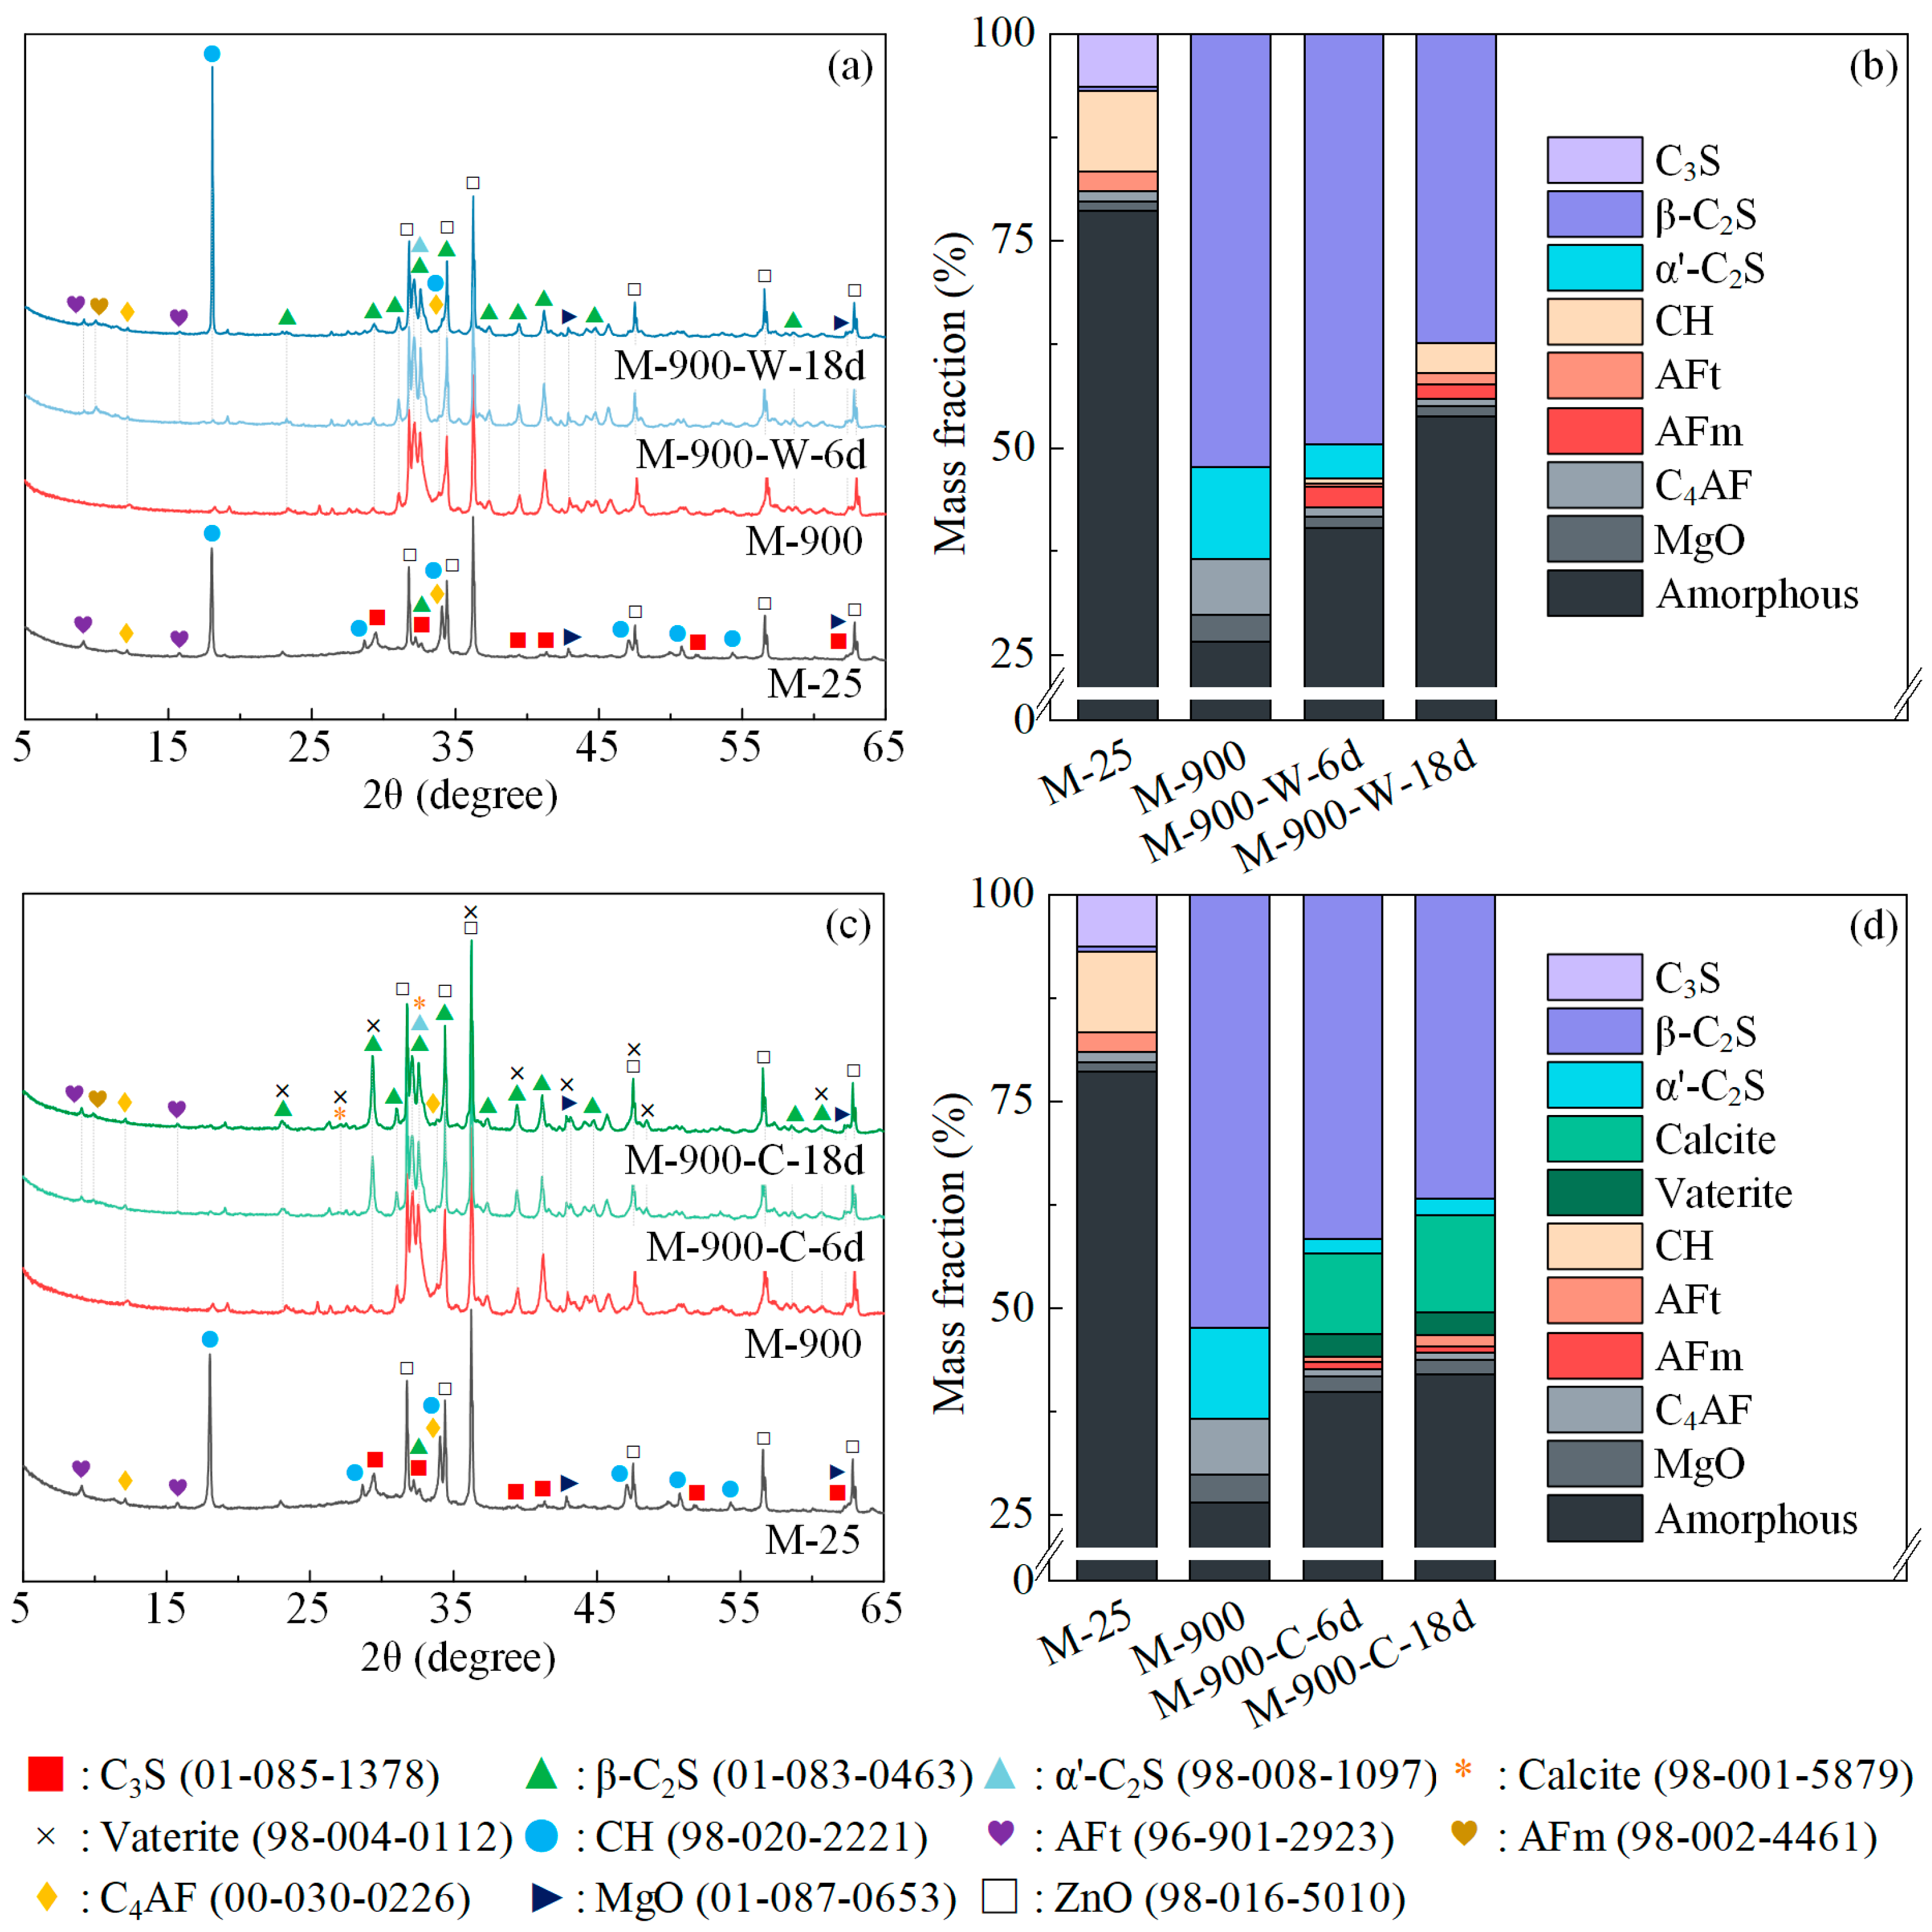
3.2. Phase Assemblage
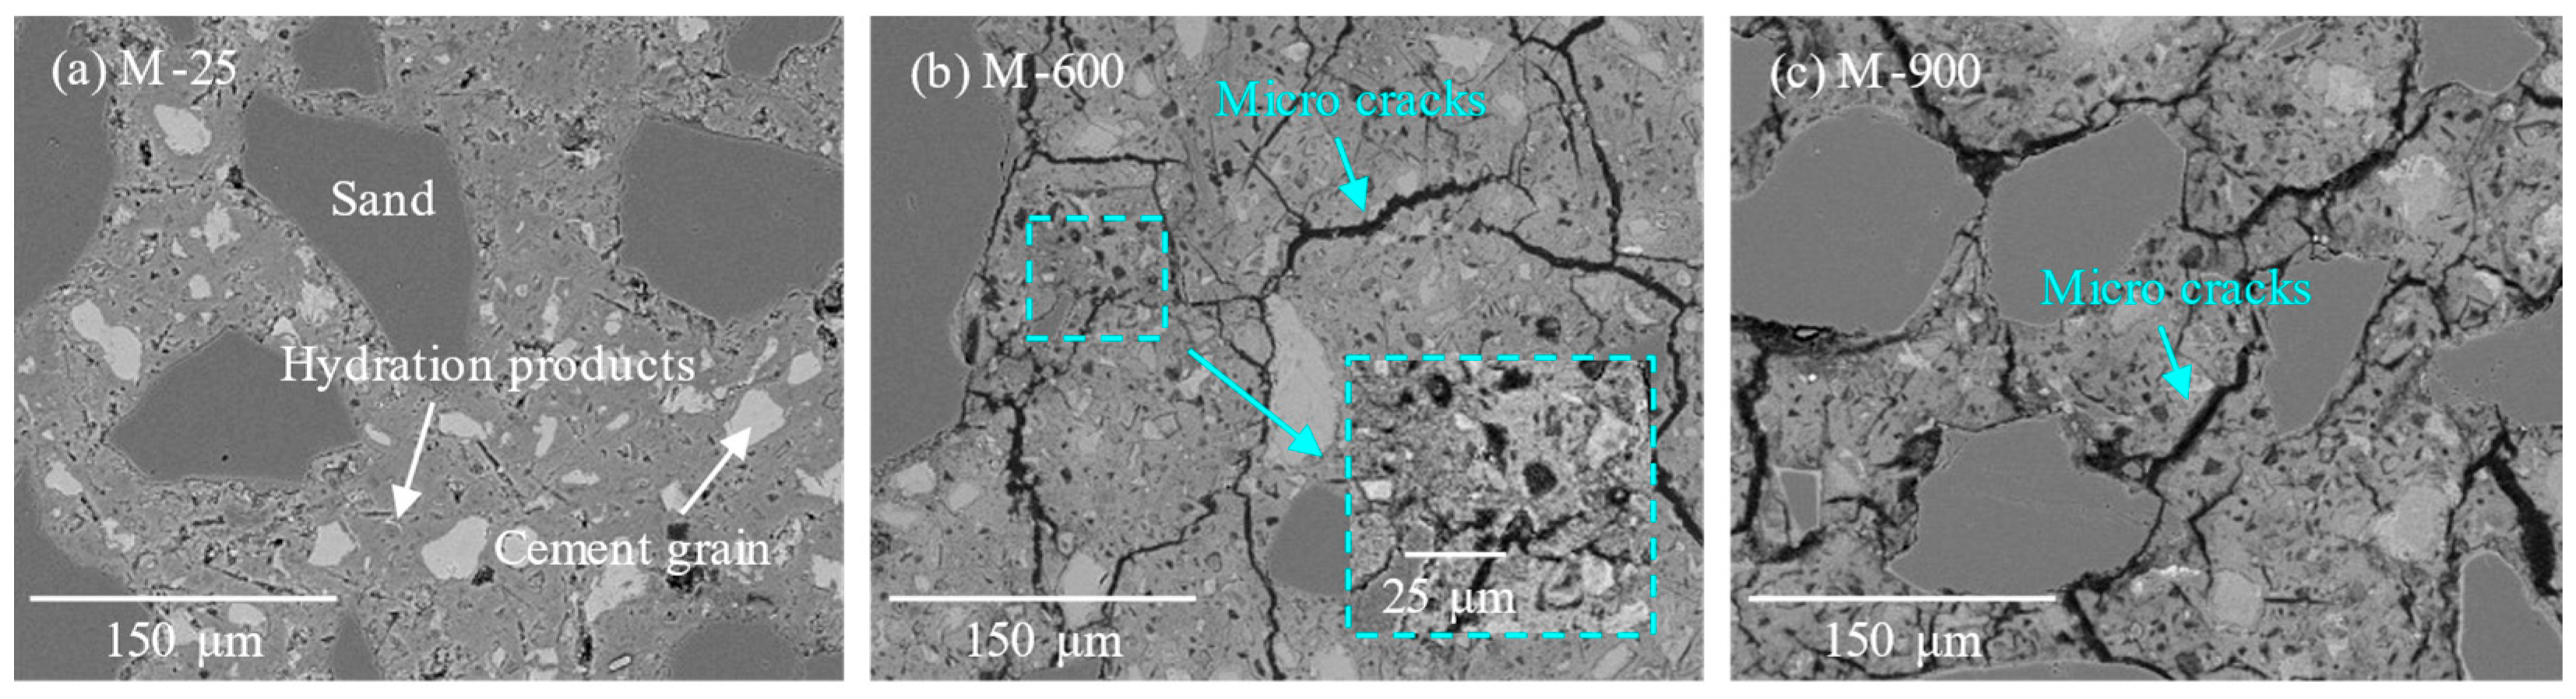
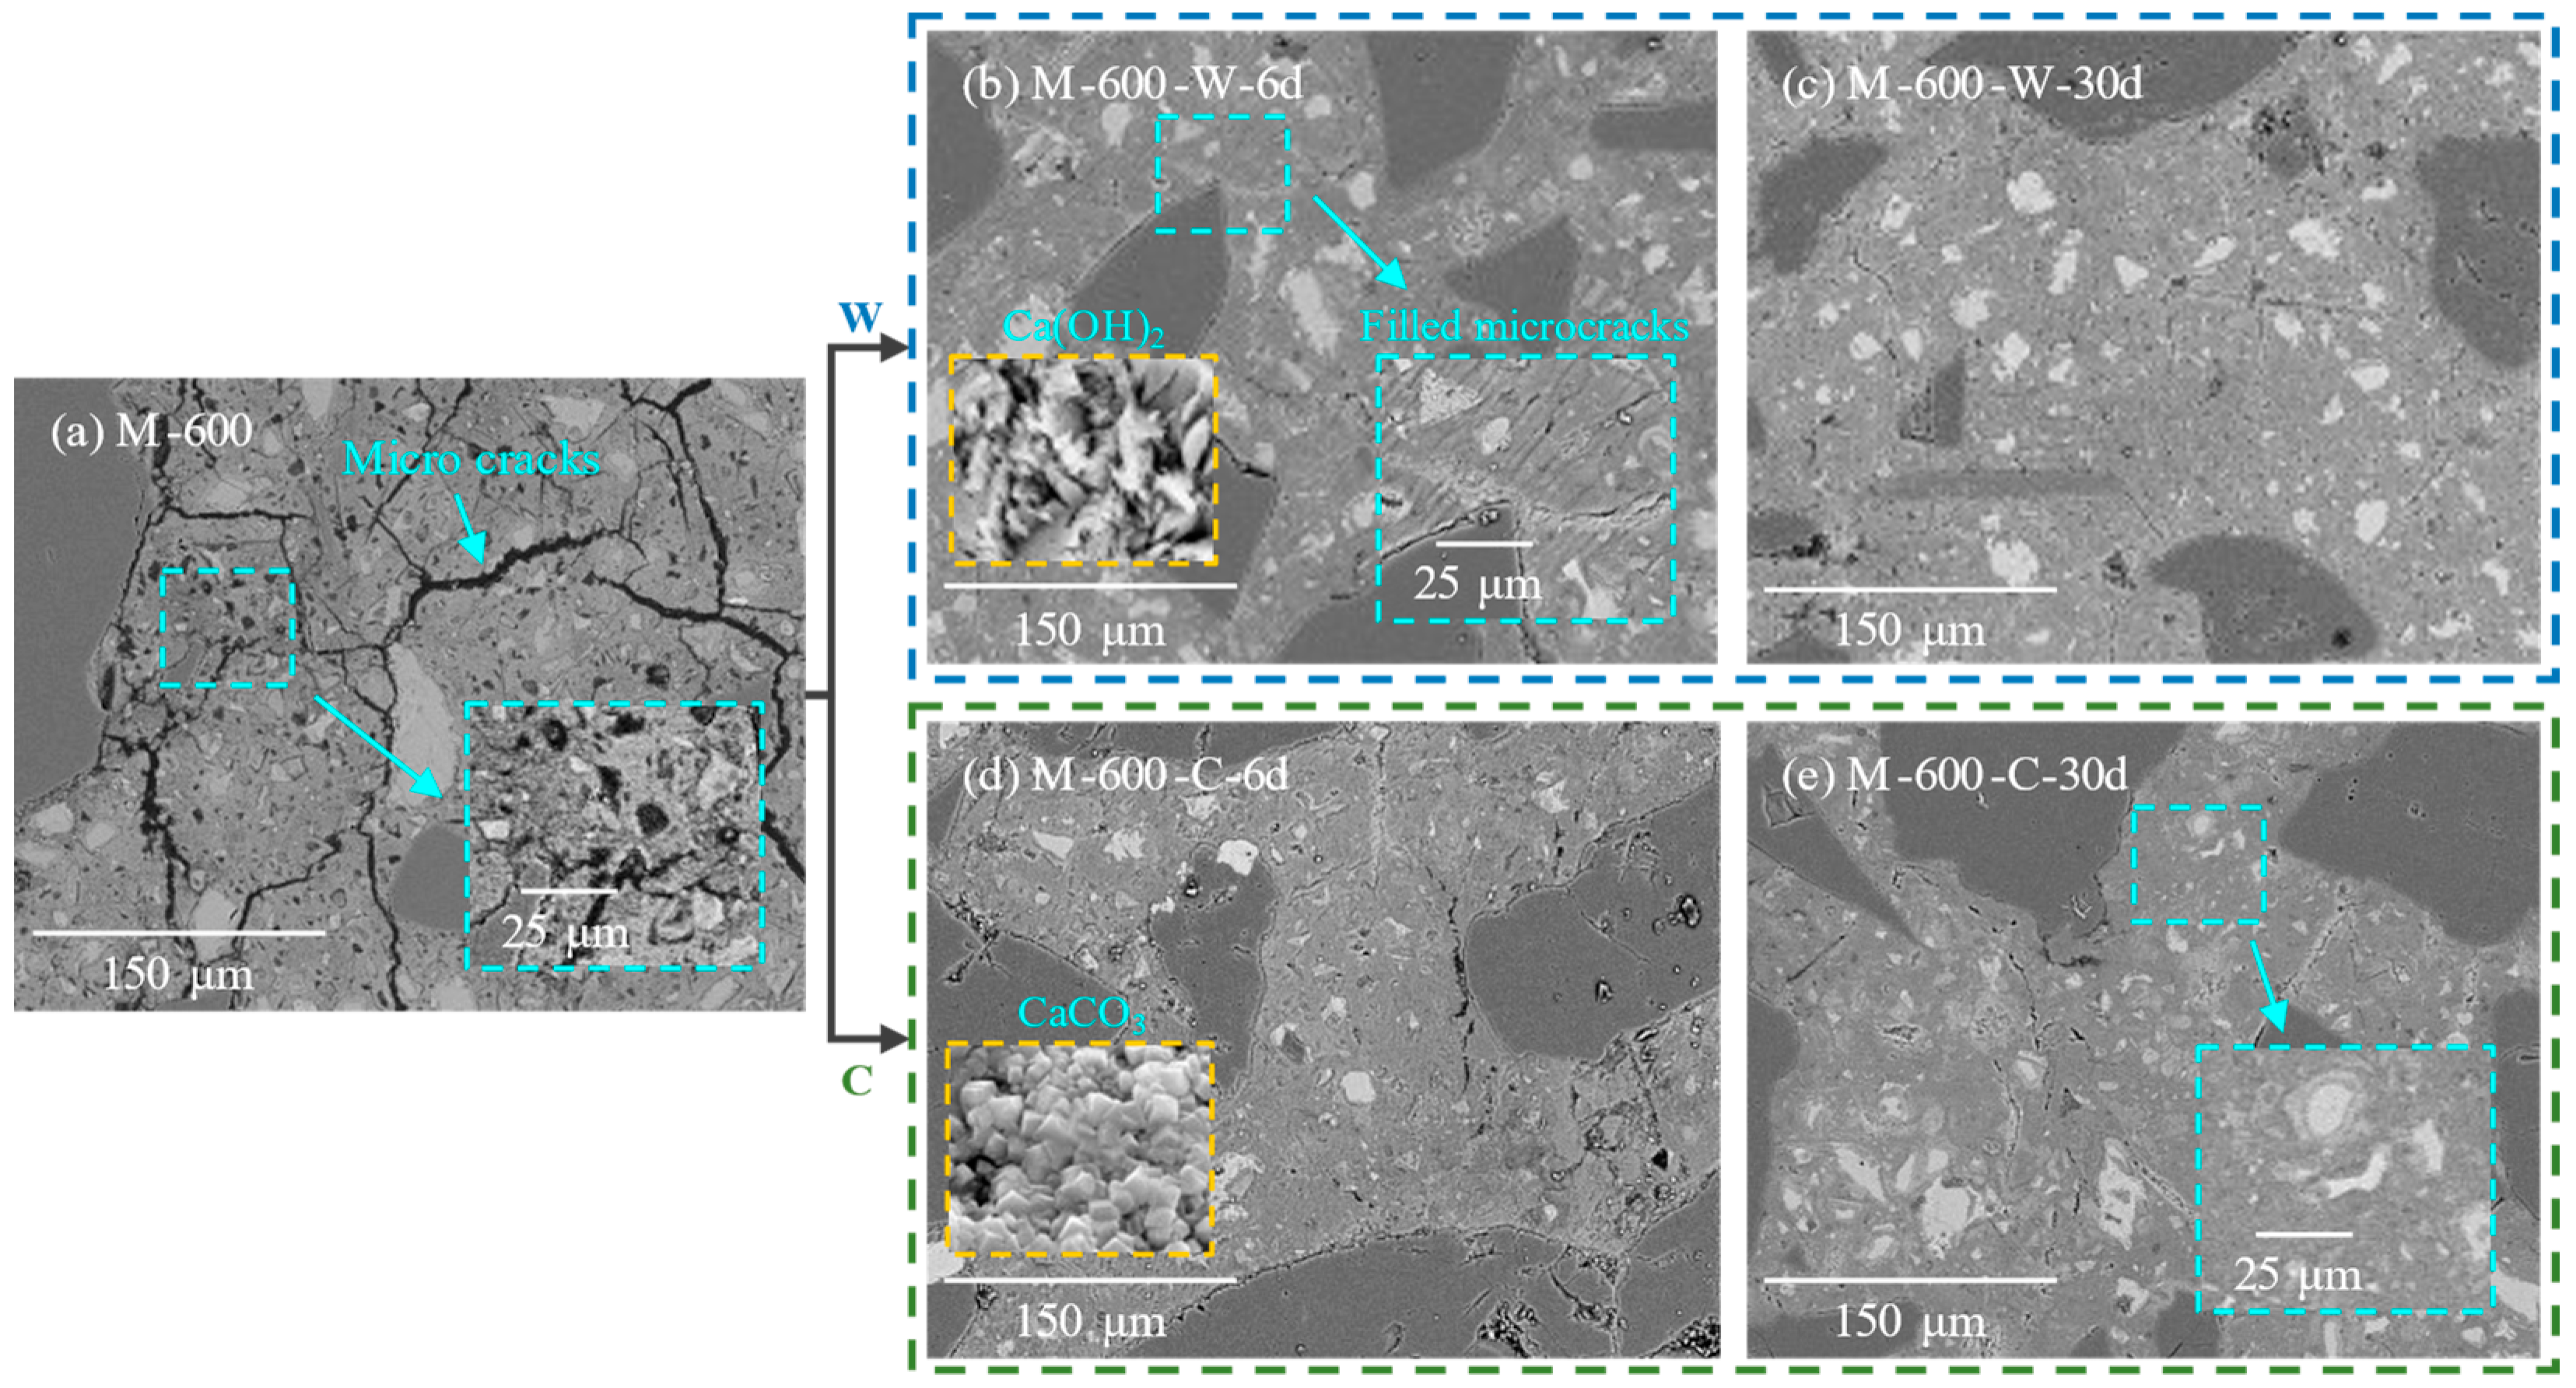
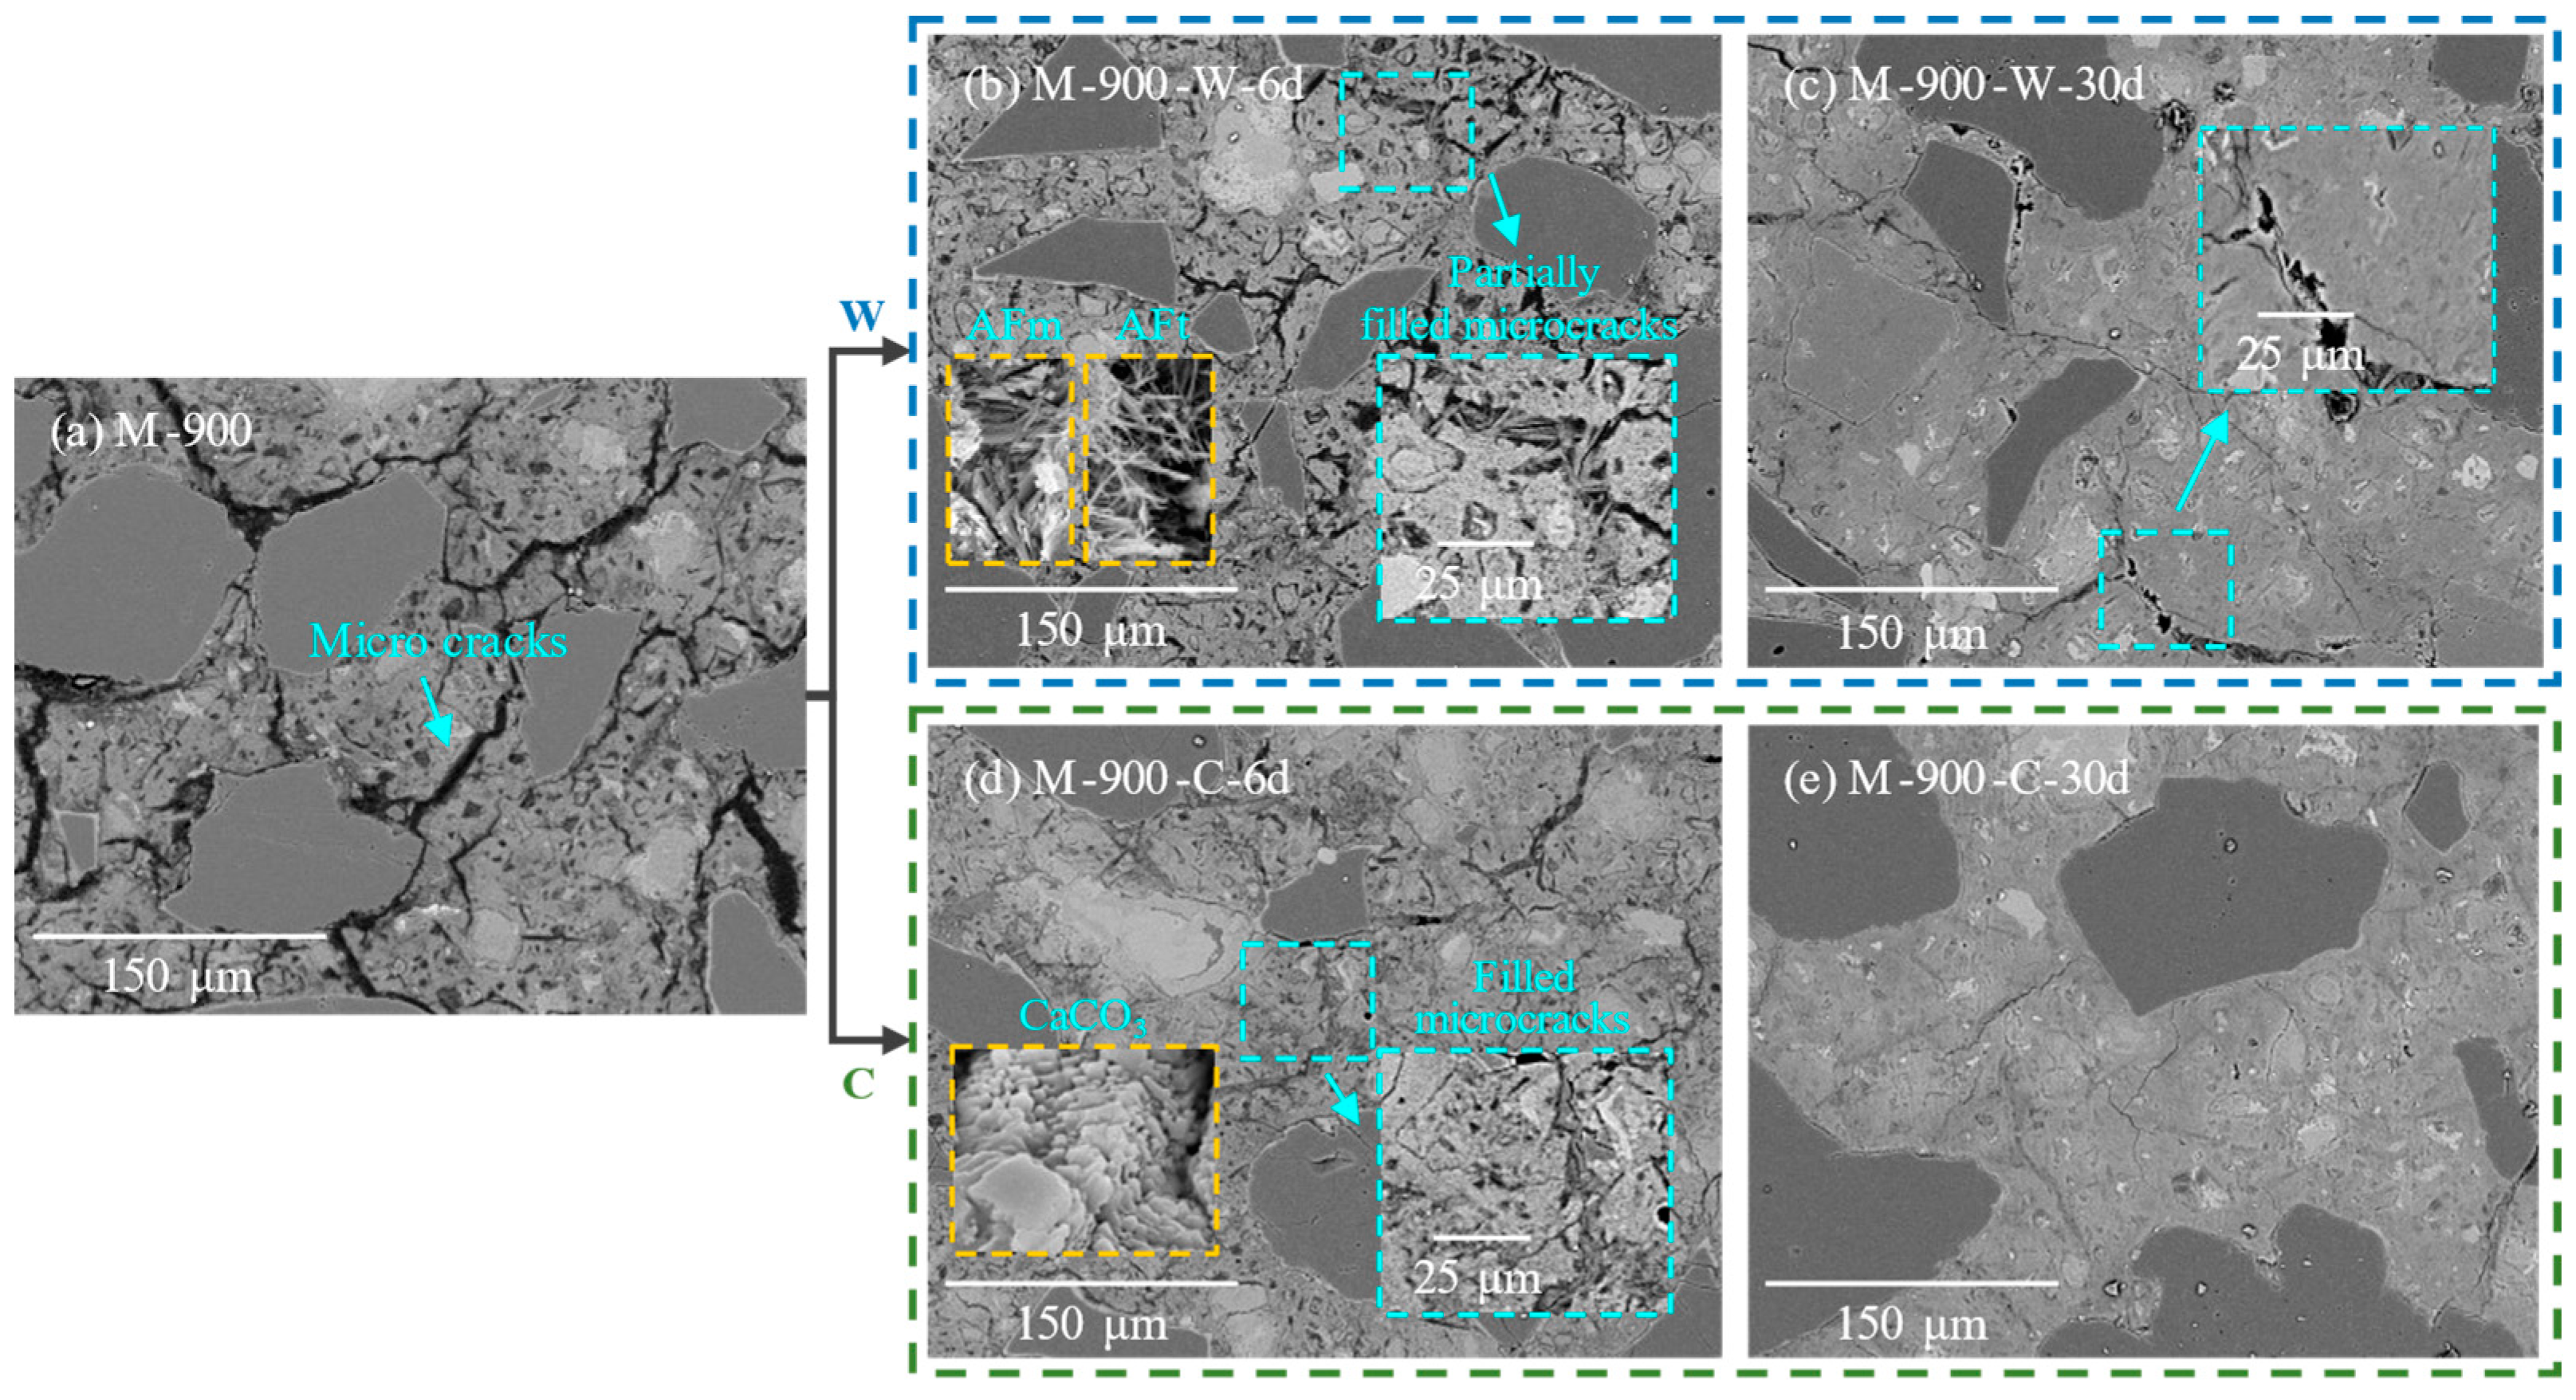
3.3. Microstructure Observations
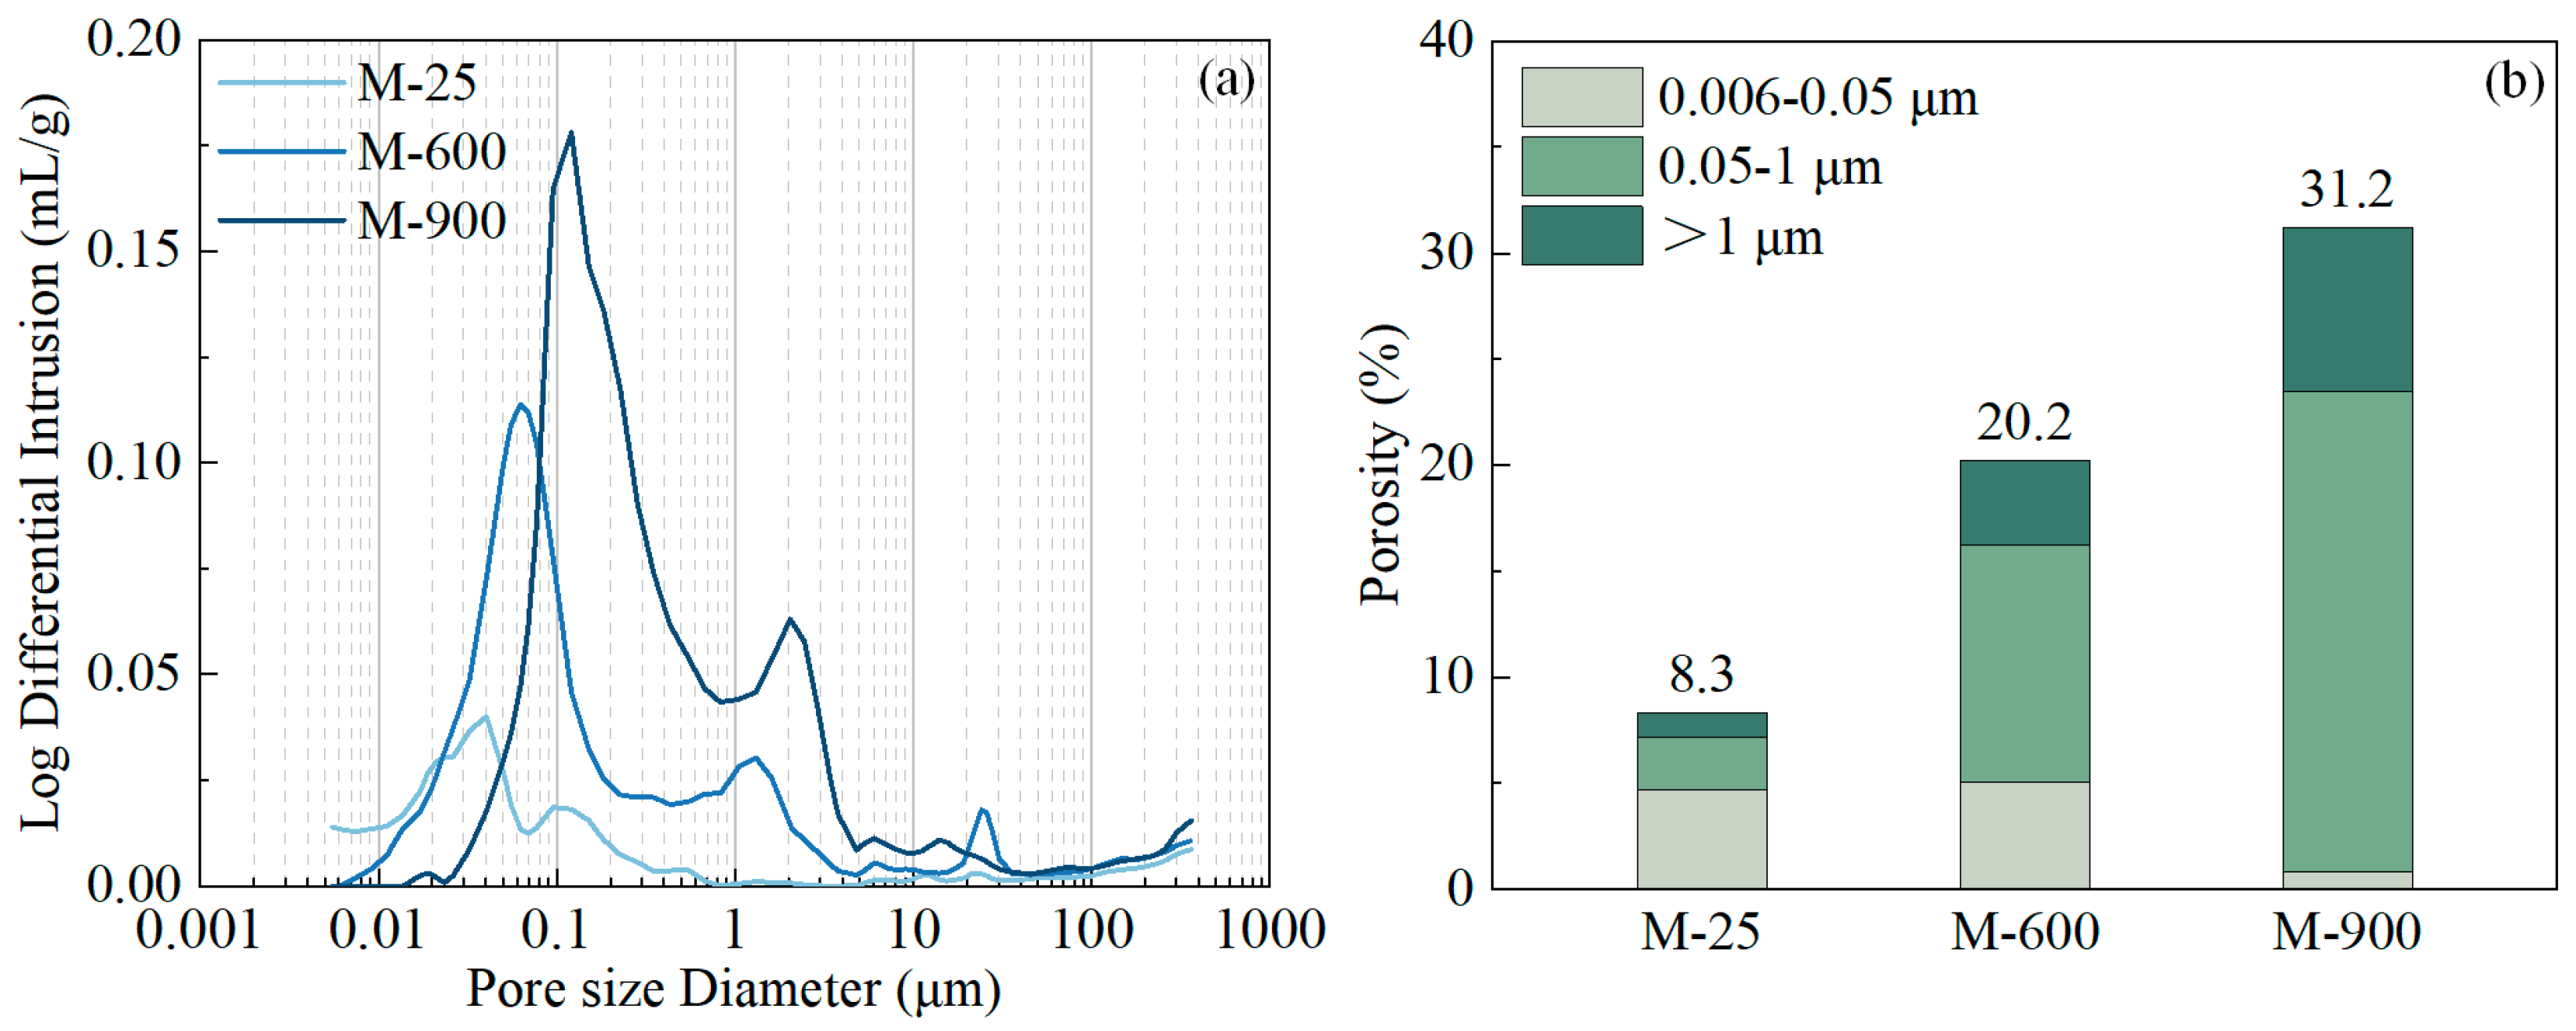
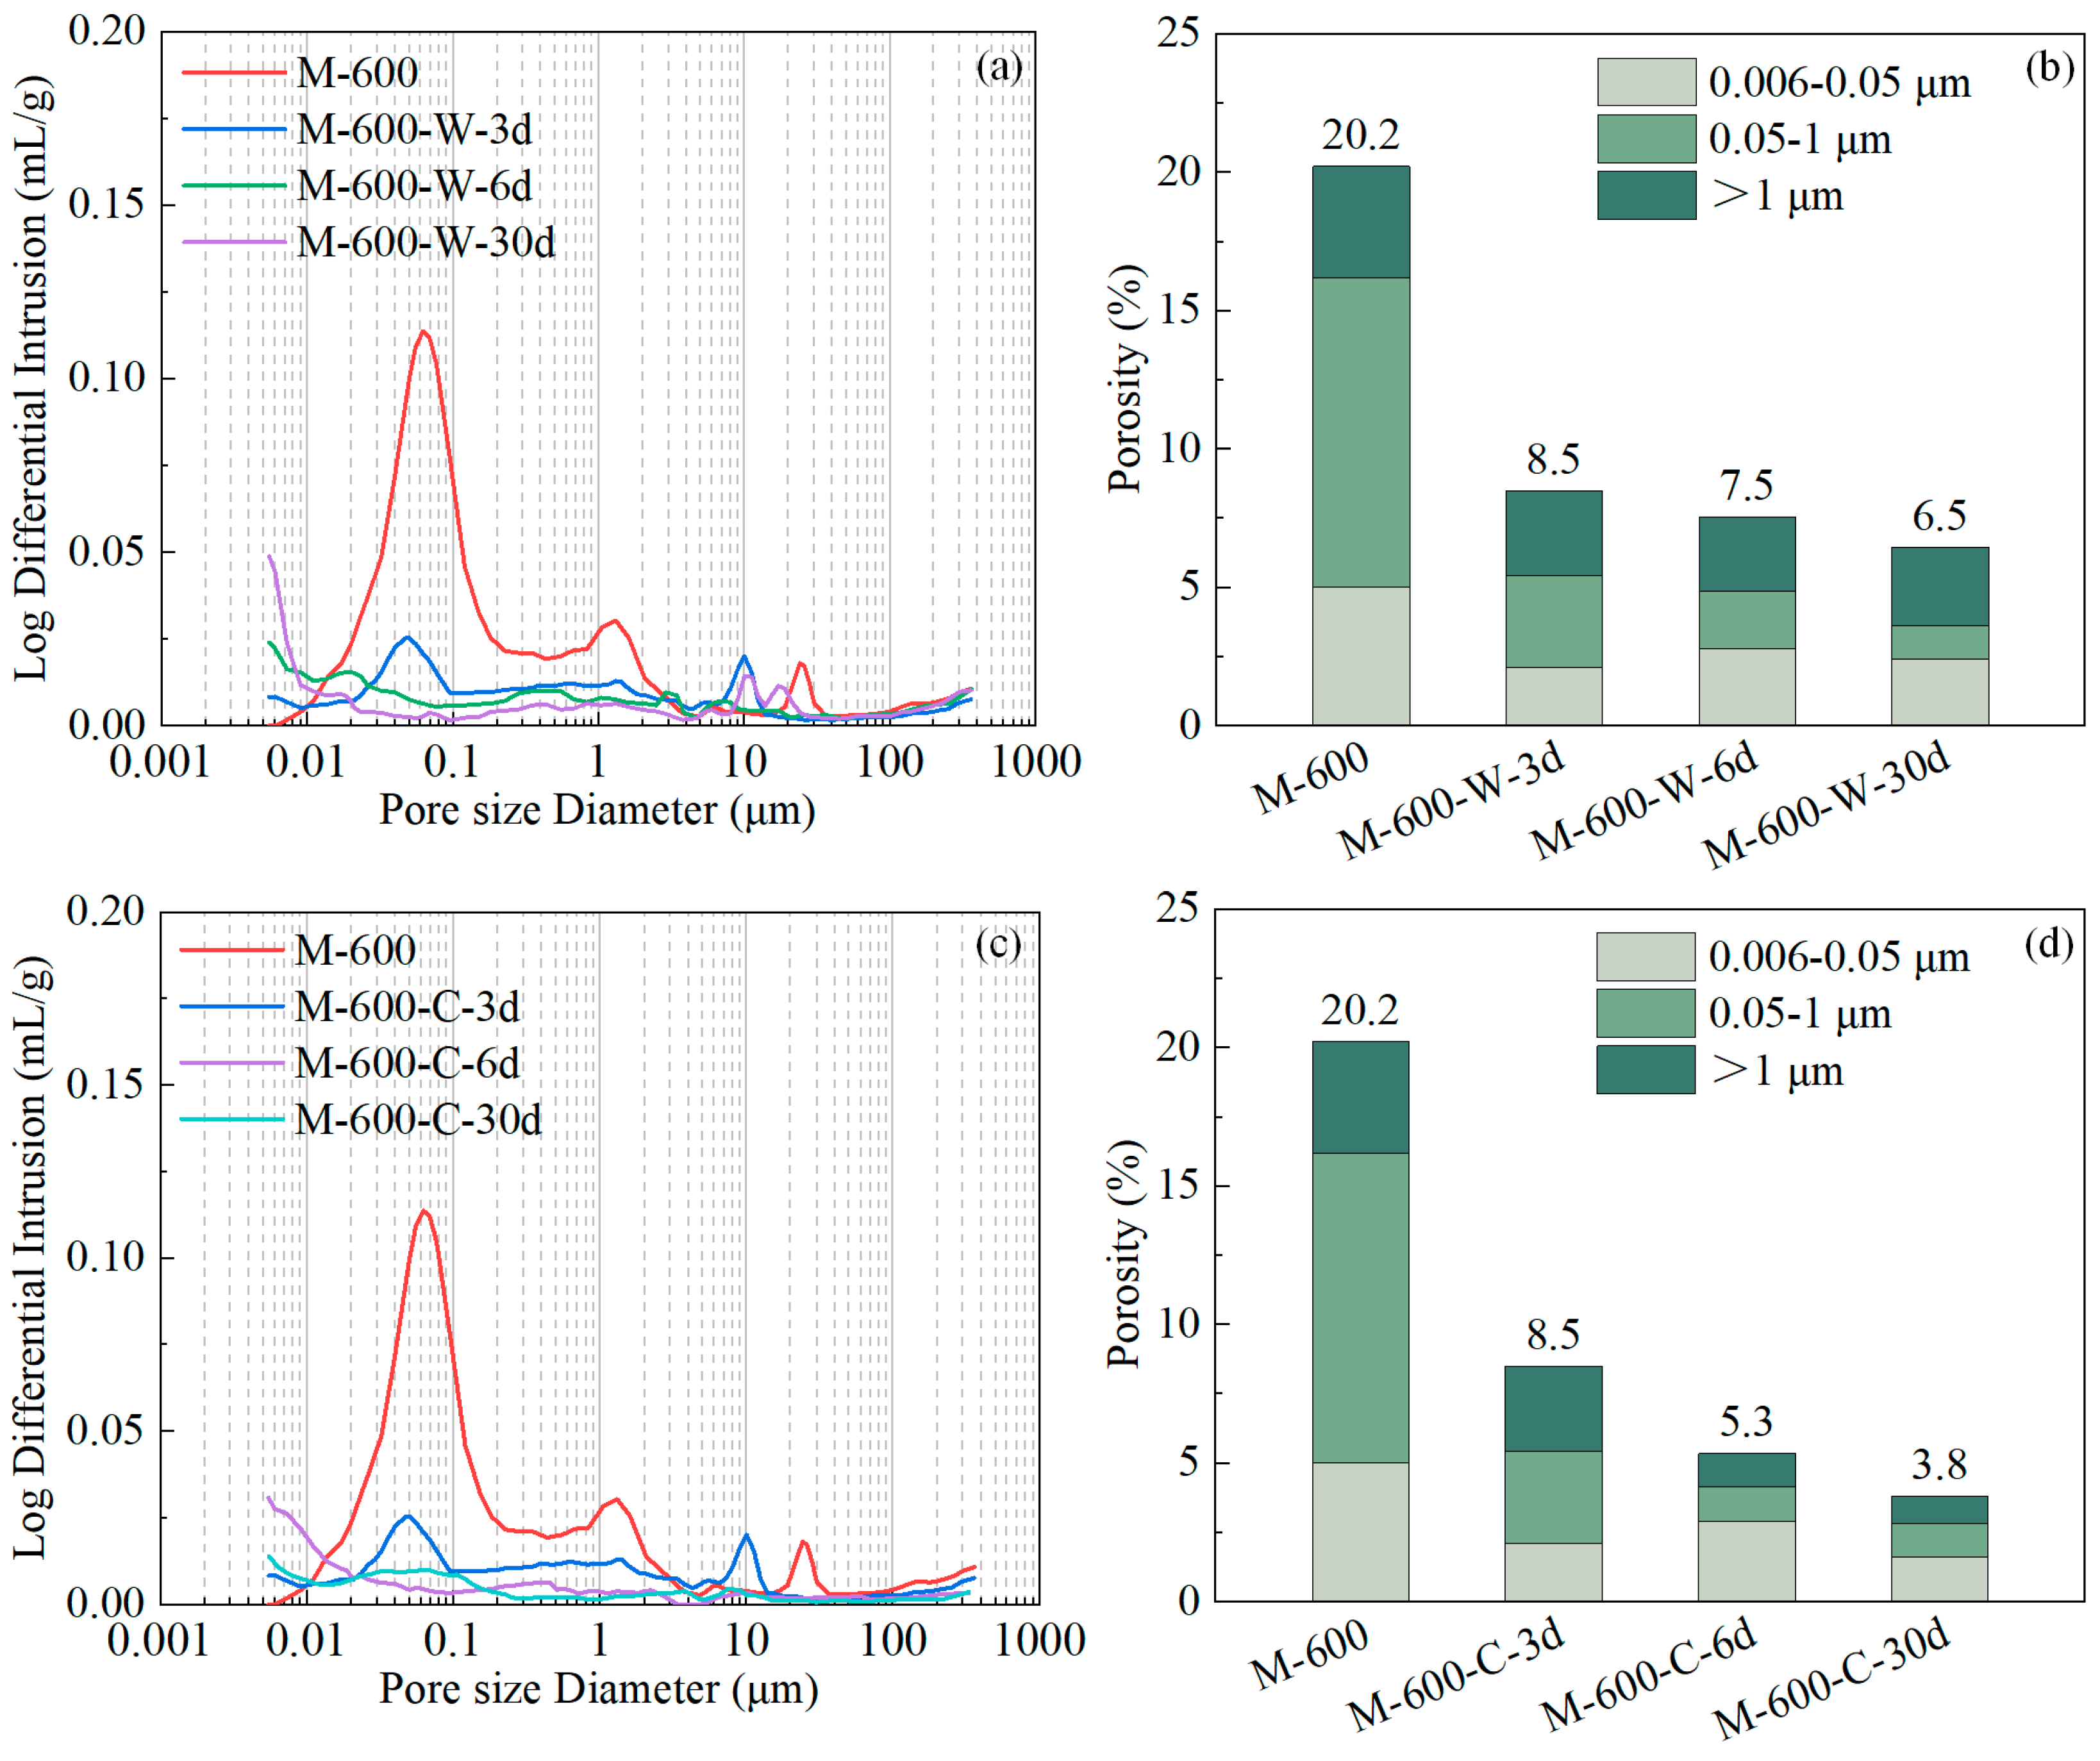
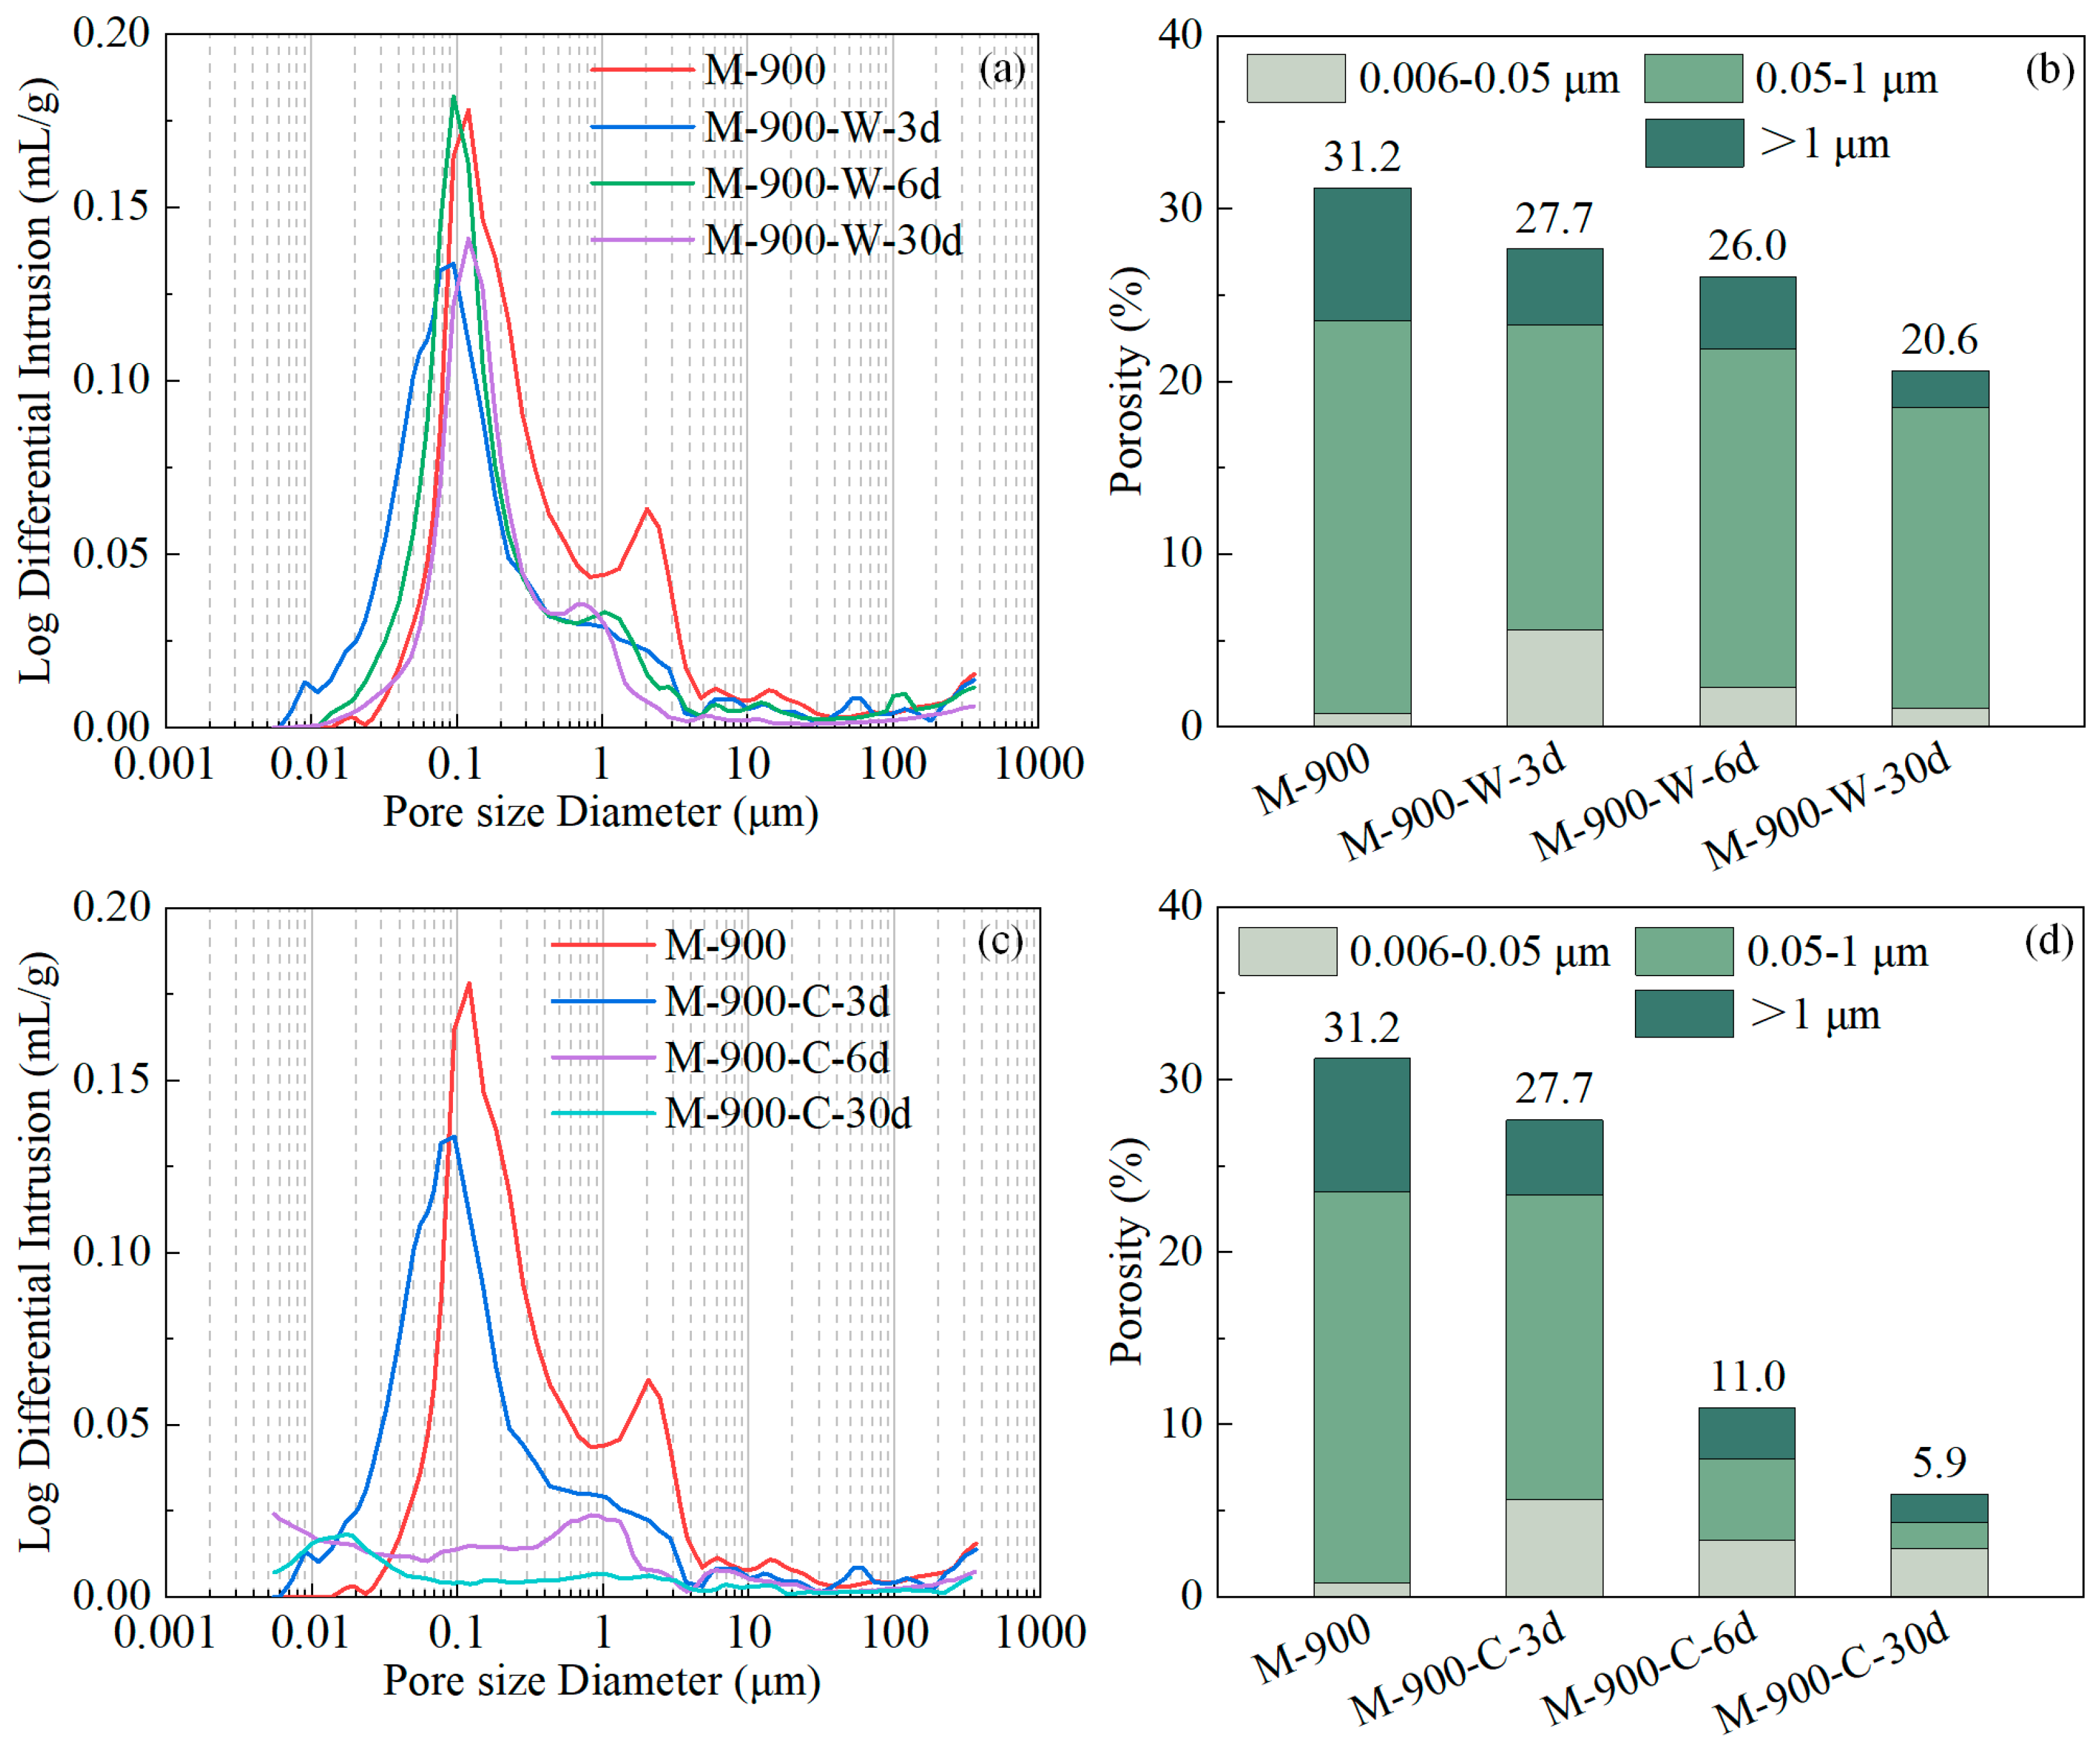
3.4. Porosity and Pore Size Distribution
3.5. Discussion
4. Conclusions
- Both water and water–CO2 cyclic recuring methods can effectively improve the compressive strength of thermally damaged HPC. Cyclic recuring can accelerate the recovery rate of compressive strength of HPC and improve the overall degree of strength recovery. The optimal recuring period for HPC samples exposed to 600 and 900 °C under cyclic recuring conditions is 18 days;
- The primary reason for the compressive strength recovery of thermally damaged HPC is the filling of microcracks and coarsened pores, which increases matrix density. The analysis of HPC porosity and compressive strength reveals a strong linear correlation between the two variables;
- Compared to water recuring, the formation of carbonation products such as CaCO3 and silica gel within the microcracks and cement paste in HPC under cyclic recuring can indeed further enhance its compressive strength. The amounts of rehydration and carbonation products follow the same trend as the development of compressive strength and matrix density.
Author Contributions
Funding
Institutional Review Board Statement
Informed Consent Statement
Data Availability Statement
Conflicts of Interest
References
- Ma, Q.M.; Guo, R.X.; Zhao, Z.M.; Lin, Z.W.; He, K.C. Mechanical properties of concrete at high temperature—A review. Constr. Build. Mater. 2015, 93, 371–383. [Google Scholar] [CrossRef]
- Bažant, Z.P.; Kaplan, M.F.; Bazant, Z.P. Concrete at High Temperatures: Material Properties and Mathematical Models; Addison-Wesley: Boston, MA, USA, 1996. [Google Scholar]
- Yim, H.J.; Kim, J.H.; Park, S.J.; Kwak, H.G. Characterization of thermally damaged concrete using a nonlinear ultrasonic method. Cem. Concr. Res. 2012, 42, 1438–1446. [Google Scholar] [CrossRef]
- DenariÉ, E.; BrÜhwiler, E. Structural rehabilitations with ultra-high performance fibre reinforced concretes (UHPFRC). Restor. Build. Monum. 2006, 12, 93–108. [Google Scholar]
- Tovey, A.K. Assessment and Repair of Fire-Damaged Concrete Structures—An Update; ACI Symposium Publication: Philadelphia, PA, USA, 1986; Volume 92, pp. 47–62. [Google Scholar]
- Crook, D.N.; Murray, M.J. Regain of Strength after Firing of Concrete. Mag. Concr. Res. 1970, 22, 149–154. [Google Scholar] [CrossRef]
- Akca, A.H.; Özyurt, N. Effects of re-curing on residual mechanical properties of concrete after high temperature exposure. Constr. Build. Mater. 2018, 159, 540–552. [Google Scholar] [CrossRef]
- Li, L.S.; Wang, Y.; An, M.Z.; Yu, P.Y.; Hou, X. The Influence of Rehydration on the Properties of Portland Cement-Based Materials with Low Water/Binder Ratios: A Review of Existing Research. Materials 2023, 16, 970. [Google Scholar] [CrossRef] [PubMed]
- He, F.Z.; Biolzi, L.; Carvelli, V. Effects of elevated temperature and water re-curing on the compression behavior of hybrid fiber reinforced concrete. J. Build. Eng. 2023, 67, 106034. [Google Scholar] [CrossRef]
- Bouhafs, F.; Ezziane, M.; Ayed, K.; Leklou, N.; Mouli, M. Effect of water re-curing on the physico-mechanical and microstructural properties of self-compacting concrete reinforced with steel fibers after exposure to high temperatures. Constr. Build. Mater. 2024, 413, 134805. [Google Scholar] [CrossRef]
- Kharrazi, H.; Ahmadi, B.; Shekarchi, M.; Farhoudi, N. A comprehensive study of the effects of re-curing on macro- and microstructure of zeolite incorporating concretes after exposure to high temperature. Mater. Struct. 2023, 56, 50. [Google Scholar] [CrossRef]
- Akca, A.H.; Özyurt, N. Effects of re-curing on microstructure of concrete after high temperature exposure. Constr. Build. Mater. 2018, 168, 431–441. [Google Scholar] [CrossRef]
- Park, S.J.; Yim, H.J.; Kwak, H.G. Effects of post-fire curing conditions on the restoration of material properties of fire-damaged concrete. Constr. Build. Mater. 2015, 99, 90–98. [Google Scholar] [CrossRef]
- Henry, M.; Darma, I.S.; Sugiyama, T. Analysis of the effect of heating and re-curing on the microstructure of high-strength concrete using X-ray CT. Constr. Build. Mater. 2014, 67, 37–46. [Google Scholar] [CrossRef]
- Li, L.; Shi, L.; Wang, Q.Y.; Liu, Y.J.; Dong, J.F.; Zhang, H.; Zhang, G.M. A review on the recovery of fire-damaged concrete with post-fire-curing. Constr. Build. Mater. 2020, 237, 117564. [Google Scholar] [CrossRef]
- Georgali, B.; Tsakiridis, P.E. Microstructure of fire-damaged concrete. A case study. Cem. Concr. Compos. 2005, 27, 255–259. [Google Scholar] [CrossRef]
- Abdelmelek, N.; Alimrani, N.S.; Krelias, N.; Lublóy, É. Effect of Elevated Temperatures on Microstructure of High Strength Concrete Based-Metakaolin. J. King Saud Univ. Eng. Sci. 2021, 7–9. [Google Scholar] [CrossRef]
- Alonso, C.; Fernandez, L. Dehydration and rehydration processes of cement paste exposed to high temperature environments. J. Mater. Sci. 2004, 39, 3015–3024. [Google Scholar] [CrossRef]
- Wang, G.M.; Zhang, C.; Zhang, B.; Li, Q.; Shui, Z.H. Study on the high-temperature behavior and rehydration characteristics of hardened cement paste. Fire Mater. 2015, 39, 741–750. [Google Scholar] [CrossRef]
- Serpell, R.; Lopez, M. Reactivated cementitious materials from hydrated cement paste wastes. Cem. Concr. Compos. 2013, 39, 104–114. [Google Scholar] [CrossRef]
- Qian, Y.F.; Yang, D.Y.; Liu, M.; Guo, Z.R.; Xiao, Z.L.; Ma, Z.M. Performance recovery of high-temperature damaged ultra-high-performance concrete under different curing environments. Dev. Built Environ. 2023, 16, 100274. [Google Scholar] [CrossRef]
- Li, Y.; Wang, H.; Shi, C.; Zou, D.; Zhou, A.; Liu, T. Effect of post-fire lime-saturated water and water-CO2 cyclic curing on strength recovery of thermally damaged high-performance concrete with different silica contents. Cem. Concr. Res. 2023, 164, 107050. [Google Scholar] [CrossRef]
- Ming, X.; Cao, M.L. Development of eco-efficient cementitious composites with high fire resistance and self-healing abilities—A review. Resour. Conserv. Recycl. 2020, 162, 105017. [Google Scholar] [CrossRef]
- Shui, Z.H.; Xuan, D.X.; Chen, W.; Yu, R.; Zhang, R. Cementitious characteristics of hydrated cement paste subjected to various dehydration temperatures. Constr. Build. Mater. 2009, 23, 531–537. [Google Scholar] [CrossRef]
- Khaled, A.; Safhi, A.E.; Soliman, A.M. Post-fire curing and autogenous self-healing in alkali-activated slag: Microstructures and healing mechanisms. Constr. Build. Mater. 2024, 428, 136334. [Google Scholar] [CrossRef]
- Yim, H.J.; Park, S.J.; Jun, Y.B. Physicochemical and mechanical changes of thermally damaged cement pastes and concrete for recuring conditions. Cem. Concr. Res. 2019, 125, 105831. [Google Scholar] [CrossRef]
- Ashraf, W.; Olek, J. Carbonation behavior of hydraulic and non-hydraulic calcium silicates: Potential of utilizing low-lime calcium silicates in cement-based materials. J. Mater. Sci. 2016, 51, 6173–6191. [Google Scholar] [CrossRef]
- Poon, C.S.; Azhar, S.; Anson, M.; Wong, Y.L. Strength and durability recovery of fire-damaged concrete after post-fire-curing. Cem. Concr. Res. 2001, 31, 1307–1318. [Google Scholar] [CrossRef]
- Shui, Z.H.; Xuan, D.X.; Wan, H.W.; Cao, B.B. Rehydration reactivity of recycled mortar from concrete waste experienced to thermal treatment. Constr. Build. Mater. 2008, 22, 1723–1729. [Google Scholar] [CrossRef]
- Xuan, D.X.; Shui, Z.H. Temperature dependence of thermal induced mesocracks around limestone aggregate in normal concrete. Fire Mater. 2010, 34, 137–146. [Google Scholar] [CrossRef]
- Liu, T.J.; Wang, H.D.; Zou, D.J.; Long, X.; Miah, M.J.; Li, Y. Strength recovery of thermally damaged high-performance concrete subjected to post-fire carbonation curing. Cem. Concr. Compos. 2023, 143, 105273. [Google Scholar] [CrossRef]
- Ashraf, W.; Olek, J.; Jain, J. Microscopic features of non-hydraulic calcium silicate cement paste and mortar. Cem. Concr. Res. 2017, 100, 361–372. [Google Scholar] [CrossRef]
- Jang, J.G.; Lee, H.K. Microstructural densification and CO2 uptake promoted by the carbonation curing of belite-rich Portland cement. Cem. Concr. Res. 2016, 82, 50–57. [Google Scholar] [CrossRef]
- ISO 679-2009; International Organization for Standardization, Cement-Test Method-Determination of Strength. ISO Copyright Office: Geneva, Switzerland, 2009.
- Liu, Z.; Meng, W. Fundamental understanding of carbonation curing and durability of carbonation-cured cement-based composites: A review. J. CO2 Util. 2021, 44, 101428. [Google Scholar] [CrossRef]
- Bertos, M.F.; Simons, S.; Hills, C.; Carey, P. A review of accelerated carbonation technology in the treatment of cement-based materials and sequestration of CO2. J. Hazard. Mater. 2004, 112, 193–205. [Google Scholar]
- ASTM C 109/C109M-07; C109/C109M-11: Standard Test Method for Compressive Strength of Hydraulic Cement Mortars (Using 2-in. or [50-mm] Cube Specimens). ASTM International: West Conshohocken, PA, USA, 2008.
- Poon, C.S.; Azhar, S.; Anson, M.; Wong, Y.-L. Comparison of the strength and durability performance of normal- and high-strength pozzolanic concretes at elevated temperatures. Cem. Concr. Res. 2001, 31, 1291–1300. [Google Scholar] [CrossRef]
- Zhang, Q.; Ye, G.; Koenders, E. Investigation of the structure of heated Portland cement paste by using various techniques. Constr. Build. Mater. 2013, 38, 1040–1050. [Google Scholar] [CrossRef]
- Tantawy, M.A. Effect of High Temperatures on the Microstructure of Cement Paste. J. Mater. Sci. Chem. Eng. 2017, 5, 33. [Google Scholar] [CrossRef]
- Morandeau, A.E.; White, C.E. In situ X-ray pair distribution function analysis of accelerated carbonation of a synthetic calcium-silicate-hydrate gel. J. Mater. Chem. A 2015, 3, 8597–8605. [Google Scholar] [CrossRef]
- Morandeau, A.; ThiÉry, M.; Dangla, P. Investigation of the carbonation mechanism of CH and C-S-H in terms of kinetics, microstructure changes and moisture properties. Cem. Concr. Res. 2014, 56, 153–170. [Google Scholar] [CrossRef]
- Saillio, M.; Baroghel-Bouny, V.; Pradelle, S.; Bertin, M.; Vincent, J.; de Lacaillerie, J.B.D. Effect of supplementary cementitious materials on carbonation of cement pastes. Cem. Concr. Res. 2021, 142, 106358. [Google Scholar] [CrossRef]
- Mumme, W.G.; Hill, R.J.; Bushnellwye, G.; Segnit, E.R. Rietveld crystal-structure refinements, crystal-chemistry and calculated powder diffraction data for the polymorphs of dicalcium silicate and related phases. Neues. Jb. Miner. Abh. 1995, 169, 35–68. [Google Scholar]
- Mumme, W.; Cranswick, L.; Chakoumakos, B. Rietveld crystal structure refinements from high temperature neutron powder diffraction data for the polymorphs of dicalcium silicate. Neues. Jb. Miner. Abh. 1996, 170, 171–188. [Google Scholar]
- Serpell, R.; Zunino, F. Recycling of hydrated cement pastes by synthesis of α′H-C2S. Cem. Concr. Res. 2017, 100, 398–412. [Google Scholar] [CrossRef]
- Serpell, R.; Lopez, M. Properties of mortars produced with reactivated cementitious materials. Cem. Concr. Compos. 2015, 64, 16–26. [Google Scholar] [CrossRef]
- Mehta, P.K.; Monteiro, P. Concrete: Microstructure, Properties, and Materials, 4th ed.; McGraw-Hill: New York, NY, USA, 2014; pp. 65–71. [Google Scholar]
- Hou, D.W.; Zhang, G.P.; Pant, R.R.; Shen, J.S.; Liu, M.M.; Luo, H. Nanoindentation characterization of a ternary clay-based composite used in ancient Chinese construction. Materials 2016, 9, 866. [Google Scholar] [CrossRef] [PubMed]
- Jia, F.; Bernard, F.; Kamali-Bernard, S.; Cornen, M. Statistical analysis of mechanical properties for main cement phases by nanoindentation technique. IOP Conf. Ser. Mater. Sci. Eng. 2018, 439, 4. [Google Scholar]
- Borges, P.H.R.; Costa, J.O.; Milestone, N.B.; Lynsdale, C.J.; Streatfield, R.E. Carbonation of CH and C–S–H in composite cement pastes containing high amounts of BFS. Cem. Concr. Res. 2010, 40, 284–292. [Google Scholar] [CrossRef]
- Castellote, M.; Fernandez, L.; Andrade, C.; Alonso, C. Chemical changes and phase analysis of OPC pastes carbonated at different CO2 concentrations. Mater. Struct. 2009, 42, 515–525. [Google Scholar] [CrossRef]
- Ouyang, X.W.; Koleva, D.A.; Ye, G.; van Breugel, K. Understanding the adhesion mechanisms between C-S-H and fillers. Cem. Concr. Res. 2017, 100, 275–283. [Google Scholar] [CrossRef]
- Zhan, B.J.; Xuan, D.X.; Poon, C.S.; Scrivener, K.L. Multi-scale investigation on mechanical behavior and microstructural alteration of C-S-H in carbonated Alite paste. Cem. Concr. Res. 2021, 144, 106448. [Google Scholar] [CrossRef]
- Hay, R.; Li, J.Q.; Celik, K. Phase evolution, micromechanical properties, and morphology of calcium(alumino) silicate hydrates C-(A-)S-H under carbonation. Cem. Concr. Res. 2022, 152, 106683. [Google Scholar] [CrossRef]
- Lahoti, M.; Wong, K.K.; Tan, K.H.; Yang, E.H. Effect of alkali cation type on strength endurance of fly ash geopolymers subject to high temperature exposure. Mater. Des. 2018, 154, 8–19. [Google Scholar] [CrossRef]
- GallÉ, C.; Sercombe, J. Permeability and pore structure evolution of silico-calcareous and hematite high-strength concretes submitted to high temperatures. Mater. Struct. 2001, 34, 619–628. [Google Scholar] [CrossRef]
- Justnes, H.; Skocek, J.; Ostnor, T.A.; Engelsen, C.J.; Skjolsvold, O. Microstructural changes of hydrated cement blended with fly ash upon carbonation. Cem. Concr. Res. 2020, 137, 106192. [Google Scholar] [CrossRef]
- Šauman, Z. Carbonization of porous concrete and its main binding components. Cem. Concr. Res. 1971, 1, 645–662. [Google Scholar] [CrossRef]
- Huang, H.; Ye, G.; Damidot, D. Effect of blast furnace slag on self-healing of microcracks in cementitious materials. Cem. Concr. Res. 2014, 60, 68–82. [Google Scholar] [CrossRef]
- Wang, H.D.; Lyu, H.; Liu, T.J.; Li, Y.; Tan, K.H. Effect of post-fire curing on compressive strength of ultra-high performance concrete and mortar. Constr. Build. Mater. 2022, 346, 128447. [Google Scholar] [CrossRef]


| Mix Design | Cement | Silica Fume | Silica Flour | Fine Aggregates | Superplasticizer | Water | Polypropylene Fibers |
|---|---|---|---|---|---|---|---|
| Mortar | 872.4 | 87.2 | 270.5 | 820.1 | 6.1 | 345.5 | 3.0 |
| CaO | SiO2 | Al2O3 | Fe2O3 | MgO | K2O | TiO2 | SO3 | SrO | |
|---|---|---|---|---|---|---|---|---|---|
| Cement (%) | 61.78 | 20.56 | 5.13 | 3.57 | 3.76 | 0.59 | 0.23 | 3.98 | 0.03 |
| Silica fume (%) | 0.11 | 97.70 | 0.16 | 0.07 | 0.44 | 0.23 | - | 0.99 | - |
| Materials | D10 | D50 | D90 |
|---|---|---|---|
| Cement | 1.26 | 11.91 | 37.81 |
| Silica fume | 0.48 | 0.62 | 0.80 |
| Silica flour | 58.05 | 112.51 | 170.71 |
| Sieved standard quartz sand | 148.85 | 343.72 | 842.42 |
| Form | Color | Density | Effective Content | pH | Total Cl− | Alkali Content | Water Reducing Rate |
|---|---|---|---|---|---|---|---|
| Liquid | Yellow | 1.1 g/mL | 24.7% | 5.4 | ≤0.2% | ≤4.0% | ≥20.0% |
Disclaimer/Publisher’s Note: The statements, opinions and data contained in all publications are solely those of the individual author(s) and contributor(s) and not of MDPI and/or the editor(s). MDPI and/or the editor(s) disclaim responsibility for any injury to people or property resulting from any ideas, methods, instructions or products referred to in the content. |
© 2024 by the authors. Licensee MDPI, Basel, Switzerland. This article is an open access article distributed under the terms and conditions of the Creative Commons Attribution (CC BY) license (https://creativecommons.org/licenses/by/4.0/).
Share and Cite
Li, Y.; Wang, H.; Lou, H. Strength Recovery of Thermally Damaged High-Performance Concrete during Recuring. Materials 2024, 17, 3531. https://doi.org/10.3390/ma17143531
Li Y, Wang H, Lou H. Strength Recovery of Thermally Damaged High-Performance Concrete during Recuring. Materials. 2024; 17(14):3531. https://doi.org/10.3390/ma17143531
Chicago/Turabian StyleLi, Ye, Haodong Wang, and Hangqi Lou. 2024. "Strength Recovery of Thermally Damaged High-Performance Concrete during Recuring" Materials 17, no. 14: 3531. https://doi.org/10.3390/ma17143531