
Performance Characterization and Composition Design Using Machine Learning and Optimal Technology for Slag–Desulfurization Gypsum-Based Alkali-Activated Materials
Abstract
:1. Introduction
2. Materials and Methods
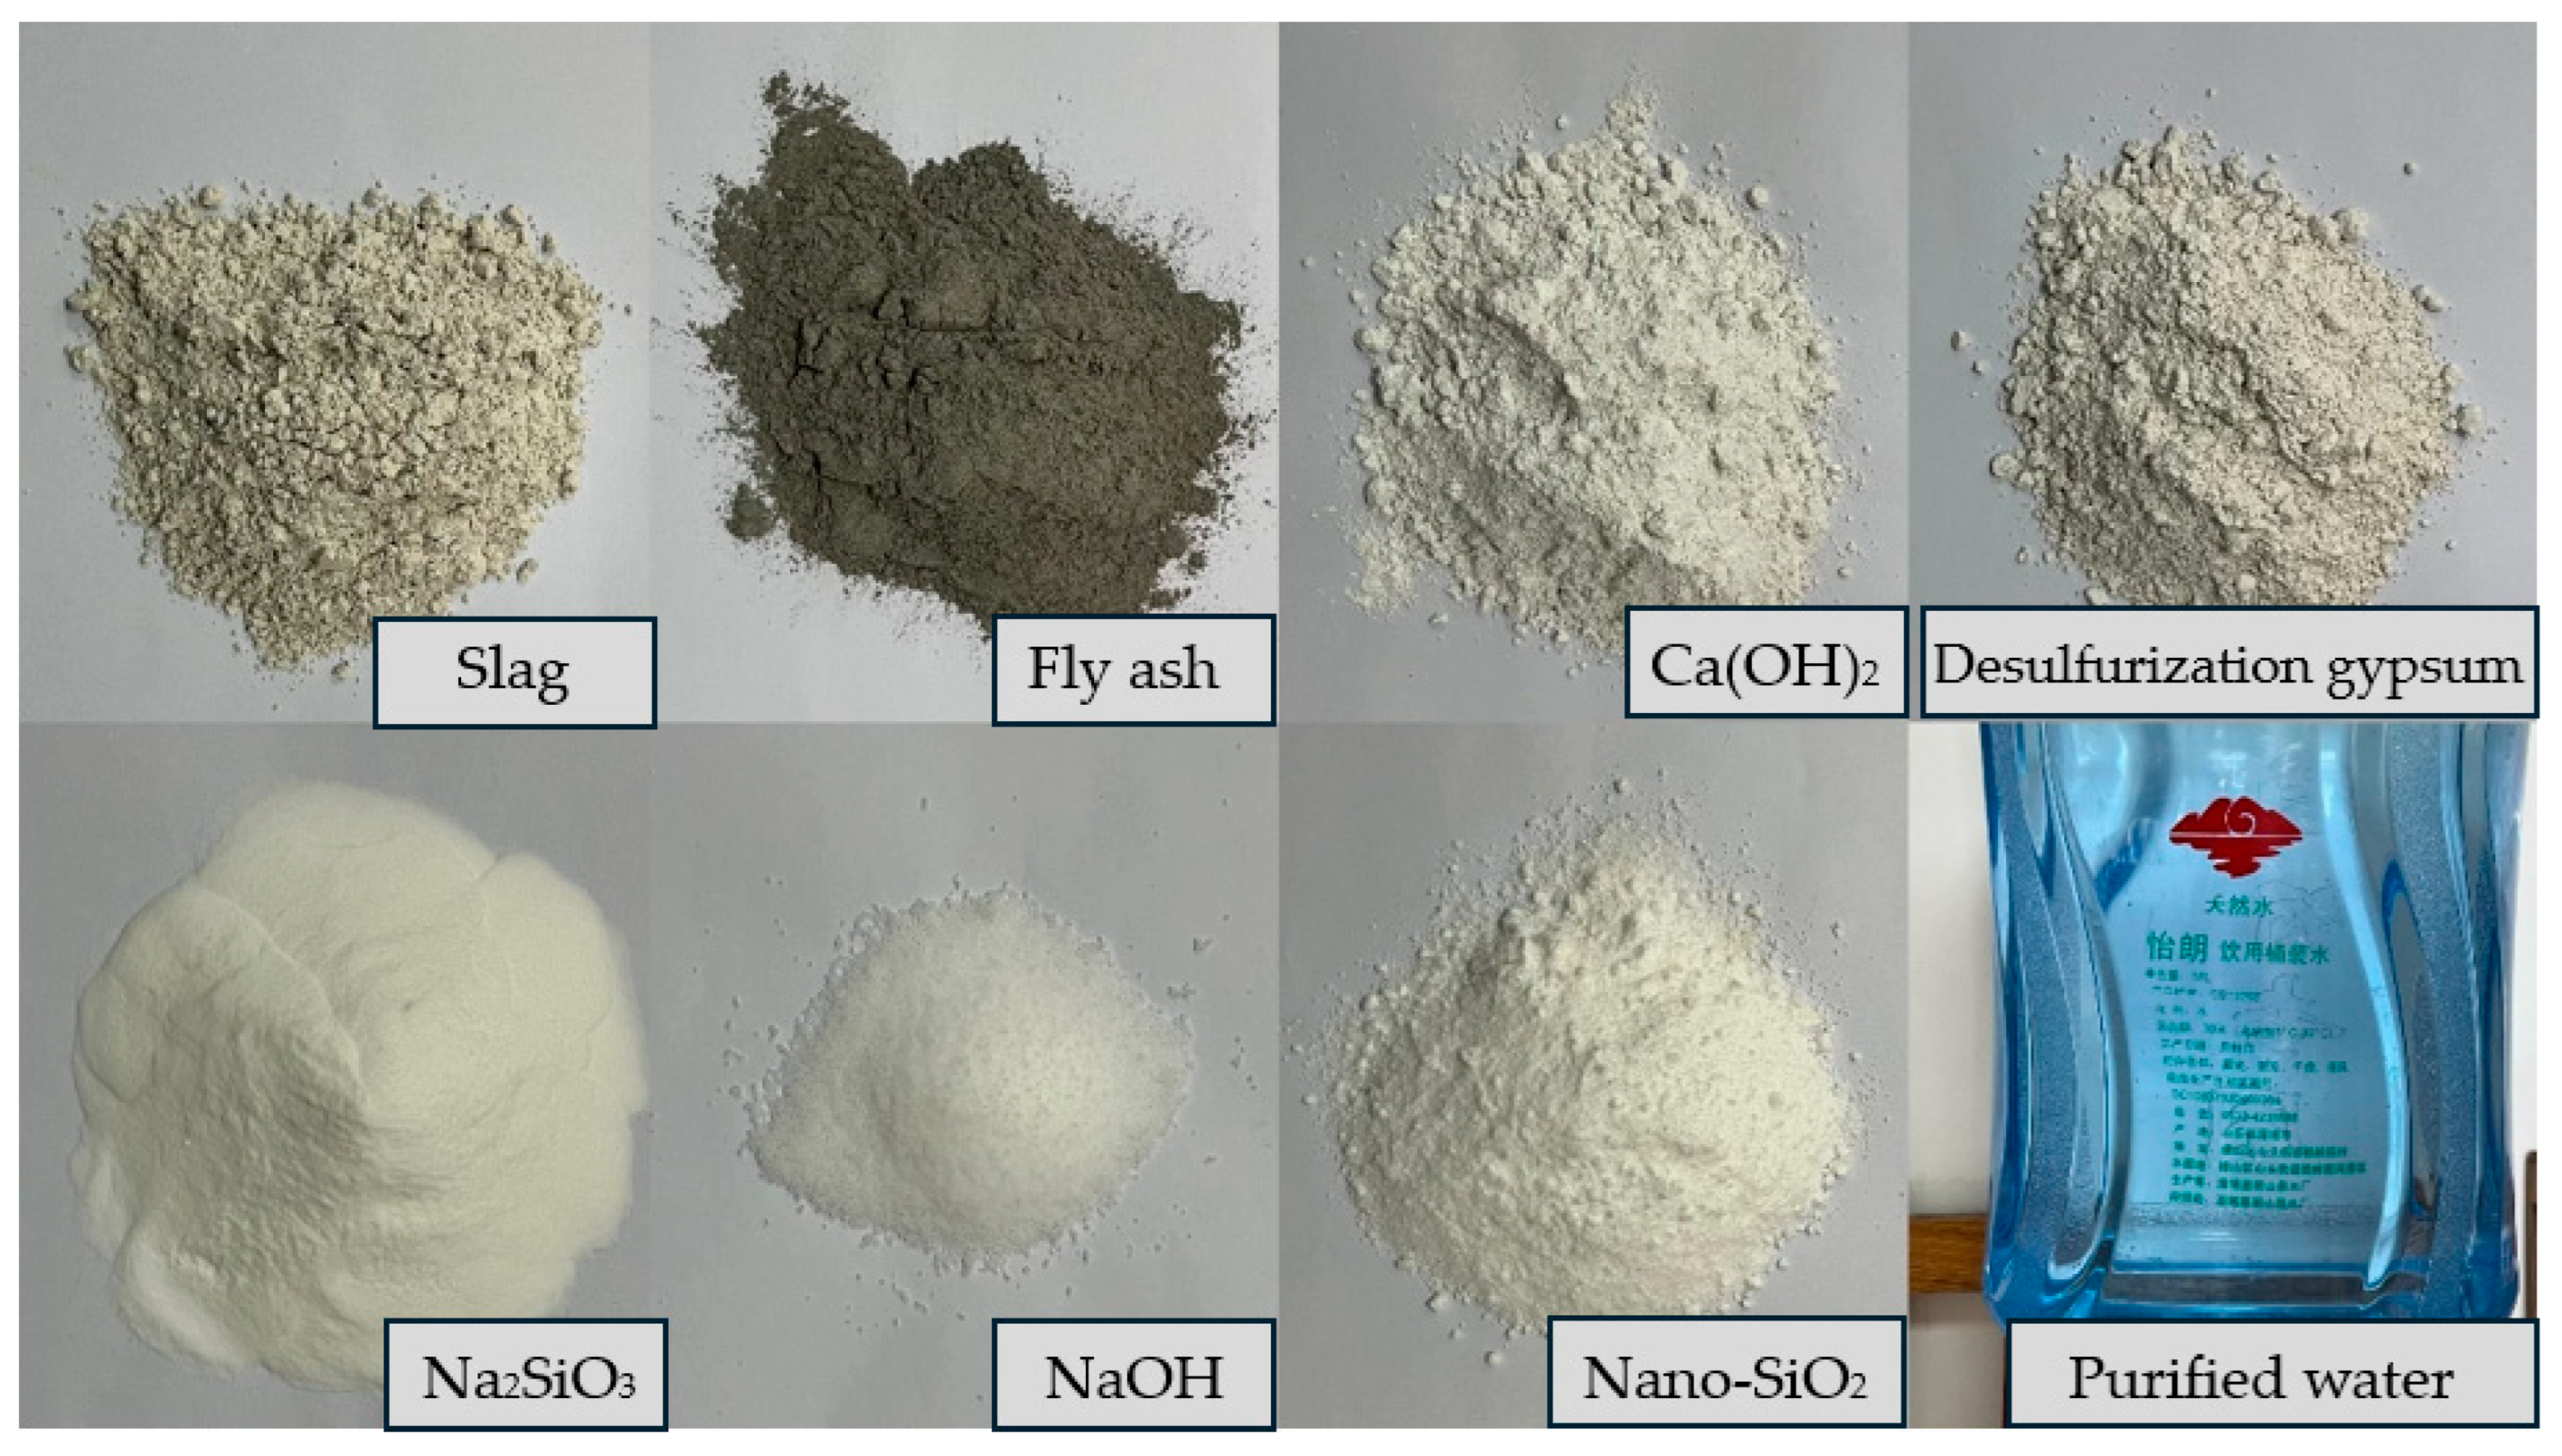
2.1. Test Materials
2.2. Test Design
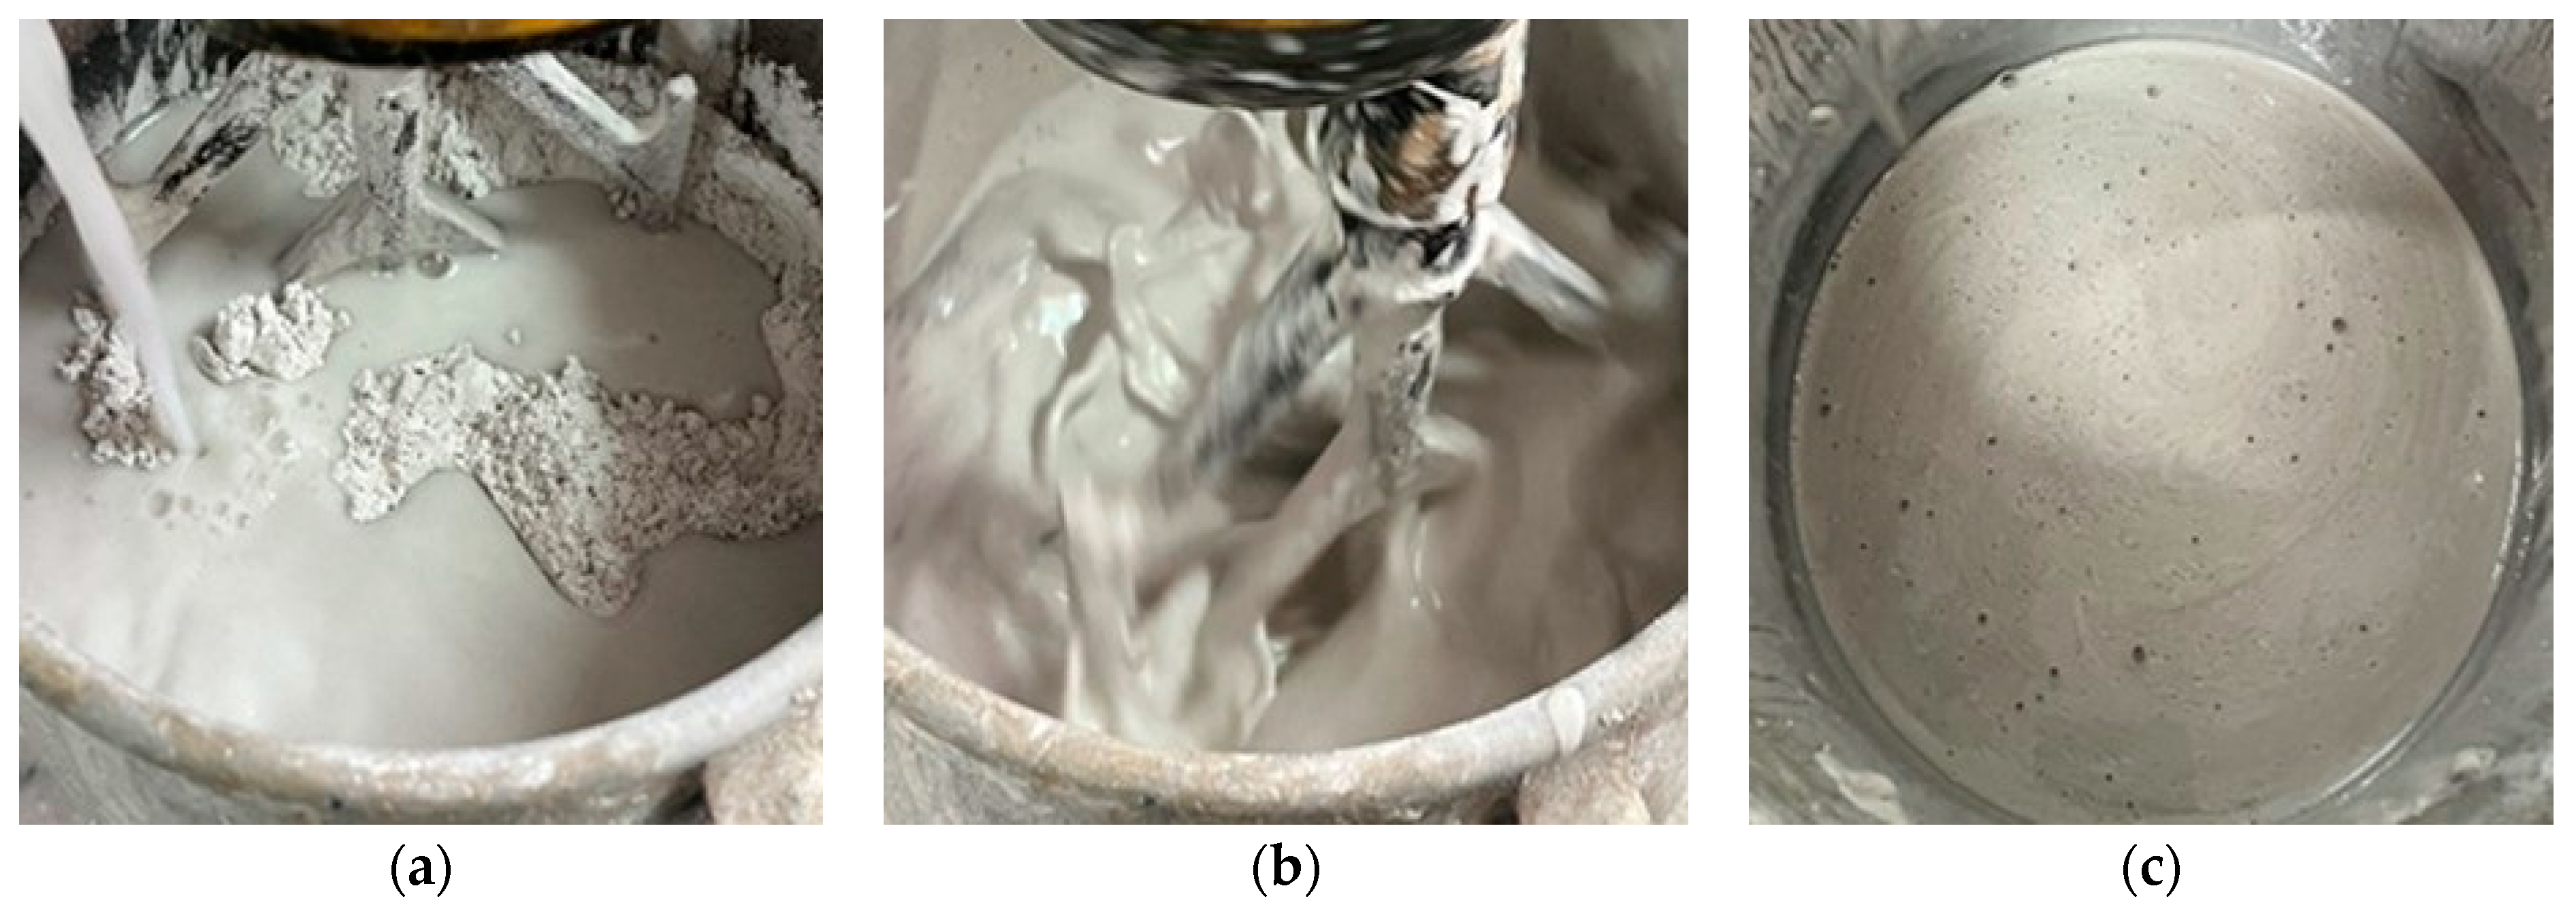
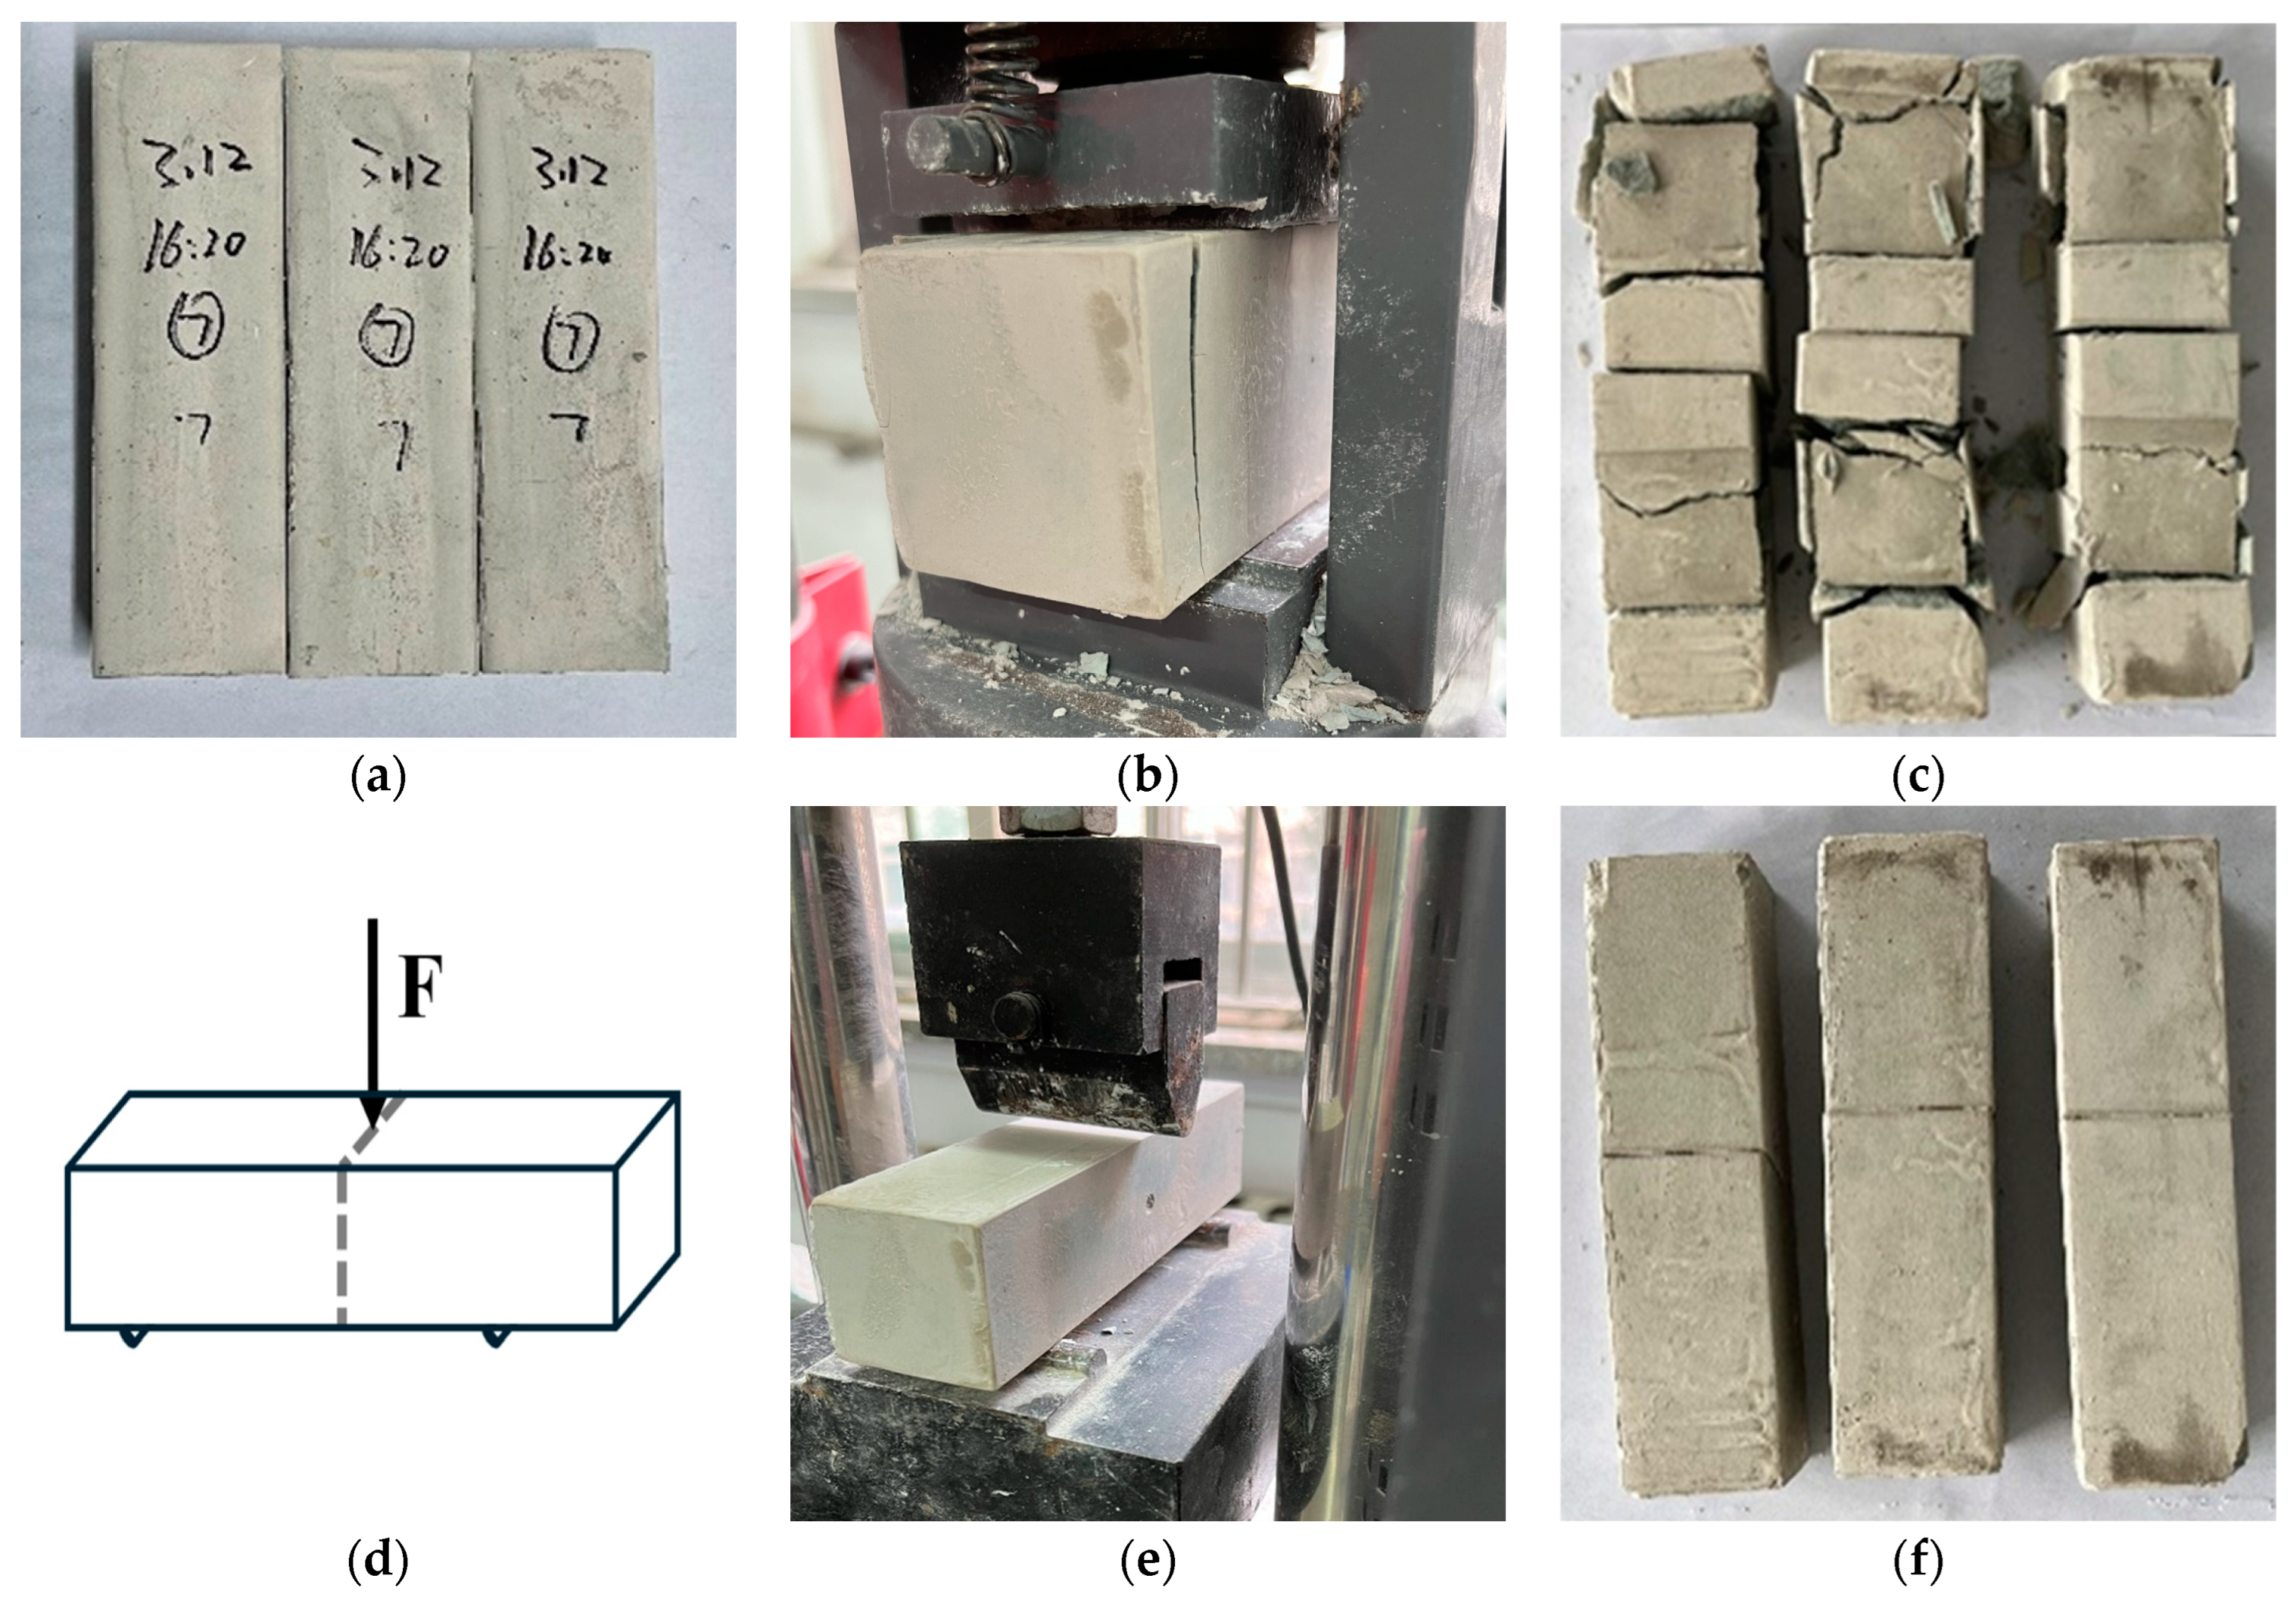
2.3. Specimen Preparation and Performance Measurement
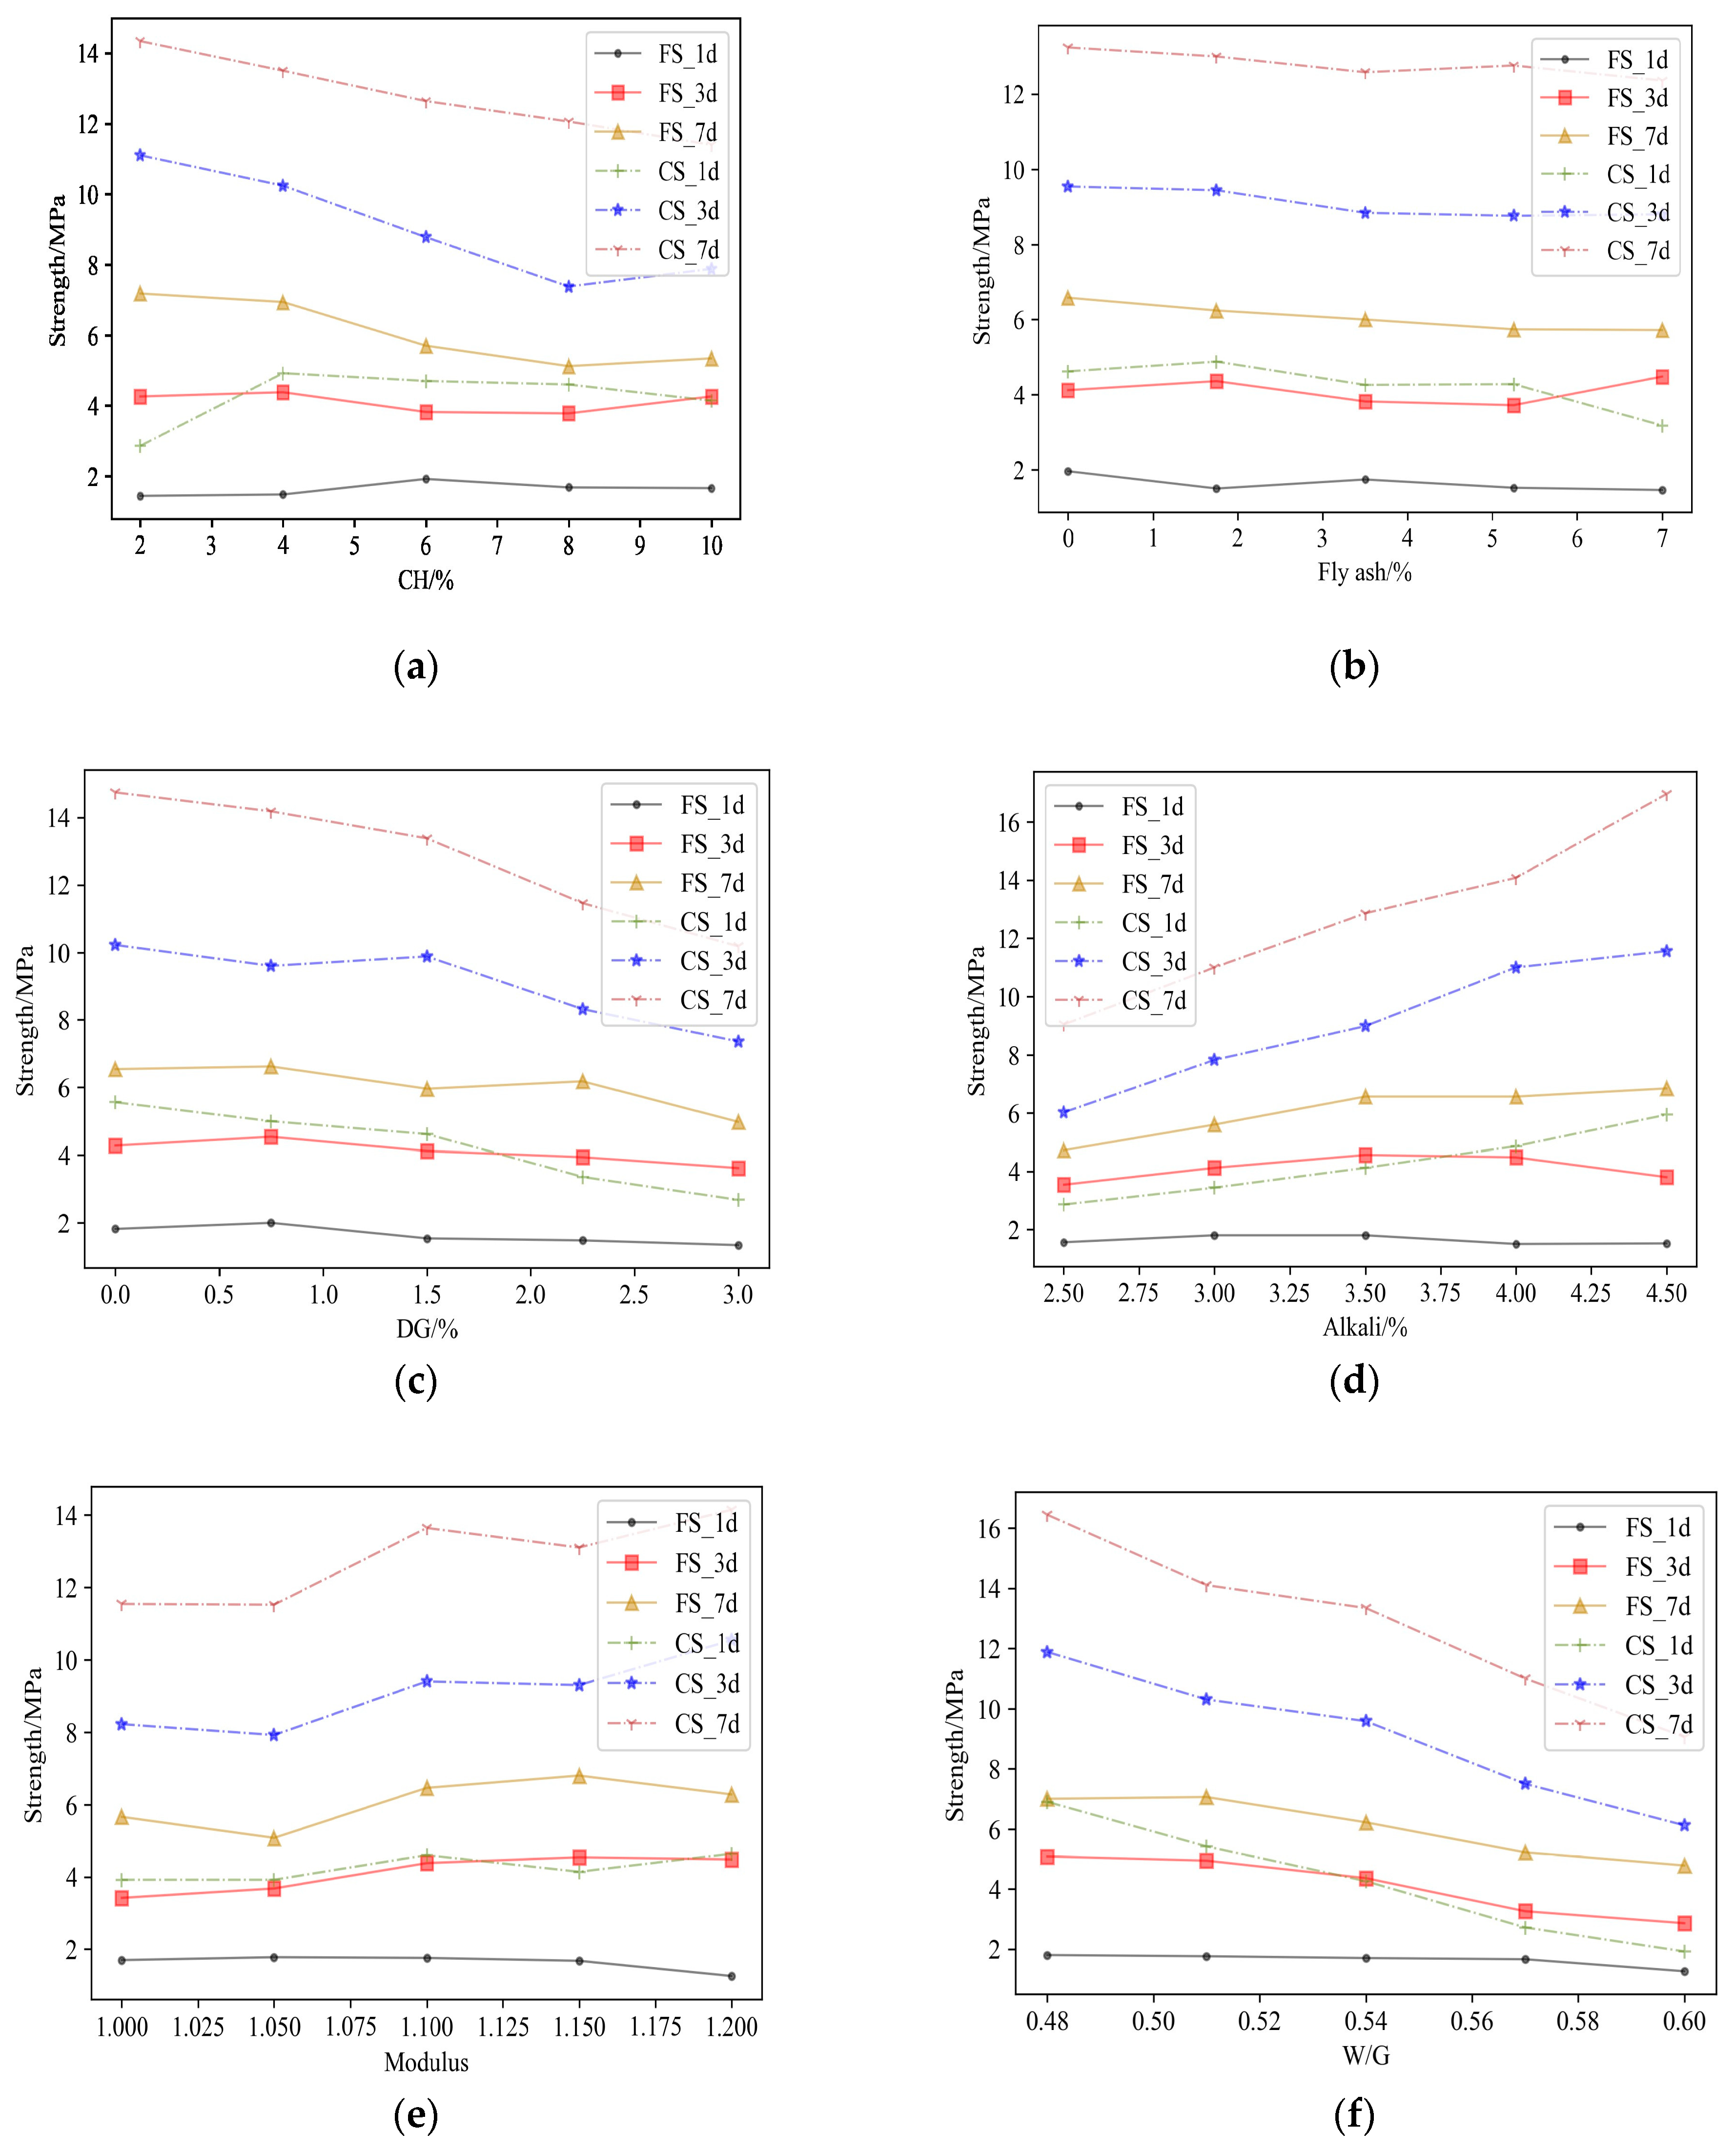
2.4. Test Results
3. Performance Characterization and Composition Design Methods
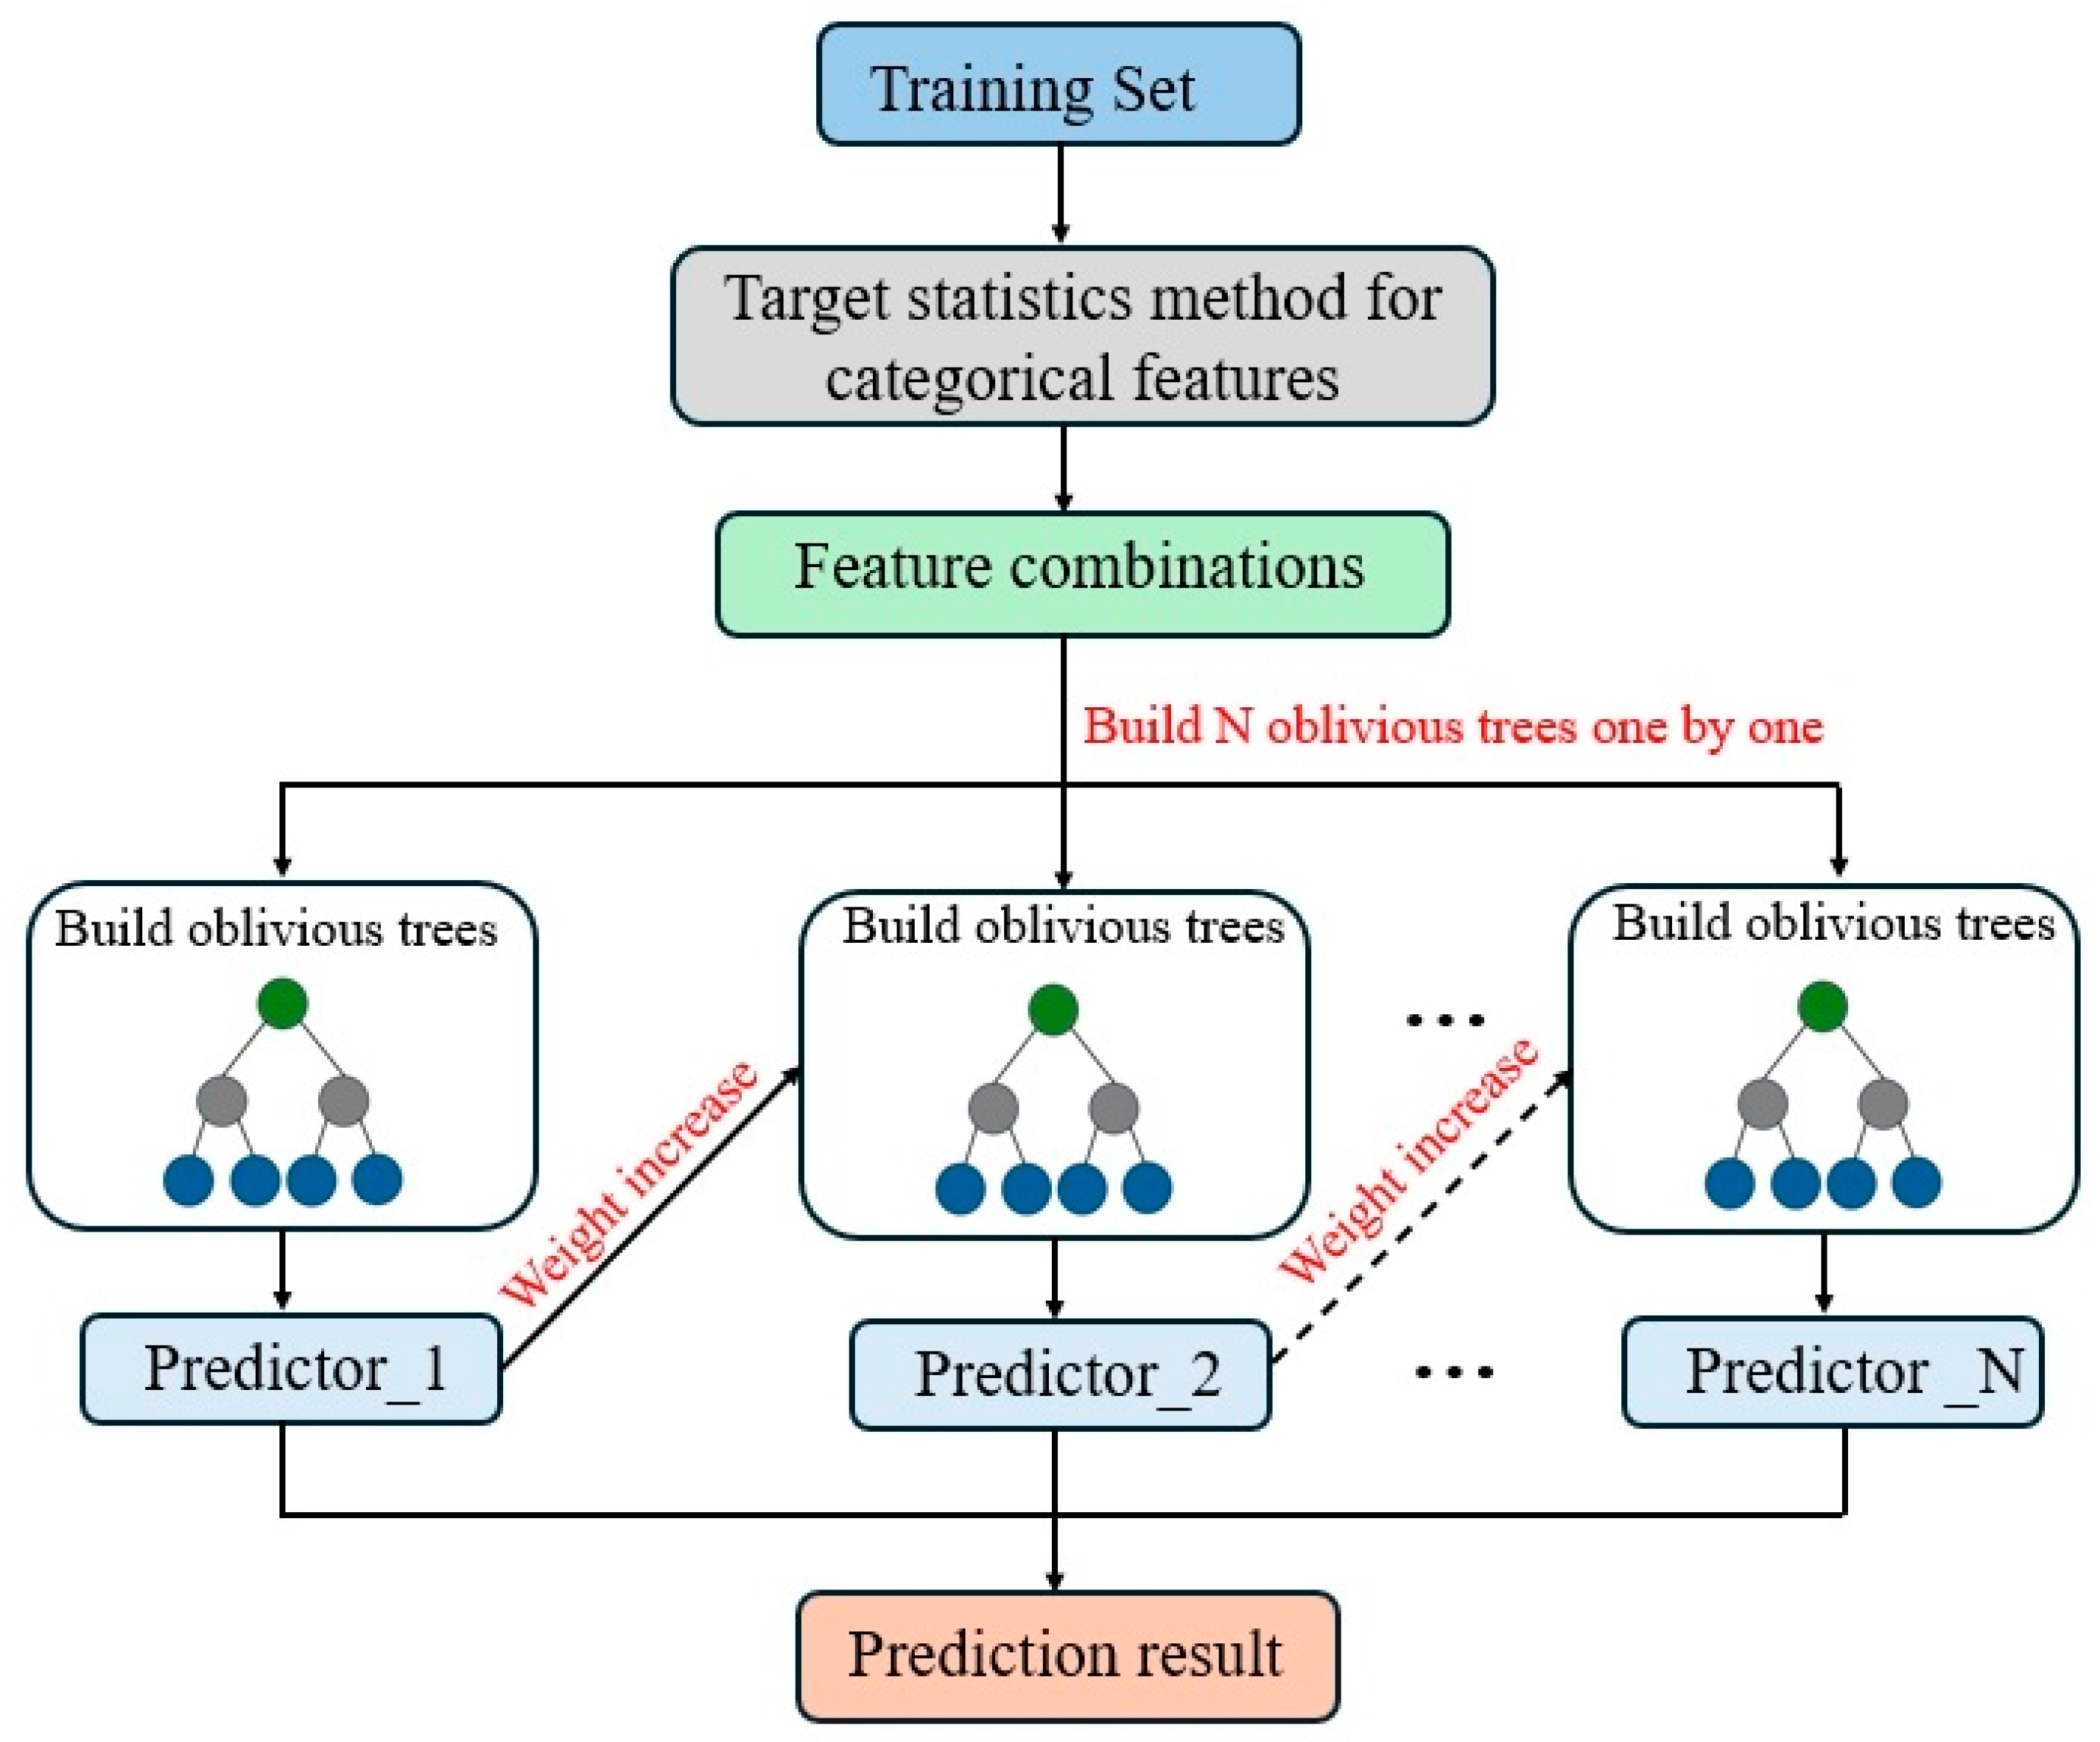
3.1. CatBoost
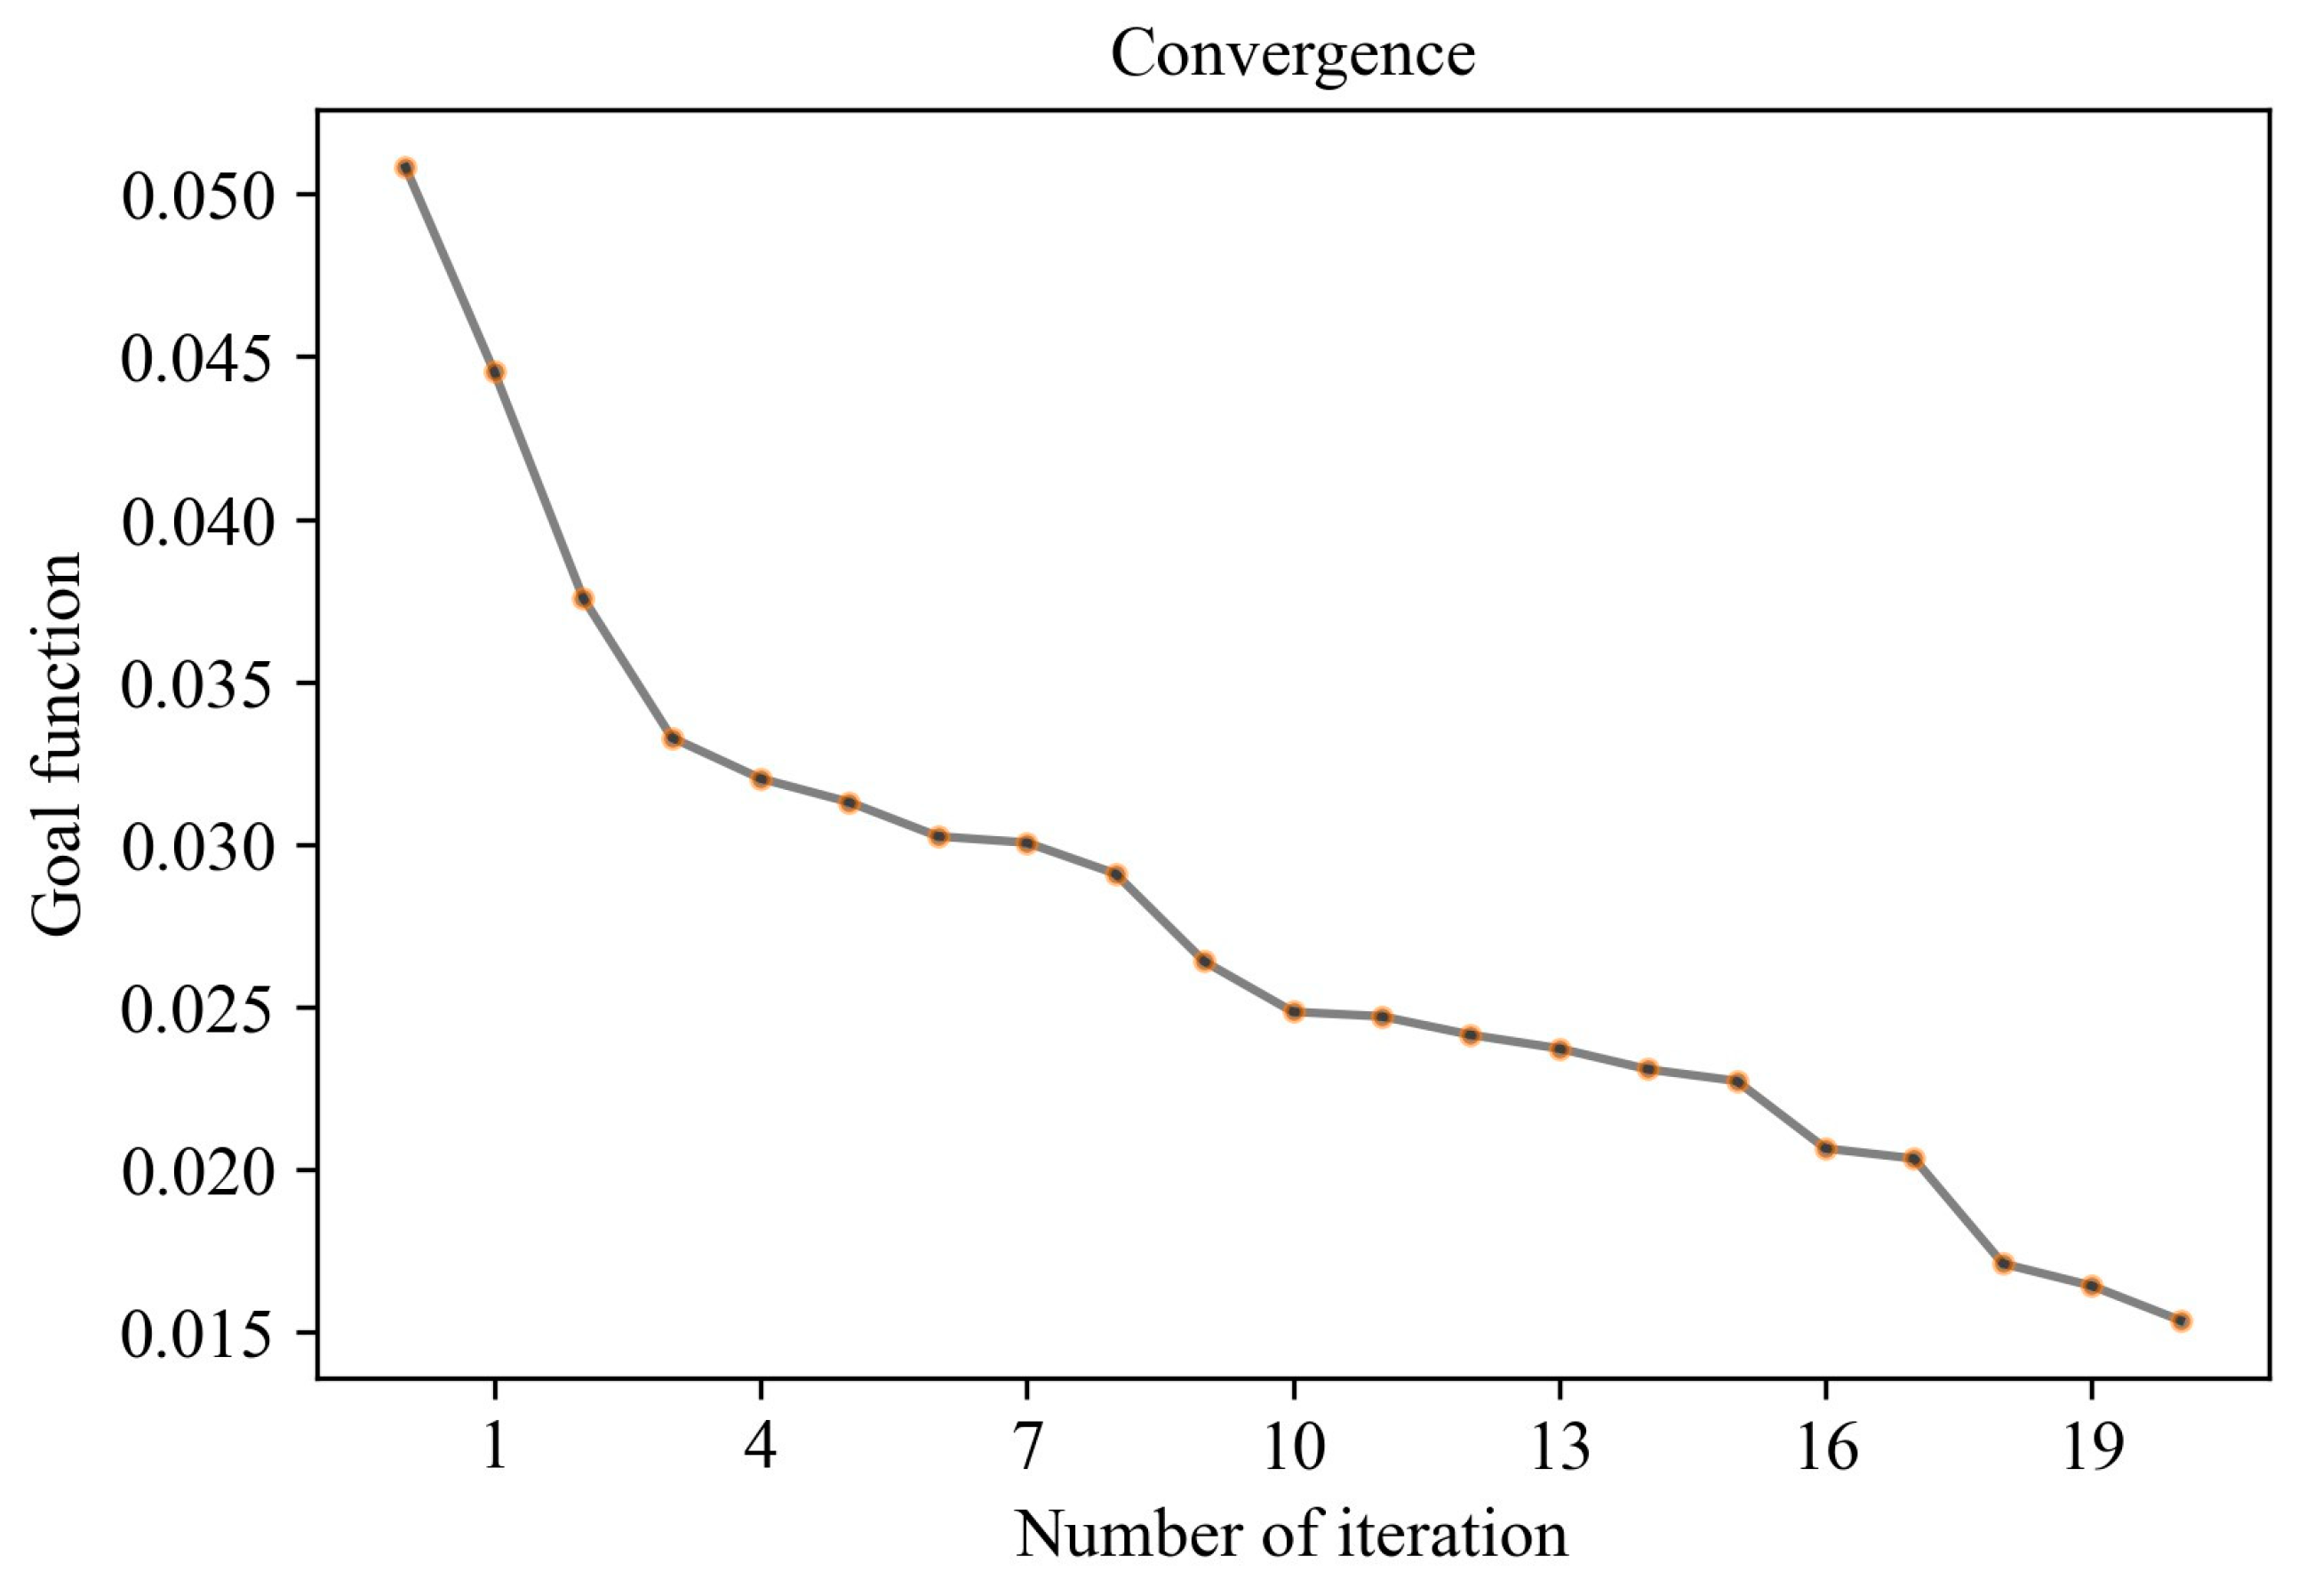
3.2. SHGO
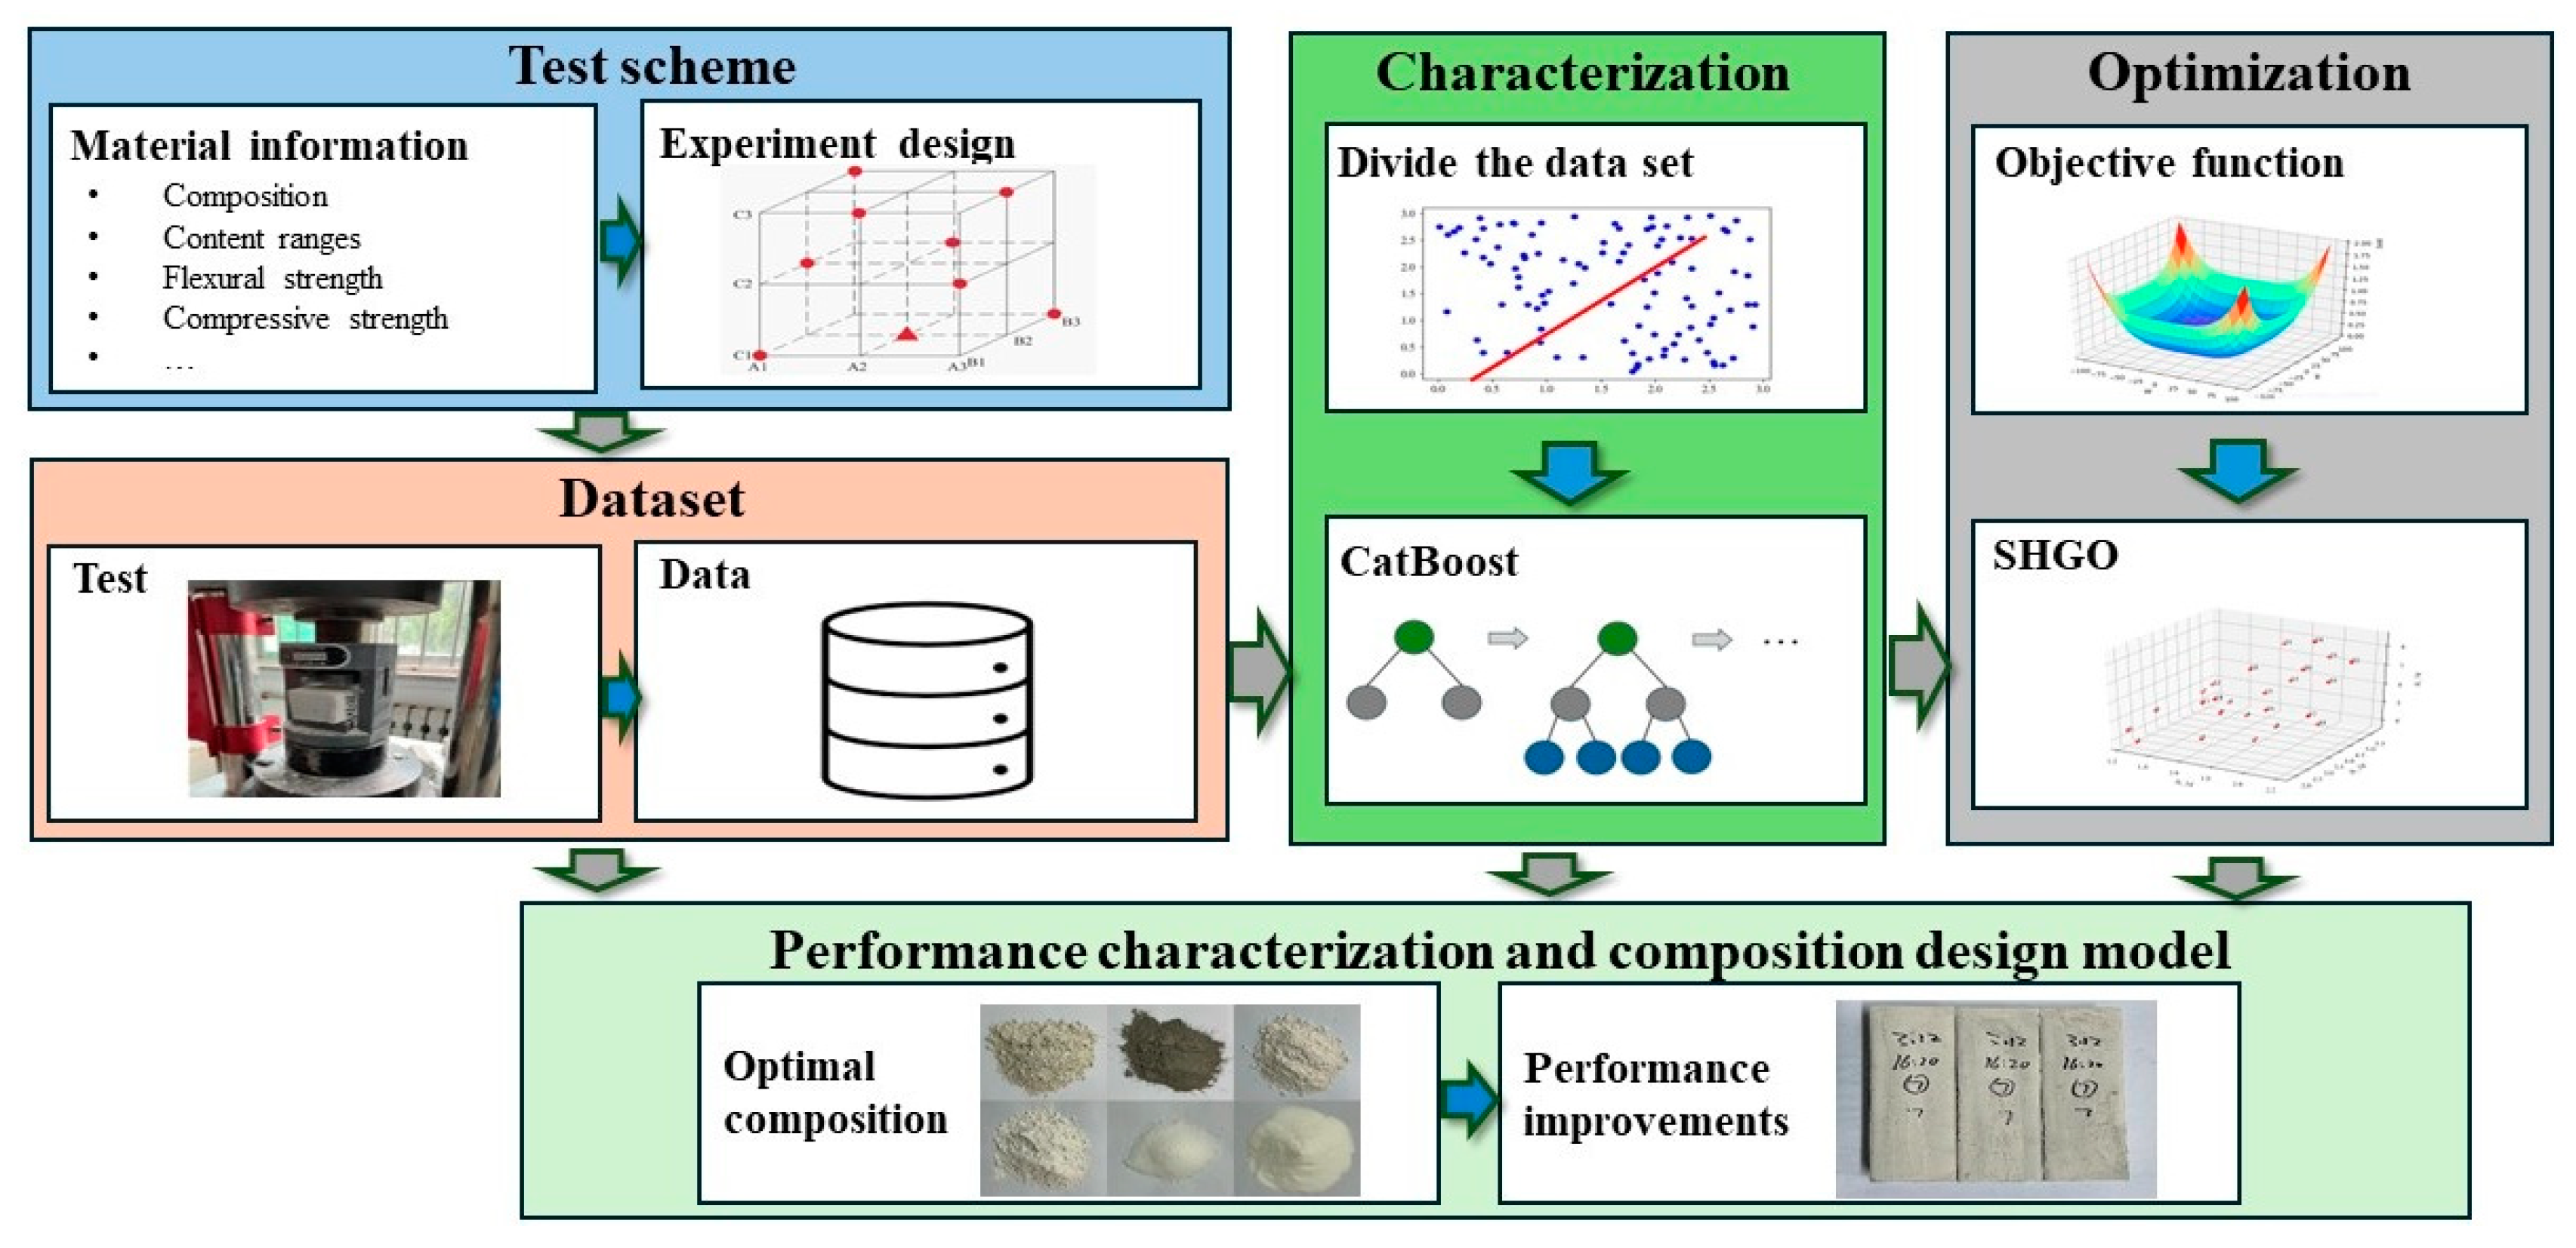
3.3. Performance Characterization and Composition Design Based on CatBoost and SHGO
- Step 1: Collect the relevant information on slag–desulfurization gypsum-based alkali-activated materials and determine their main compositions and key performance based on the engineering requirement.
- Step 2: Determine the test scheme based on the experimental design method.
- Step 3: Implement the test scheme and obtain the materials’ performance.
- Step 4: Analyze the test results and generate the samples for the CatBoost algorithm.
- Step 5: Characterize the performance based on the CatBoost model and test data.
- Step 6: Generate the optimization model based on the CatBoost-based performance characterization model.
- Step 7: Build the composition design model based on the CatBoost-based performance characterization and SHGO.
- Step 8: Obtain the optimal composition based on the CatBoost, SHGO, and tests.
4. Application
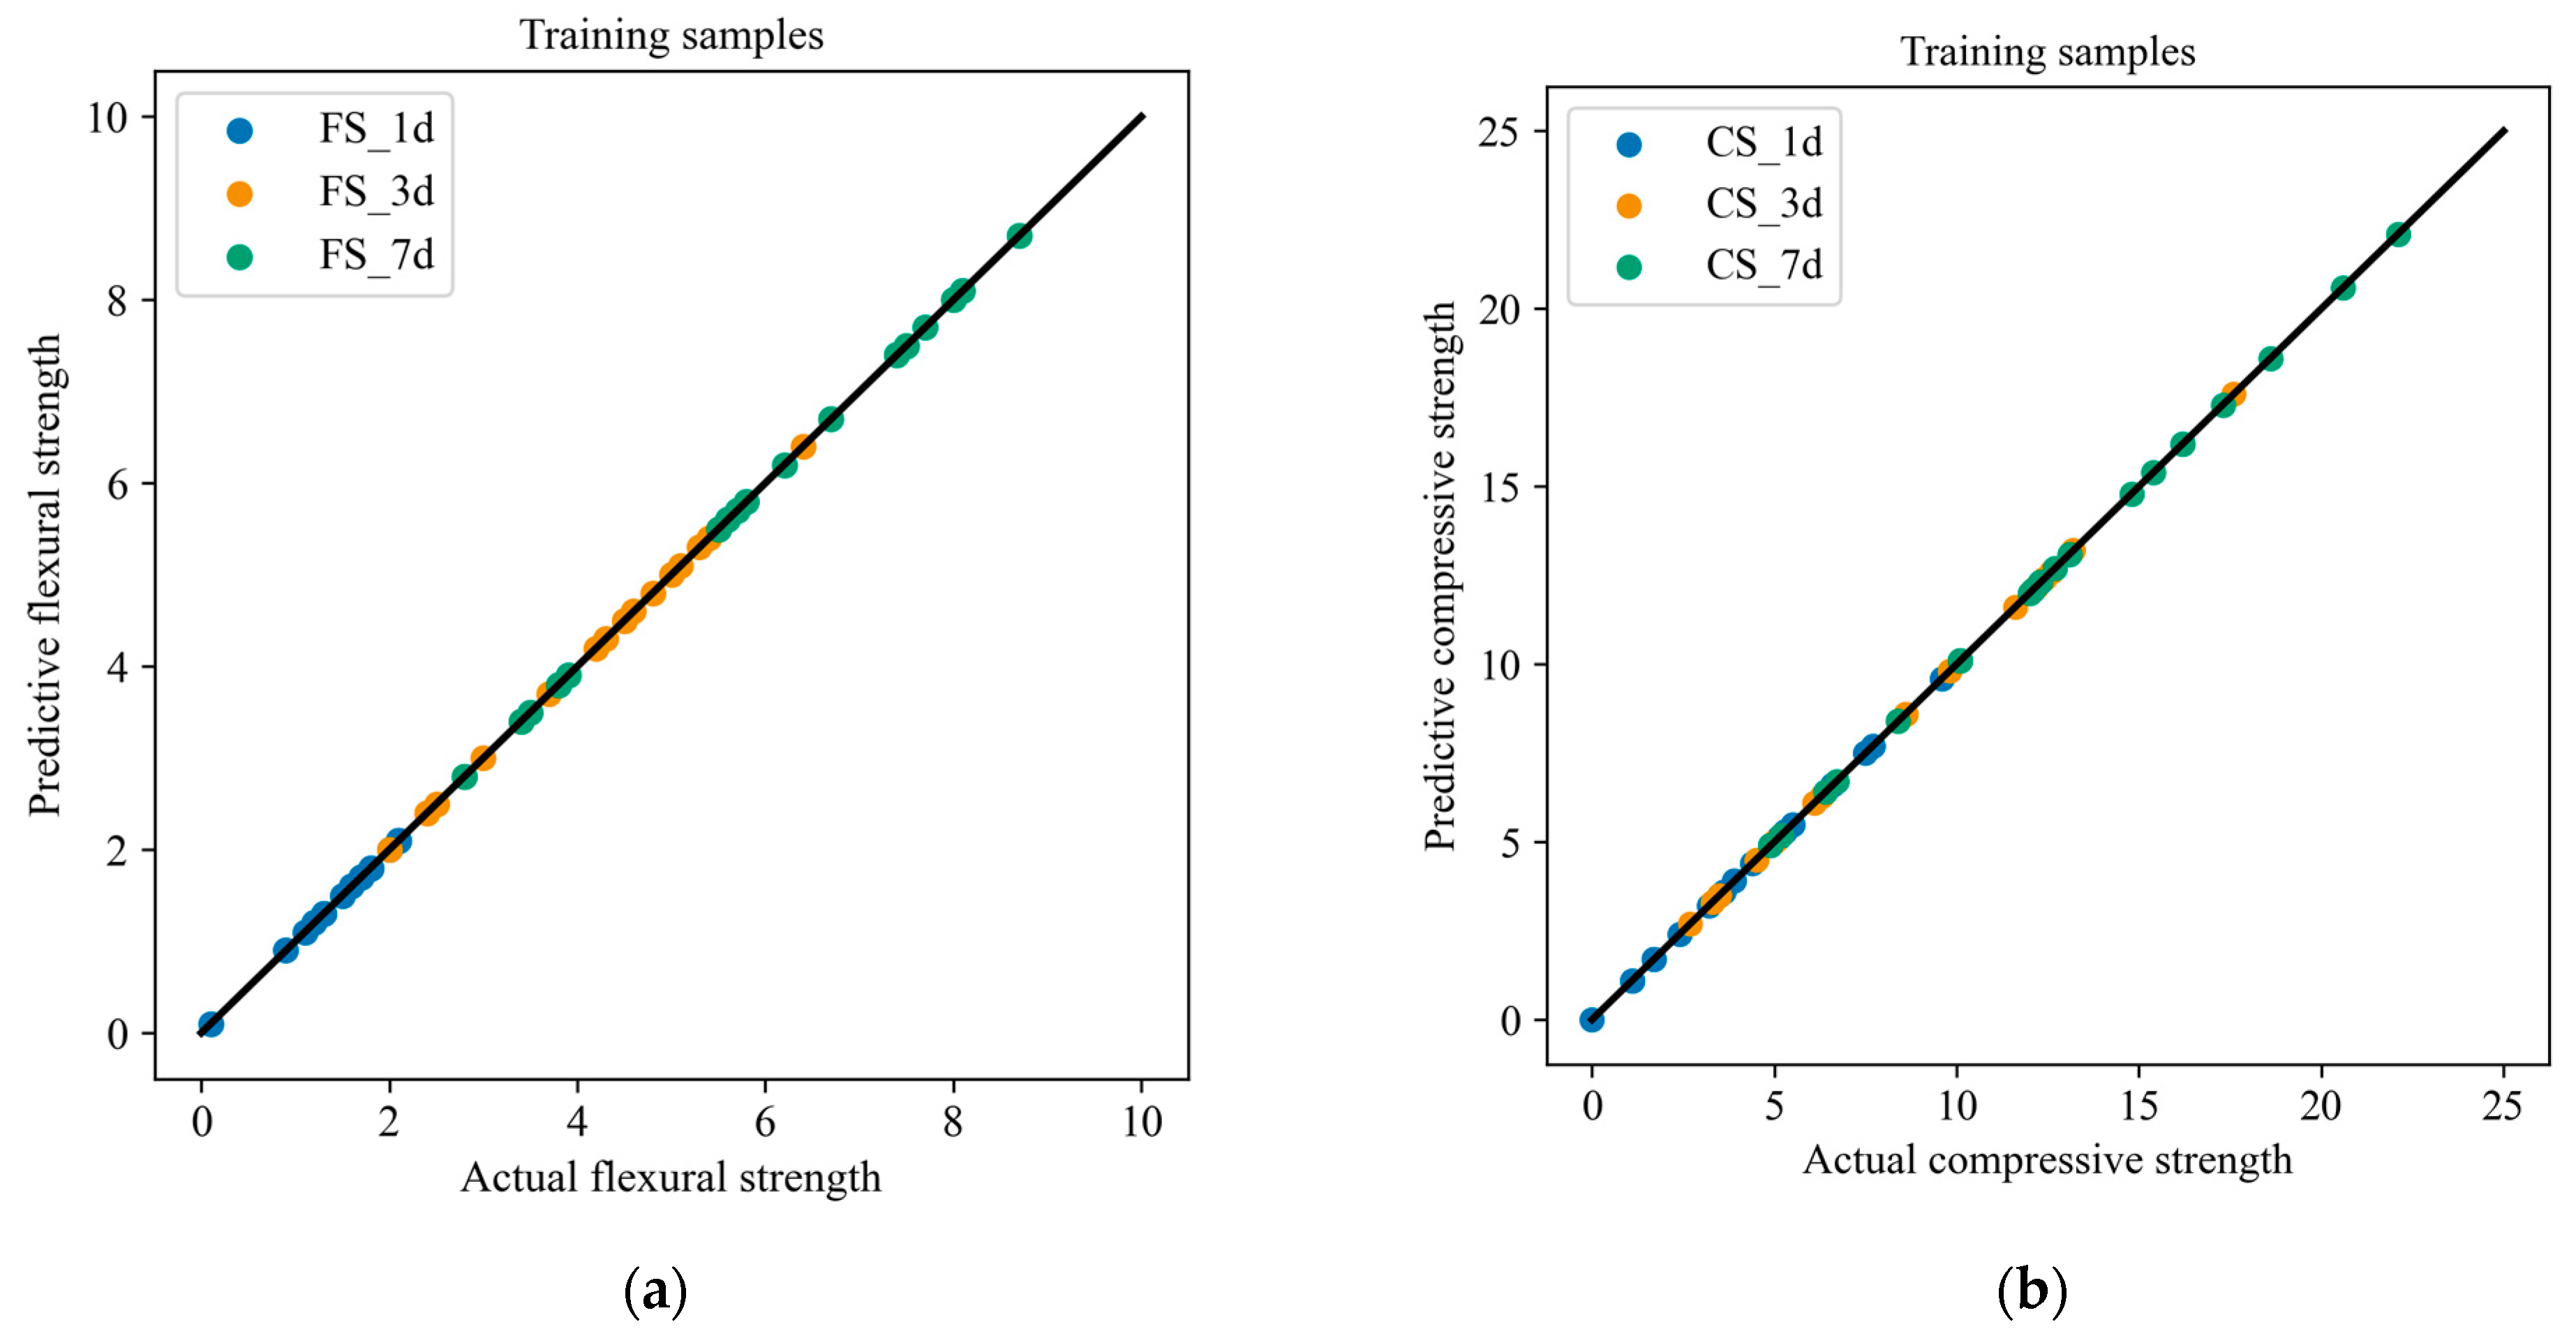
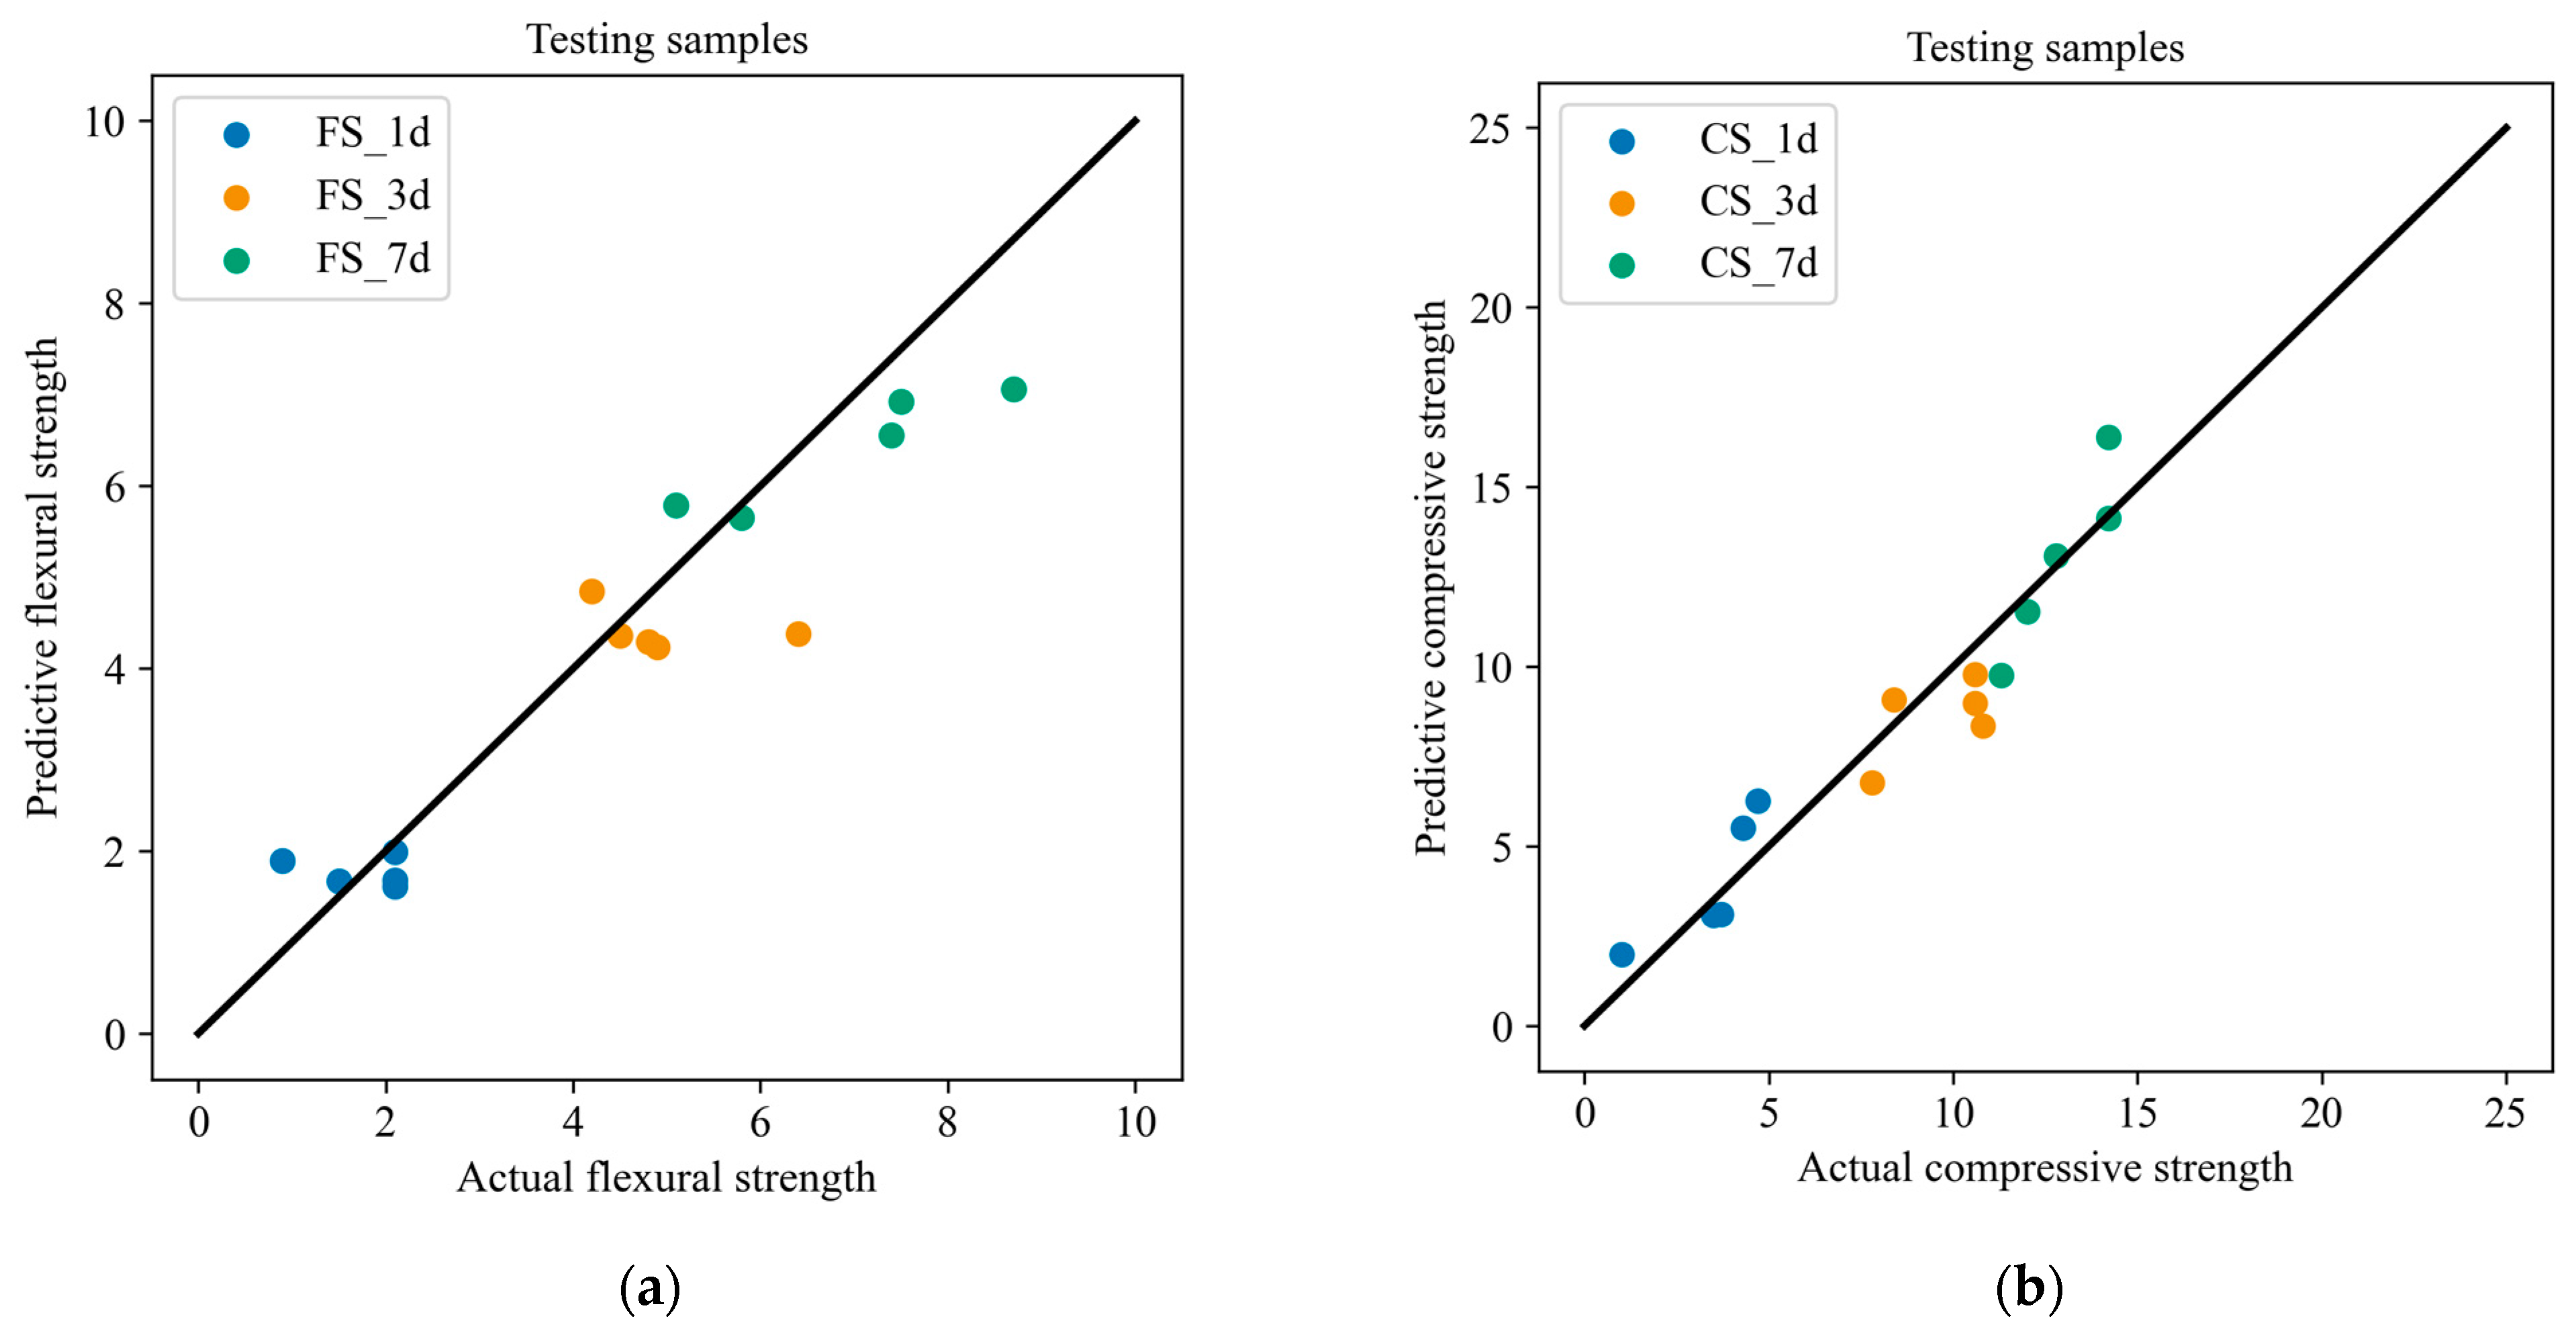
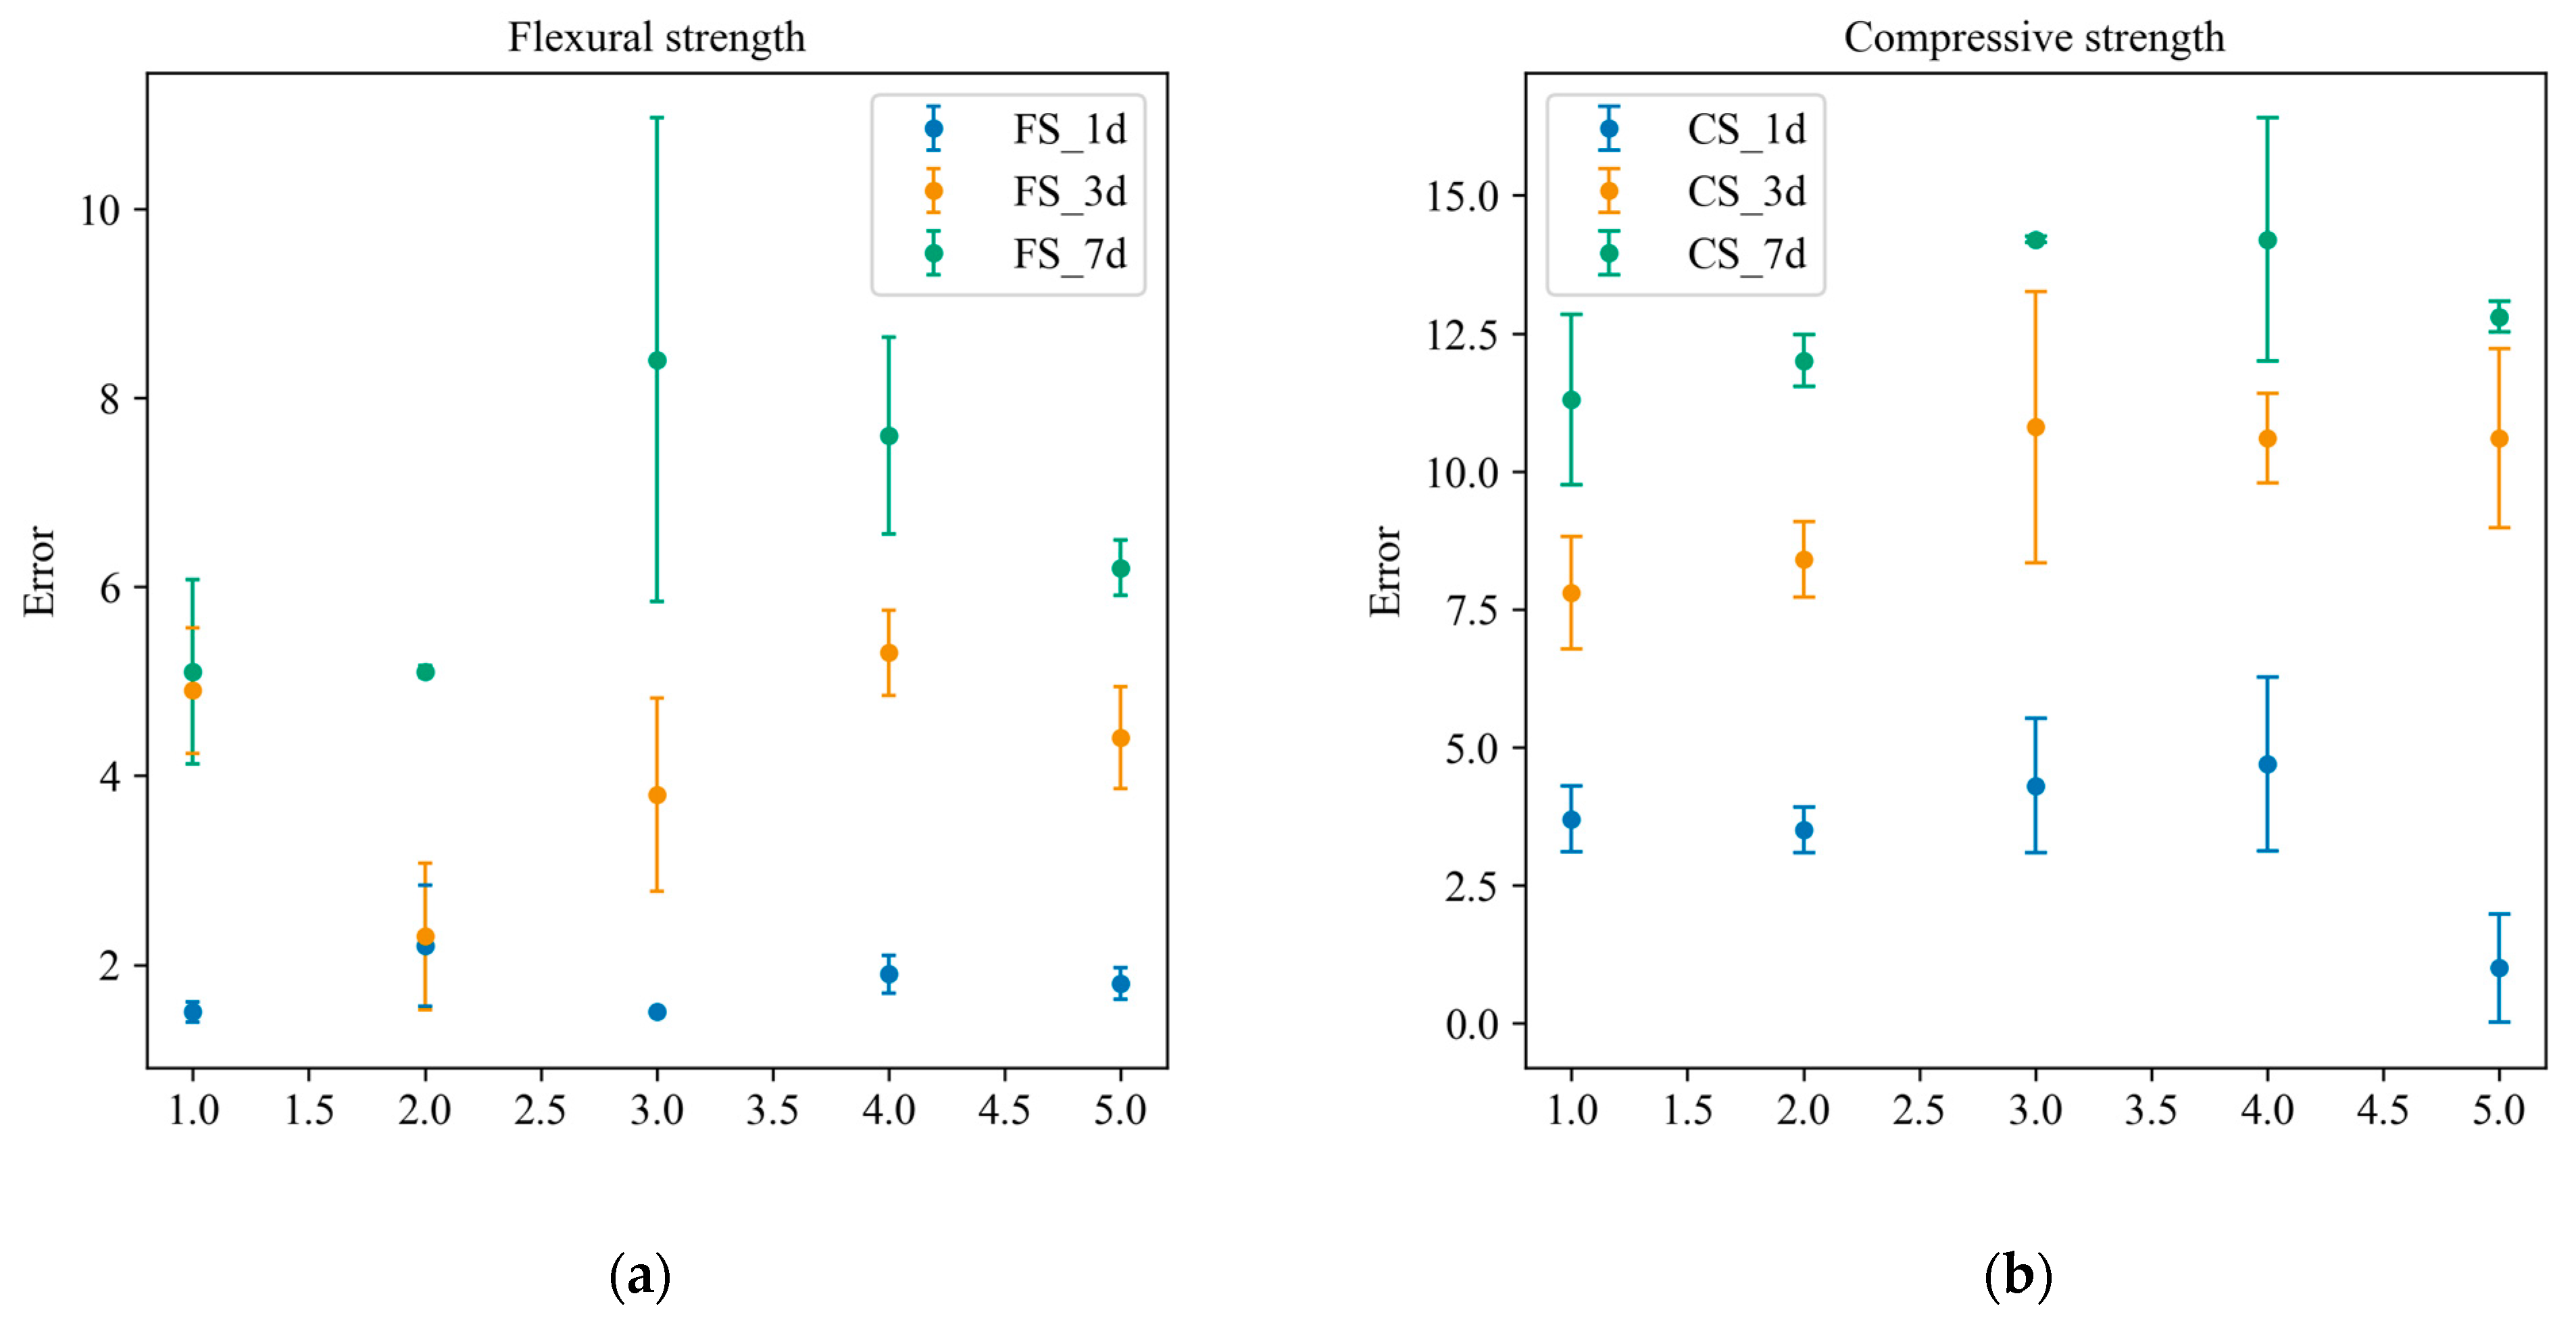
4.1. Performance Characterization
4.2. Composition Design
4.3. Discussion
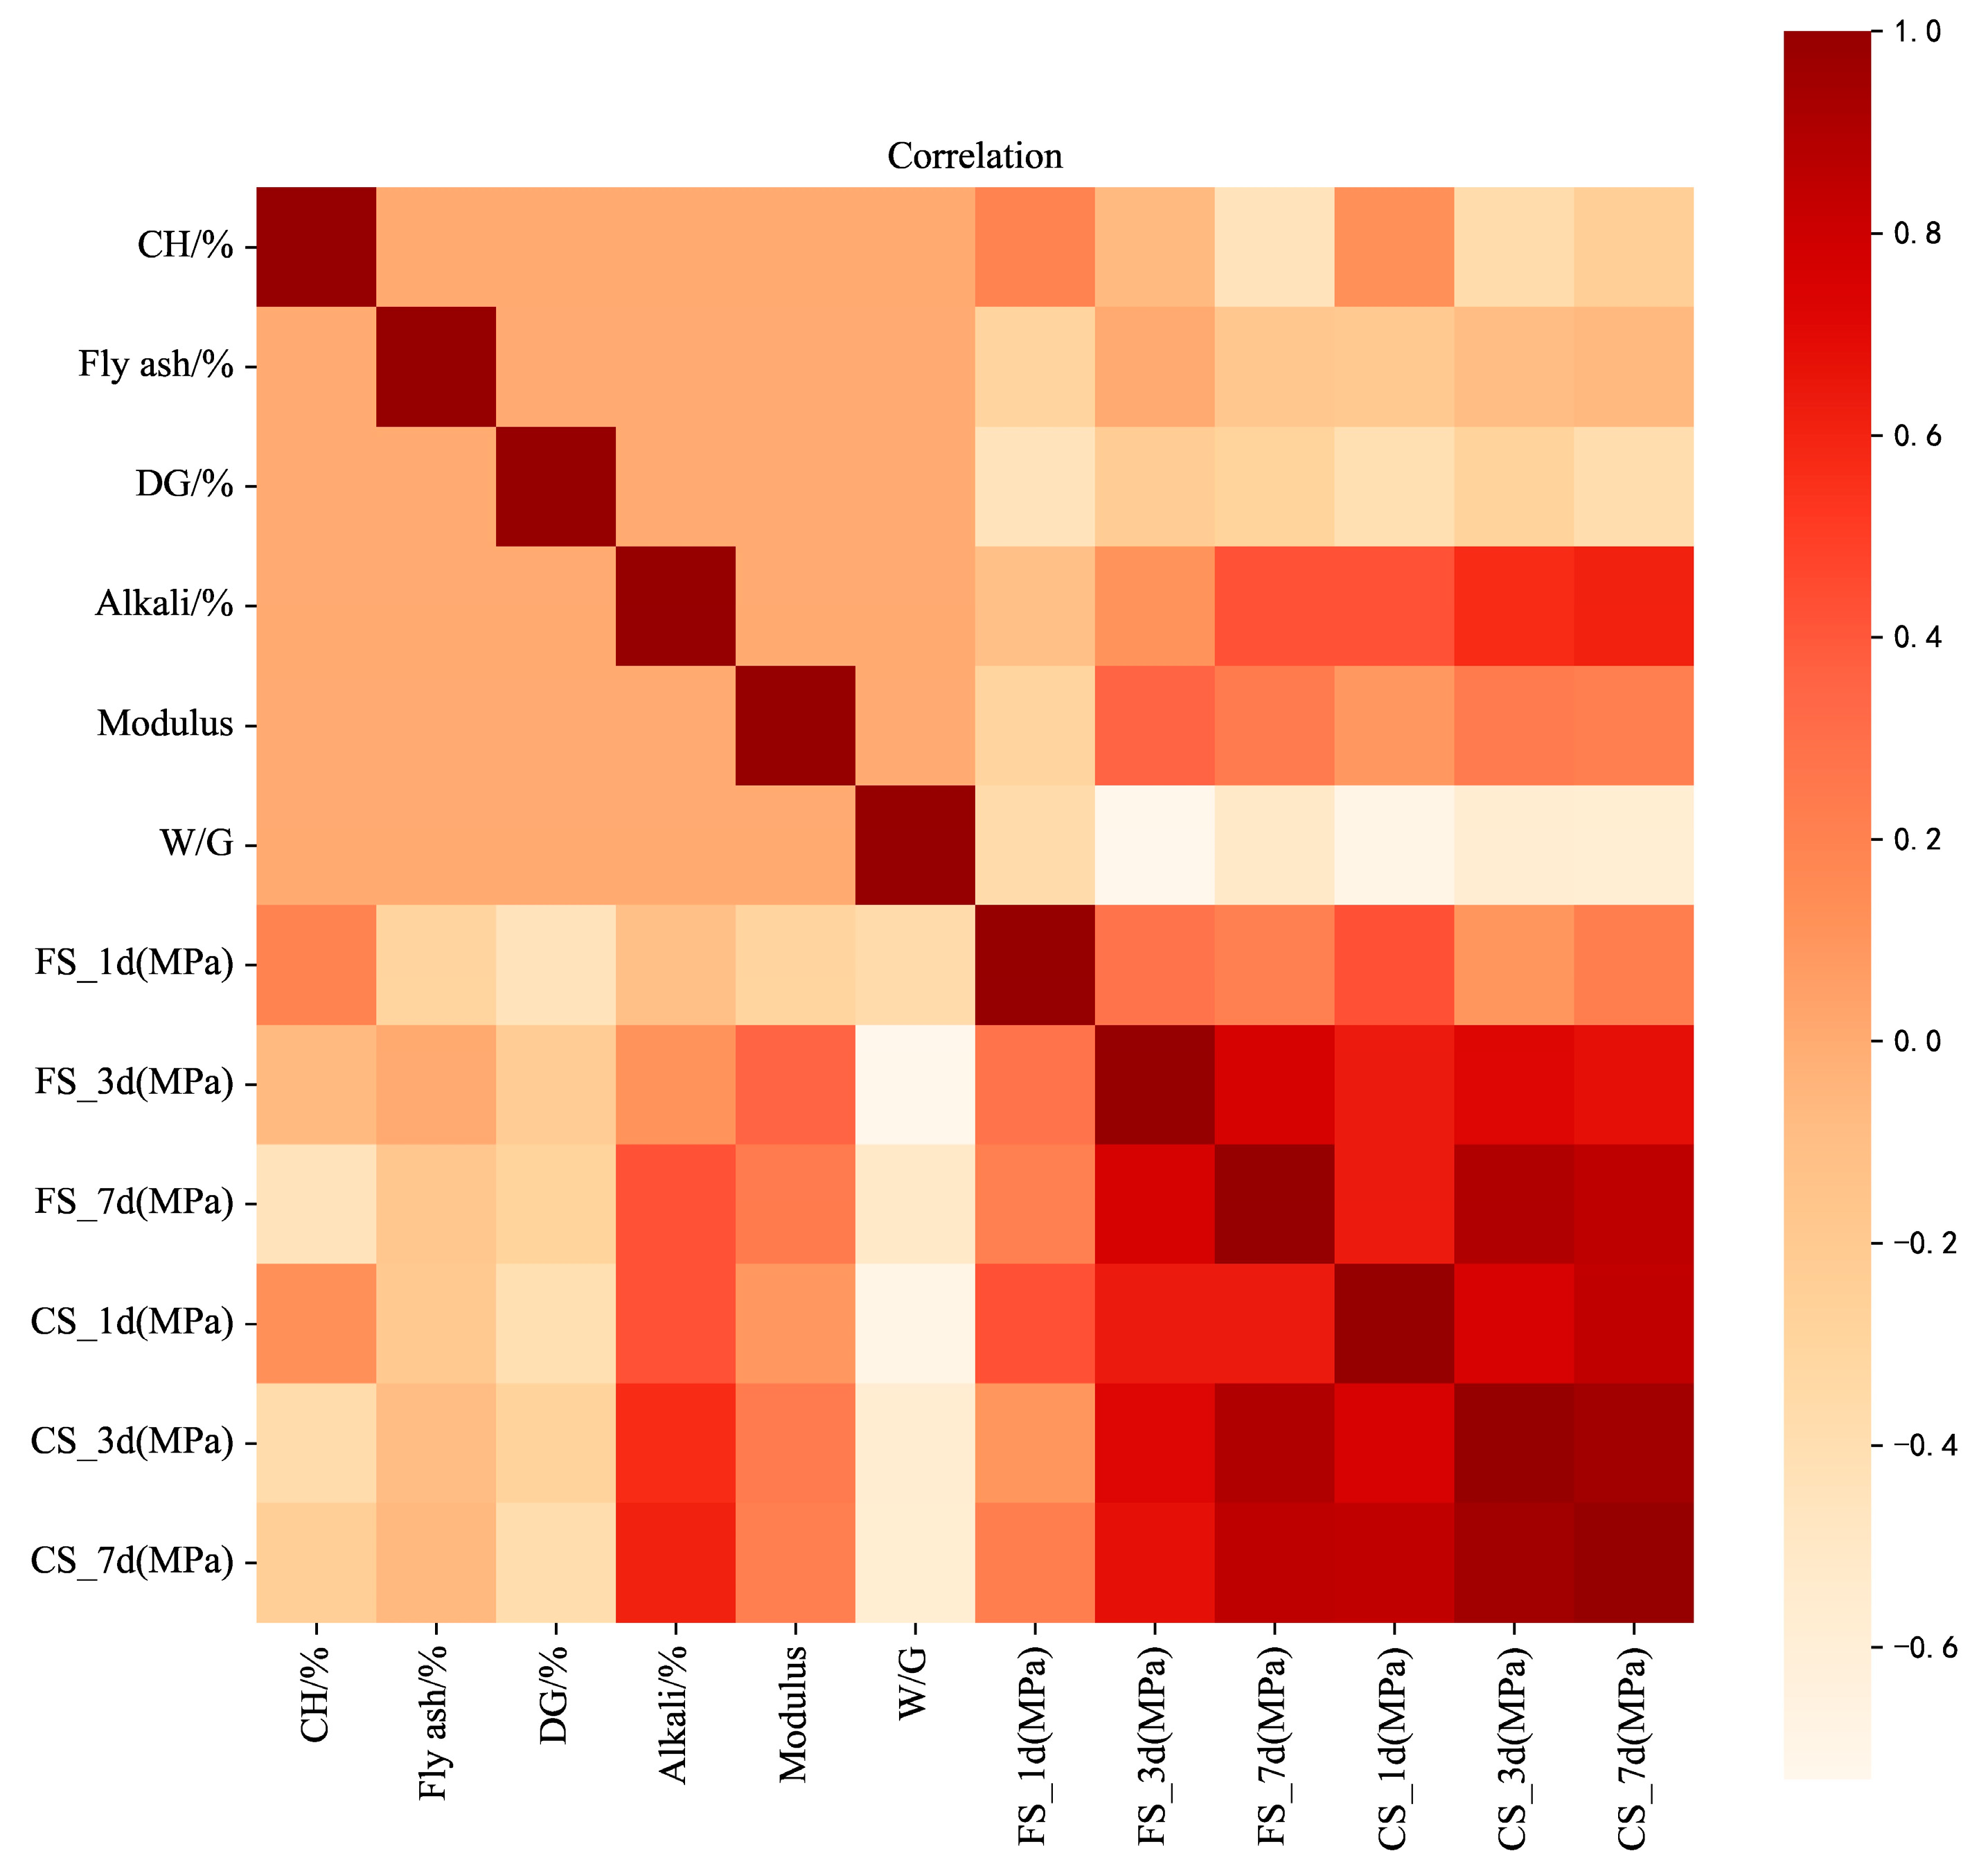
4.3.1. Correlation
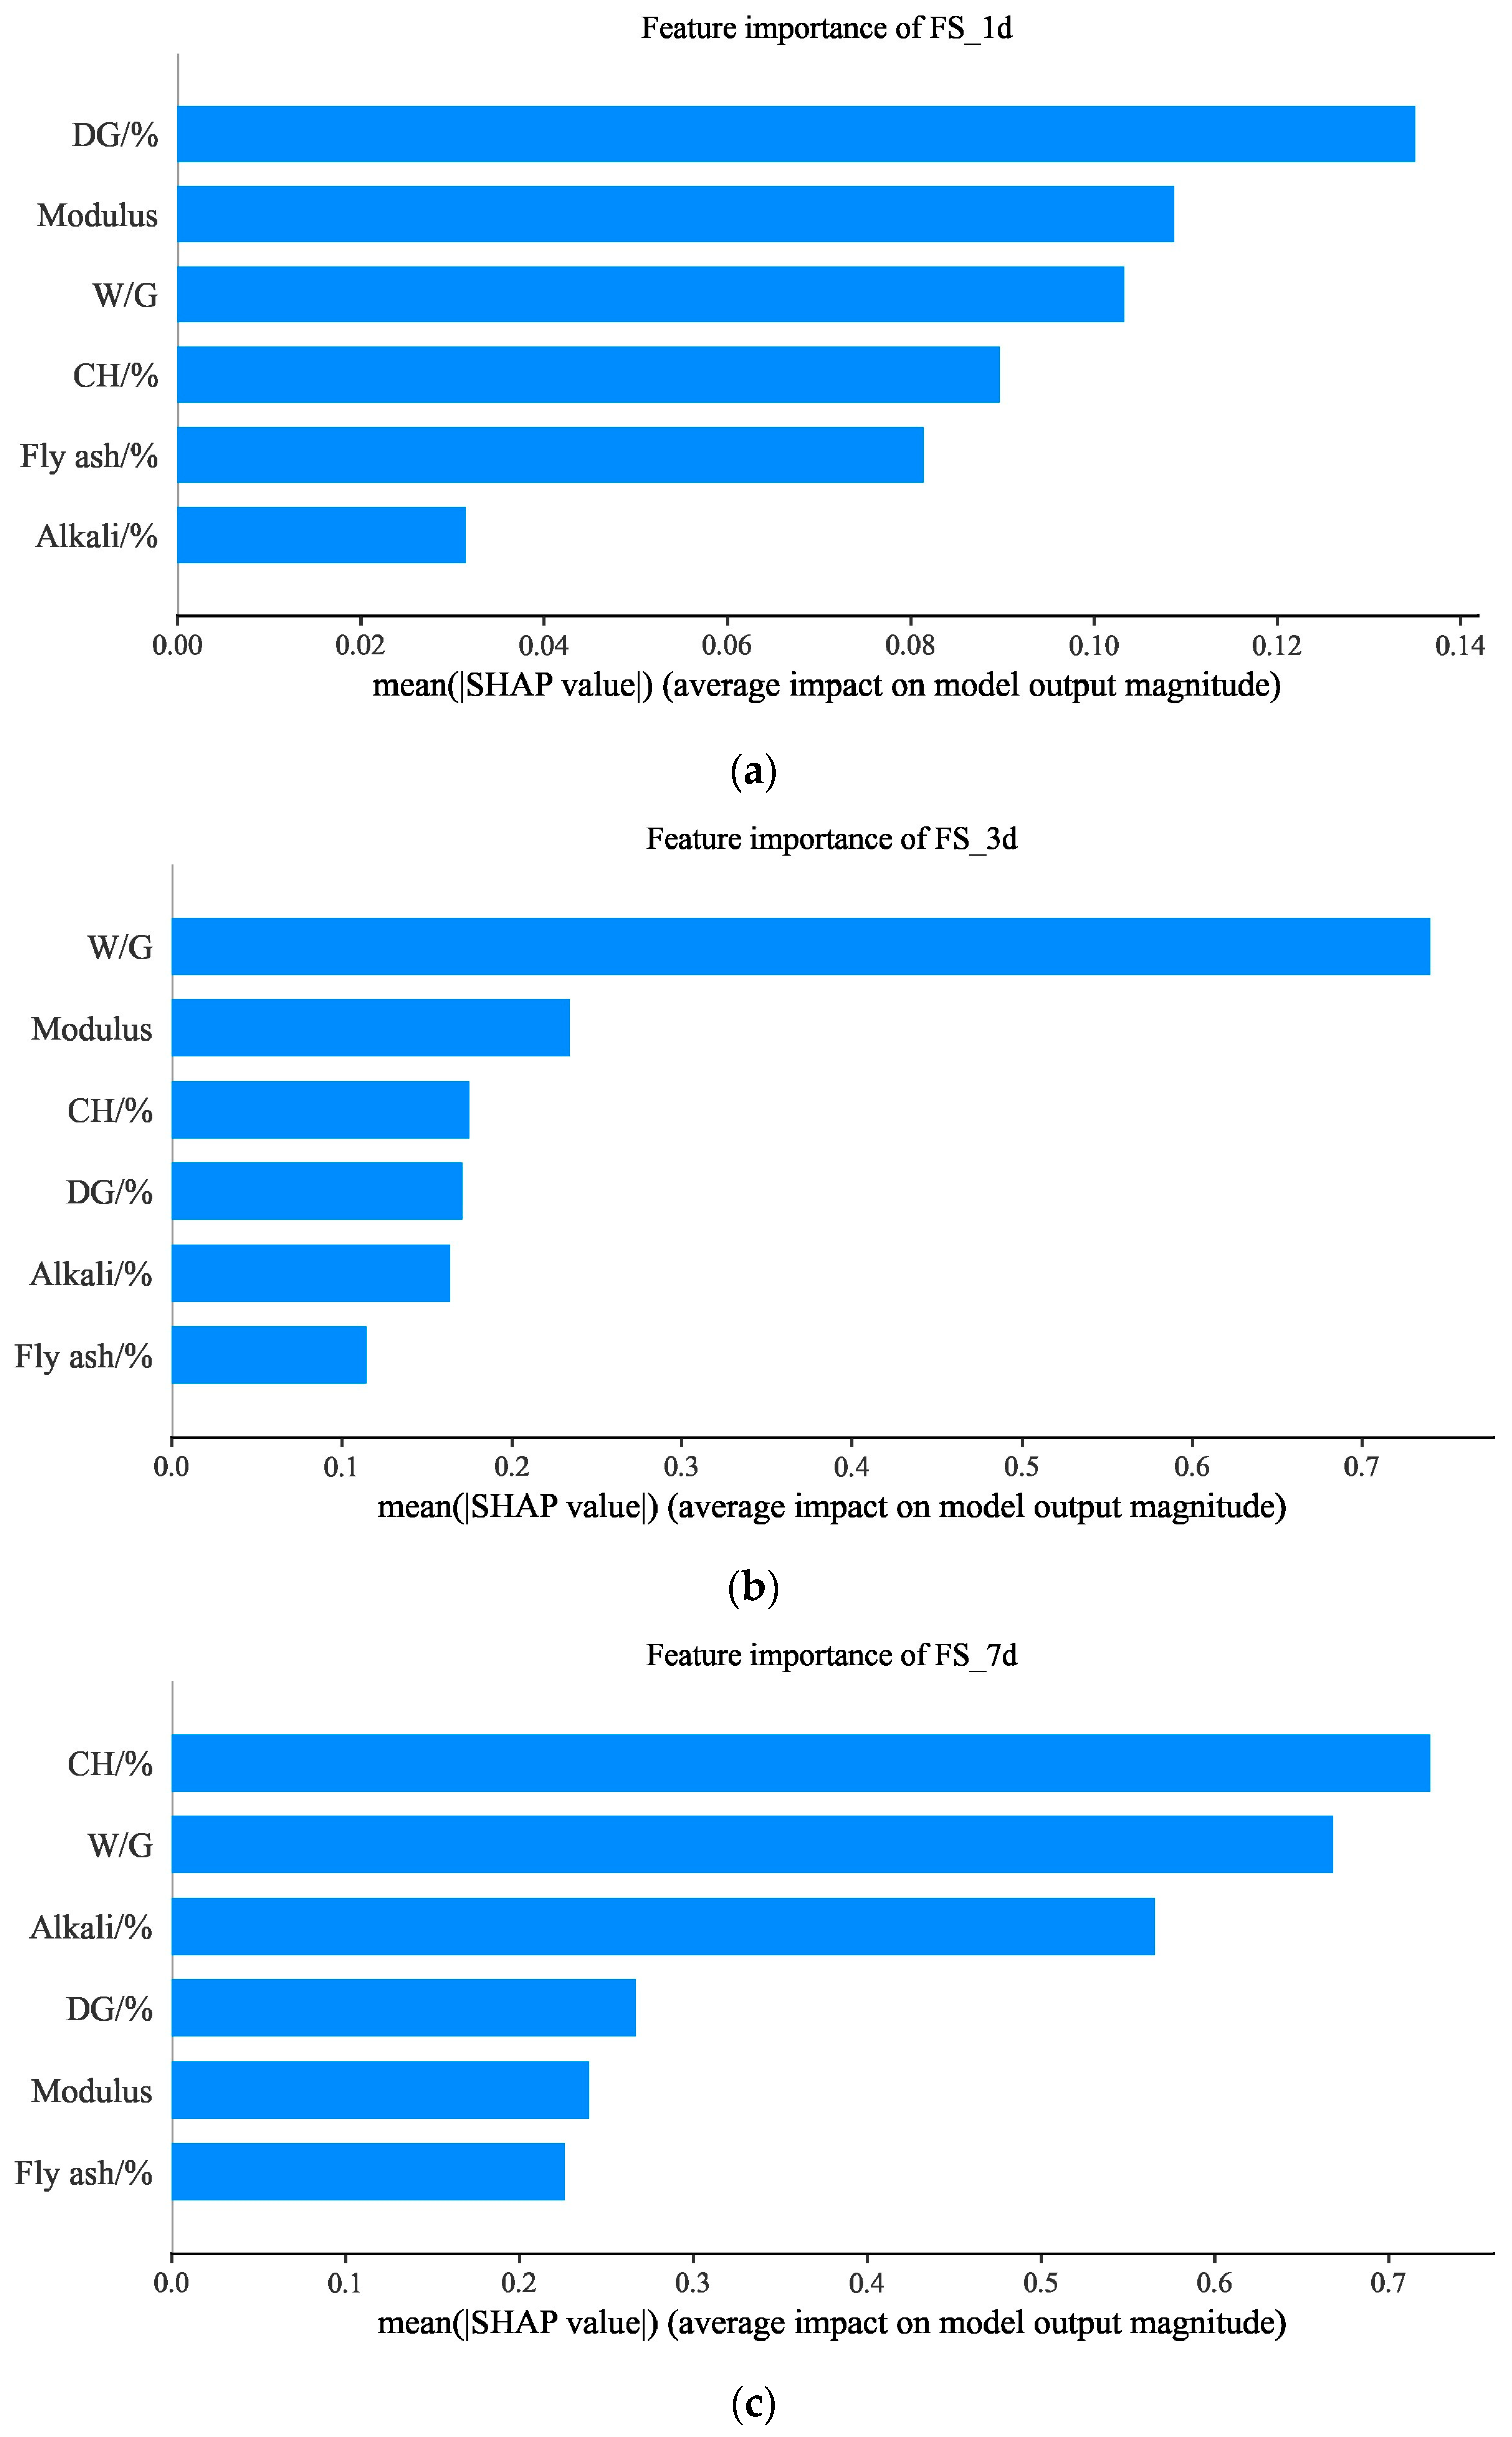
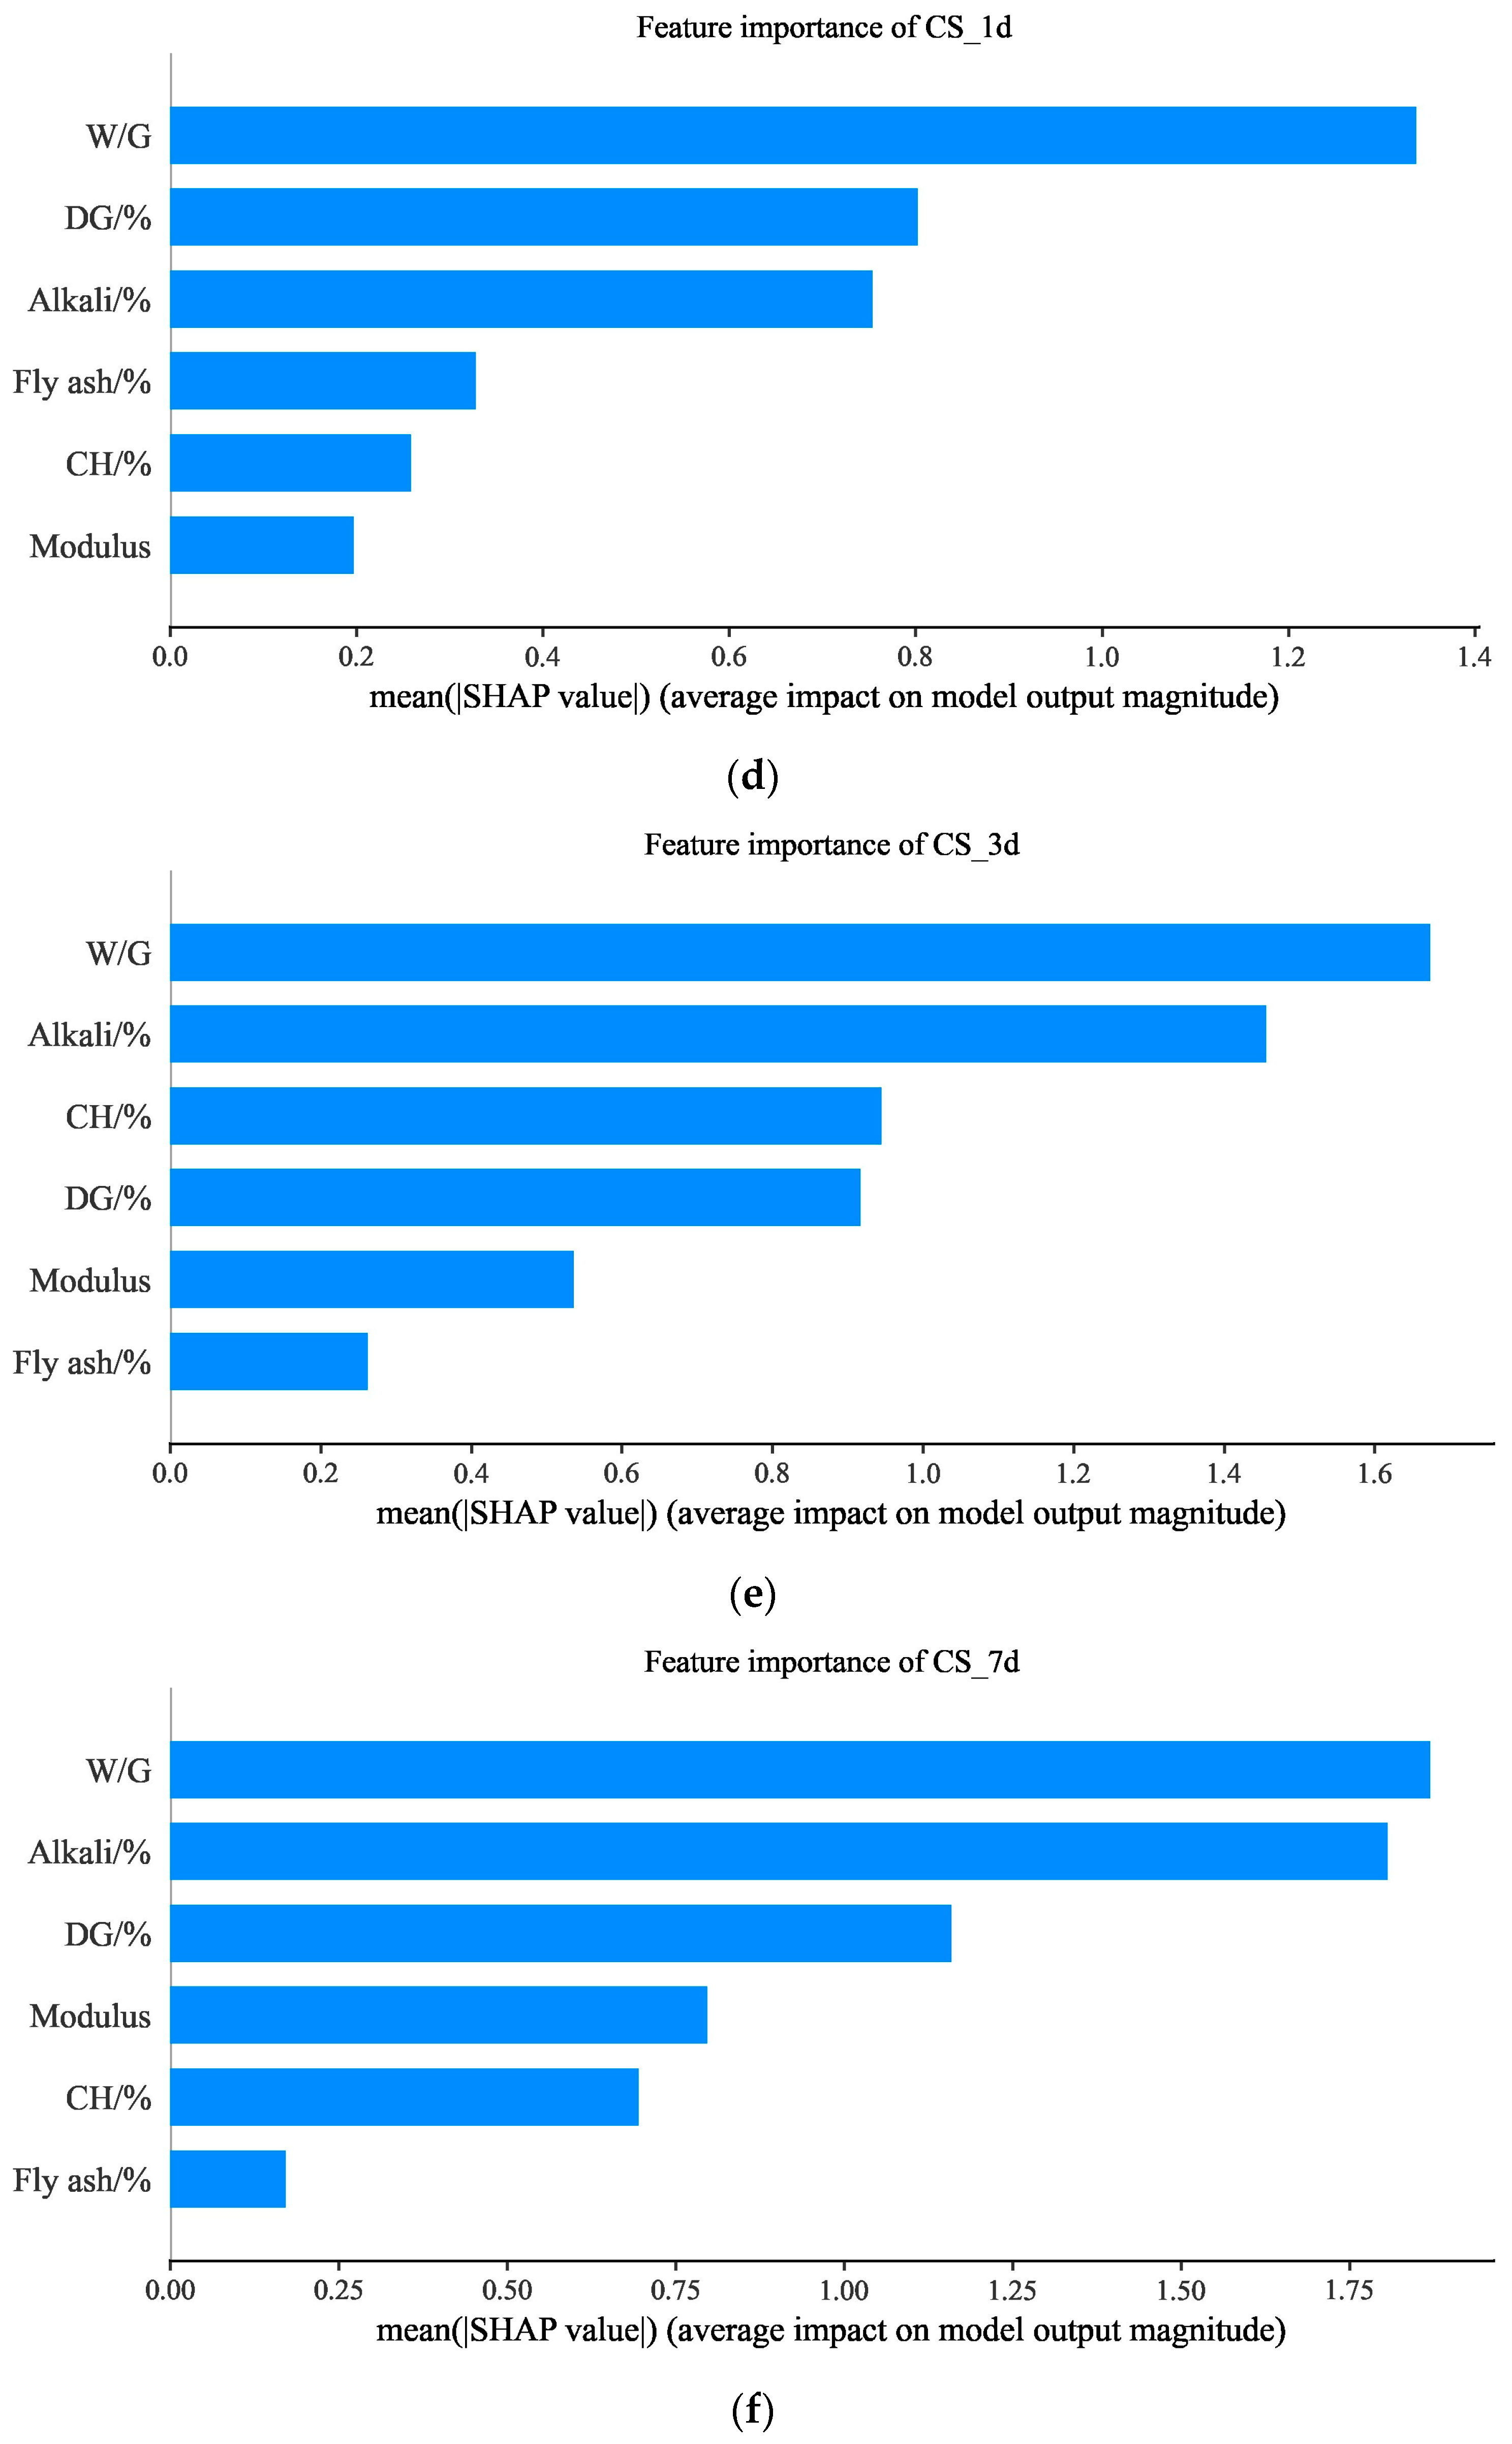
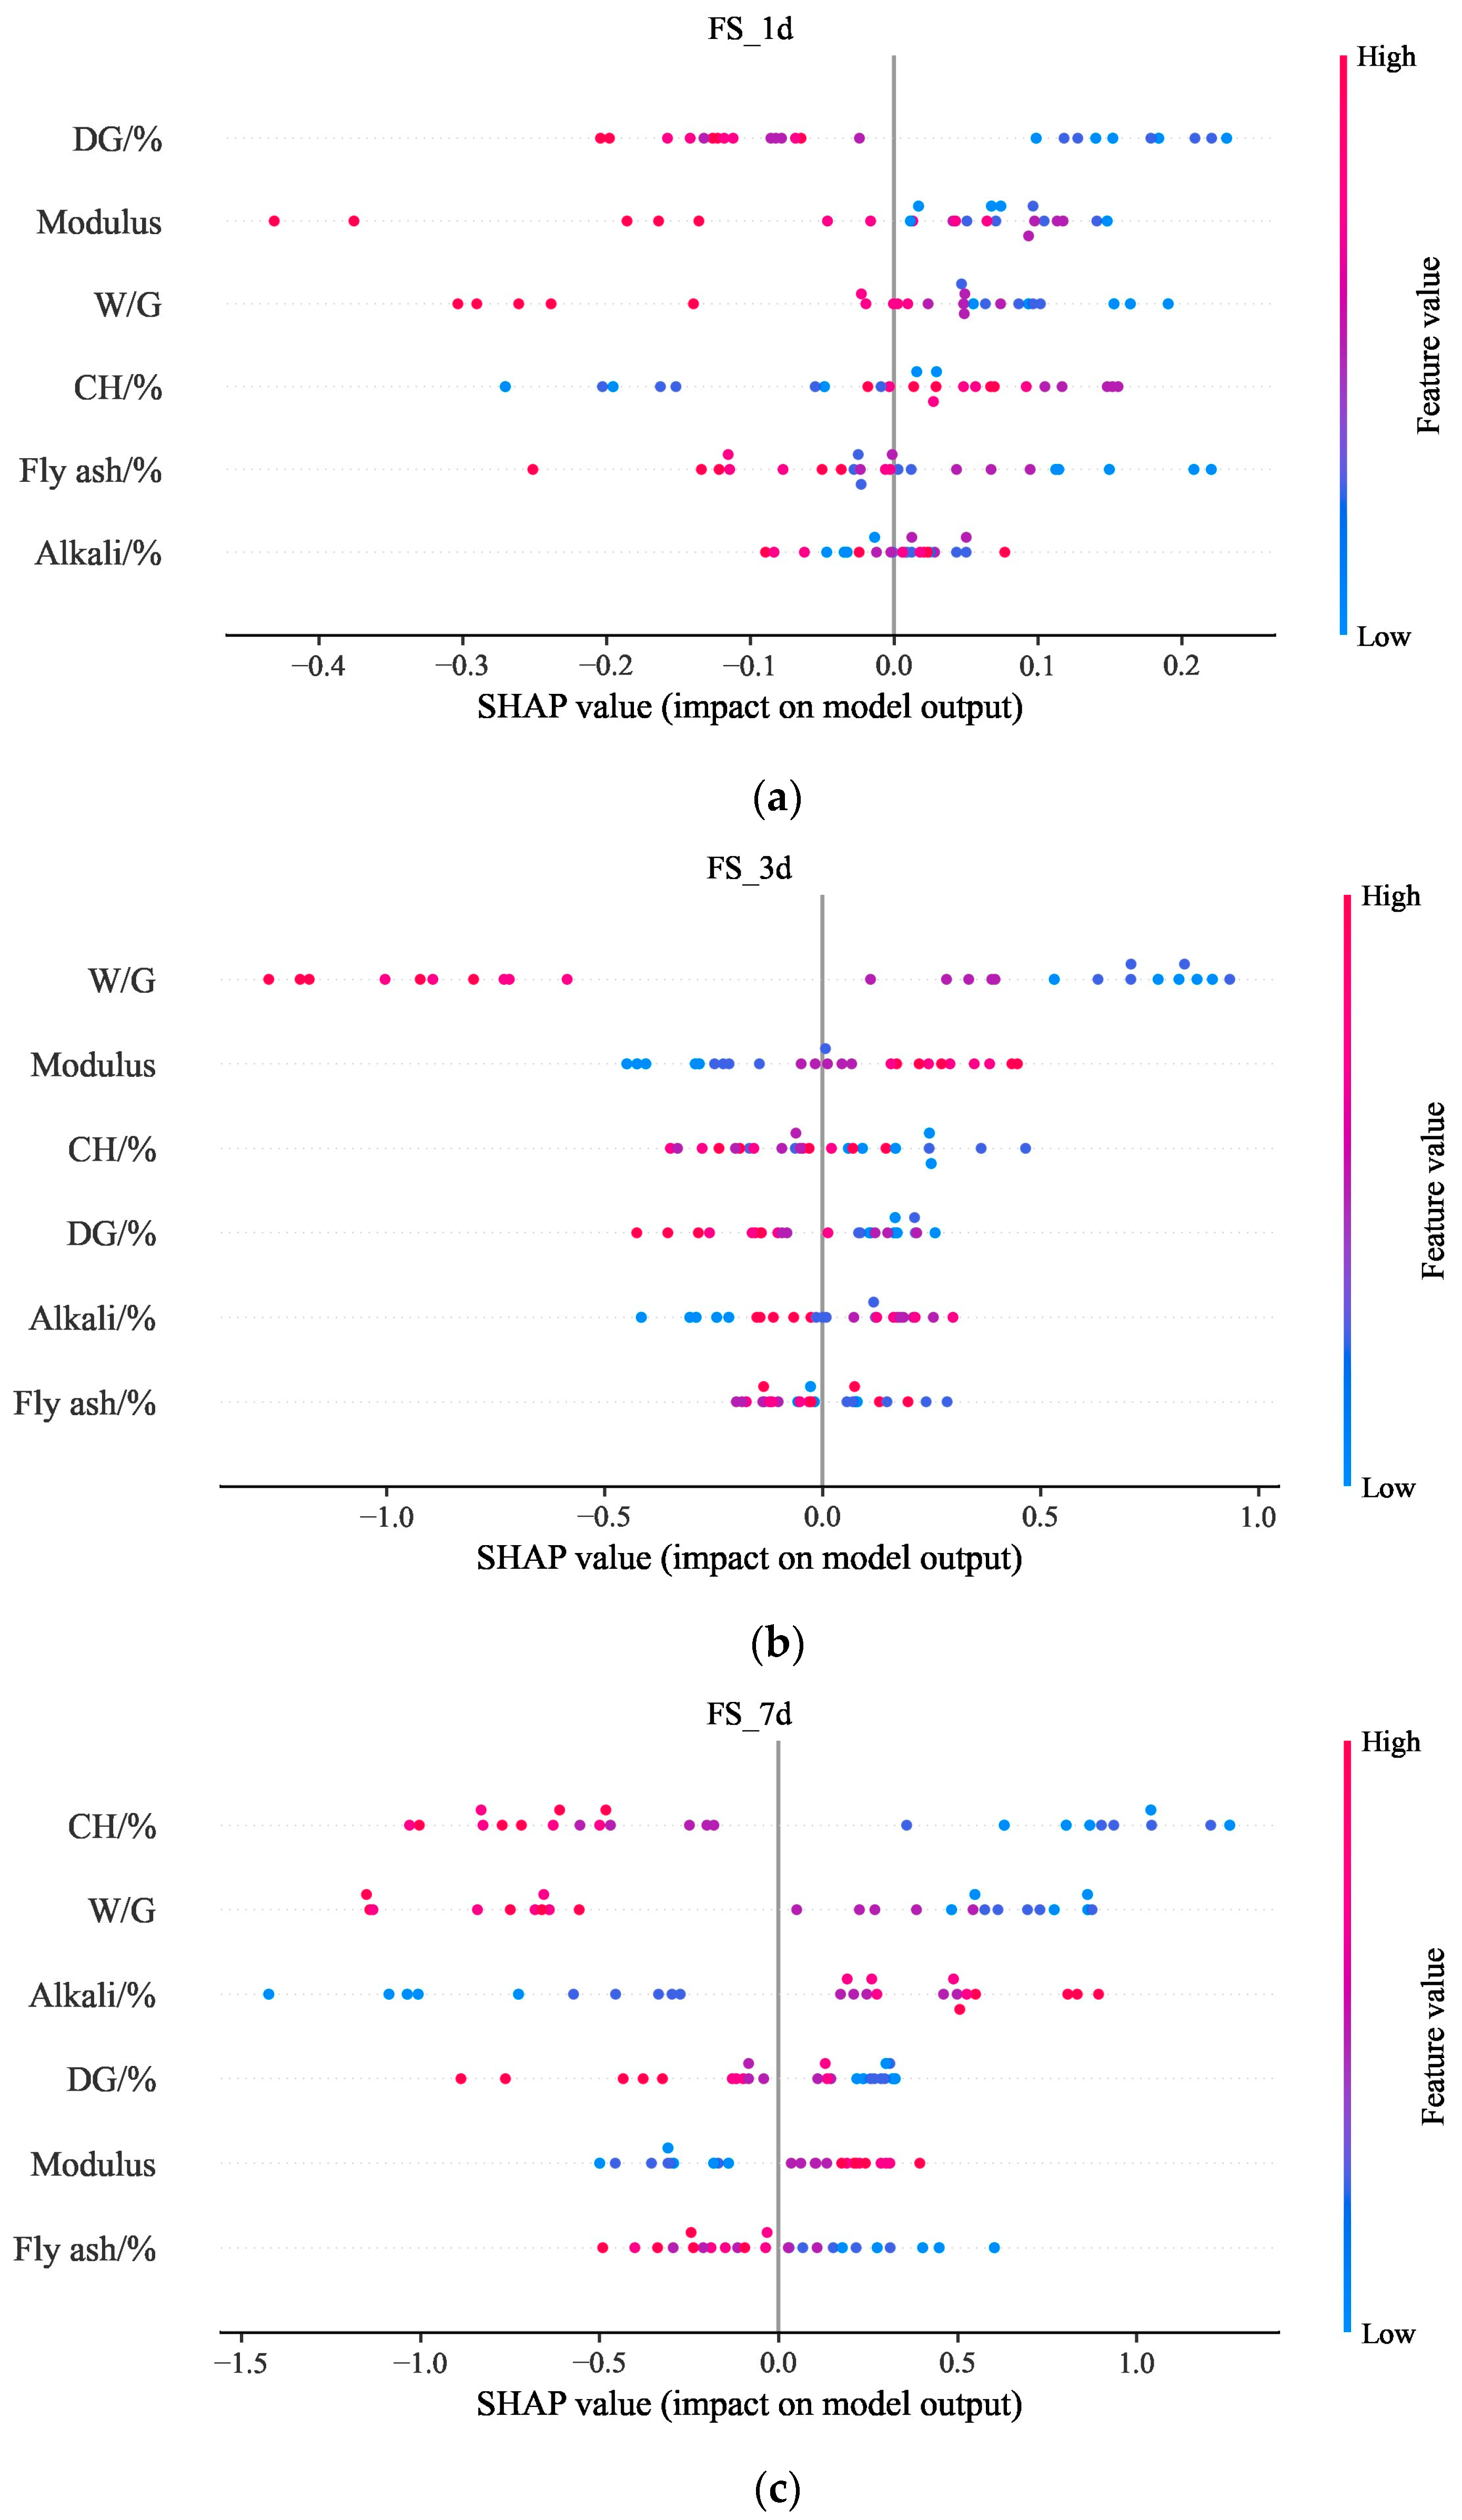
4.3.2. Feature Importance Based on SHAP
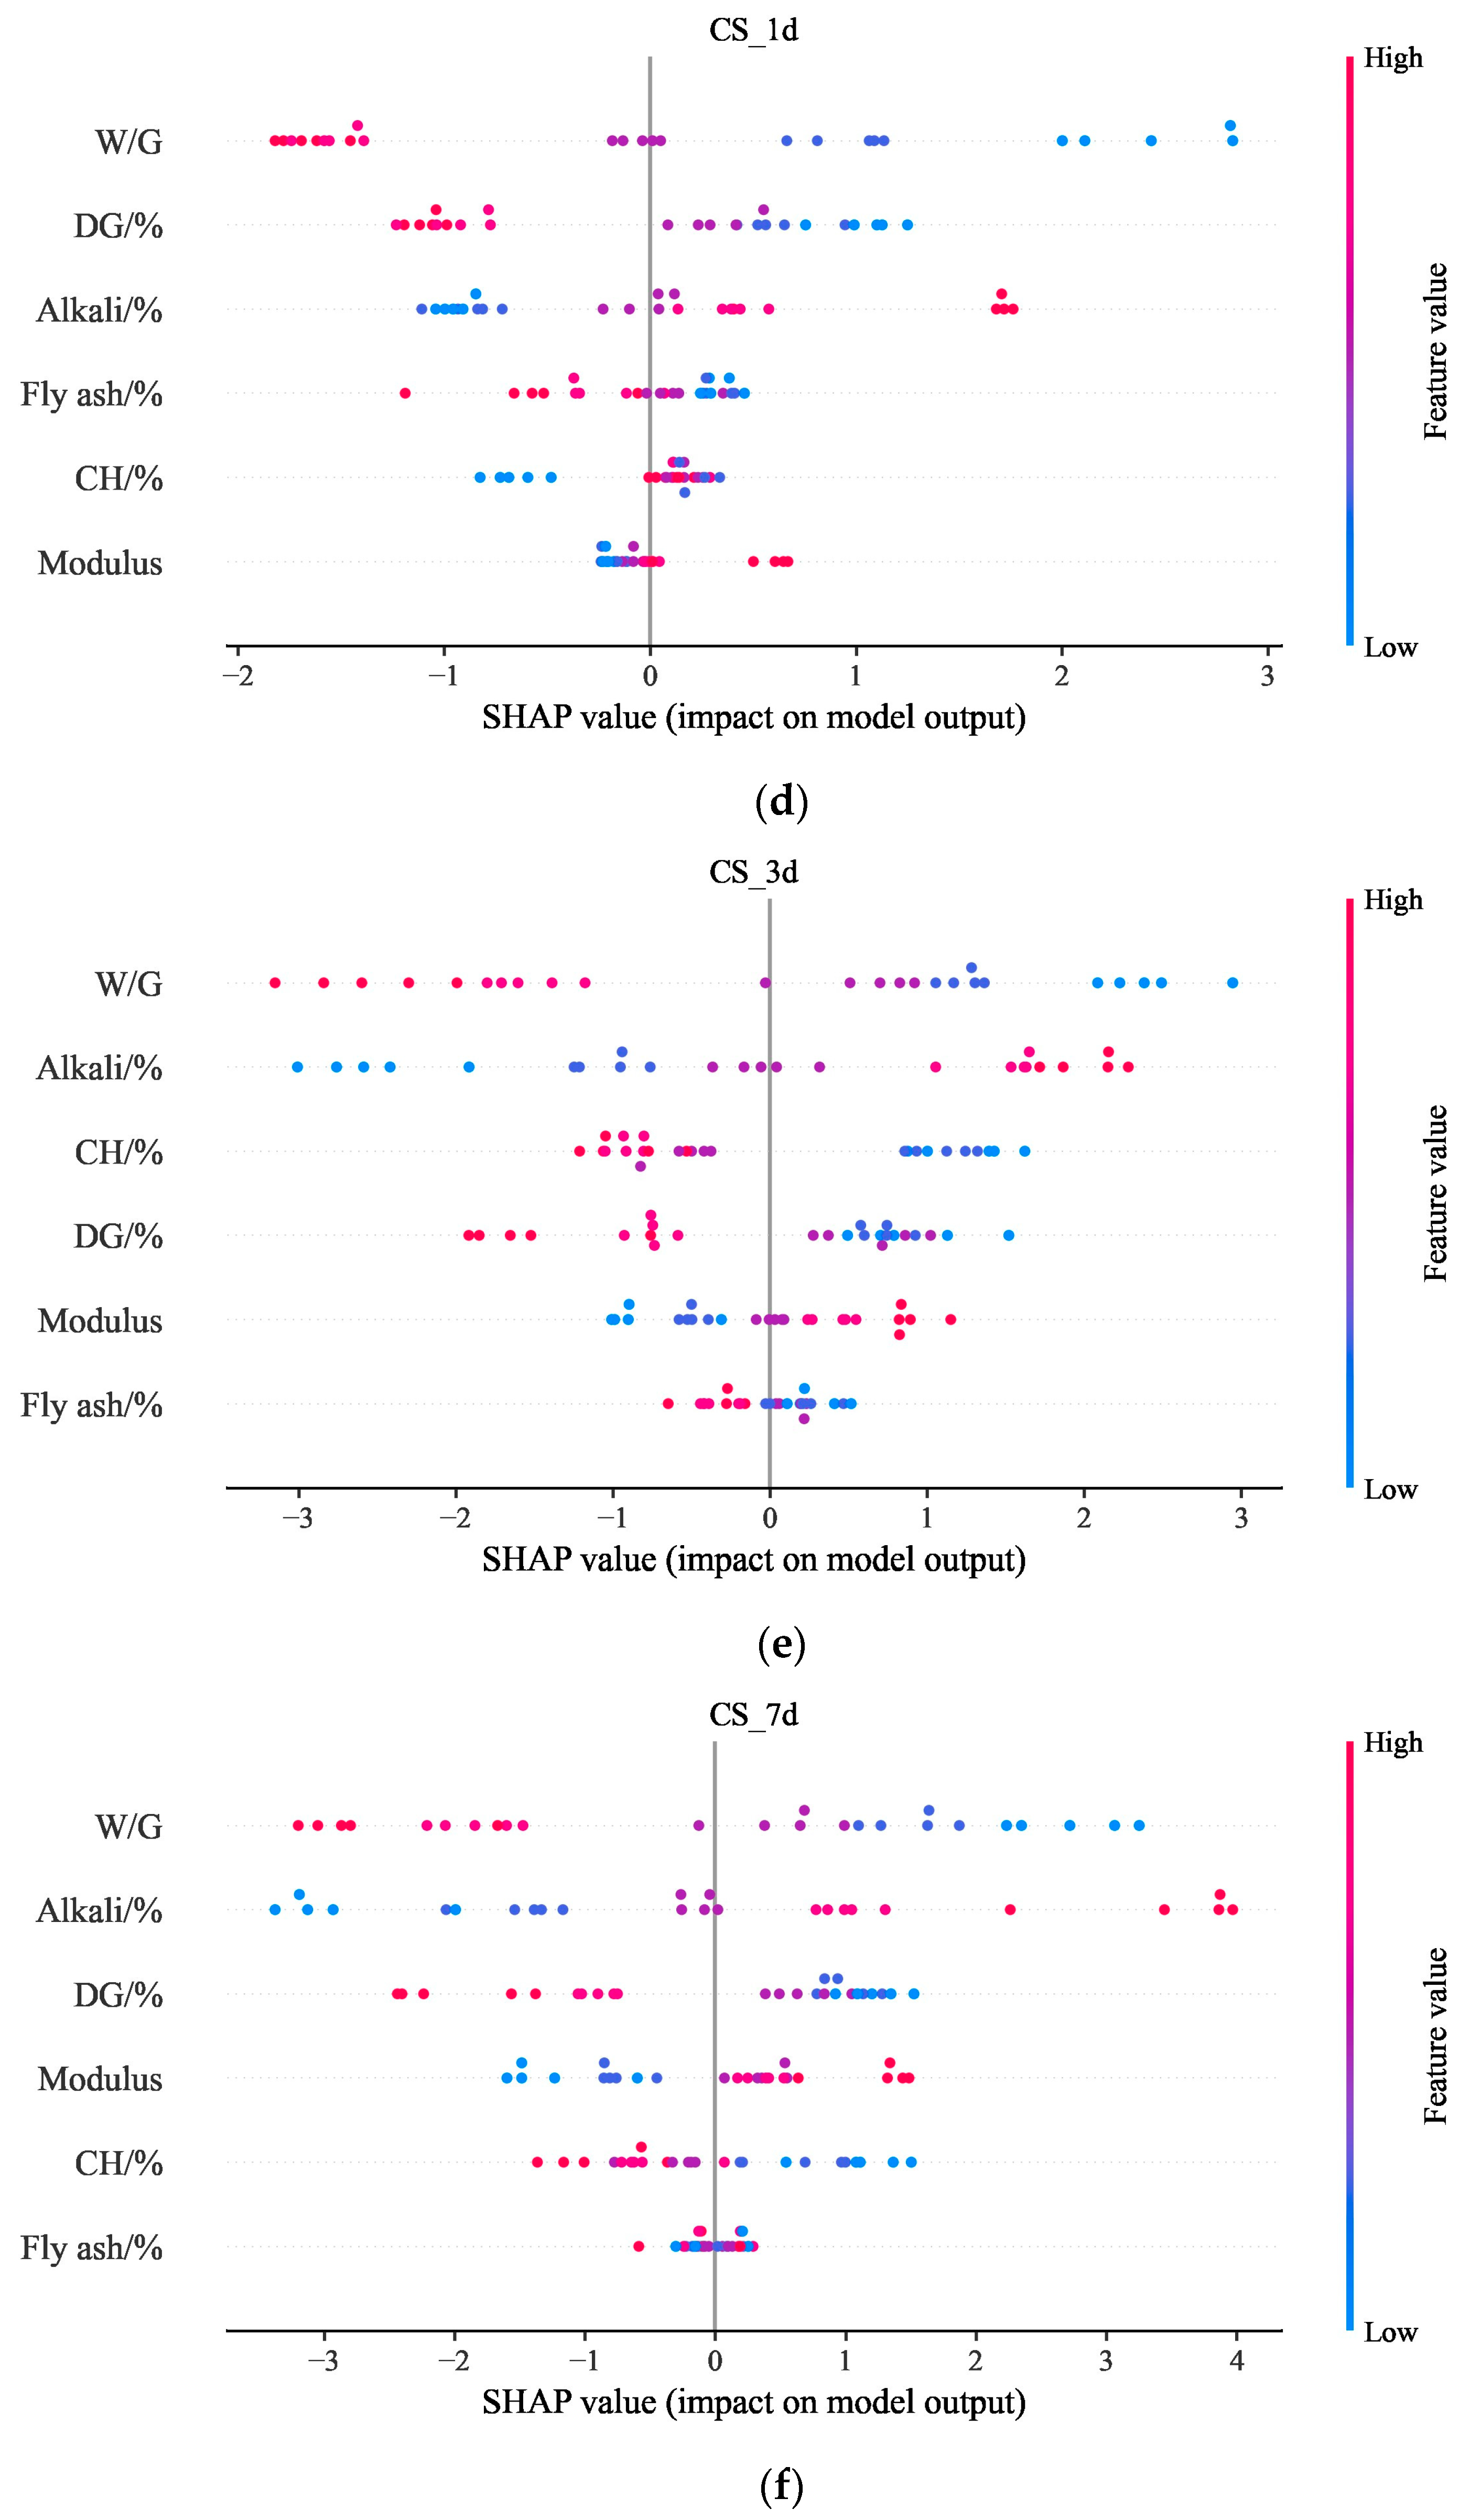
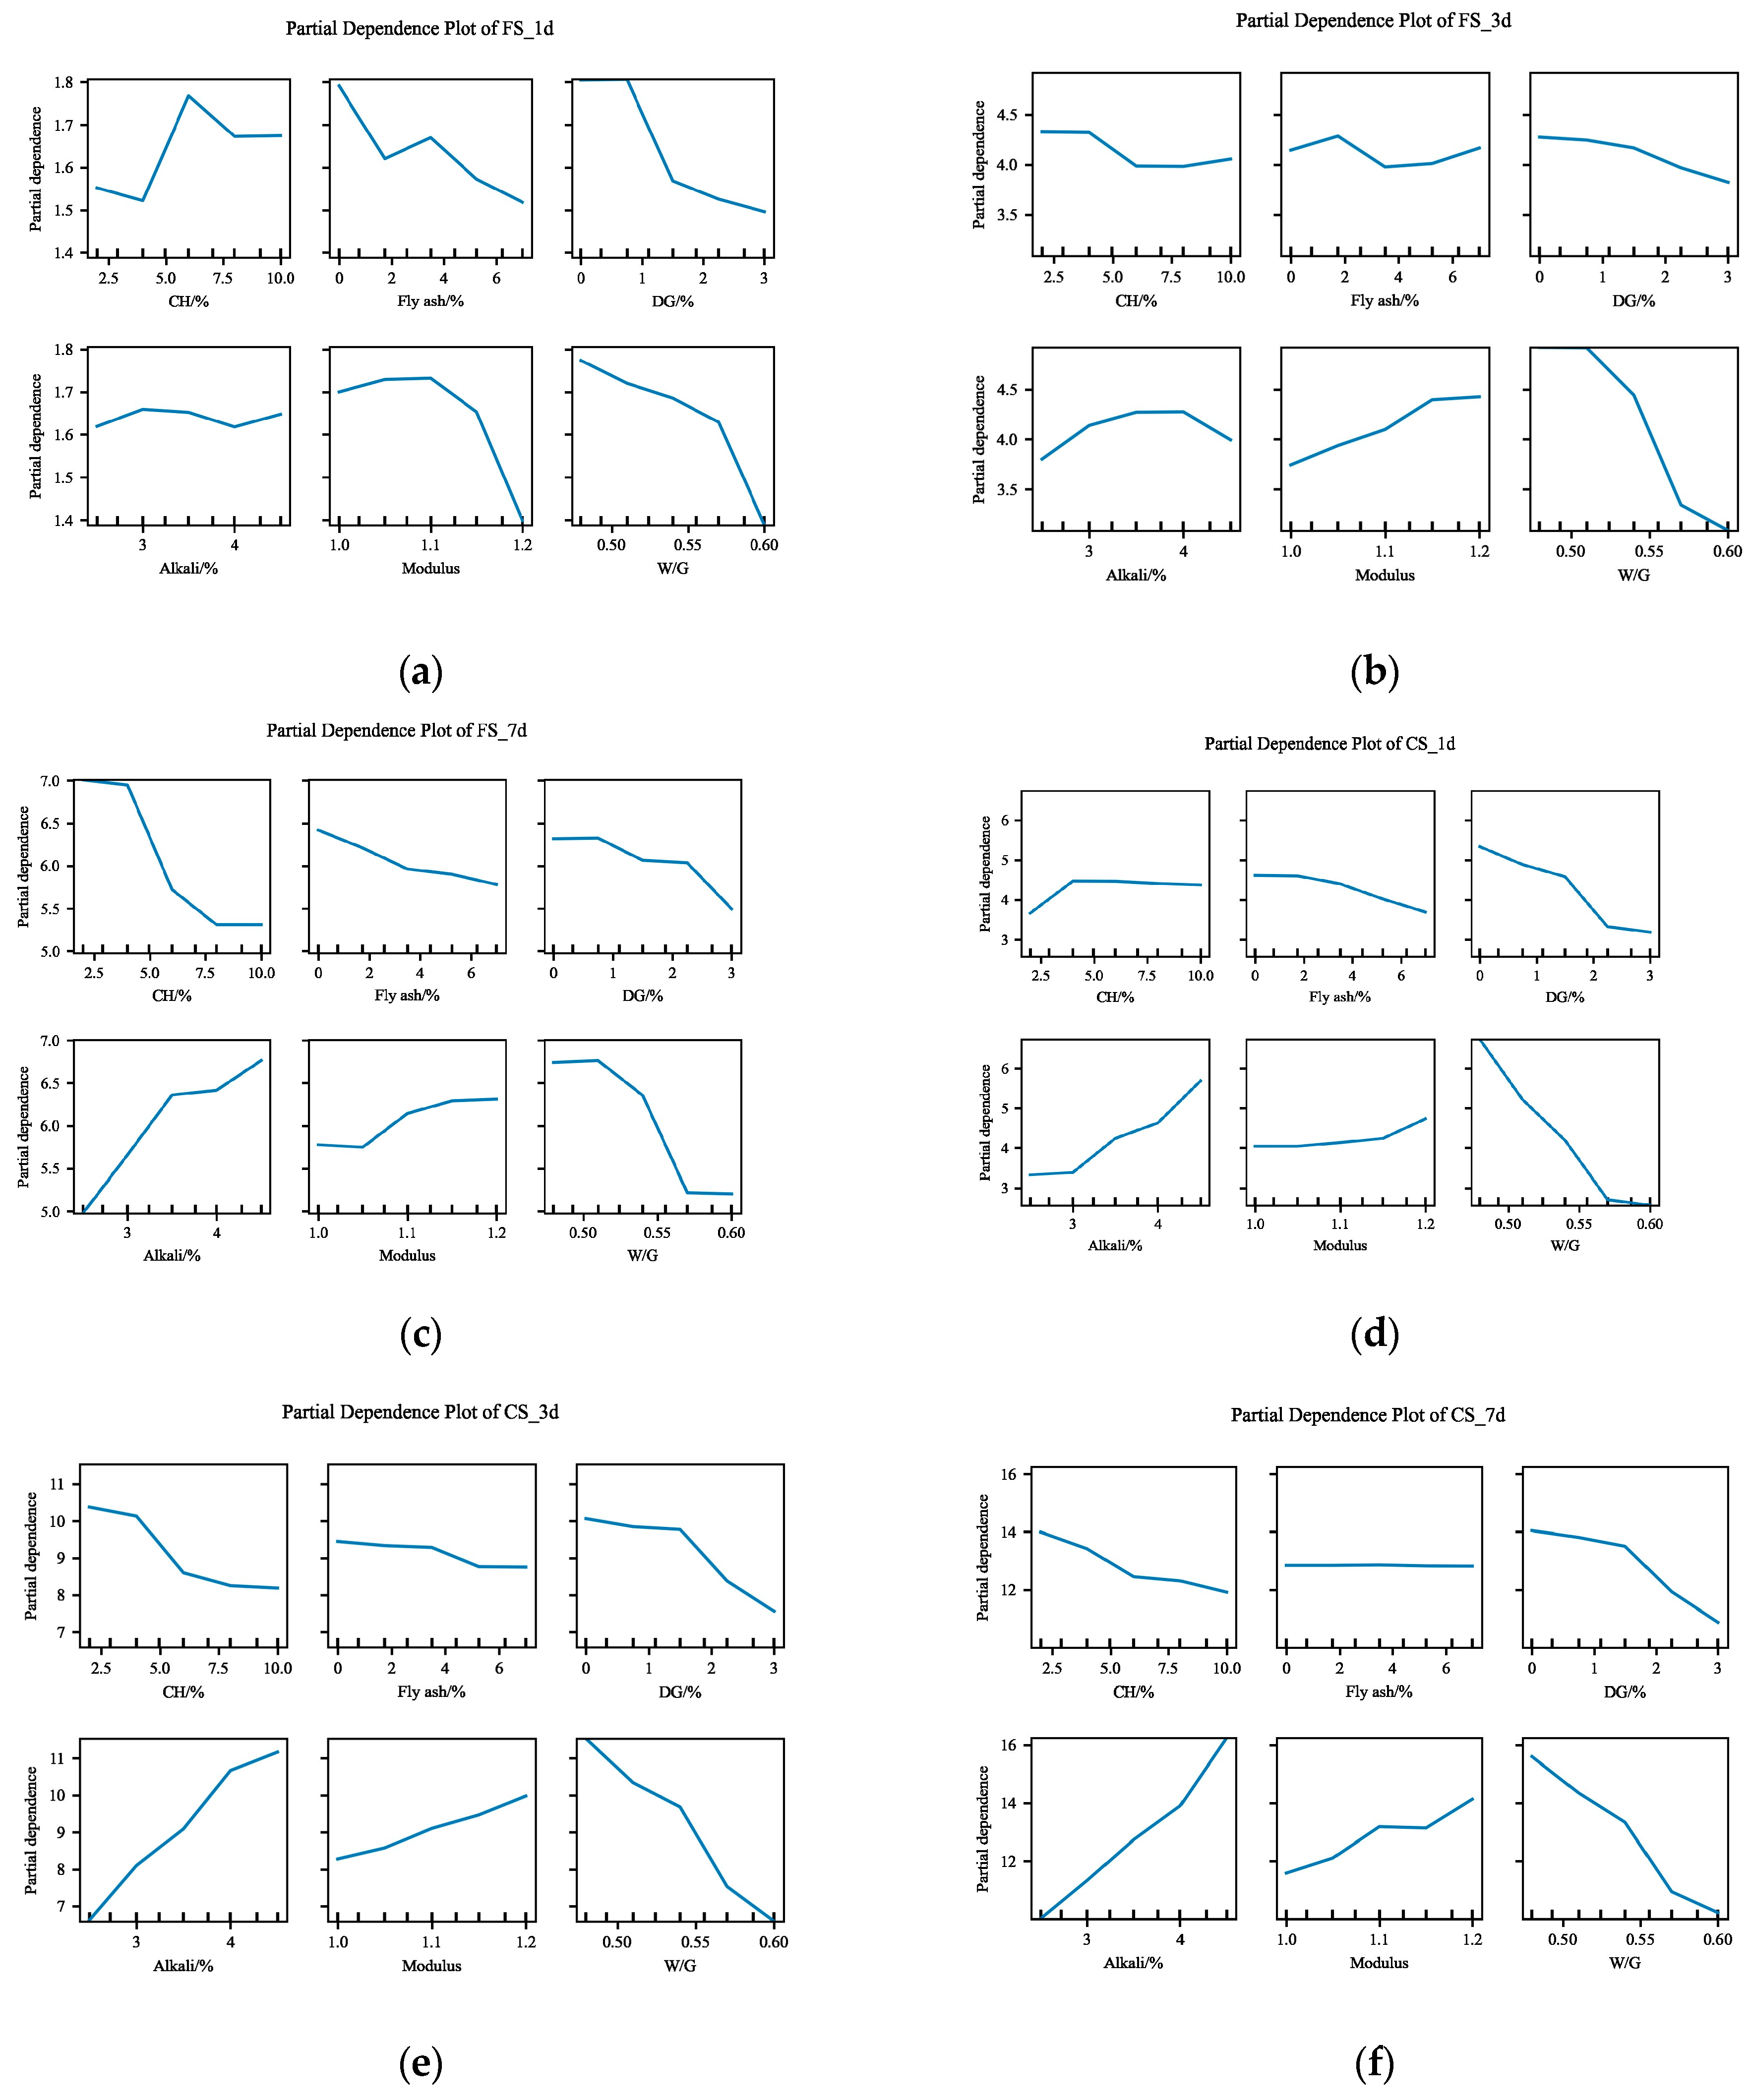
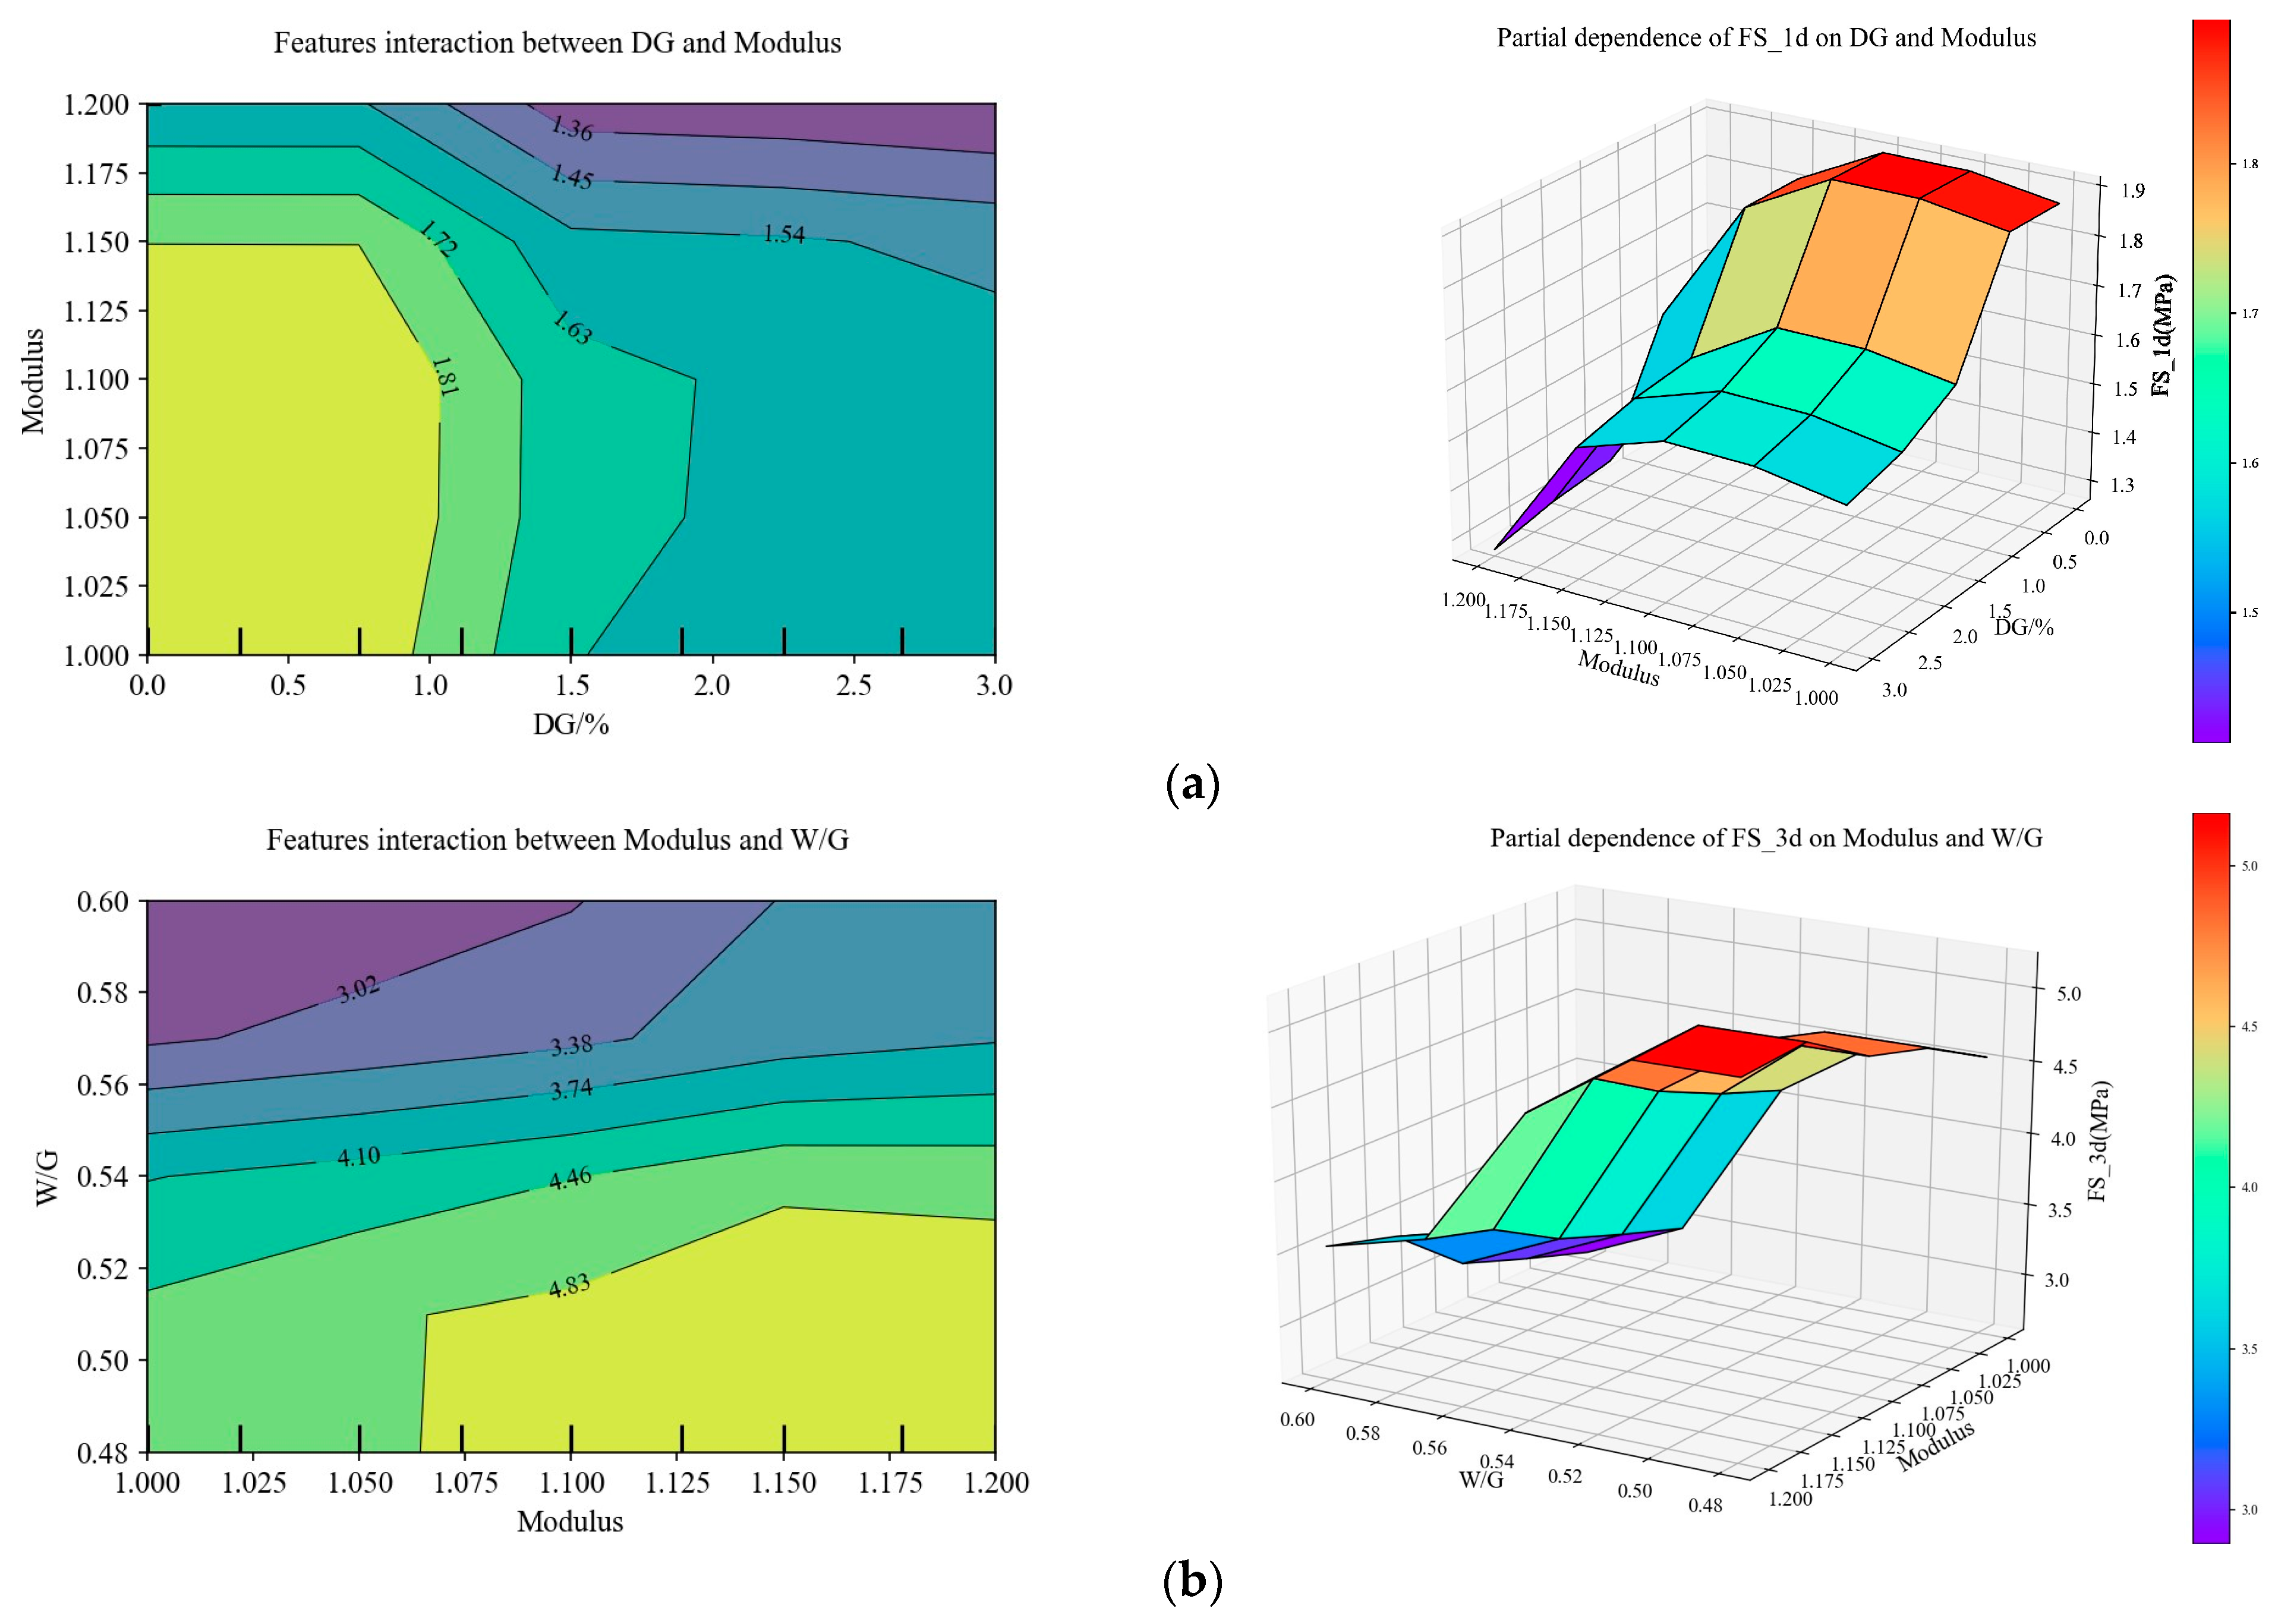
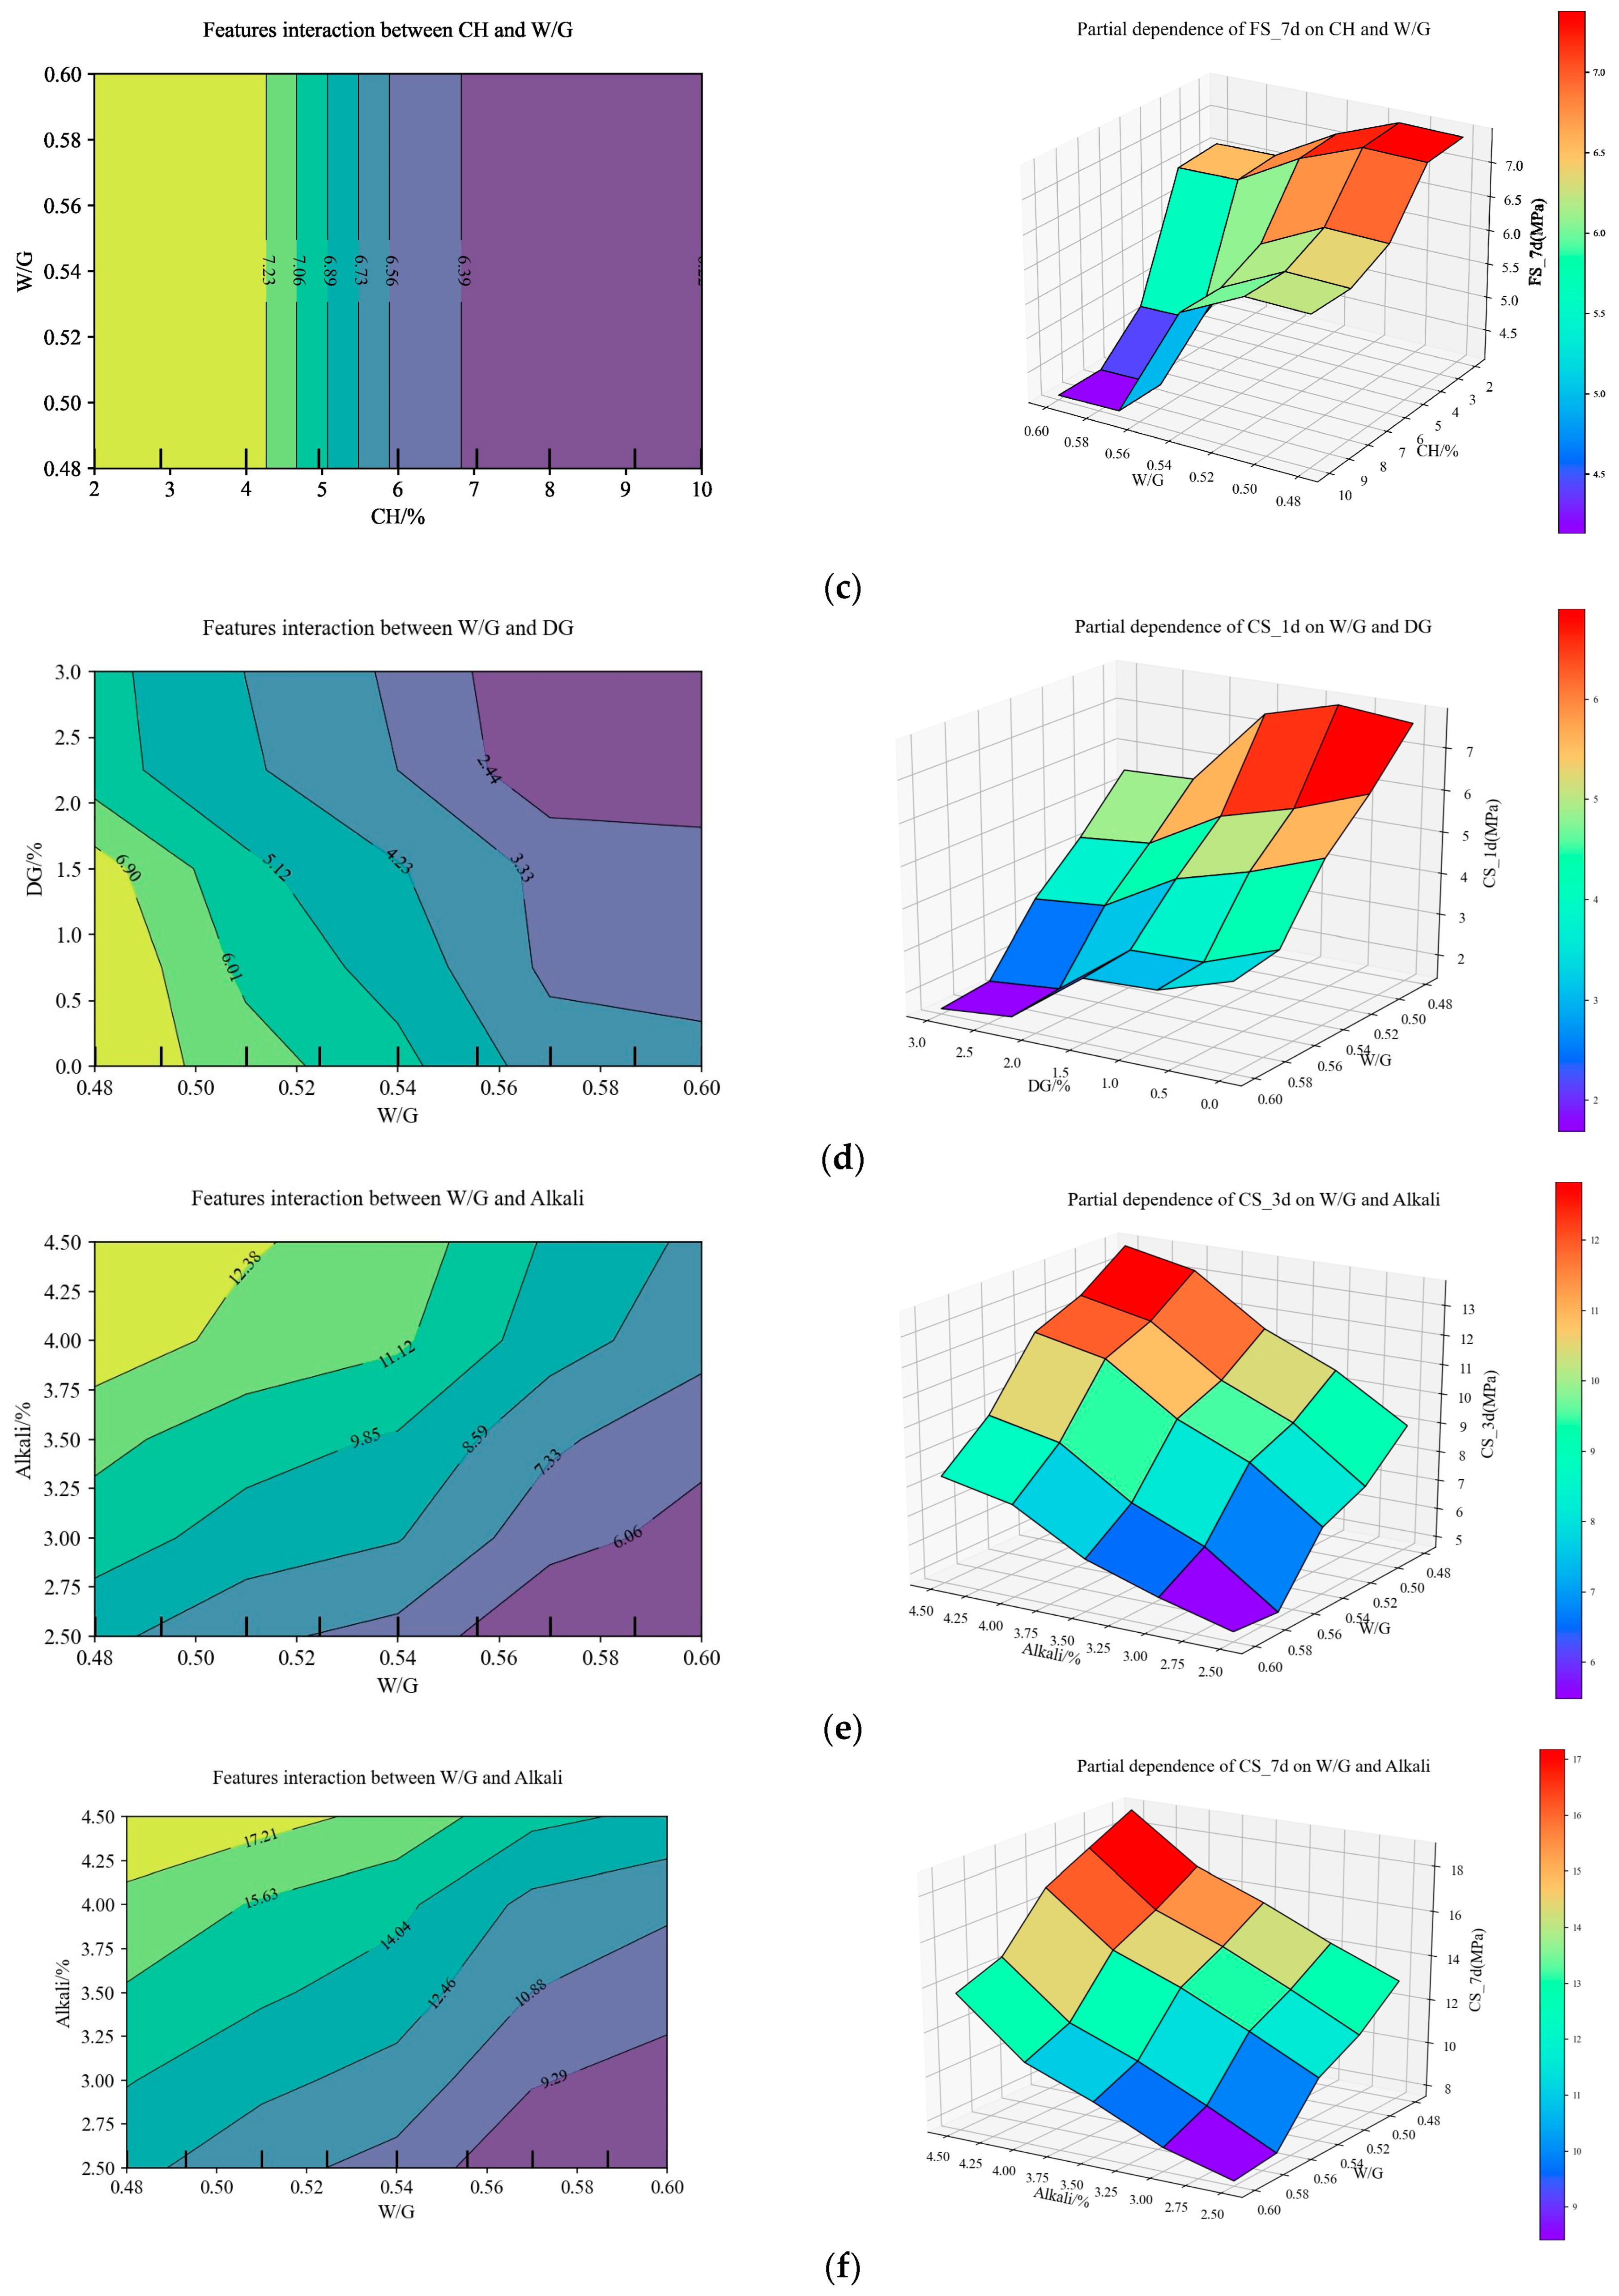
4.3.3. Feature Importance Based on SHAP
4.3.4. Potential Applications
5. Conclusions
- CatBoost is a powerful tool that can characterize the complex relationship between material composition and performance and can predict the performance of slag–desulfurization gypsum-based alkali-activated materials very well, and the predicted strength of the material based on CatBoost is consistent with the results obtained from laboratory tests.
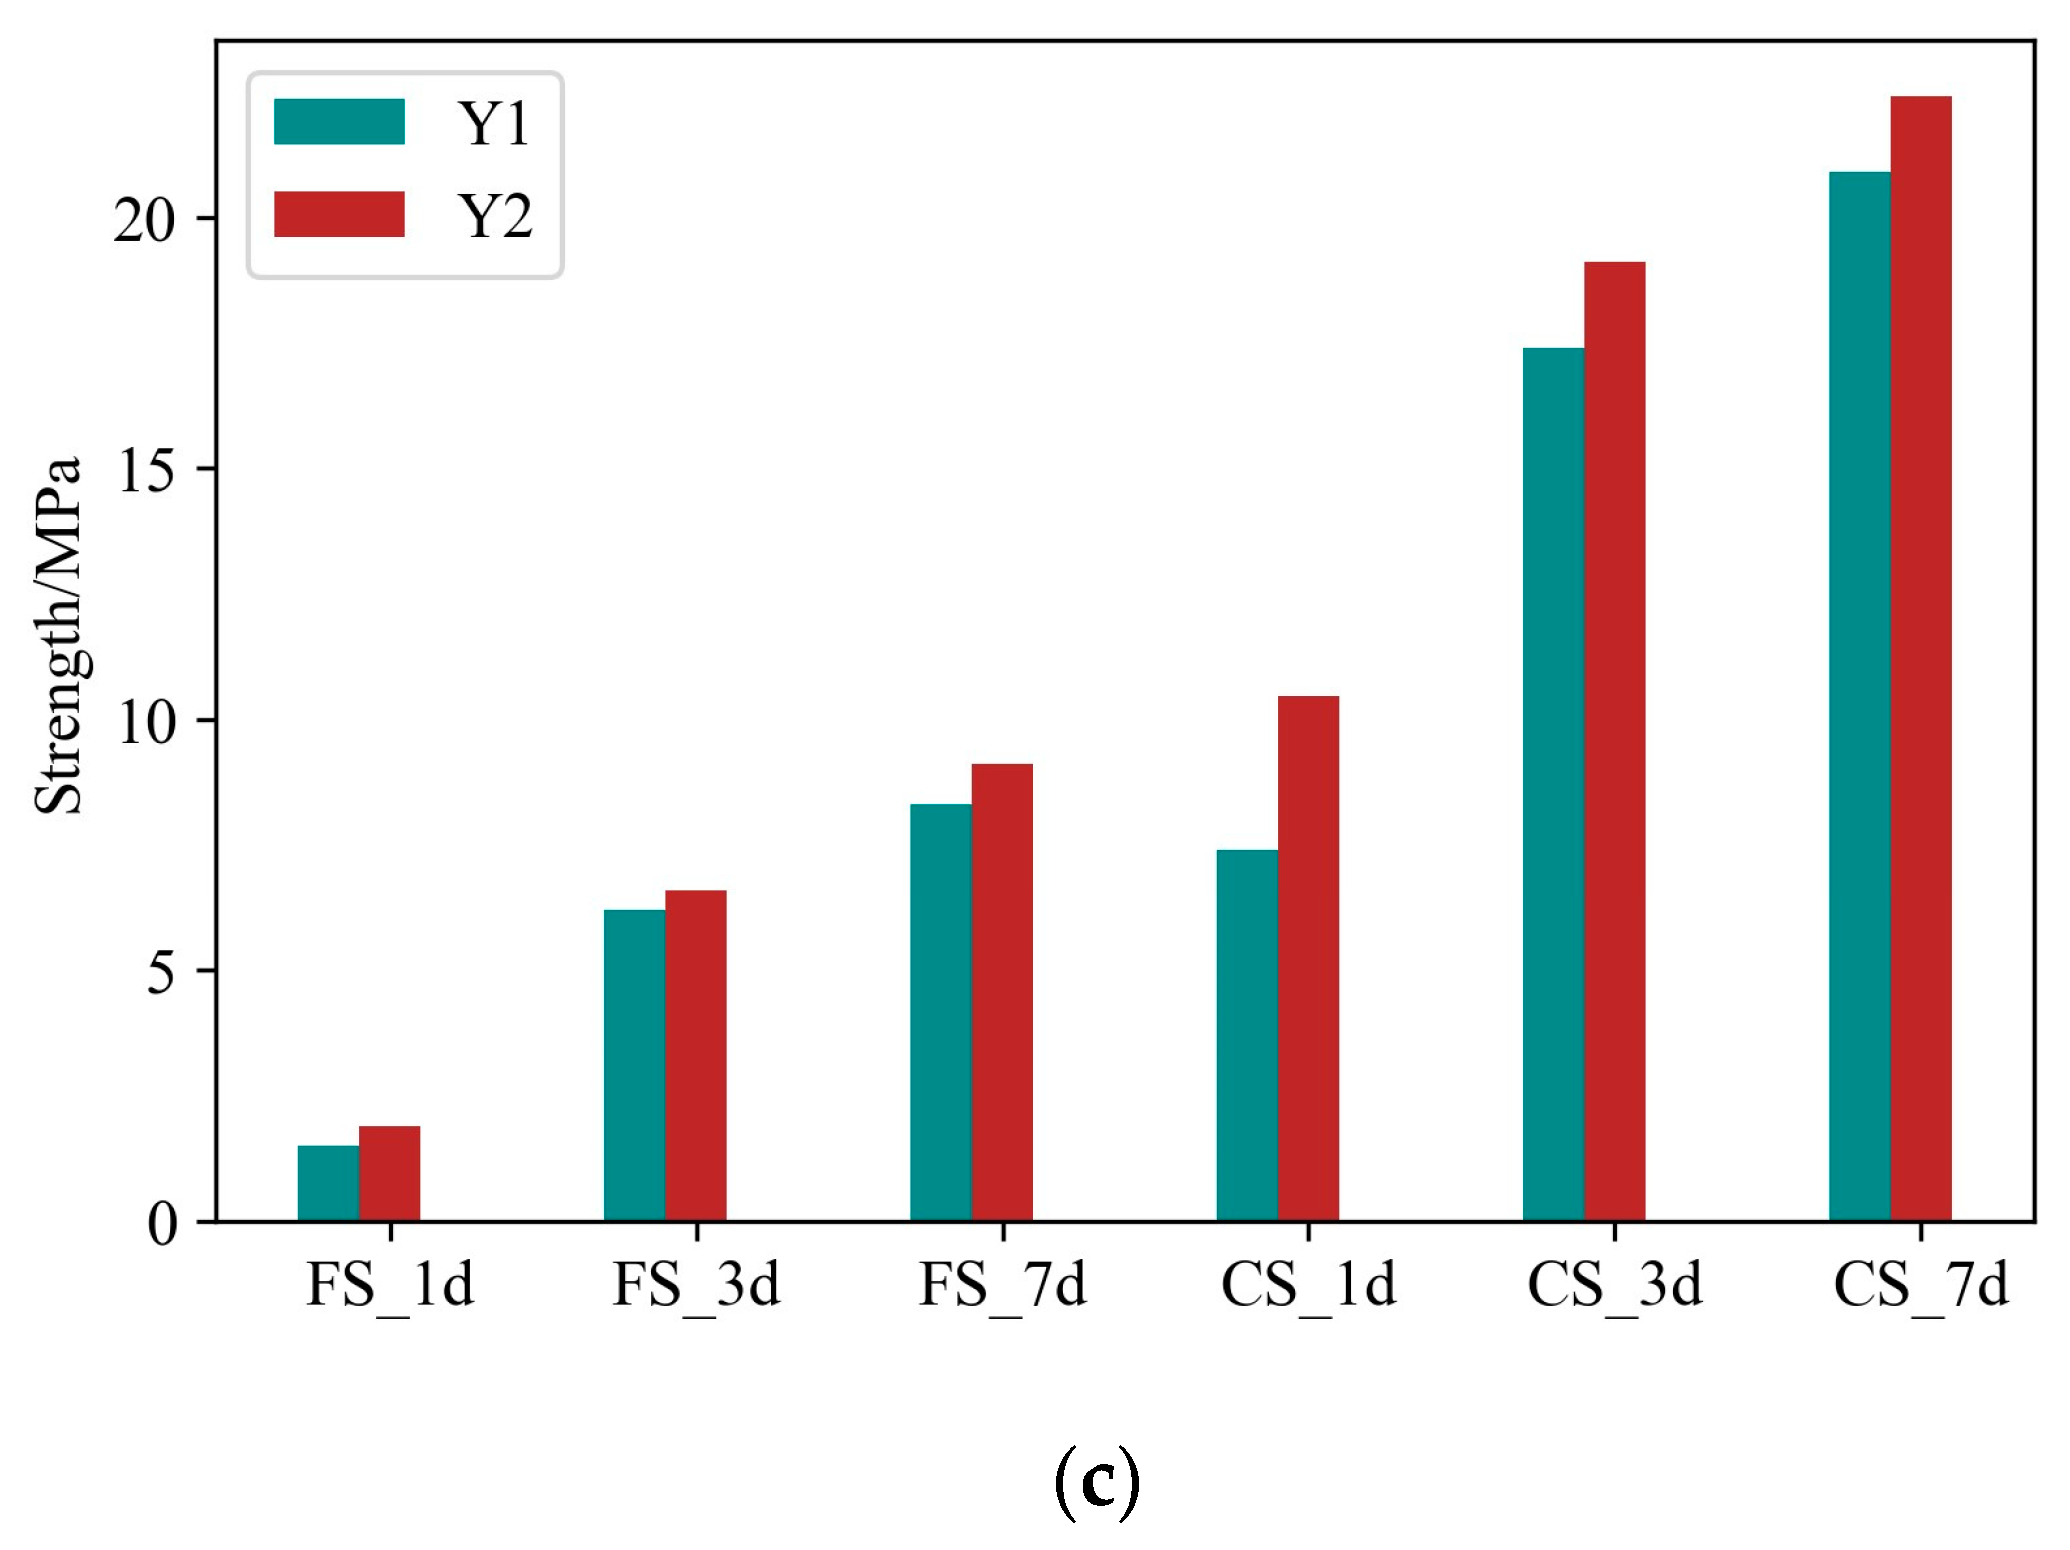
- In this study, SHGO is used to search for the optimal composition of the slag–desulfurization gypsum-based alkali-activated materials to maximize the flexural and compressive strength at different ages. The results show that the optimal composition determined by SHGO is similar to that obtained by traditional experimental methods. The final composition is as follows: Ca(OH)2: 3.1%, fly ash: 2.6%, DG: 0.53%, alkali: 4.3%, modulus: 1.18, and W/G: 0.49.
- The performance characterization and composition design framework proposed in this study determines the optimal composition of slag–desulfurization gypsum-based alkali-activated materials that meets the target. Compared with the material composition obtained by traditional experiments, the actual flexural strength and compressive strength at 1, 3, and 7 days increased by 26.67%, 6.45%, 9.64%, 41.89%, 9.77%, and 7.18%, respectively. This also means that the developed framework is of great significance for optimizing material composition and improving the performance of materials in civil engineering.
- In this study, the working mechanism of the CatBoost algorithm is explained by using SHAPs and PDPs, and the influence trend and mode of each component of slag–desulfurization gypsum-based alkali-activated materials on the performance are more clearly demonstrated, which provides strong support for the optimal composition of the determined material. This promising tool offers a new horizon for determining the optimal composition of civil materials, promising significant advancements in the field.
Author Contributions
Funding
Institutional Review Board Statement
Informed Consent Statement
Data Availability Statement
Conflicts of Interest
References
- Yusuf, M.O.; Johari, M.A.M.; Ahmad, Z.A.; Maslehuddin, M. Strength and microstructure of alkali-activated binary blended binder containing palm oil fuel ash and ground blast-furnace slag. Constr. Build. Mater. 2014, 52, 504–510. [Google Scholar] [CrossRef]
- Part, W.K.; Ramli, M.; Cheah, C.B. An overview on the influence of various factors on the properties of geopolymer concrete derived from industrial by-products. Constr. Build. Mater. 2015, 77, 370–395. [Google Scholar] [CrossRef]
- McLellan, B.C.; Williams, R.P.; Lay, J.; van Riessen, A.; Corder, G.D. Costs and carbon emissions for geopolymer pastes in comparison to ordinary portland cement. J. Clean. Prod. 2011, 19, 1080–1090. [Google Scholar] [CrossRef]
- Biricik, H.; Kırgız, M.S.; Galdino, A.G.d.S.; Kenai, S.; Mirza, J.; Kinuthia, J.; Ashteyat, A.; Khitab, A.; Khatib, J. Activation of slag through a combination of NaOH/NaS alkali for transforming it into geopolymer slag binder mortar—Assessment the effects of two different Blaine fines and three different curing conditions. J. Mater. Res. Technol. 2021, 14, 1569–1584. [Google Scholar] [CrossRef]
- Zhuang, X.Y.; Chen, L.; Komarneni, S.; Zhou, C.H.; Tong, D.S.; Yang, H.M.; Yu, W.H.; Wang, H. Fly ash-based geopolymer: Clean production, properties and applications. J. Clean. Prod. 2016, 125, 253–267. [Google Scholar] [CrossRef]
- Caldas, P.H.C.H.; de Azevedo, A.R.G.; Marvila, M.T. Silica fume activated by NaOH and KOH in cement mortars: Rheological and mechanical study. Constr. Build. Mater. 2023, 400, 132623. [Google Scholar] [CrossRef]
- Marvila, M.T.; de Azevedo, A.R.G.; Júnior, J.A.T.L.; Vieira, C.M.F. Activated alkali cement based on blast furnace slag: Effect of curing type and concentration of Na2O. J. Mater. Res. Technol. 2023, 23, 4551–4565. [Google Scholar] [CrossRef]
- Cong, X.; Zhou, W.; Elchalakani, M. Experimental study on the engineering properties of alkali-activated GGBFS/FA concrete and constitutive models for performance prediction. Constr. Build. Mater. 2020, 240, 117977. [Google Scholar] [CrossRef]
- Le, H.-B.; Bui, Q.-B.; Tang, L. Geopolymer Recycled Aggregate Concrete: From Experiments to Empirical Models. Materials 2021, 14, 1180. [Google Scholar] [CrossRef]
- Zhang, H.; Li, L.; Yuan, C.; Wang, Q.; Sarker, P.K.; Shi, X. Deterioration of ambient-cured and heat-cured fly ash geopolymer concrete by high temperature exposure and prediction of its residual compressive strength. Constr. Build. Mater. 2020, 262, 120924. [Google Scholar] [CrossRef]
- Thomas, R.J.; Peethamparan, S. Alkali-activated concrete: Engineering properties and stress–strain behavior. Constr. Build. Mater. 2015, 93, 49–56. [Google Scholar] [CrossRef]
- Amlashi, A.T.; Abdollahi, S.M.; Goodarzi, S.; Ghanizadeh, A.R. Soft computing based formulations for slump, compressive strength, and elastic modulus of bentonite plastic concrete. J. Clean. Prod. 2019, 230, 1197–1216. [Google Scholar] [CrossRef]
- Zhao, H.; Li, S.; Zang, X.; Liu, X.; Zhang, L.; Ren, J. Uncertainty quantification of inverse analysis for geomaterials using probabilistic programming. J. Rock Mech. Geotech. Eng. 2023, 16, 895–908. [Google Scholar] [CrossRef]
- Ahmad, A.; Chaiyasarn, K.; Farooq, F.; Ahmad, W.; Suparp, S.; Aslam, F. Compressive strength prediction via Gene Expression Programming (GEP) and Artificial Neural Network (ANN) for concrete containing RCA. Buildings 2021, 11, 324. [Google Scholar] [CrossRef]
- Song, H.; Ahmad, A.; Ostrowski, K.A.; Dudek, M. Analyzing the compressive strength of ceramic waste-based concrete using experiment and Artificial Neural Network (ANN) approach. Materials 2021, 14, 4518. [Google Scholar] [CrossRef] [PubMed]
- Li, Q.; Song, Z. Prediction of compressive strength of rice husk ash concrete based on stacking ensemble learning model. J. Clean. Prod. 2023, 382, 135279. [Google Scholar] [CrossRef]
- Mansouri, E.; Manfredi, M.; Hu, J.-W. Environmentally friendly concrete compressive strength prediction using hybrid machine learning. Sustainability 2022, 14, 12990. [Google Scholar] [CrossRef]
- Fang, J.; Xie, M.; He, X.; Zhang, J.; Hu, J.; Chen, Y.; Yang, Y.; Jin, Q. Machine learning accelerates the materials discovery. Mater. Today Commun. 2022, 33, 104900. [Google Scholar] [CrossRef]
- Arrieta, A.B.; Díaz-Rodríguez, N.; Del Ser, J.; Bennetot, A.; Tabik, S.; Barbado, A.; Garcia, S.; Gil-Lopez, S.; Molina, D.; Benjamins, R.; et al. Explainable Artificial Intelligence (XAI): Concepts, taxonomies, opportunities and challenges toward responsible AI. Inf. Fusion 2020, 58, 82–115. [Google Scholar] [CrossRef]
- Naser, M. An engineer’s guide to eXplainable Artificial Intelligence and Interpretable Machine Learning: Navigating causality, forced goodness, and the false perception of inference. Autom. Constr. 2021, 129, 103821. [Google Scholar] [CrossRef]
- Friedman, J.H. Greedy function approximation: A gradient boosting machine. Ann. Stat. 2001, 29, 1189–1232. [Google Scholar] [CrossRef]
- Pedregosa, F.; Varoquaux, G.; Gramfort, A.; Michel, V.; Thirion, B.; Grisel, O.; Blondel, M.; Prettenhofer, P.; Weiss, R.; Dubourg, V.; et al. Scikit-learn: Machine Learning in Python. J. Mach. Learn. Res. 2011, 12, 2825–2830. [Google Scholar]
- Lundberg, S.M.; Lee, S. A unified approach to interpreting model predictions. In Proceedings of the 31st International Confer-ence on Neural Information Processing Systems, Long Beach, CA, USA, 4–9 December 2017; pp. 4768–4777. [Google Scholar]
- Zhao, H.; Li, M.; Zhang, L.; Zhao, L.; Zang, X.; Liu, X.; Ren, J. Multi-objective optimization for composition design of civil materials based on data-driven method. Mater. Today Commun. 2024, 38, 108143. [Google Scholar] [CrossRef]
- Steinerova, M. Mechanical properties of geopolymer mortars in relation to their porous structure. Ceram. Silik. 2011, 55, 362–372. [Google Scholar]
- Provis, J.L.; Duxson, P.; van Deventer, J.S. The role of particle technology in developing sustainable construction materials. Adv. Powder Technol. 2010, 21, 2–7. [Google Scholar] [CrossRef]
- Van Deventer, J.S.; Provis, J.L.; Duxson, P. Technical and commercial progress in the adoption of geopolymer cement. Miner. Eng. 2011, 29, 89–104. [Google Scholar] [CrossRef]
- Bagheri, A.; Nazari, A. Compressive strength of high strength class C fly ash-based geopolymers with reactive granulated blast furnace slag aggregates designed by Taguchi method. Mater. Des. 2014, 54, 483–490. [Google Scholar] [CrossRef]
- Fernández-Jiménez, A.; Palomo, A.; López-Hombrados, C. Engineering properties of alkali-activated fly ash. ACI Mater. J. 2006, 103, 106–112. [Google Scholar]
- Wang, S.; Xia, P.; Chen, K.; Gong, F.; Wang, H.; Wang, Q.; Zhao, Y.; Jin, W. Prediction and optimization model of sustainable concrete properties using machine learning, deep learning and swarm intelligence: A review. J. Build. Eng. 2023, 80, 108065. [Google Scholar] [CrossRef]
- Ma, G.; Cui, A.; Huang, Y.; Dong, W. A Data-Driven Influential Factor Analysis Method for Fly Ash–Based Geopolymer Using Optimized Machine-Learning Algorithms. J. Mater. Civ. Eng. 2022, 34, 04022132. [Google Scholar] [CrossRef]
- Lahoti, M.; Narang, P.; Tan, K.H.; Yang, E.-H. Mix design factors and strength prediction of metakaolin-based geopolymer. Ceram. Int. 2017, 43, 11433–11441. [Google Scholar] [CrossRef]
- Gunasekara, C.; Atzarakis, P.; Lokuge, W.; Law, D.W.; Setunge, S. Novel Analytical Method for Mix Design and Performance Prediction of High Calcium Fly Ash Geopolymer Concrete. Polymers 2021, 13, 900. [Google Scholar] [CrossRef] [PubMed]
- Zhao, T.; Wu, H.; Sun, J.; Wen, X.; Zhang, J.; Zeng, W.; Shen, H.; Hu, Z.; Huang, P. Immobilization of uranium tailings by phos-phoric acid-based geopolymer with optimization of machine learning. J. Radioanal. Nucl. Chem. 2022, 331, 4047–4054. [Google Scholar] [CrossRef]
- Huang, Y.; Huo, Z.; Ma, G.; Zhang, L.; Wang, F.; Zhang, J. Multi-objective optimization of fly ash-slag based geopolymer considering strength, cost and CO2 emission: A new framework based on tree-based ensemble models and NSGA-II. J. Build. Eng. 2023, 68, 106070. [Google Scholar] [CrossRef]
- Wang, Q.; Hussain, A.; Farooqi, M.U.; Deifalla, A.F. Artificial intelligence-based estimation of ultra-high-strength concrete’s flexural property. Case Stud. Constr. Mater. 2022, 17, e01243. [Google Scholar] [CrossRef]
- Li, Y.; Shen, J.; Lin, H.; Li, Y. Optimization design for alkali-activated slag-fly ash geopolymer concrete based on artificial intelligence considering compressive strength, cost, and carbon emission. J. Build. Eng. 2023, 75, 106929. [Google Scholar] [CrossRef]
- Atiş, C.D.; Bilim, C.; Çelik, Ö.; Karahan, O. Influence of activator on the strength and drying shrinkage of alkali-activated slag mortar. Constr. Build. Mater. 2009, 23, 548–555. [Google Scholar] [CrossRef]
- Krizan, D.; Zivanovic, B. Effects of dosage and modulus of water glass on early hydration of alkali–slag cements. Cem. Concr. Res. 2002, 32, 1181–1188. [Google Scholar] [CrossRef]
- He, J.; Bai, W.; Zheng, W.; He, J.; Sang, G. Influence of hydrated lime on mechanical and shrinkage properties of alkali-activated slag cement. Constr. Build. Mater. 2021, 289, 123201. [Google Scholar] [CrossRef]
- GB/T 18046-2017; Ground Granulated Blast Furnace Slag Used for Cement, Mortar and Concrete; General Administration of Quality Supervision, Inspection and Quarantine of the People. Standardization Administration of China: Beijing, China, 2017.
- GB/T 1596-2017; Fly Ash Used for Cement and Concrete; General Administration of Quality Supervision, Inspection and Quarantine of the People. Standardization Administration of China: Beijing, China, 2017.
- JTG 3420-2020; Testing Methods of Cement and Concrete for Highway Engineering. Ministry of Transport of the People’s Public of China: Beijing, China, 2020.
- Prokhorenkova, L.; Guaev, G.; Vorobev, A.; Dorogush, A.V.; Gulin, A. CatBoost: Unbiased boosting with categorical features. In Proceedings of the 32nd International Conference on Neural Information Processing Systems, Montréal, QC, Canada, 3–8 December 2018; pp. 6639–6649. [Google Scholar]
- Wang, Y.; Huang, X.; Ren, X.; Chai, Z.; Chen, X. In-process belt-image-based material removal rate monitoring for abrasive belt grinding using CatBoost algorithm. Int. J. Adv. Manuf. Technol. 2022, 123, 2575–2591. [Google Scholar] [CrossRef]
- Lee, S.; Vo, T.P.; Thai, H.-T.; Lee, J.; Patel, V. Strength prediction of concrete-filled steel tubular columns using Categorical Gradient Boosting algorithm. Eng. Struct. 2021, 238, 112109. [Google Scholar] [CrossRef]
- Endres, S.C.; Sandrock, C.; Focke, W.W. A simplicial homology algorithm for Lipschitz optimization. J. Glob. Optim. 2018, 72, 181–217. [Google Scholar] [CrossRef]
- Wu, Y.; Zhou, Y. Hybrid machine learning model and Shapley additive explanations for compressive strength of sustainable concrete. Constr. Build. Mater. 2022, 330, 127298. [Google Scholar] [CrossRef]
- Mangalathu, S.; Hwang, S.-H.; Jeon, J.-S. Failure mode and effects analysis of RC members based on machine-learning-based SHapley Additive exPlanations (SHAP) approach. Eng. Struct. 2020, 219, 110927. [Google Scholar] [CrossRef]
- Ogami, C.; Tsuji, Y.; Seki, H.; Kawano, H.; To, H.; Matsumoto, Y.; Hosono, H. An artificial neural network−pharmacokinetic model and its interpretation using Shapley additive explanations. CPT Pharmacomet. Syst. Pharmacol. 2021, 10, 760–768. [Google Scholar] [CrossRef] [PubMed]
- Nguyen, N.-H.; Tong, K.T.; Lee, S.; Karamanli, A.; Vo, T.P. Prediction compressive strength of cement-based mortar containing metakaolin using explainable Categorical Gradient Boosting model. Eng. Struct. 2022, 269, 114768. [Google Scholar] [CrossRef]
- Ravikumar, D.; Neithalath, N. Effects of activator characteristics on the reaction product formation in slag binders activated using alkali silicate powder and NaOH. Cem. Concr. Compos. 2012, 34, 809–818. [Google Scholar] [CrossRef]


| Materials | Specific Surface Area/m2/kg | Flow Ratio/% | Activity Index/% | Density/g × cm−3 | Ignition Loss/% | Water Content/% | Bulk Density/g/m3 | Soakage/% | Stability/% | Fitness/% | |
|---|---|---|---|---|---|---|---|---|---|---|---|
| 0.045 mm Material Retained | 0.075 mm Material Retained | ||||||||||
| Slag | 429 | 98 | 84.2 | 3.1 | 0.84 | 0.45 | -- | -- | -- | -- | -- |
| Fly ash | 0.29 | -- | -- | 2.1 × 10⁻⁶ | ≤6.5 | -- | 0.79 | 106 | ≤4.5 | -- | -- |
| Ca(OH)2 | -- | -- | -- | -- | 22.52 | 0.23 | -- | -- | -- | 90.34 | 99.09 |
| Materials | CaO/% | SiO2/% | Al2O3/% | SO3/% | Fe2O3/% | MgO/% | Fe2O/% | K2O/% | Ca(OH)2/% | CaCO3/% |
|---|---|---|---|---|---|---|---|---|---|---|
| Slag | 34 | 34.5 | 17.7 | 1.64 | 1.03 | 6.01 | -- | -- | -- | -- |
| Fly ash | 10 | 40 | 30 | -- | -- | 2.5 | 4.3 | 1.2 | -- | -- |
| Ca(OH)2 | 73.53 | 0.78 | 0.597 | -- | 0.128 | 0.68 | -- | -- | 89.51 | 3.98 |
| Materials | Setting Time (min) | Flexural Strength/MPa | Standard Consistency/% | Expansion Coefficient | Appearance | Density/g/cm3 | Bulk Density/g/cm3 | Specific Surface Area/m2/g | Particle Size/nm | |
|---|---|---|---|---|---|---|---|---|---|---|
| Initial Setting | Permanent Setting | |||||||||
| Desulfurization gypsum | 3 | 5 | 2.5 | 99 | 100 | White powder | -- | -- | -- | -- |
| Nano-SiO2 | -- | -- | -- | -- | -- | White spheres | 2.2–2.6 | 0.06 | 240 | 20 |
| Level | CH */% | Fly Ash/% | DG */% | Alkali */% | Modulus * | W/G * |
|---|---|---|---|---|---|---|
| I | 2 | 0 | 0 | 2.5 | 1.00 | 0.48 |
| II | 4 | 1.75 | 0.75 | 3.0 | 1.05 | 0.51 |
| III | 6 | 3.50 | 1.50 | 3.5 | 1.10 | 0.54 |
| IV | 8 | 5.25 | 2.25 | 4.0 | 1.15 | 0.57 |
| V | 10 | 7.00 | 3.00 | 4.5 | 1.20 | 0.60 |
| No. | CH/% | Fly Ash/% | DG/% | Alkali/% | Modulus | W/G |
|---|---|---|---|---|---|---|
| 1 | 2 | 0 | 0 | 2.5 | 1.00 | 0.48 |
| 2 | 2 | 1.75 | 0.75 | 3 | 1.05 | 0.51 |
| 3 | 2 | 3.5 | 1.5 | 3.5 | 1.10 | 0.54 |
| 4 | 2 | 5.25 | 2.25 | 4 | 1.15 | 0.57 |
| 5 | 2 | 7 | 3 | 4.5 | 1.20 | 0.60 |
| 6 | 4 | 0 | 0.75 | 3.5 | 1.15 | 0.60 |
| 7 | 4 | 1.75 | 1.5 | 4 | 1.20 | 0.48 |
| 8 | 4 | 3.5 | 2.25 | 4.5 | 1.00 | 0.51 |
| 9 | 4 | 5.25 | 3 | 2.5 | 1.05 | 0.54 |
| 10 | 4 | 7 | 0 | 3 | 1.10 | 0.57 |
| 11 | 6 | 0 | 1.5 | 4.5 | 1.05 | 0.57 |
| 12 | 6 | 1.75 | 2.25 | 2.5 | 1.10 | 0.60 |
| 13 | 6 | 3.5 | 3 | 3 | 1.15 | 0.48 |
| 14 | 6 | 5.25 | 0 | 3.5 | 1.20 | 0.51 |
| 15 | 6 | 7 | 0.75 | 4 | 1.00 | 0.54 |
| 16 | 8 | 0 | 2.25 | 3 | 1.20 | 0.54 |
| 17 | 8 | 1.75 | 3 | 3.5 | 1.00 | 0.57 |
| 18 | 8 | 3.5 | 0 | 4 | 1.05 | 0.60 |
| 19 | 8 | 5.25 | 0.75 | 4.5 | 1.10 | 0.48 |
| 20 | 8 | 7 | 1.5 | 2.5 | 1.15 | 0.51 |
| 21 | 10 | 0 | 3 | 4 | 1.10 | 0.51 |
| 22 | 10 | 1.75 | 0 | 4.5 | 1.15 | 0.54 |
| 23 | 10 | 3.5 | 0.75 | 2.5 | 1.20 | 0.57 |
| 24 | 10 | 5.25 | 1.5 | 3 | 1.00 | 0.60 |
| 25 | 10 | 7 | 2.25 | 3.5 | 1.05 | 0.48 |
| No. | Slag/g | NS/g | CH/g | Fly Ash/g | DG/g | Na2SiO3/g | NaOH/g | Water/g |
|---|---|---|---|---|---|---|---|---|
| 1 | 970.2 | 9.8 | 20 | 0 | 0 | 50.0 | 9.7 | 508.7 |
| 2 | 945.2 | 9.8 | 20 | 17.5 | 7.5 | 63.0 | 12.2 | 548.4 |
| 3 | 920.2 | 9.8 | 20 | 35 | 15 | 77.0 | 14.9 | 589.6 |
| 4 | 895.2 | 9.8 | 20 | 52.5 | 22.5 | 92.0 | 17.8 | 632.6 |
| 5 | 870.2 | 9.8 | 20 | 70 | 30 | 108.0 | 20.9 | 677.4 |
| 6 | 942.9 | 9.6 | 40 | 0 | 7.5 | 80.5 | 15.6 | 657.7 |
| 7 | 917.9 | 9.6 | 40 | 17.5 | 15 | 96.0 | 18.6 | 535.0 |
| 8 | 892.9 | 9.6 | 40 | 35 | 22.5 | 90.0 | 17.4 | 564.8 |
| 9 | 867.9 | 9.6 | 40 | 52.5 | 30 | 52.5 | 10.2 | 573.8 |
| 10 | 880.4 | 9.6 | 40 | 70 | 0 | 66.0 | 12.8 | 614.9 |
| 11 | 915.6 | 9.4 | 60 | 0 | 15 | 94.5 | 18.3 | 634.3 |
| 12 | 890.6 | 9.4 | 60 | 17.5 | 22.5 | 55.0 | 10.7 | 639.4 |
| 13 | 865.6 | 9.4 | 60 | 35 | 30 | 69.0 | 13.4 | 519.5 |
| 14 | 878.1 | 9.4 | 60 | 52.5 | 0 | 84.0 | 16.3 | 561.1 |
| 15 | 853.1 | 9.4 | 60 | 70 | 7.5 | 80.0 | 15.5 | 591.6 |
| 16 | 888.3 | 9.2 | 80 | 0 | 22.5 | 72.0 | 14.0 | 586.4 |
| 17 | 863.3 | 9.2 | 80 | 17.5 | 30 | 70.0 | 13.6 | 617.6 |
| 18 | 875.8 | 9.2 | 80 | 35 | 0 | 84.0 | 16.3 | 660.2 |
| 19 | 850.8 | 9.2 | 80 | 52.5 | 7.5 | 99.0 | 19.2 | 536.7 |
| 20 | 825.8 | 9.2 | 80 | 70 | 15 | 57.5 | 11.1 | 545.0 |
| 21 | 861 | 9 | 100 | 0 | 30 | 88.0 | 17.1 | 563.6 |
| 22 | 873.5 | 9 | 100 | 17.5 | 0 | 103.5 | 20.1 | 606.7 |
| 23 | 848.5 | 9 | 100 | 35 | 7.5 | 60.0 | 11.6 | 610.8 |
| 24 | 823.5 | 9 | 100 | 52.5 | 15 | 60.0 | 11.6 | 643.0 |
| 25 | 798.5 | 9 | 100 | 70 | 22.5 | 73.5 | 14.2 | 522.1 |
| No. | FS_1d */MPa | FS_3d */MPa | FS_7d */MPa | CS_1d */MPa | CS_3d */MPa | CS_7d */MPa |
|---|---|---|---|---|---|---|
| 1 | 2.1 | 4.2 | 7.4 | 5.5 | 11.6 | 15.4 |
| 2 | 2.1 | 5.4 | 7.5 | 4.3 | 10.8 | 14.2 |
| 3 | 1.8 | 5 | 8.1 | 3.5 | 12.4 | 16.2 |
| 4 | 1.1 | 3.7 | 7.4 | 1 | 10.6 | 12.8 |
| 5 | 0.1 | 3 | 5.5 | 0 | 10.1 | 13.1 |
| 6 | 2 | 4.5 | 8 | 3.5 | 8.4 | 12 |
| 7 | 0.9 | 6.4 | 8.7 | 9.6 | 17.6 | 20.6 |
| 8 | 1.5 | 3.8 | 8.4 | 6.6 | 12.1 | 16.2 |
| 9 | 1.2 | 2.8 | 3.4 | 1.7 | 4.5 | 6.4 |
| 10 | 1.8 | 4.4 | 6.2 | 3.2 | 8.6 | 12.3 |
| 11 | 2.2 | 2.3 | 5.1 | 5.3 | 9.8 | 14.8 |
| 12 | 1.3 | 2.4 | 3.8 | 1.1 | 2.7 | 4.9 |
| 13 | 2.1 | 4.5 | 5.8 | 4.9 | 8.6 | 12 |
| 14 | 1.9 | 5.3 | 7.6 | 7.5 | 12.2 | 17.3 |
| 15 | 2.1 | 4.6 | 6.2 | 4.7 | 10.6 | 14.2 |
| 16 | 1.7 | 4.3 | 5.7 | 3.7 | 7.8 | 11.3 |
| 17 | 1.5 | 2.5 | 3.5 | 1.7 | 3.5 | 6.7 |
| 18 | 1.6 | 2.4 | 3.8 | 3.9 | 6.1 | 10.1 |
| 19 | 2.1 | 4.8 | 7.5 | 10.1 | 13.2 | 22.1 |
| 20 | 1.5 | 4.9 | 5.1 | 3.6 | 6.3 | 10.1 |
| 21 | 1.8 | 5.3 | 6.7 | 5.1 | 10.1 | 12.7 |
| 22 | 1.7 | 5.1 | 7.7 | 7.7 | 12.6 | 18.6 |
| 23 | 1.7 | 3.4 | 3.9 | 2.4 | 5 | 8.4 |
| 24 | 1.3 | 2 | 2.8 | 1.1 | 3.3 | 5.2 |
| 25 | 1.8 | 5.5 | 5.6 | 4.4 | 8.4 | 12.1 |
| Composition | CH/% | Fly Ash/% | DG/% | Alkali/% | Modulus | W/G |
|---|---|---|---|---|---|---|
| Content | 2 | 0 | 0.75 | 4.5 | 1.15 | 0.48 |
| No. | CH/% | Fly Ash/% | DG/% | Alkali/% | Modulus | W/G |
|---|---|---|---|---|---|---|
| A1 | 12 | 9.2 | 4. | 3.5 | 1.15 | 0.6 |
| A2 | 12 | 10 | 7 | 4 | 1.2 | 0.48 |
| No. | CS_1d | CS_3d | CS_7d | |
|---|---|---|---|---|
| A1 | Experiment/MPa | 3.6 | 7.03 | 9.9 |
| CatBoost/MPa | 3.4 | 7.3 | 10.7 | |
| Relative error/% | −6.2 | 3.8 | 8.1 | |
| A2 | Experiment/MPa | 7.8 | 13.5 | 17.1 |
| CatBoost/MPa | 7.2 | 12.5 | 16.0 | |
| Relative error/% | −7.69 | −7.41 | −6.32 |
| No. | CH/% | Fly Ash/% | DG/% | Alkali/% | Modulus | W/G |
|---|---|---|---|---|---|---|
| Y1 | 2 | 0 | 0.75 | 4.5 | 1.15 | 0.48 |
| Y2 | 3.1 | 2.6 | 0.53 | 4.3 | 1.18 | 0.49 |
| Method | No. | FS_1d | FS_3d | FS_7d | CS_1d | CS_3d | CS_7d |
|---|---|---|---|---|---|---|---|
| CatBoost /MPa | Y1 | 1.8 | 5.8 | 8.2 | 7.0 | 14.8 | 19.4 |
| Y2 | 1.1 | 5.8 | 8.8 | 10.2 | 17.6 | 21.8 | |
| Experiment/MPa | Y1 | 1.5 | 6.2 | 8.3 | 7.4 | 17.4 | 20.9 |
| Y2 | 1.9 | 6.6 | 9.1 | 10.5 | 19.1 | 22.4 |
Disclaimer/Publisher’s Note: The statements, opinions and data contained in all publications are solely those of the individual author(s) and contributor(s) and not of MDPI and/or the editor(s). MDPI and/or the editor(s) disclaim responsibility for any injury to people or property resulting from any ideas, methods, instructions or products referred to in the content. |
© 2024 by the authors. Licensee MDPI, Basel, Switzerland. This article is an open access article distributed under the terms and conditions of the Creative Commons Attribution (CC BY) license (https://creativecommons.org/licenses/by/4.0/).
Share and Cite
Liu, X.; Liu, H.; Wang, Z.; Zang, X.; Ren, J.; Zhao, H. Performance Characterization and Composition Design Using Machine Learning and Optimal Technology for Slag–Desulfurization Gypsum-Based Alkali-Activated Materials. Materials 2024, 17, 3540. https://doi.org/10.3390/ma17143540
Liu X, Liu H, Wang Z, Zang X, Ren J, Zhao H. Performance Characterization and Composition Design Using Machine Learning and Optimal Technology for Slag–Desulfurization Gypsum-Based Alkali-Activated Materials. Materials. 2024; 17(14):3540. https://doi.org/10.3390/ma17143540
Chicago/Turabian StyleLiu, Xinyi, Hao Liu, Zhiqing Wang, Xiaoyu Zang, Jiaolong Ren, and Hongbo Zhao. 2024. "Performance Characterization and Composition Design Using Machine Learning and Optimal Technology for Slag–Desulfurization Gypsum-Based Alkali-Activated Materials" Materials 17, no. 14: 3540. https://doi.org/10.3390/ma17143540