
Research on the Influence of HMFI and PWHT Treatments on the Properties and Stress States of MAG-Welded S690QL Steel Joints


Abstract
:1. Introduction
2. Materials and Methods
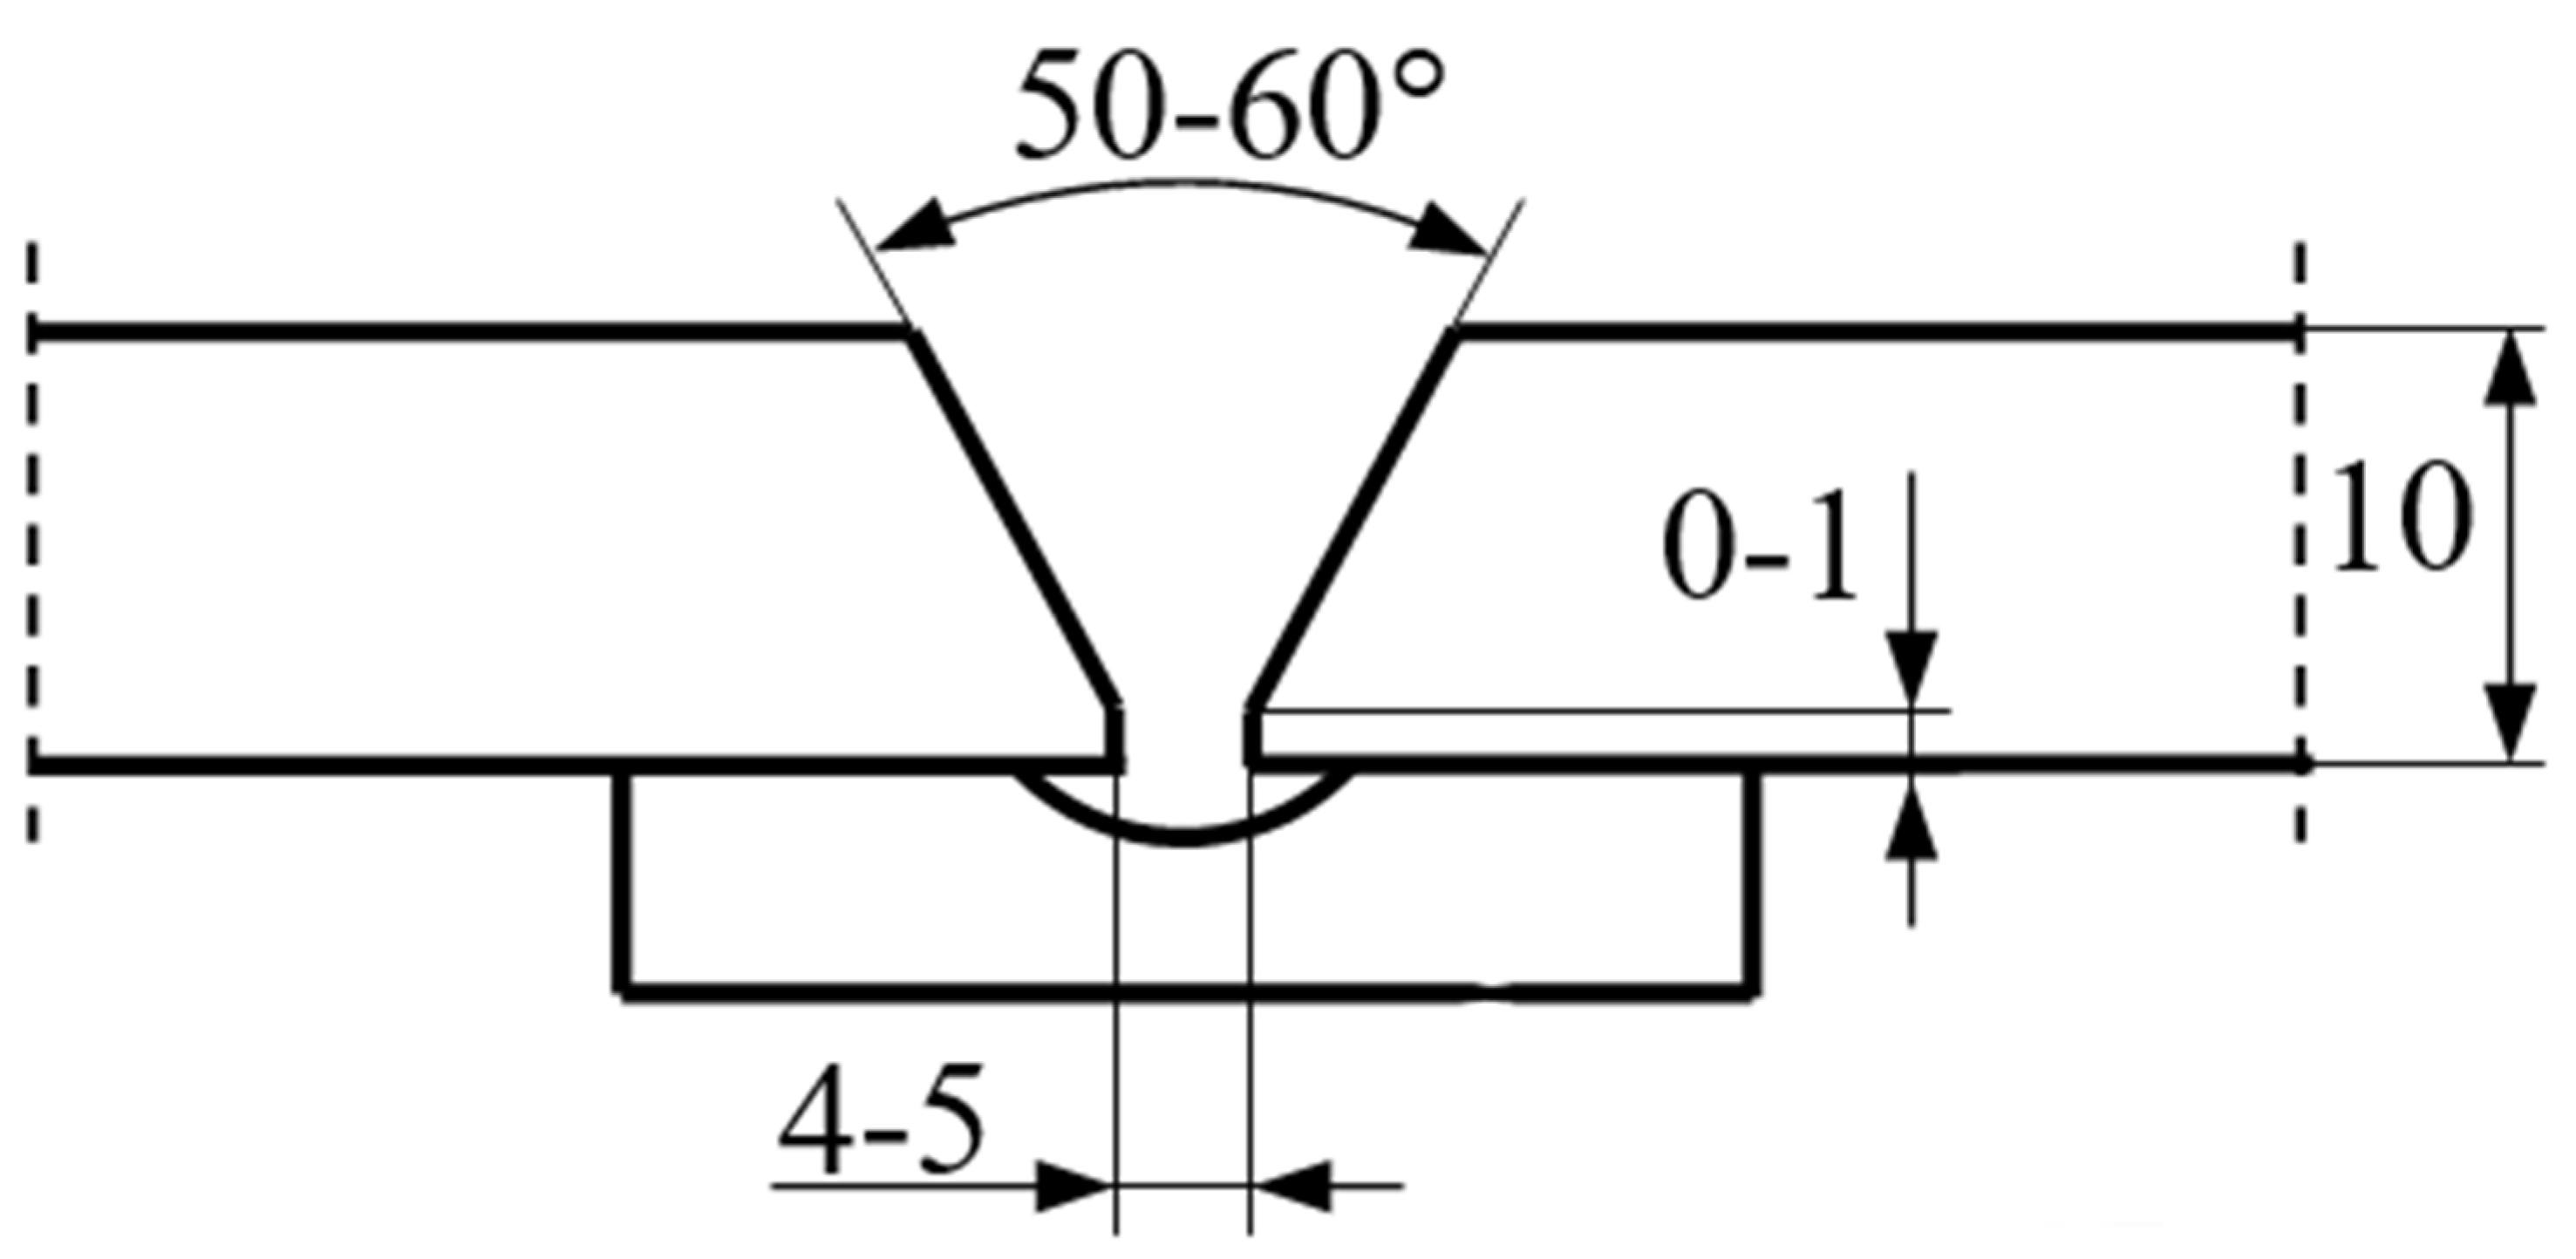
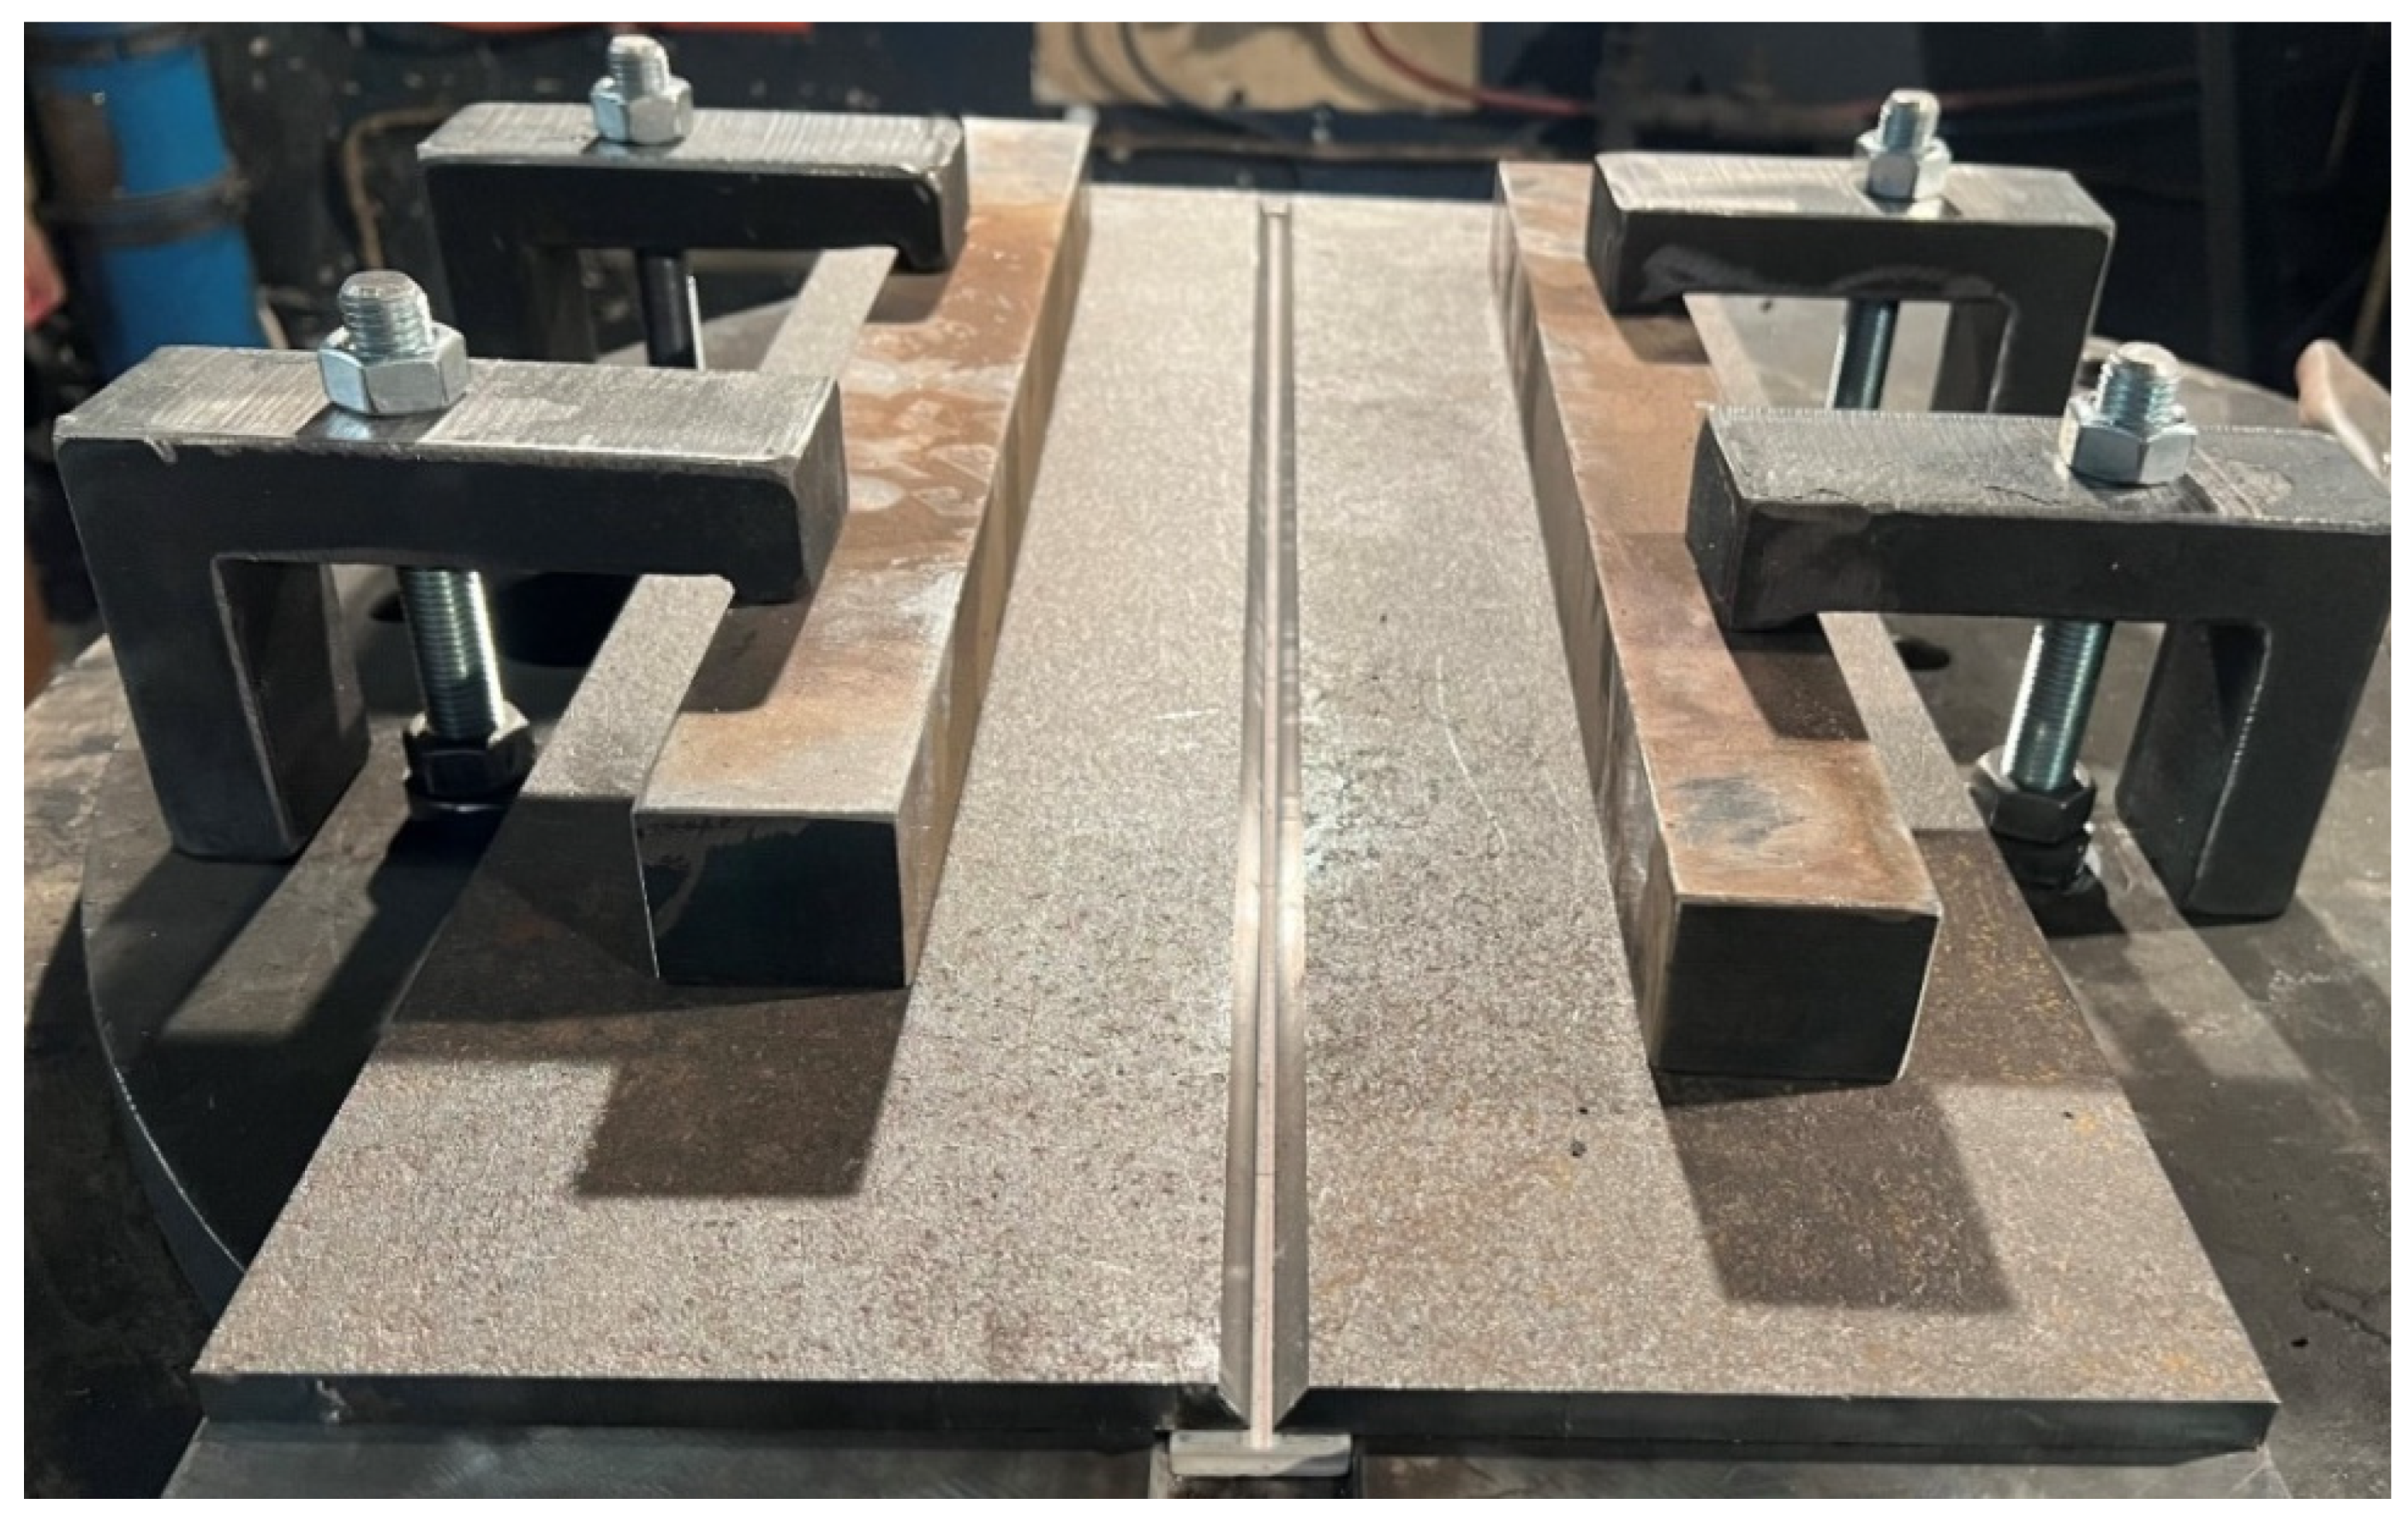
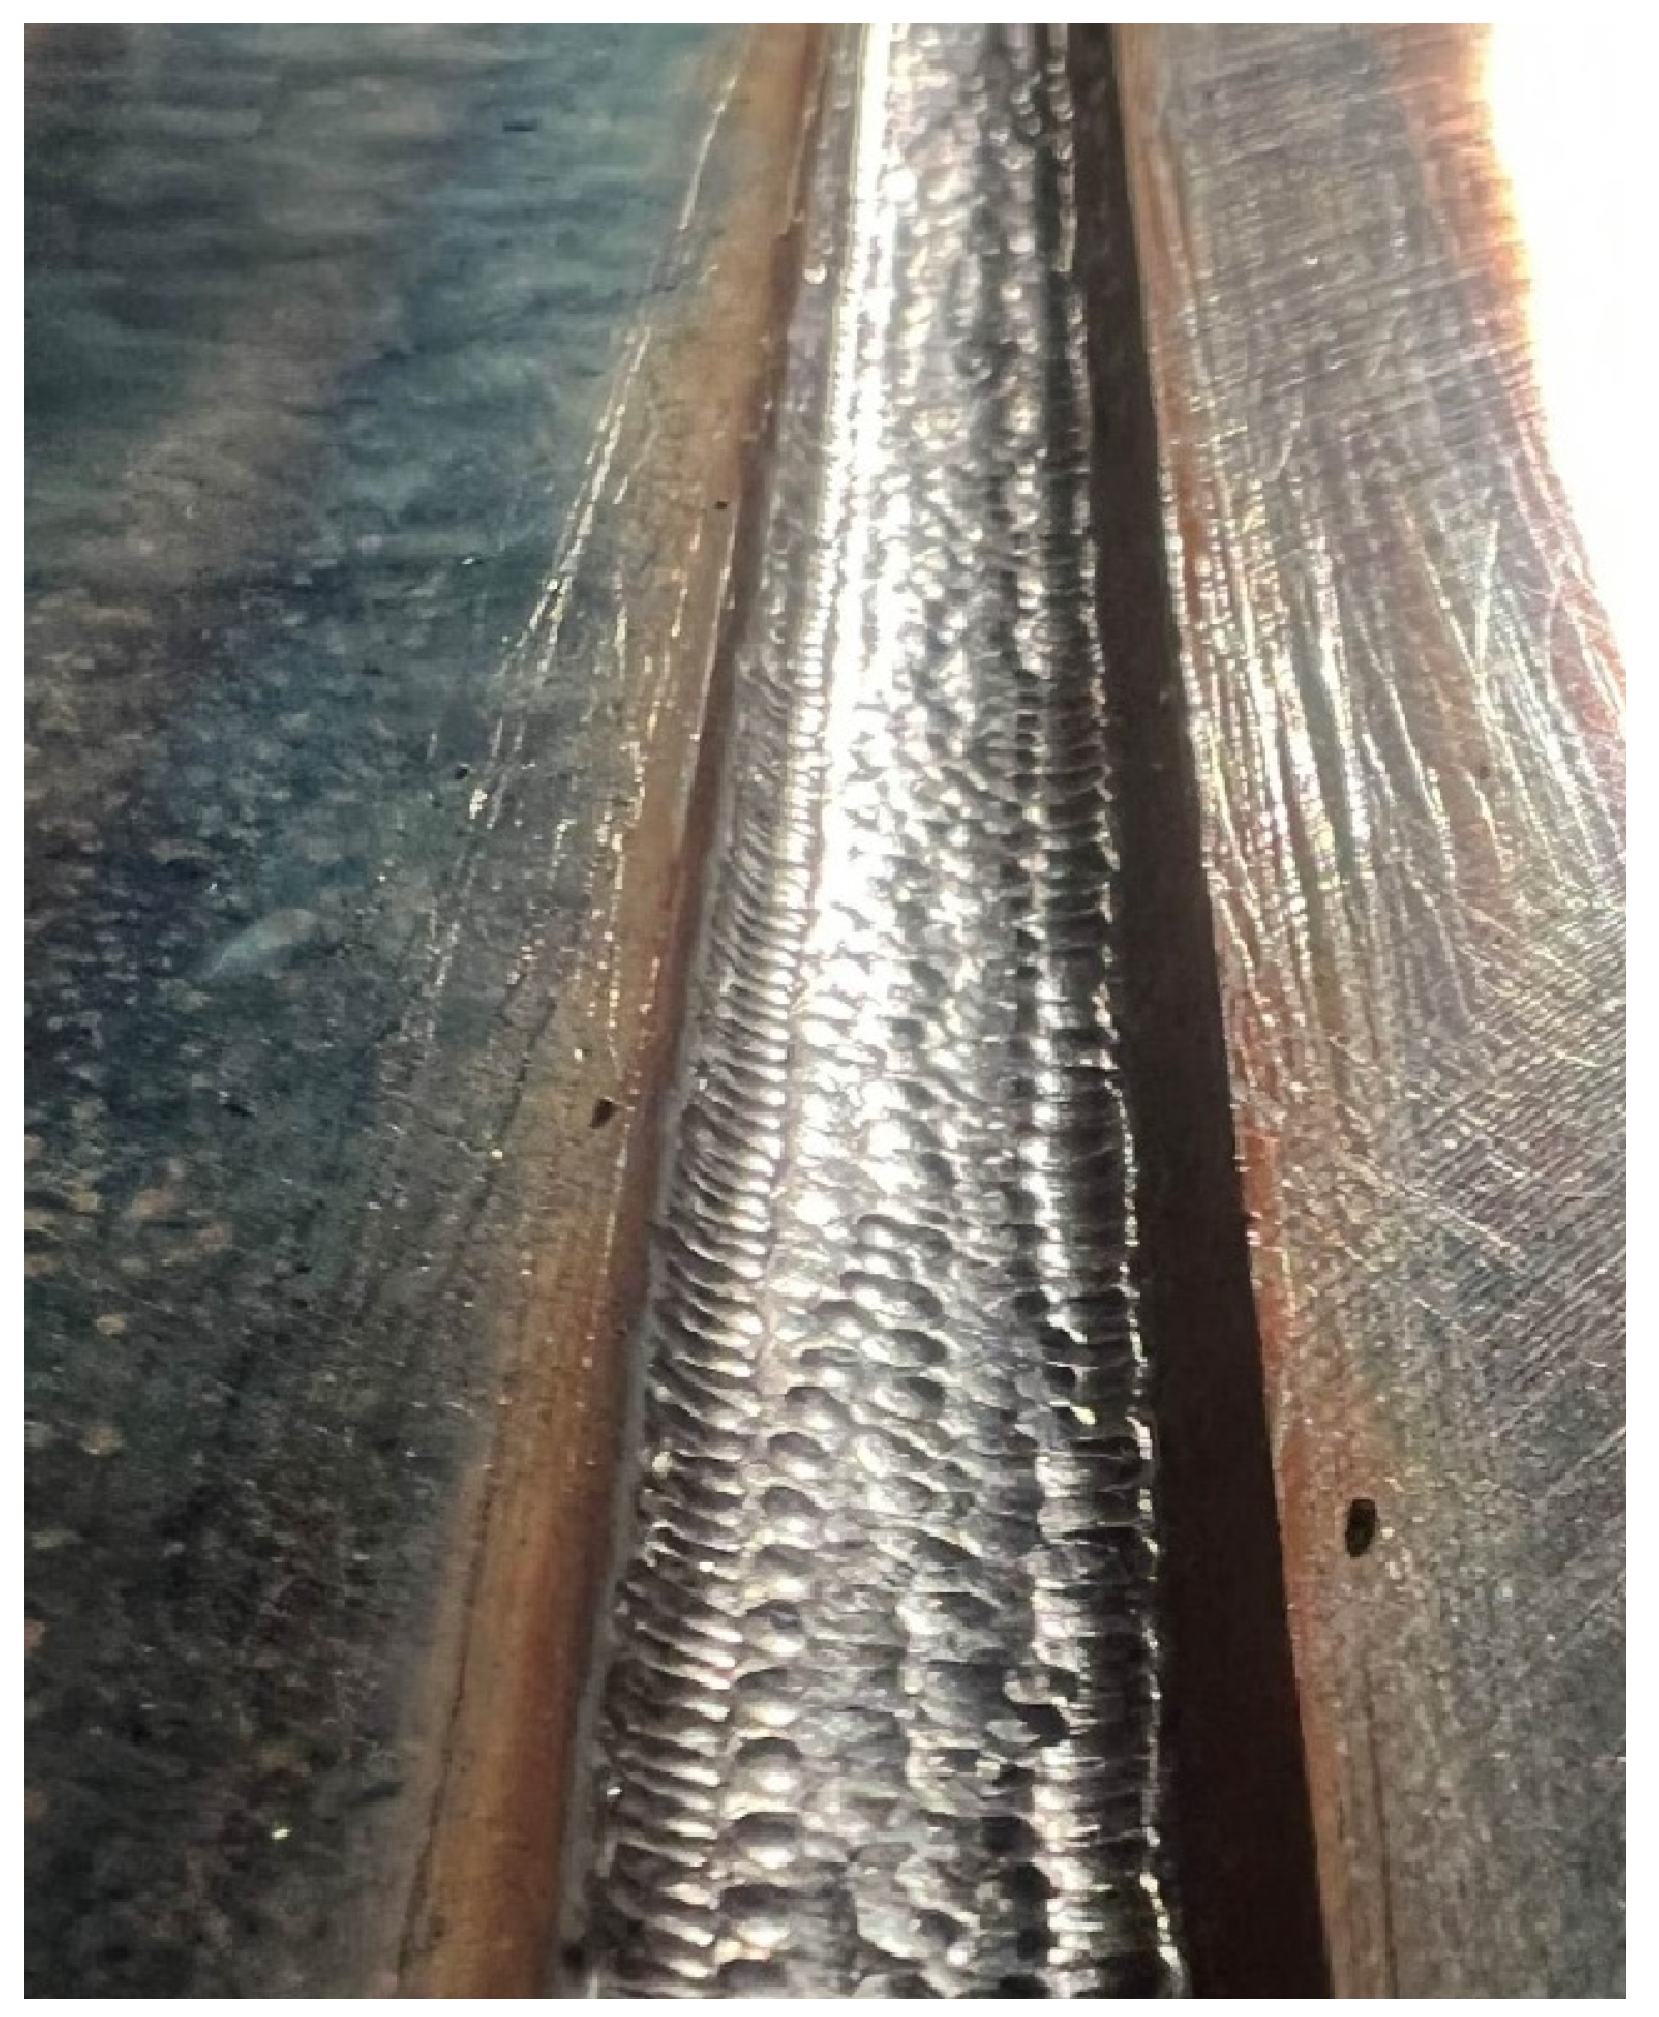
2.1. Preparation of Welded Joints
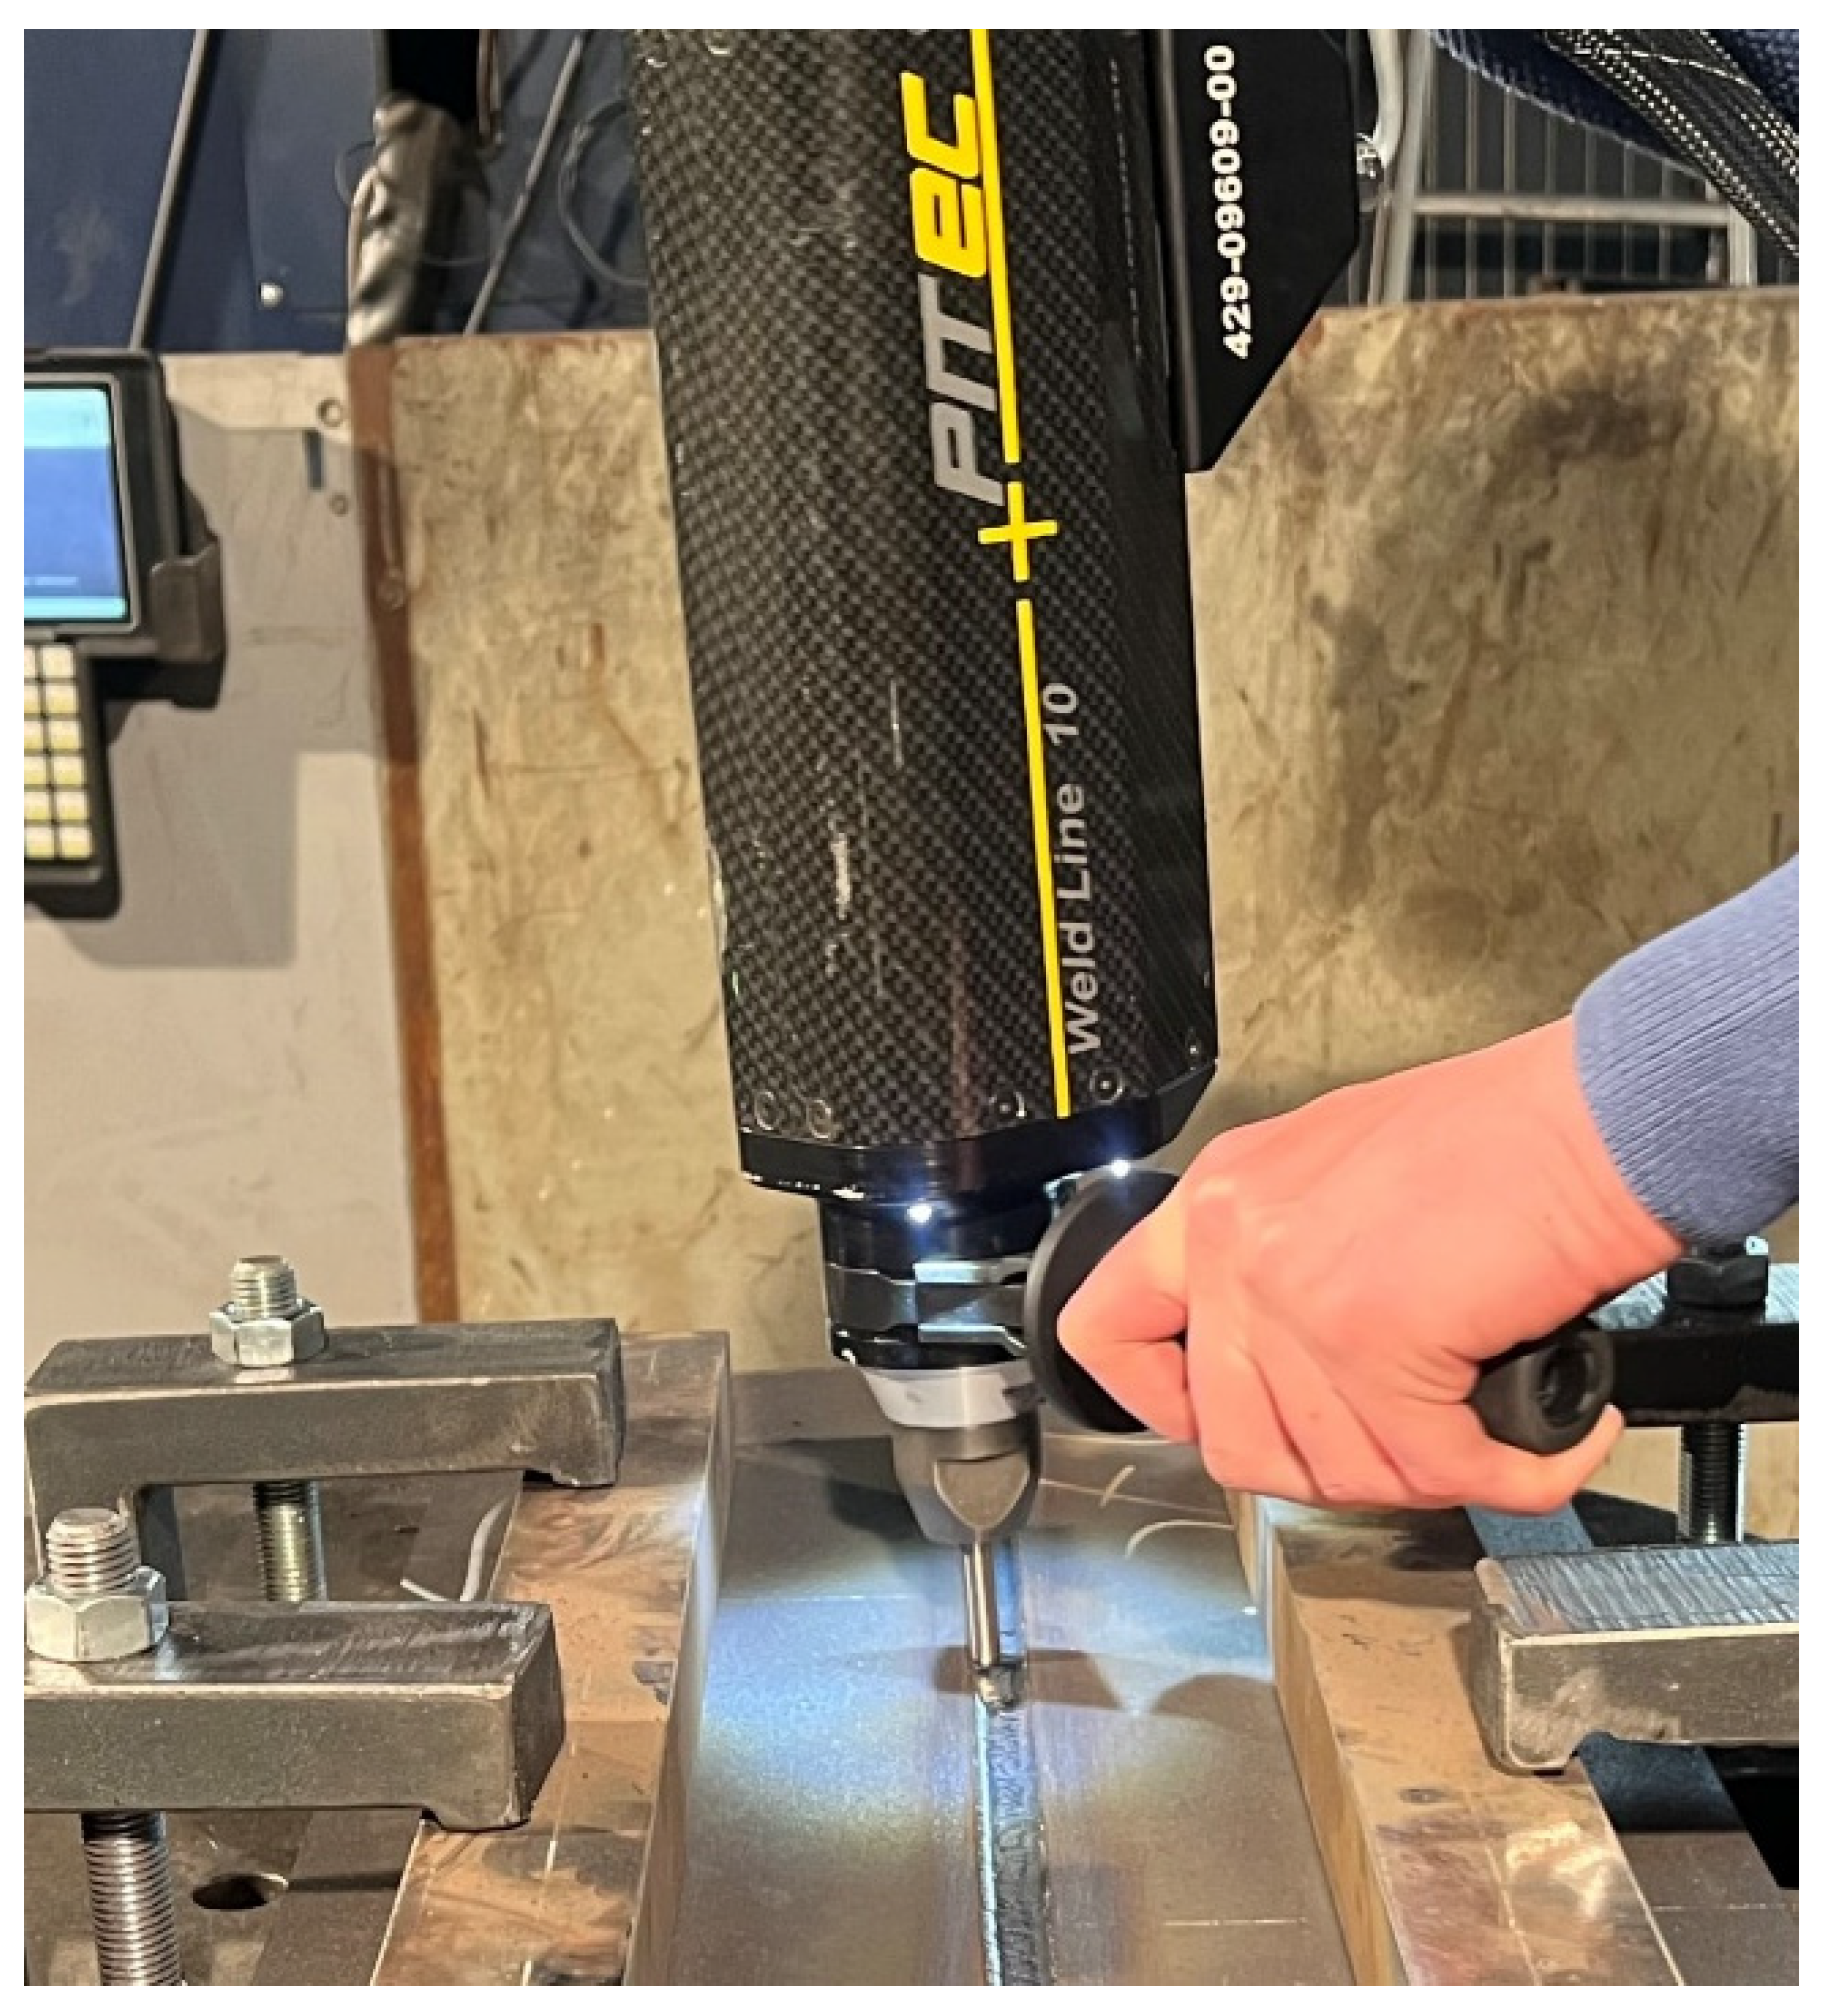
2.2. High-Frequency Mechanical Impact
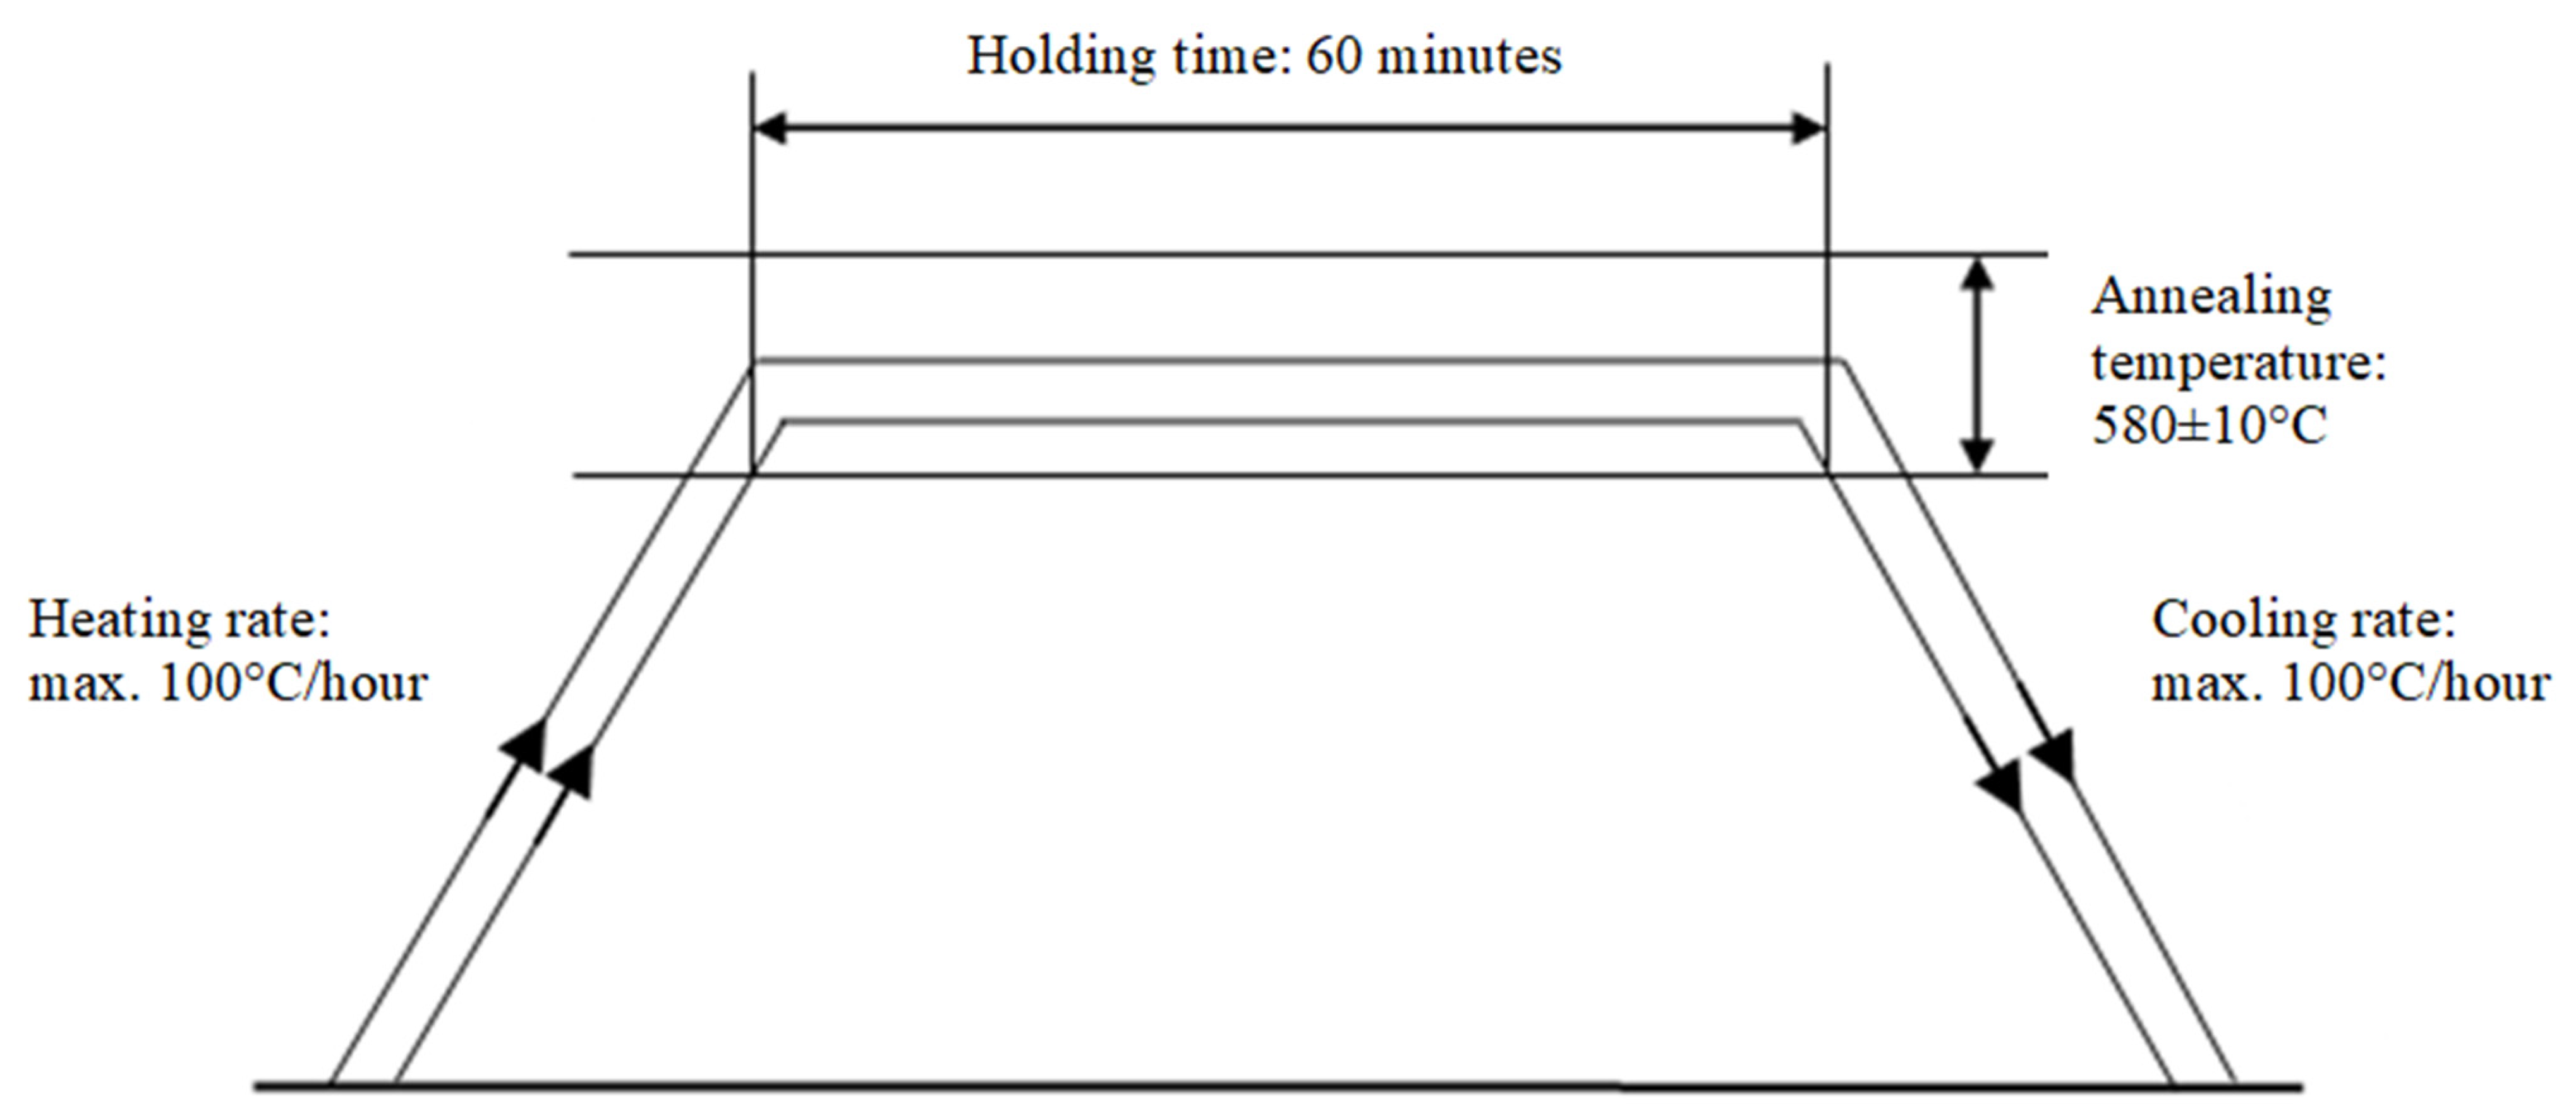
2.3. Post-Weld Heat Treatment
2.4. Methodology of Tests and Acceptance Criteria
- ⮚
- Tensile test—2 pieces of specimens according to EN ISO 4136 [43];
- ⮚
- Side and root bend test—4 pieces of samples in accordance with EN ISO 5173 [44];
- ⮚
- Charpy test—2 sets of samples in accordance with EN ISO 9016 [45];
- ⮚
- Vickers hardness test—2 lines of measurement in accordance with EN ISO 9015-1 [46];
- ⮚
- Macroscopic test—1 piece in accordance with EN ISO 17639 [47].
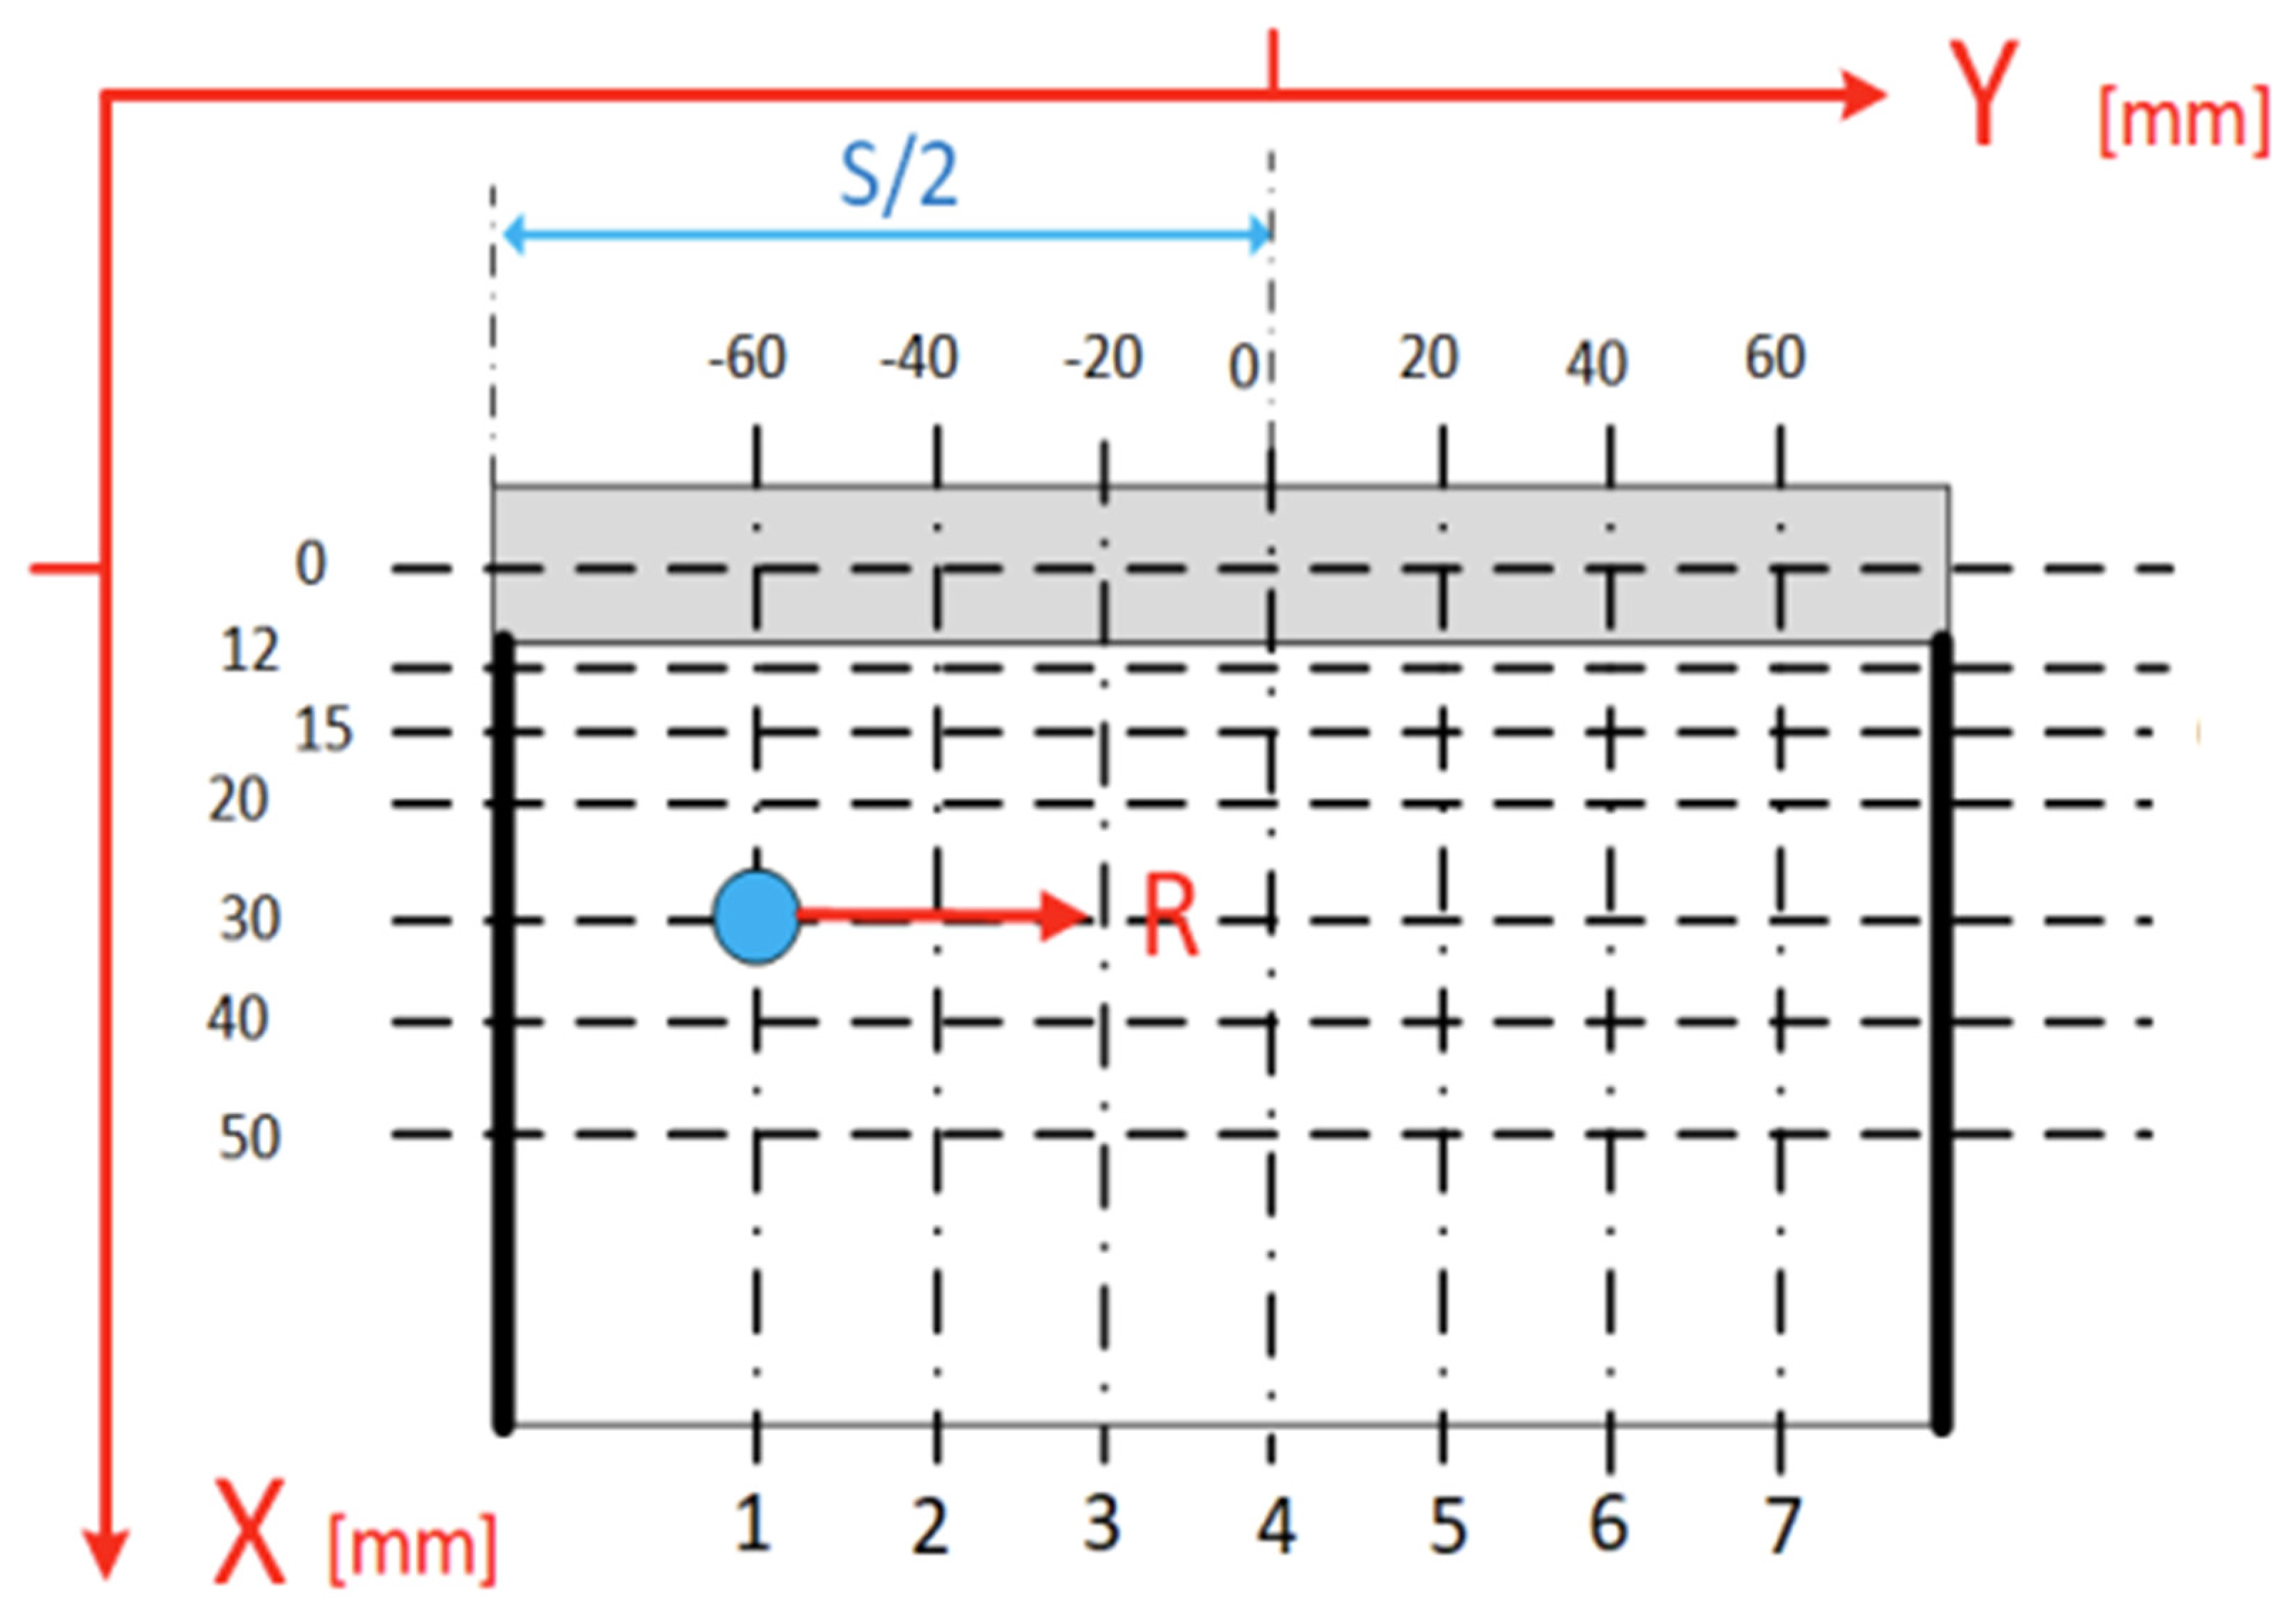
Barkhausen Effect Measurement
3. Results
3.1. Destructive Tests Result Analysis
3.2. Stress Measurement Using the Barkhausen Effect
4. Summary
- ⮚
- Based on this article, it was proven that a classic welding technology qualification can be carried out together with HFMI as it has no negative impact on the obtained results.
- ⮚
- Tensile test results were positive for specimens taken from as-welded and HFMI-treated weld samples. For the PWHT-treated sample, the tensile test showed a value that decreased below the requirement. It showed that the PWHT of quenched and tempered construction steels has a negative impact on tensile strength. On the other hand, the results showed that HMFI did not reduce their mechanical properties.
- ⮚
- Face and root bending tests showed no inconsistencies and met the acceptance criteria specified in the standards.
- ⮚
- Charpy test results were within the range of acceptance criteria for all three samples. The HFMI sample displayed the lowest values in both the HAZ and weld area compared to as-welded and PWHT-treated samples.
- ⮚
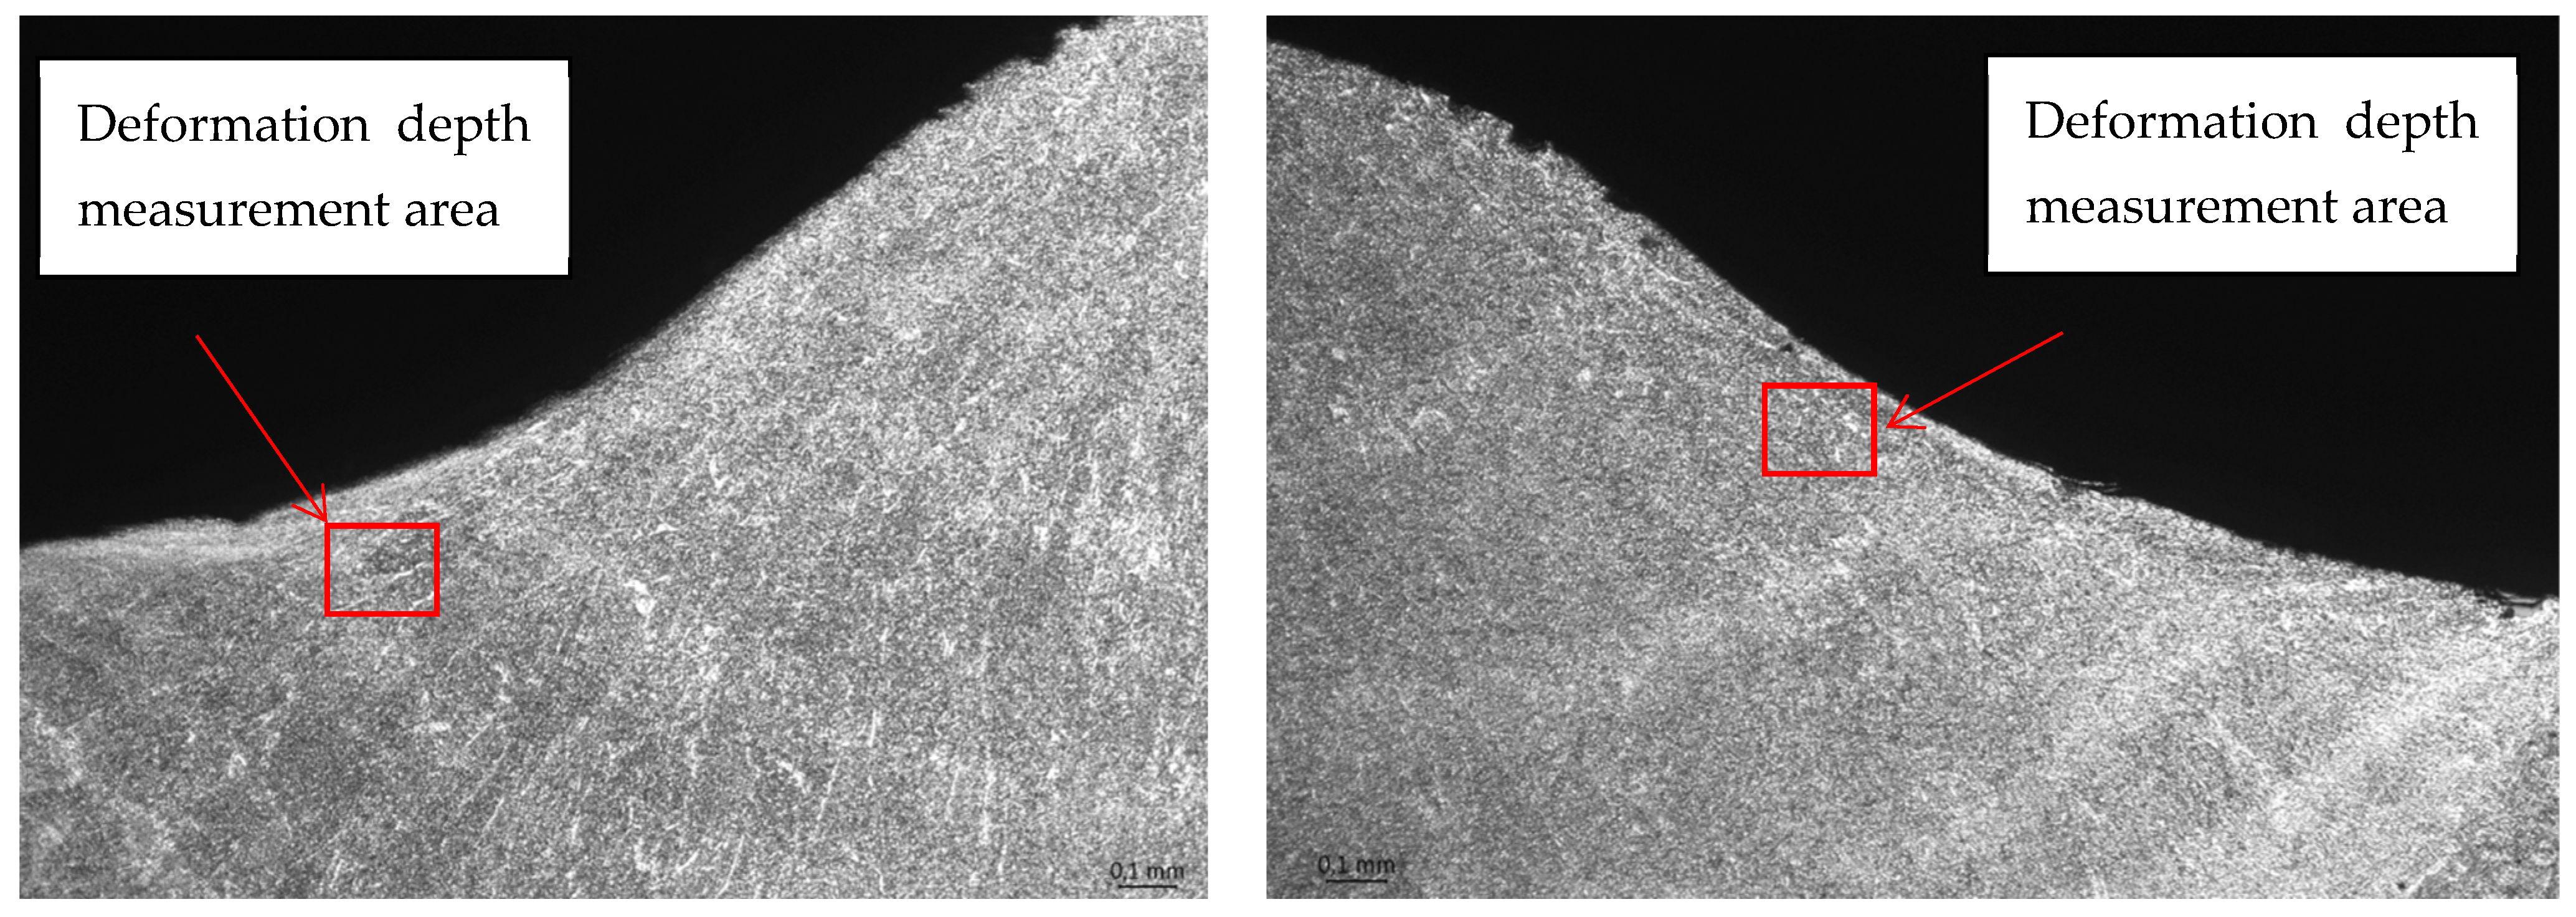
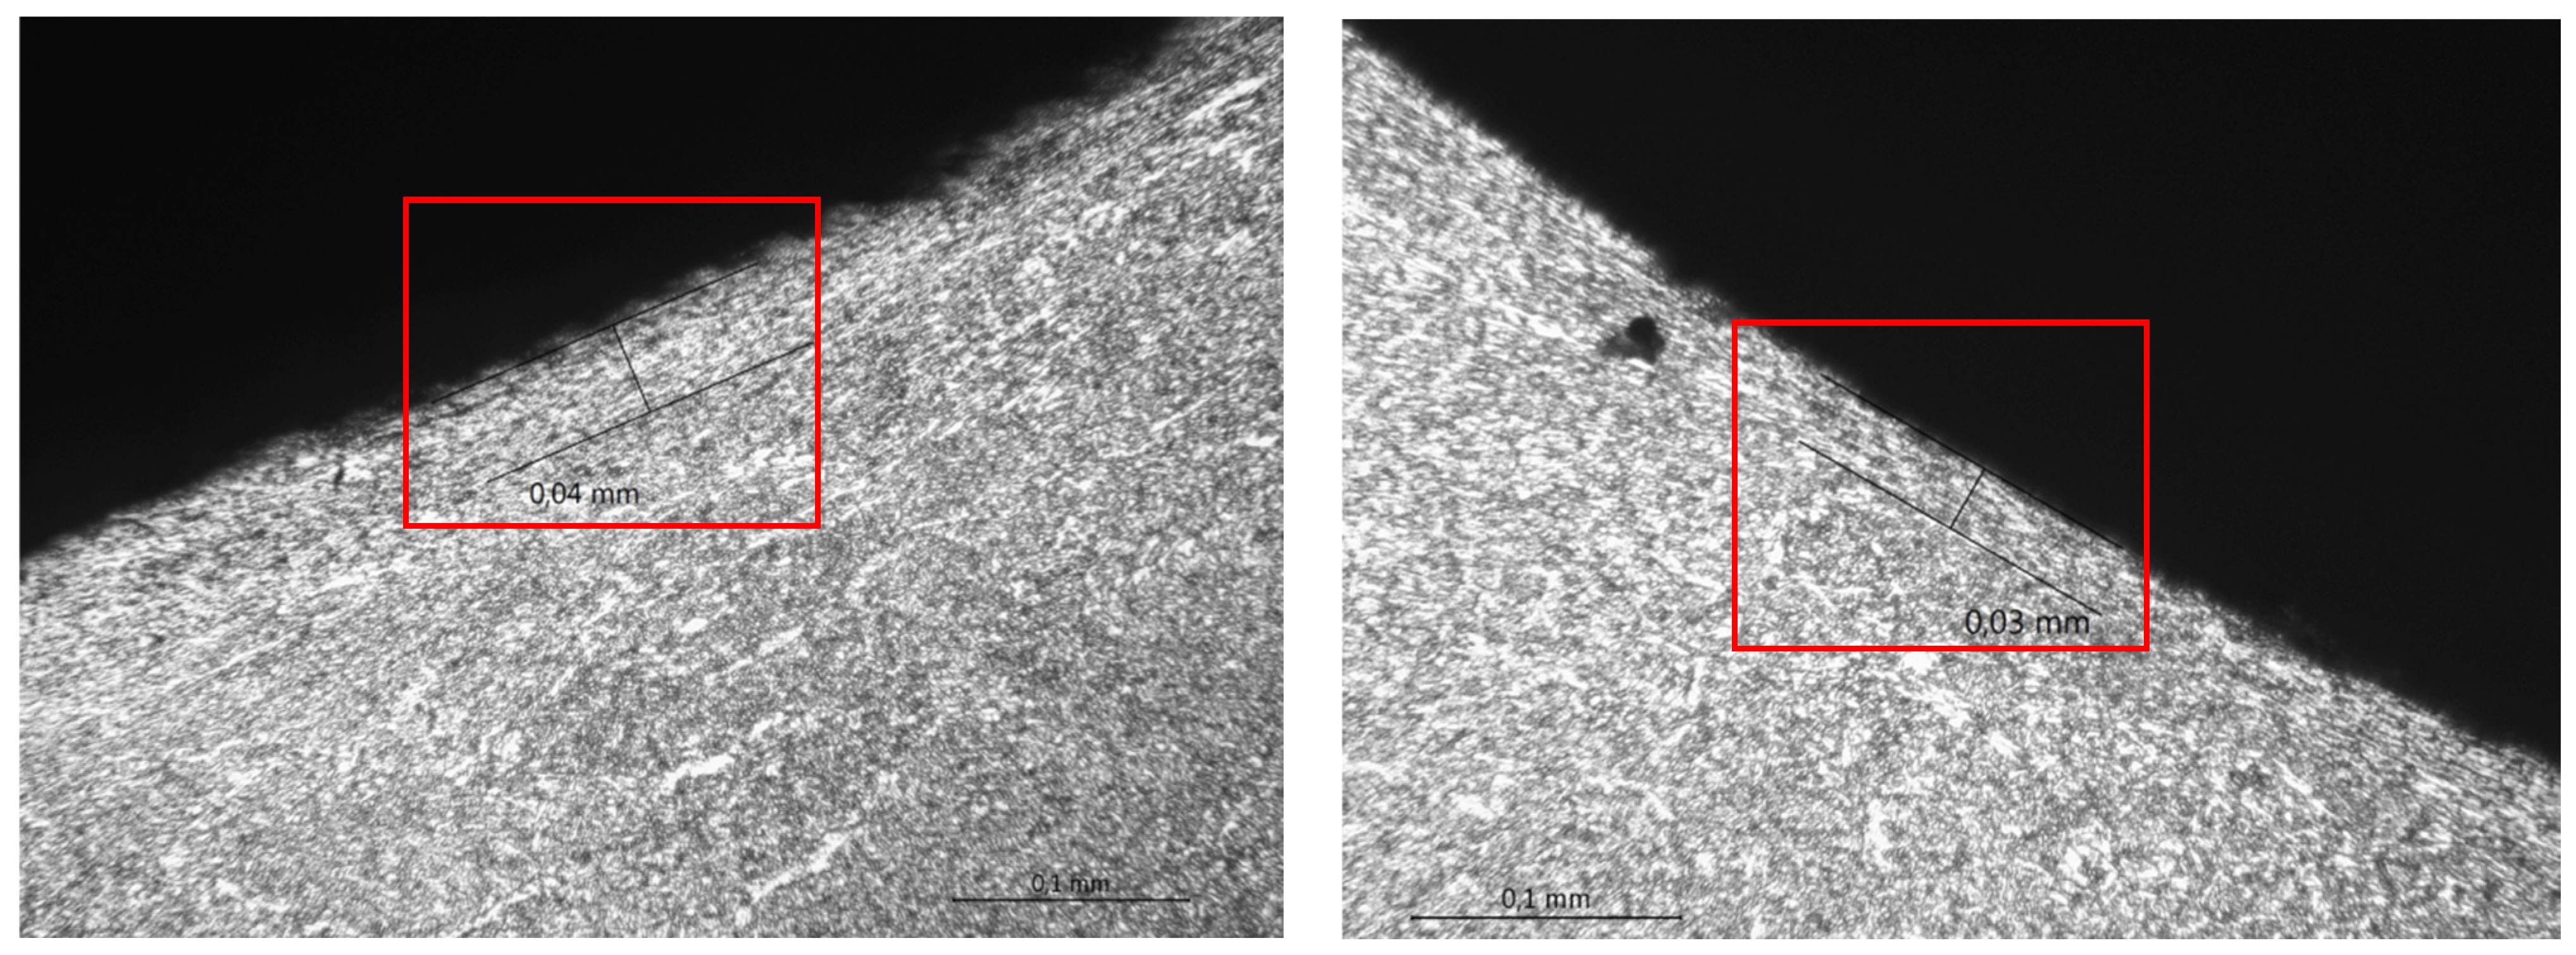
- Hardness measurements showed that using HMFI caused a hardness increase in the area that was treated. The reason for this is that a local high plastic deformation occurs due to hammer peening. Despite the increase in hardness in the HFMI sample, the values were still within the outlined limits.
- ⮚
- The macroscopic examination showed no inconsistencies on the cross-sections of all three test plates.
- ⮚
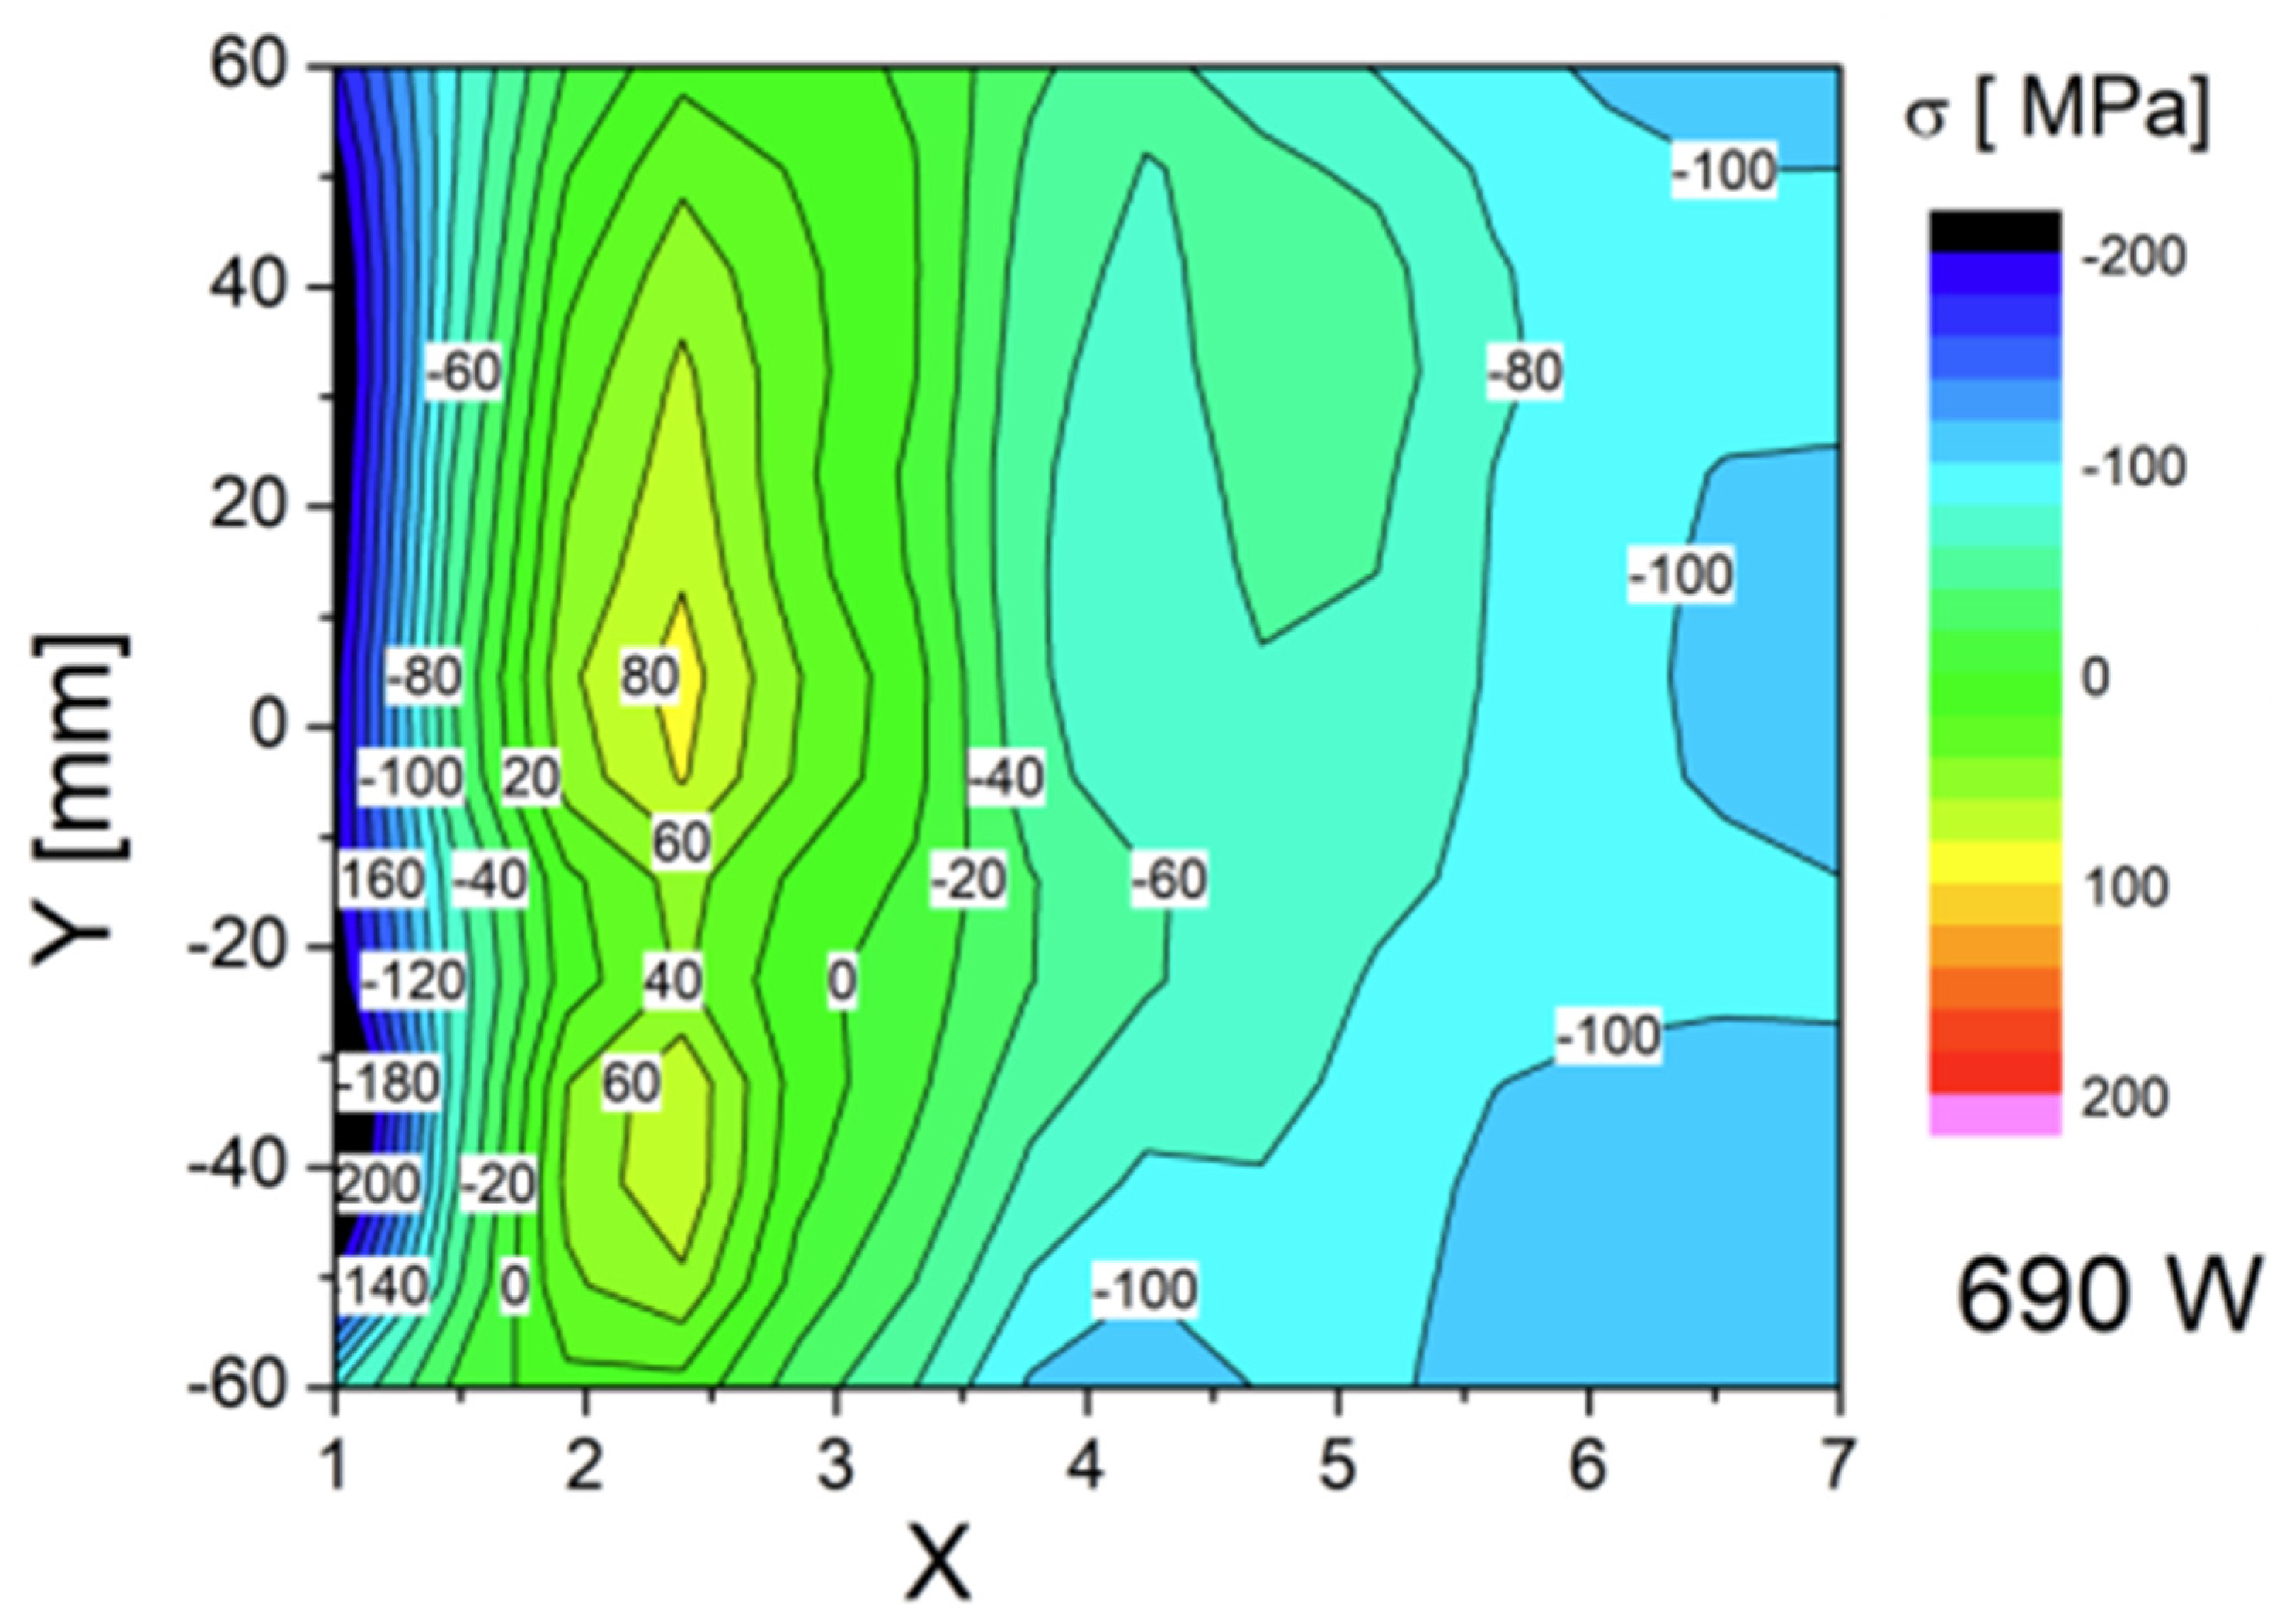
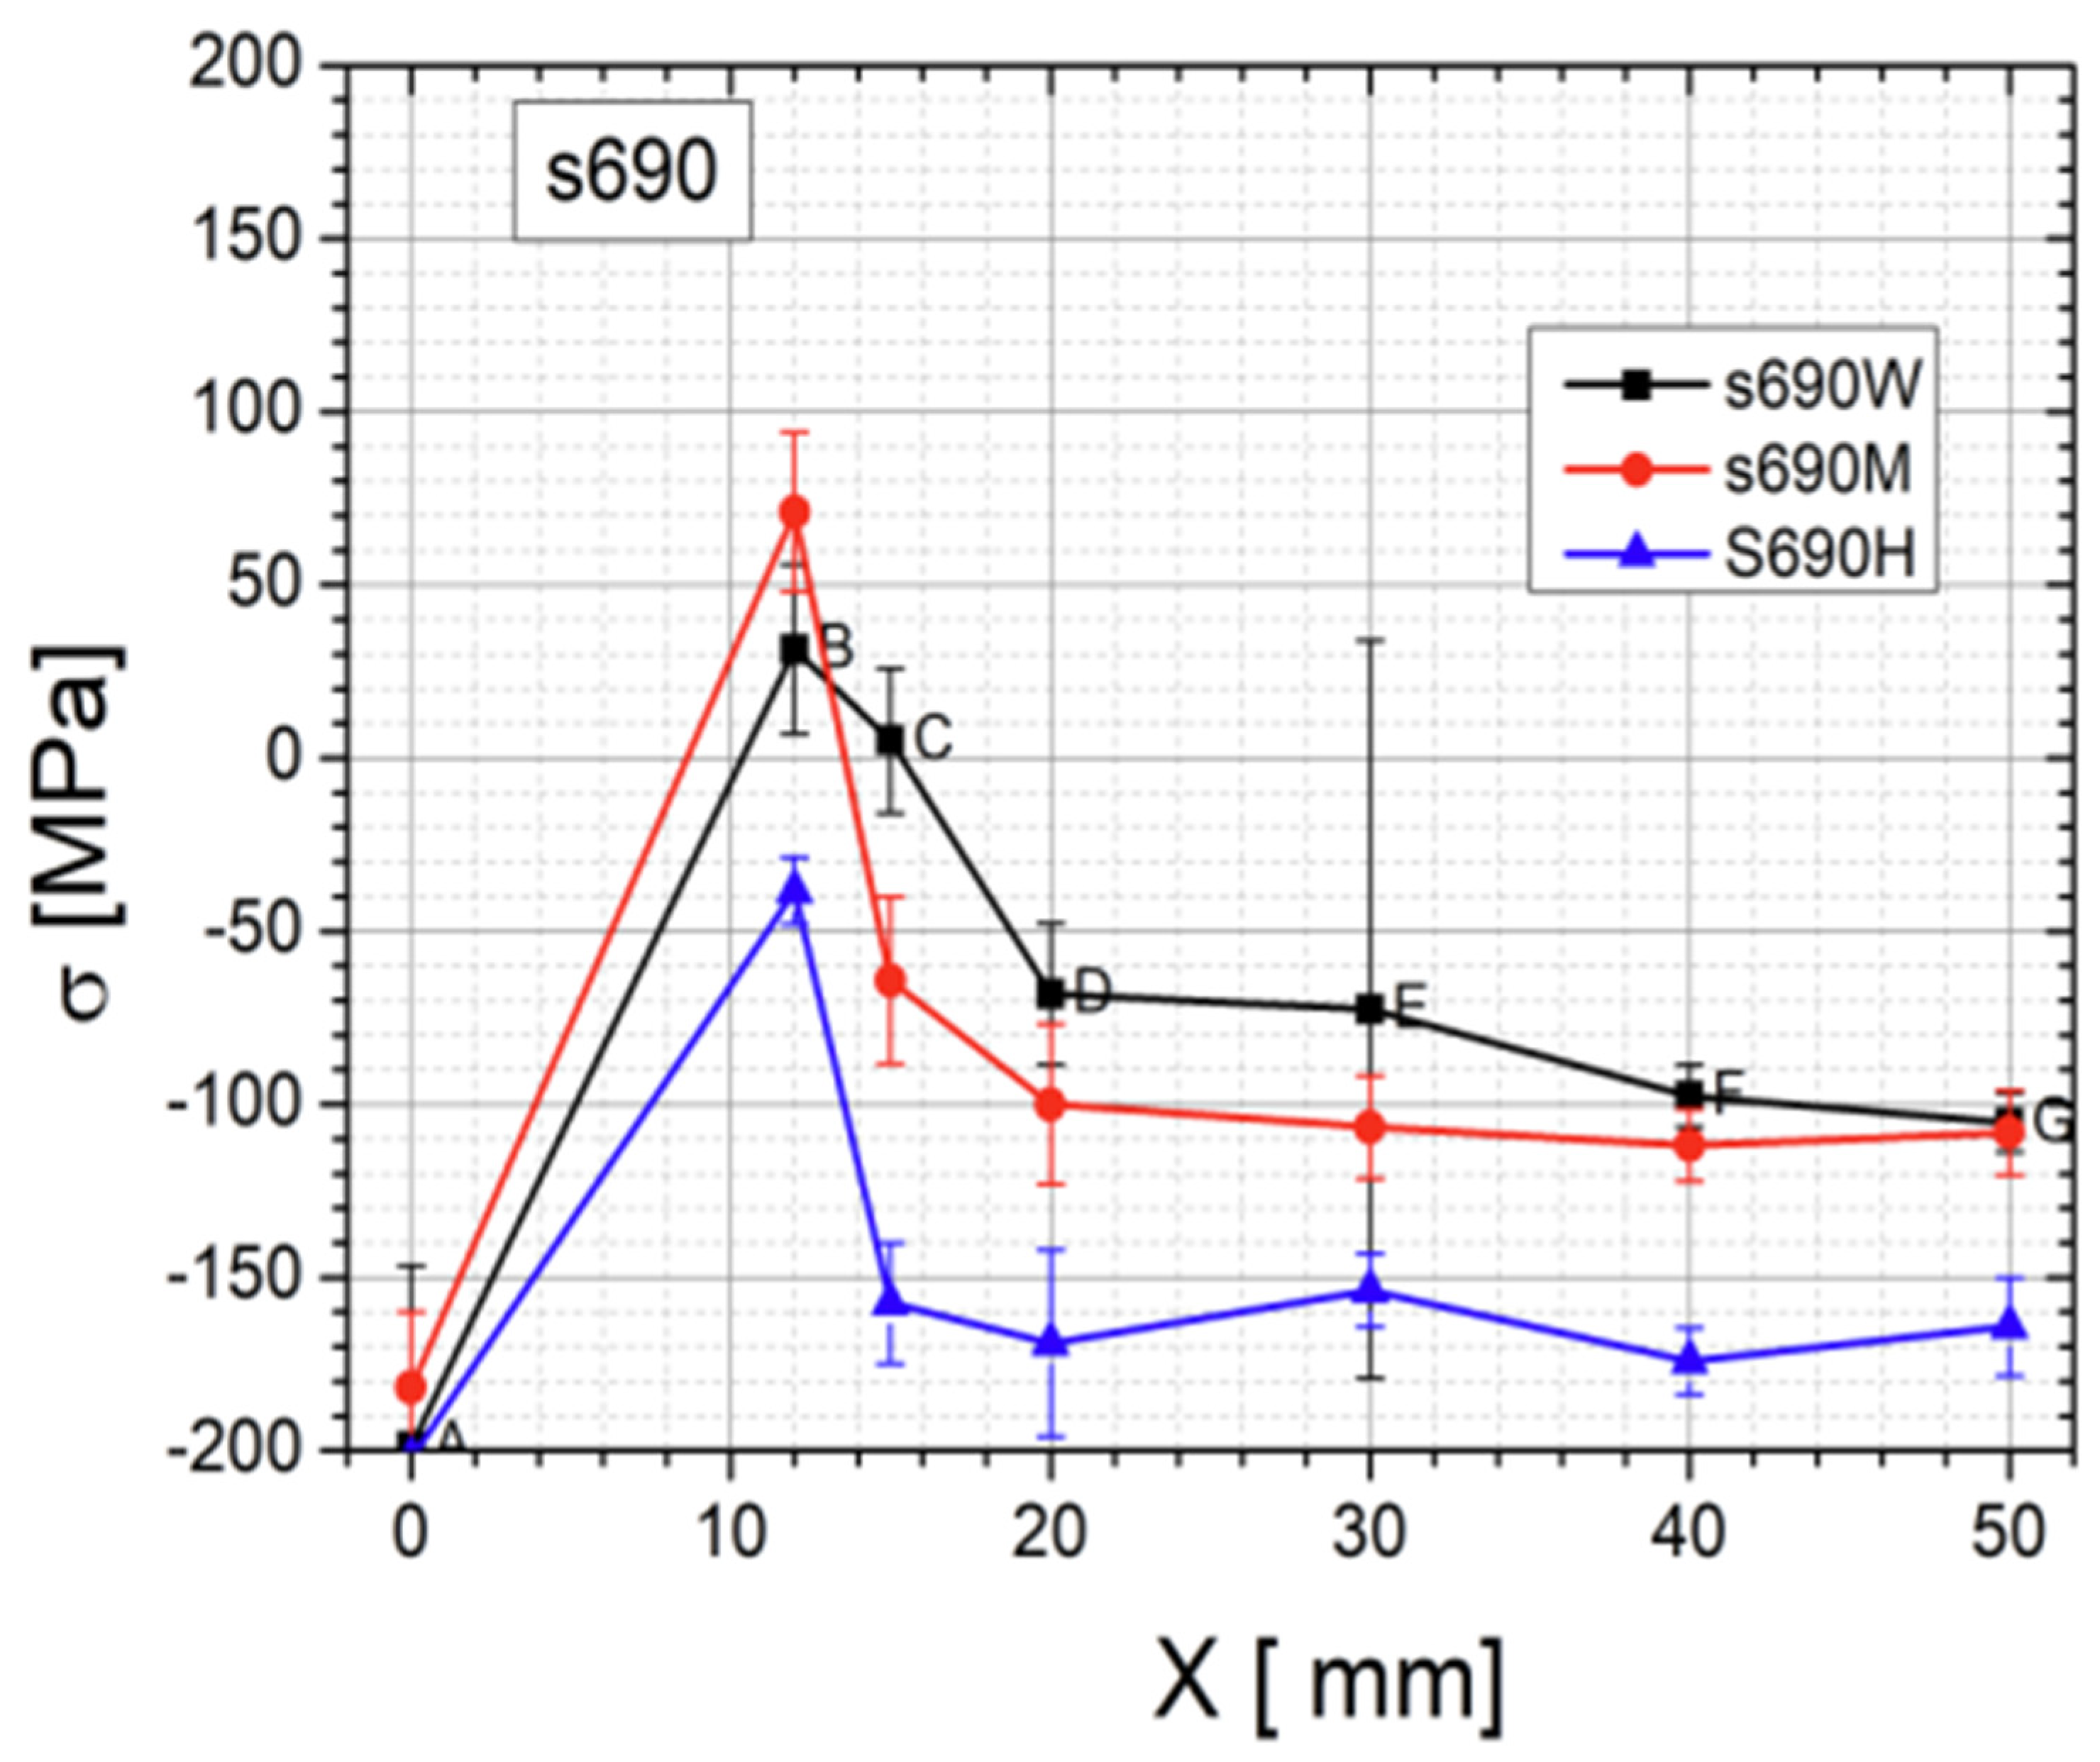
- The spatial distribution of the stress level specific to each treatment condition was revealed. The stress state in the HAZ zone was particularly interesting. The authors believe that the HAZ zone can be considered as being 12–15 mm away from weld axis (Figure 13).
- ⮚
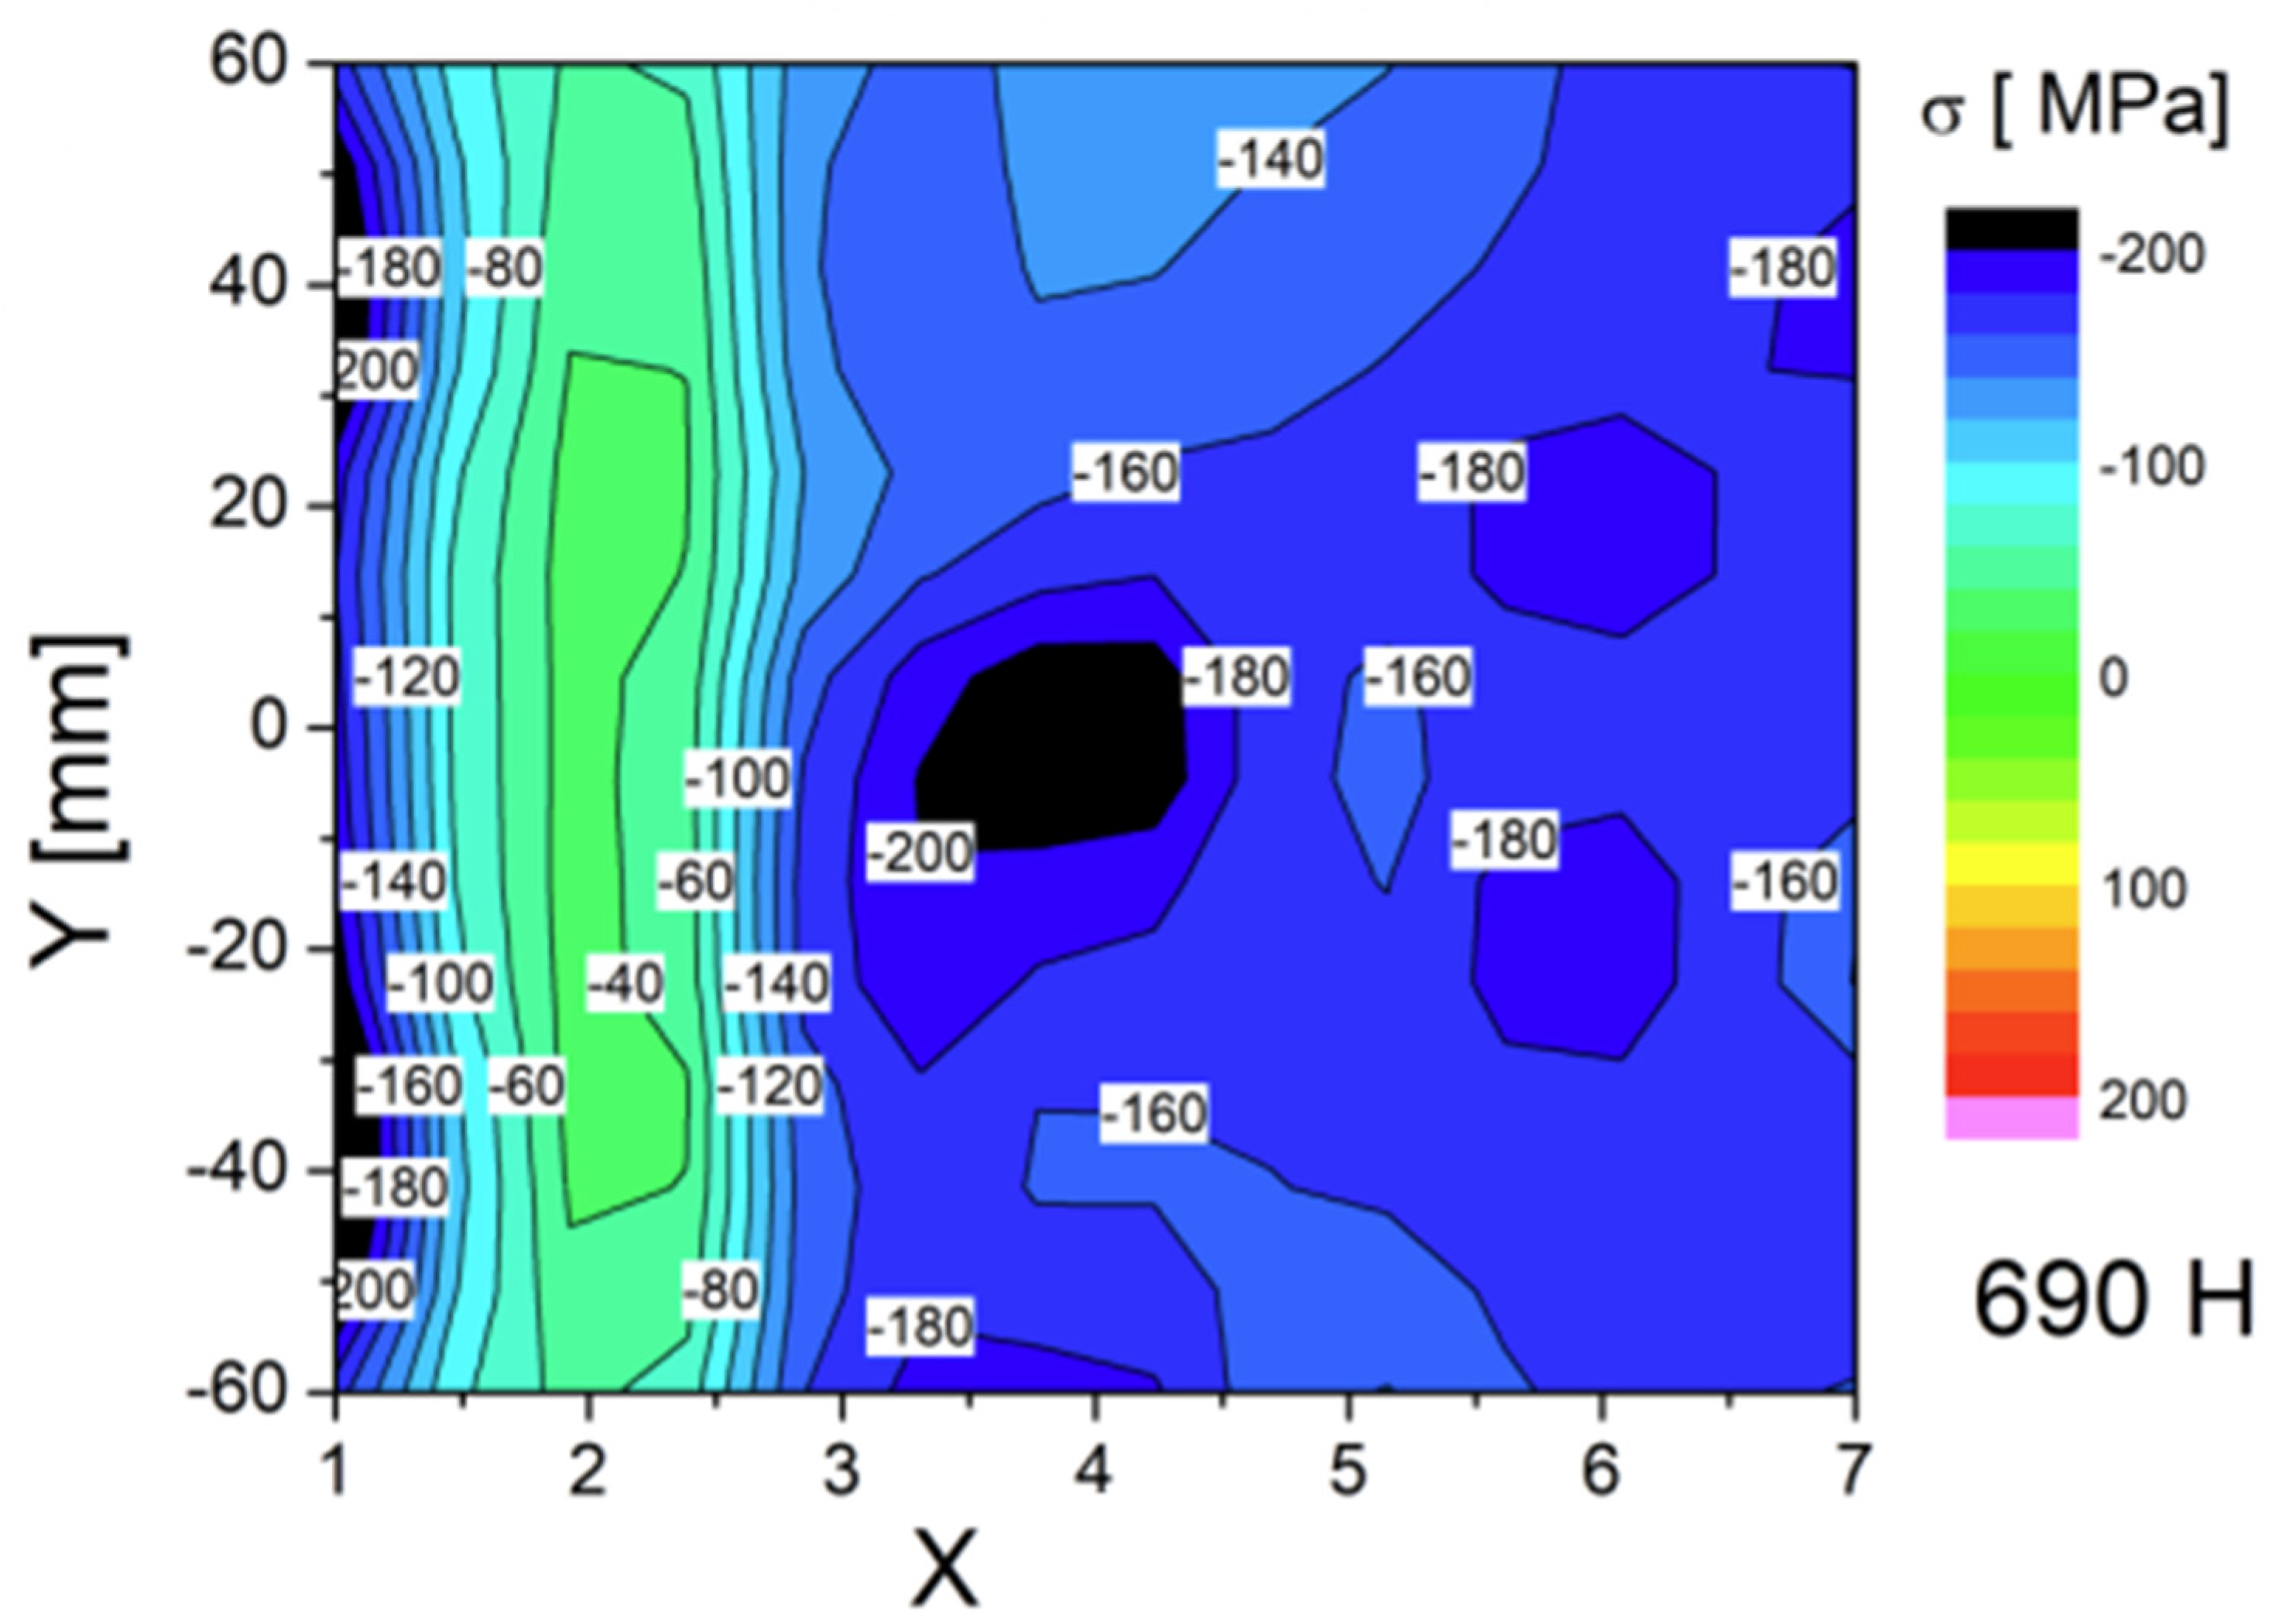
- The Barkhausen measurements showed that the HFMI treatment has a positive impact on the HAZ in comparison to as-welded sample but that the benefit is lower compared to regular PWHT. The PWHT conducted was slightly above the tempering temperature, and this is a reason why HFMI was less beneficial in comparison to annealing in terms of a reduction in residual stress.
- ⮚
- Evidently, the high-frequency mechanical impact (HFMI) treatment markedly diminishes stress levels within welds. An analysis of the stress distribution plots presented in Figure 13, depicting as-welded and HFMI-treated states with respect to the distance on the X axis, further allows us to infer that for distances of X ≥ 15 mm, the impact of HFMI is virtually negligible.
- ⮚
- The results indicate that a further investigation in terms of HFMI treatment with regard to a reduction in stress states is necessary and will be carried out by the authors in the future.
Author Contributions
Funding
Institutional Review Board Statement
Informed Consent Statement
Data Availability Statement
Conflicts of Interest
References
- Lefebvre, F.; Peyrac, C.; Elbel, G.; Revilla-Gomez, C.; Verdu, C.; Buffière, J.-Y. Understanding of fatigue strength improvement of steel structures by hammer peening treatment. Procedia Eng. 2015, 133, 454–464. [Google Scholar] [CrossRef]
- Gary, B.; Barsoum, Z. A guideline for fatigue strength improvement of high strength steel welded structures using high frequency mechanical impact treatment. Procedia Eng. 2013, 66, 98–107. [Google Scholar]
- Hobbacher, A. IIW Recommendations for Fatigue Design of Welded Joints and Components; WRC Bulletin 520; The Welding Research Council: New York, NY, USA, 2009. [Google Scholar]
- Kanga, H.; Leeb, Y.; Sunb, X. Effects of residual stress and heat treatment on fatigue strength of weldments. Mater. Sci. Eng. A 2008, 497, 37–43. [Google Scholar] [CrossRef]
- Górka, J.; Przybyla, M.; Szmul, M.; Chudzio, A.; Ladak, D. Orbital TIG welding of titanium tubes with perforated bottom made of titanium-clad steel. Adv. Mater. Sci. 2019, 19, 55–64. [Google Scholar] [CrossRef]
- Liu, S.; Wu, Z.; Liu, H.; Zhou, H.; Deng, K.; Wang, C.; Liu, L.; Li, E. Optimization of welding parameters on welding distortion and stress in S690 high-strength steel thin-plate structures. J. Mater. Res. Technol. 2023, 25, 382–397. [Google Scholar] [CrossRef]
- Fuštar, B.; Lukačević, I.; Dujmović, D. High-Frequency mechanical impact treatment of welded joints. Građevinar 2020, 72, 421–436. [Google Scholar] [CrossRef]
- Haagensen, P.J.; Maddox, S.J. Recommendations on Methods for Improving the Fatigue Strength of Welded Joints: IIW-2142-10; International Institute of Welding (IIW): Cambridge, UK; Philadelphia, PA, USA, 2013. [Google Scholar]
- Gerster, P.; Schäfers, F.; Leitner, M. Pneumatic Impact Treatment (PIT)—Application and Quality Assurance: IIW Document XIII-WG2-138-13; International Institute of Welding (IIW): Cambridge, UK; Philadelphia, PA, USA, 2013. [Google Scholar]
- Statnikov, E.S.; Shevtsov, U.M.; Kulikov, V.F. Ultrasonic impact tool for welds strengthening and reduction of residual stresses. Publ. Sci. Work. Metall. 1997, 92, 27–29. [Google Scholar]
- Harati, E.; Svensson, L.; Karlsson, L.; Hurtig, K. Effect of HFMI treatment procedure on weld toe geometry and fatigue properties of high strength steel welds. Procedia Struct. Integr. 2016, 2, 3483–3490. [Google Scholar] [CrossRef]
- Abadie, F.X.; Beckmerhagen, P.; Belassel, M. Shot Peening: A Dynamic Application and Its Future, 3rd ed.; Metal Finishing News: Wetzikon, Switzerland, 2009; pp. 17–44. [Google Scholar]
- Bagheri, S.; Guagliano, M. Review of shot peening processes to obtain nanocrystalline surfaces in metal alloys. Surf. Eng. 2009, 25, 3–14. [Google Scholar] [CrossRef]
- Bagherifard, S.; Guagliano, M. Fatigue behavior of a low alloy steel with nanostructured surface obtained by severe shot peening. Eng. Fract. Mech. 2012, 81, 56–68. [Google Scholar] [CrossRef]
- Trško, L.; Bokůvka, O.; Nový, F.; Guagliano, M. Effect of severe shot peening on ultra-high-cycle fatigue of a low-alloy steel. Mat. Des. 2014, 57, 103–113. [Google Scholar] [CrossRef]
- Bokůvka, O.; Nicoletto, G.; Guagliano, M.; Kunz, L.; Palcek, P.; Novy, F.; Chalupová, M. Fatigue of Materials at Low and High Frequency Loading, 2nd ed.; University of Zilina: Zilina, Slovakia, 2015; ISBN 978-80-554-0857-6. [Google Scholar]
- Noyan, I.C.; Cohen, J.B. Residual Stress-Measurement by Diffraction and Interpretation; Springer: New York, NY, USA, 1987. [Google Scholar]
- Lago, J.; Trsko, L.; Jambor, M.; Nový, F.; Bokůvka, O.; Mičian, M.; Pastorek, F. Fatigue Life Improvement of the High Strength Steel Welded Joints by Ultrasonic Impact Peening. Metals 2019, 9, 619. [Google Scholar] [CrossRef]
- Fitzpatrick, M.E.; Fry, A.T.; Holdway, P.; Kandil, F. Determination of Residual Stresses by X-ray Diffraction, 2nd ed.; National Physical Laboratory: Teddington, UK, 2005; pp. 42–48. [Google Scholar]
- ISO 15614-1:2017; Specification and Qualification of Welding Procedures for Metallic Materials—Welding Procedure Test—Part 1: Arc and Gas Welding of Steels and Arc Welding of Nickel and Nickel Alloys. ISO: Geneva, Switzerland, 2017.
- Bhadeshia, H.K.D.H. Reliability of Weld Microstructure and Property Calculations. Weld. J. 2004, 83, 237–243. [Google Scholar]
- Hildebrand, J.; Werner, F. Change of structural condition of welded joints between high-strength fine-grained and structural steels. J. Civ. Eng. Manag. 2004, 2, 87–95. [Google Scholar] [CrossRef]
- Mikia, C.; Homma, K.; Tominaga, K. High strength and high performance steels and their use in bridge structures. J. Constr. Steel Res. 2002, 58, 3–20. [Google Scholar] [CrossRef]
- Saeglitz, M.; Krauss, G. Deformation, fracture, and mechanical properties of low temperature-tempered martensite in SAE 43xx steels. Metall. Mater. Trans. A 2017, 28, 377–387. [Google Scholar] [CrossRef]
- Graville, B.A. Cold Cracking in Welds in HSLA Steels, Welding of HSLA (Microalloyed) Structural Steels. In Proceedings of the AIM/ASM Conference, Rome, Italy, 9–12 November 1976; American Society of Metals: Novelty, OH, USA, 1976. [Google Scholar]
- Ramirez, J.E. Characterization of high-Strength Steel Weld Metals: Chemical Composition, Microstructure, and Nonmetalic Inclusions. Weld. J. 2008, 87, 65–75. [Google Scholar]
- Ollilainen, V.; Hurmola, H.; Pontinen, H. Mechanical properties and machinability of a high-strength, medium-carbon, microalloyed steel. J. Mater. Energy Syst. 1984, 5, 222–232. [Google Scholar] [CrossRef]
- Kasuya, T.; Hashiba, Y. Carbon Equivalent to Asses Hardenability of Steel and Prediction of HAZ Hardness Distribution; Nippon Steel Report, No. 95; Nippon Steel Corporation: Oita, Japan, 2007. [Google Scholar]
- Adamczyk, J. Manufacturing of mass-scale products from structural microalloyed steels in integrated production lines. J. Achiev. Mater. Manuf. Eng. 2007, 20, 16–21. [Google Scholar]
- Skowronska, B.; Szulc, J.; Bober, M.; Chmielewski, T. Selected properties of RAMOR 500 steel welded joints by hybrid PTA-MAG. J. Adv. Join. Process. 2022, 5, 100111. [Google Scholar] [CrossRef]
- Tomków, J.; Landowski, M.; Fydrych, D.; Rogalski, G. Underwater wet welding of S1300 ultra-high strength steel. Mar. Struct. 2022, 81, 103120. [Google Scholar] [CrossRef]
- Grajcar, A.; Różański, M.; Stano, S.; Kowalski, A. Microstructure characterization of laser-welded Nb-microalloyed silicon-aluminum TRIP steel. J. Mater. Eng. Perform. 2014, 23, 3400–3406. [Google Scholar] [CrossRef]
- Żuk, M.; Górka, J.; Czupryński, A.; Adamiak, M. Properties and structure of the weld joints of quench and tempered 4330V steel. Metalurgija 2016, 55, 613–616. [Google Scholar]
- Fydrych, D.; Labanowski, J.; Rogalski, G. Weldability of high strength steels in wet welding conditions. Pol. Marit. Res. 2013, 20, 67–73. [Google Scholar] [CrossRef]
- Charleux, M.; Poole, W.; Militzer, M. Precipitation behavior and its effect on strengthening of an HSLA-Nb/Ti steel. Metall. Mater. Trans. A 2001, 32, 1635–1647. [Google Scholar] [CrossRef]
- Górka, J. Analysis of simulated welding thermal cycles S700MC using a thermal imaging camera. Adv. Mater. Res. 2014, 1036, 111–116. [Google Scholar] [CrossRef]
- Maeda, K.; Suzuki, R.; Suga, T.; Kawahito, Y. Investigating delayed cracking behaviour in laser welds of high strength steel sheets using an X-ray transmission in-situ observation system. Sci. Technol. Weld. Joi. 2020, 25, 377–382. [Google Scholar] [CrossRef]
- Pan, Q.; Mizutani, M.; Kawahito, Y.; Katayama, S. High power disk laser-metal active gas arc hybrid welding of thick high tensile strength steel plates. J. Laser Appl. 2016, 28, 012004. [Google Scholar] [CrossRef]
- Mician, M.; Harmaniak, D.; Novy, F.; Winczek, J.; Moravec, J.; Trško, L. Effect of the t8/5 Cooling Time on the Properties of S960MC Steel in the HAZ of Welded Joints Evaluated by Thermal Physical Simulation. Metals 2020, 10, 229. [Google Scholar] [CrossRef]
- ISO 17637:2016; Non-Destructive Testing of Welds—Visual Testing of Fusion-Welded Joints. ISO: Geneva, Switzerland, 2016.
- ISO 3452-1:2021; Non-Destructive Testing—Penetrant Testing. Part 1: General Principles. ISO: Geneva, Switzerland, 2021.
- ISO 17636-1:2022; Non-Destructive Testing of Welds—Radiographic Testing. Part 1: X- and Gamma-Ray Techniques with Film. ISO: Geneva, Switzerland, 2022.
- ISO 4136:2022; Destructive Tests on Welds in Metallic Materials—Transverse Tensile Test. ISO: Geneva, Switzerland, 2022.
- ISO 5173:2023; Destructive Tests on Welds in Metallic Materials—Bend Tests. ISO: Geneva, Switzerland, 2023.
- ISO 9016:2022; Destructive Tests on Welds in Metallic Materials—Impact Tests—Test Specimen Location, Notch Orientation and Examination. ISO: Geneva, Switzerland, 2022.
- ISO 9015-1:2001; Destructive Tests on Welds in Metallic Materials—Hardness Testing. Part 1: Hardness Test on Arc Welded Joints. ISO: Geneva, Switzerland, 2001.
- ISO 17639:2022; Destructive Tests on Welds in Metallic Materials—Macroscopic and Microscopic Examination of Welds. ISO: Geneva, Switzerland, 2022.
- ISO 5817:2023; Welding—Fusion-Welded Joints in Steel, Nickel, Titanium and Their Alloys (Beam Welding Excluded)—Quality Levels for Imperfections. ISO: Geneva, Switzerland, 2023.


| Plate | Element Concentration, wt % | |||||||||||||
|---|---|---|---|---|---|---|---|---|---|---|---|---|---|---|
| C | Mn | Si | P | S | Cr | Mo | Ni | V | Cu | Al | Ti | Nb | Zr | |
| S690QL | 0.143 | 1.262 | 0.285 | 0.01 | 0.0006 | 0.259 | 0.302 | 0.823 | 0.004 | 0.087 | 0.028 | 0.001 | 0.023 | 0.001 |
| Wire | Element Concentration, wt % | |||||||||||
|---|---|---|---|---|---|---|---|---|---|---|---|---|
| C | Mn | Si | P | S | Cr | Ni | V | Cu | Al | Mo | Ti + Zr | |
| IMT | 0.082 | 1.60 | 0.56 | 0.01 | 0.006 | 0.347 | 1.43 | 0.09 | 0.02 | 0.002 | 0.27 | 0.002 |
| Sample Designation | Bead No | Inter-Pass Temperature [°C] | Average Welding Current [A] | Average Arc Voltage [V] | Welding Time [min] | Linear Energy [kJ/mm] |
|---|---|---|---|---|---|---|
| S690QL As welded | 1 | 28.3 | 194 | 24.3 | 2:46 | 1.05 |
| 2 | 82.5 | 200 | 27.8 | 1:36 | 0.71 | |
| 3 | 104.5 | 247 | 26.5 | 2:31 | 1.32 | |
| S690QL + HMFI | 1 | 34.0 | 192 | 24.2 | 2:44 | 1.02 |
| 2 | 60.6 | 202 | 27.4 | 1:37 | 0.72 | |
| 3 | 108.5 | 250 | 26.4 | 2:29 | 1.31 | |
| S690QL + PWHT | 1 | 36.0 | 195 | 24.3 | 2:44 | 1.04 |
| 2 | 92.4 | 199 | 27.3 | 1:38 | 0.71 | |
| 3 | 119.7 | 249 | 26.5 | 2:33 | 1.35 |
| Test Type | Acceptance Criteria [12] |
|---|---|
| Tensile test | Rm value should not be less than the corresponding required minimum value for the base material—Rm minimum 770 MPa |
| Bend test | During the test, there should be no inconsistencies in the specimens above 3 mm in any direction—bending former radius 60 mm |
| Impact test | Impact value shall be in accordance with the relevant standard of the base material—KV2 minimum 40 J at −20 °C |
| Hardness test | For non-heat-treated specimens—HV10 max. 450 For heat-treated (PWHT) specimens—HV10 max. 380 |
| Macroscopic examination | No nonconformities in quality levels lower than those described in Table 4 of EN ISO 15614-1:2017-08 [20] |
| Type of Test | Designation | Result | Designation | Result | |||||||||||||
|---|---|---|---|---|---|---|---|---|---|---|---|---|---|---|---|---|---|
| Tensile test | TT-1 | 793 MPa | TT-2 | 791 MPa | |||||||||||||
| Face bend test | TFBB1 | positive | TFBB2 | positive | |||||||||||||
| Root bend test | TRBB1 | positive | TRBB2 | positive | |||||||||||||
| Impact test | VWT 0/2 | 122.6 J | VHT 0/2 | 73.6 J | |||||||||||||
| VWT 0/2 | 130.8 J | VHT 0/2 | 85.0 J | ||||||||||||||
| VWT 0/2 | 135.7 J | VHT 0/2 | 62.1 J | ||||||||||||||
| Hardness test | Ma-1 HV10 | L1 | 263 | 268 | 264 | 195 | 197 | 234 | 272 | 271 | 268 | 207 | 188 | 234 | 250 | 261 | 266 |
| L2 | 264 | 261 | 258 | 201 | 193 | 225 | 266 | 265 | 256 | 216 | 186 | 199 | 251 | 261 | 258 | ||
| Macroscopic examination | Ma-1 |  | |||||||||||||||
| Type of Test | Designation | Result | Designation | Result | |||||||||||||
|---|---|---|---|---|---|---|---|---|---|---|---|---|---|---|---|---|---|
| Tensile test | TT-1 | 782 MPa | TT-2 | 780 MPa | |||||||||||||
| Face bend test | TFBB1 | positive | TFBB2 | positive | |||||||||||||
| Root bend test | TRBB1 | positive | TRBB2 | positive | |||||||||||||
| Impact test | VWT 0/2 | 85.0 J | VHT 0/2 | 71.9 J | |||||||||||||
| VWT 0/2 | 114.5 J | VHT 0/2 | 65.4 J | ||||||||||||||
| VWT 0/2 | 94.8 J | VHT 0/2 | 67.0 J | ||||||||||||||
| Hardness test | Ma-1 HV10 | L1 | 275 | 267 | 267 | 268 | 248 | 311 | 293 | 298 | 313 | 310 | 300 | 267 | 267 | 271 | 278 |
| L2 | 284 | 285 | 263 | 236 | 262 | 250 | 298 | 287 | 296 | 272 | 261 | 262 | 274 | 278 | 277 | ||
| Macroscopic examination | Ma-1 | 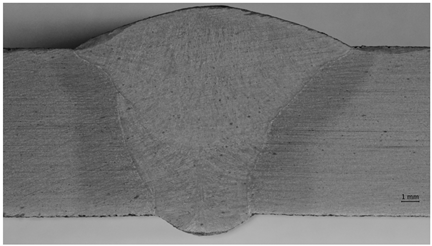 | |||||||||||||||
| Type of Test | Designation | Result | Designation | Result | |||||||||||||
|---|---|---|---|---|---|---|---|---|---|---|---|---|---|---|---|---|---|
| Tensile test | TT-1 | 714 MPa (negative) | TT-2 | 714 MPa (negative) | |||||||||||||
| Face bend test | TFBB1 | positive | TFBB2 | positive | |||||||||||||
| Root bend test | TRBB1 | positive | TRBB2 | positive | |||||||||||||
| Impact test | VWT 0/2 | 101.4 J | VHT 0/2 | 225.6 J | |||||||||||||
| VWT 0/2 | 114.5 J | VHT 0/2 | 228.9 J | ||||||||||||||
| VWT 0/2 | 85.0 J | VHT 0/2 | 201.1 J | ||||||||||||||
| Hardness test | Ma-1 HV10 | L1 | 264 | 268 | 264 | 195 | 197 | 234 | 272 | 271 | 268 | 207 | 188 | 238 | 250 | 261 | 266 |
| L2 | 264 | 261 | 258 | 201 | 193 | 225 | 266 | 265 | 256 | 216 | 186 | 199 | 251 | 261 | 258 | ||
| Macroscopic examination | Ma-1 | 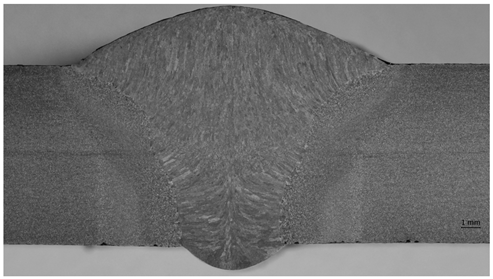 | |||||||||||||||
| As-Welded S690QL | 0 mm | 12 mm | 15 mm | 20 mm | 30 mm | 40 mm | 50 mm |
|---|---|---|---|---|---|---|---|
| 1 | 1967 | 3906 | 2456 | 1769 | 1861 | 1784 | 1810 |
| 2 | 1268 | 4852 | 3340 | 2033 | 1946 | 1774 | 1799 |
| 3 | 1388 | 4010 | 3549 | 2327 | 2008 | 1910 | 1859 |
| 4 | 1406 | 4988 | 4335 | 2095 | 2112 | 1896 | 1750 |
| 5 | 1362 | 4741 | 3951 | 2089 | 2229 | 1896 | 1810 |
| 6 | 1350 | 4207 | 3987 | 2167 | 2293 | 1926 | 1902 |
| 7 | 1464 | 3094 | 3602 | 2356 | 2007 | 1829 | 1742 |
| HFMI-Treated S690QL | 0 mm | 12 mm | 15 mm | 20 mm | 30 mm | 40 mm | 50 mm |
| 1 | 1497 | 4876 | 1840 | 1864 | 1774 | 1742 | 1906 |
| 2 | 1561 | 5674 | 2057 | 1796 | 1778 | 1756 | 1895 |
| 3 | 1568 | 5136 | 1939 | 1575 | 1823 | 1831 | 1731 |
| 4 | 1511 | 5031 | 2601 | 1956 | 1692 | 1878 | 1773 |
| 5 | 1372 | 5003 | 2607 | 1918 | 1714 | 1707 | 1774 |
| 6 | 1402 | 5010 | 2083 | 1948 | 1960 | 1795 | 1796 |
| 7 | 1447 | 4663 | 2172 | 1939 | 1912 | 1704 | 1697 |
| S690QL + PWHT | 0 mm | 12 mm | 15 mm | 20 mm | 30 mm | 40 mm | 50 mm |
| 1 | 1517 | 2276 | 1510 | 1457 | 1632 | 1536 | 1560 |
| 2 | 1276 | 2594 | 1552 | 1558 | 1544 | 1507 | 1499 |
| 3 | 1396 | 2619 | 1478 | 1480 | 1550 | 1452 | 1639 |
| 4 | 1457 | 2602 | 1503 | 1369 | 1563 | 1498 | 1499 |
| 5 | 1466 | 2619 | 1667 | 1536 | 1522 | 1458 | 1548 |
| 6 | 1318 | 2465 | 1605 | 1636 | 1578 | 1519 | 1464 |
| 7 | 1516 | 2240 | 1638 | 1650 | 1646 | 1539 | 1556 |
| As-Welded S690QL | 0 mm | 12 mm | 15 mm | 20 mm | 30 mm | 40 mm | 50 mm |
|---|---|---|---|---|---|---|---|
| 1 | −82 | 16 | −39 | −112 | −97 | −109 | −105 |
| 2 | −261 | 56 | −3 | −74 | −85 | −111 | −107 |
| 3 | −211 | 19 | 4 | −48 | −77 | −90 | −97 |
| 4 | −205 | 64 | 31 | −68 | −66 | −92 | −115 |
| 5 | −221 | 50 | 17 | −68 | −55 | −92 | −105 |
| 6 | −226 | 26 | 19 | −61 | −50 | −88 | −91 |
| 7 | −185 | −11 | 6 | −46 | −77 | −102 | −117 |
| HFMI-Treated S690QL | 0 mm | 12 mm | 15 mm | 20 mm | 30 mm | 40 mm | 50 mm |
| 1 | −175 | 57 | −100 | −96 | −111 | −117 | −90 |
| 2 | −157 | 124 | −72 | −107 | −110 | −114 | −92 |
| 3 | −155 | 74 | −86 | −154 | −103 | −102 | −119 |
| 4 | −171 | 67 | −31 | −84 | −127 | −94 | −111 |
| 5 | −217 | 65 | −31 | −89 | −122 | −124 | −111 |
| 6 | −206 | 65 | −69 | −85 | −83 | −107 | −107 |
| 7 | −191 | 46 | −60 | −86 | −89 | −124 | −126 |
| S690QL + PWHT | 0 mm | 12 mm | 15 mm | 20 mm | 30 mm | 40 mm | 50 mm |
| 1 | −169 | −52 | −171 | −188 | −140 | −164 | −158 |
| 2 | −257 | −32 | −160 | −158 | −162 | −172 | −175 |
| 3 | −208 | −30 | −181 | −180 | −160 | −189 | −138 |
| 4 | −188 | −31 | −173 | −218 | −157 | −175 | −175 |
| 5 | −185 | −30 | −132 | −164 | −168 | −187 | −161 |
| 6 | −239 | −39 | −146 | −139 | −153 | −169 | −185 |
| 7 | −170 | −55 | −138 | −136 | −137 | −163 | −159 |
| X [mm] | As-Welded S690QL | Δσ | 690QL + HFMI | Δσ | 690QL + PWHT | Δσ |
|---|---|---|---|---|---|---|
| 0 | −199 | 52 | −182 | 22 | −202 | 32 |
| 12 | 31 | 24 | 71 | 23 | −38 | 10 |
| 15 | 5 | 21 | −64 | 24 | −157 | 17 |
| 20 | −68 | 20 | −100 | 23 | −169 | 27 |
| 30 | −73 | −107 | −107 | 15 | −154 | 11 |
| 40 | −98 | 9 | −112 | 10 | −174 | 10 |
| 50 | −105 | 9 | −108 | 12 | −164 | 14 |
Disclaimer/Publisher’s Note: The statements, opinions and data contained in all publications are solely those of the individual author(s) and contributor(s) and not of MDPI and/or the editor(s). MDPI and/or the editor(s) disclaim responsibility for any injury to people or property resulting from any ideas, methods, instructions or products referred to in the content. |
© 2024 by the authors. Licensee MDPI, Basel, Switzerland. This article is an open access article distributed under the terms and conditions of the Creative Commons Attribution (CC BY) license (https://creativecommons.org/licenses/by/4.0/).
Share and Cite
Górka, J.; Przybyła, M. Research on the Influence of HMFI and PWHT Treatments on the Properties and Stress States of MAG-Welded S690QL Steel Joints. Materials 2024, 17, 3560. https://doi.org/10.3390/ma17143560
Górka J, Przybyła M. Research on the Influence of HMFI and PWHT Treatments on the Properties and Stress States of MAG-Welded S690QL Steel Joints. Materials. 2024; 17(14):3560. https://doi.org/10.3390/ma17143560
Chicago/Turabian StyleGórka, Jacek, and Mateusz Przybyła. 2024. "Research on the Influence of HMFI and PWHT Treatments on the Properties and Stress States of MAG-Welded S690QL Steel Joints" Materials 17, no. 14: 3560. https://doi.org/10.3390/ma17143560