
Mechanical Properties of Rock Salt from the Kłodawa Salt Dome—A Statistical Analysis of Geomechanical Data


Abstract
:1. Introduction
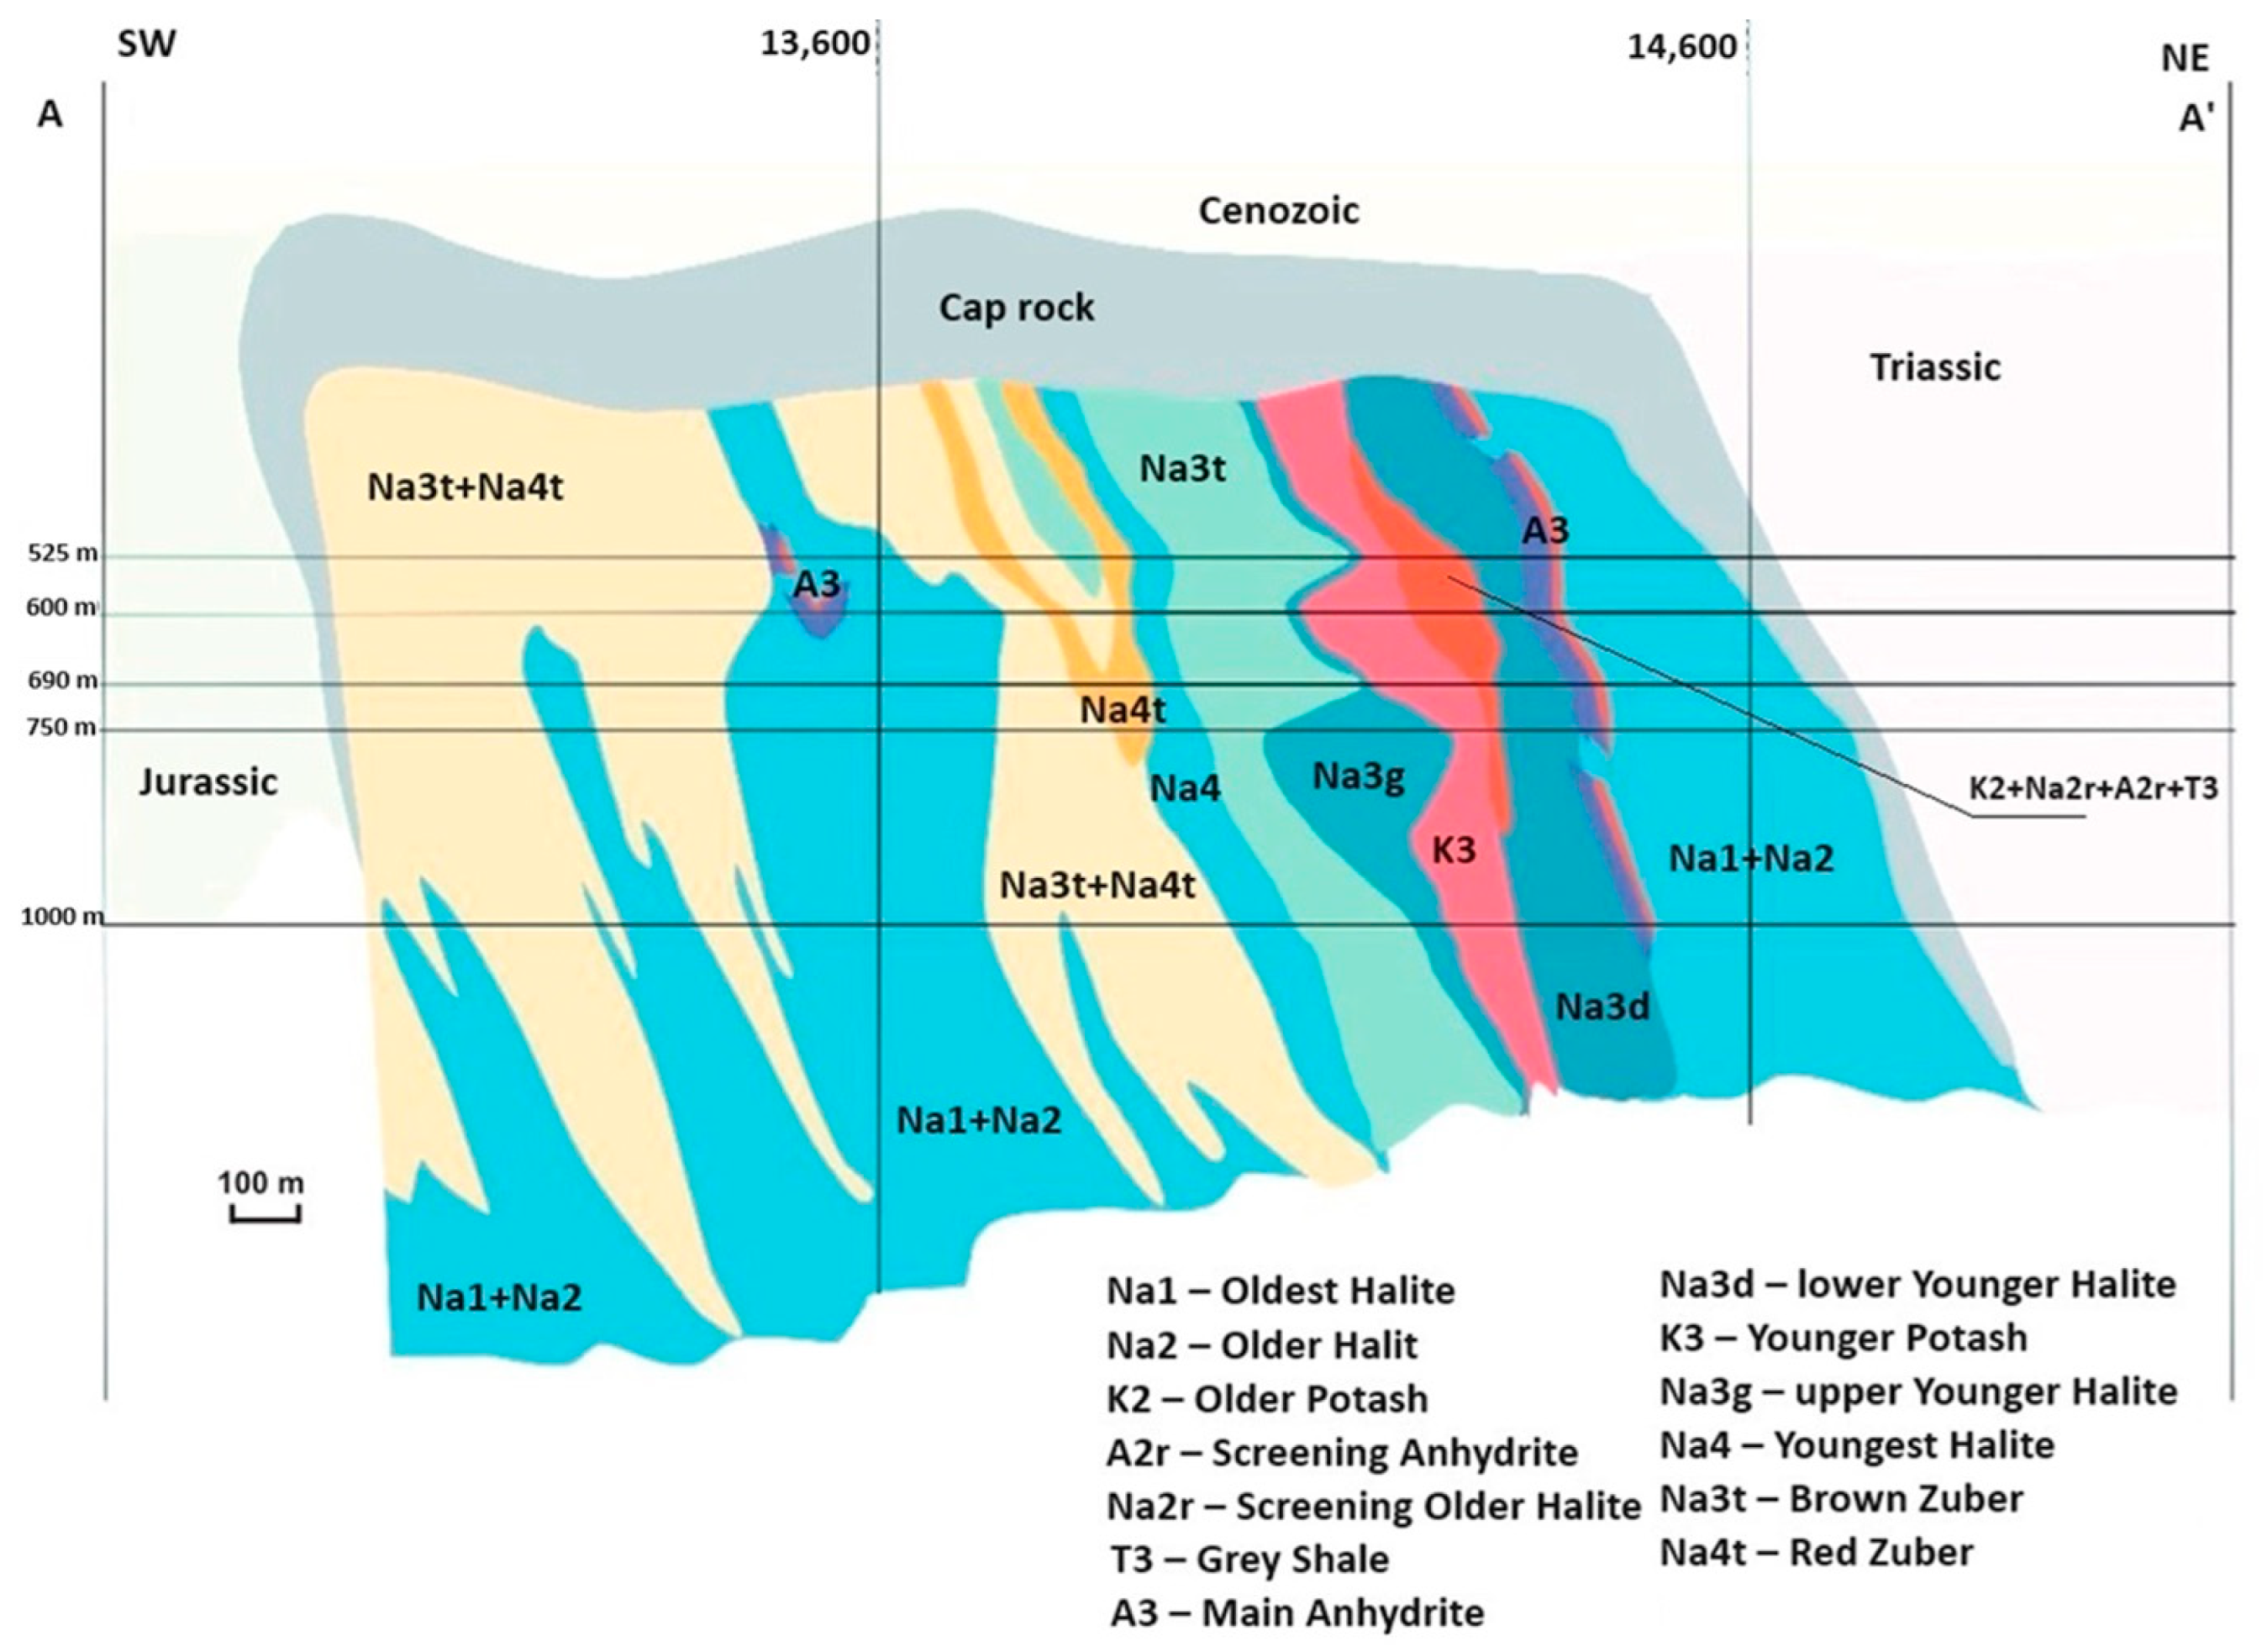
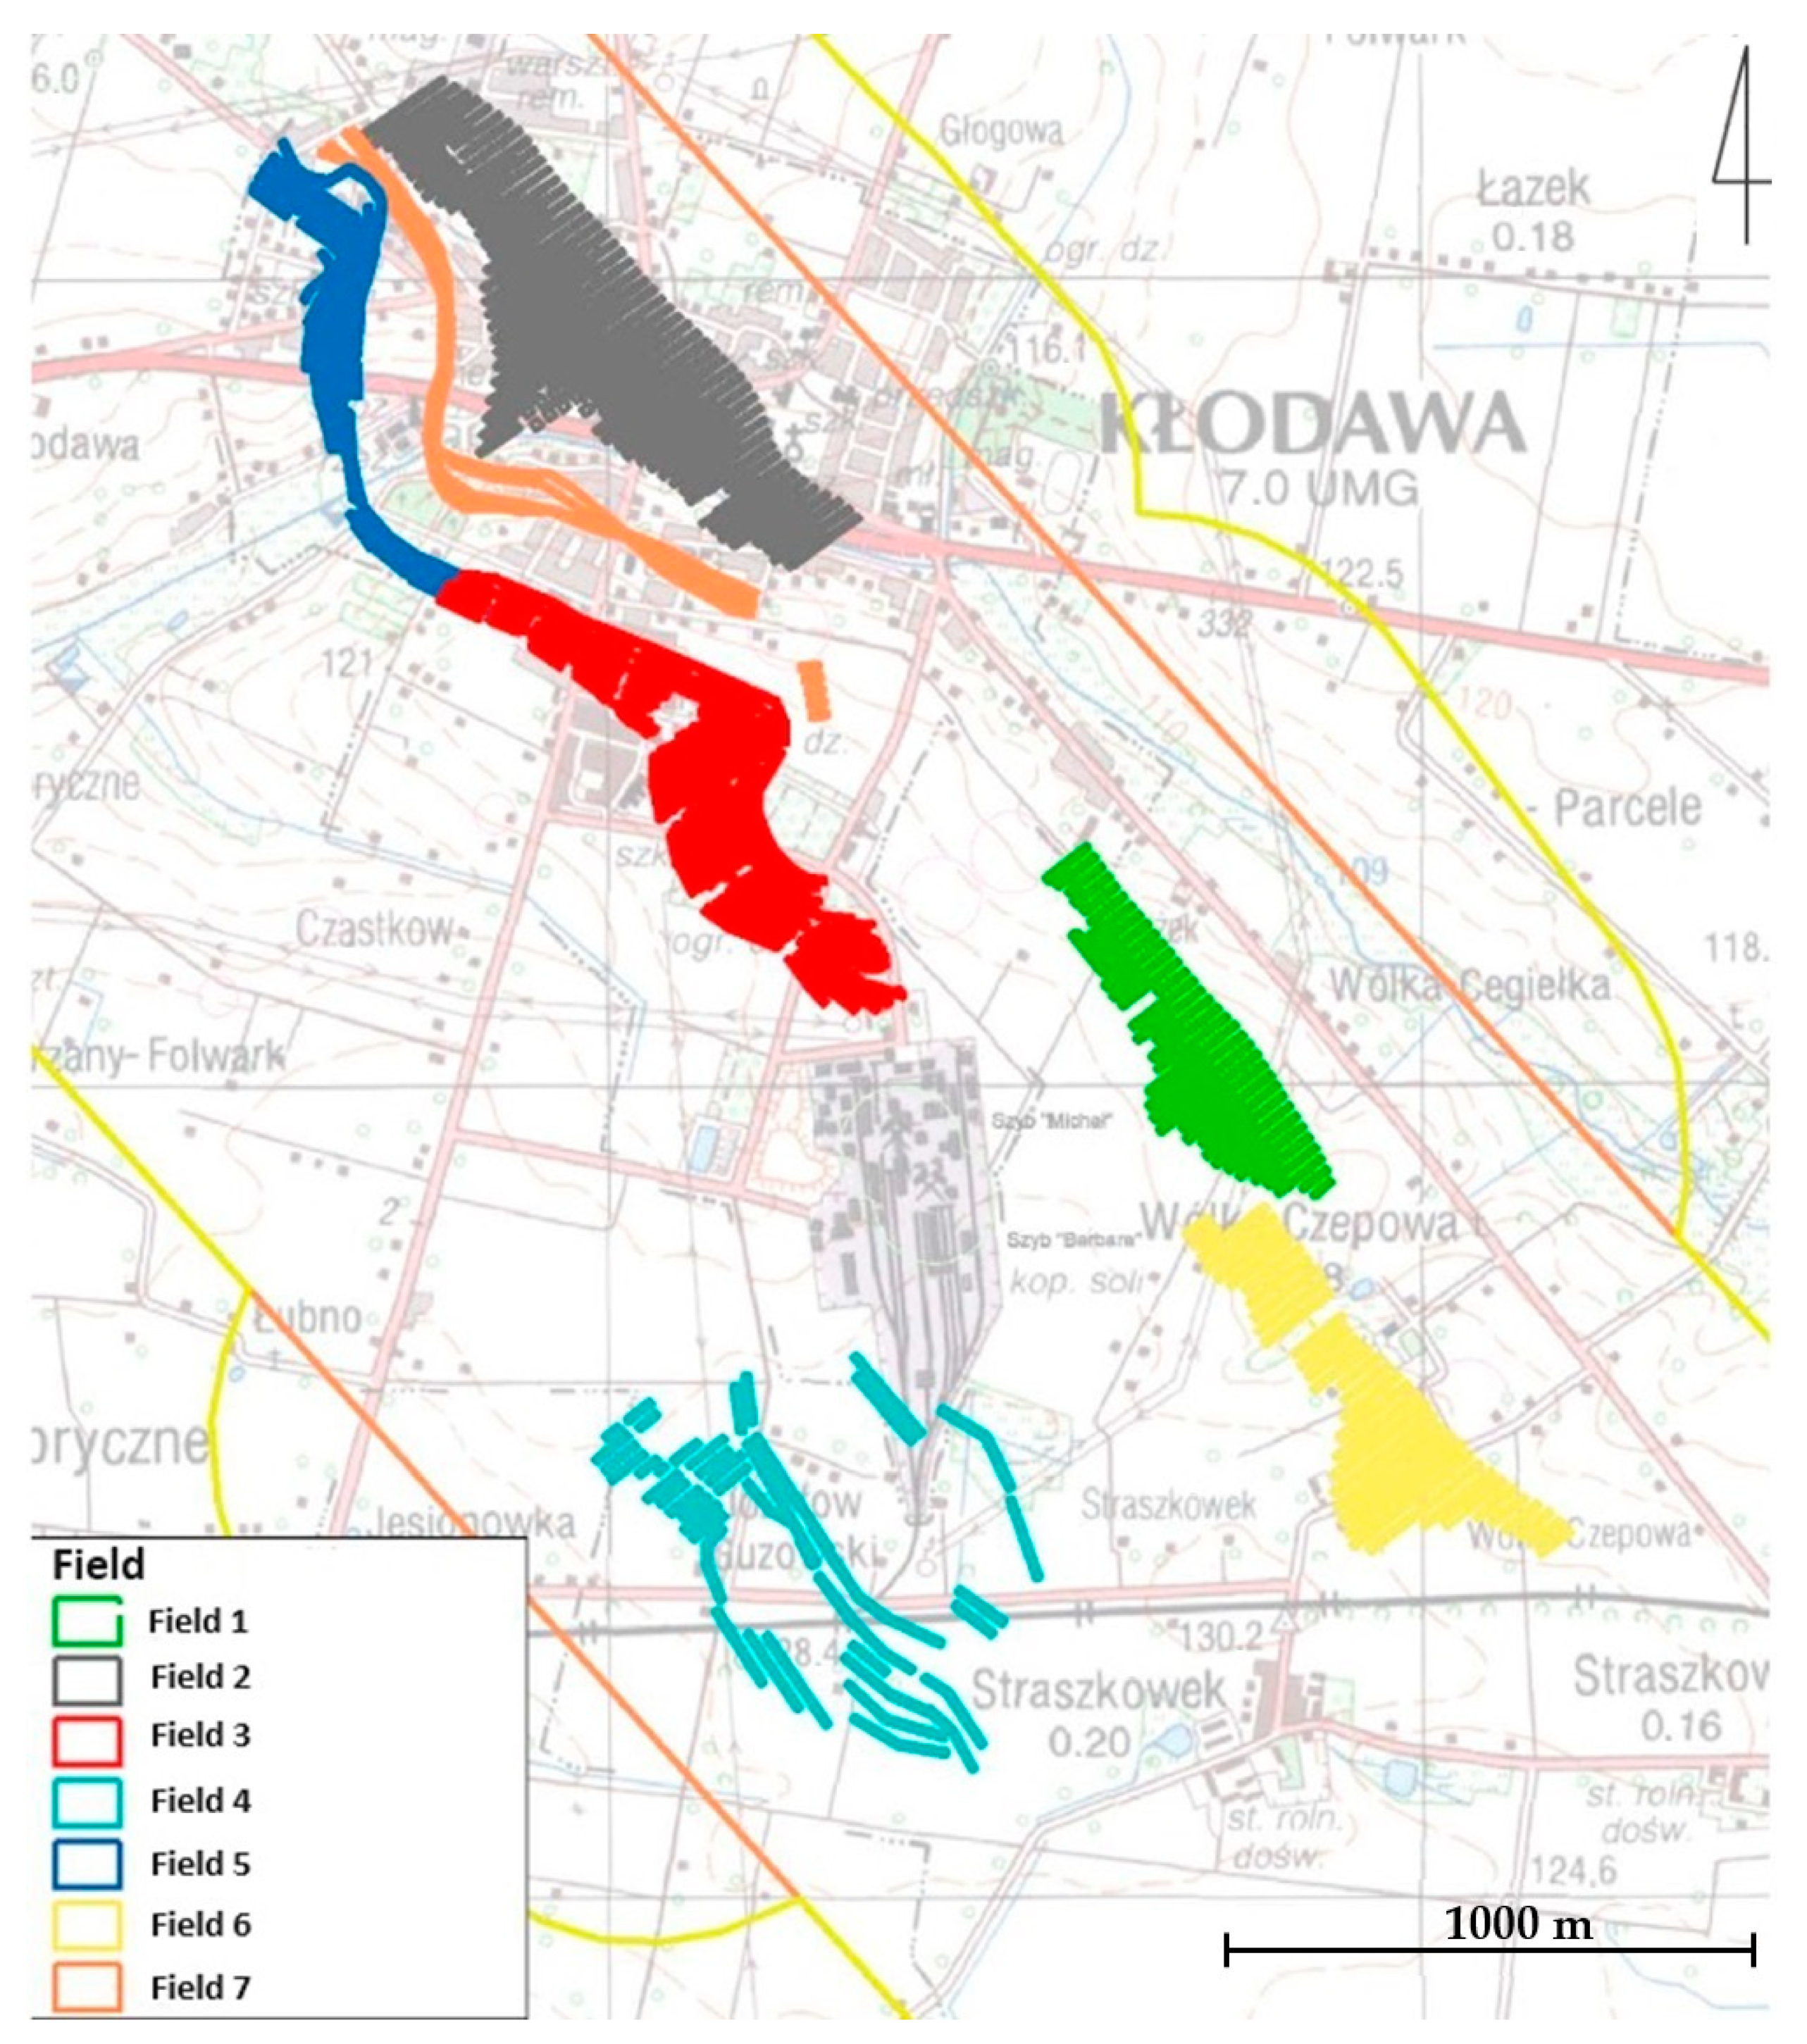
2. Geological Settings
- Field 1—mining on the five shallowest levels;
- Field 2—mining on levels corresponding to relative depths of 450–600 m below sea level (m b.s.l.);
- Field 3—mining between levels corresponding to relative depths of 450 and 750 m b.s.l.;
- Field 4—mining on levels corresponding to relative depths of 538, 572, and 600 m b.s.l.;
- Field 5—mining between levels corresponding to relative depths of 600 and 750 m b.s.l.;
- Field 6—exploration with galleries;
- Field 7—mining on levels corresponding to relative depths of 575 and 600 m b.s.l., consisting of potassium–magnesium salts.
3. Materials and Methods
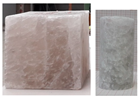
3.1. Test Materials
3.2. Test Methods
3.2.1. The Determination of Physical Properties
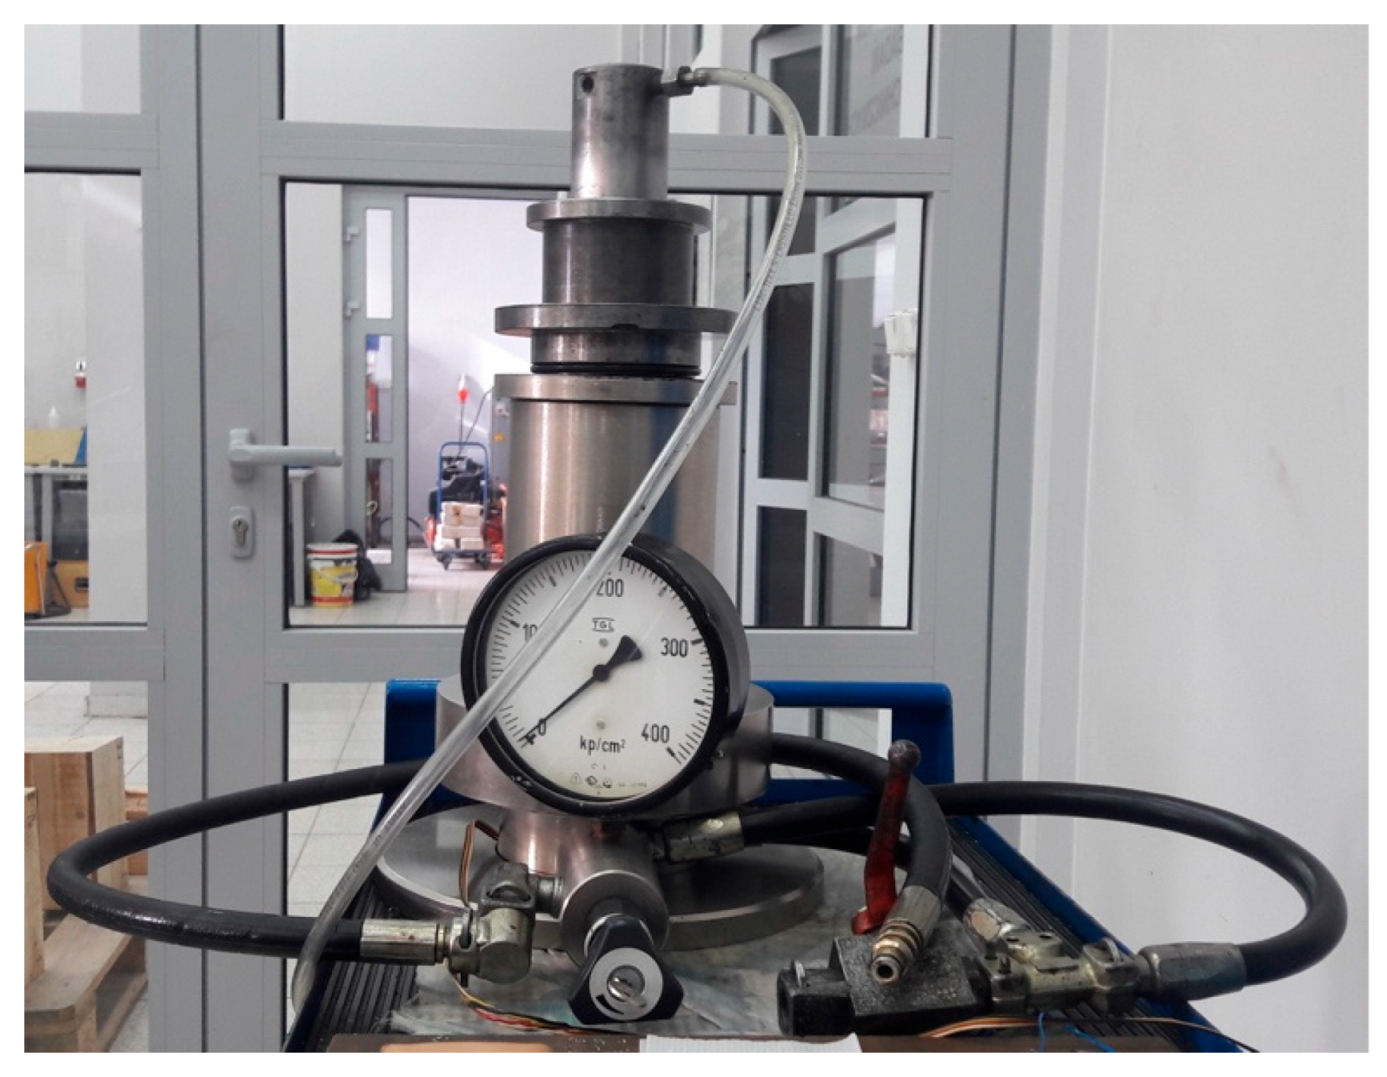
3.2.2. Uniaxial Compressive Strength Test
- Longitudinal strain coefficient (E) calculated from the average slopes of the more-or-less straight line portion of the axial stress–axial strain curve (~0.2 σc–~0.8 σc) (Average Modulus, ISRM [69]):
- Lateral strain coefficient (ν) within the linearity range of radial strains:
3.2.3. Tensile Strength Test
3.2.4. Triaxial Compressive Strength Test
4. Results and Discussion
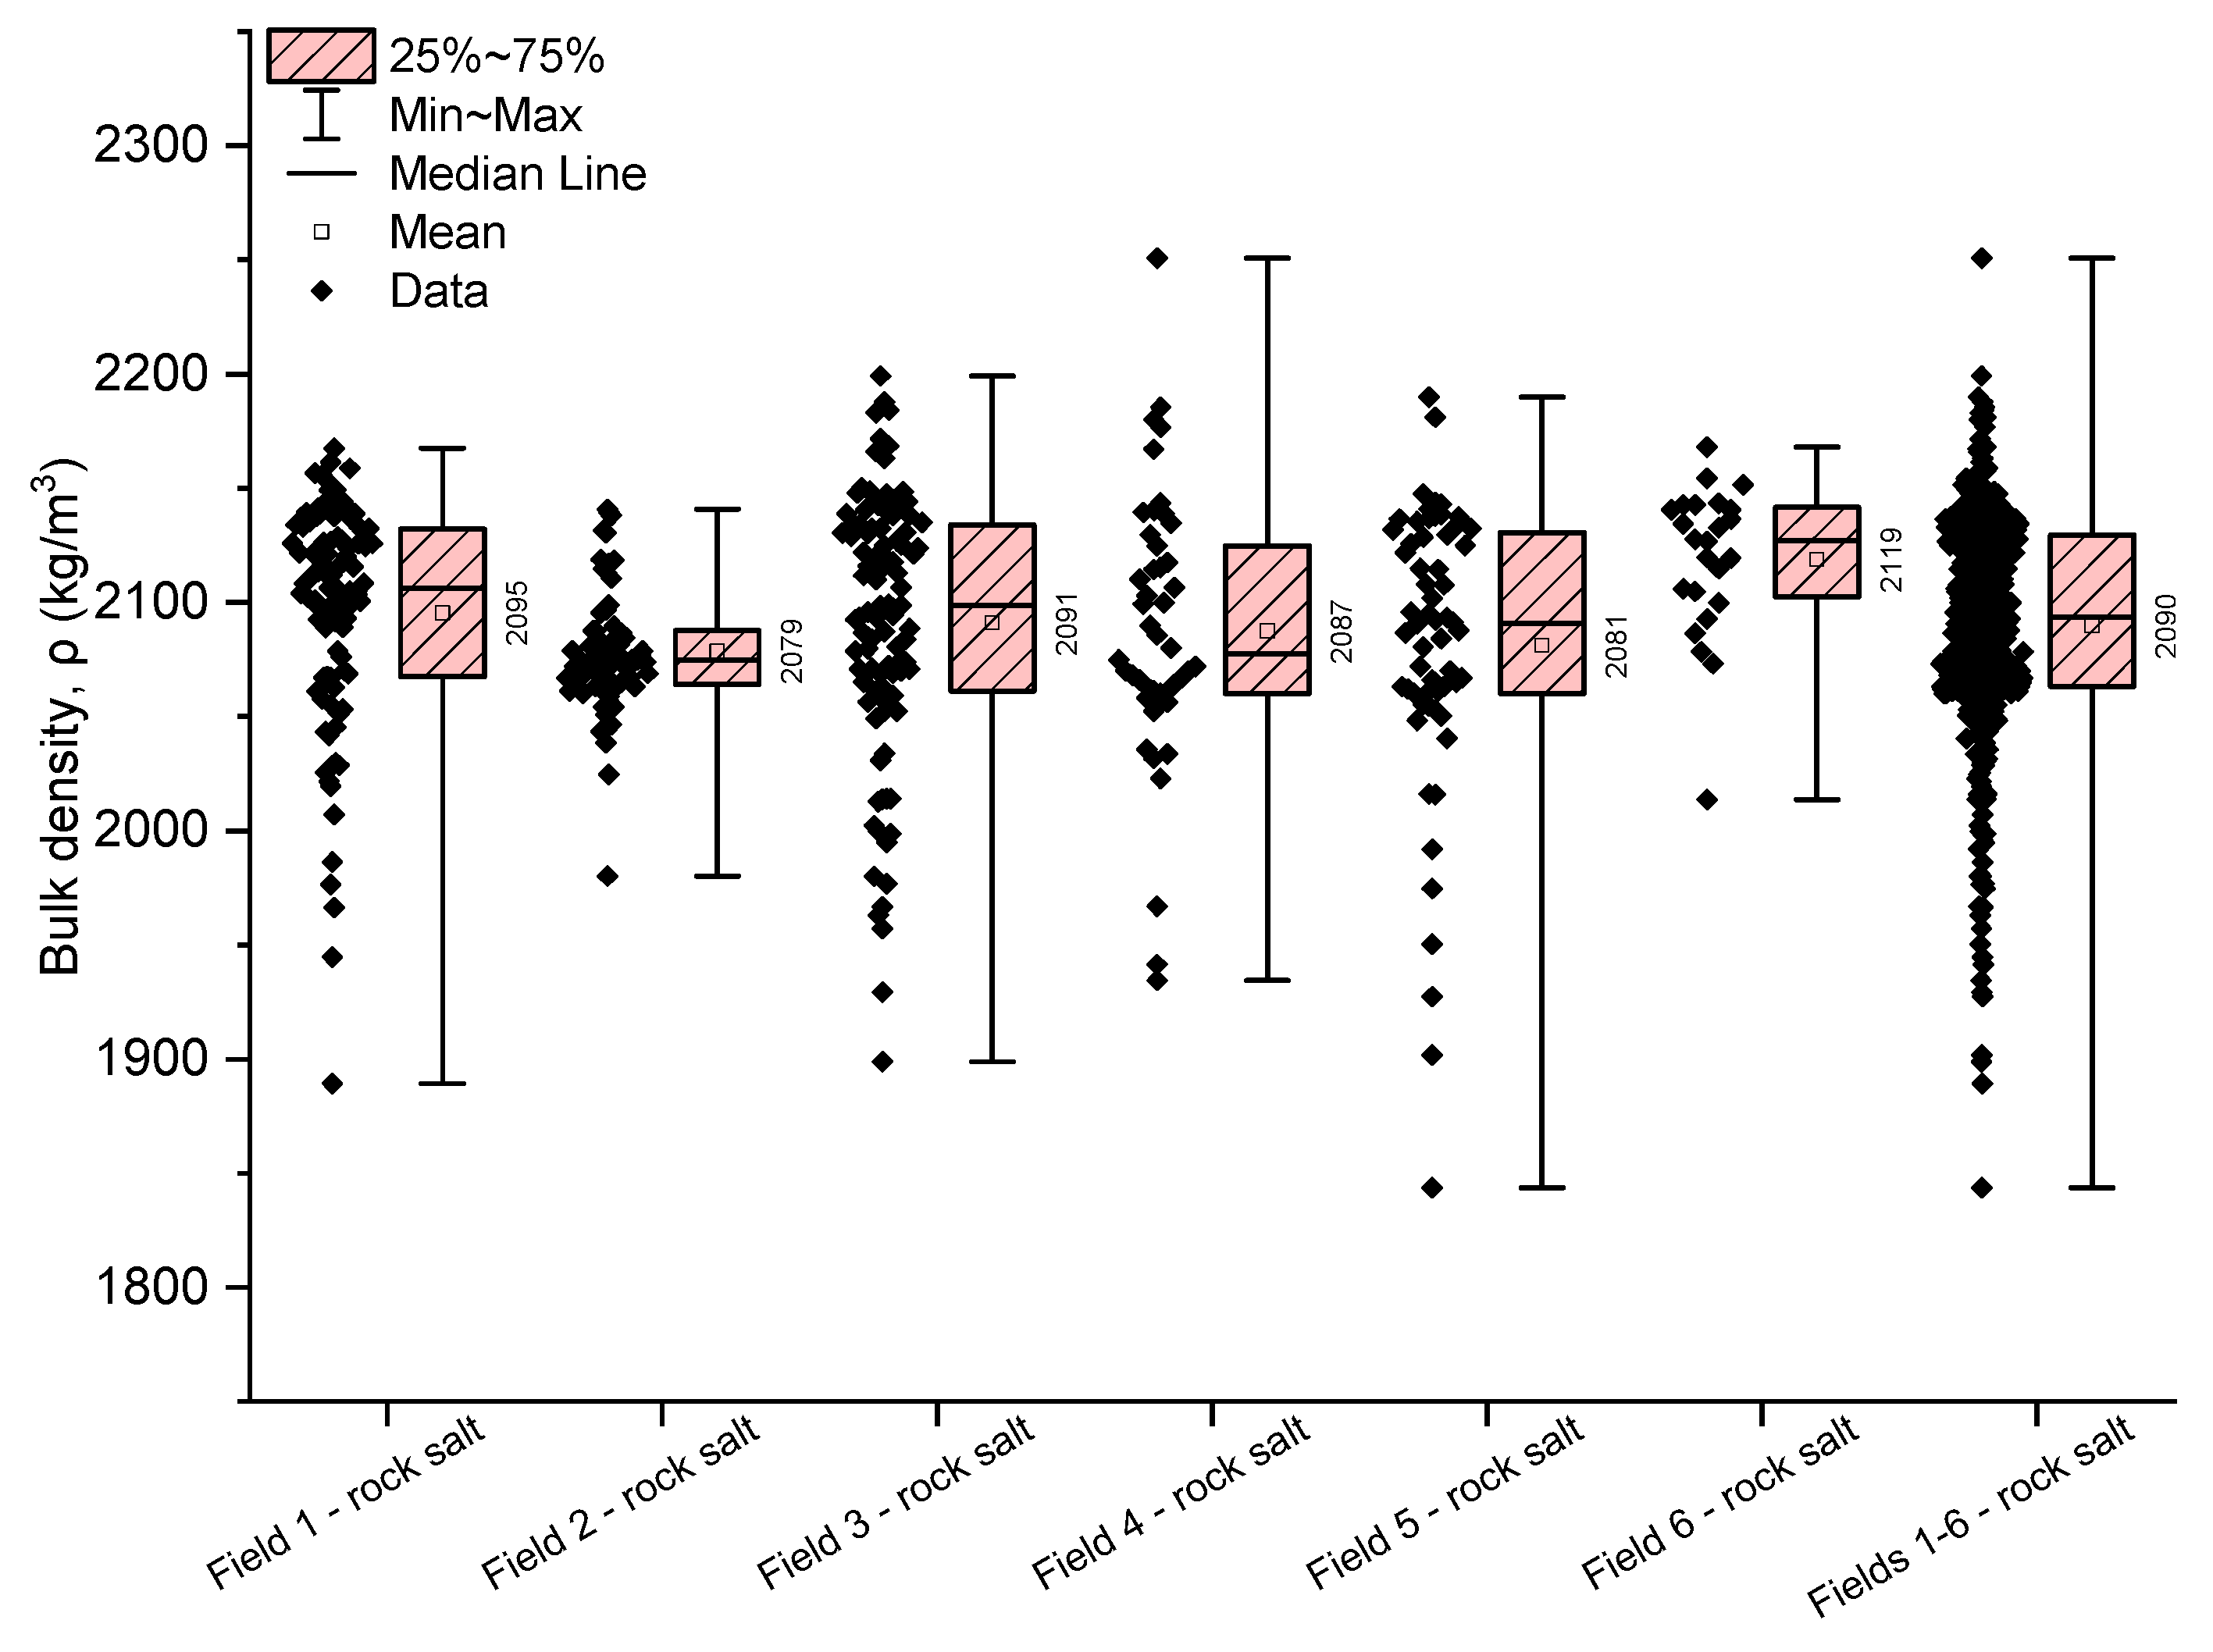
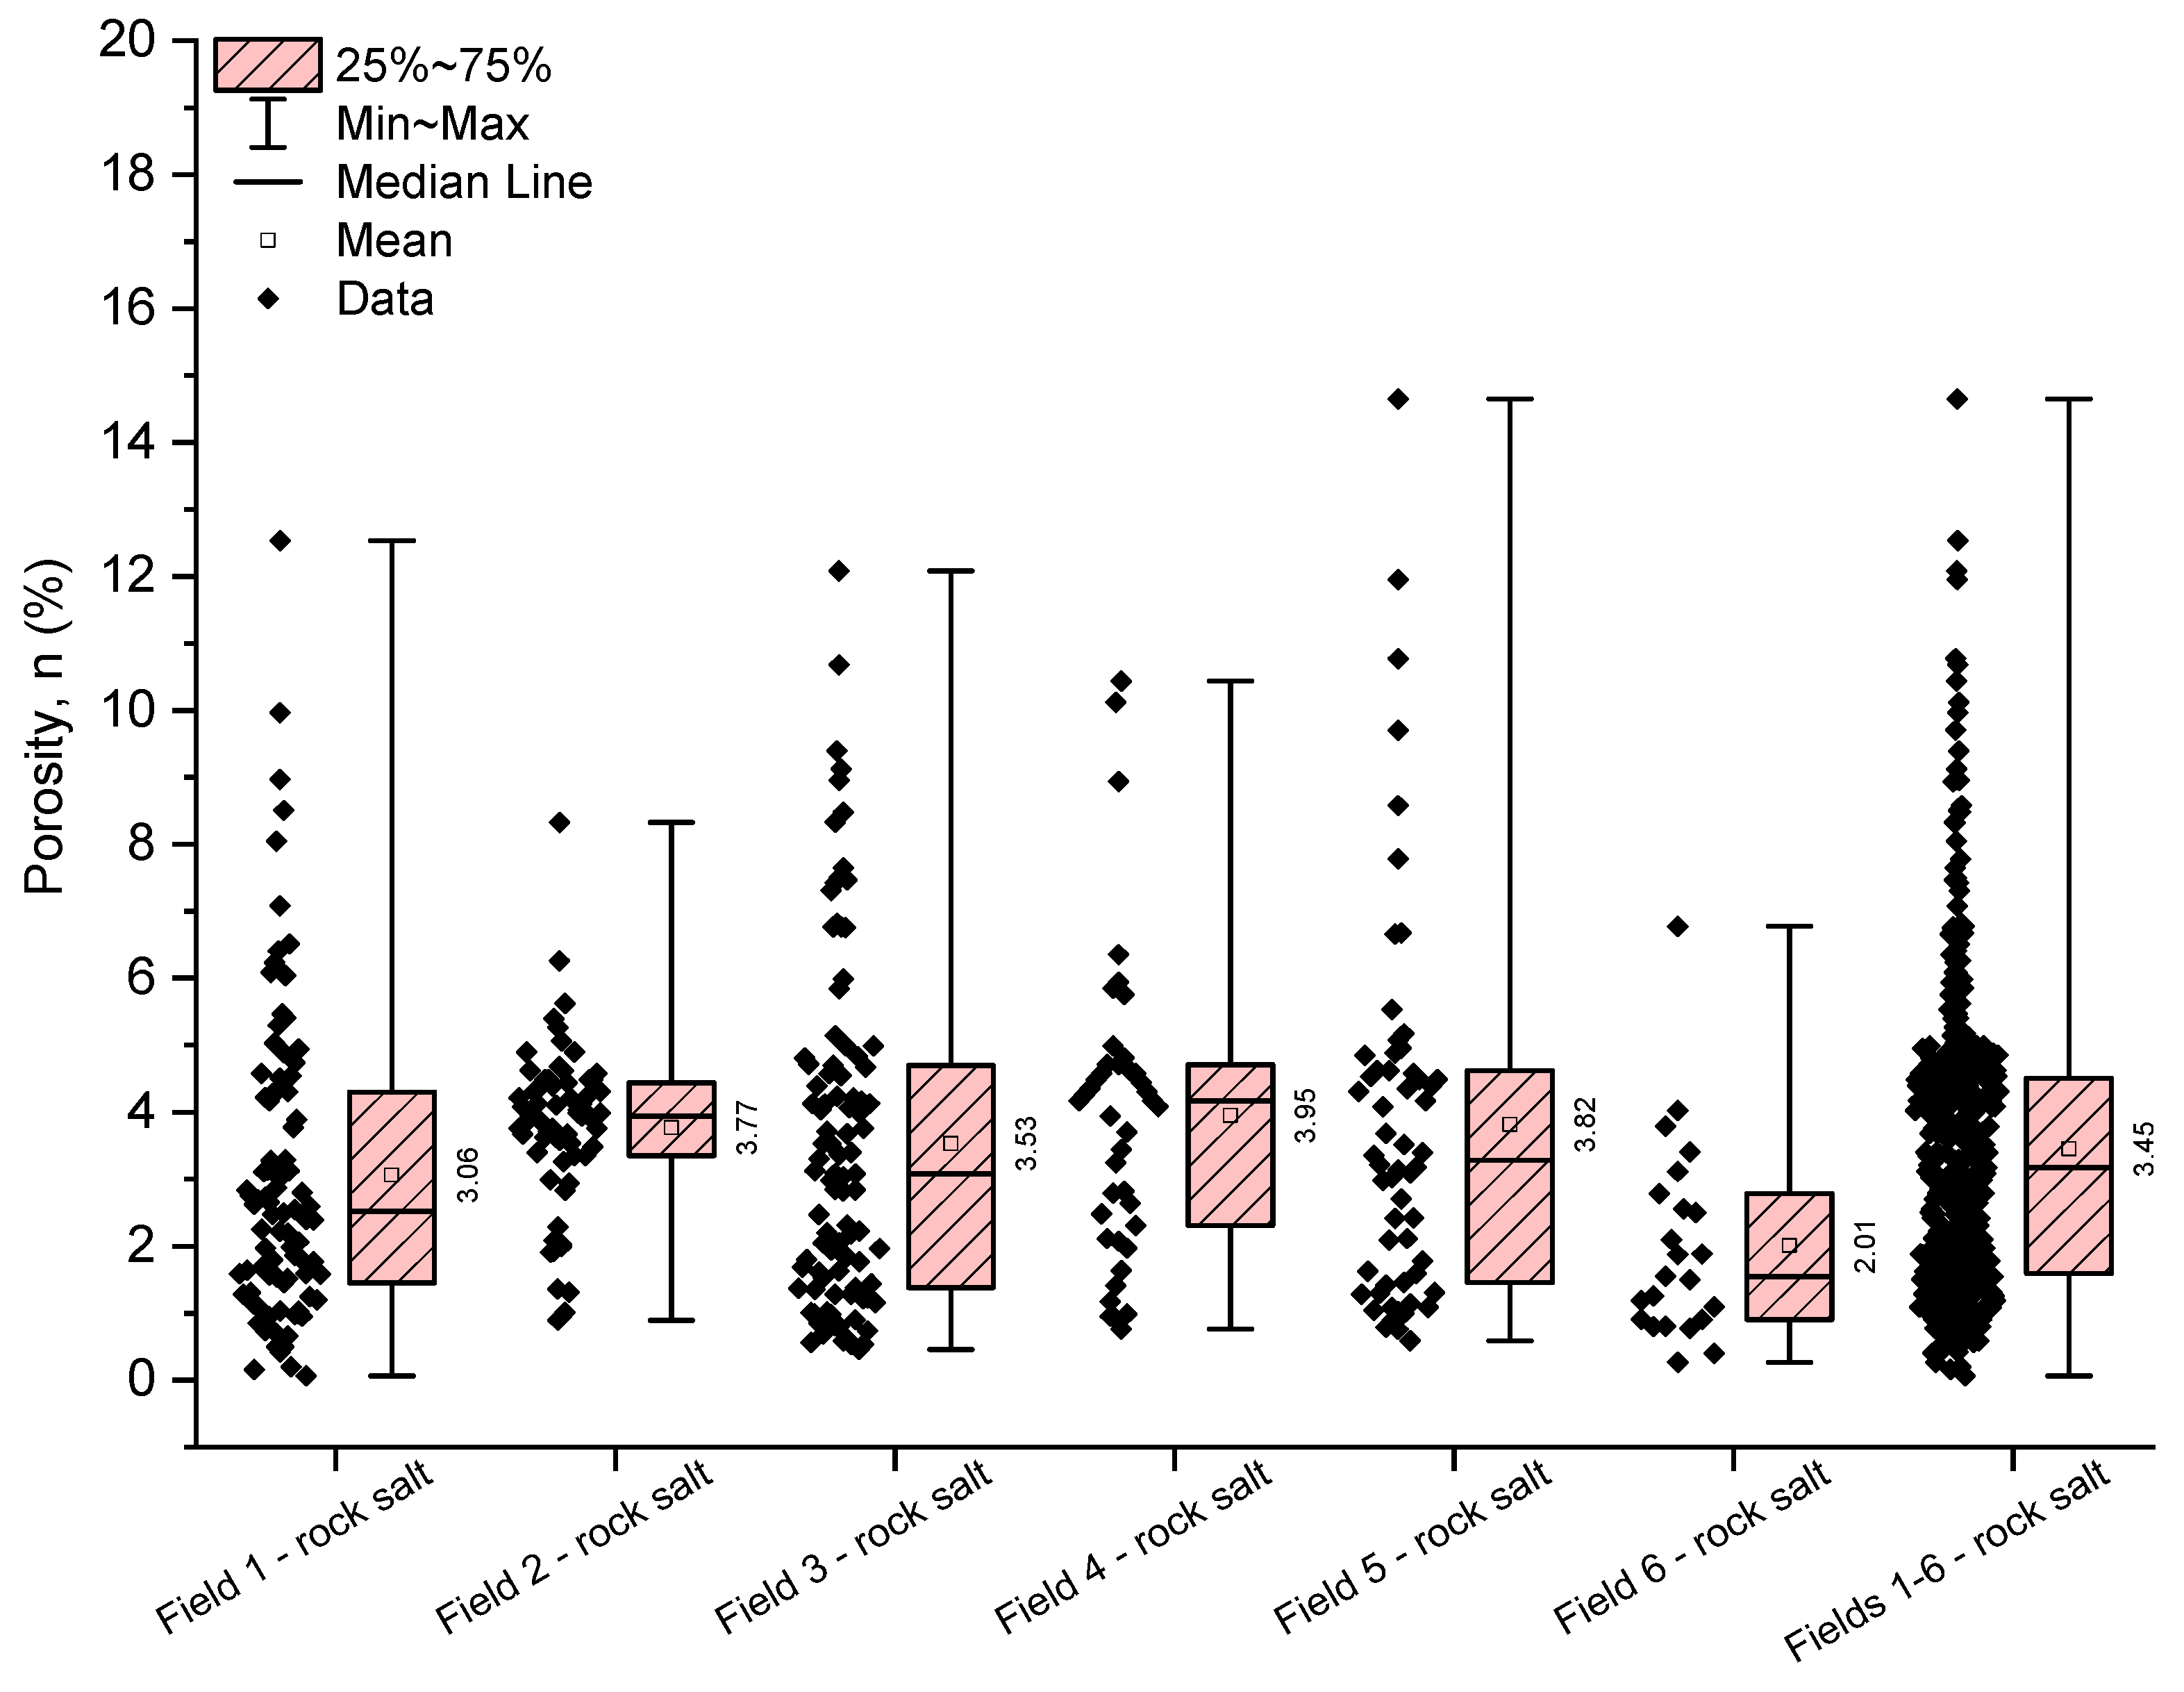
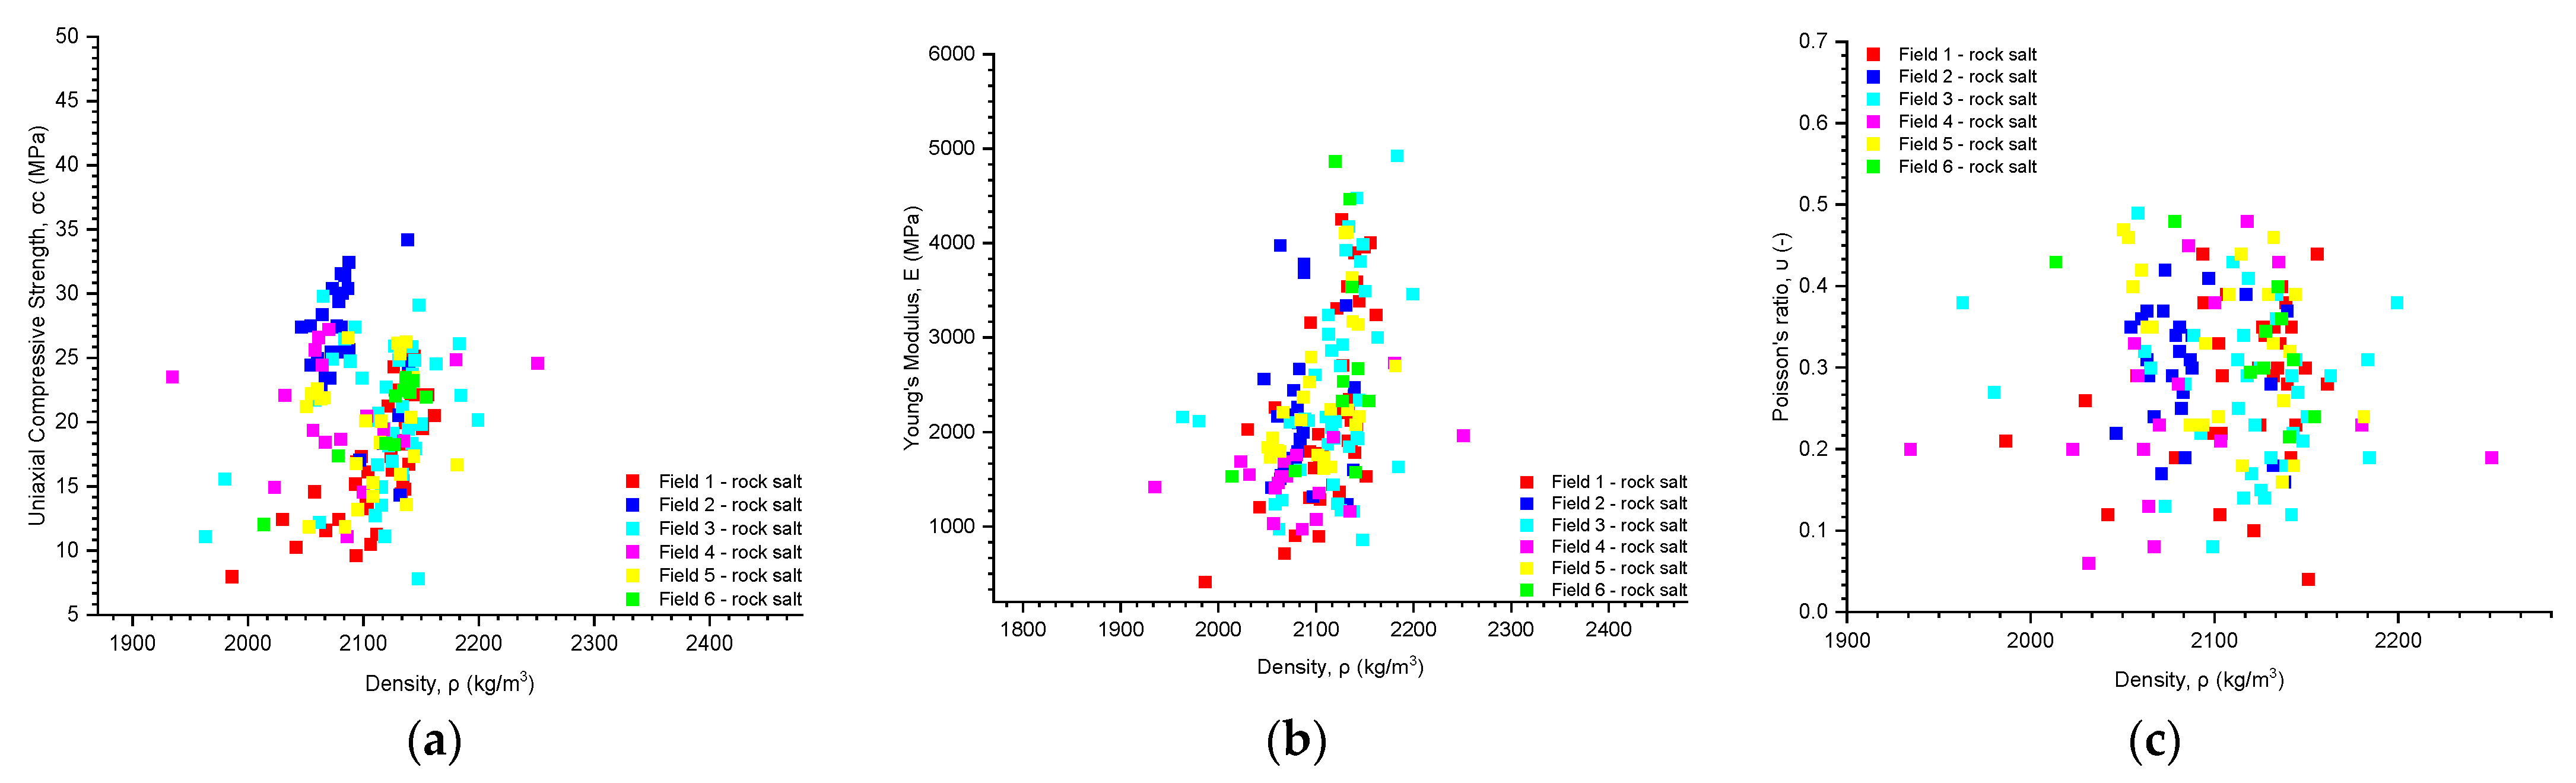
4.1. Physical Property
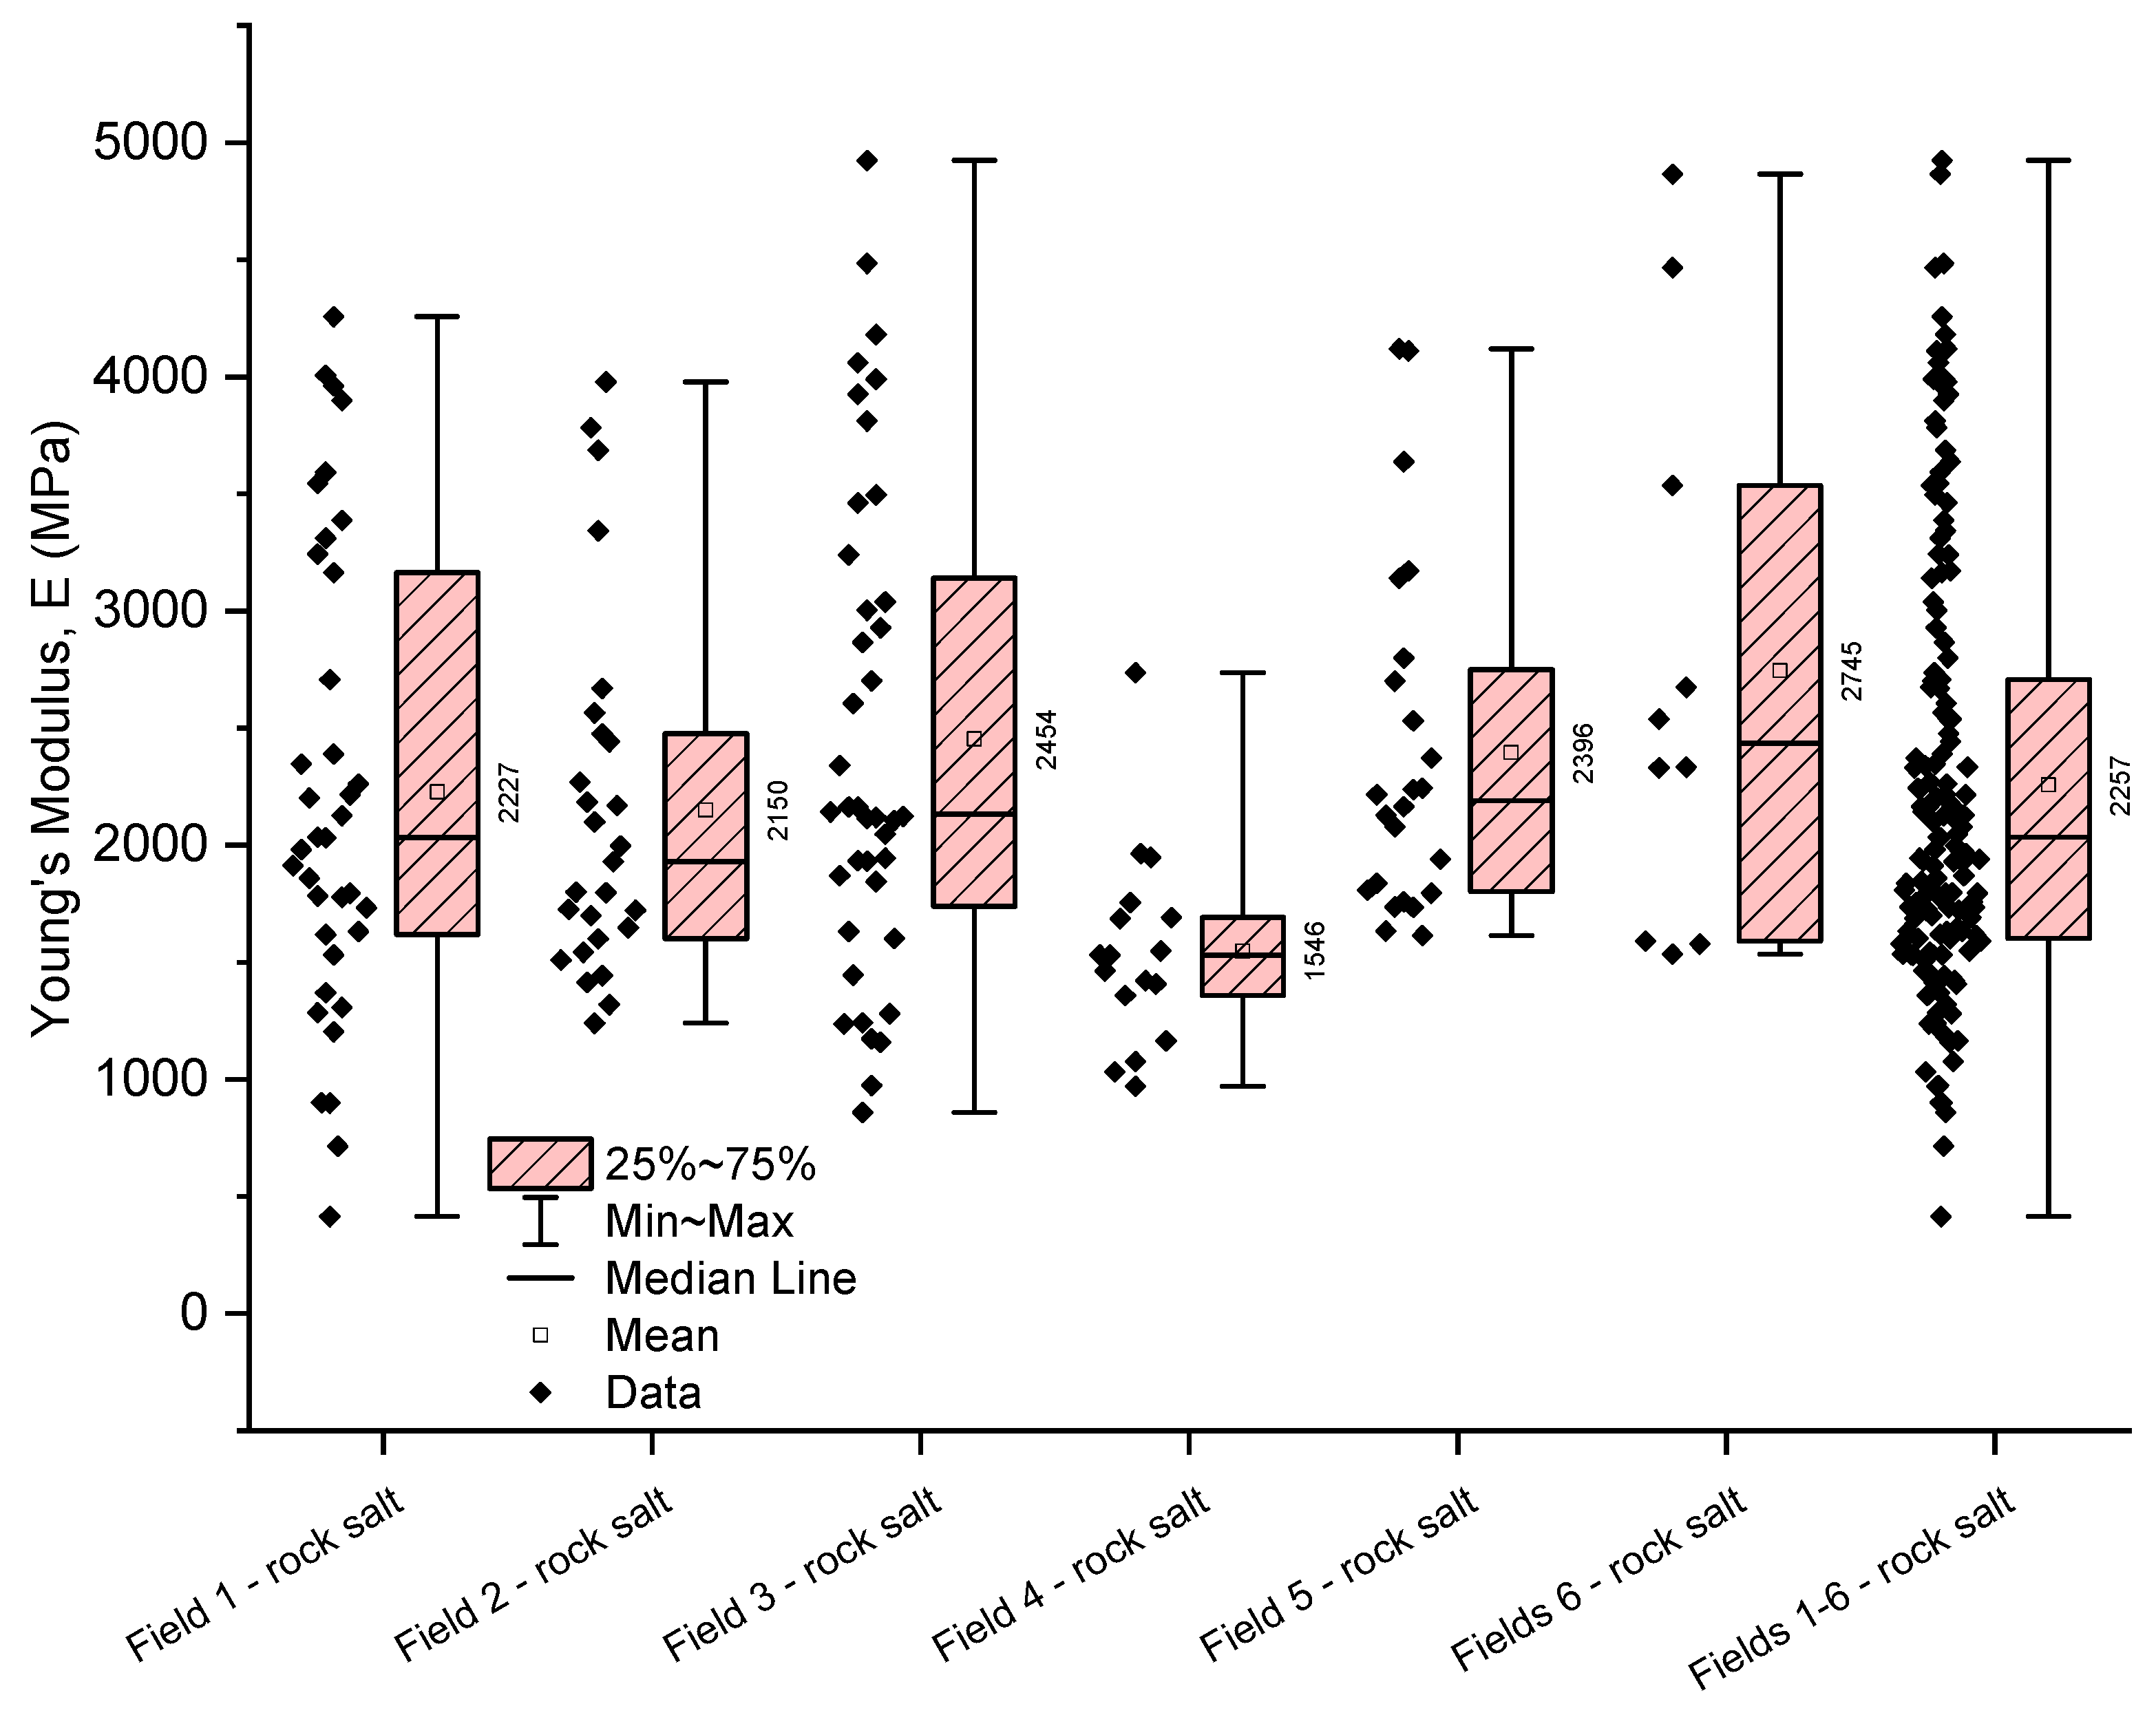
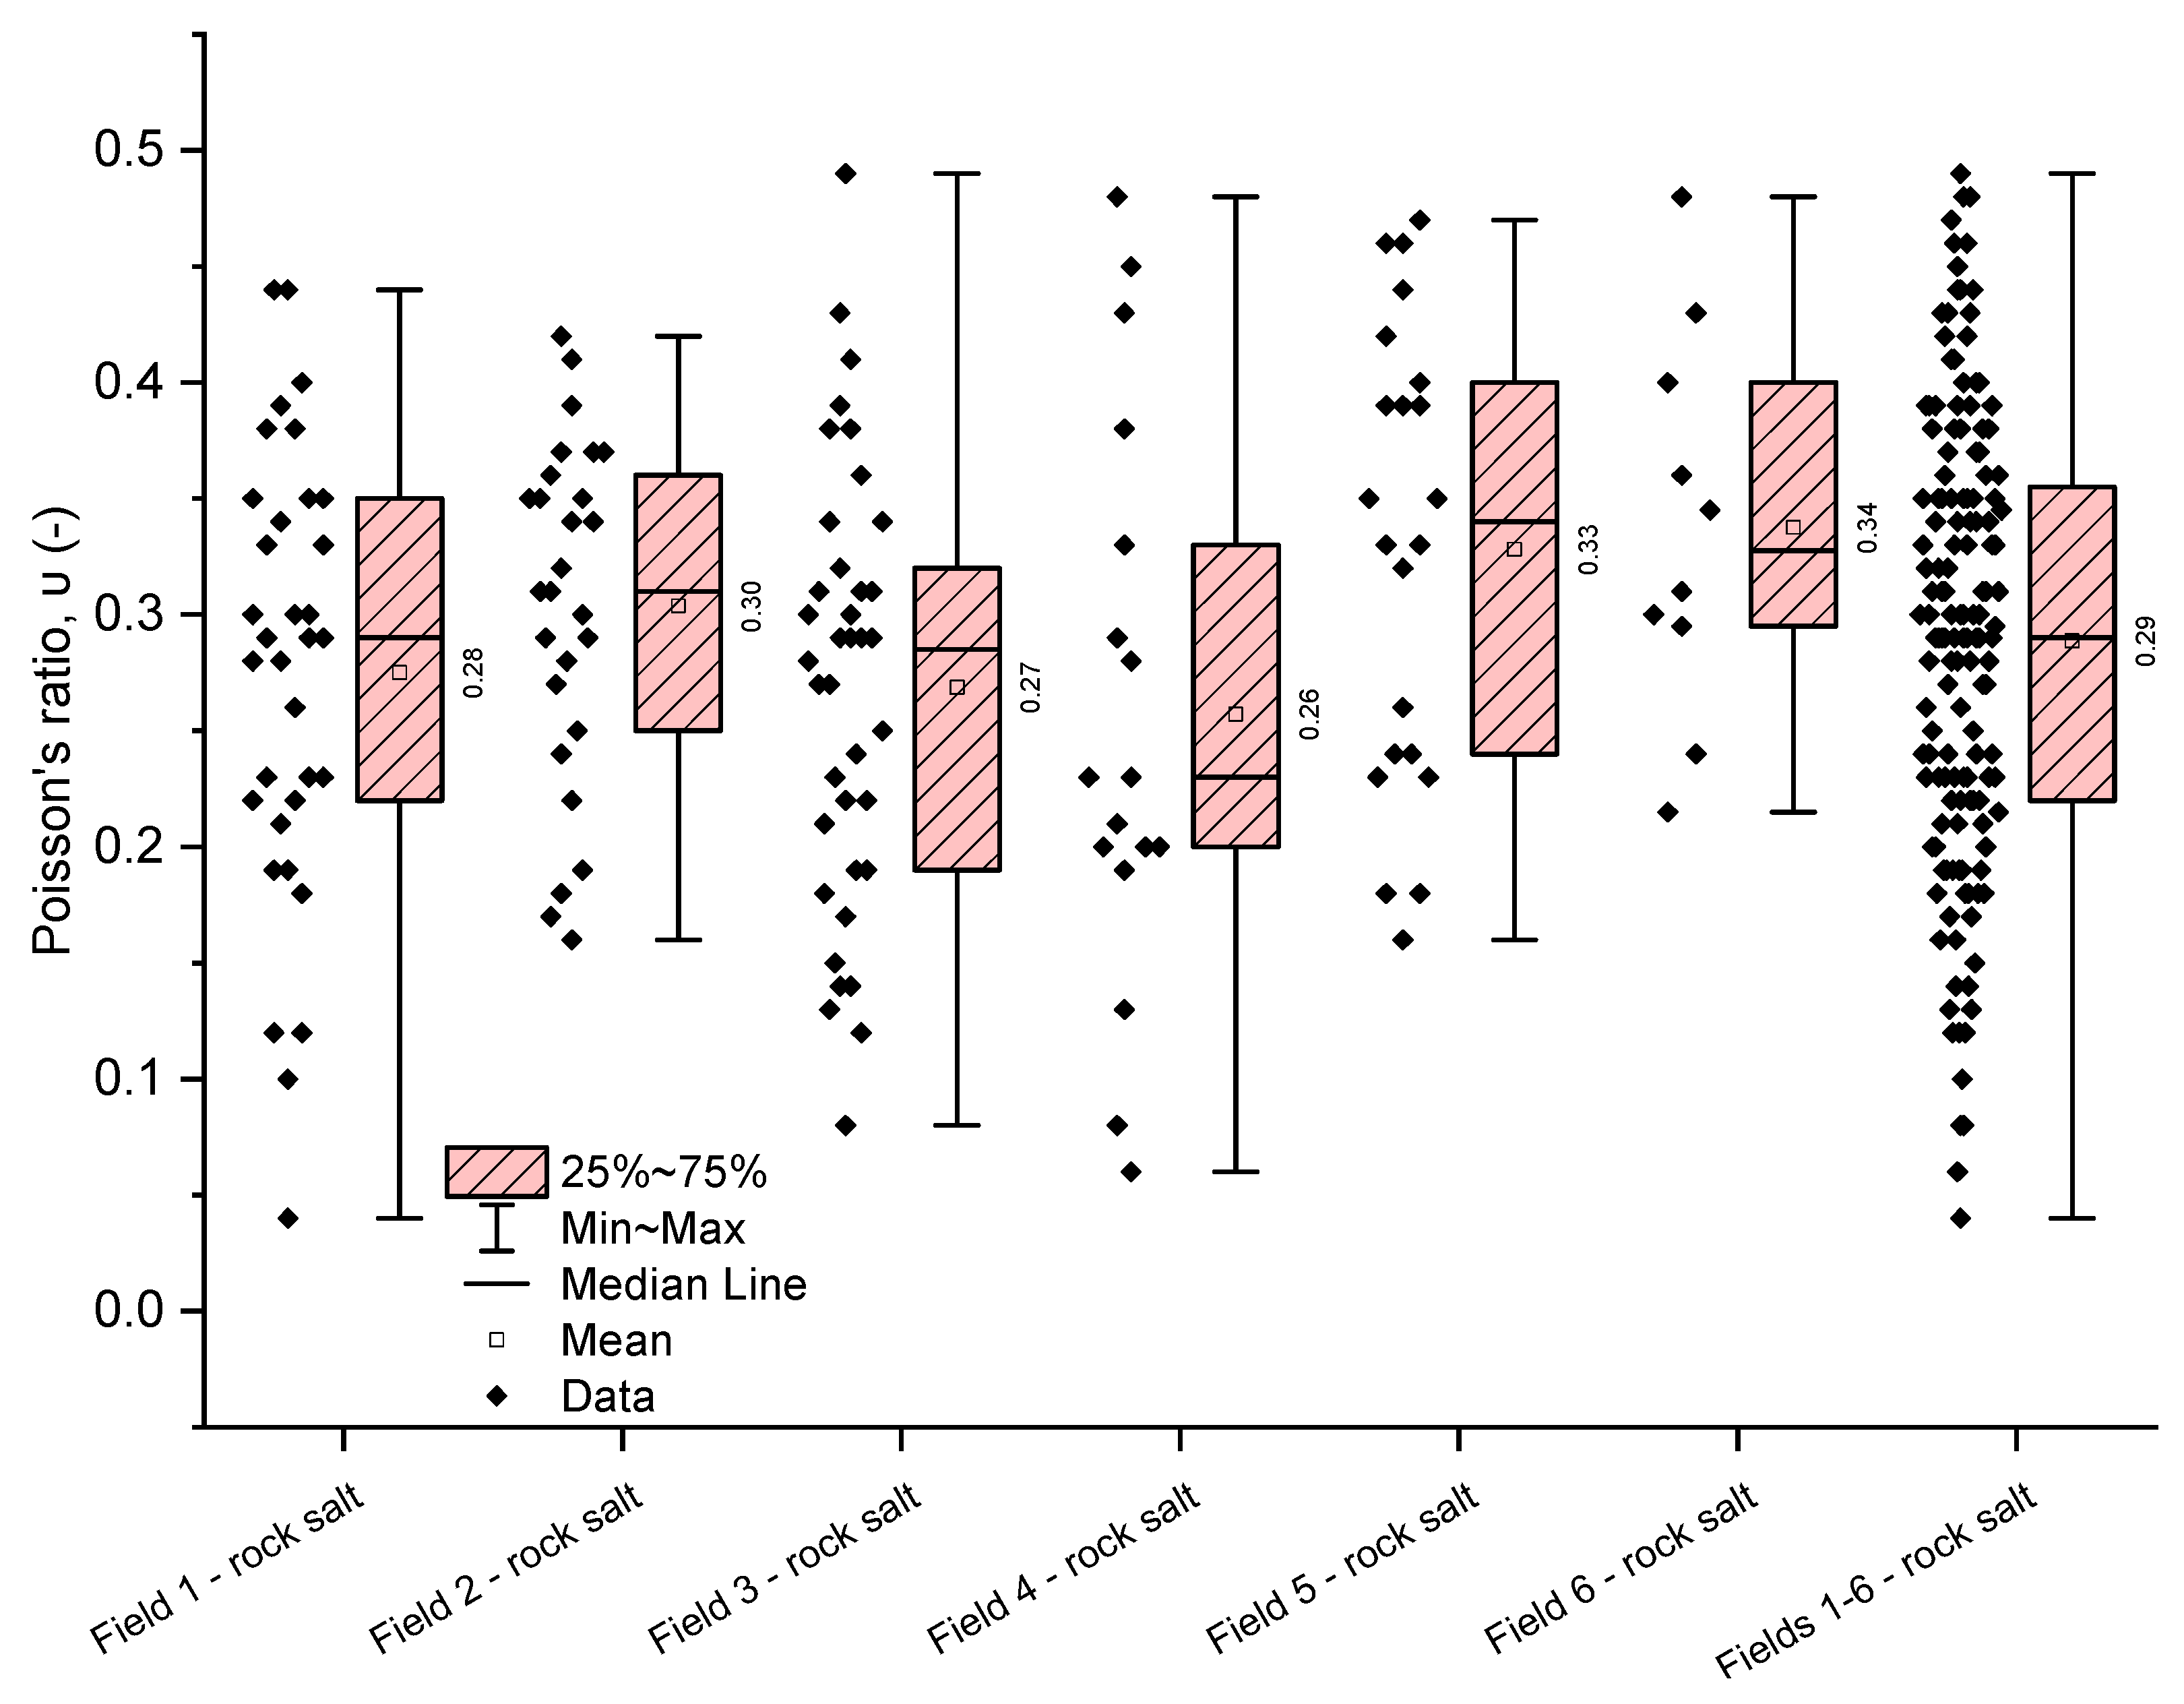
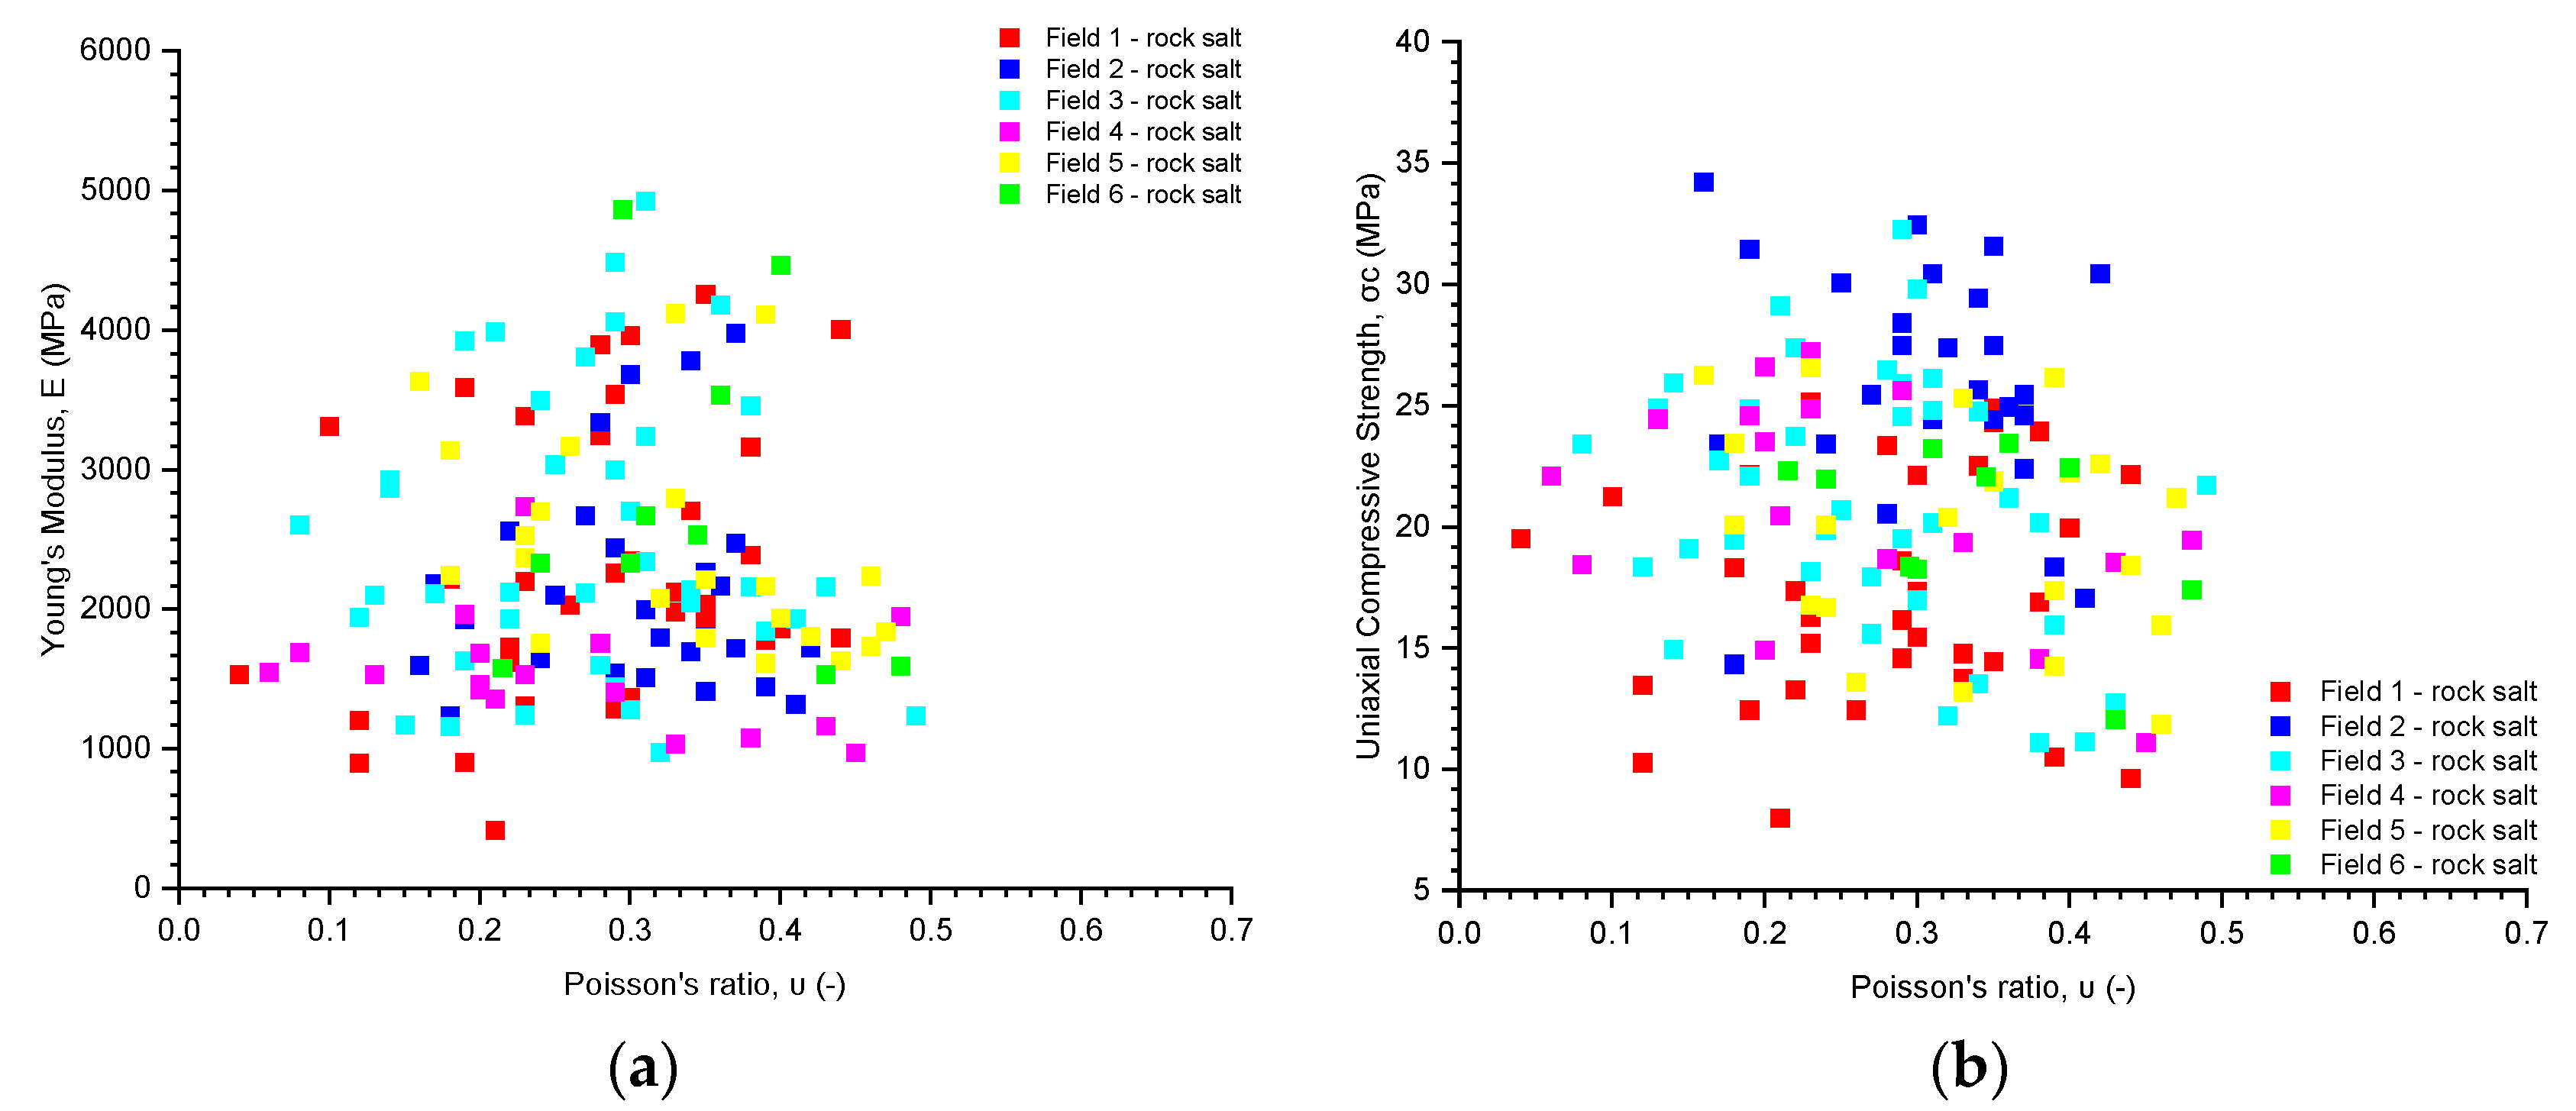
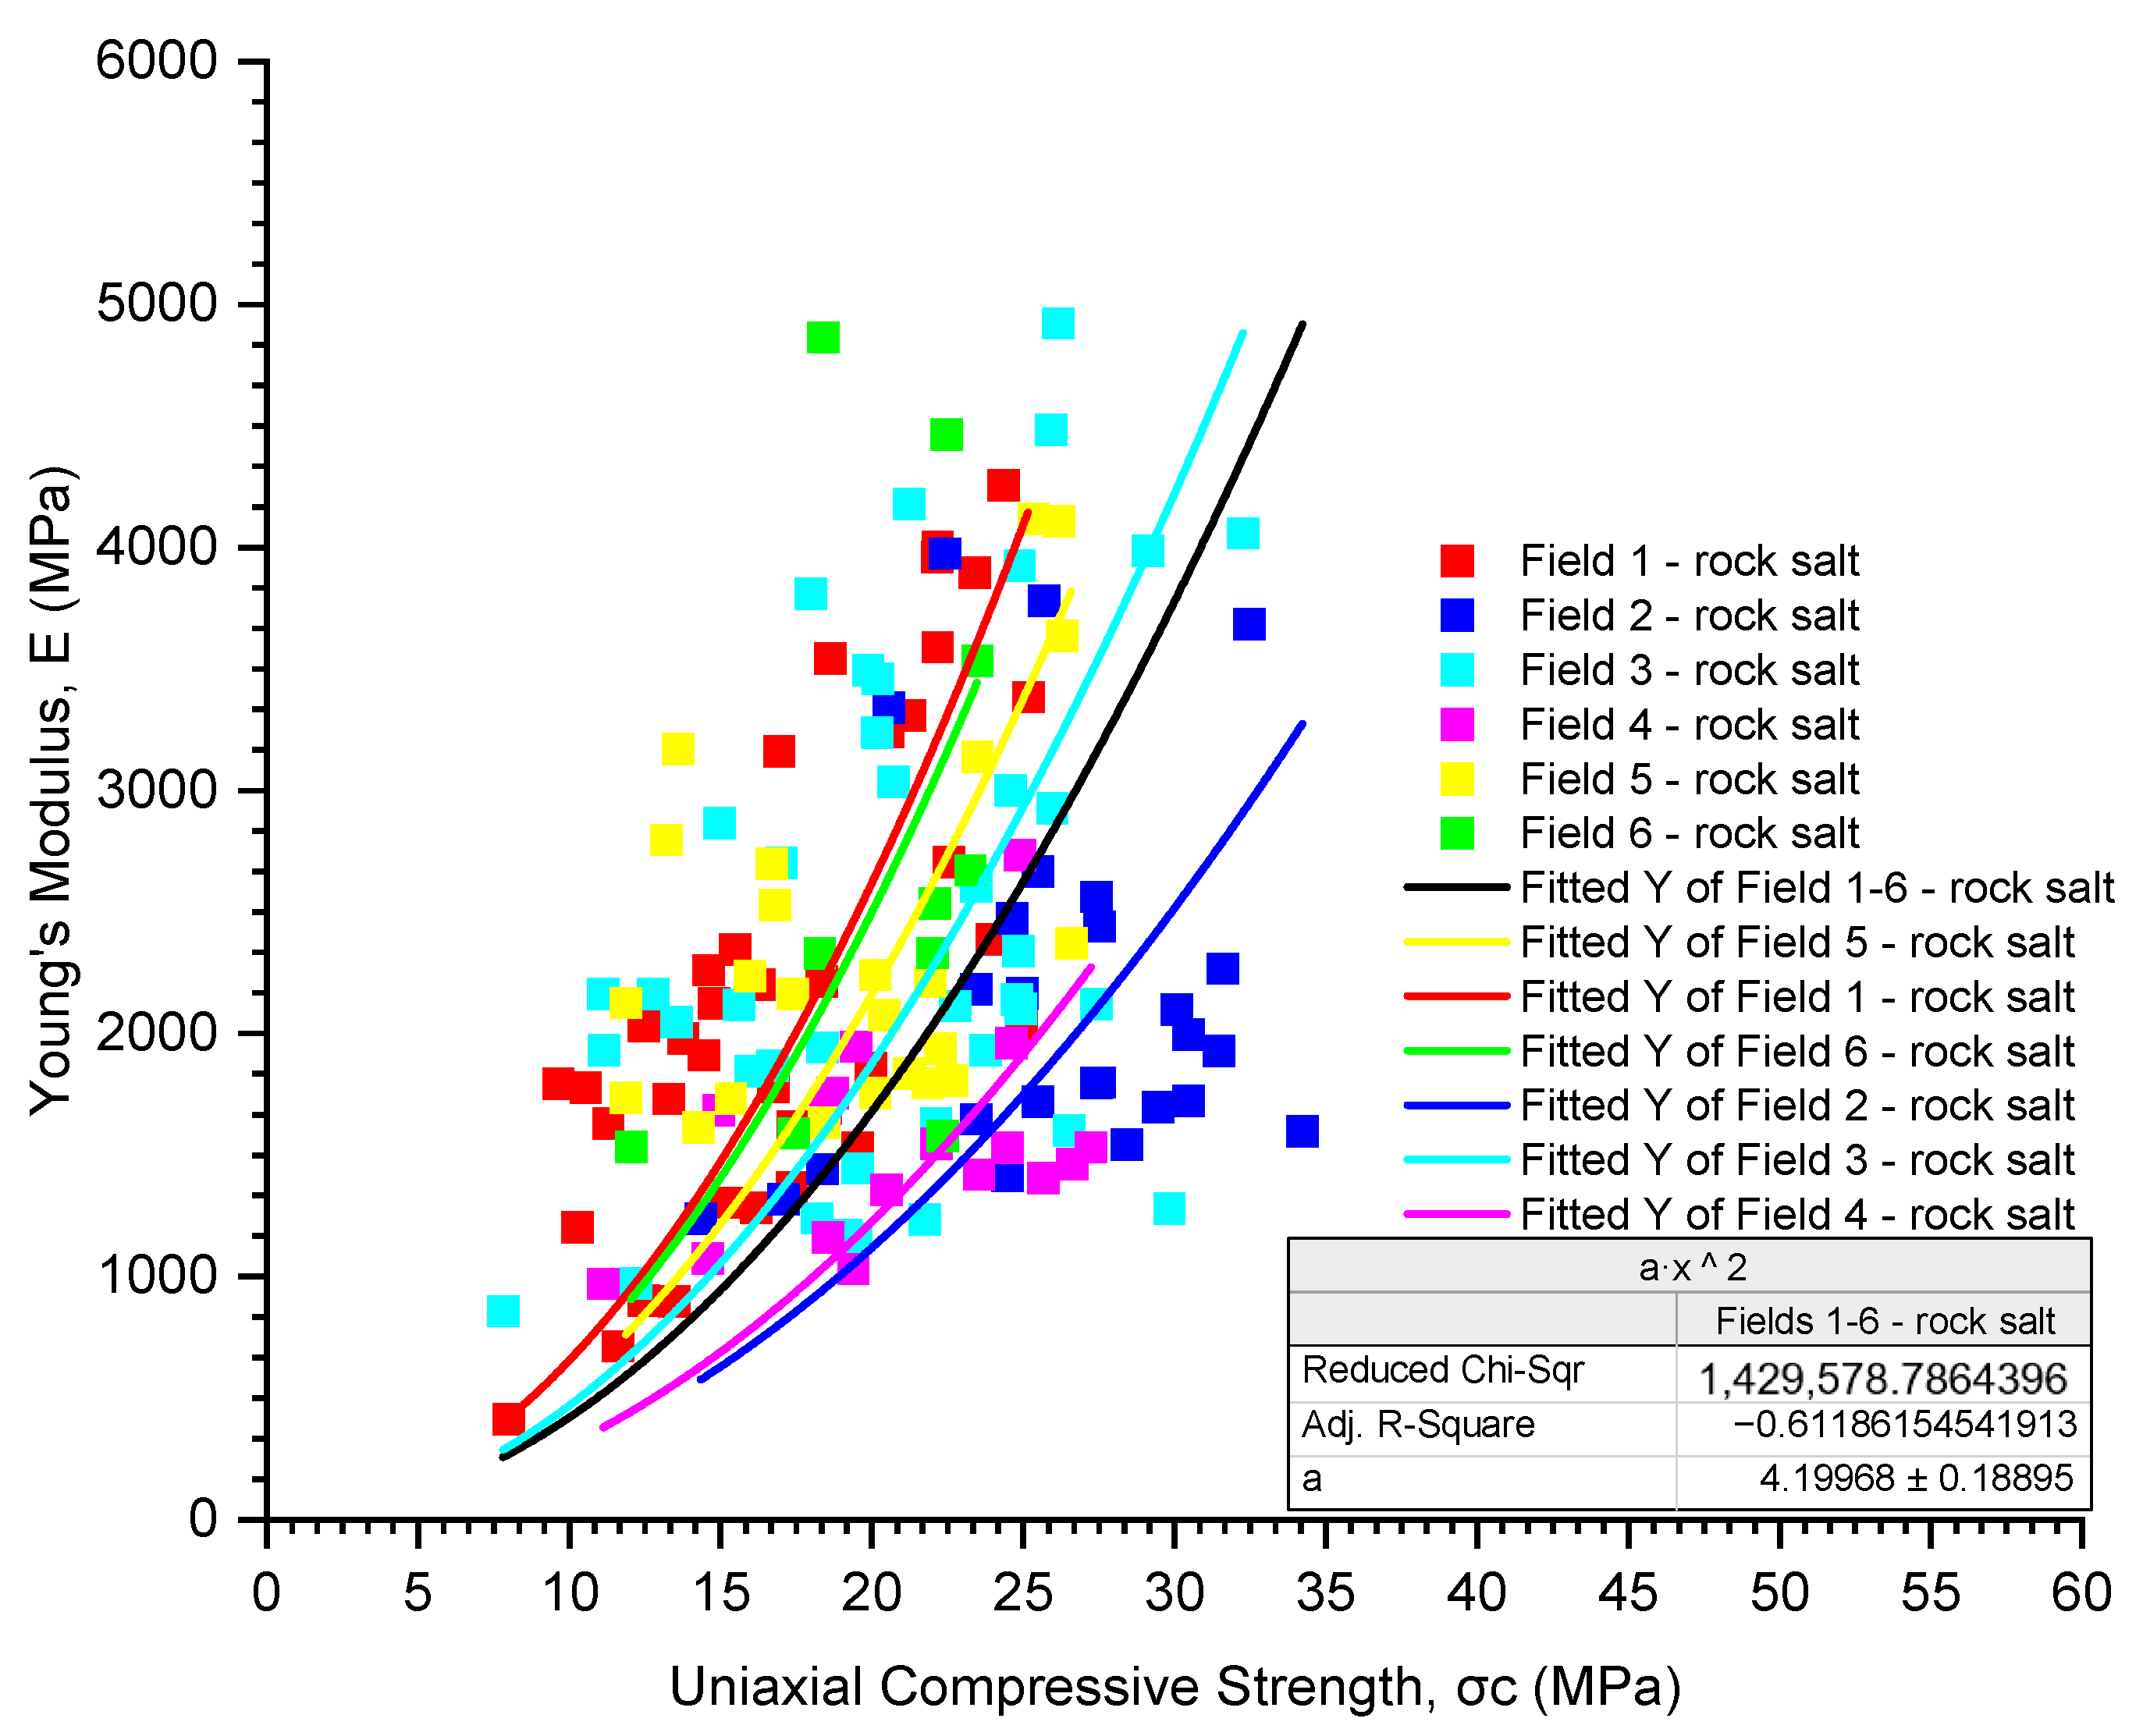
4.2. Uniaxial Compressive Strength and Deformability of Material
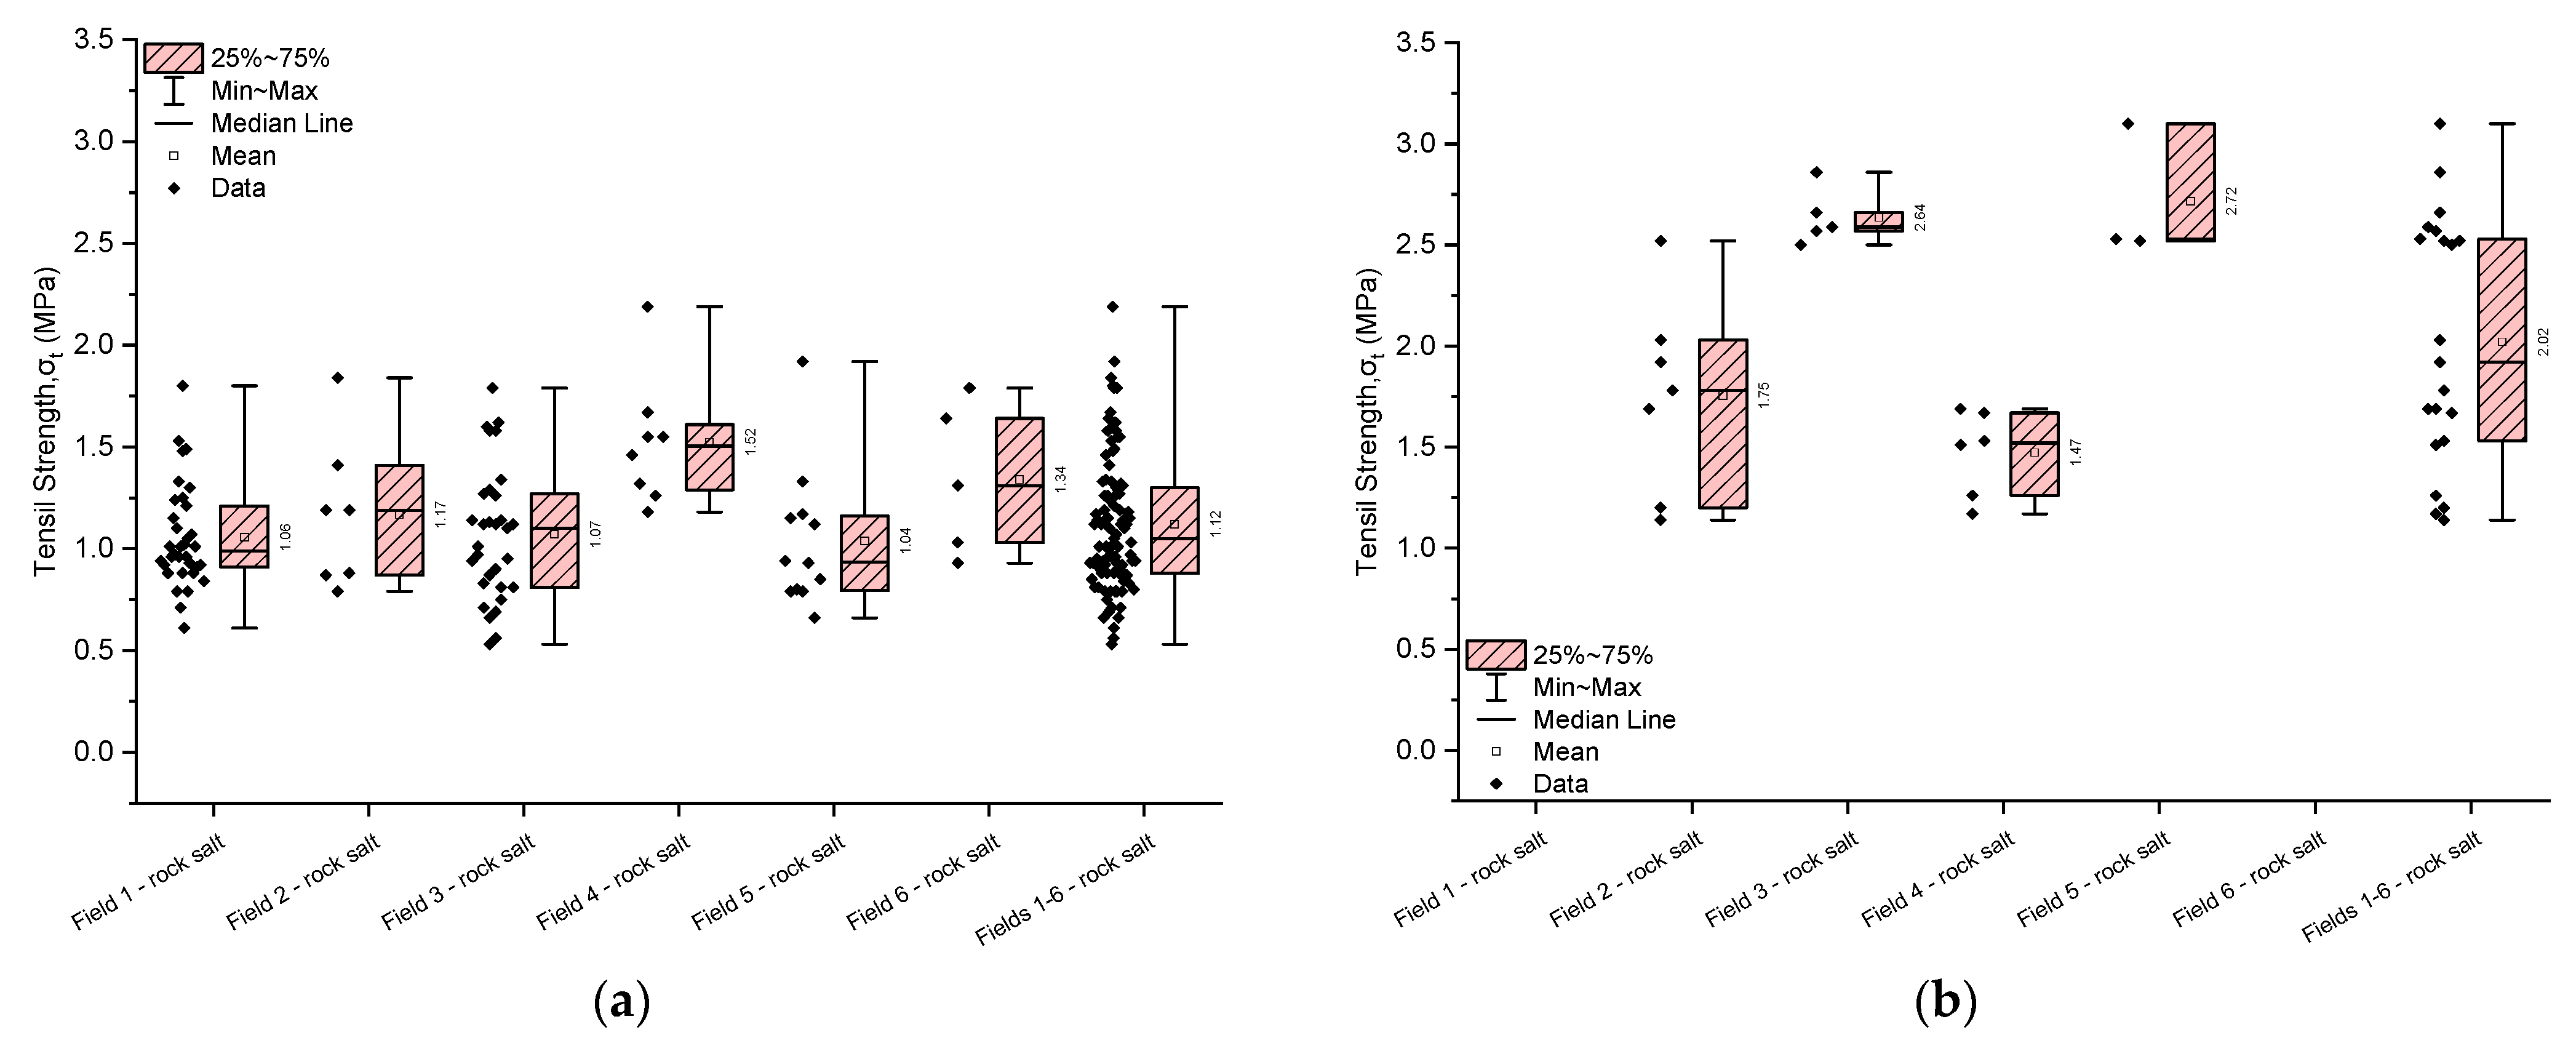
4.3. Indirect Tensile Strength
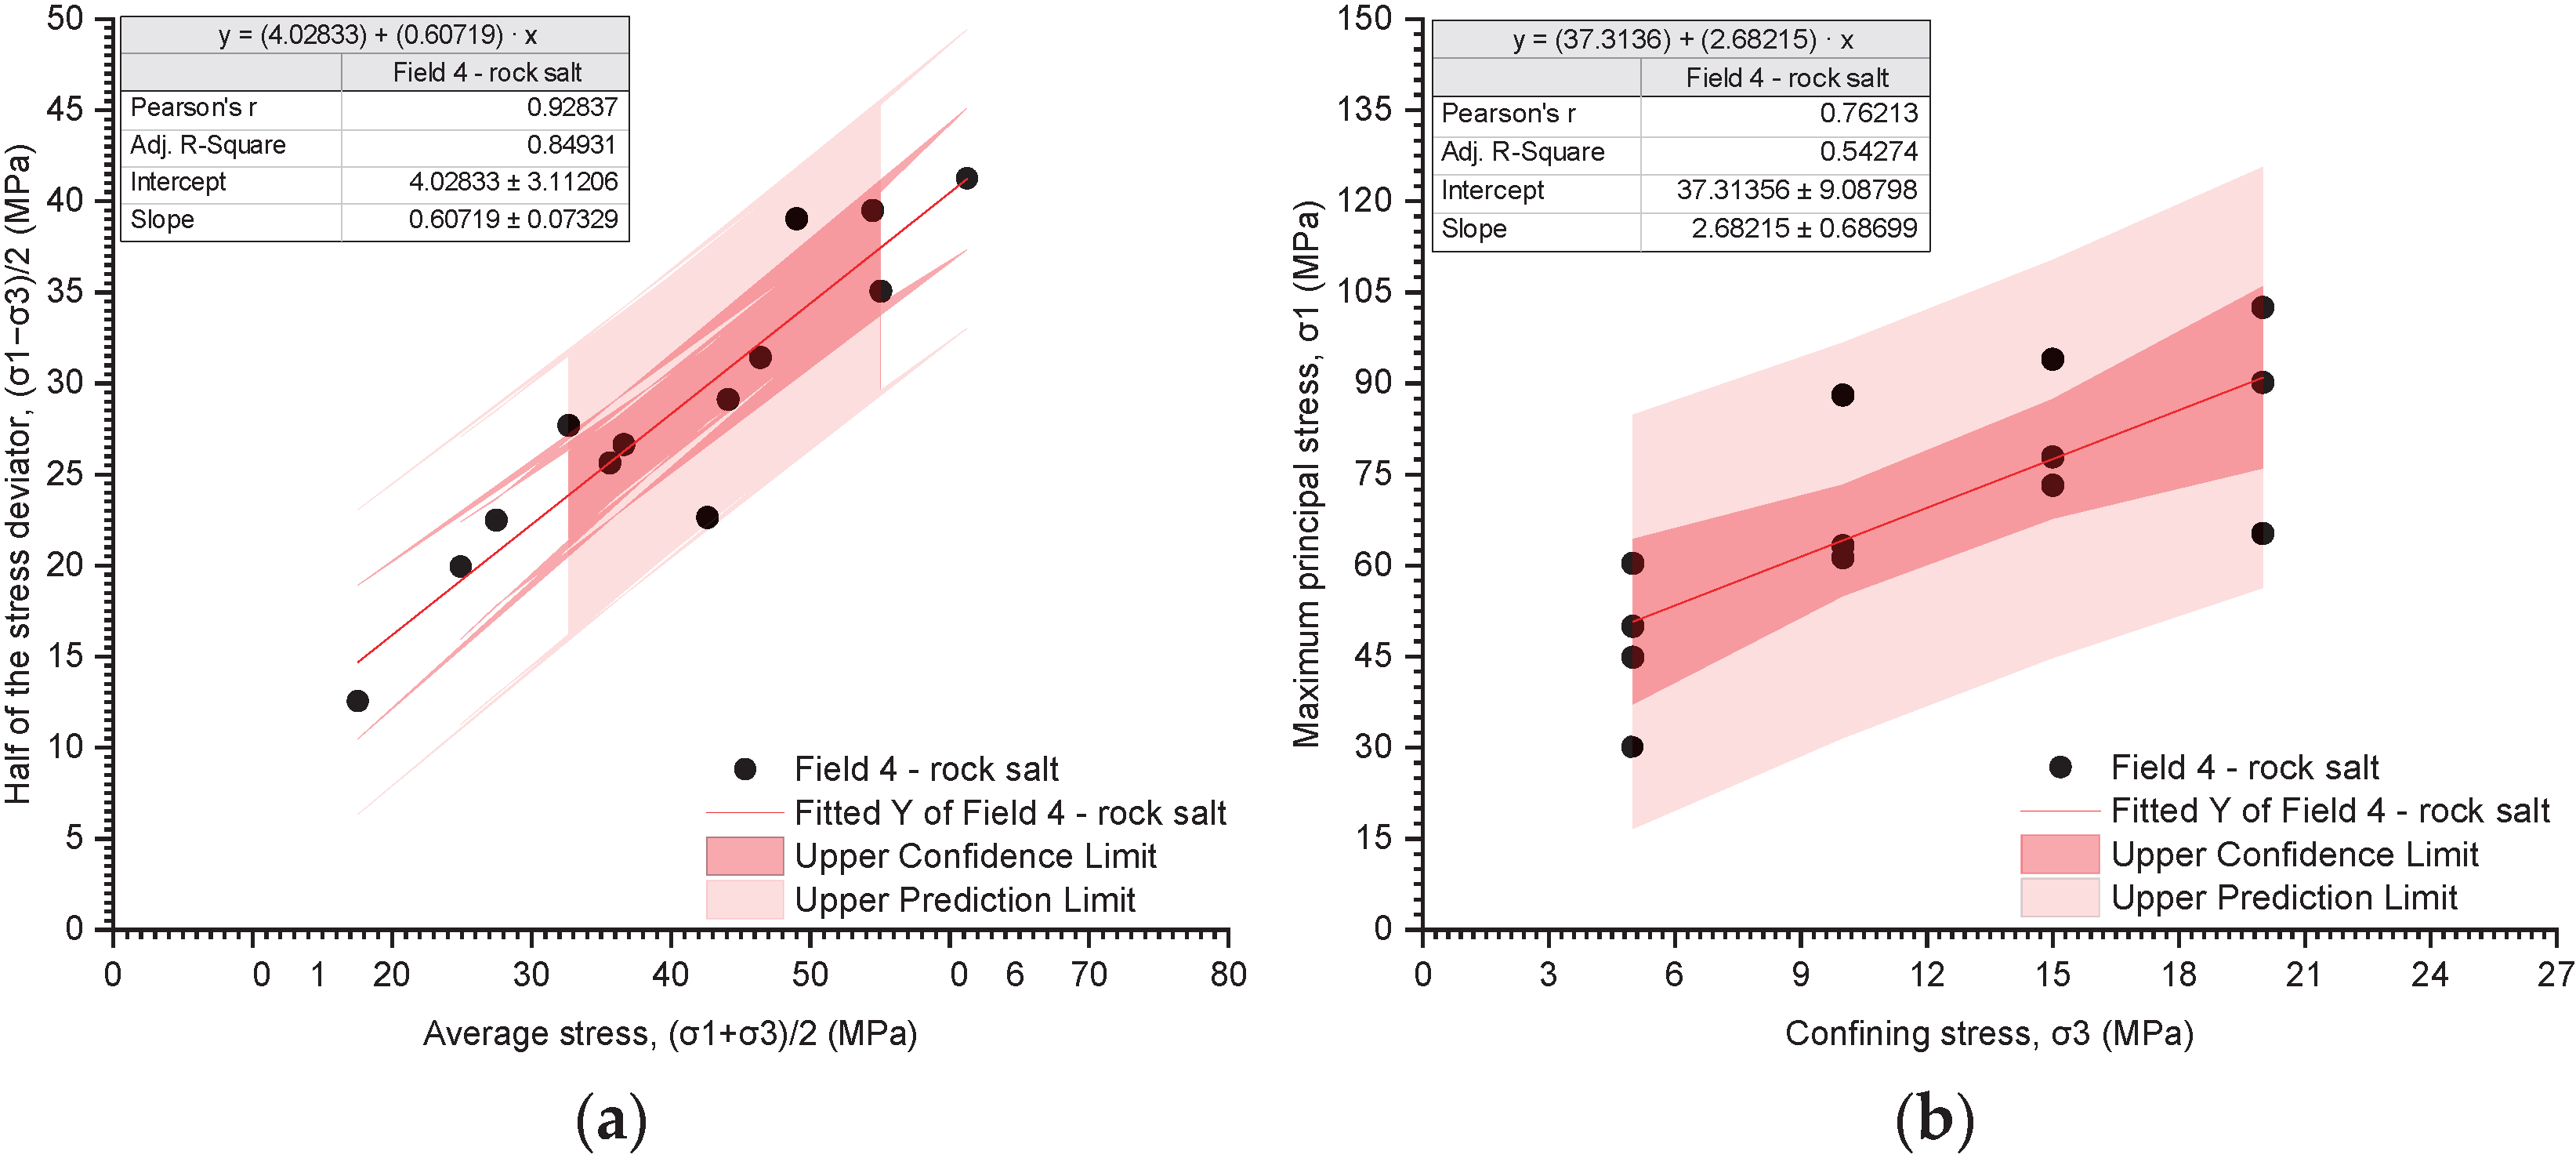
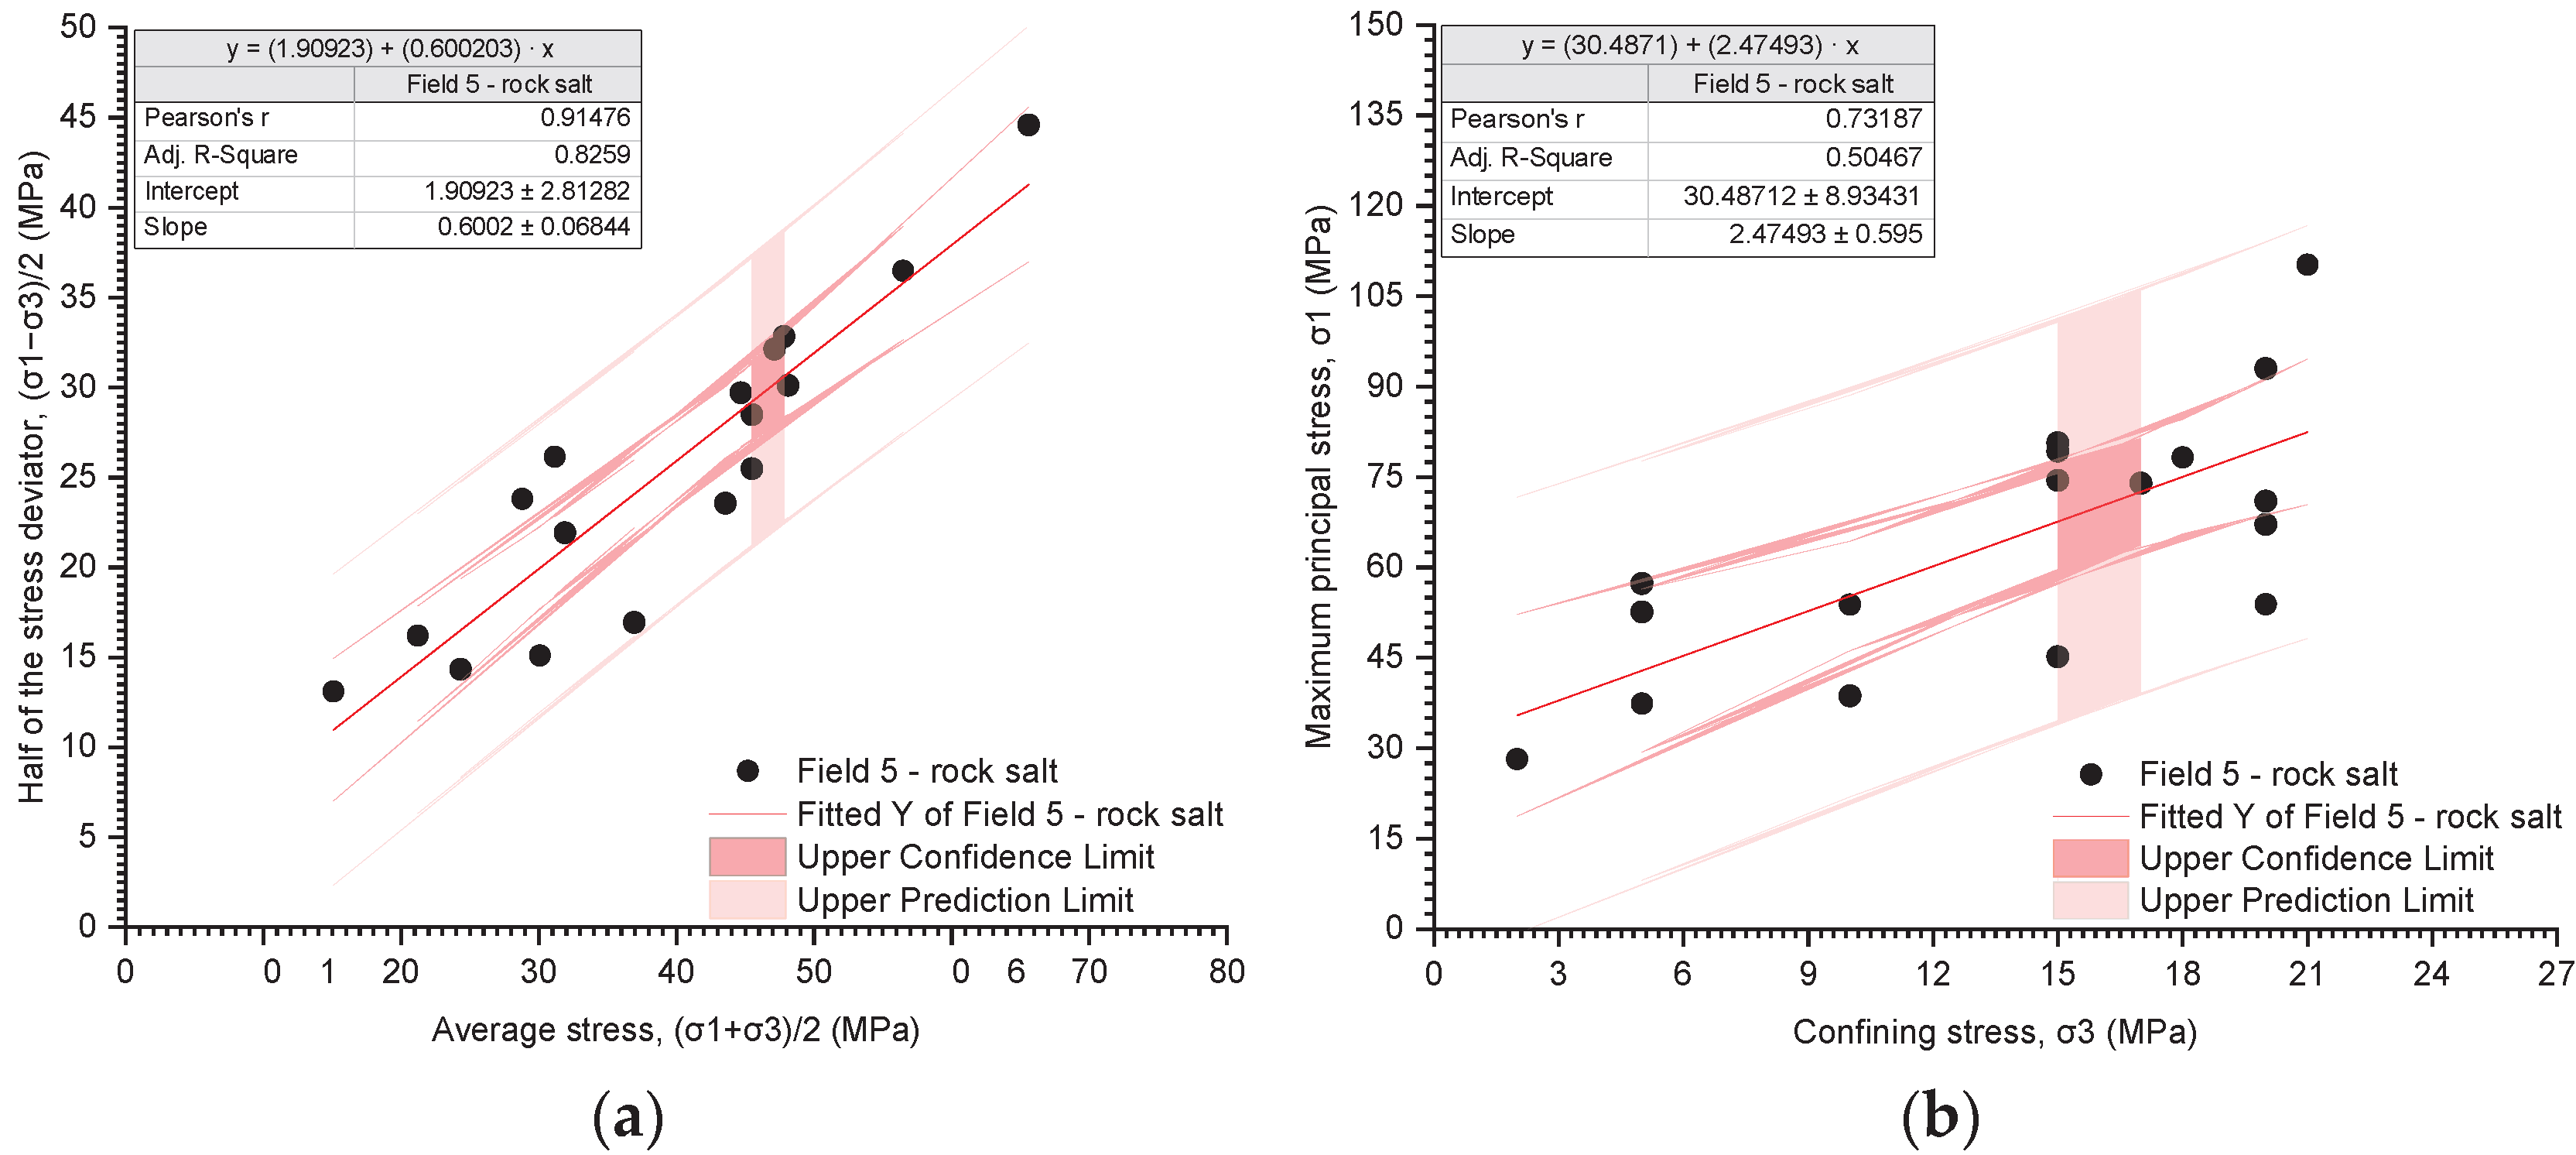
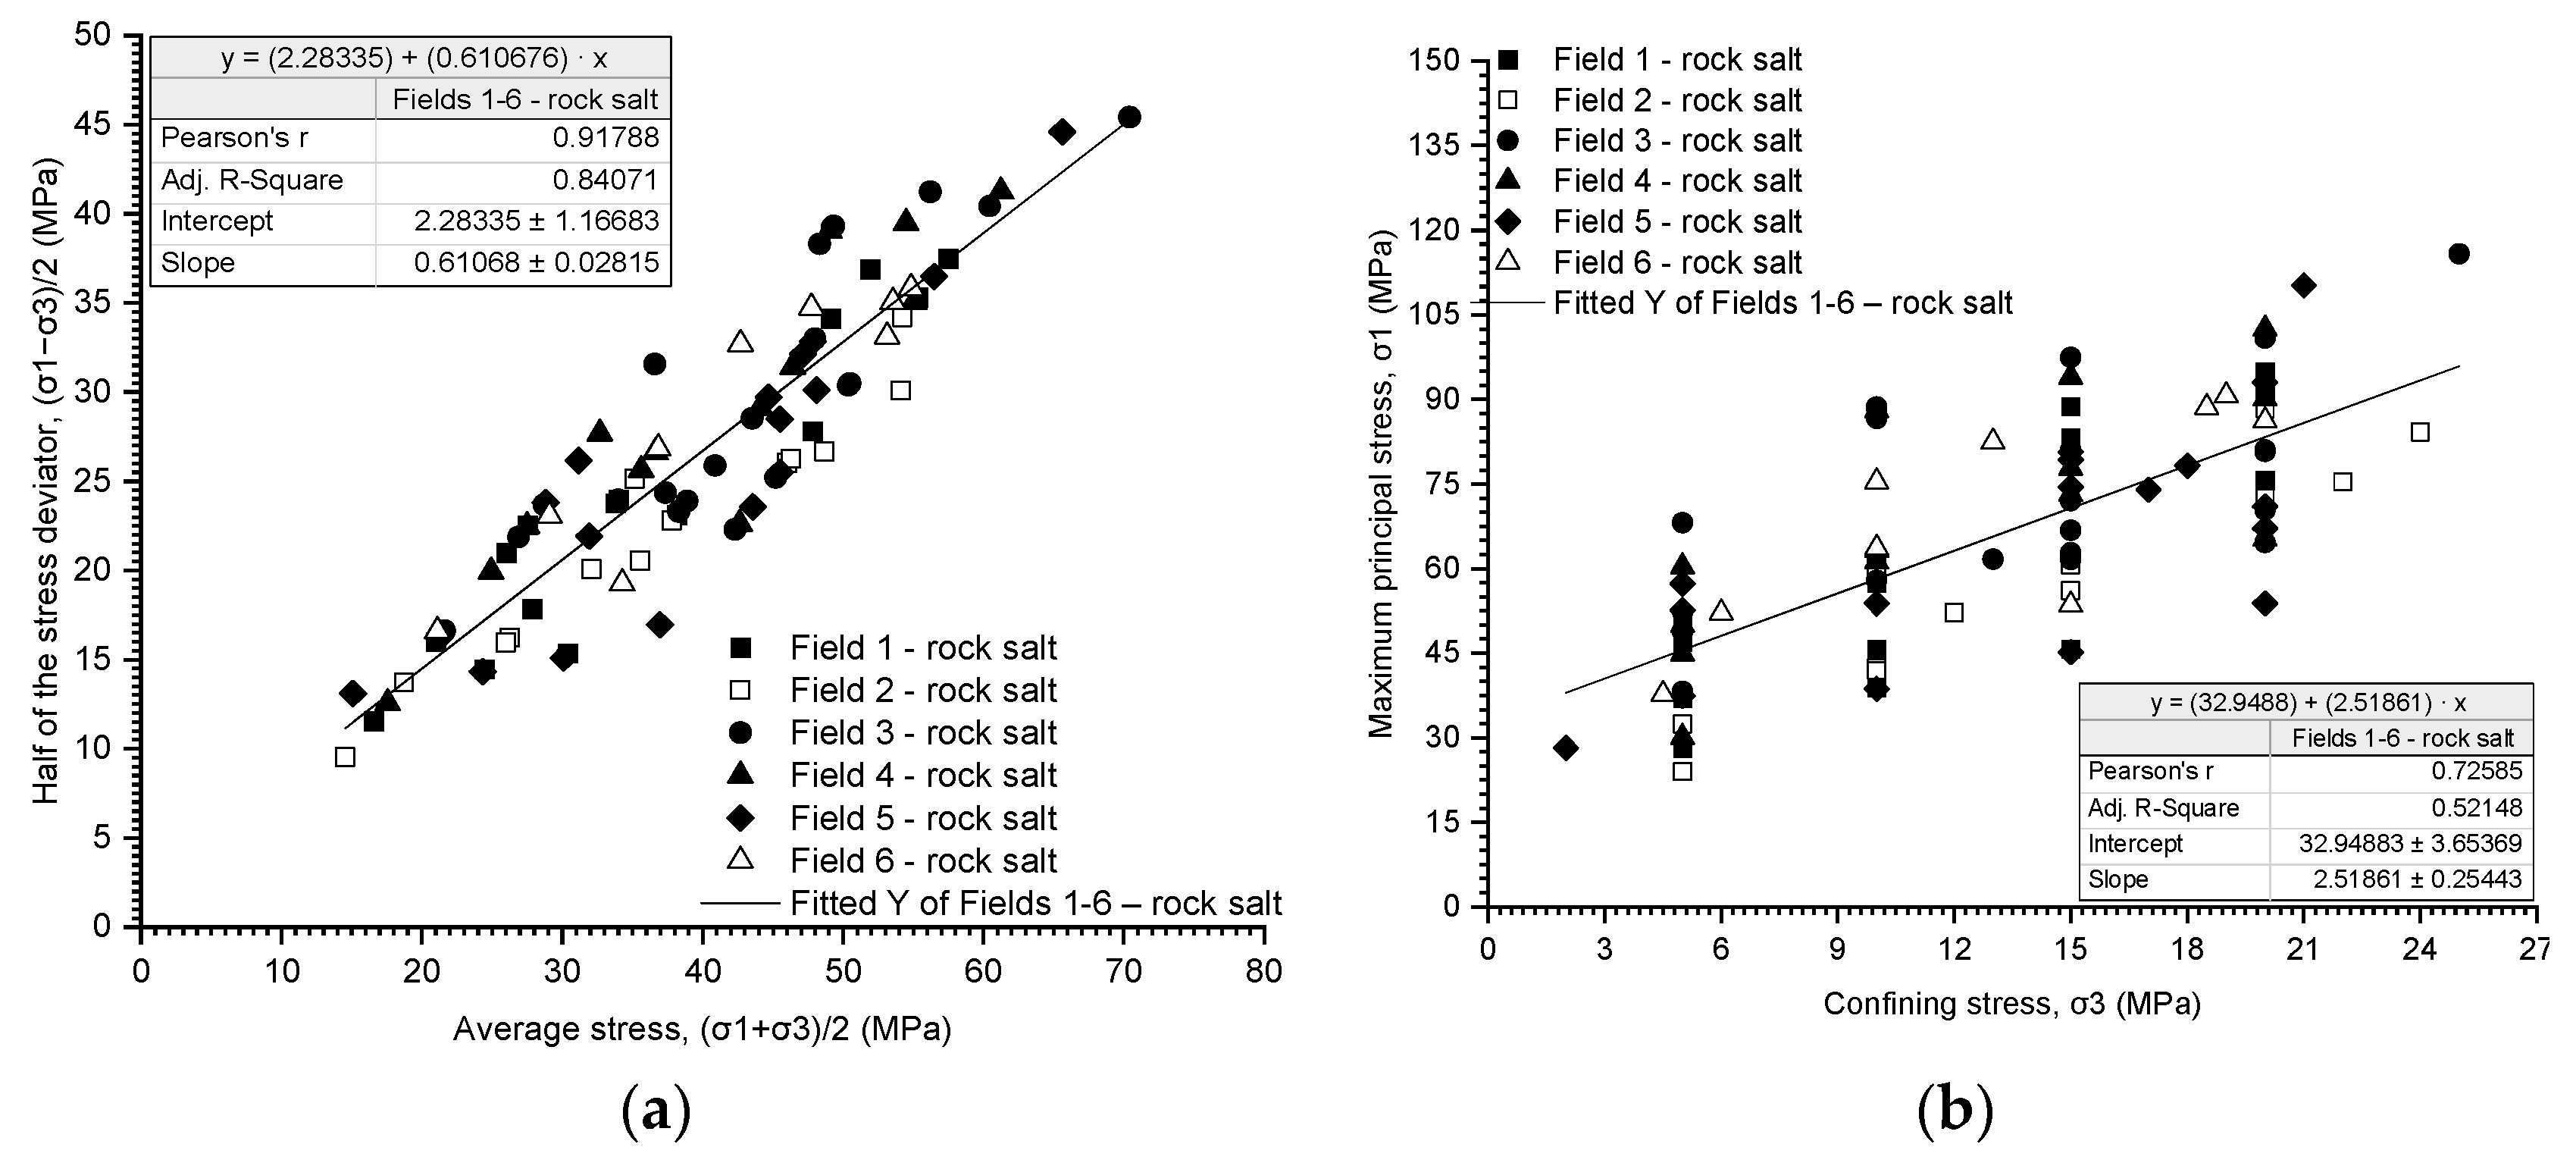
4.4. Strength of Materials in Triaxial Compression
- Field 1–6—stress path, Pearson’s r = 0.91788;
- Cohesion: 2.88 MPa;
- Internal friction angle: 37.64°;
- Fields 1–6—critical state, Pearson’s r = 0.72585;
- Cohesion: 10.38 MPa;
- Internal friction angle: 25.57°.
5. Conclusions
- Fields 1–6—stress path, Pearson’s r = 0.91788: ;
- Fields 1–6—critical state, Pearson’s r = 0.72585:
Author Contributions
Funding
Institutional Review Board Statement
Informed Consent Statement
Data Availability Statement
Conflicts of Interest
References
- Wang, T.T.; Yan, X.Z. A new shape design method of salt cavern used as underground gas storage. Appl. Energy 2013, 104, 50–61. [Google Scholar] [CrossRef]
- Wang, T.T.; Yan, X.Z.; Yang, H.L.; Yang, X.J. Stability analysis of the pillars between bedded salt cavern groups by cusp catastrophe model. Sci. China Technol. Sci. 2011, 54, 1615–1623. [Google Scholar] [CrossRef]
- Lux, K.H. Design of salt caverns for the storage of natural gas, crude oil and compressed air: Geomechanical aspects of construction, operation and abandonment. Geol. Soc. Lond. 2009, 313, 93–128. [Google Scholar] [CrossRef]
- Kim, H.M.; Rutqvist, J.; Ryu, D.W.; Choi, B.H.; Sunwoo, C.; Song, W.K. Exploring the concept of compressed air energy storage (CAES) in lined rock caverns at shallow depth: A modelling study of air tightness and energy balance. Appl. Energy 2012, 92, 653–667. [Google Scholar] [CrossRef]
- Raju, M.; Khaitan, S.K. Modeling and simulation of compressed air storage in caverns: A case study of the Huntorf plant. Appl. Energy 2011, 89, 474–481. [Google Scholar] [CrossRef]
- Amaya, V.N.; Joseba, R.B.; Daniel, C.F.; Jorge, R.H. Review of seasonal heat storage in large basins: Watertanks and gravel–waterpits. Appl. Energy 2010, 87, 390–397. [Google Scholar]
- Compressed Air Energy Storage (CAES) in Salt Caverns. Available online: http://web.evs.anl.gov/saltcaverns/uses/compair/index.htm (accessed on 8 May 2024).
- Yinping, L.; Wei, L.; Chunhe, Y.; Jaak, D. Experimental investigation of mechanical behaviour of bedded rock salt containing inclined interlayer. Int. J. Rock Mech. Min. Sci. 2014, 69, 39–49. [Google Scholar]
- Bérest, P.; Brouard, B. Safety of salt caverns used for underground storage blow out; mechanical instability; seepage; cavern abandonment. Oil Gas Sci. Technol. 2003, 58, 361–384. [Google Scholar] [CrossRef]
- Peach, C.J. Influence of Deformation on the Fluid Transport Properties of Rock Salts. Ph.D. Thesis, Utrecht University, Utrecht, The Netherlands, 1990. [Google Scholar]
- Hunsche, U.; Hampel, A. Rock salt—The mechanical properties of the host rock material for a radioactive waste repository. Eng. Geol. 1999, 52, 271–291. [Google Scholar] [CrossRef]
- Slizowski, K.; Janeczek, J.; Przewlocki, K. Suitability of salt-mudstones as a host rock in salt domes for radioactive-waste storage. Appl. Energy 2003, 75, 119–128. [Google Scholar] [CrossRef]
- Vandeginste, V.; Ji, Y.; Buysschaert, F.; Anoyatis, G. Mineralogy, microstructures and geomechanics of rock salt for underground gas storage. Deep Undergr. Sci. Eng. 2023, 2, 129–147. [Google Scholar] [CrossRef]
- Lankof, L.; Tarkowski, R. Hydrogen storage potential in Permian rock salts in Poland. Salt Rev. 2022, 16, 29–42. [Google Scholar]
- Crotogino, F.; Schneider, G.S.; Evans, D.J. Renewable energy storage in geological formations. J. Power Energy 2018, 232, 100–114. [Google Scholar] [CrossRef]
- Olabi, A.G.; Bahri, A.; Saleh Abdelghafar, A.A.; Baroutaji, A.; Sayed, E.T.; Alami, A.H.; Rezk, H.; Abdelkareem, M.A. Large-vscale hydrogen production and storage technologies: Current status and future directions. Int. J. Hydrogen Energy 2021, 46, 23498–23528. [Google Scholar] [CrossRef]
- Zivar, D.; Kumar, S.; Foroozesh, J. Underground hydrogen storage: A comprehensive review. Int. J. Hydrogen Energy 2021, 46, 23436–23462. [Google Scholar] [CrossRef]
- Muhammed, N.S.; Haq, B.; Al Shehri, D.; Al Ahmed, A.; Rahman, M.M.; Zaman, E. A review on underground hydrogen storage: Insight into geological sites, influencing factors and future outlook. Energy Rep. 2022, 8, 461–499. [Google Scholar] [CrossRef]
- Lizowski, J.S.; Lankof, L. Salt-mudstones and rock-salt suitabilities for radioactive waste storage systems: Rheological properties. Appl. Energy 2003, 75, 137–144. [Google Scholar] [CrossRef]
- Hakan, A. Percolation model for dilatancy-induced permeability of the excavation damaged zone in rock salt. Int. J. Rock Mech. Min. Sci. 2009, 46, 716–724. [Google Scholar]
- Bérest, P.; Benoît, B.; Mehdi, K.J. Transient behaviour of salt caverns—Interpretation of mechanical integrity tests. Int. J. Rock Mech. Min. Sci. 2007, 44, 767–786. [Google Scholar] [CrossRef]
- Brouard, B.; Bérest, P.; Couteau, J. Influence of the leaching phase on the mechanical behaviour of salt caverns. Int. J. Rock Mech. Min. Sci. 1997, 34, 26.e1–26.e15. [Google Scholar] [CrossRef]
- Martín, L.B.; Rutqvist, J.; Birkholzer, J.T. Long-term modelling of the thermal–hydraulic–mechanical response of a generic salt repository for heat-generating nuclear waste. Eng. Geol. 2015, 193, 198–211. [Google Scholar] [CrossRef]
- Deng, J.Q.; Yang, Q.; Liu, Y.R. Time-dependent behaviour and stability evaluation of gas storage caverns in salt rock based on deformation reinforcement theory. Tunn. Undergr. Space Technol. 2014, 42, 277–292. [Google Scholar] [CrossRef]
- Mortazavi, A.; Nasab, H. Analysis of the behaviour of large underground oil storage caverns in salt rock. Int. J. Numer. Anal. Methods Geomech. 2017, 41, 602–624. [Google Scholar] [CrossRef]
- Mahmoudi, E.; Khaledi, K.; Miro, S.; König, D.; Schanz, T. Probabilistic Analysis of a Rock Salt Cavern with Application to Energy Storage Systems. Rock Mech. Rock Eng. 2017, 50, 139–157. [Google Scholar] [CrossRef]
- Schulze, O. Investigation on Damage and Healing of Rock Salt. In Proceedings of the 6th Conference on the Mechanical Behaviour of Salt, Hannover, Germany, 22–25 May 2007; pp. 33–43. [Google Scholar]
- Chen, J.; Ren, S.; Yang, C.; Jiang, D.; Li, L. Self-healing characteristics of damaged rock salt under different healing conditions. Materials 2013, 6, 3438–3450. [Google Scholar] [CrossRef] [PubMed]
- Zhang, Q.; Liu, J.; Wang, L.; Luo, M.; Liu, H.; Xu, H.; Zou, H. Impurity Effects on the Mechanical Properties and Permeability Characteristics of Salt Rock. Energies 2020, 13, 1366. [Google Scholar] [CrossRef]
- Hesser, J.; Kaiser, D.; Schmitz, H.; Spies, T. Measurements of Acoustic Emission and Deformation in a Repository of Nuclear Waste in Salt Rock. Eng. Geol. 2015, 6, 551–554. [Google Scholar]
- Paul, B.; Shao, H.; Hesser, J.; Lege, C. In Situ Quantification of Hydrocarbon in an Underground Facility in Tight Salt Rock. Eng. Geol. 2015, 6, 893–896. [Google Scholar]
- Flisiak, D. Metodyka badań soli kamiennej w warunkach konwencjonalnego trójosiowego ściskania dla projektowania podziemnych magazynów (Methodology of rock salt testing under conventional triaxial compression conditions for the design of underground storage facilities). Górnictwo Geoinżynieria 2007, 3, 179–186. (In Polish) [Google Scholar]
- Zhou, H.W.; Wang, C.P.; Han, B.B.; Duan, Z.Q. A creep constitutive model for salt rock based on fractional derivatives. Int. J. Rock Mech. Min. Sci. 2011, 48, 116–121. [Google Scholar] [CrossRef]
- Cristescu, N.D.; Hunsche, U. Time Effects in Rock Mechanics; John Wiley & Sons: New York, NY, USA, 1998. [Google Scholar]
- Hou, Z. Mechanical and hydraulic behavior of rock salt in the excavation disturbed zone around underground facilities. Int. J. Rock Mech. Min. Sci. 2003, 40, 725–738. [Google Scholar] [CrossRef]
- Berest, P.; Bergues, J.; Brouard, B.; Durup, J.G.; Guerber, B. A salt cavern abandonment test. J. Rock Mech. Min. Sci. 2001, 38, 357–368. [Google Scholar] [CrossRef]
- Ren, S.; Bai, Y.; Zhang, J.; Jiang, D.; Yang, C. Experimental investigation of the fatigue properties of salt rock. Int. J. Rock Mech. Min. Sci. 2013, 64, 68–72. [Google Scholar]
- Lux, K.H.; Hersermann, S. Creep tests on rock salt with changing load as a basis for the verification of theoretical material laws. In Proceedings of the 6th International Symposium on Salt Symposium, Toronto, ON, Canada, 24–28 May 1983; Schreiber, B.C., Harner, H.L., Eds.; The Salt Institute: Alexandria, VA, USA, 1983; Volume 1, pp. 417–435. [Google Scholar]
- Hunsche, U.; Albercht, H. Results of true triaxial strength tests on rock salt. Eng. Fract. Mech. 1990, 35, 867–877. [Google Scholar] [CrossRef]
- Hunsche, U. Uniaxial and triaxial creep and failure tests on rock: Experimental technique and interpretation. In Visco-Plastic Behaviour of Geomaterials; Cristescu, N.D., Ed.; Springer: Vienna, Austria, 1994; pp. 1–53. [Google Scholar]
- Fuenkajorn, K.; Phueakphum, D. Effects of cyclic loading on mechanical properties of Maha Sarakham salt. Eng. Geol. 2010, 112, 43–52. [Google Scholar] [CrossRef]
- Wallner, M. Ermittlung zeit-und temperature abbangiger mechanischer Kennwerte von Salzgesteinen. In Proceedings of the 4th International Congress on the Rock Mechanics, Montreux, Switzerland, 2–8 September 1979; Volume 1, pp. 313–318. [Google Scholar]
- Hansen, F.D.; Mellegard, K.D.; Senseny, E. Elasticity and strength of ten natural rock salt. In Proceedings of the 1st International Conference Mechanical Behavior of Salt; Hardy, H.R., Langer, M., Eds.; Trans Tech Pub: Clausthal-Zellerfeld, Germany, 1984; pp. 71–83. [Google Scholar]
- Senseny, P.E.; Hansen, F.D.; Russell, J.E. Mechanical behaviour of rocksalt: Phenomenology and micromechanisms. Int. J. Rock Mech. Min. Sci. 1992, 29, 363–378. [Google Scholar] [CrossRef]
- Liang, W.; Yang, C.; Zhao, Y. Experimental investigation of mechanical properties of bedded salt rock. Int. J. Rock Mech. Min. Sci. 2007, 44, 400–411. [Google Scholar] [CrossRef]
- Flisiak, D.; Kolano, M. Research on geo-mechanical properties of rock salt in Kłodawa Diapir. AGH J. Min. Geoengin. 2012, 36, 145–153. [Google Scholar]
- Kolano, M.; Flisiak, D. Comparison of geo-mechanical properties of white rock salt and pink rock salt in Kłodawa salt diapir. Stud. Geotech. Mech. 2013, 35, 119–128. [Google Scholar] [CrossRef]
- Cristescu, N.D. A general constitutive equation for transient and stationary creep of rock salt. Int. J. Rock Mech. Min. Sci. Geomech. Abstr. 1993, 30, 125–140. [Google Scholar] [CrossRef]
- Chan, K.; Brodsky, N.; Fossum, A.; Bodner, S.; Munson, D. Damage-induced non-associated inelastic flow in rock salt. Int. J. Plast. 1994, 10, 623–642. [Google Scholar] [CrossRef]
- Jin, J.; Cristescu, N. An elastic/viscoplastic model for transient creep of rock salt. Int. J. Plast. 1998, 14, 85–107. [Google Scholar] [CrossRef]
- Yahya, O.; Aubertin, M.; Julien, M. A unified representation of the plasticity, creep and relaxation behaviour of rocksalt. Int. J. Rock Mech. Min. Sci. 2000, 37, 787–800. [Google Scholar] [CrossRef]
- Flisiak, D. Własności Odkształceniowe Soli Kamiennej w Próbach Reologicznych (Deformation Properties of Rock Salt in Rheological Tests); Geotechnika i Budownictwo Specjalne; AGH: Krakow, Poland, 2002. (In Polish) [Google Scholar]
- Flisiak, D.; Klisowski, R. Wstępna Ocena Własności Deformacyjnych Soli Kamiennej z Wysadu Dębina (Preliminary Assessment of the Deformation Properties of Rock Salt from the Dębina Salt Dome); Geotechnika i Budownictwo Specjalne; AGH: Krakow, Poland, 2004. (In Polish) [Google Scholar]
- Flisiak, D. Właściwości geomechaniczne skał w wysadach solnych. W: Ruch górotworu w rejonie wysadów solnych (Geomechanical properties of rocks in salt formations. In Rock Mass Movement in the Area of Salt Deposits; Kortas, R.G., Ed.; Akademia Nauk, Instytut Mechaniki Górotworu: Krakow, Poland, 2008. (In Polish) [Google Scholar]
- Tomiczek, K. O zachowaniu się skał w warunkach naprężeń rozciągających (część I) (On the behaviour of rocks under tensile stress conditions (Part I)). Budownictwo Górnicze Tunelowe 2007, 38–44. (In Polish) [Google Scholar]
- Cała, M.; Czaja, P.; Flisiak, D.; Kowalski, M. Ocena stateczności wybranych komór kopalni soli Wieliczka za pomocą modelowania numerycznego (Assessment of stability of selected chambers in the Wieliczka Salt Mine using numerical modeling). Budownictwo Górnicze Tunelowe 2010, 16. Available online: http://yadda.icm.edu.pl/baztech/element/bwmeta1.element.baztech-article-BPS1-0042-0040 (accessed on 24 May 2024).
- Flisiak, D. Przykład wykorzystania pomiarów konwergencji do określania reologicznych parametrów odkształceniowych górotworu o złożonej strukturze (Example of using convergence measurements to determine the rheological deformation parameters of a complex structured rock mass). In Proceedings of the XV Międzynarodowe Sympozjum Solne Ouo Vadis Sal, Świerardów, Poland, 13–15 October 2010. (In Polish). [Google Scholar]
- Cała, M.; Czaja, P.; Flisiak, D.; Kowalski, M. Estimation of stability of selected caverns in Wieliczka salt mine with numerical methods. Mech. Charact. Rock 2010, 2, 140–150. [Google Scholar]
- Slizowski, J.; Urbańczyk, K.; Serbin, K. Wytrzymałość doraźna i odkształcenie niszczące w laboratoryjnych badaniach soli kamiennej (Immediate strength and destructive deformation in laboratory tests of rock salt). Zesz. Nauk. 2010, 77. Available online: https://min-pan.krakow.pl/wydawnictwo/wp-content/uploads/sites/4/2017/12/slizowski-urbanczyk-serbin.pdf (accessed on 24 May 2024). (In Polish).
- Flisiak, D. (AGH University of Krakow, Krakow, Poland). Projekt Badawczy: Badanie Procesów Reologicznych W Górotworze Solnym Wywołanych Użytkowaniem Podziemnych Magazynów Gazu, 2003–2005. (Research Project: Study of Rheological Processes in Rock Salt Induced by the Operation of Underground Gas Storage Facilities. Under the Direction of Flisiak, D. Research Project). Unpublished work. (In Polish)
- Hwałek, S. Górnictwo Soli Kamiennych i Potasowych; Wydawnictwo Śląsk: Katowice, Poland, 1971. (In Polish) [Google Scholar]
- Burliga, S.; Kolonko, P.; Misiek, G.; Czapowski, G. Kłodawa salt mine. Upper Permian (zechstein) profile from basin center, salt tectonics, mineral transformations, salt mining problems. In Proceedings of the XIII International Congress on Carboniferous-Permian Guide to Excursion A3; Wyd. PIG: Warszawa, Poland, 1995; pp. 45–54. [Google Scholar]
- Mokrzycki, E.; Slizowski, K.; Saługa, P. Surowce mineralne Polski: Surowce Chemiczne: Sól Kamienna (Mineral Resources of Poland. Chemical Resources. Rock Salt); Wyd. CPP Gsmie PAN: Krakow, Poland, 1995. (In Polish) [Google Scholar]
- Rock Salt. Mineral Resources of Poland as Seen by Polish Geological Survey. Polish Geological Institute National Research Institute. Available online: https://www.pgi.gov.pl/images/muzeum/kopalnia_wiedzy/surowce/foldery/sol_kamienna.pdf (accessed on 8 May 2024).
- Kołodziejski, J. Charakterystyka rynku soli w Polsce na przykładzie Kopalni Soli “Kłodawa” S.A. (Characterisation of the salt market in Poland using the example of the “Kłodawa” Salt Mine S.A.). Mining, Informatics, Automation and Electrical Engineering. 2022, pp. 15–22. Available online: https://journals.bg.agh.edu.pl/MIAG/2022.1.549/miag.2022.1.549.15.pdf (accessed on 24 May 2024). (In Polish).
- Tarka, R. Tektonika wybranych złóż soli w Polsce na podstawie badań mezostrukturalnych (Tectonics of selected salt deposits in Poland based on mesostructural research.). Państwowy Inst. Geol. 1992, 137, 27–39. (In Polish) [Google Scholar]
- Hejmanowski, R.; Malinowska, A.A. Wykorzystanie metody odwrotnej w estymacji osiadań powierzchni terenu dla złóż soli (Utilization of inverse method in estimating surface subsidence for salt deposits). Miner. Resour. Manag. 2017, 33, 179–200. (In Polish) [Google Scholar] [CrossRef]
- Cała, M.; Tajduś, A.; Andrusikiewicz, W.; Kowalski, M.; Kolano, M.; Stopkowicz, A.; Cyran, K.; Jakóbczyk, J. Long Term Analysis of Deformations in Salt Mines: Kłodawa Salt Mine Case Study, Central Poland. Arch. Min. Sci. 2017, 62, 565–577. [Google Scholar] [CrossRef]
- Ulusay, R.; Hudson, J.A. (Eds.) . The Complete ISRM Suggested Methods for Rock Characterizations, Testing and Monitoring: 1974–2006; ISRM Turkish National Group: Ankara, Turkey, 2007; ISBN 978-975-93675-4-1. [Google Scholar]
- Klein, C.; Hurlbut, C.S.; Dana, J.D. Manual of Mineralogy; John Wiley & Sons: New York, NY, USA, 1988. [Google Scholar]
- Firme, P.A.L.P.; Roehl, D.; Romanel, C. Salt caverns history and geomechanics towards future natural gas strategic storage in Brazil. J. Nat. Gas Sci. Eng. 2019, 72, 103006. [Google Scholar] [CrossRef]
- Ge, Y.; Xie, Z.; Tang, H.; Du, B.; Cao, B. Determination of the shear failure areas of rock joints using a laser scanning technique and artificial intelligence algorithms. Eng. Geol. 2021, 293, 106320. [Google Scholar] [CrossRef]
- Leichnitz, W. Mechanical properties of rock joints. Int. J. Rock Mech. Min. Sci. Geomech. Abstr. 1985, 22, 313–321. [Google Scholar] [CrossRef]
- Bahaaddini, M.; Sharrock, G.; Hebblewhite, B.K. Numerical investigation of the effect of joint geometrical parameters on the mechanical properties of a non-persistent jointed rock mass under uniaxial compression. Comput. Geotech. 2013, 49, 206–225. [Google Scholar] [CrossRef]


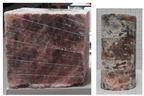
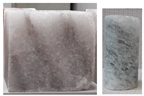
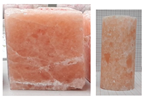
| Field 1 | ||
 | 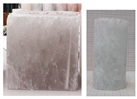 | 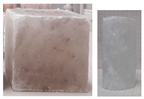 |
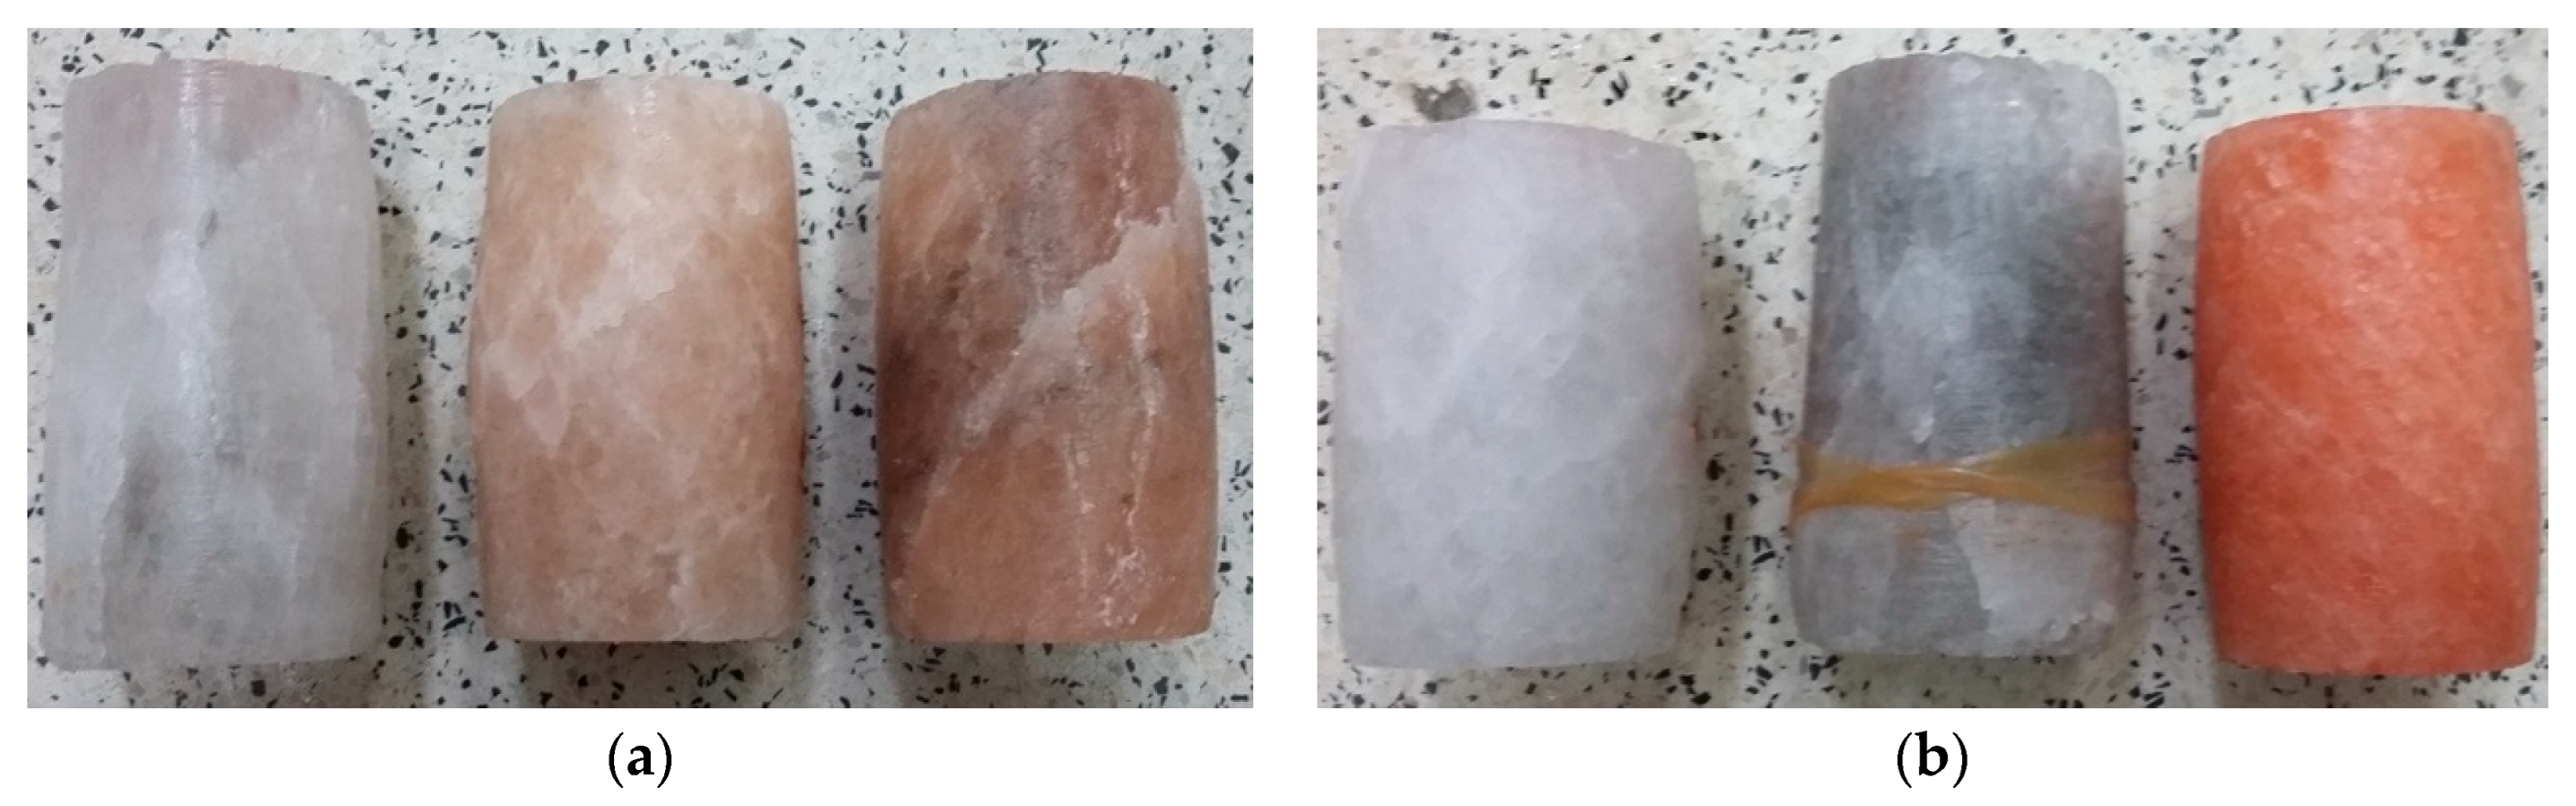
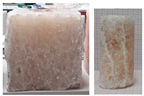
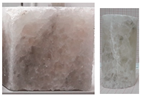
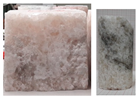
| Field 2 | ||
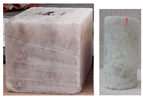 |  |  |
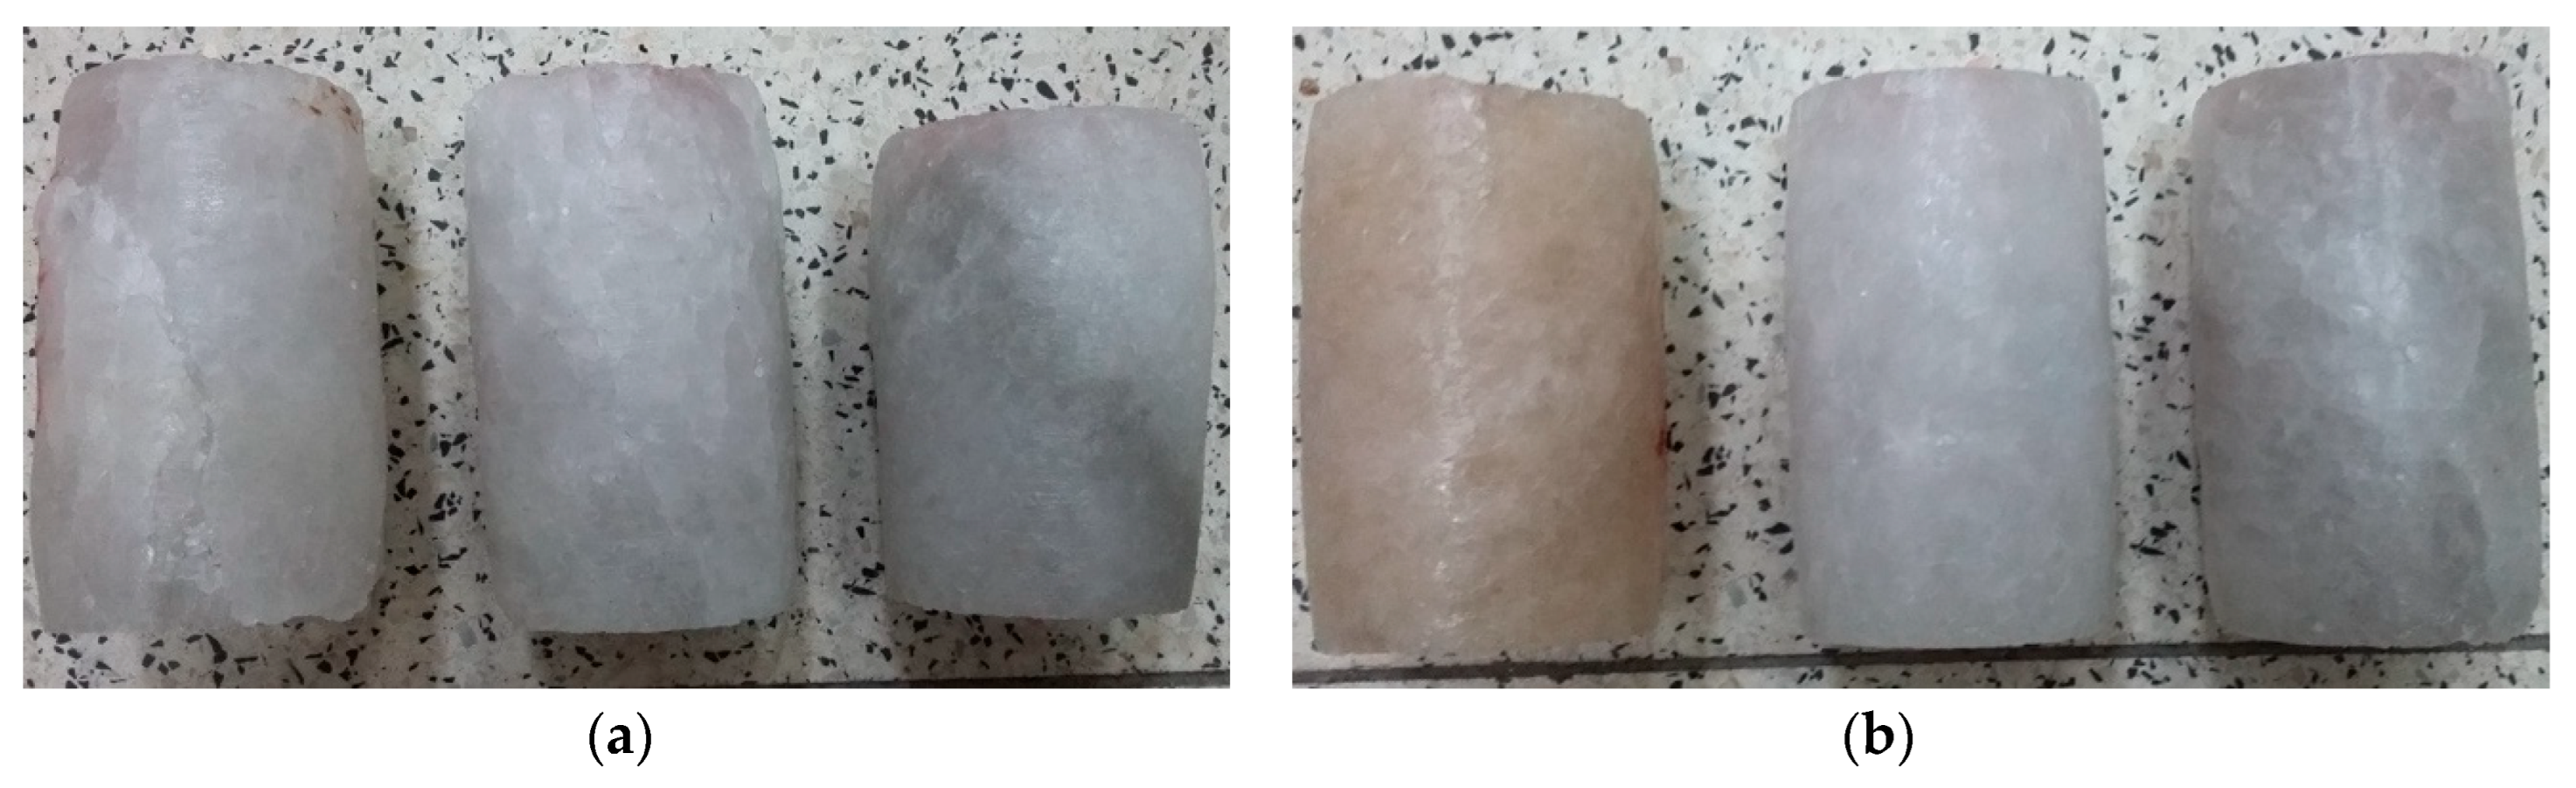
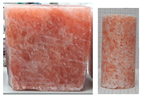
| Field 3 | ||
 |  | 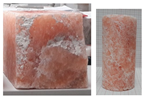 |
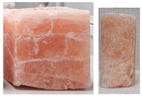
| Field 4 | ||
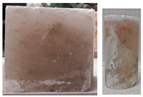 |  |  |
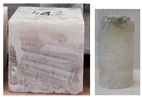
| Field 5 | ||
 |  |  |
| Field 6 | ||
 |  |  |
| Field | Type of Test 1 | Number of Samples | Height-to-Diameter Ratio [-] | ||
|---|---|---|---|---|---|
| Average | Min | Max | |||
| Field 1 | UCT | 37 | 2.01 | 1.82 | 2.05 |
| BT | 34 | 0.51 | 0.50 | 0.55 | |
| TCT | 18 | 2.02 | 2.00 | 2.03 | |
| Field 2 | UCT | 27 | 2.02 | 2.00 | 2.04 |
| BT | 16 | 0.80 | 0.49 | 1.03 | |
| TCT | 14 | 1.84 | 1.56 | 2.04 | |
| Field 3 | UCT | 40 | 2.00 | 1.56 | 2.03 |
| BT | 36 | 0.59 | 0.48 | 1.07 | |
| TCT | 24 | 2.01 | 1.95 | 2.04 | |
| Field 4 | UCT | 17 | 2.00 | 1.77 | 2.13 |
| BT | 14 | 0.71 | 0.49 | 1.07 | |
| TCT | 13 | 2.03 | 1.98 | 2.11 | |
| Field 5 | UCT | 24 | 2.02 | 1.96 | 2.07 |
| BT | 15 | 0.61 | 0.51 | 1.02 | |
| TCT | 17 | 2.02 | 1.98 | 2.05 | |
| Field 6 | UCT | 10 | 1.97 | 1.84 | 2.02 |
| BT | 5 | 0.52 | 0.51 | 0.52 | |
| TCT | 8 | 2.00 | 1.96 | 2.03 | |
| Number of Samples | Average [kg/m3] | Median [kg/m3] | Min [kg/m3] | Max [kg/m3] | Standard Dev. [kg/m3] | Coeff. of Variation [%] |
|---|---|---|---|---|---|---|
| Field 1 | ||||||
| 89 | 2095 | 2106 | 1889 | 2167 | 50 | 2.41 |
| Field 2 | ||||||
| 57 | 2079 | 2075 | 1980 | 2141 | 27 | 1.31 |
| Field 3 | ||||||
| 100 | 2091 | 2099 | 1899 | 2199 | 59 | 2.82 |
| Field 4 | ||||||
| 44 | 2087 | 2077 | 1935 | 2251 | 59 | 2.84 |
| Field 5 | ||||||
| 56 | 2081 | 2091 | 1844 | 2190 | 64 | 3.07 |
| Field 6 | ||||||
| 23 | 2119 | 2127 | 2014 | 2168 | 33 | 1.54 |
| Fields 1–6 | ||||||
| 369 | 2090 | 2093 | 1844 | 2251 | 53 | 2.55 |
| Number of Samples | Average [%] | Median [%] | Min [%] | Max [%] | Standard Dev. [%] | Coeff. of Variation [%] |
|---|---|---|---|---|---|---|
| Field 1 | ||||||
| 87 | 3.06 | 2.52 | 0.06 | 12.54 | 2.31 | 75.43 |
| Field 2 | ||||||
| 57 | 3.77 | 3.94 | 0.89 | 8.33 | 1.26 | 33.39 |
| Field 3 | ||||||
| 89 | 3.53 | 3.08 | 0.45 | 12.09 | 2.57 | 72.77 |
| Field 4 | ||||||
| 39 | 3.95 | 4.17 | 0.76 | 10.44 | 2.23 | 56.50 |
| Field 5 | ||||||
| 54 | 3.82 | 3.28 | 0.58 | 14.65 | 2.87 | 75.20 |
| Field 6 | ||||||
| 22 | 2.01 | 1.54 | 0.26 | 6.78 | 1.47 | 72.90 |
| Fields 1–6 | ||||||
| 348 | 3.45 | 3.18 | 0.06 | 14.65 | 2.33 | 67.60 |
| Number of Samples | Average [MPa] | Median [MPa] | Min [MPa] | Max [MPa] | Standard Dev. [MPa] | Coeff. of Variation [%] |
|---|---|---|---|---|---|---|
| Field 1 | ||||||
| 37 | 17.05 | 16.73 | 7.98 | 25.15 | 4.71 | 27.61 |
| Field 2 | ||||||
| 27 | 26.04 | 25.67 | 14.34 | 34.22 | 4.68 | 17.97 |
| Field 3 | ||||||
| 40 | 20.61 | 20.44 | 7.81 | 32.26 | 5.55 | 26.93 |
| Field 4 | ||||||
| 17 | 20.86 | 20.47 | 11.11 | 27.23 | 4.46 | 21.39 |
| Field 5 | ||||||
| 24 | 19.31 | 20.10 | 11.86 | 26.58 | 4.53 | 23.45 |
| Field 6 | ||||||
| 10 | 20.16 | 22.03 | 12.04 | 23.47 | 3.43 | 17.02 |
| Fields 1–6 | ||||||
| 155 | 20.50 | 20.55 | 7.81 | 34.22 | 5.62 | 27.42 |
| Number of Samples | Average [MPa] | Median [MPa] | Min [MPa] | Max [MPa] | Standard Dev. [MPa] | Coeff. of Variation [%] |
|---|---|---|---|---|---|---|
| Field 1 | ||||||
| 37 | 2227 | 2032 | 414 | 4257 | 992.23 | 44.55 |
| Field 2 | ||||||
| 27 | 2150 | 1930 | 1240 | 3978 | 750.79 | 34.92 |
| Field 3 | ||||||
| 40 | 2454 | 2133 | 859 | 4923 | 1039.34 | 42.35 |
| Field 4 | ||||||
| 17 | 1546 | 1531 | 971 | 2736 | 411.28 | 26.60 |
| Field 5 | ||||||
| 24 | 2396 | 2190 | 1615 | 4120 | 732.85 | 30.58 |
| Field 6 | ||||||
| 10 | 2745 | 2436 | 1535 | 4866 | 1124.00 | 40.95 |
| Fields 1–6 | ||||||
| 155 | 2326 | 2123 | 414 | 4923 | 979.81 | 42.12 |
| Number of Samples | Average [-] | Median [-] | Min [-] | Max [-] | Standard Dev. [-] | Coeff. of Variation [%] |
|---|---|---|---|---|---|---|
| Field 1 | ||||||
| 37 | 0.28 | 0.29 | 0.04 | 0.44 | 0.10 | 34.67 |
| Field 2 | ||||||
| 27 | 0.30 | 0.31 | 0.16 | 0.42 | 0.07 | 23.78 |
| Field 3 | ||||||
| 40 | 0.27 | 0.29 | 0.08 | 0.49 | 0.09 | 34.66 |
| Field 4 | ||||||
| 17 | 0.26 | 0.23 | 0.06 | 0.48 | 0.12 | 46.52 |
| Field 5 | ||||||
| 24 | 0.33 | 0.34 | 0.16 | 0.47 | 0.10 | 29.42 |
| Field 6 | ||||||
| 10 | 0.34 | 0.33 | 0.22 | 0.48 | 0.08 | 23.30 |
| Fields 1–6 | ||||||
| 155 | 0.29 | 0.29 | 0.04 | 0.49 | 0.10 | 33.60 |
| Number of Samples | Equation | R-Square | Standard Error |
|---|---|---|---|
| Field 1 | |||
| 37 | E = 6.55213٠UCS2 | 0.38995 | 0.36606 |
| Field 2 | |||
| 27 | E = 2.79638٠UCS2 | −0.65720 | 0.25702 |
| Field 3 | |||
| 40 | E = 4.69291٠UCS2 | −0.31149 | 0.37505 |
| Field 4 | |||
| 17 | E = 3.06393٠UCS2 | −0.87374 | 0.28790 |
| Field 5 | |||
| 24 | E = 5.40696٠UCS2 | −0.59085 | 0.44740 |
| Field 6 | |||
| 10 | E = 6.25274٠UCS2 | −0.0653 | 0.88573 |
| Fields 1–6 | |||
| 155 | E = 4.19968٠UCS2 | −0.61186 | 0.18895 |
| Height-to-Diameter Ratio [-] | Number of Samples | Average [MPa] | Median [MPa] | Min [MPa] | Max [MPa] | Standard Dev. [MPa] | Coeff. of Variation [%] |
|---|---|---|---|---|---|---|---|
| Field 1 | |||||||
| 0.51 | 34 | 1.06 | 0.99 | 0.61 | 1.80 | 0.25 | 23.63 |
| Field 2 | |||||||
| 0.51 | 7 | 1.17 | 1.19 | 0.79 | 1.84 | 0.34 | 29.43 |
| 1.02 | 9 | 1.75 | 1.78 | 1.14 | 2.52 | 0.44 | 25.3 |
| Field 3 | |||||||
| 0.51 | 31 | 1.07 | 1.10 | 0.53 | 1.79 | 0.32 | 30.21 |
| 1.05 | 5 | 2.64 | 2.59 | 2.50 | 2.86 | 0.12 | 4.67 |
| Field 4 | |||||||
| 0.51 | 8 | 1.52 | 1.51 | 1.18 | 2.19 | 0.30 | 19.43 |
| 0.99 | 6 | 1.47 | 1.52 | 1.17 | 1.69 | 0.19 | 13.24 |
| Field 5 | |||||||
| 0.51 | 12 | 1.04 | 0.94 | 0.66 | 1.92 | 0.33 | 31.47 |
| 1.01 | 3 | 2.72 | 2.53 | 2.52 | 3.10 | - | - |
| Field 6 | |||||||
| 0.51 | 5 | 1.34 | 1.31 | 0.93 | 1.79 | 0.33 | 24.92 |
| Fields 1–6 (2–5) | |||||||
| 0.51 | 97 | 1.12 | 1.05 | 0.53 | 2.19 | 0.33 | 29.49 |
| 1.02 | 23 | 2.02 | 1.92 | 1.14 | 3.10 | 0.60 | 29.68 |
| Number of Samples | Equation | Pearson’s r | R-Square |
|---|---|---|---|
| Field 1 | |||
| 34 | σt = 0.00230718·ρ − 3.70222 | 0.53117 | 0.2597 |
| Field 2 | |||
| 7 | σt = 0.00363454·ρ − 6.38697 | 0.49255 | 0.09112 |
| Field 3 | |||
| 31 | σt = 0.00270609·ρ − 4.49716 | 0.66000 | 0.41614 |
| Field 4 | |||
| 8 | σt = −0.00301262·ρ + 7.92826 | −0.23861 | −0.10024 |
| Field 5 | |||
| 12 | σt = 0.00259767·ρ − 4.1447 | 0.60291 | 0.29985 |
| Field 6 | |||
| 5 | σt = 0.0135688·ρ − 27.2324 | 0.94963 | 0.86907 |
| Fields 1–6 | |||
| 97 | σt = 0.0027697·ρ − 4.5892 | 0.59952 | 0.35268 |
| Number of Samples | Equation | Pearson’s r | R-Square |
|---|---|---|---|
| Field 1 | |||
| 18 | (σ1 − σ3)/2 = ((σ1 + σ3)/2)·0.621446 + 1.66151 | 0.95353 | 0.90224 |
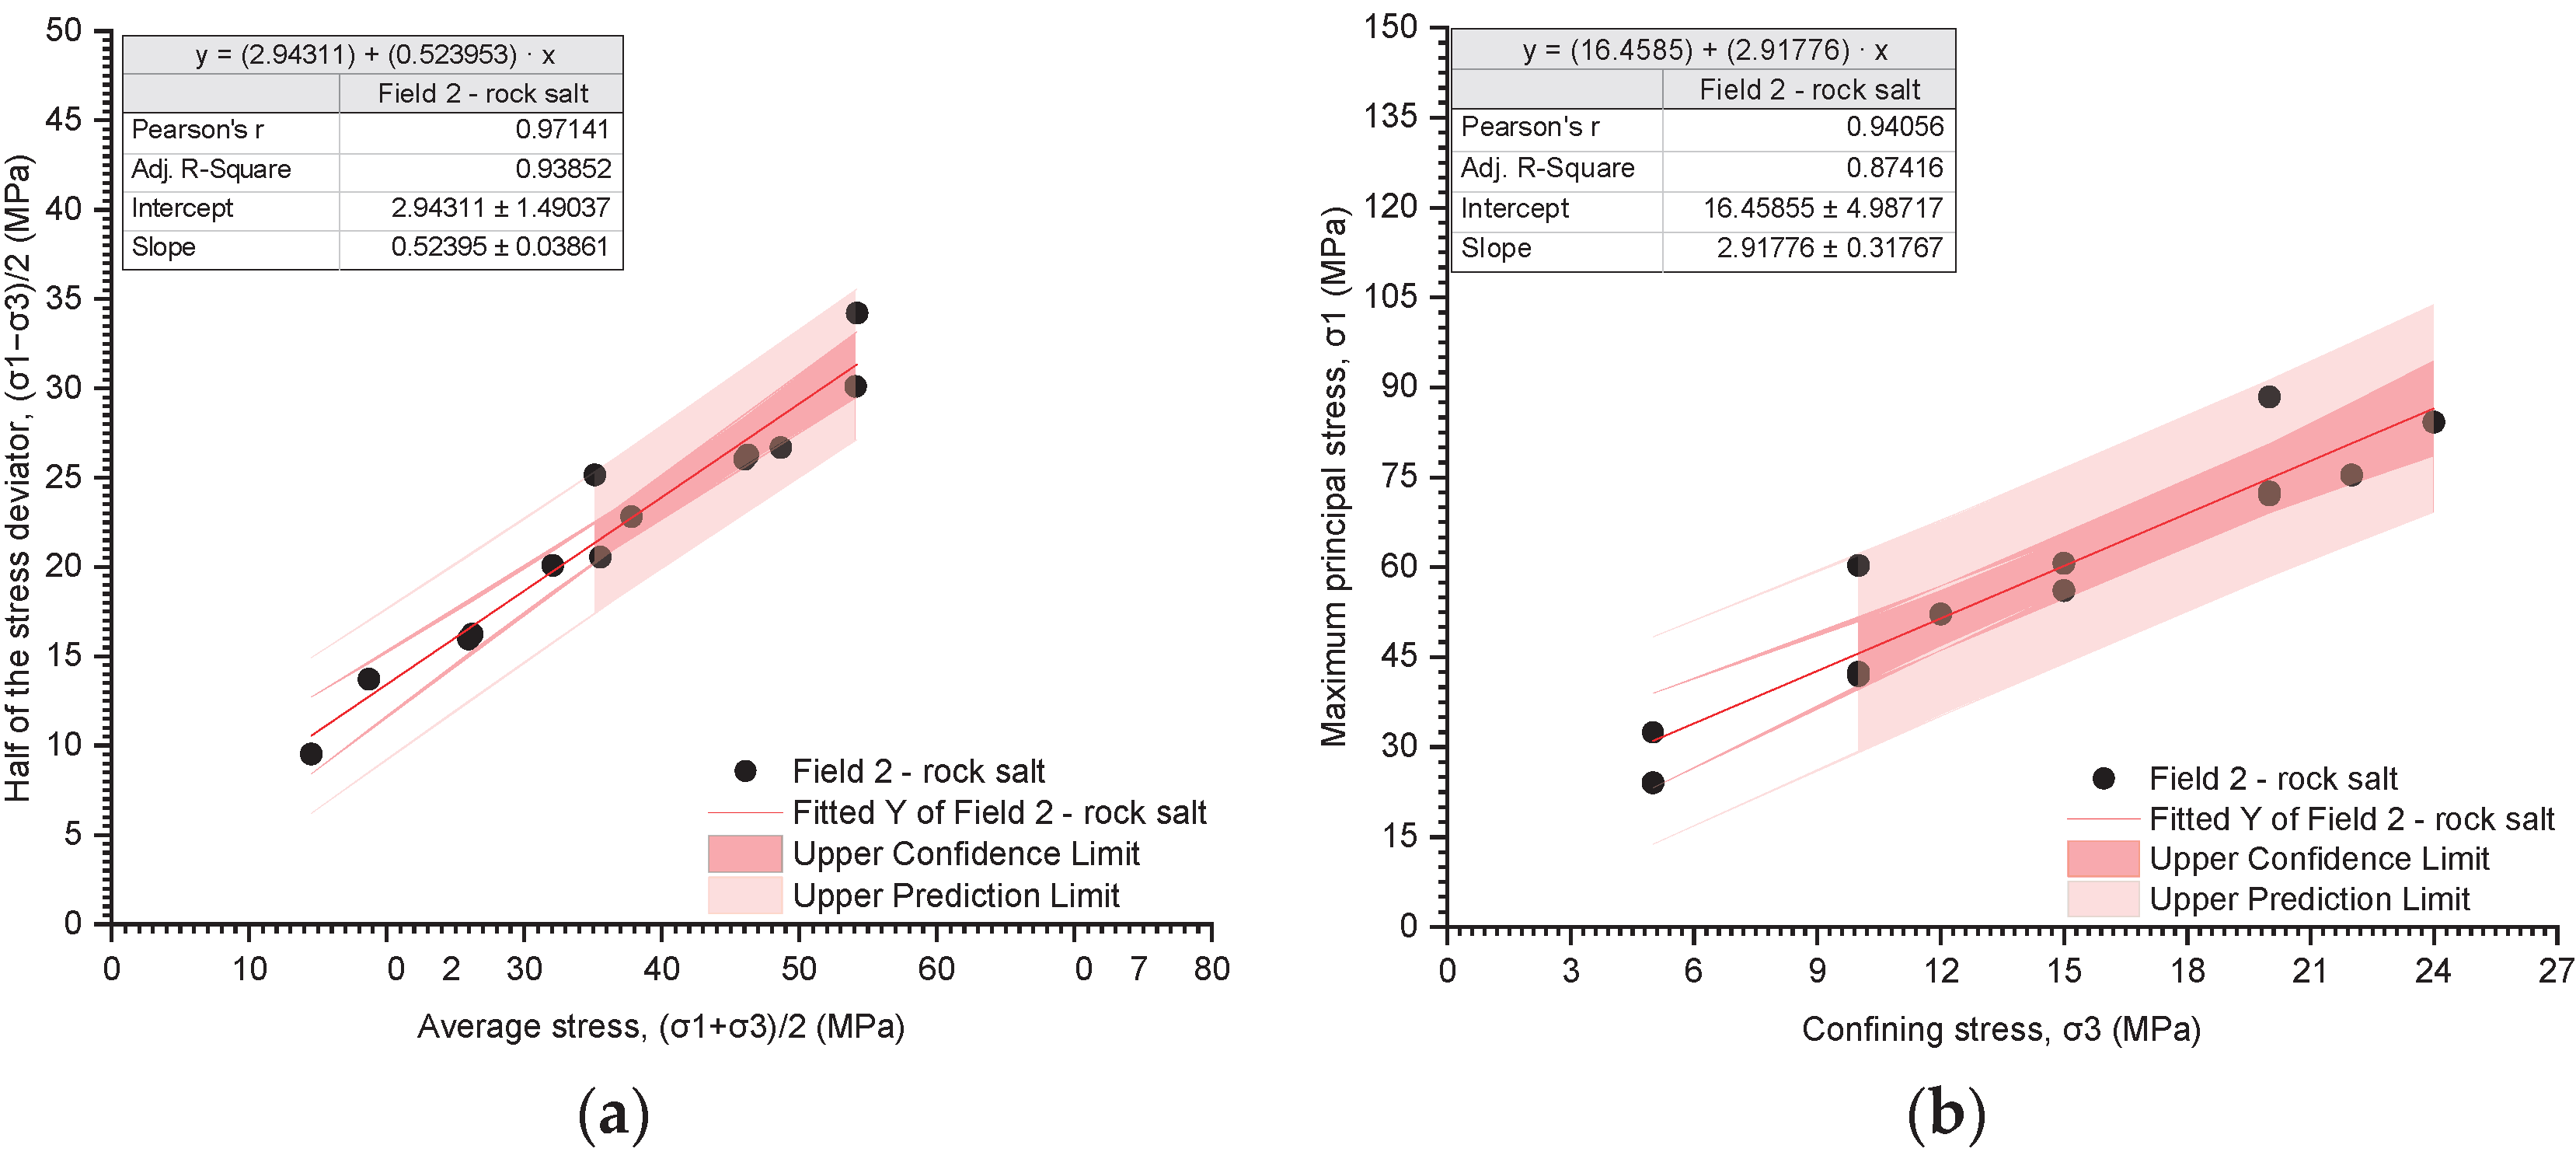
| Field 2 | |||
| 14 | (σ1 − σ3)/2 = ((σ1 + σ3)/2)·0.523953 + 2.94311 | 0.97141 | 0.93852 |
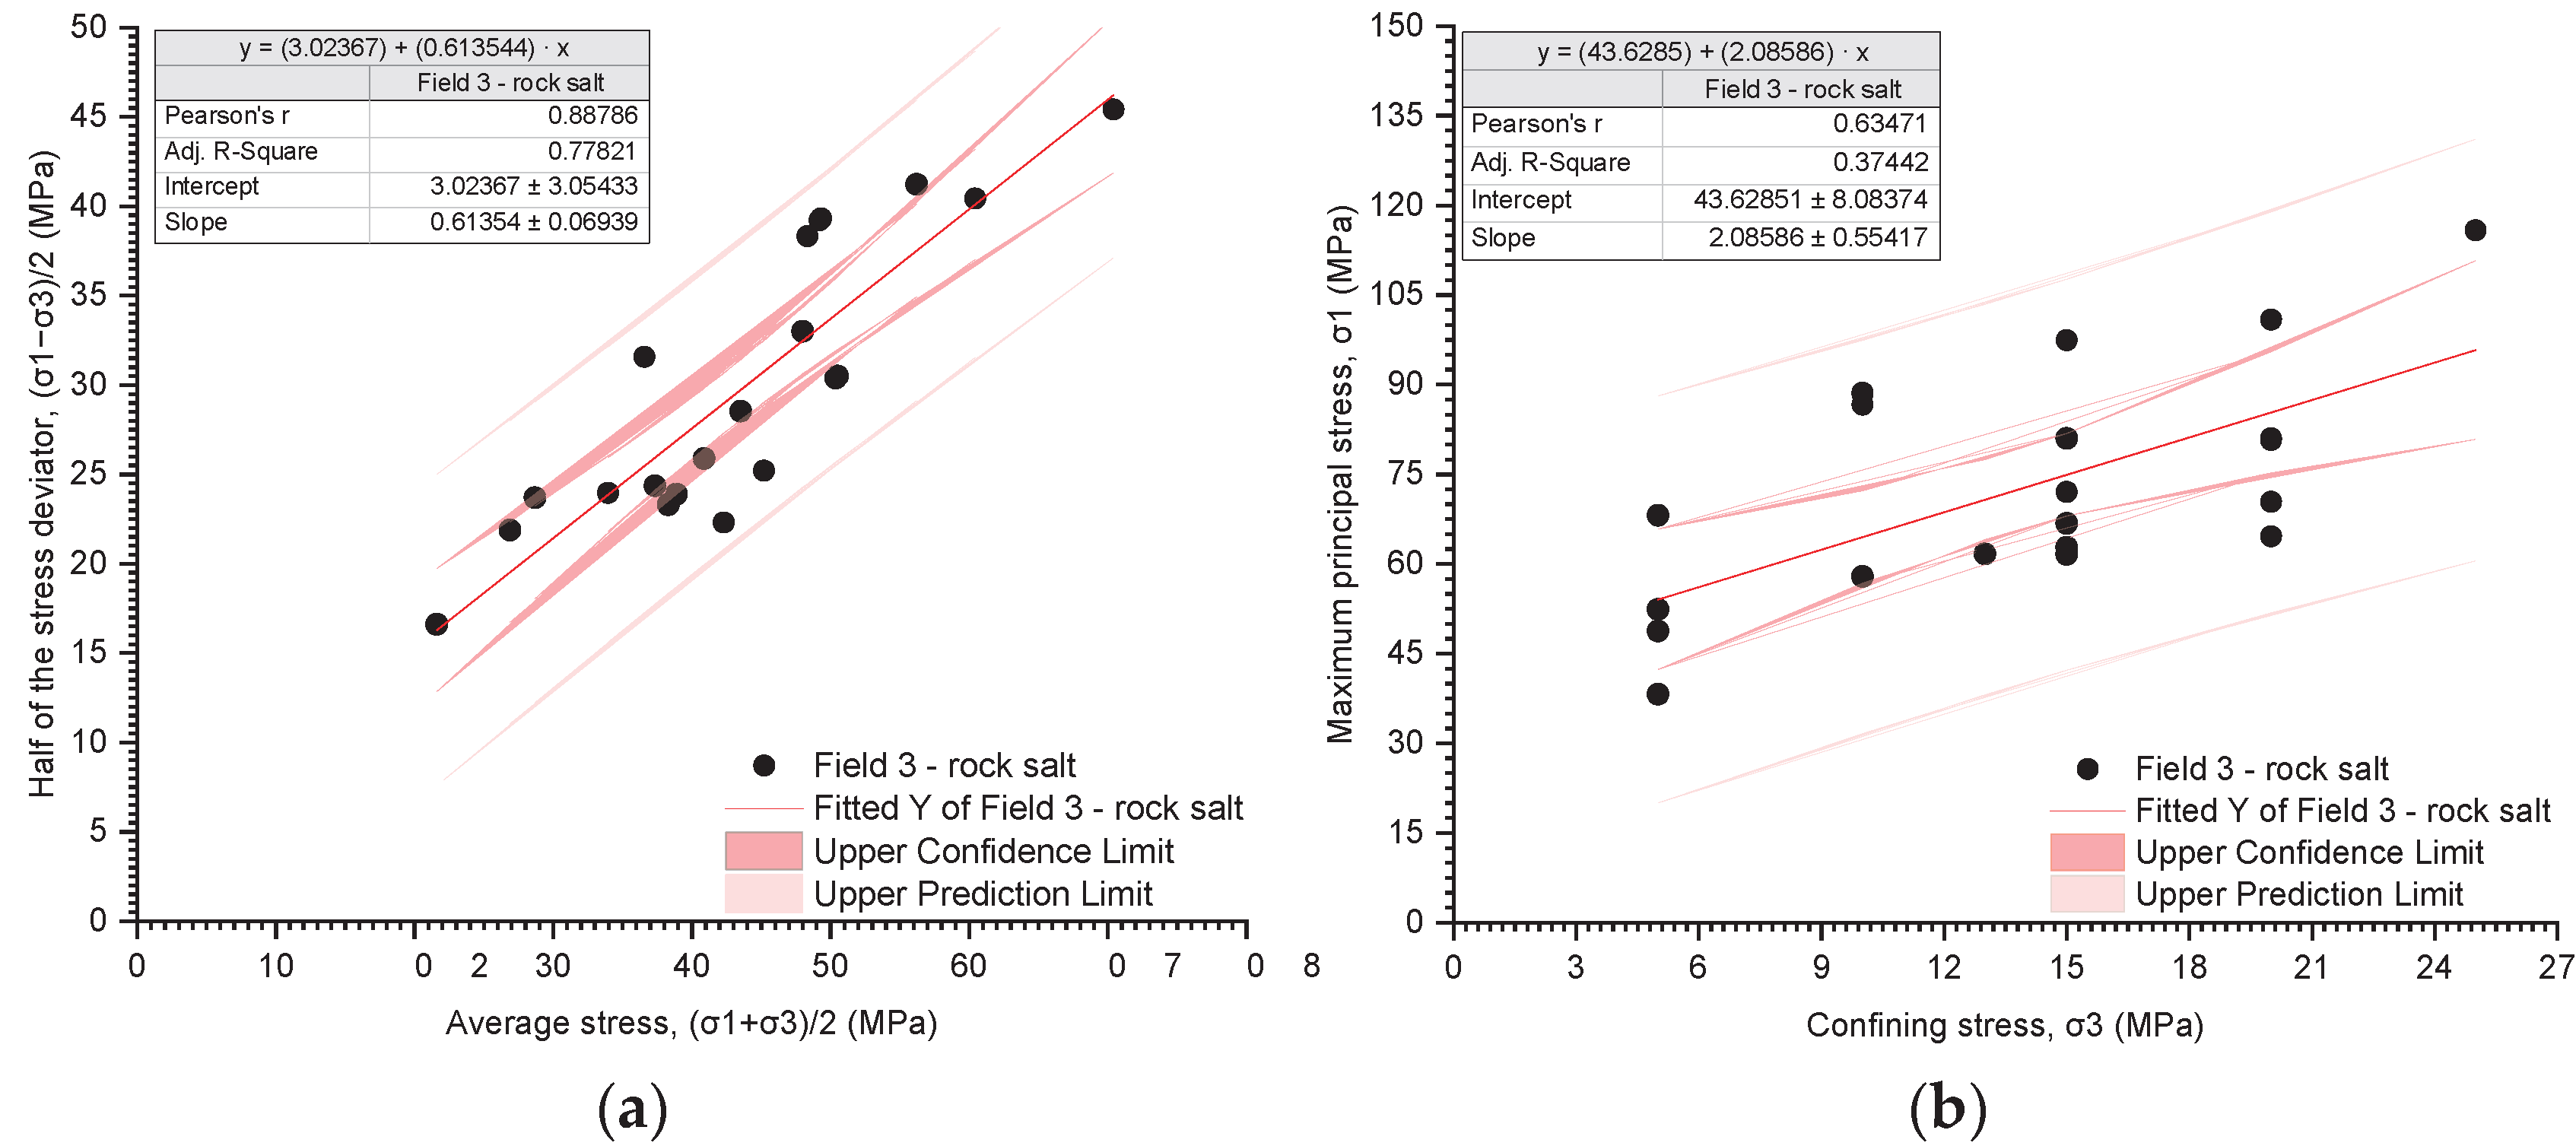
| Field 3 | |||
| 24 | (σ1 − σ3)/2 = ((σ1 + σ3)/2)·0.613544 + 3.02367 | 0.88786 | 0.77821 |
| Field 4 | |||
| 13 | (σ1 − σ3)/2 = ((σ1 + σ3)/2)·0.60719 + 4.02833 | 0.92837 | 0.84931 |
| Field 5 | |||
| 17 | (σ1 − σ3)/2 = ((σ1 + σ3)/2)·0.600203 + 1.90923 | 0.91476 | 0.82590 |
| Field 6 | |||
| 8 | (σ1 − σ3)/2 = ((σ1 + σ3)/2)·0.576689 + 4.66864 | 0.93622 | 0.85888 |
| Fields 1–6 | |||
| 94 | (σ1 − σ3)/2 = ((σ1 + σ3)/2)·0.610676 + 2.28335 | 0.91788 | 0.84071 |
| Number of Samples | Equation | Pearson’s r | R-Square |
|---|---|---|---|
| Field 1 | |||
| 18 | σ1 = σ3·3.16264 + 22.223 | 0.82581 | 0.65749 |
| Field 2 | |||
| 14 | σ1 = σ3·2.91776 + 16.4585 | 0.94056 | 0.85416 |
| Field 3 | |||
| 24 | σ1 = σ3·2.08586 + 43.6285 | 0.63471 | 0.37442 |
| Field 4 | |||
| 13 | σ1 = σ3·2.68215 + 37.3136 | 0.76213 | 0.54274 |
| Field 5 | |||
| 17 | σ1 = σ3·2.47493 + 30.4871 | 0.73187 | 0.50467 |
| Field 6 | |||
| 8 | σ1 = σ3·2.74518 + 34.6821 | 0.82007 | 0.62574 |
| Fields 1–6 | |||
| 94 | σ1 = σ3·2.51861 + 32.9488 | 0.72585 | 0.52148 |
| Origin of Samples | Number of Samples | Regression Analysis | Cohesion c [MPa] | Internal Friction Angle ɸ [°] |
|---|---|---|---|---|
| Field 1 | 18 | Stress path, Pearson’s r = 0.95353 | 2.12 | 38.42 |
| Critical state, Pearson’s r = 0.82581 | 6.25 | 31.30 | ||
| Field 2 | 14 | Stress path, Pearson’s r = 0.97141 | 3.46 | 31.60 |
| Critical state, Pearson’s r = 0.94056 | 4.81 | 29.31 | ||
| Field 3 | 24 | Stress path, Pearson’s r = 0.88786 | 3.83 | 37.85 |
| Critical state, Pearson’s r = 0.63471 | 15.10 | 20.60 | ||
| Field 4 | 13 | Stress path Pearson’s r = 0.92837 | 5.07 | 37.39 |
| Critical state, Pearson’s r = 0.76213 | 11.39 | 27.18 | ||
| Field 5 | 17 | Stress path, Pearson’s r = 0.91476 | 2.39 | 36.88 |
| Critical state, Pearson’s r = 0.73187 | 9.69 | 25.12 | ||
| Field 6 | 8 | Stress path, Pearson’s r = 0.93622 | 5.72 | 35.22 |
| Critical state, Pearson’s r = 0.82007 | 10.47 | 27.77 | ||
| Fields 1–6 | 94 | Stress path, Pearson’s r = 0.91788 | 2.88 | 37.64 |
| Critical state, Pearson’s r = 0.72585 | 10.38 | 25.57 |
| Bulk Density [kg/m3] | Porosity [-] | UCS [MPa] | E [MPa] | ν [-] | TS [MPa] | c [MPa]/ɸ [°] |
|---|---|---|---|---|---|---|
| Field 1 | ||||||
| 2095 | 3.06 | 17.05 | 2227 | 0.28 | 1.06 | 2.12/38.42 |
| Field 2 | ||||||
| 2079 | 3.77 | 26.04 | 2150 | 0.30 | 1.17 | 3.46/31.60 |
| Field 3 | ||||||
| 2091 | 3.53 | 20.61 | 2454 | 0.27 | 1.07 | 3.83/37.85 |
| Field 4 | ||||||
| 2087 | 3.95 | 20.86 | 1546 | 0.26 | 1.52 | 5.07/37.39 |
| Field 5 | ||||||
| 2081 | 3.82 | 19.3 | 2396 | 0.33 | 1.04 | 2.39/36.88 |
| Field 6 | ||||||
| 2119 | 2.01 | 20.16 | 2745 | 0.34 | 1.34 | 5.72/35.22 |
| Fields 1–6 | ||||||
| 2090 | 3.45 | 20.50 | 2326 | 0.29 | 1.12 | 2.88/37.64 |
| —Low variation | —Average variation | —Strength variation | ||||
Disclaimer/Publisher’s Note: The statements, opinions and data contained in all publications are solely those of the individual author(s) and contributor(s) and not of MDPI and/or the editor(s). MDPI and/or the editor(s) disclaim responsibility for any injury to people or property resulting from any ideas, methods, instructions or products referred to in the content. |
© 2024 by the authors. Licensee MDPI, Basel, Switzerland. This article is an open access article distributed under the terms and conditions of the Creative Commons Attribution (CC BY) license (https://creativecommons.org/licenses/by/4.0/).
Share and Cite
Kolano, M.; Cała, M.; Stopkowicz, A. Mechanical Properties of Rock Salt from the Kłodawa Salt Dome—A Statistical Analysis of Geomechanical Data. Materials 2024, 17, 3564. https://doi.org/10.3390/ma17143564
Kolano M, Cała M, Stopkowicz A. Mechanical Properties of Rock Salt from the Kłodawa Salt Dome—A Statistical Analysis of Geomechanical Data. Materials. 2024; 17(14):3564. https://doi.org/10.3390/ma17143564
Chicago/Turabian StyleKolano, Malwina, Marek Cała, and Agnieszka Stopkowicz. 2024. "Mechanical Properties of Rock Salt from the Kłodawa Salt Dome—A Statistical Analysis of Geomechanical Data" Materials 17, no. 14: 3564. https://doi.org/10.3390/ma17143564
APA StyleKolano, M., Cała, M., & Stopkowicz, A. (2024). Mechanical Properties of Rock Salt from the Kłodawa Salt Dome—A Statistical Analysis of Geomechanical Data. Materials, 17(14), 3564. https://doi.org/10.3390/ma17143564