
Seismic Performance of a Single-Story Timber-Framed Masonry Structure Strengthened with Fiber-Reinforced Cement Mortar
Abstract
:1. Introduction
2. Experiment Program
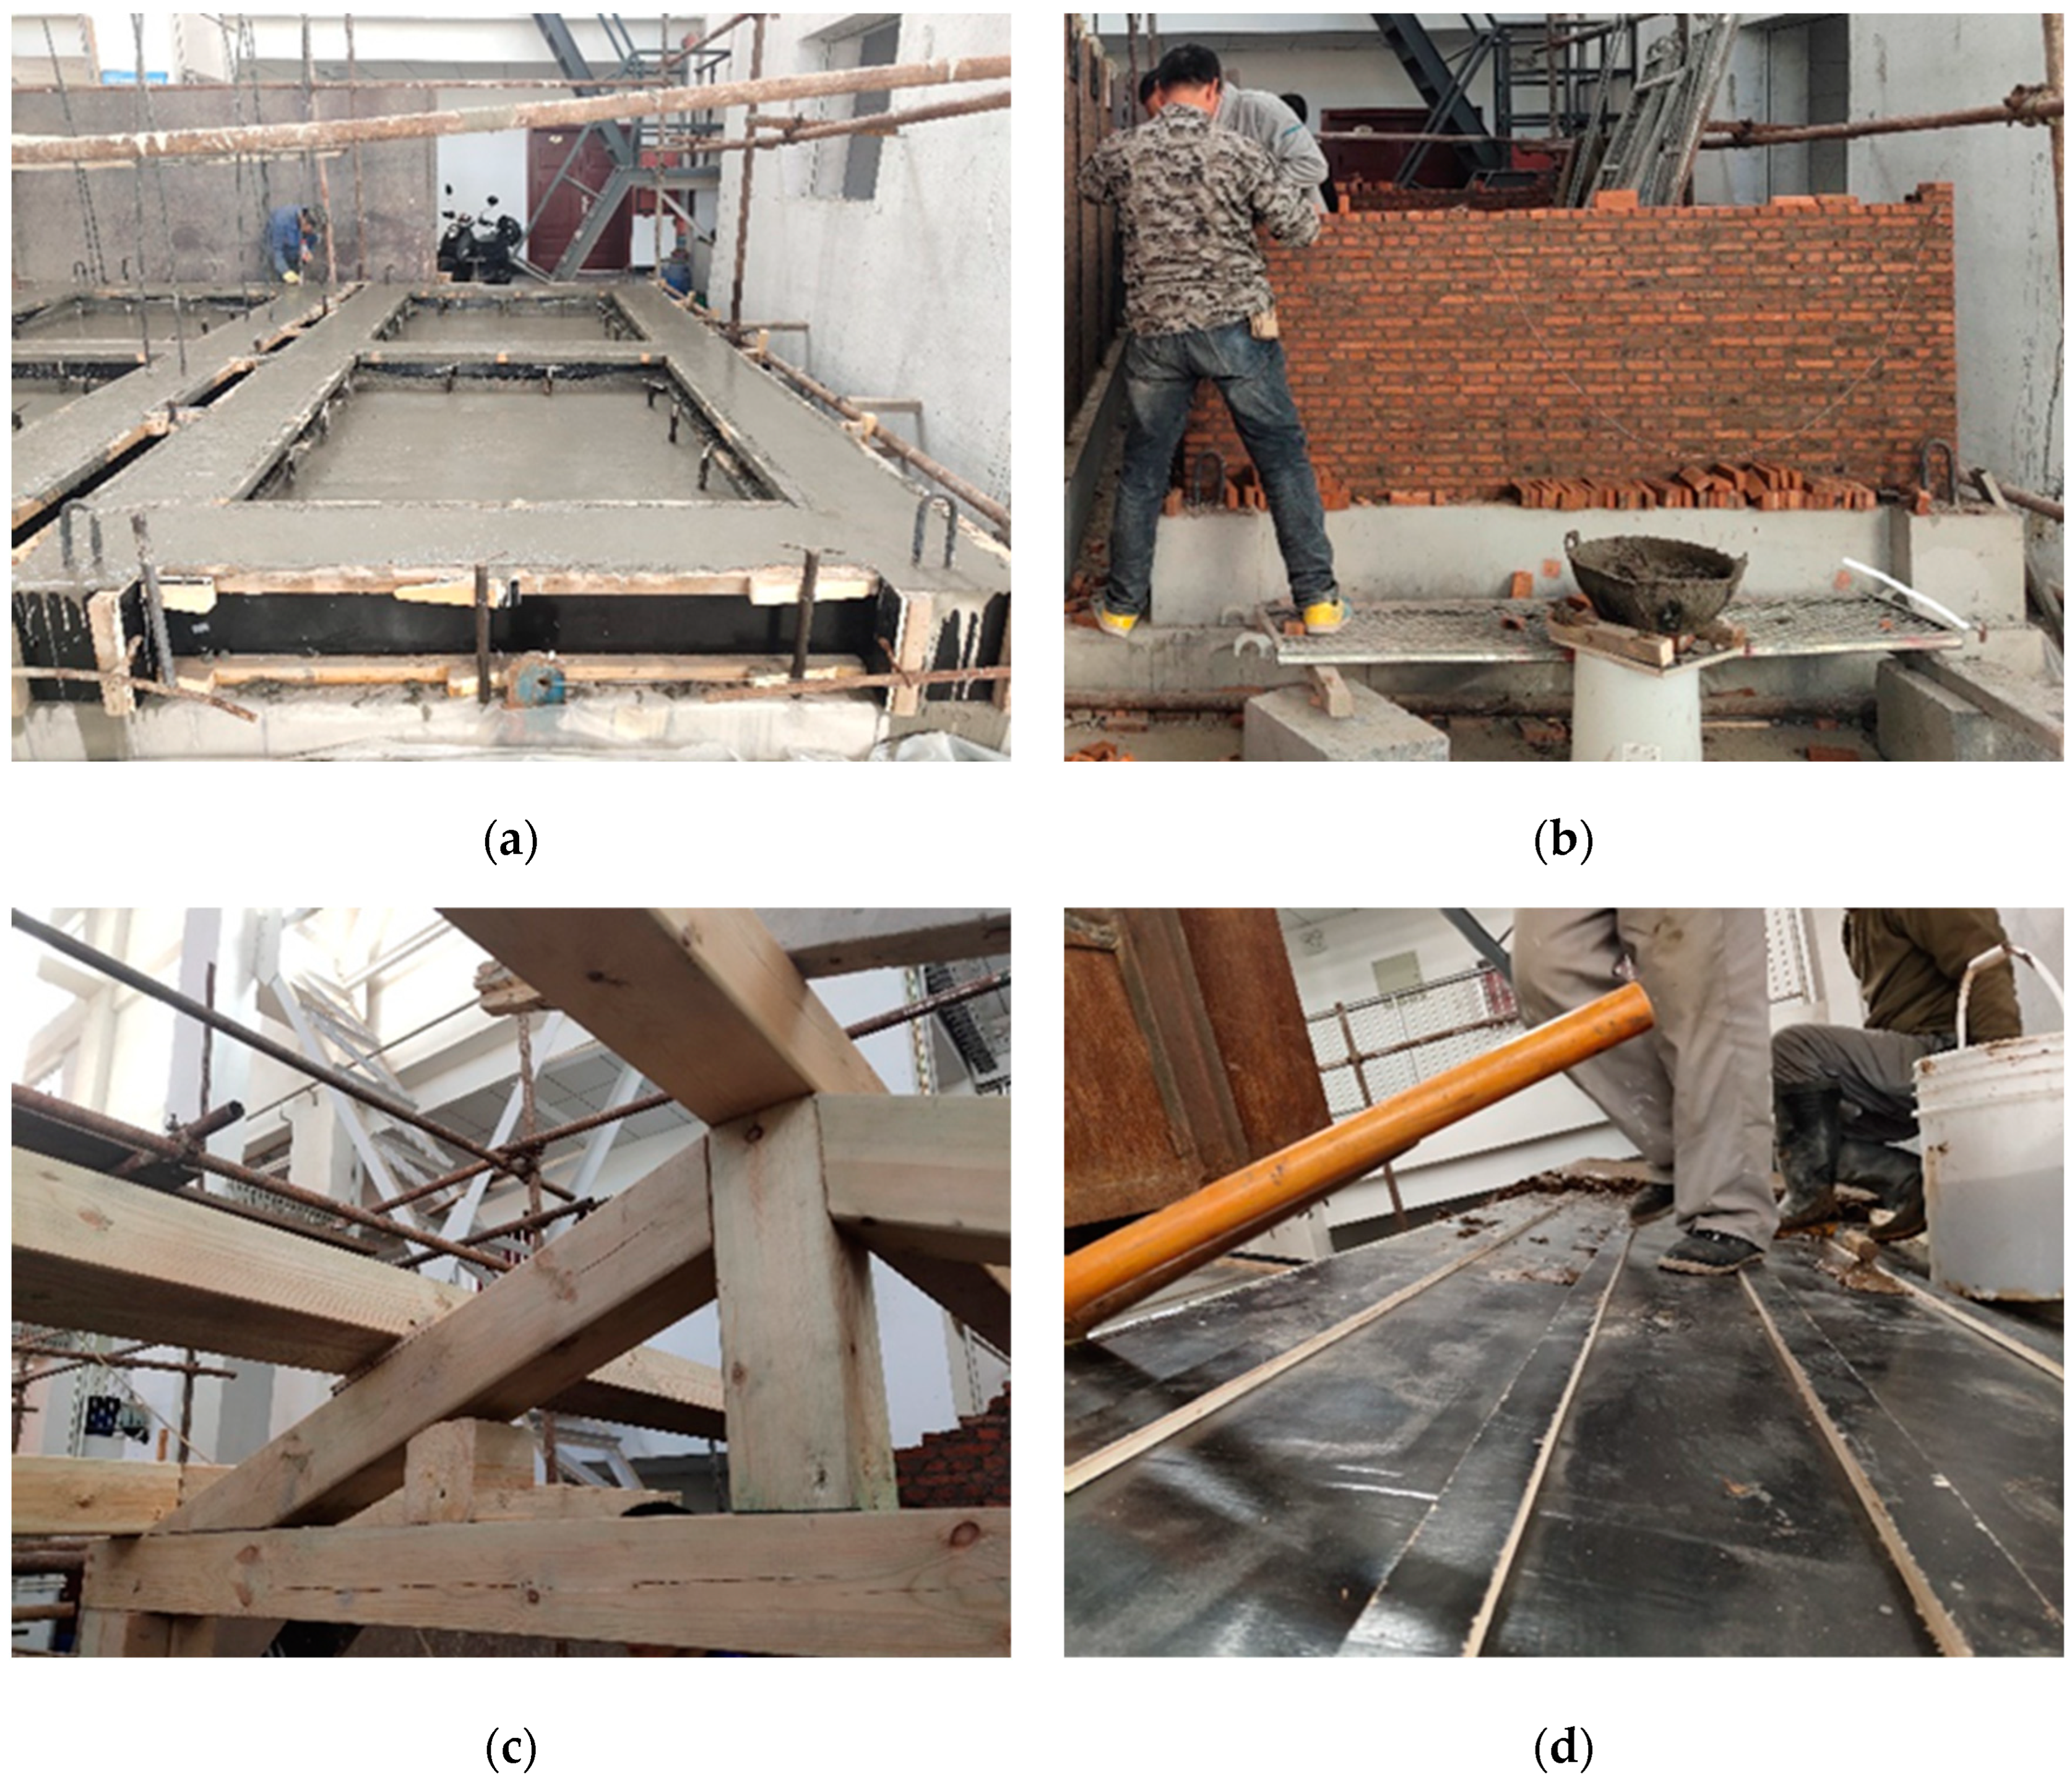
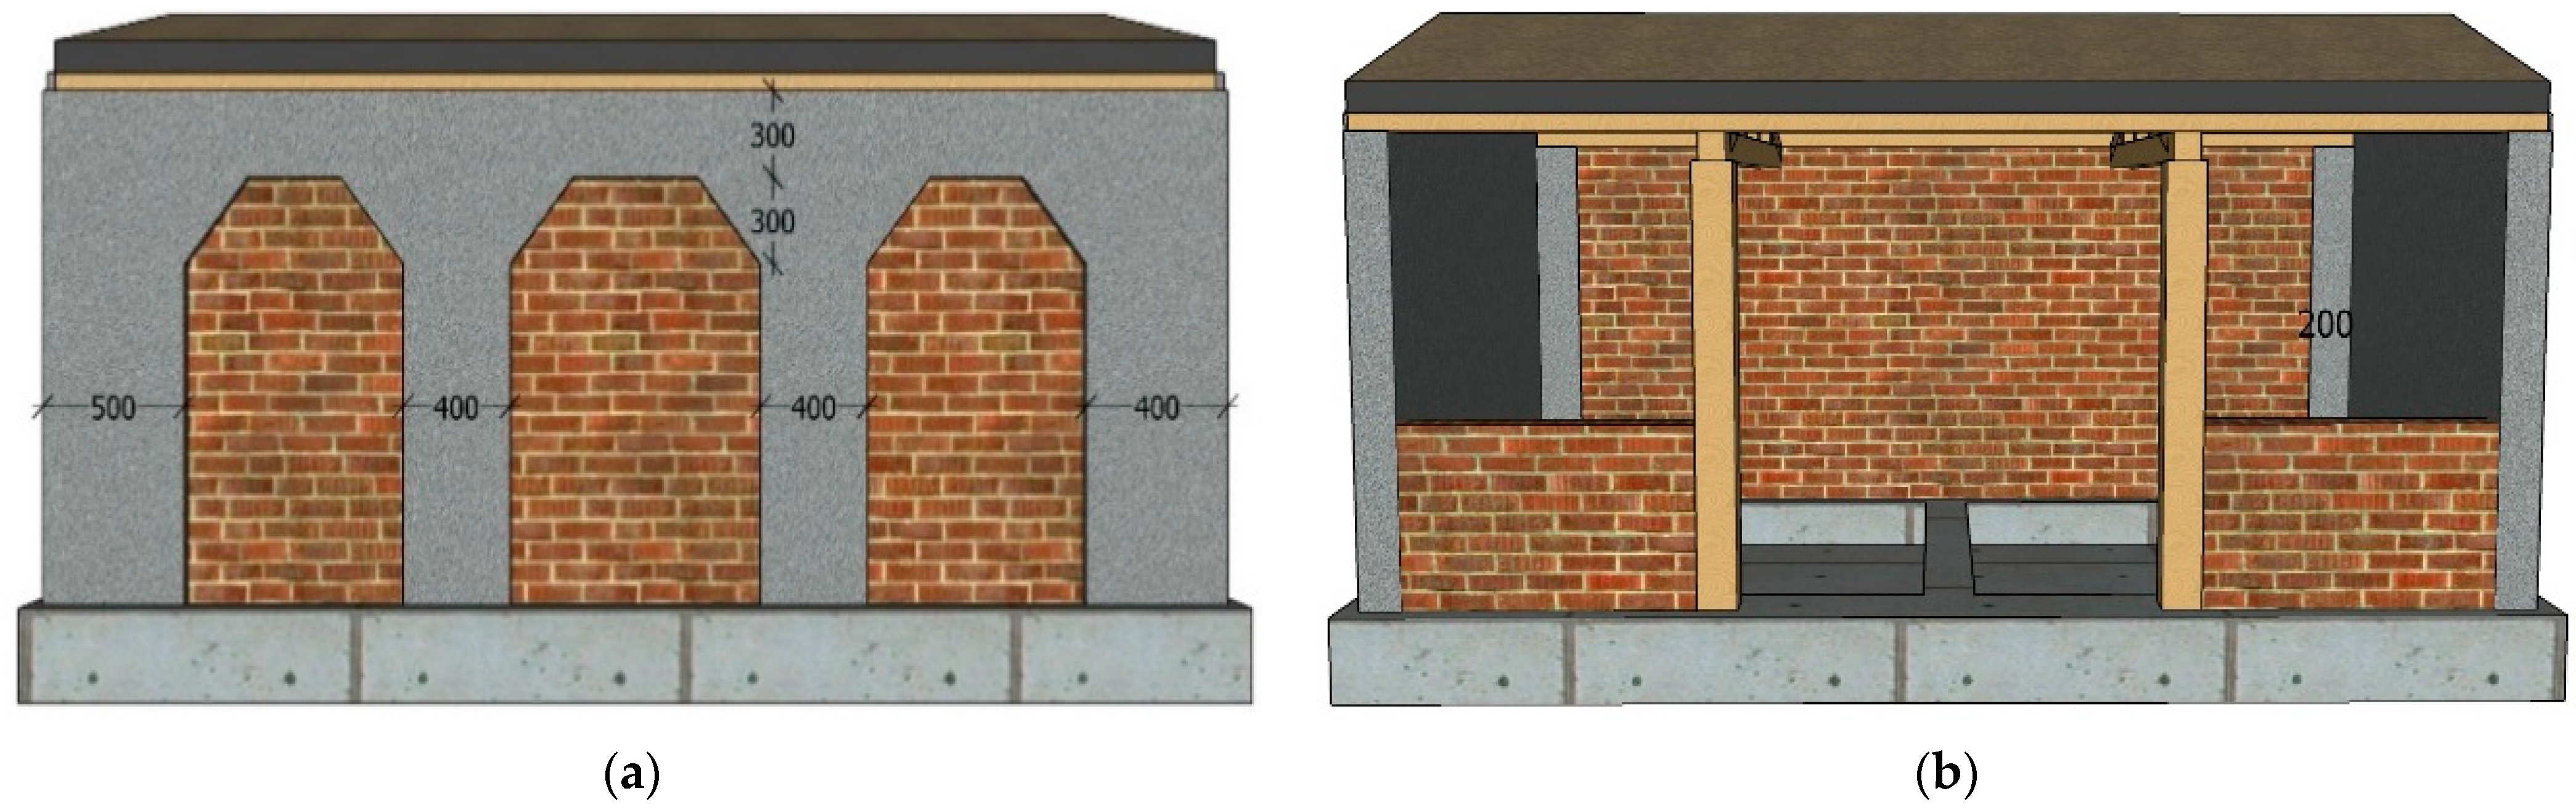
2.1. The Design and Fabrication of Specimens
2.2. Material Properties
2.2.1. Bricks
2.2.2. Masonry Mortar
2.2.3. Wood
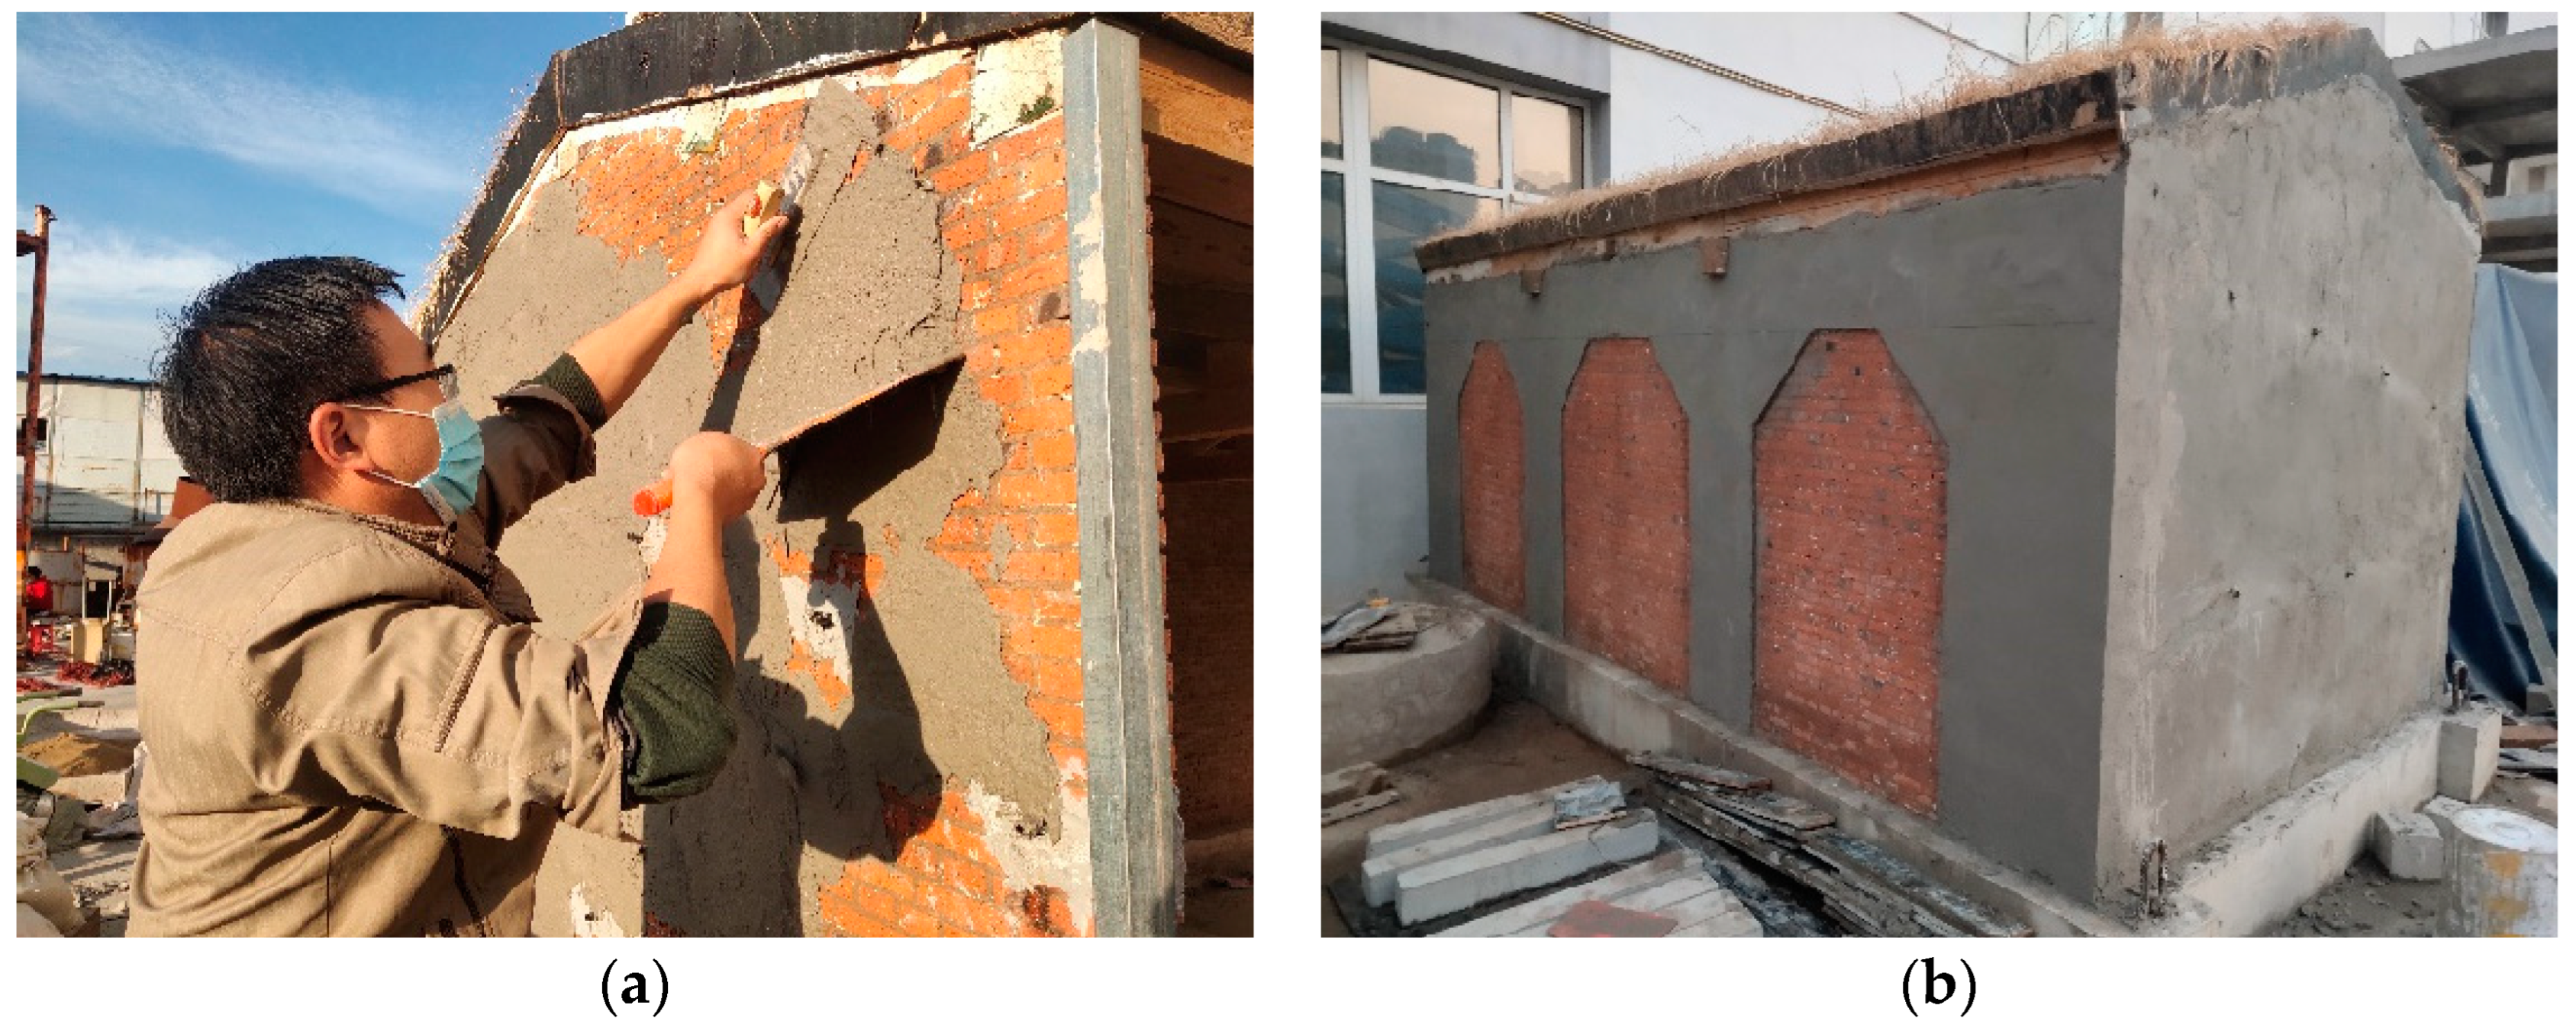
2.2.4. FRCM
2.3. Similarity Relation
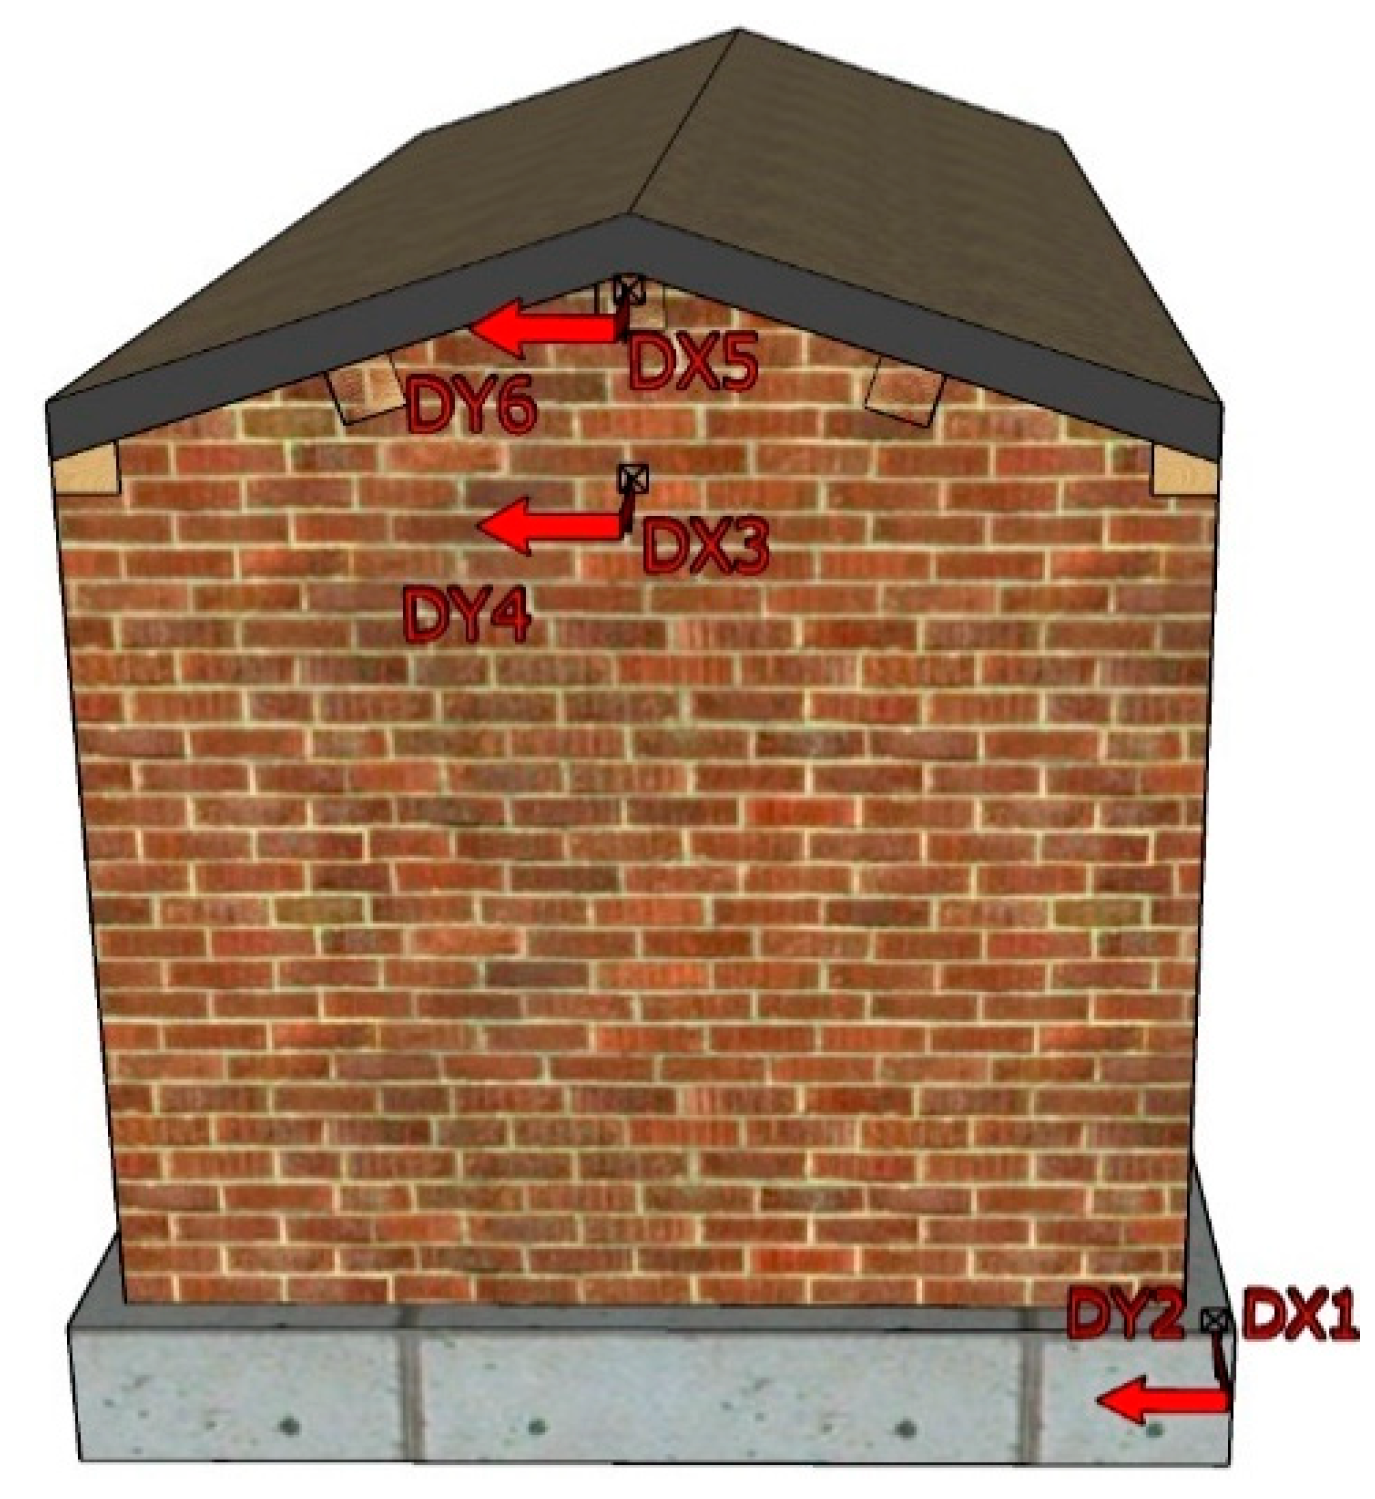
2.4. Instrumentation and Measurement
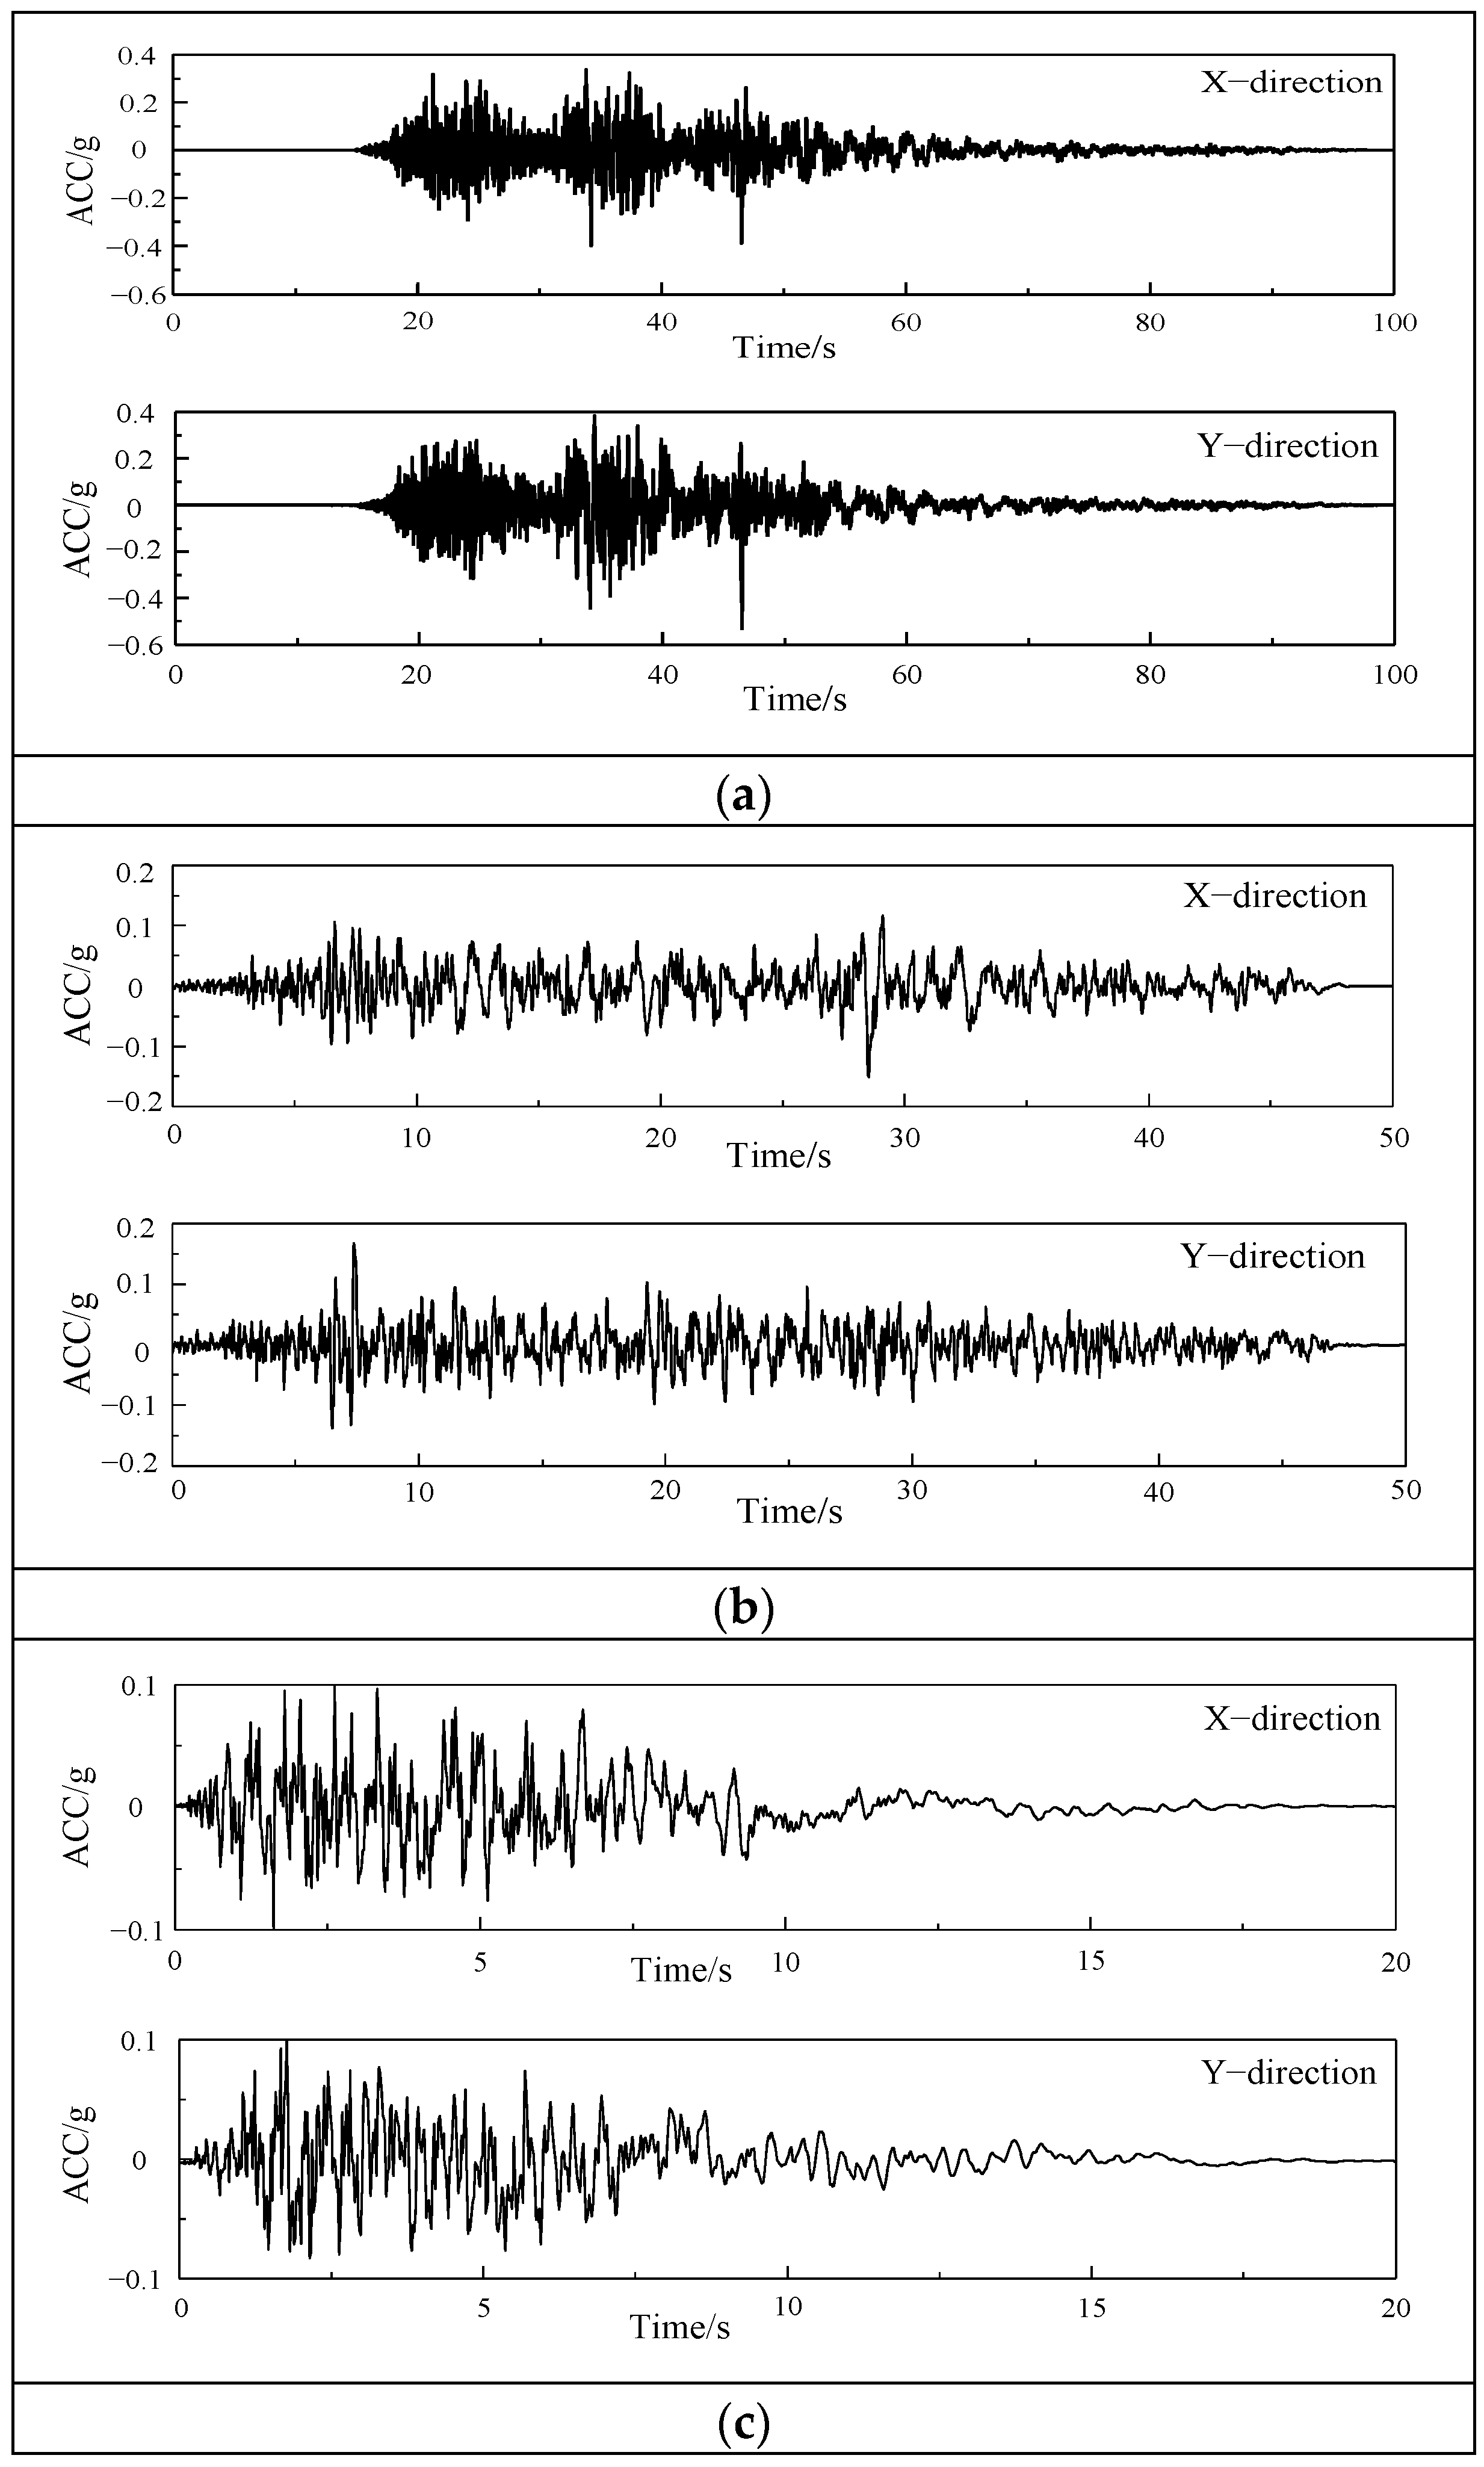
2.5. Acceleration Time History Curves
2.6. Test Program
3. Test Result Analysis
3.1. Experimental Phenomenon
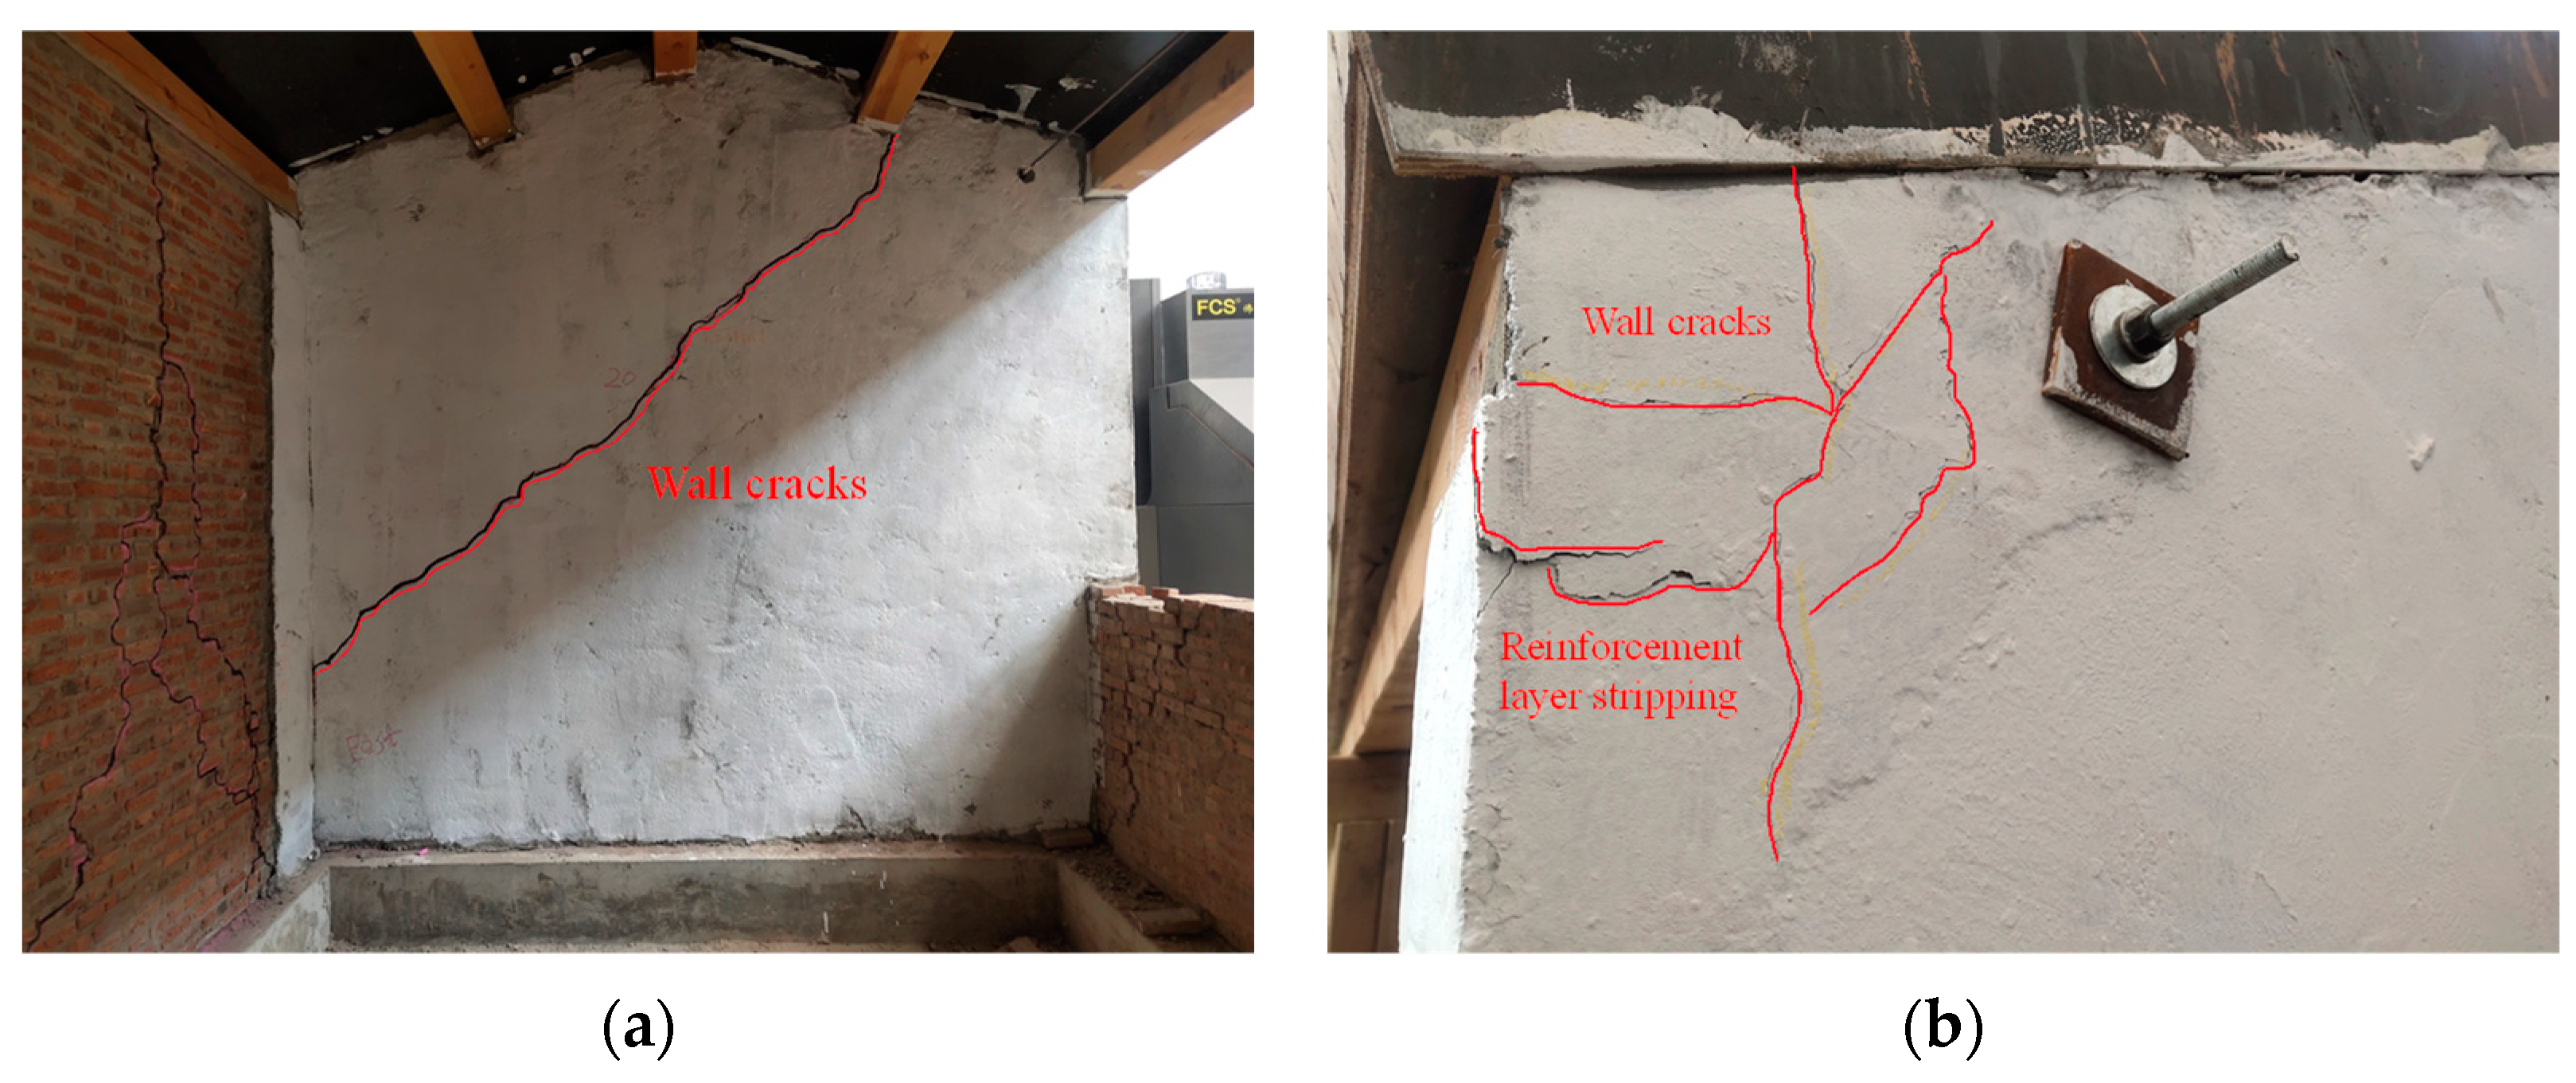
3.1.1. Experimental Phenomenon of M1
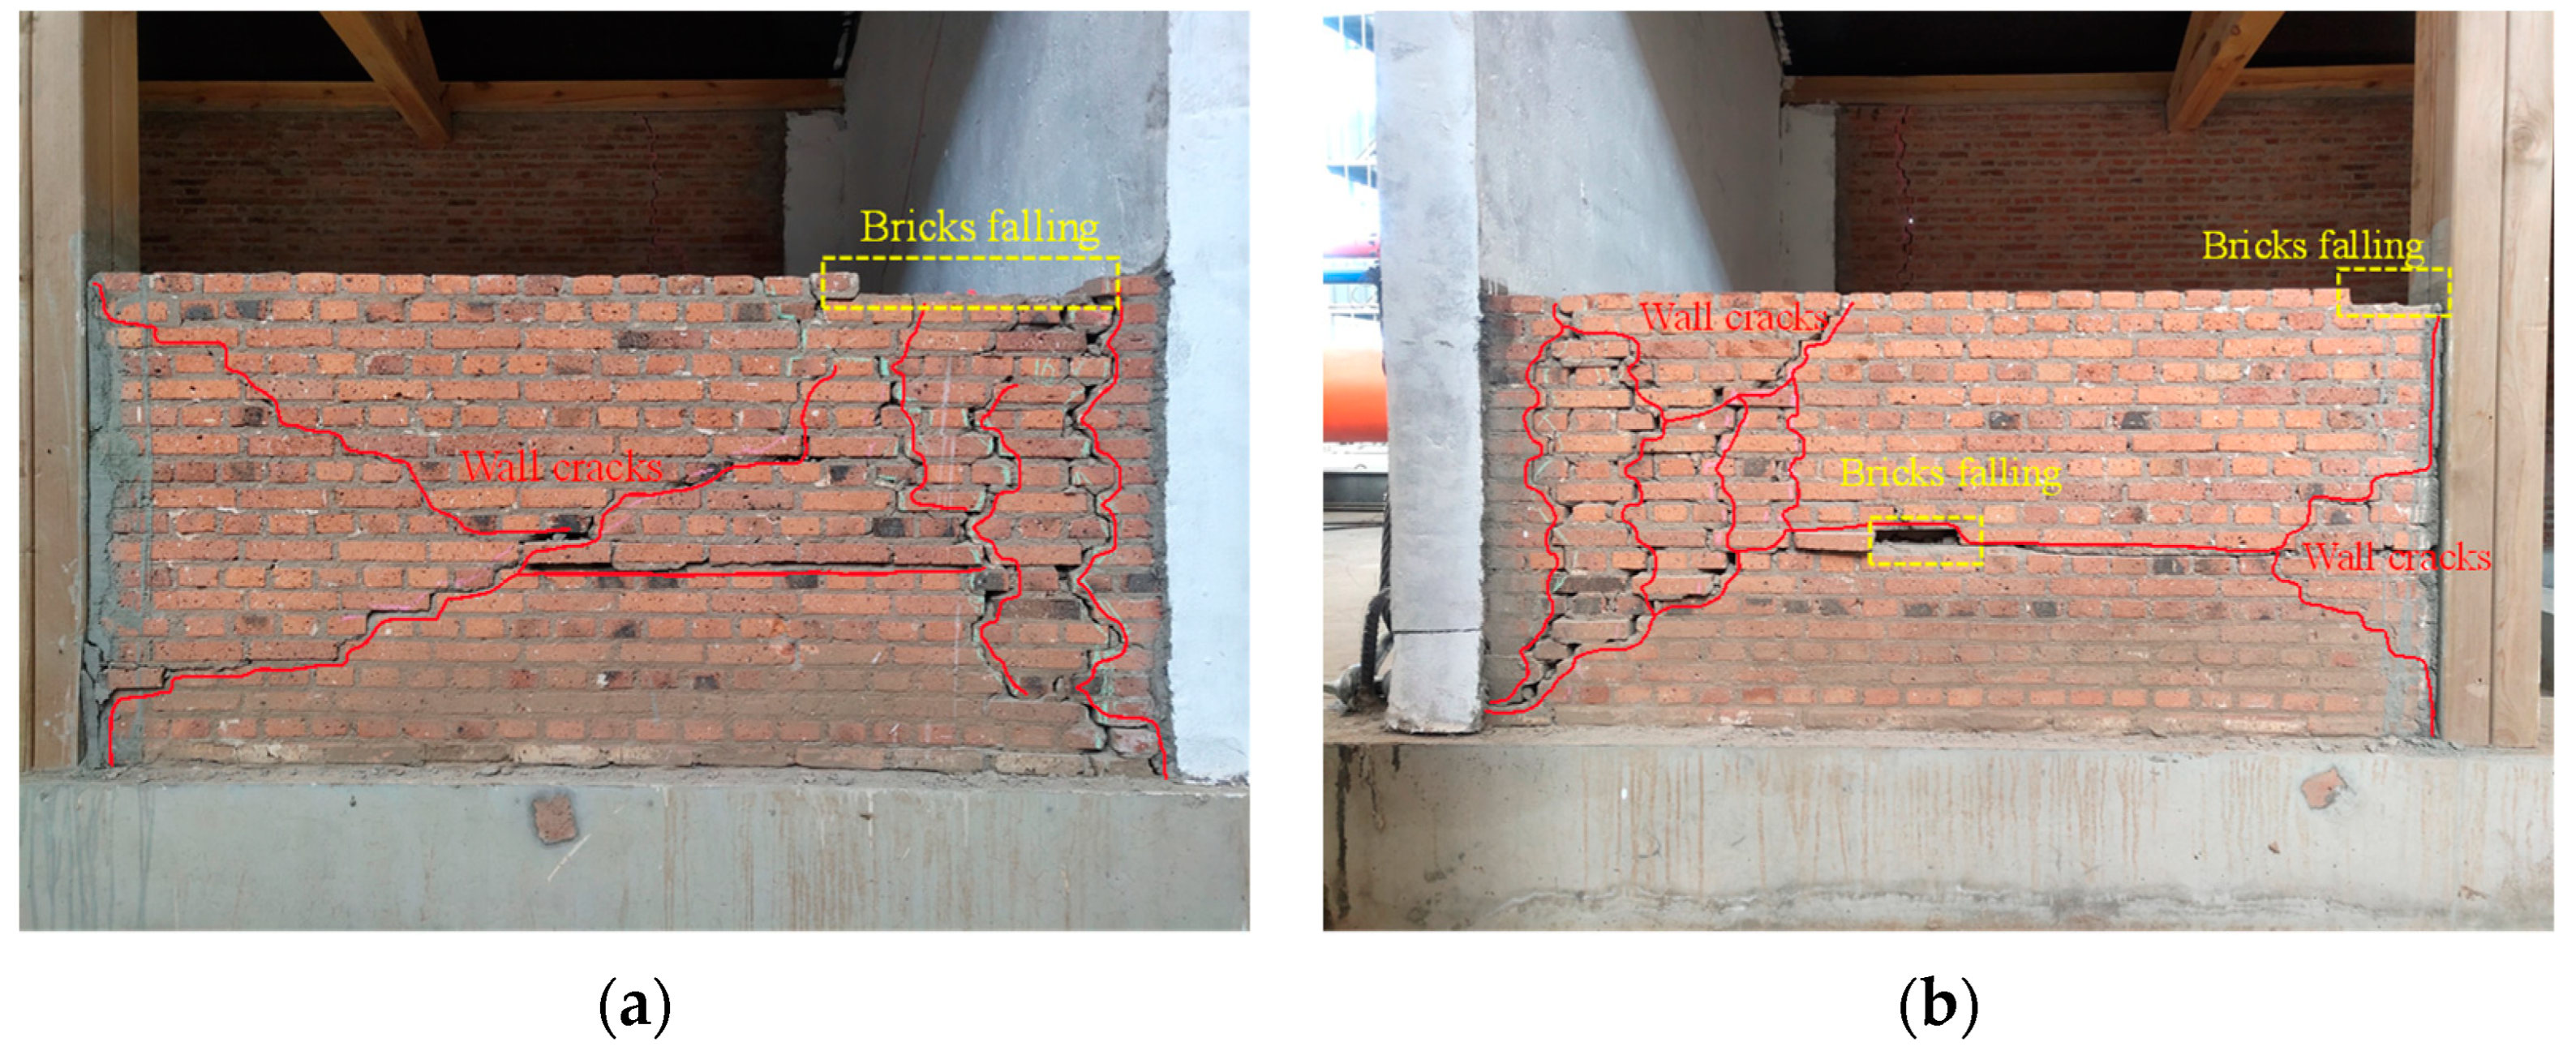
3.1.2. Experimental Phenomenon of M2
3.1.3. Failure Mechanism
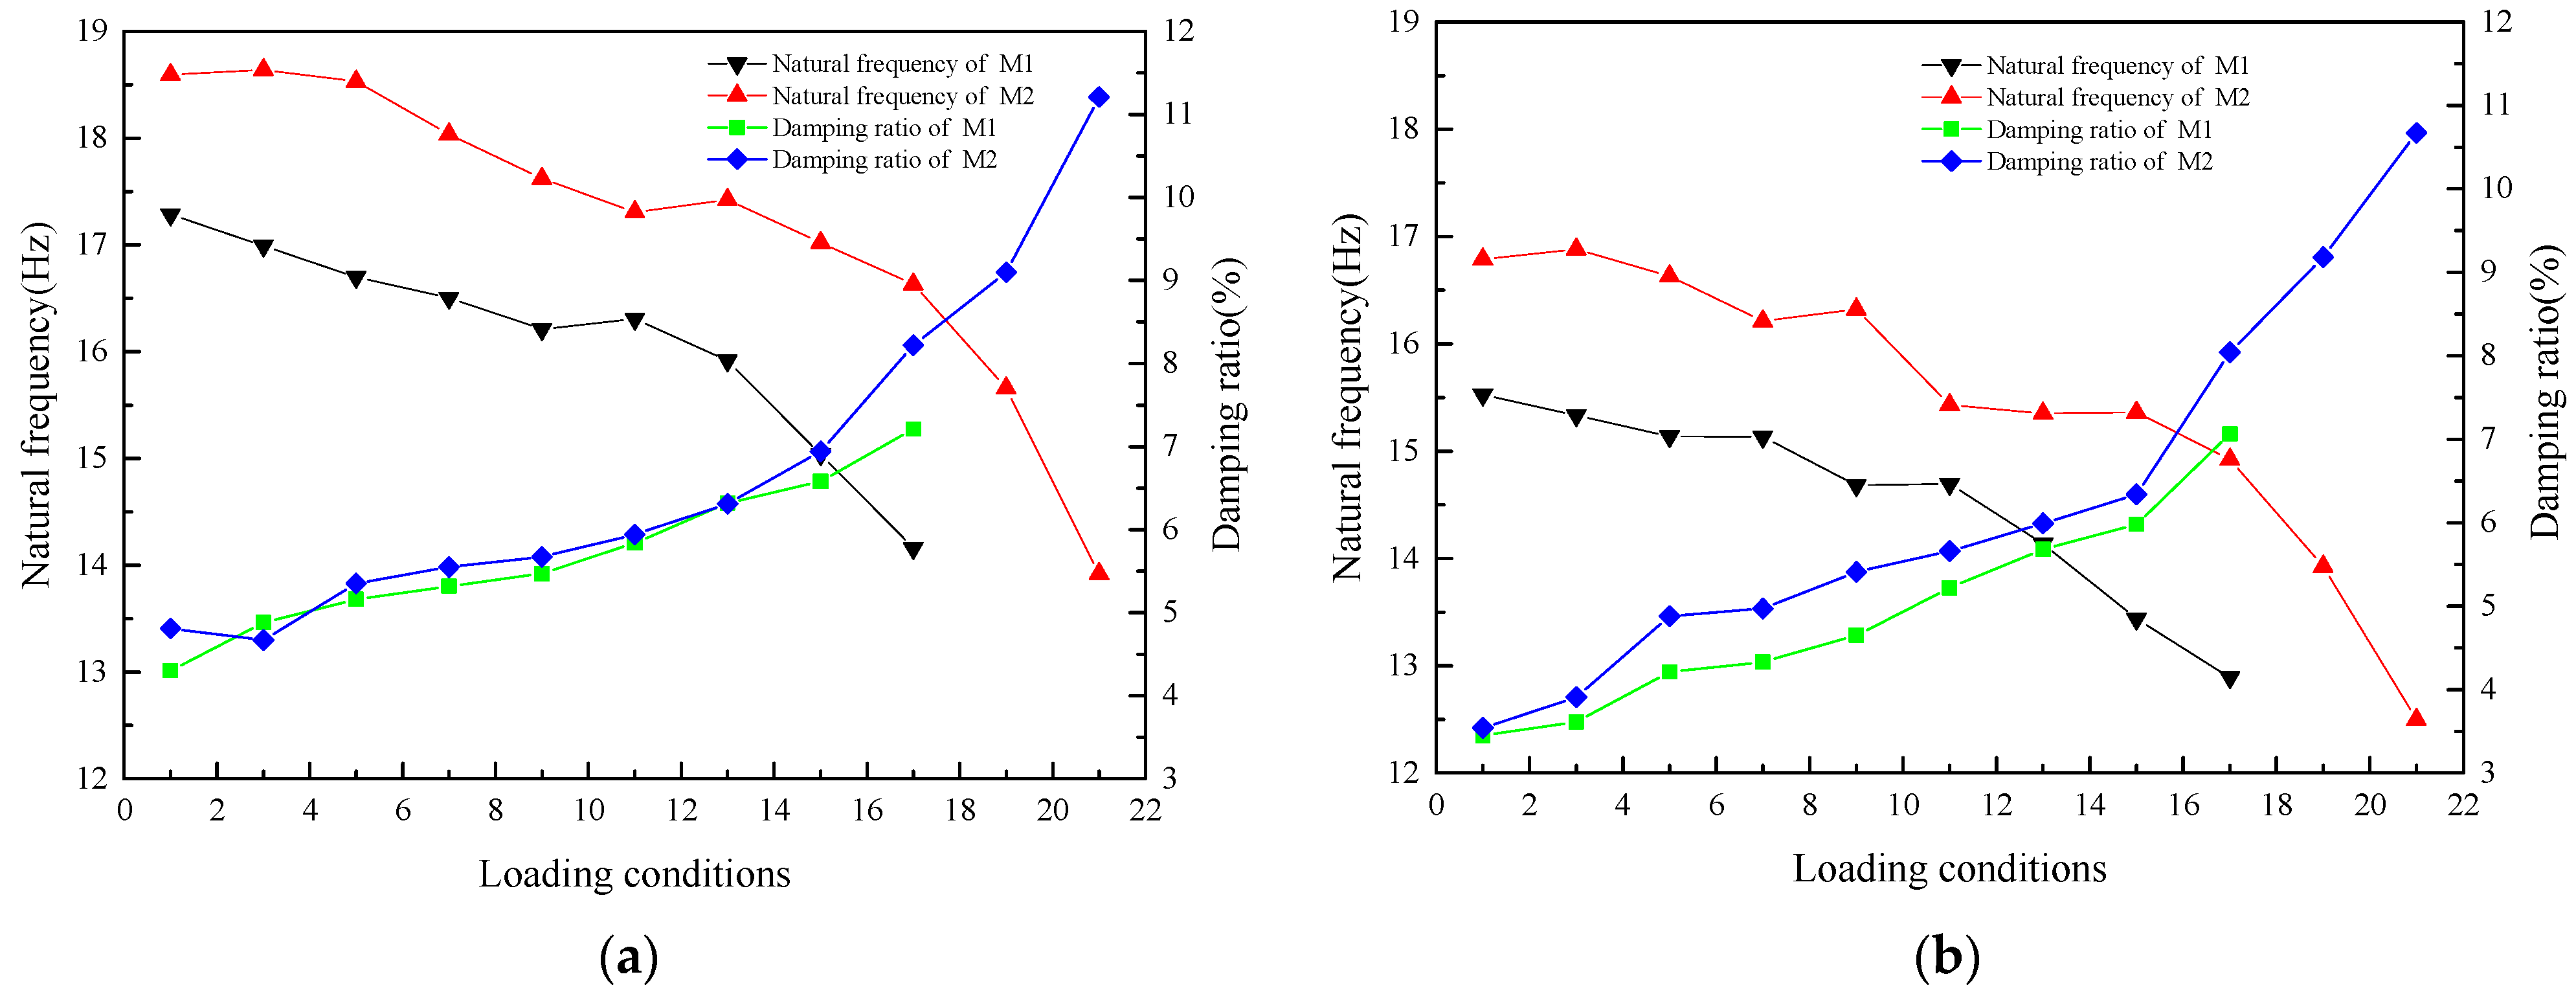
3.2. Dynamic Characteristics Analysis
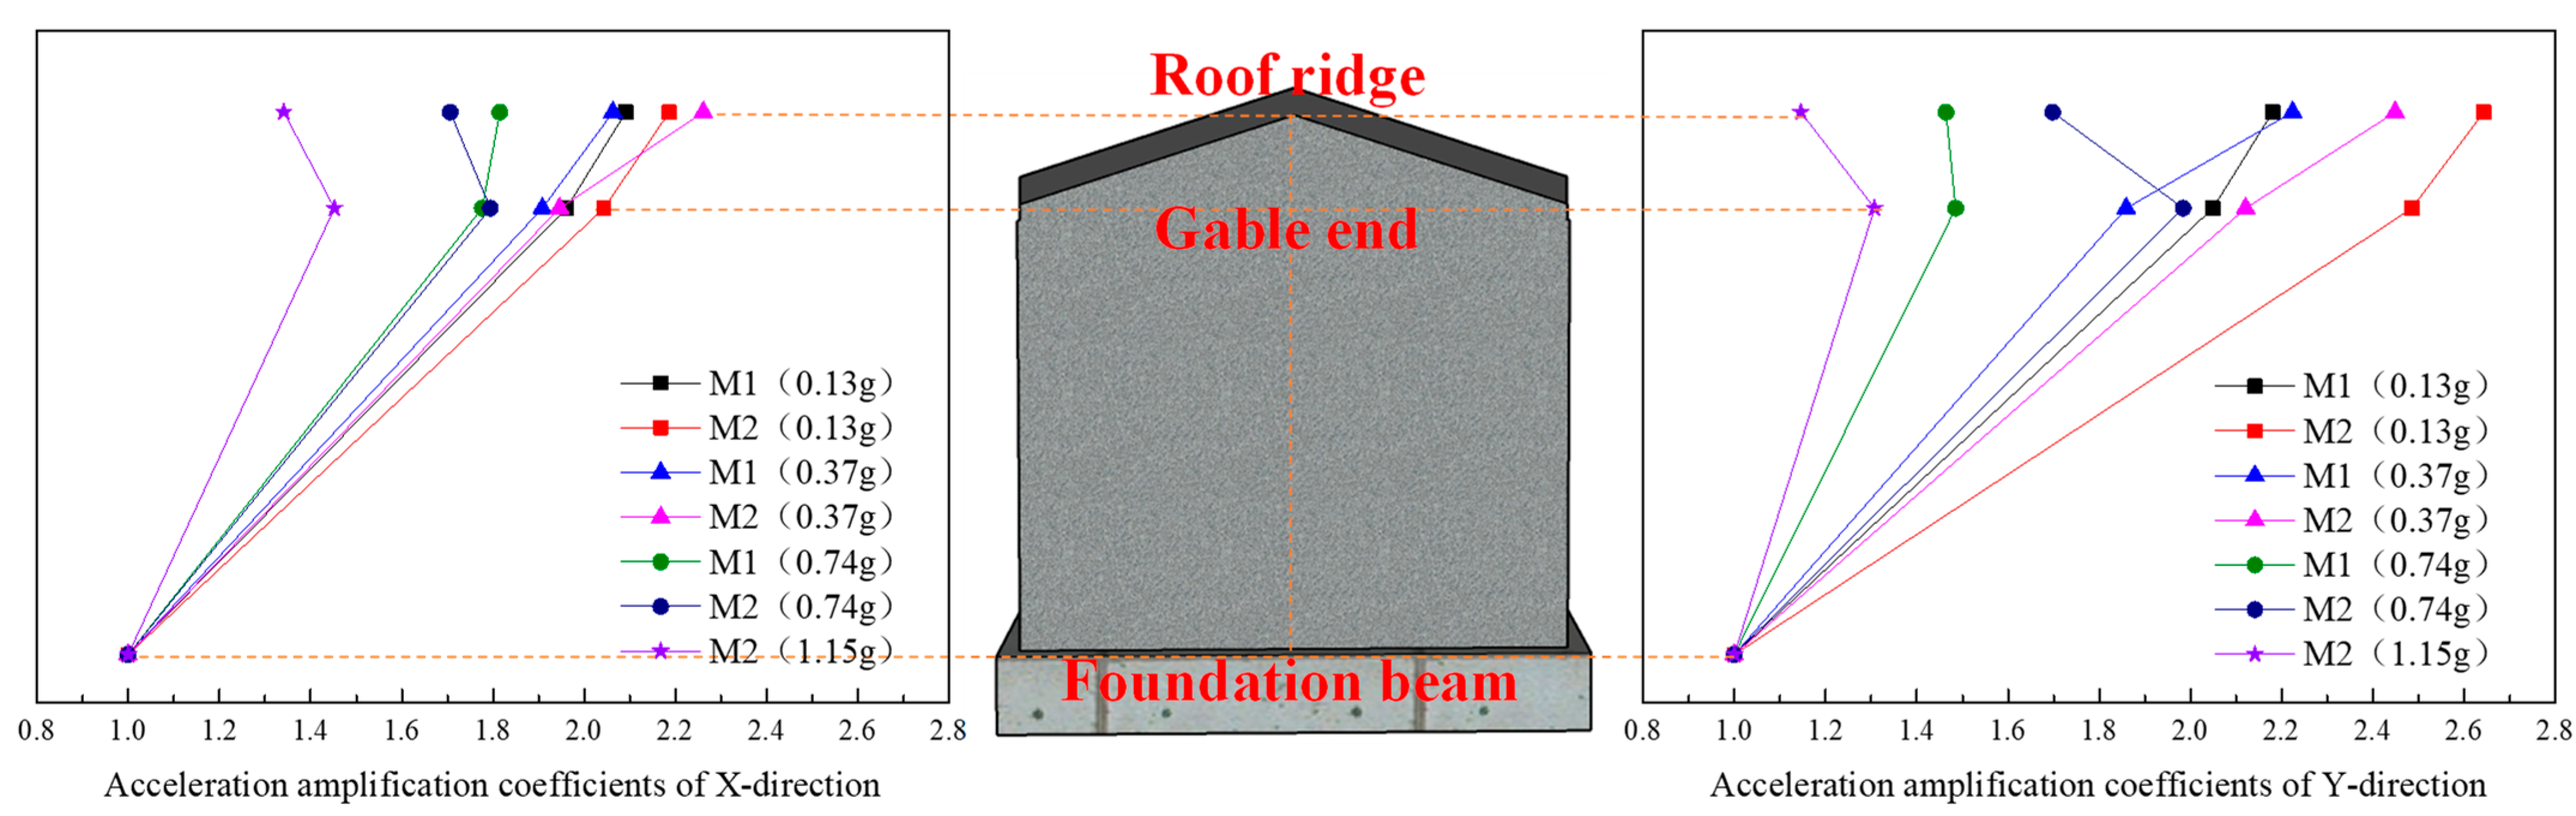
3.3. Acceleration Response Analysis
3.4. Displacement Response Analysis
4. Conclusions
- Under the action of an eight-degree rare earthquake of Landers wave, M1 is seriously damaged and the overall performance is poor. When M2 is loaded to the level of a nine-degree rare earthquake, it is damaged, but there is no collapse of the structure or its components, which maintain good integrity. The integrity of the model structure is enhanced by the reinforcement of the FRCM layer.
- Under the same intensity of earthquake, the interlayer displacement of M2 in X- and Y-directions is significantly smaller than that of M1. When M1 is destroyed, the inter-layer displacement angles in X- and Y-directions reach 1/98 and 1/577, respectively, and the inter-layer displacement angle of M2 is only 1/2 that of M1. The deformation capacity of the model structure is significantly improved by the reinforcement of the FRCM layer.
- After loading, the natural frequencies of M1 in X- and Y-directions are 14.160 Hz and 12.890 Hz, respectively. The initial natural frequencies of M2 are 18.592 Hz and 16.786 Hz. The natural frequencies of X- and Y-directions are increased by 31.30% and 30.22%, respectively. The stiffness and seismic performance of the model structure can be greatly improved by the reinforcement of the FRCM layer.
- After the earthquake action, the cracks of M1 mainly appear on the load-bearing gables on both sides, while the cracks of M2 are mainly concentrated on the rear longitudinal wall, and there are no obvious stress cracks on the load-bearing gables on both sides, indicating the effectiveness of the reinforcement method. However, the front eaves of the eastern gable are slightly flashed. The main consideration is that the connection between the gables is slightly insufficient, and further follow-up research should be considered to strengthen the treatment. This reinforcement method is only suitable for the reinforcement of a single-story timber-framed masonry structure, and our research group is currently working on the reinforcement of multi-story timber-framed masonry structures.
Author Contributions
Funding
Institutional Review Board Statement
Informed Consent Statement
Data Availability Statement
Conflicts of Interest
References
- Song, B.; Yan, H.; Zhou, H.; Cheng, Y.; Wang, M. Experimental study on collapse resistance mechanism of typical masonry structures strengthened with inner frames. Harbin Inst. Technol. 2021, 53, 164–170. [Google Scholar]
- Tang, D. Study on Practical Methods for Seismic Identification of Agricultural Houses in Guanzhong Region; Xi’an University of Architecture and Technology: Xi’an, China, 2022. [Google Scholar]
- Shah, M.U.; Usman, M.; Hanif, M.U.; Naseem, I.; Farooq, S. Utilization of Solid Waste from Brick Industry and Hydrated Lime in Self-Compacting Cement Pastes. Materials 2021, 14, 1109. [Google Scholar] [CrossRef] [PubMed]
- Dong, F.; Jiang, F.; Yu, J.; Zhu, Q.; Wang, H. Seismic performance of timber-framed masonry structure strengthened with ultra-high ductile concrete. Harbin Inst. Technol. 2022, 54, 130–140. [Google Scholar]
- Deng, M.; Dong, Z.; Yang, S.; Wang, L.; Zhou, T. Shaking table test on damaged masonry structure reinforced with high ductile concrete layer. Eng. Mech. 2019, 36, 116–125. [Google Scholar]
- Zhou, T.; Tian, P.; Deng, M. Research on shaking table test of cavity-wall building strengthened with engineered cementitious composite. J. Build. Struct. 2018, 39, 147–152. [Google Scholar]
- Enea, M.; Marco, C.; Yavuz, Y.; Erion, L.; Muhammed, Y.C. Ferrocement, Carbon, and Polypropylene Fibers for Strengthening Masonry Shear Walls. Materials 2023, 16, 4597. [Google Scholar] [CrossRef] [PubMed]
- Cardoso, R.; Lopes, M.; Bento, R. Seismic evaluation of old masonry buildings. Part I: Method description and application to a case-study. Eng. Struct. 2005, 27, 2024–2035. [Google Scholar] [CrossRef]
- Zhao, Z.; Xu, S.; Chen, Y.; Liu, H. Seismic behavior of a retrofitted one-story four-bay masonry residential building in rural area of Beijing. J. Build. Struct. 2018, 39, 139–146. [Google Scholar]
- Wang, M.; Yang, W.; Chen, Y.; Zhao, Z.; Liu, H. Seismic performance research of rural dwellings in Beijing. Build. Struct. 2013, 43, 96–99. [Google Scholar]
- Song, B.; Cheng, Y.; Wang, S. Study on reinforcement method and seismic performance of farm house with brick-wood structure reinforced by inner steel frame. Build. Struct. 2021, 51, 119–125+36. [Google Scholar]
- Yu, J.; Ren, Z.; Zheng, L.; Luo, G. Investigation and analysis on seismic performance of rural buildings in Beijing area. Build. Struct. 2022, 1–6. [Google Scholar] [CrossRef]
- Kouris, L.A.S.; Triantafillou, T.C. State-of-the-art on strengthening of masonry structures with textile reinforced mortar (TRM). Constr. Build. Mater. 2018, 188, 1221–1233. [Google Scholar] [CrossRef]
- Deng, M.; Fan, X.; Gao, X.; Liang, X. Experimental investigation on seismic behavior of damaged brick masonry wall strengthened with ECC splint. Eng. Mech. 2015, 32, 120–129. [Google Scholar]
- Umair, S.M.; Numada, M.; Meguro, K. Applied Element Method Simulation of Fiber Reinforced Polymer and Polypropylene Composite Retrofitted Masonry Walls. Adv. Struct. Eng. 2014, 17, 1567–1583. [Google Scholar] [CrossRef]
- Sathiparan, N.; Sakurai, K.; Numada, M.; Meguro, K. Experimental investigation on the seismic performance of PP-band strengthening stone masonry houses. Bull. Earthq. Eng. 2013, 11, 2177–2196. [Google Scholar] [CrossRef]
- Saleem, M.U.; Numada, M.; Amin, M.N.; Meguro, K. Seismic response of PP-band and FRP retrofitted house models under shake table testing. Constr. Build. Mater. 2016, 111, 298–316. [Google Scholar] [CrossRef]
- Bothara, J.K.; Dhakal, R.P.; Mander, J.B. Seismic performance of an unreinforced masonry building: An experimental investigation. Earthq. Eng. Struct. Dyn. 2009, 39, 45–68. [Google Scholar] [CrossRef]
- Gao, R.; Zhang, Y.; Li, X. Experimental study on seismic performance of brick masonry structure durability deterioration and reinforcement repair. Build. Struct. 2024, 1–10. [Google Scholar] [CrossRef]
- Han, P.; Shi, Y.; Guo, Z.; Chen, Y.; Zhang, J. Study on the Method of Strengthening Masonry Wall with High Ductility Concrete. Constr. Des. Eng. 2024, 149–151. [Google Scholar] [CrossRef]
- Zhang, P.; Wang, S.; Tao, X.; Li, Z.; Liu, Y.; Peng, E.; Du, B.; Lv, J. Experimental study on the flexural behaviors of ECC-reinforced masonry beams with GFRP mesh. Eng. Struct. 2024, 315, 118479. [Google Scholar] [CrossRef]
- Luo, R. Experimental Study of Seismic Performance of Low Strength Masonry Walls Reinforced with One-Side Cement Mortar Splint. Master’s Thesis, China Academy of Building Research, Beijing, China, 2016. [Google Scholar]
- Deng, M.; Yang, S.; Liang, X. Experimental studies on seismic behavior of confined masonry walls strengthened with single HDC layer. China Civ. Eng. J. 2018, 51, 10–19. [Google Scholar]
- Deng, M.; Gao, X.; Liang, X. Experimental investigation on aseismic behavior of brick wall strengthened with ECC splint. Eng. Mech. 2013, 30, 168–174. [Google Scholar]
- Zhang, W.; He, J.; Hu, W.; Hu, W.; Pan, J.; Deng, M. Study on Seismic Behavior and Bearing Capacity of Concrete Masonry Wall Retrofitted Using High Ductile Fiber-Reinforeced Concrete. Eng. Mech. 2023, 1–14. [Google Scholar] [CrossRef]
- Zhang, F.; Liang, Y.; Liu, Z.; Xue, J.; An, Z.; Hu, X.; Zhou, G.; Zhang, Y. Shaking table test on brick masonry farmhouse strengthened by polypropylene grid cement mortar coating. J. Build. Struct. 2024, 45, 69–80. [Google Scholar]
- Maras, M.M.; Kilinc, H.C. Comparison on repair and strengthening techniques for unreinforced masonry structures. Int. J. Eng. Res. Appl. 2016, 6, 1–5. [Google Scholar]
- Tan, K.H.; Patoary, M.K.H. Strengthening of Masonry Walls against Out-of-Plane Loads Using Fiber-Reinforced Polymer Reinforcement. J. Compos. Constr. 2004, 8, 79–87. [Google Scholar] [CrossRef]
- Shakib, H.; Dardaei, S.; Mousavi, M.; Rezaei, M.K. Experimental and Analytical Evaluation of Confined Masonry Walls Retrofitted with CFRP Strips and Mesh-Reinforced PF Shotcrete. J. Perform. Constr. Facil. 2016, 30, 04016039. [Google Scholar] [CrossRef]
- Papanicolaou, C.G.; Triantafillou, T.; Papathanasiou, M.; Karlos, K. Textile reinforced mortar (TRM) versus FRP as strengthening material of URM walls: Out-of-plane cyclic loading. Mater. Struct. 2007, 41, 143–157. [Google Scholar] [CrossRef]
- GB 50011-2010; Code for Seismic Design of Buildings. Standardization Administration of China: Beijing, China, 2010.
- GB50203-2011; Code for Acceptance of Constructional Quality of Masonry Structures. Standardization Administration of China: Beijing, China, 2011.
- Zhao, X. Effect of age on basic mechanical properties of recycled concrete hollow block. China Concr. Cem. Prod. 2015, 5, 68–70. [Google Scholar]
- Cao, J. Study on Seismic Performance of Masonry Wall Reinforced by Strip Method of Reinforced Mortar Surface Layer. Master’s Thesis, North China University of Science and Technology , Tangshan, China, 2023. [Google Scholar]
- Li, S. Study on Mechanical Behavior of Reinforced Mortar Belt Reinforcing Masonry Structure Agricultural House. Master’s Thesis, Sichuan Agricultural University, Ya’an, China, 2019. [Google Scholar]
- GB/T 2542-2012; Test Methods for Wall Bricks. Standardization Administration of China: Beijing, China, 2012.
- JGJ/T 70-2009; Standard for Test Method of Basic Properties of Construction Mortar. Standardization Administration of China: Beijing, China, 2009.
- GB/T50329-2012; Standard for Methods Testing of Timber Structures. Standardization Administration of China: Beijing, China, 2012.
- GB/T 17671-2021; Test Method of Cement Mortar Strength (ISO Method). Standardization Administration of China: Beijing, China, 2021.
- J15934-2021; Technical Specification for Strengthening Structure with High Ductile Concrete. China Building Materials Press: Beijing, China, 2021.
- Zhang, F.; Wang, Z.; Jiang, L.; Yongqun, Z.; Yubing, L.; Xi, C. Shaking table test study on traditional Chuan-Dou style wood frame with embedded brick wall. China Civ. Eng. J. 2021, 54, 10–19+29. [Google Scholar]
- Zheng, Y.; Shi, X.; Wang, Y.; Zhang, Y.; Jin, N. Study on shaking table test scheme design of isolated masonry structure in villages and towns. Technol. Earthq. Disaster Prev. 2016, 11, 297–305. [Google Scholar]
- Hassiotis, S.; Jeong, G. Assessment of structural damage from natural frequency measurements. Comput. Struct. 1993, 49, 679–691. [Google Scholar] [CrossRef]


| Type | Physical Quantity | Similarity Coefficient |
|---|---|---|
| Material property | Vertical stress (Sσ) | 0.536 |
| Shear stress (Sτ) | 1.000 | |
| Elastic modulus (SE) | 1.000 | |
| Poisson’s ratio (Sγ) | 1.000 | |
| Density (Sρ) | 1.000 | |
| Dynamical property | Mass (SL) | 0.134 |
| Stiffness (SX) | 0.500 | |
| Periodicity (Sθ) | 0.518 | |
| Frequency (Sm) | 1.929 | |
| Acceleration (Sk) | 1.861 |
| Loading Stage | Loading Conditions | Seismic Waves | Prototype Structure PGA/g | Shaker Table PGA/g |
|---|---|---|---|---|
| - | 1 | White noise | — | 0.05 |
| 1 | 2 | El Mayor | 0.07 | 0.13 |
| 3 | White noise | — | 0.05 | |
| 4 | Landers | 0.07 | 0.13 | |
| 5 | White noise | — | 0.05 | |
| 6 | Artificial wave | 0.07 | 0.13 | |
| 7 | White noise | — | 0.05 | |
| 2 | 8 | El Mayor | 0.20 | 0.37 |
| 9 | White noise | — | 0.05 | |
| 10 | Landers | 0.20 | 0.37 | |
| 11 | White noise | — | 0.05 | |
| 12 | Artificial wave | 0.20 | 0.37 | |
| 13 | White noise | — | 0.05 | |
| 3 | 14 | El Mayor | 0.40 | 0.74 |
| 15 | White noise | — | 0.05 | |
| 16 | Landers | 0.40 | 0.74 | |
| 17 | White noise | — | 0.05 | |
| 18 | Artificial wave | 0.40 | 0.74 | |
| 19 | White noise | — | 0.05 | |
| 4 | 20 | El Mayor | 0.62 | 1.15 |
| 21 | White noise | — | 0.05 |
| Loading Conditions | X-Direction | Y-Direction | ||||||
|---|---|---|---|---|---|---|---|---|
| Natural Frequency of M1 (Hz) | Natural Frequency of M2 (Hz) | Damping Ratio of M1 (%) | Damping Ratio of M2 (%) | Natural Frequency of M1 (Hz) | Natural Frequency of M2 (Hz) | Damping Ratio of M1 (%) | Damping Ratio of M2 (%) | |
| 1 | 17.285 | 18.592 | 4.30 | 4.81 | 15.527 | 16.786 | 3.45 | 3.54 |
| 3 | 16.992 | 18.641 | 4.88 | 4.67 | 15.332 | 16.881 | 3.61 | 3.91 |
| 5 | 16.699 | 18.531 | 5.16 | 5.35 | 15.136 | 16.631 | 4.21 | 4.88 |
| 7 | 16.503 | 18.035 | 5.32 | 5.55 | 15.132 | 16.212 | 4.33 | 4.97 |
| 9 | 16.210 | 17.621 | 5.47 | 5.67 | 14.682 | 16.322 | 4.65 | 5.41 |
| 11 | 16.308 | 17.308 | 5.84 | 5.94 | 14.695 | 15.432 | 5.22 | 5.66 |
| 13 | 15.917 | 17.422 | 6.32 | 6.31 | 14.135 | 15.351 | 5.68 | 5.99 |
| 15 | 15.039 | 17.021 | 6.58 | 6.94 | 13.438 | 15.362 | 5.98 | 6.34 |
| 17 | 14.160 | 16.632 | 7.21 | 8.22 | 12.890 | 14.923 | 7.06 | 8.04 |
| 19 | — | 15.658 | — | 9.10 | — | 13.925 | — | 9.18 |
| 21 | — | 13.92 | — | 11.21 | — | 12.498 | — | 10.67 |
| Seismic Waves | Loading Conditions | Foundation Beam | M1 | M2 | ||
|---|---|---|---|---|---|---|
| Gable End | Roof Ridge | Gable End | Roof Ridge | |||
| El Mayor wave | 2 | 1 | 1.961 | 2.091 | 2.043 | 2.186 |
| 8 | 1 | 1.946 | 2.261 | 1.908 | 2.063 | |
| 14 | 1 | 1.794 | 1.706 | 1.776 | 1.815 | |
| 20 | 1 | - | - | 1.452 | 1.341 | |
| Landers wave | 4 | 1 | 1.769 | 1.795 | 2.417 | 2.162 |
| 10 | 1 | 1.830 | 1.877 | 2.245 | 2.209 | |
| 16 | 1 | 1.557 | 1.542 | 2.097 | 1.927 | |
| Artificial wave | 6 | 1 | 1.985 | 2.050 | 2.164 | 1.945 |
| 12 | 1 | 1.712 | 1.781 | 1.983 | 1.956 | |
| 18 | 1 | - | - | 1.757 | 1.610 | |
| Seismic Waves | Loading Conditions | Foundation Beam | M1 | M2 | ||
|---|---|---|---|---|---|---|
| Gable End | Roof Ridge | Gable End | Roof Ridge | |||
| El Mayor wave | 2 | 1 | 2.049 | 2.180 | 2.486 | 2.643 |
| 8 | 1 | 1.859 | 2.224 | 2.121 | 2.449 | |
| 14 | 1 | 1.485 | 1.464 | 1.984 | 1.698 | |
| 20 | 1 | - | - | 1.307 | 1.146 | |
| Landers wave | 4 | 1 | 1.836 | 1.612 | 2.286 | 1.952 |
| 10 | 1 | 1.735 | 1.964 | 1.942 | 1.539 | |
| 16 | 1 | 1.659 | 1.483 | 1.678 | 1.312 | |
| Artificial wave | 6 | 1 | 2.466 | 2.371 | 2.671 | 2.761 |
| 12 | 1 | 2.107 | 2.257 | 2.486 | 2.302 | |
| 18 | 1 | - | - | 1.903 | 1.842 | |
| Seismic Waves | Direction | Loading Conditions | M1 | M2 | ||
|---|---|---|---|---|---|---|
| Displacement/mm | Displacement Angle | Displacement/mm | Displacement Angle | |||
| El Mayor wave | X | 2 | 0.769 | 1/2666 | 0.515 | 1/3981 |
| 8 | 2.076 | 1/987 | 1.543 | 1/1329 | ||
| 14 | 11.032 | 1/186 | 3.54 | 1/579 | ||
| 20 | - | - | 26.395 | 1/78 | ||
| Y | 2 | 0.720 | 1/2847 | 0.586 | 1/3498 | |
| 8 | 1.184 | 1/1731 | 0.908 | 1/2258 | ||
| 14 | 2.014 | 1/1018 | 1.645 | 1/1246 | ||
| 20 | - | - | 10.974 | 1/187 | ||
| Landers wave | X | 4 | 0.868 | 1/2362 | 0.745 | 1/2752 |
| 10 | 2.247 | 1/912 | 1.587 | 1/1292 | ||
| 16 | 20.983 | 1/98 | 7.916 | 1/259 | ||
| Y | 4 | 0.500 | 1/4100 | 0.421 | 1/4869 | |
| 10 | 0.818 | 1/2506 | 0.782 | 1/2621 | ||
| 16 | 3.552 | 1/577 | 2.014 | 1/1018 | ||
| Artificial wave | X | 6 | 0.563 | 1/3641 | 0.514 | 1/3988 |
| 12 | 2.087 | 1/982 | 1.764 | 1/1162 | ||
| 18 | - | - | 8.875 | 1/231 | ||
| Y | 6 | 0.683 | 1/3001 | 0.515 | 1/3981 | |
| 12 | 1.085 | 1/1889 | 0.994 | 1/2062 | ||
| 18 | - | - | 2.844 | 1/721 | ||
Disclaimer/Publisher’s Note: The statements, opinions and data contained in all publications are solely those of the individual author(s) and contributor(s) and not of MDPI and/or the editor(s). MDPI and/or the editor(s) disclaim responsibility for any injury to people or property resulting from any ideas, methods, instructions or products referred to in the content. |
© 2024 by the authors. Licensee MDPI, Basel, Switzerland. This article is an open access article distributed under the terms and conditions of the Creative Commons Attribution (CC BY) license (https://creativecommons.org/licenses/by/4.0/).
Share and Cite
Tan, W.; Zhou, T.; Zhu, L.; Zhao, X.; Yu, W.; Zhang, L.; Liang, Z. Seismic Performance of a Single-Story Timber-Framed Masonry Structure Strengthened with Fiber-Reinforced Cement Mortar. Materials 2024, 17, 3644. https://doi.org/10.3390/ma17153644
Tan W, Zhou T, Zhu L, Zhao X, Yu W, Zhang L, Liang Z. Seismic Performance of a Single-Story Timber-Framed Masonry Structure Strengthened with Fiber-Reinforced Cement Mortar. Materials. 2024; 17(15):3644. https://doi.org/10.3390/ma17153644
Chicago/Turabian StyleTan, Wei, Tiegang Zhou, Lixin Zhu, Xiang Zhao, Wen Yu, Liangyi Zhang, and Zengfei Liang. 2024. "Seismic Performance of a Single-Story Timber-Framed Masonry Structure Strengthened with Fiber-Reinforced Cement Mortar" Materials 17, no. 15: 3644. https://doi.org/10.3390/ma17153644