Article

Numerical and Experiment Analysis of Sapphire Sandwich-Structure Fabry–Perot Pressure Sensor through Fast Fourier Transform and Mean Square Error Demodulation Algorithm

by
Zhenyin Hai
1,*,
Zhixuan Su
1,
Rui Liang
2,
Maocheng Guo
1,
Hongtian Zhu
1,
Jun Chen
3,
Qi Zhang
1,
Yue Chen
1,
Runze Lin
1,
Yihang Zhang
1,
Zewang Zhang
4,* and
Chenyang Xue
1
1
School of Aerospace Engineering, Xiamen University, Xiamen 361005, China
2
School of Instrument and Electronics, North University of China, Taiyuan 030051, China
3
School of Electronic Engineering, Ocean University of China, Qingdao 266000, China
4
School of Opto-Electronic and Communication Engineering, Xiamen University of Technology, Xiamen 361005, China
*
Authors to whom correspondence should be addressed.
Materials 2024, 17(15), 3649; https://doi.org/10.3390/ma17153649
Submission received: 24 June 2024 / Revised: 17 July 2024 / Accepted: 23 July 2024 / Published: 24 July 2024
(This article belongs to the Special Issue Experimental and Numerical Analysis of Sandwich Structures)

Abstract

:
Pressure sensors prepared from sapphire exhibit excellent characteristics, including high-temperature resistance, high hardness, and resistance to electromagnetic interference. A Fast Fourier Transform and Mean Square Error (FFT-MSE) demodulation algorithm was employed to demodulate a sapphire sandwich-structure Fabry–Perot (F-P) pressure sensor. Through simulation analysis, the experimental results indicated that the demodulation error of the air cavity length in the range of 206 μm to 216 μm was less than 0.0008%. Compared to single demodulation methods and combined demodulation methods based on FFT or Minimum Mean Square Error (MMSE), the method proposed in this work reduced the demodulation error by more than three times and increased accuracy by more than six times. The algorithm was utilized to demodulate the sapphire sandwich-structure F-P pressure sensor, and the test results indicated that the fitting error of the sensor was less than 0.025% within the pressure range of 0 MPa to 10 MPa. The repeatability error was less than 0.066%, the zero-point deviation was 1.26%, and the maximum stability deviation was 0.0063% per 30 min. The algorithm effectively demodulated the actual cavity length variation in the sapphire sandwich-structure F-P pressure sensor, providing a solution for the performance evaluation of the sapphire sandwich-structure F-P pressure sensor.

1. Introduction

The measurement of pressure values in the operating states of key components in high-hypervelocity vehicles and advanced aerospace engines is essential for assessing their operating states, structural optimization, and safety performance [1]. For example, during aero-engine testing, pressure measurements are required for intakes, combustion chambers, tail nozzles, and exhaust outlets [2,3,4]. The melting point of sapphire material is as high as 2040 °C [5], and the pressure sensors made from it possess superior properties such as high-temperature resistance, high hardness, anti-electromagnetic interference, and high-temperature stability [6,7,8]. It is reported that pressure sensors based on sapphire material are mainly F-P pressure sensors [9,10,11,12,13,14]. Sapphire Fabry–Perot (F-P) pressure sensors have high accuracy, high stability, and high-temperature environment adaptability, making them more suitable for pressure measurement in extreme aerospace environments. The main demodulation algorithms for sapphire F-P pressure sensors include bimodal methods [15,16,17], Fourier transform methods [18,19,20], phase quadrature methods [21,22,23], and mutual correlation methods [24,25,26]. Zhiqiang Shao et al. achieved the demodulation of the sapphire F-P cavity length ranging from 103 µm to 283 µm by using the mutual correlation function method with a pressure range of 0 MPa to 5 MPa [27]. Zilong Guo et al. achieved the demodulation of the sapphire F-P cavity with a length range of 60 µm to 95 µm using the white light interference method with a pressure range of 0 MPa to 2.9 MPa and accuracy of up to 0.04% [28]. Yang Cui et al. achieved the demodulation of the quartz F-P cavity with a length range of 614 µm to 630 µm using the white light interference method with a pressure range of 0 MPa to 10 MPa [29].
This work combines the Fast Fourier Transform (FFT) and Mean Square Error (MSE) demodulation methods, interrelating the computational results to achieve air cavity length demodulation in a sapphire sandwich-structure F-P cavity. The objective was to optimize the low accuracy of FFT and the instability of MSE. Simulation results indicated that the maximum deviation is less than 0.1 nm, and demodulation accuracy reaches 0.0008% using the FFT-MSE demodulation method. During actual testing, the sapphire sandwich-structure pressure sensor undergoes multiple large-range pressure tests from 0–10 MPa. The fitting error of this sensor is less than 0.016%, the repeatability error is less than 0.066%, and no mode-jumping problem arises, demonstrating that the method has good reliability and stability. This method provides a reliable solution for determining the air cavity length of sapphire sandwich-structure F-P cavity.

2. Test Systems and Sensor Structures

2.1. Test System

Figure 1 illustrates the sapphire sandwich-structure F-P pressure sensor test system, which comprises a optical spectrum analyzer (DAQ6370, Yokogawa Measurement Technology Co., Ltd., Tokyo, Japan), a super-continuum spectral light source (SuperK COMPACT, NKT Photonics A/S, Copenhagen, Denmark), a pressure controller (860-25M, Beijing ConST Instruments Technology Inc., Beijing, China), an optical isolator, an optical coupler, a computer, a pressure connection table, a gas cylinder, and a pressure reducing valve. The super-continuum spectral light source emits laser light with a wavelength of 400 nm to 2400 nm. Figure S1 illustrates the coupling efficiency between the signal emitted by the super-continuum spectral light source and the single-mode fiber, which ranges from 17.71% to 23.8%, within the wavelength range of 1520 nm to 1570 nm. The laser light passes through the optical isolator and optical coupler before entering the sapphire sandwich-structure F-P pressure sensor. Its reflection spectrum then passes through the optical coupler, and the optical spectrum analyzer collects the reflection spectrum signals (sampling wavelength range: 1520 nm to 1570 nm, number of sampling points: 1001, scanning speed: 1×). The collected reflectance spectral signals are transferred to a computer with demodulation system software written in MATLAB (version number: 9.6.0.1047502), which demodulates the changes in the air cavity length of the sapphire sandwich-structure F-P cavity. The pressure in the gas cylinder is approximately 15 MPa, reduced to about 12 MPa by a pressure reducing valve. The pressure controller connects the gas cylinder to the pressure connection table, regulating the pressure within it. The sapphire sandwich-structure F-P pressure sensor is mounted onto the pressure connection table.

2.2. Sensor Structure

Figure 2 illustrates the sensitive core of the sapphire sandwich-structure F-P cavity, which comprises a basal cavity, an air cavity, and a pressure-sensitive diaphragm, all constructed from sapphire. The optical fiber consists of quartz. The super-continuum spectral light source emits a beam that reflects off the upper surface of the basal cavity (reflectivity R1), the lower surface of the basal cavity (reflectivity R2), and the upper surface of the pressure-sensitive diaphragm (reflectivity R3), resulting in an interferometric reflectance spectrum. The sapphire basal cavity diaphragm thickness (d1) is 600 μm, with a diameter of 8 mm. The sapphire pressure-sensing diaphragm thickness (d3) is 200 μm, with a diameter of 8 mm. The sapphire air cavity diaphragm thickness (d2) is 216 μm, with an outer diameter of 8 mm and an inner diameter of 4 mm. The quartz optical fiber is a single-mode fiber with a diameter of 125 μm.
Figure 3a shows the upper structure of the sensitive core of the sapphire sandwich-structure F-P pressure sensor. The diameter of the sensitive core is approximately 8 mm. Figure 3b illustrates the physical diagram of the sapphire sandwich-structure F-P pressure sensor. The sensor is encased in 304 stainless steel and features a thread diameter of 20 mm with a pitch of 1.5 mm. The scanning electron microscope (SEM) manufactured by Carl Zeiss AG, model SUPRA55 SAPPHIRE, combined with energy-dispersive X-ray spectroscopy (EDS), is used to analyze the micro-structure and element distribution of the sensitive core of the sapphire sandwich-structure F-P pressure sensor. The micro-structure in A-A cross section of the sapphire sandwich-structure F-P cavity appears in Figure 3c, and the corresponding surface elements are Al and O. This is due to the main material composition of sapphire being Al2O3. From top to bottom, the layers are the sapphire pressure-sensitive diaphragm (①), sapphire air cavity diaphragm (②), and sapphire basal cavity diaphragm (③).

3. Simulation and Analysis

To effectively simulate the reflectance spectrum of the sapphire sandwich-structure F-P cavity, it is necessary to construct the reflectance spectrum using basal cavity reflectance spectrum expression, air cavity reflectance spectrum expression, and interferometric reflectance spectrum expression for both the basal and air cavities [28,30,31]. The basal cavity reflectance spectrum expression is as follows:
I 1 = 2 R 1 R 2 c o s ( 4 π n 1 L 1 c v ) I 0
n1 denotes the refractive index of the basal cavity, L1 represents the basal cavity length, I0 indicates the incident spectrum, I1 denotes the basal cavity reflectance spectrum, c represents the speed of light, and v indicates the incident light frequency. The air cavity reflectance spectrum expression is as follows:
I 2 = 2 R 2 R 3 c o s ( 4 π n 2 L 2 c v ) I 0
n2 denotes the refractive index of the air cavity, L2 represents the air cavity length, and I2 indicates the air cavity reflectance spectrum. The interferometric reflectance spectrum expression for the basal and air cavities is as follows:
I 3 = 2 R 1 R 3 c o s [ 2 ( 4 π n 1 L 1 c v + 4 π n 2 L 2 c v ) ] I 0
The reflectance spectrum expression for the sapphire sandwich-structure F-P cavity is as follows:
I r = ( R 1 + R 2 + R 3 + I 1 + I 2 + I 3 ) I 0
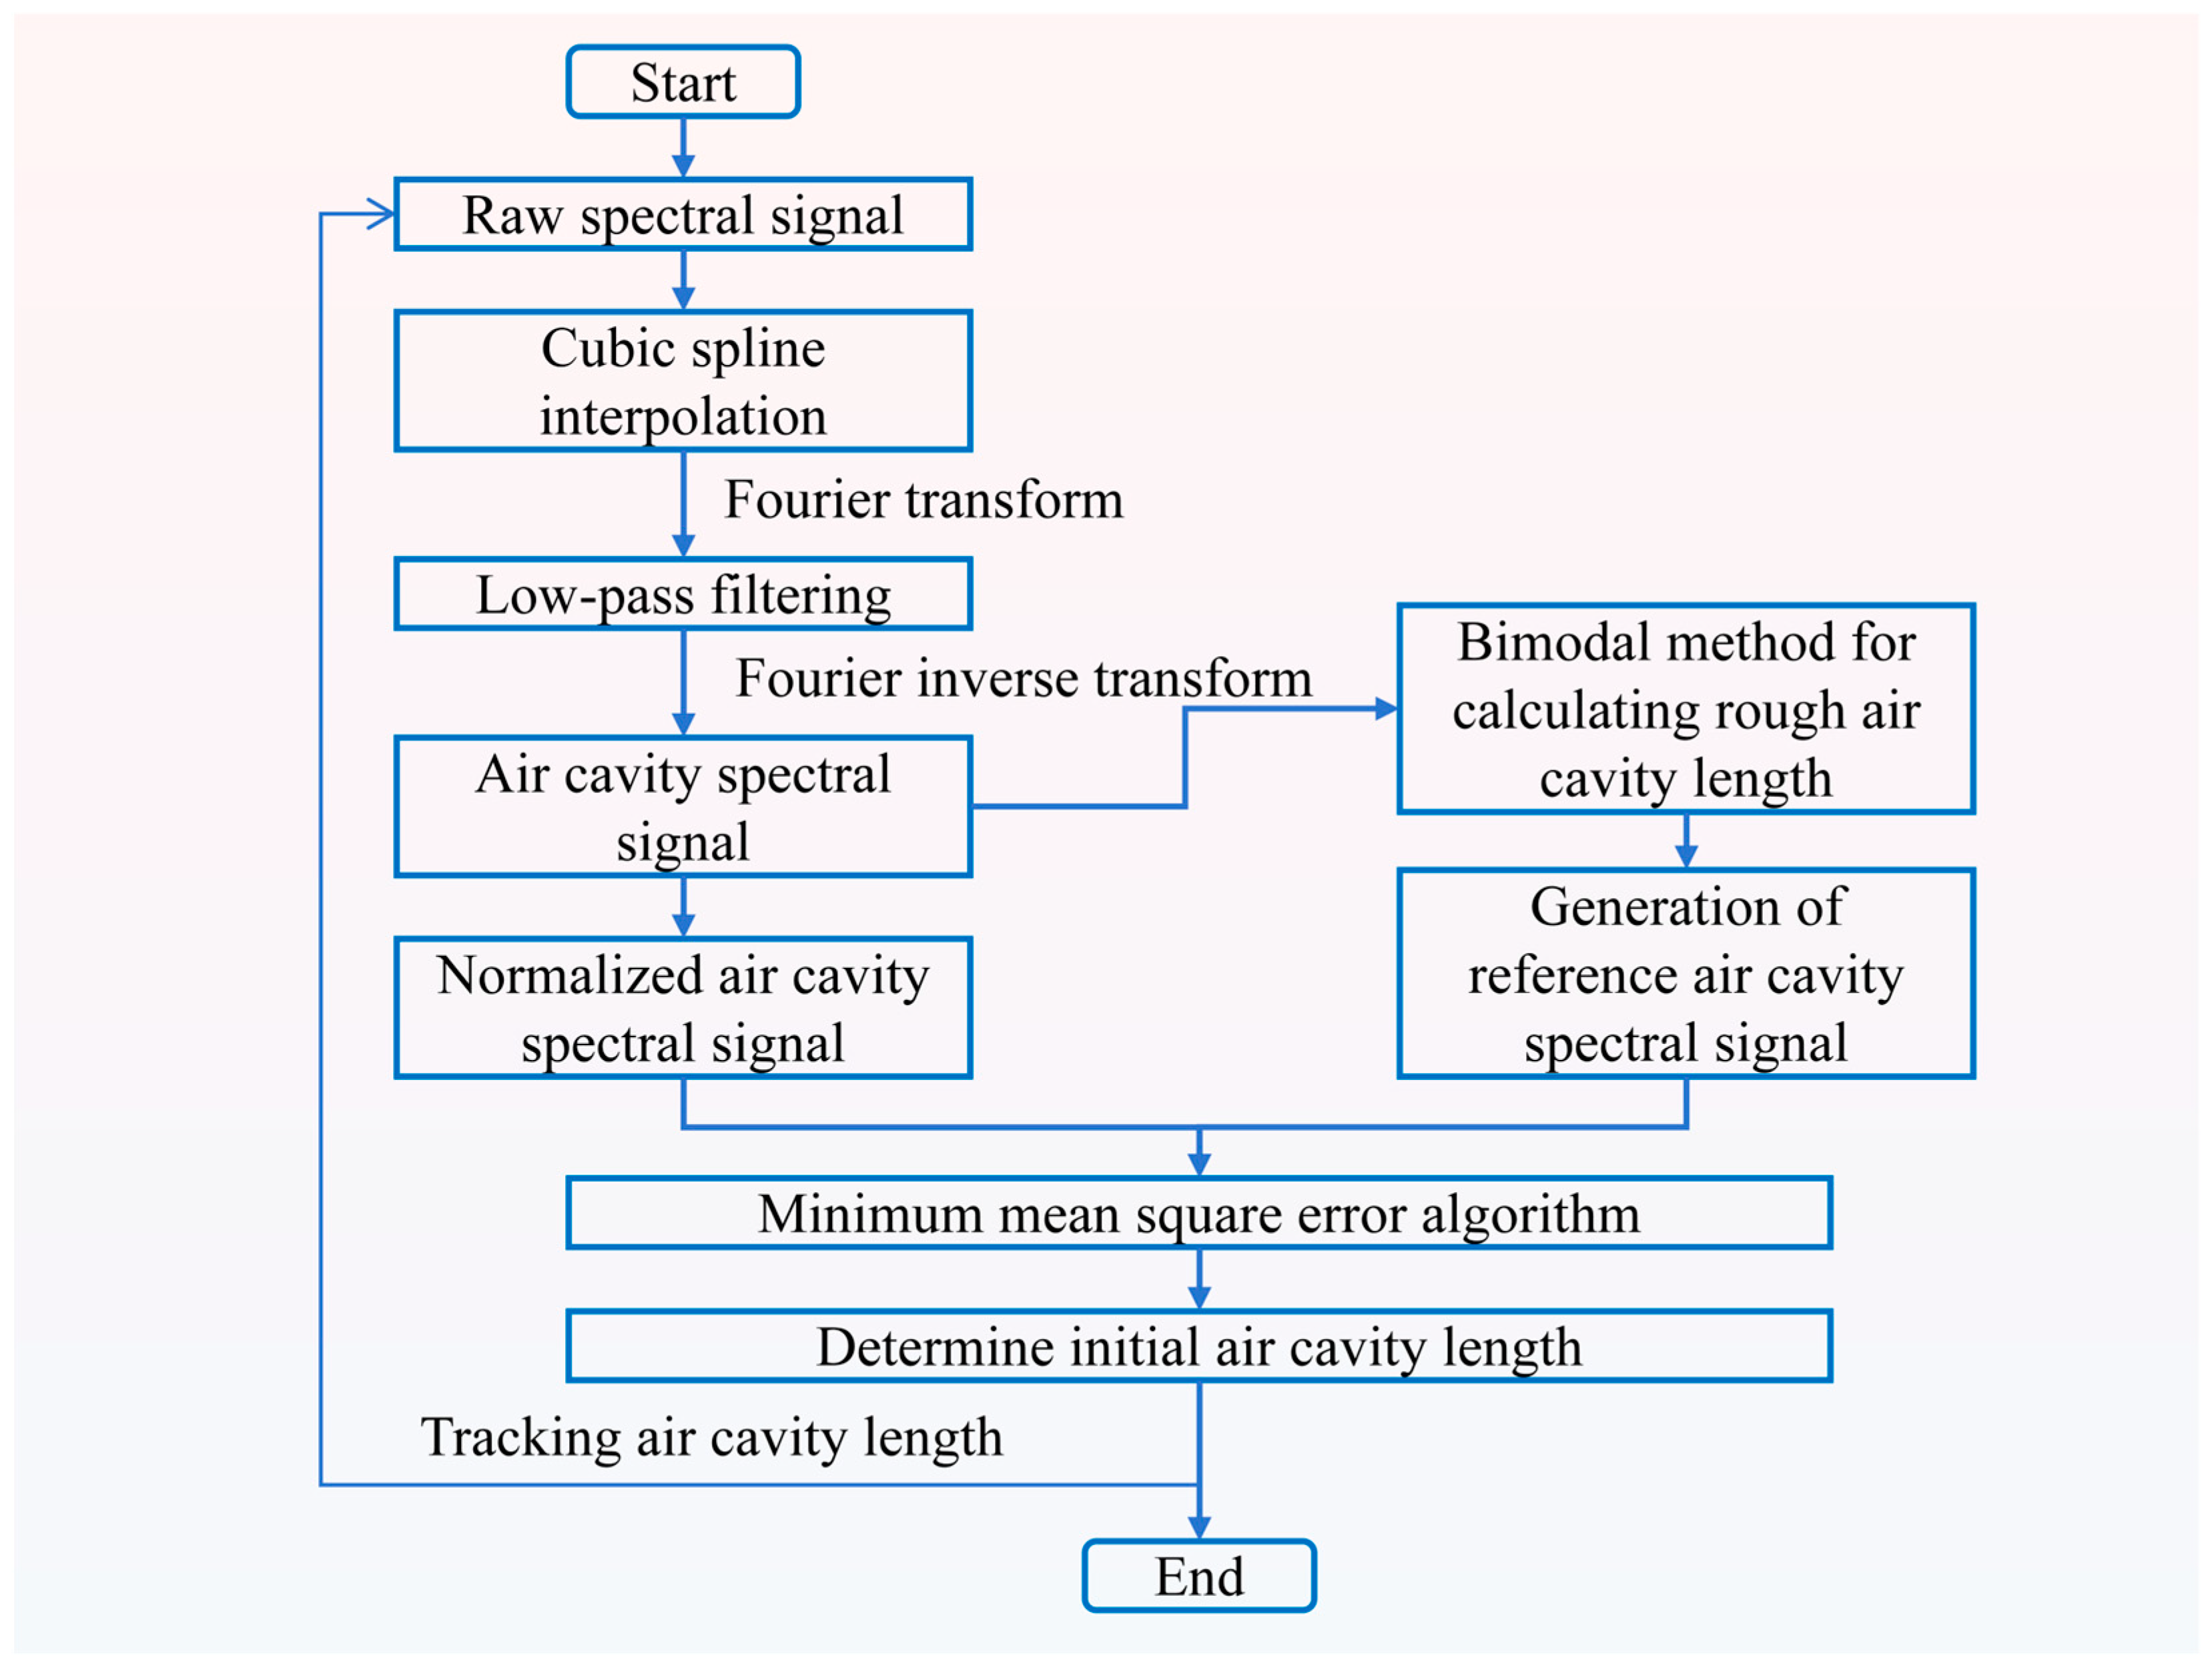
The flowchart of the FFT-MSE demodulation algorithm is shown in Figure 4. The reflectance spectrum of the sapphire sandwich-structure F-P cavity (Figure S2) is plotted using Equation (4), with a wavelength range from 1520 nm to 1570 nm. To simulate the reflectance spectrum of the sapphire sandwich-structure F-P cavity more efficiently, normal distribution noise is introduced. The reflectance spectrum with added normal distribution noise is shown in Figure 5a. The signal-to-noise ratio (SNR) distribution in the wavelength range from 1520 nm to 1570 nm is shown in Figure S3, with the SNR greater than 35.1. The sapphire sandwich-structure F-P cavity reflectance spectrum is subjected to cubic spline interpolation. The frequency domain spectrum of the sapphire sandwich-structure F-P cavity is obtained by using the FFT (shown in Figure 5b). The frequency corresponding to the first peak is the air cavity frequency, the second peak corresponds to the basal cavity frequency, and the third peak results from the combined effect of the air cavity and basal cavity. The frequency domain spectrum of the sapphire sandwich-structure F-P cavity is low-pass filtered with a cut-off frequency of 20 Hz. The air cavity reflection spectrum is obtained by Fourier inverse transform and is then normalized as shown in Figure 5c. The normalization calculation formula is as follows:
I 4 = I 2 S down 1 S u p 1
I4 denotes the normalized air cavity reflectance spectrum, Sdown1 represents the lower envelope of the air cavity reflectance spectrum, and Sup1 indicates the upper envelope of the air cavity reflectance spectrum. The rough air cavity length is then calculated using the bimodal method, which employs the wavelengths ( λ 1 and λ 2 ) corresponding to the two adjacent wave peaks of the air cavity spectrum signal to determine the rough air cavity length ( L 4 ). The calculation formula is as follows [32]:
L 4 = λ 1 λ 2 2 ( λ 2 λ 1 )
The calculated L4 is used to construct the reference air cavity length ( L 5 ), which ranges from L 4 L to L 4 + L , with a step size ( d ) of 10 nm, and L is 10,000 nm. L5 is then substituted into Equation (2) to construct the reference air cavity reflectance spectrum. The normalized reference air cavity reflectance spectrum (I5) calculated using Equation (5). I4 and I5 are substituted into the MSE calculation formula; the result is shown in Figure S4. The MSE calculation formula is as follows:
MSE = 1 N i = 1 n ( I 5 I 4 ) 2
where N denotes the number of sampling points of the sapphire sandwich-structure F-P cavity reflectance spectrum after three iterations of spline interpolation, and n represents the sample points of L5.
The minimum value of MSE corresponds to the reference air cavity length, identified as the first air cavity length. As shown in Figure 5d, after calculating the second MSE, the next step is to determine which of the reference air cavity lengths corresponding to “①”, “②”, and “③” is closest to the first air cavity length and then use this value as the air cavity length. Each subsequent air cavity length calculation references the immediately preceding air cavity length. The results of the simulation calculations for the variation in air cavity length from 206 μm to 216 μm are shown in Figure 5e. The simulation error curve is shown in Figure 5f, with the simulation error being less than 0.0008%. As shown in Table 1, compared with the dual peak method [15], dual/mult wavelength method [33,34], phase demodulation method [26,28,35], MMSE method [36,37,38], and FFT method [18,19,39], the method proposed in this work achieves a demodulation error that is more than three times smaller and accuracy that is more than six times higher. The simulation parameters not explicitly stated above are listed in Table 2.

4. Experiments

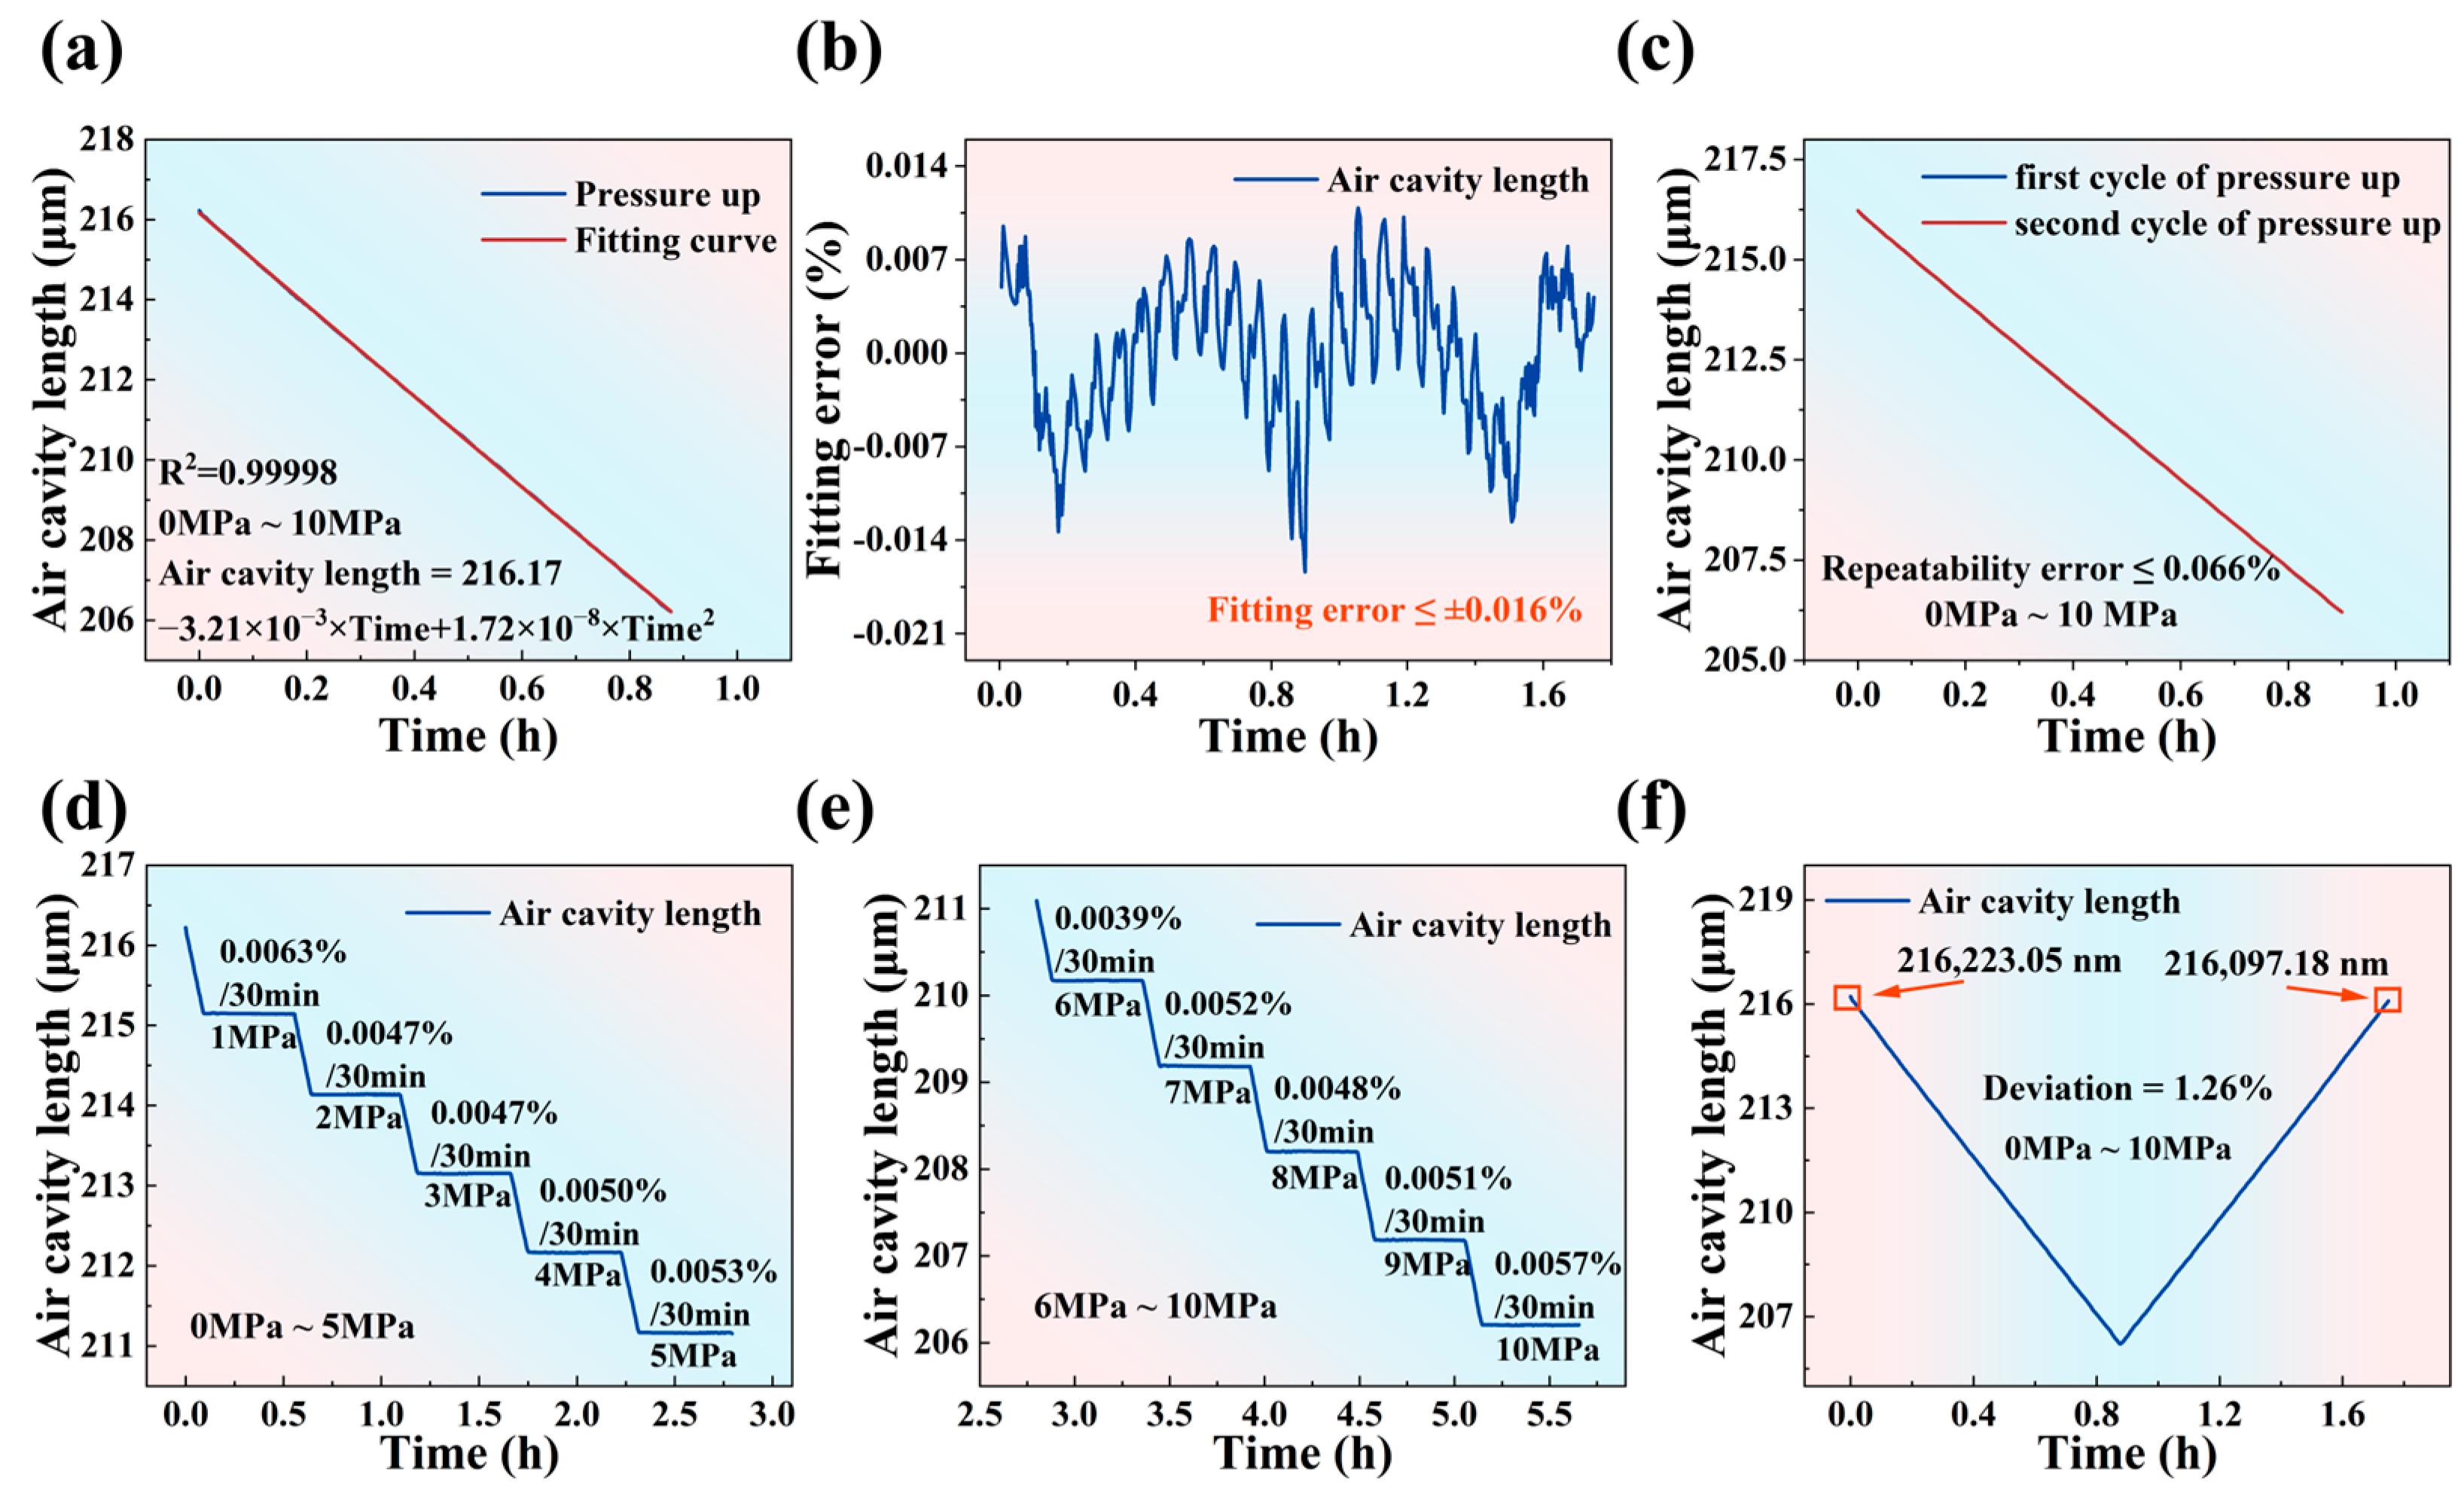
To effectively evaluate the feasibility of the demodulation algorithm, it is necessary to test the sapphire sandwich-structure F-P pressure sensor. As shown in Figure 6a, the sapphire sandwich-structure F-P pressure sensor is pressurized from 0 MPa to 10 MPa in a single round, with a boost rate of the pressure controller at 0.003 MPa/s. Second-order fitting equations are used for modeling, resulting in an R2 value of 0.99998. The fitting error curve is shown in Figure 6b, and the fitting error (ef) is calculated using the following formula:
e f = Y Y f Y F . S . × 100 %
Y denotes the air cavity length curve, Yf represents the fitting curve of the air cavity length, and YF.S. indicates the variation range of the air cavity length. According to Equation (8), the absolute value of ef is calculated to be less than 0.016%. To evaluate the repeatability of the sapphire sandwich-structure F-P pressure sensor, two rounds of 0 MPa to 10 MPa pressurization are performed, with the pressure controller’s boost rate at 0.003 MPa/s. The test results are shown in Figure 6c, and the repeatability error ( δ R ) is calculated as follows:
δ R = Y Y F . S . × 100 %
Y denotes the difference between the change in curves of the air cavity lengths of the two rounds, and YF.S. represents the variation range of the air cavity length. According to Equation (9), the calculated δ R is less than 0.066%, indicating that the sapphire sandwich-structure F-P pressure sensor has excellent repeatability. The stability of the sensor is a key indicator for evaluating its performance. Stability tests are conducted on the sapphire sandwich-structure F-P pressure sensor for 1 MPa to 10 MPa. The test results, shown in Figure 6d,e, indicate stability values of 0.0063%/30 min at 1 MPa, 0.0047%/30 min at 2 MPa, 0.0047%/30 min at 3 Mpa, 0.0050%/30 min at 4 MPa, 0.0053%/30 min at 5 MPa, 0.0039%/30 min at 6 MPa, 0.0052%/30 min at 7 MPa, 0.0048%/30 min at 8 MPa, 0.0051%/30 min at 9 MPa, and 0.0057%/30 min at 10 MPa. Notably, no “mode jumping” occurs during the 8 h continuous demodulation process. Figure 6f shows the 0 MPa to 10 MPa boost and buck curves, and the deviation ( δ D ) of the zero point is calculated as follows:
δ D = Y P = 0 Y F . S . × 100 %
Y P = 0 the deviation value of the zero point, and YF.S. indicates the variation range of the air cavity length. The pressure controller has a ramp-up and ramp-down rate of 0.003 MPa/s. After one round of ramp-up and ramp-down, the air cavity length offset of the sapphire sandwich-structure F-P pressure sensor at atmospheric pressure is 125.87 nm, and according to Equation (10), the δ D is calculated to be 1.26%. The performance of the sapphire sandwich-structure F-P pressure sensor is accurately evaluated using the FFT-MSE algorithm, which provides a generalized method for calculating the cavity length of sandwich-structure F-P cavity.

5. Conclusions

In conclusion, through the simulation analysis of the sapphire sandwich-structure F-P cavity, experimental results show that the demodulation error of the air cavity length in the range of 206 μm to 216 μm is less than 0.0008%, indicating that the algorithm has excellent accuracy. Compared to single demodulation methods and combined demodulation methods based on FFT or MMSE, the method proposed in this work reduces demodulation errors by more than three times and increases accuracy by more than six times. Testing the application of the sapphire sandwich-structure F-P pressure sensor using the algorithm reveals a fitting error of less than 0.025%, a repeatability error of less than 0.066%, a deviation of the zero point of 1.26%, and a maximum stability deviation of 0.0063%/30 min in the pressure range of 0 MPa to 10 MPa. The test results show that the algorithm effectively demodulates the actual cavity length variation in the sapphire sandwich-structure F-P pressure sensor, providing a robust solution for its performance evaluation. The performance of the sapphire sandwich-structure F-P pressure sensor is accurately evaluated using the FFT-MSE algorithm.

Supplementary Materials

The following supporting information can be downloaded at https://www.mdpi.com/article/10.3390/ma17153649/s1, Figure S1: The coupling efficiency results of the signal emitted by the super-continuum spectral light source and the single-mode fiber in the wavelength range of 1520 nm to 1570 nm; Figure S2: The reflectance spectrum of the sapphire sandwich-structure F-P structure; Figure S3: The signal-to-noise ratio (SNR) distribution in the wavelength range from 1520 nm to 1570 nm; Figure S4: Result of MSE.

Author Contributions

Conceptualization, Z.H. and Z.S.; methodology, R.L. (Rui Liang), M.G., and Z.Z.; software, R.L. (Runze Lin) and Y.Z.; validation, H.Z., J.C., Y.C. and R.L. (Runze Lin); formal analysis, M.G., Q.Z., Y.C., and Y.Z.; investigation, Z.H. and Z.S.; resources, Y.Z. and J.C.; data curation, R.L. (Rui Liang), M.G., and Y.C.; writing—original draft preparation, Z.S., R.L. (Rui Liang), H.Z., J.C., and Q.Z.; writing—review and editing, C.X.; visualization, H.Z., Q.Z., and R.L. (Runze Lin); supervision, Z.H. and Z.Z.; project administration, Z.Z. and C.X. All authors have read and agreed to the published version of the manuscript.

Funding

This research received no external funding.

Institutional Review Board Statement

Not applicable.

Informed Consent Statement

Not applicable.

Data Availability Statement

The original contributions presented in this study are included in the article/Supplementary Materials; further inquiries can be directed to the corresponding author.

Conflicts of Interest

The authors declare no conflicts of interest. The funders had no role in the design of the study; in the collection, analyses, or interpretation of data; in the writing of the manuscript; or in the decision to publish the results.

References

  1. Sharifzadeh, S.; Hendrick, P. Structural design and optimisation of a hypersonic aircraft based on aero-elastic deformations. In Proceedings of the 9th National Congress on Theoretical and Applied Mechanics, Brussels, Belgium, 9 May 2012. [Google Scholar]
  2. Tanguy, G.; MacManus, D.G. Characteristics of unsteady total pressure distortion for a complex aero-engine intake duct. Aerosp. Sci. Technol. 2018, 78, 297–311. [Google Scholar] [CrossRef]
  3. Qin, H.; Wang, W. Transient aerodynamic performances and pressure oscillations of a core engine combustor during start up. Aerosp. Sci. Technol. 2021, 115, 106838. [Google Scholar] [CrossRef]
  4. Albanakis, C.; Yakinthos, K. The effect of heat transfer on the pressure drop through a heat exchanger for aero engine applications. Appl. Therm. Eng. 2009, 29, 634–644. [Google Scholar] [CrossRef]
  5. Duan, B.; Hai, Z. A large-range and high-sensitivity fiber-optic fabry-perot pressure sensor based on a membrane-hole-base structure. Micromachines 2024, 15, 174. [Google Scholar] [CrossRef] [PubMed]
  6. He, J.; Xu, X. Stabilized ultra-high-temperature sensors based on inert gas-sealed sapphire fiber bragg gratings. ACS Appl. Mater. Interfaces 2022, 14, 12359–12366. [Google Scholar] [CrossRef] [PubMed]
  7. Shao, Z.; Wu, Y. All-sapphire fiber-optic pressure sensors for extreme harsh environments. Opt. Express 2022, 30, 3665–3674. [Google Scholar] [CrossRef] [PubMed]
  8. Habisreuther, T.; Elsmann, T.; Pan, Z. Long-term stable sapphire fiber bragg grating sensors at 1400 °C. In Proceedings of the 23rd International Conference on Optical Fiber Sensors, Santander, Spain, 2 June 2024. [Google Scholar]
  9. Li, W.; Liang, T. Fiber-optic fabry-perot pressure sensor based on sapphire direct bonding for high-temperature applications. Appl. Opt. 2019, 58, 1662–1666. [Google Scholar] [CrossRef] [PubMed]
  10. Wang, Z.; Chen, J. Sapphire fabry-perot interferometer for high-temperature pressure sensing. Appl. Opt. 2020, 59, 5189–5196. [Google Scholar] [CrossRef]
  11. Feng, X.; Jiang, Y. Diaphragm-free gas pressure sensor based on all-sapphire fiber Fabry-Perot interferometers. Appl. Opt. 2022, 61, 6584–6589. [Google Scholar] [CrossRef]
  12. Yi, J.; Lally, E. Demonstration of an all-sapphire fabry-perot cavity for pressure sensing. IEEE Photonics Technol. Lett. 2011, 23, 9–11. [Google Scholar] [CrossRef]
  13. Shao, Z.; Wu, Y. All-sapphire-based fiber-optic pressure sensor for high-temperature applications based on wet etching. Opt. Express 2021, 29, 4139–4146. [Google Scholar] [CrossRef] [PubMed]
  14. Yi, J. Sapphire fabry-perot pressure sensor at high temperature. IEEE Sens. J. 2021, 21, 1596–1602. [Google Scholar] [CrossRef]
  15. Jiang, Y. High-resolution interrogation technique for fiber optic extrinsic Fabry-Perot interferometric sensors by the peak-to-peak method. Appl. Opt. 2008, 47, 925–932. [Google Scholar] [CrossRef] [PubMed]
  16. Chen, H.; Zhang, Y. Squared peak-to-peak algorithm for the spectral interrogation of short-cavity fiber-optic fabry-perot sensors. Appl. Opt. 2020, 59, 1198–1205. [Google Scholar] [CrossRef] [PubMed]
  17. Shin, D.; Matsukuma, H. Improved peak-to-peak method for cavity length measurement of a fabry-perot etalon using a mode-locked femtosecond laser. Opt. Express 2023, 31, 25797–25814. [Google Scholar] [CrossRef]
  18. Yang, Y.; Tian, D. A fiber-optic displacement sensor using the spectral demodulation method. J. Light. Technol. 2018, 36, 3666–3671. [Google Scholar] [CrossRef]
  19. Fu, X.; Lu, P. Phase demodulation of interferometric fiber sensor based on fast fourier analysis. Opt. Express 2017, 25, 21094–21106. [Google Scholar] [CrossRef]
  20. Zhang, P.; Wang, Y. A high-speed demodulation technology of fiber optic extrinsic fabry-perot interferometric sensor based on coarse spectrum. Sensors 2021, 21, 6609. [Google Scholar] [CrossRef]
  21. Qi, B.; Winder, D. Quadrature phase-shifted optical demodulator for low-coherence fiber-optic fabry-perot interferometric sensors. Opt. Express 2019, 27, 7319–7329. [Google Scholar] [CrossRef]
  22. Zhang, W.; Lu, P. Four-wavelength quadrature phase demodulation technique for extrinsic fabry-perot interferometric sensors. Opt. Lett. 2022, 47, 2406–2409. [Google Scholar] [CrossRef]
  23. Zhao, Y.; Liu, Q. Passive quadrature phase demodulation of a dual-cavity fabry-perot ultrasound sensor. IEEE Photonics Technol. Lett. 2022, 34, 733–736. [Google Scholar] [CrossRef]
  24. Guo, M.; Chen, K. High-sensitivity fiber-optic low-frequency acoustic detector based on cross-correlation demodulation. J. Light. Technol. 2022, 40, 4481–4488. [Google Scholar] [CrossRef]
  25. Zhang, G.; Xiong, Z. Low-frequency optical fiber fabry-perot acoustic sensor based on all-phase cross-correlation demodulation. J. Light. Technol. 2022, 40, 7431–7438. [Google Scholar] [CrossRef]
  26. Cheung, Y.; Jing, Z. Parallel cross-correlation algorithm for the fast interrogation of high-finesse fiber-optic fabry-perot sensors. J. Light. Technol. 2023, 41, 4522–4530. [Google Scholar] [CrossRef]
  27. Shao, Z.; Wu, Y. Excellent repeatability, all-sapphire Fabry Perot optical Pressure sensor based on wet etching and direct bonding for Harsh Environment Applications. Opt. Express 2021, 29, 19831–19838. [Google Scholar] [CrossRef] [PubMed]
  28. Guo, Z.; Lv, W. Absolute single cavity length interrogation of fiber-optic compound Fabry-Perot pressure sensors through a white light non-scanning correlation method. Sensors 2019, 19, 1628. [Google Scholar] [CrossRef] [PubMed]
  29. Cui, Y.; Jiang, Y. A dual-cavity Fabry-Perot interferometric fiber-optic sensor for the simultaneous measurement of high-temperature and high-gas-pressure. IEEE Access 2020, 8, 80582–80587. [Google Scholar] [CrossRef]
  30. Zhang, W.; Yu, J. High-precision cavity length demodulation method for fiber-optic Fabry-Perot Sensors Based on Dual Superluminescent Diodes. Sensors 2022, 22, 5898. [Google Scholar] [CrossRef] [PubMed]
  31. Wang, B.; Niu, Y. A high temperature sensor based on sapphire fiber Fabry-Perot interferometer. IEEE Photonics Technol. Lett. 2020, 32, 89–92. [Google Scholar] [CrossRef]
  32. Ma, W.; Shao, Z. Sensitivity-enhanced fiber-optic sensor based on a drilled PDMS diaphragm for ultrasound imaging of seismic physical model. IEEE Trans. Instrum. Meas. 2022, 71, 1–6. [Google Scholar] [CrossRef]
  33. Ren, Q.; Jia, P. Dual-wavelength demodulation technique for interrogating a shortest cavity in multi-cavity fiber-optic Fabry–Pérot sensors. Opt. Express 2021, 29, 32658–32669. [Google Scholar] [CrossRef]
  34. Zhao, A.; Ren, Q. Extensible multi-wavelength interrogation method for arbitrary cavities in low-fineness multi-cavity Fabry-Pérot interferometric sensors. Opt. Express 2024, 32, 6141–6153. [Google Scholar] [CrossRef]
  35. Wei, X.; Yan, H. A visible-light spectral demodulation system for fiber-optic SiC Fabry-Perot sensors. Optik 2022, 251, 168441. [Google Scholar] [CrossRef]
  36. Liu, W.; Yang, T. Combined Interrogation Algorithm of Phase Function and Minimum Mean Square Error for Fiber-Optic Fabry-Perot Micro-Pressure Sensors Based on White Light Interference. J. Light. Technol. 2023, 41, 3241–3248. [Google Scholar] [CrossRef]
  37. Yu, L.; Lang, J. A Hybrid Demodulation Method of Fiber-optic Fabry-Perot Pressure Sensor. In Proceedings of the 2013 International Conference on Optical Instruments and Technology: Optical Sensors and Applications, Beijing, China, 17–19 November 2013. [Google Scholar]
  38. Gui, X.; Galle, M. Demodulation method combining virtual reference interferometry and minimum mean square error for fiber-optic Fabry–Perot sensors. Chin. Opt. Lett. 2018, 16, 010606. [Google Scholar]
  39. Dai, X.; Wang, M. The application of the FFT algorithm associated with CZT in the demodulation of Fabry-Perot pressure sensors. Adv. Sens. Syst. Appl. III 2008, 6830, 225–236. [Google Scholar]
Figure 1. Diagram of the sapphire sandwich-structure F-P pressure sensor test system.
Materials 17 03649 g001
Figure 2. The sensitive core of the sapphire sandwich-structure F-P cavity.
Materials 17 03649 g002
Figure 3. (a) The upper structure of the sensitive core of the sapphire sandwich-structure F-P pressure sensor. (b) Physical diagram of sapphire sandwich-structure F-P pressure sensor. (c) The micro-structure in the A-A cross section of the sensitive core of the sapphire sandwich-structure F-P pressure sensor and its corresponding surface element distribution (Al, O).
Materials 17 03649 g003
Figure 4. Flowchart of FFT-MSE demodulation algorithm.
Materials 17 03649 g004
Figure 5. (a) Sapphire sandwich-structure F-P cavity reflectance spectrum after adding noise. (b) Sapphire sandwich-structure F-P cavity frequency domain spectrum. (c) Air cavity spectrum and normalized air cavity spectrum. (d) Result of MSE. (e) Result of demodulated air cavity length and theoretical air cavity length. (f) Simulation error curve.
Materials 17 03649 g005
Figure 6. (a) Air cavity length fitting curve from 0 MPa to 10 MPa. (b) Air cavity length fitting error curve from 0 MPa to 10 MPa. (c) Air cavity length curve for two rounds of pressurization. (d) Stability at 1 MPa, 2 MPa, 3 MPa, 4 MPa, and 5 MPa. (e) Stability at 6 MPa, 7 MPa, 8 MPa, 9 MPa, and 10 MPa. (f) Boost and buck curves from 0 MPa to 10 MPa.
Materials 17 03649 g006
Table 1. Comparison of the simulation performance of different algorithms.
Main MethodAir Cavity Length (um)Error (nm)Error (%)Refs.
PTP2515–2610<20002.11[15]
DW/<35/[33]
EMW/<20/[34]
PCC/<0.3/[26]
WLNSC60–95<140.04[28]
SCC15–25<0.430.0437[35]
MMSE16.03–16.14<1.20.88[36]
MMSE + nDFT241–243<0.50.4[37]
MMSE + VR/<4.8/[38]
FFT//0.3[18]
FFT + MLE300.5–303.5150.005[19]
FFT + CZT397–403<0.60.01[39]
FFT + MSE206–216<0.10.0008This work
Table 2. Simulation parameters.
ParametersValue
L1600 μm
L2206~216 μm
W1520~1570 nm
I01 a.u.
R1, R2, R30.075
n11.765
n21.000
c3 × 108 m/s
Disclaimer/Publisher’s Note: The statements, opinions and data contained in all publications are solely those of the individual author(s) and contributor(s) and not of MDPI and/or the editor(s). MDPI and/or the editor(s) disclaim responsibility for any injury to people or property resulting from any ideas, methods, instructions or products referred to in the content.